

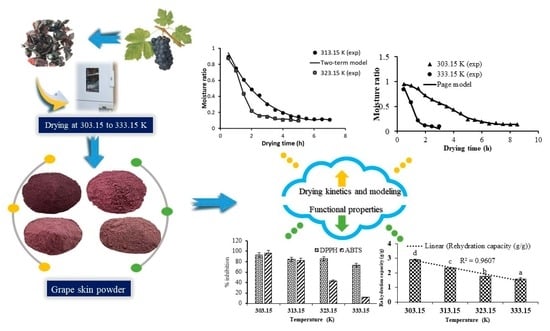
Mathematical Modeling to Describe Drying Behavior of Kyoho (Vitis labruscana) Skin Waste: Drying Kinetics and Quality Attributes


Abstract
:
1. Introduction
2. Materials and Methods
2.1. Chemicals and Instruments
2.2. Sample Preparation
2.3. Drying Process and Experimental Drying Kinetics
2.4. Modeling of Experimental Drying Kinetics
2.5. Effective Moisture Diffusivity (Deff) and Activation Energy (Ea)
2.6. Color Characterization
2.7. Rehydration
2.8. Total Phenolic and Flavonoid Contents
2.9. Antioxidant Activity
2.10. Correlation Analysis
2.11. Statistical Analysis
3. Results and Discussion
3.1. General
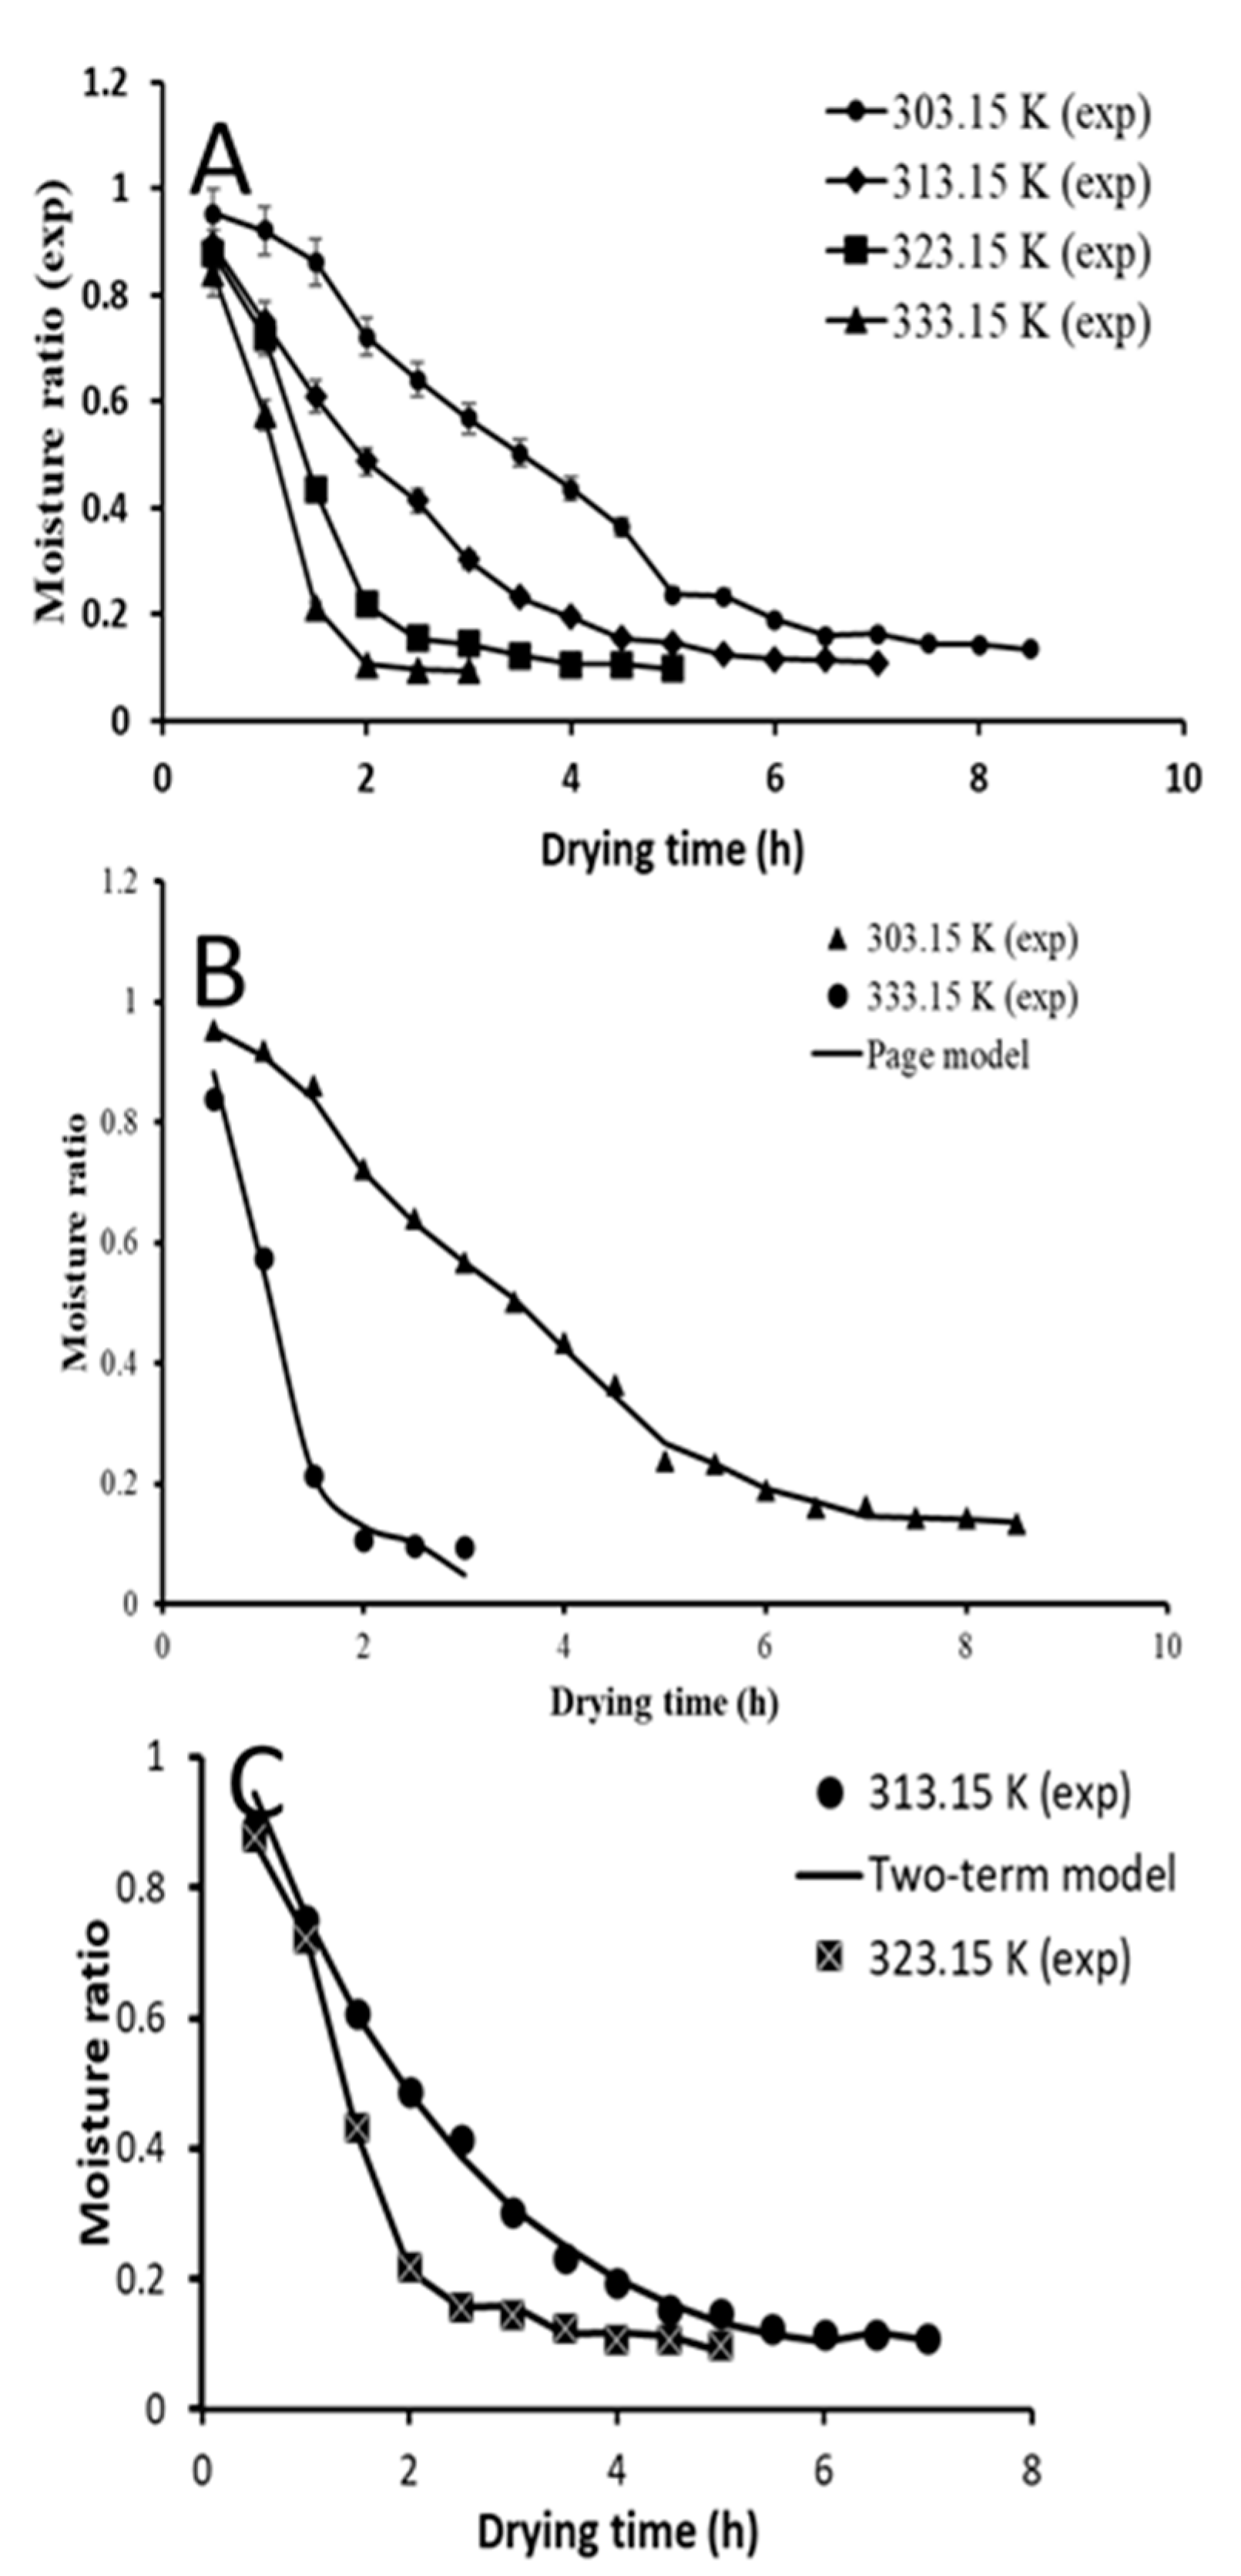
3.2. Drying Behavior of Kyoho Skin
3.3. Mathematical Modeling and Goodness of Fit
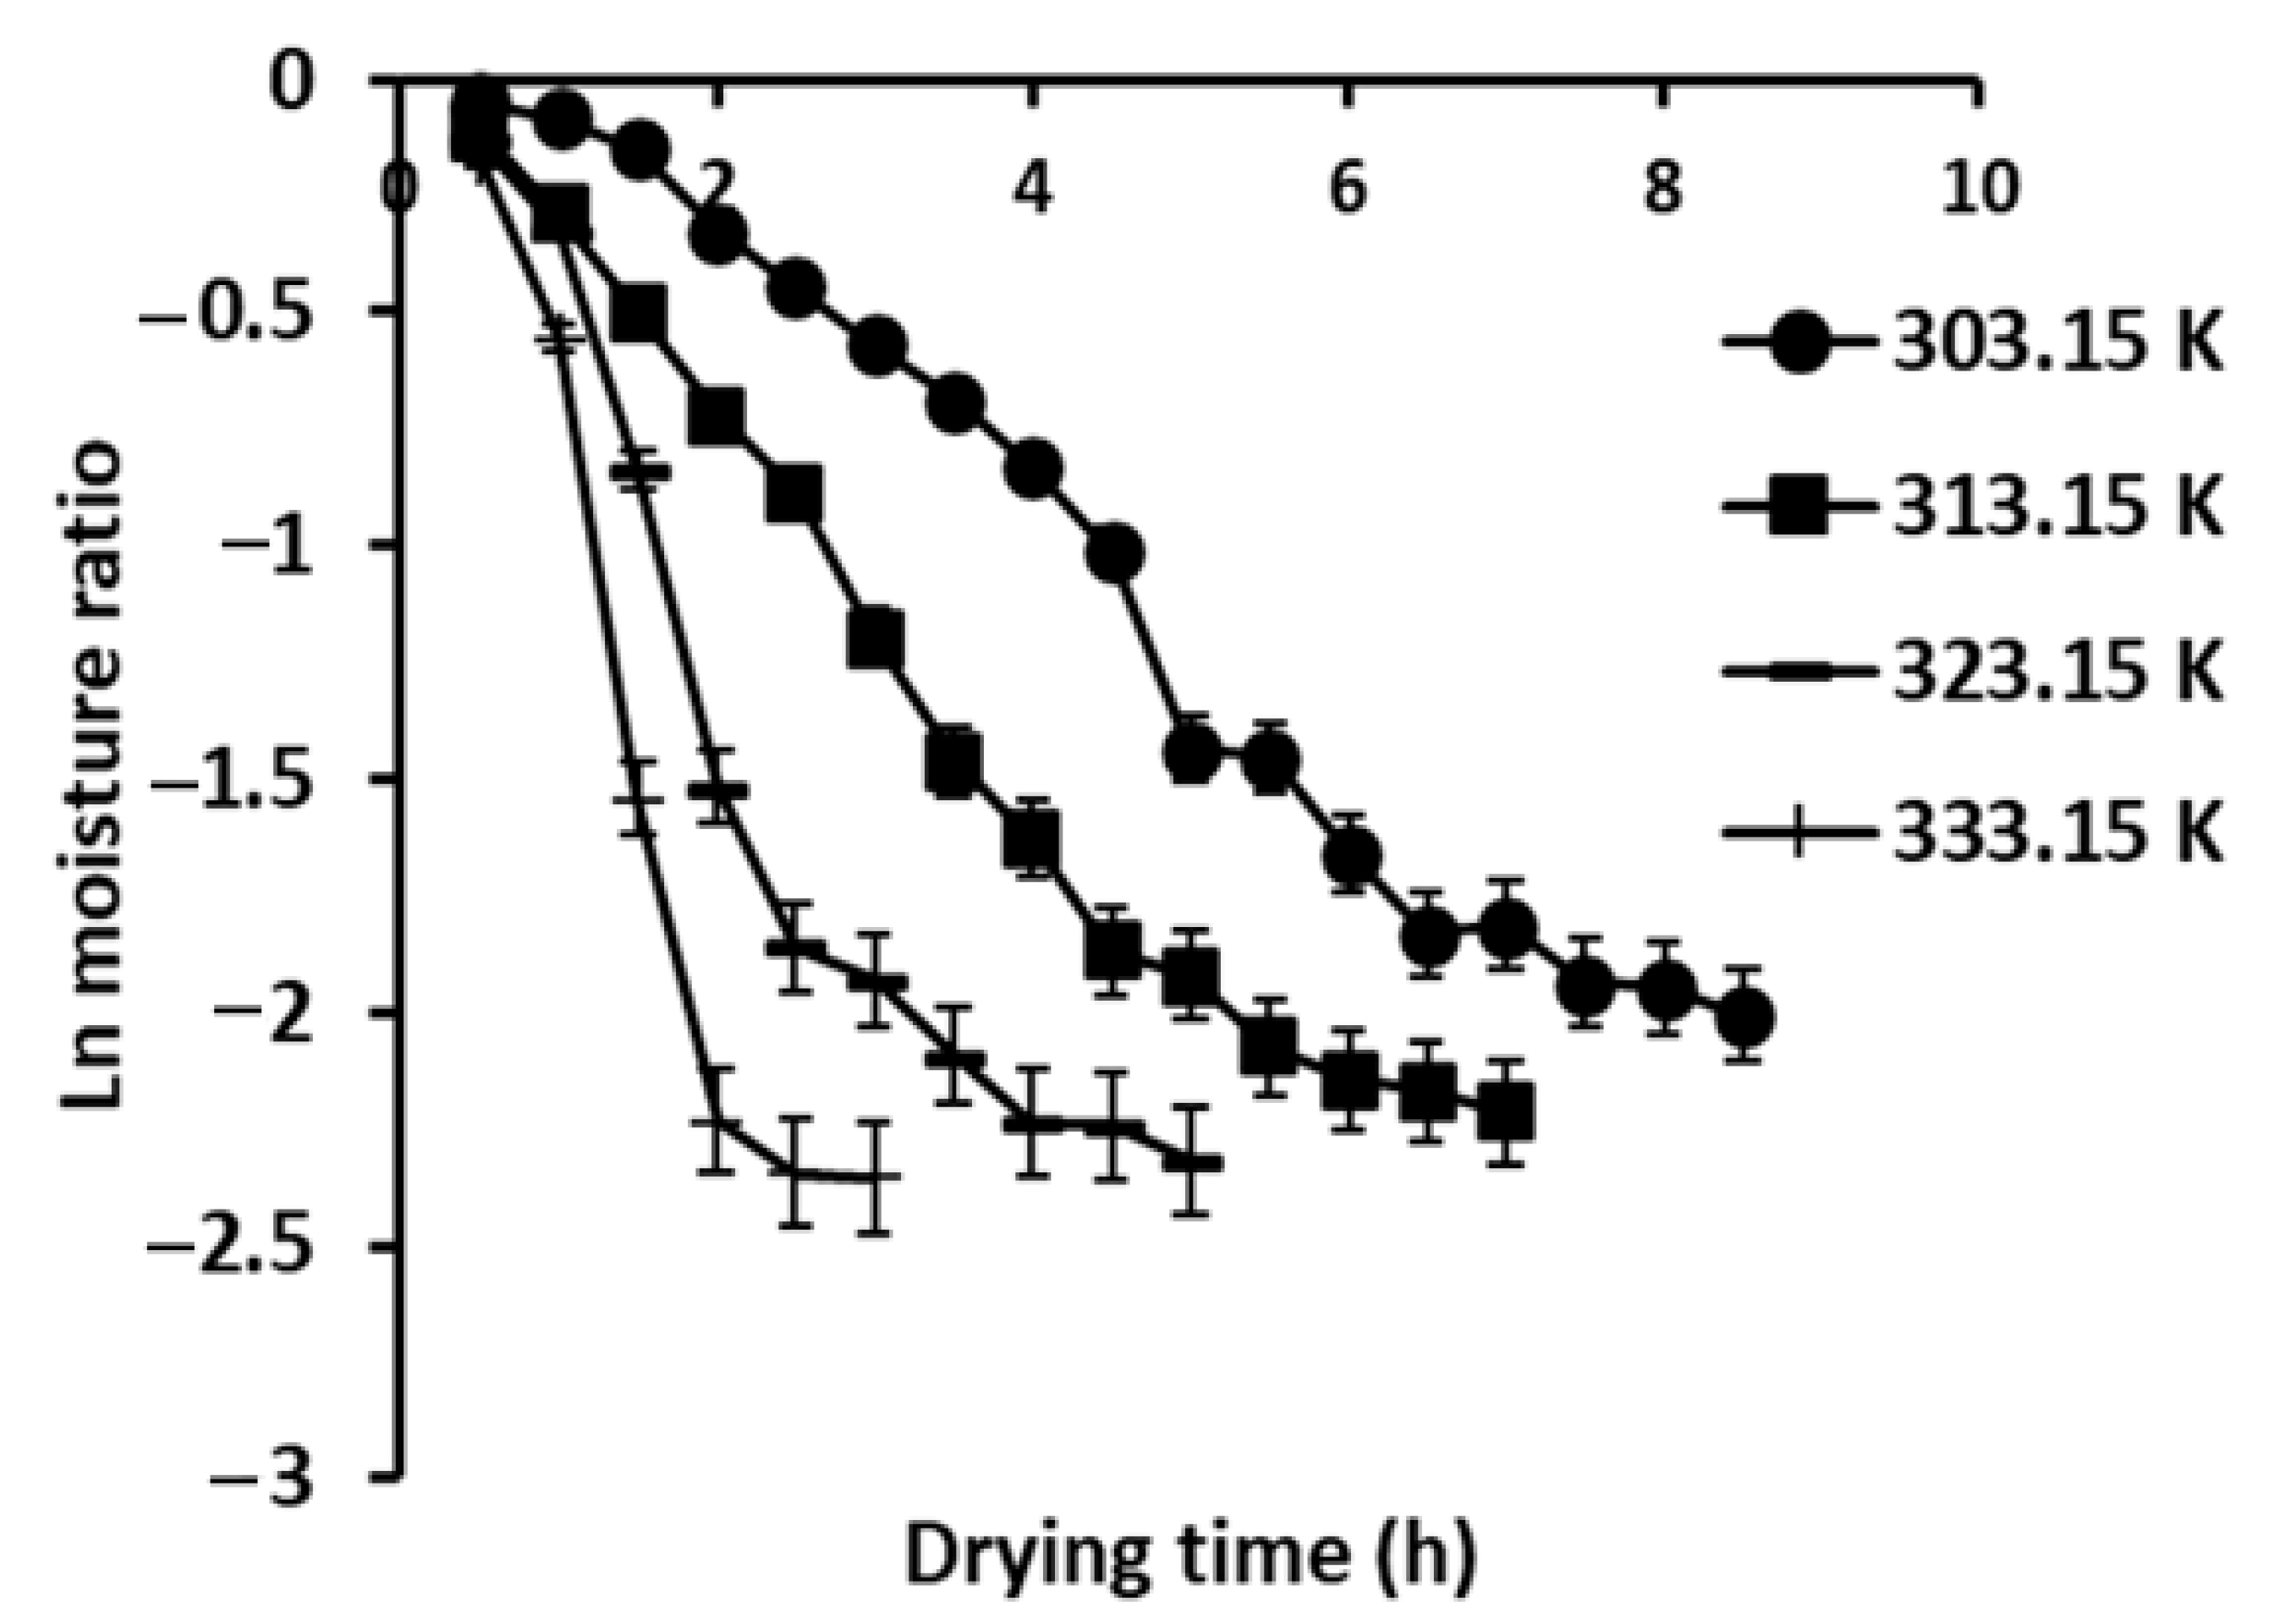
3.4. Effective Moisture Diffusivity (Deff) and Activation Energy (Ea)
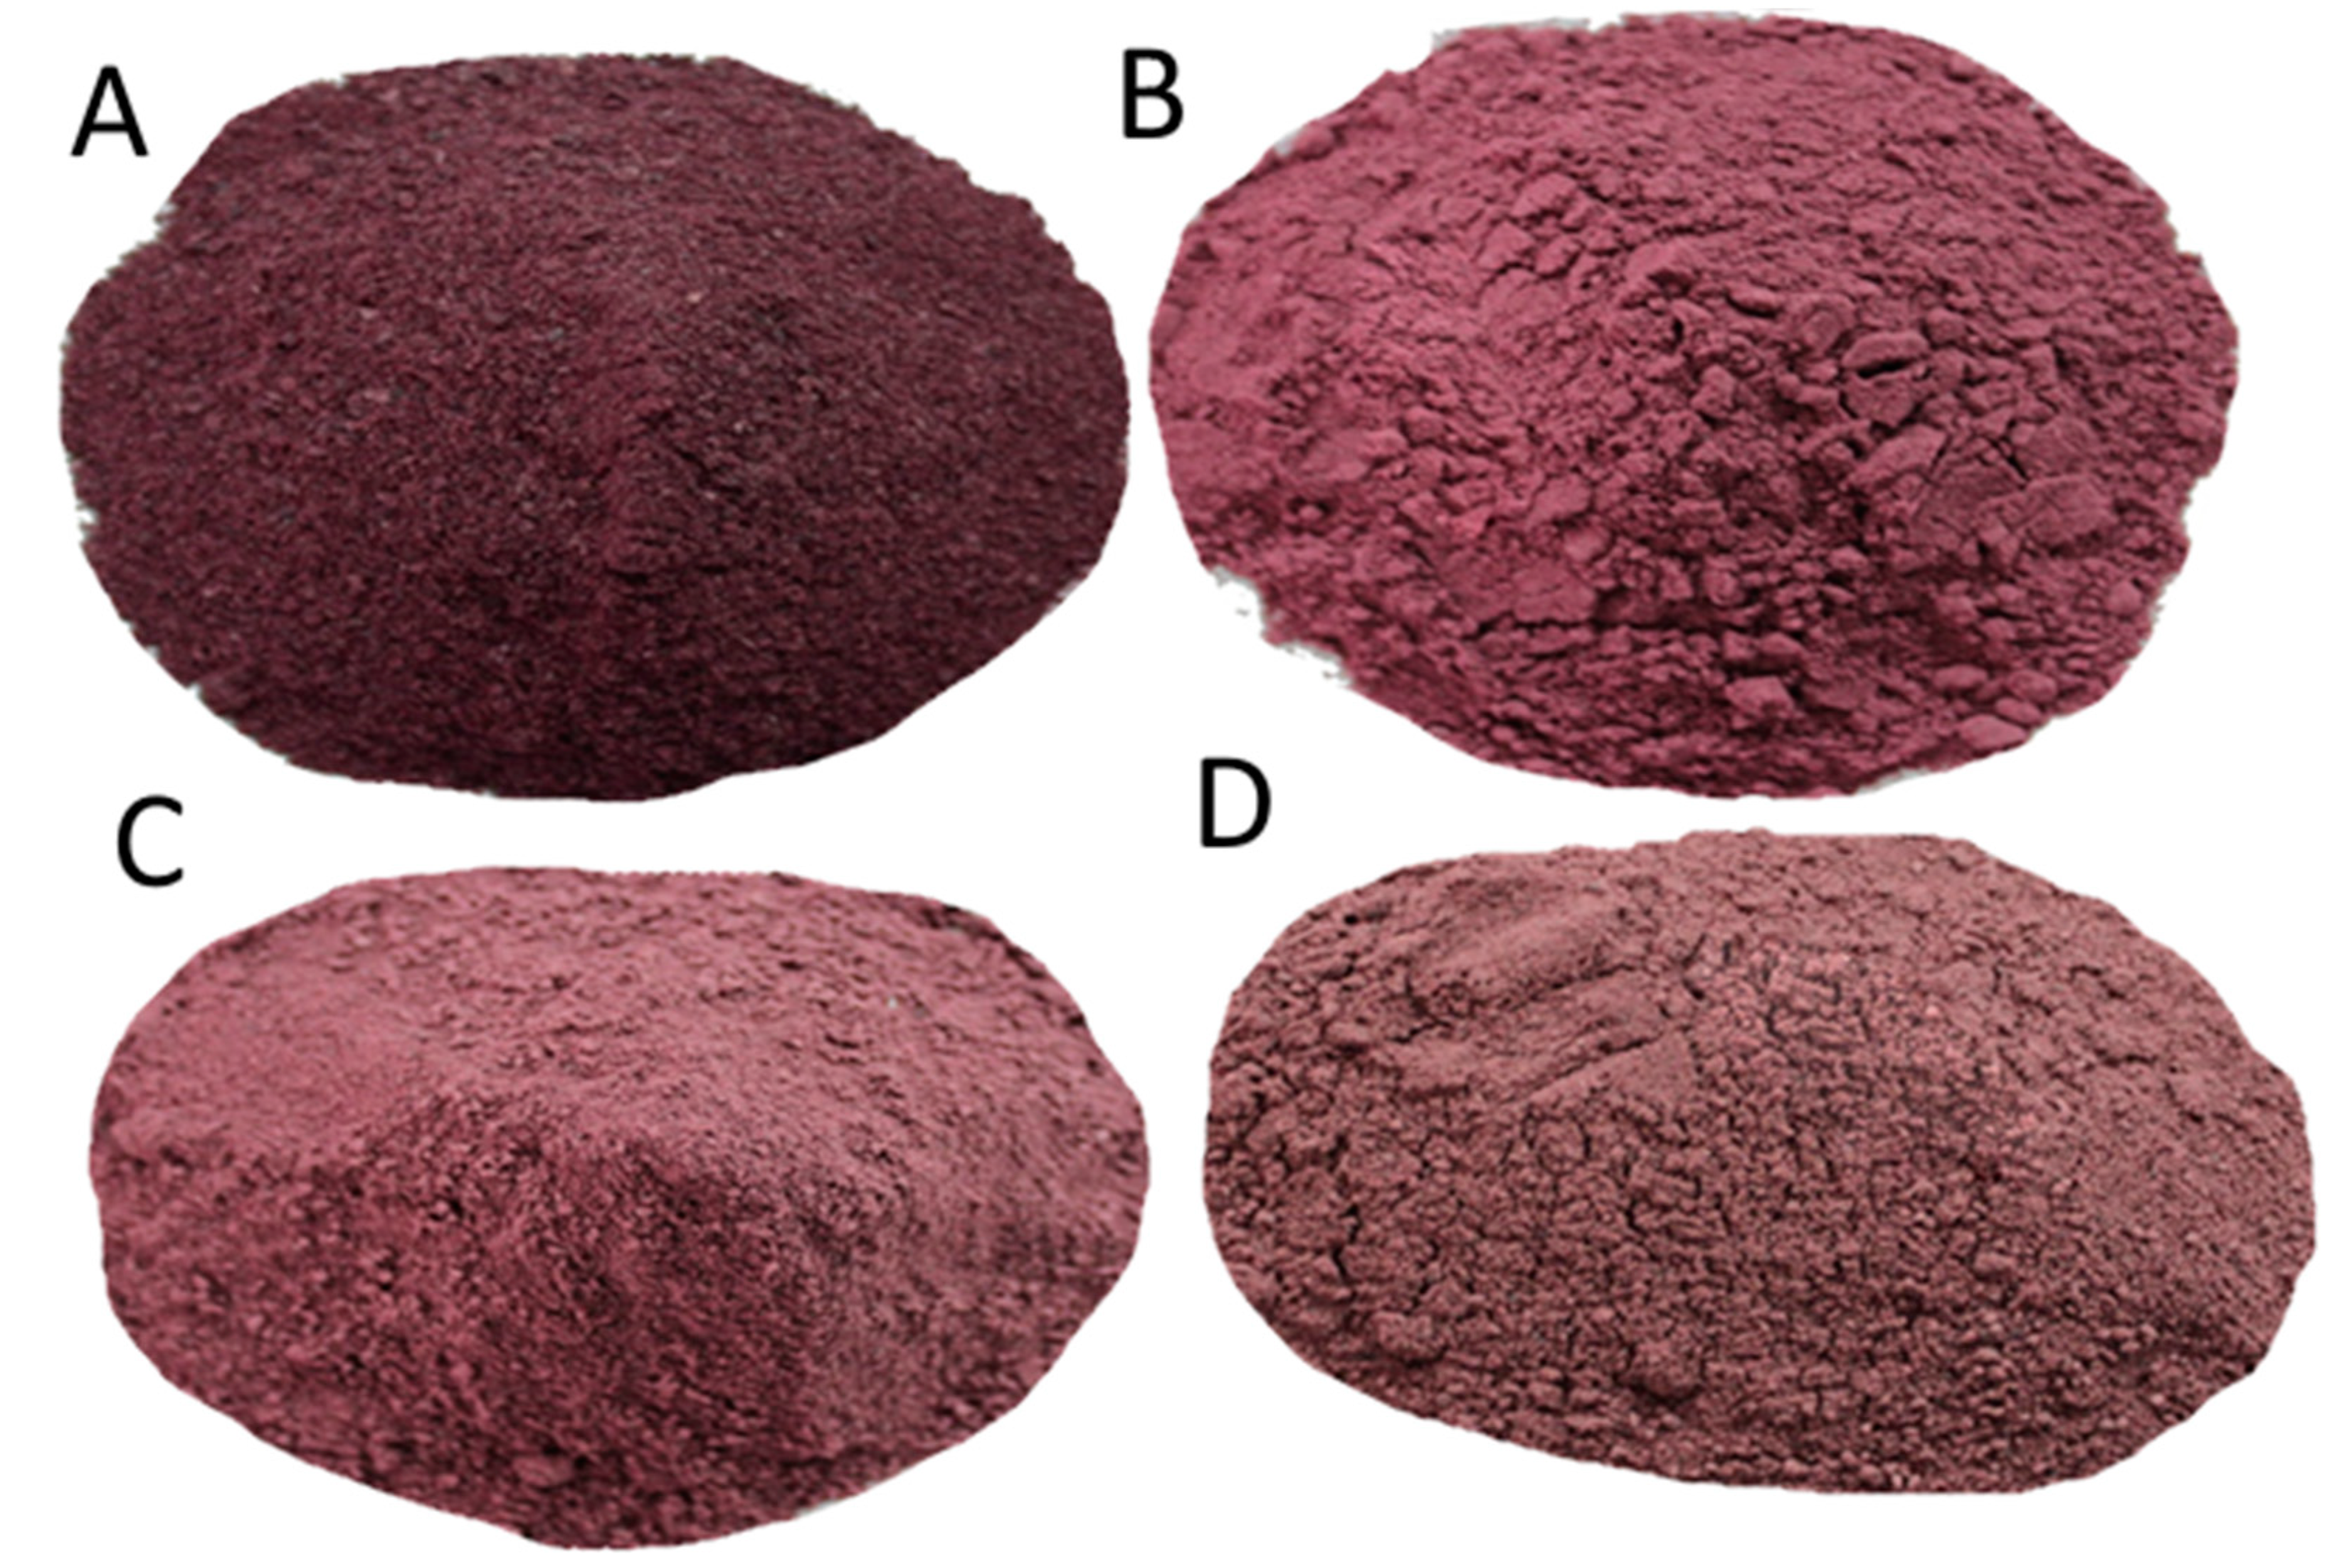
3.5. Color
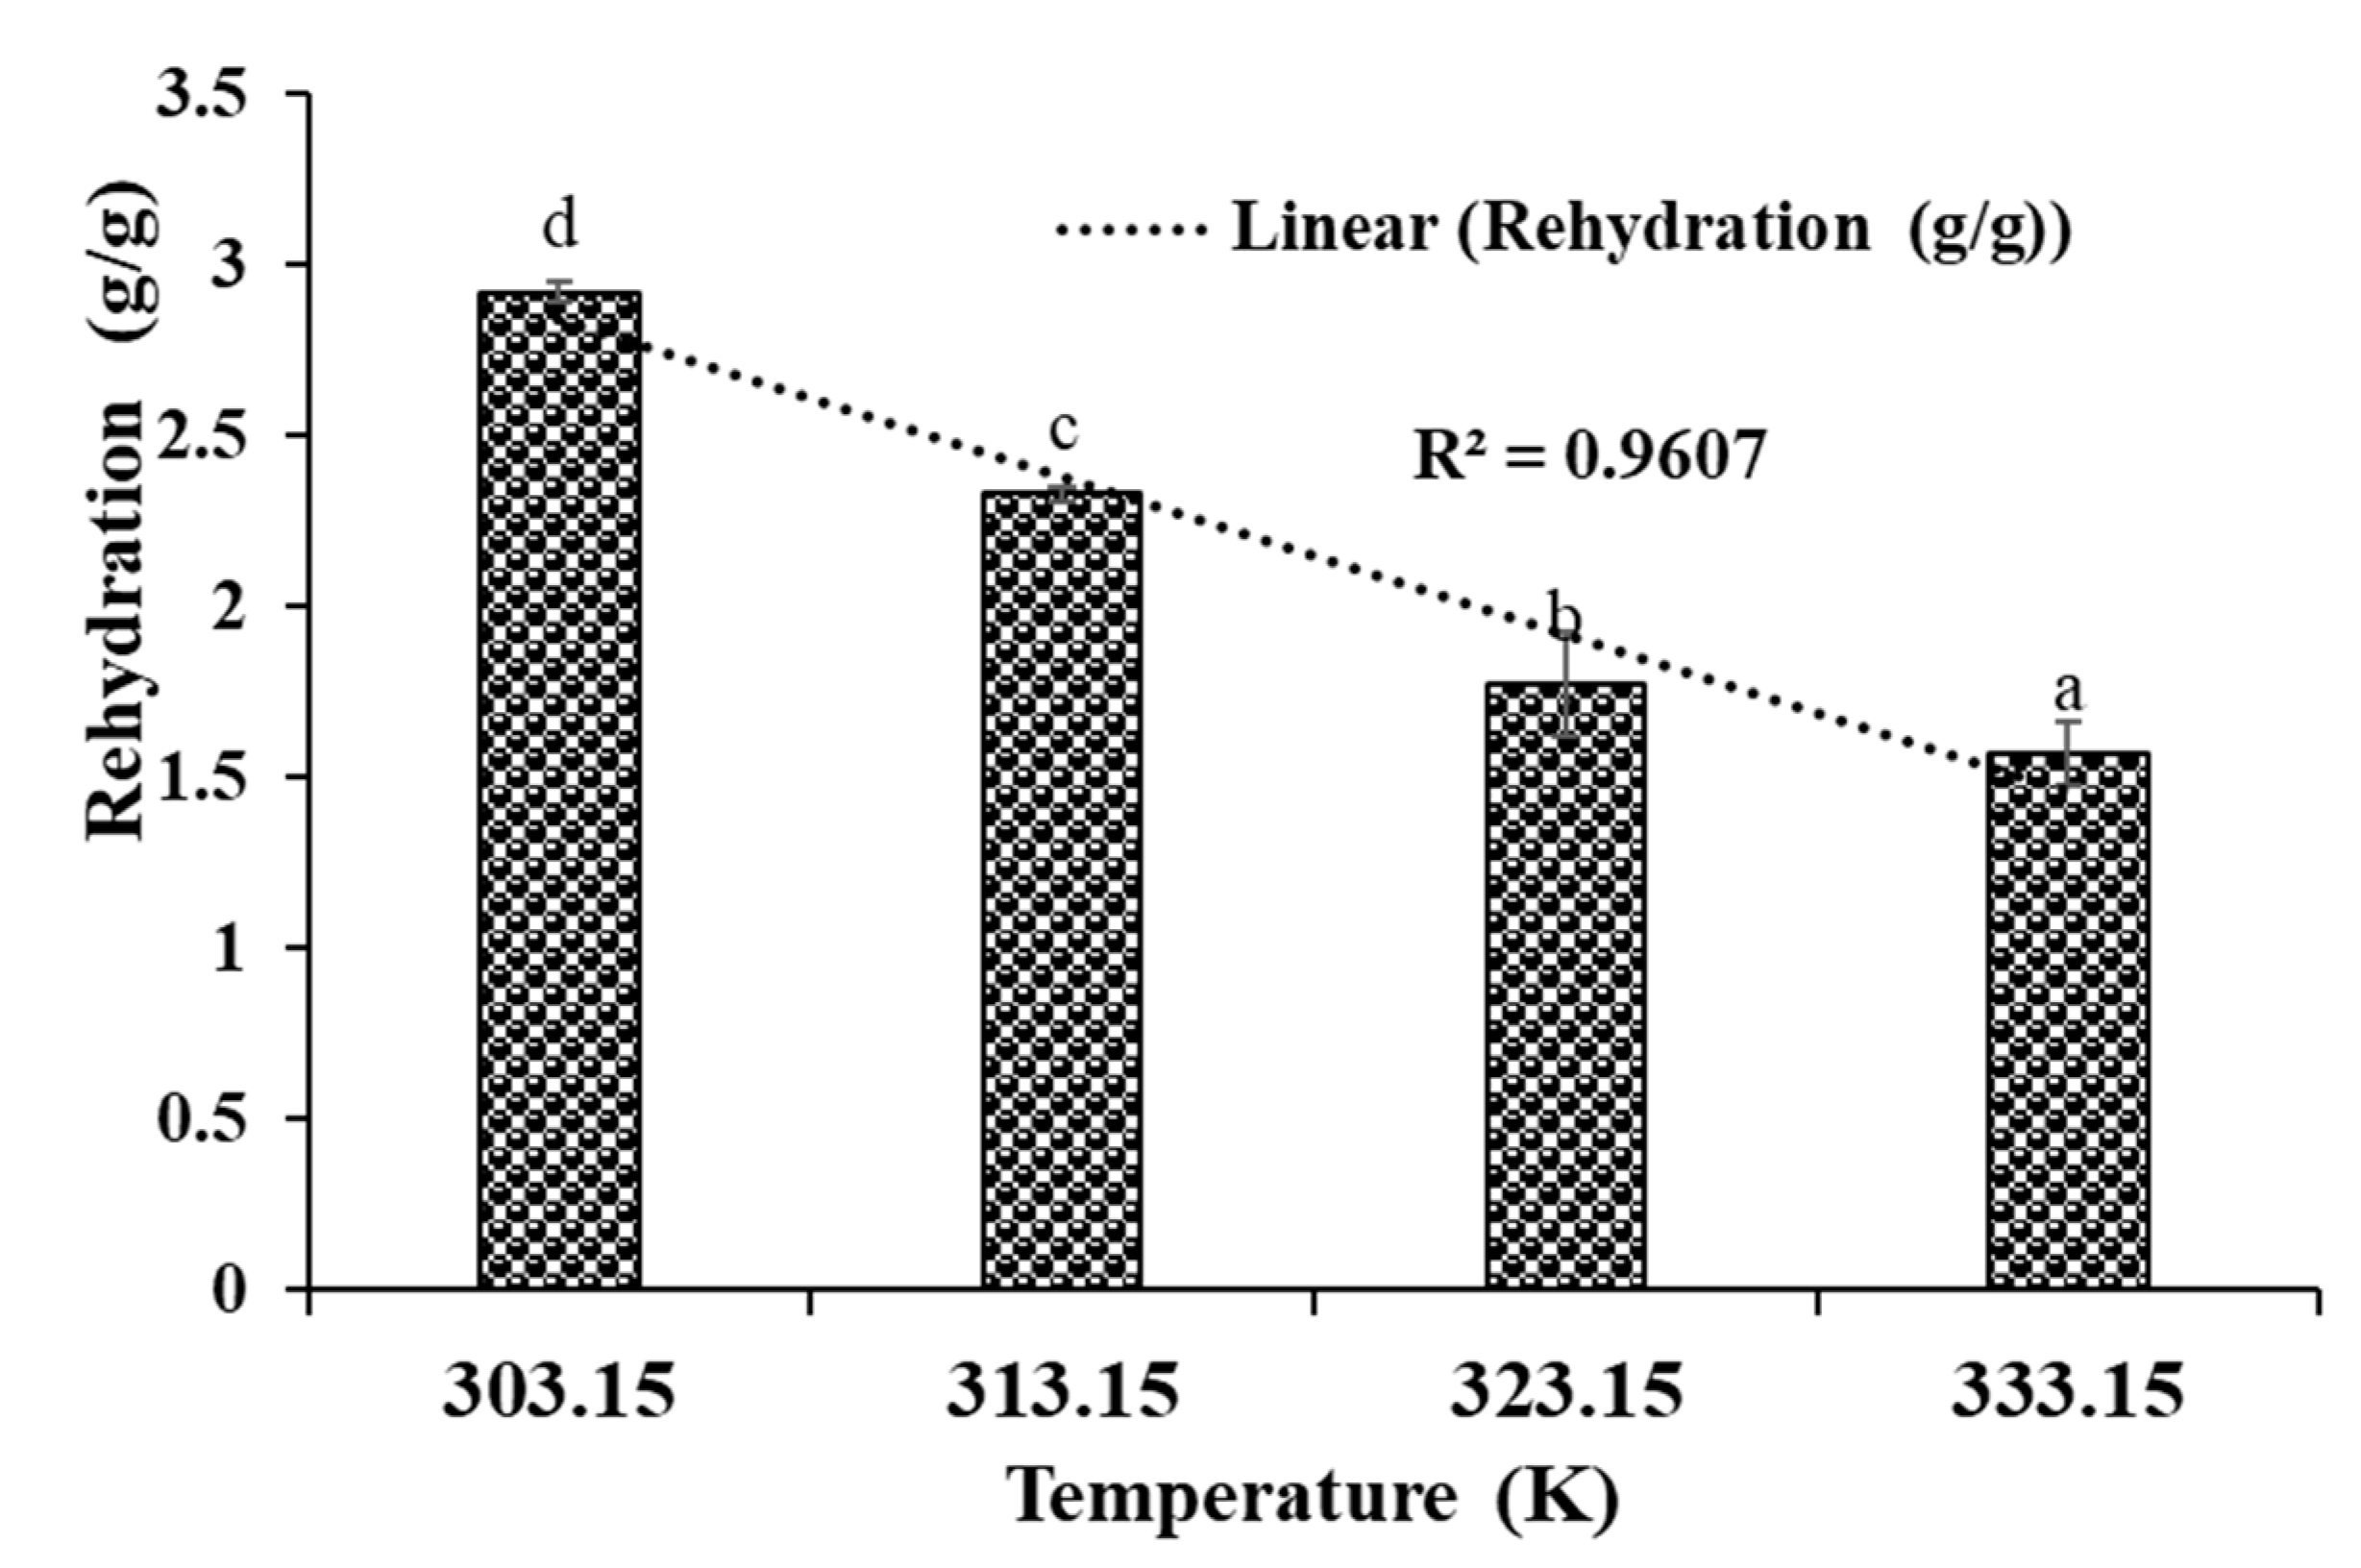
3.6. Rehydration
3.7. Total Phenolic and Flavonoid Contents
3.8. Antioxidant Activity (DPPH• and ABTS• Scavenging)
3.9. Correlation Analysis
4. Conclusions
Author Contributions
Funding
Institutional Review Board Statement
Informed Consent Statement
Data Availability Statement
Acknowledgments
Conflicts of Interest
References
- Myles, S.; Boyko, A.R.; Owens, C.L.; Brown, P.J.; Grassi, F.; Aradhya, M.K.; Prins, B.; Reynolds, A.; Chia, J.-M.; Ware, D.; et al. Genetic structure and domestication history of the grape. Proc. Nat. Acad. Sci. USA 2011, 108, 3530–3535. [Google Scholar] [CrossRef] [PubMed] [Green Version]
- Sridhar, K.; Charles, A.L. In vitro antioxidant activity of Kyoho grape extracts in DPPH and ABTS assays: Estimation methods for EC50 using advanced statistical programs. Food Chem. 2019, 275, 41–49. [Google Scholar] [CrossRef] [PubMed]
- Wang, J.; Mujumdar, A.S.; Mu, W.; Feng, J.; Zhang, X.; Zhang, Q.; Fang, X.-M.; Gao, Z.-J.; Xiao, H.-W. Grape drying: Current status and future trends. In Grape and Wine Biotechnology; IntechOpen Limited: London, UK, 2016; pp. 146–164. [Google Scholar]
- Younis, M.; Abdelkarim, D.; El-Abdein, A.Z. Kinetics and mathematical modeling of infrared thin-layer drying of garlic slices. Saudi J. Biol. Sci. 2018, 25, 332–338. [Google Scholar] [CrossRef] [PubMed]
- Adiletta, G.; Russo, P.; Senadeera, W.; Di Matteo, M. Drying characteristics and quality of grape under physical pretreatment. J. Food Eng. 2016, 172, 9–18. [Google Scholar] [CrossRef] [Green Version]
- Sridhar, K.; Charles, A.L. Mathematical modeling and effect of drying temperature on physicochemical properties of new commercial grape “Kyoho” seeds. J. Food Process. Eng. 2020, 43, e13203. [Google Scholar] [CrossRef]
- Ruiz Celma, A.; Rojas, S.; Lopez-Rodríguez, F. Mathematical modelling of thin-layer infrared drying of wet olive husk. Chem. Eng. Process. Process Int. 2008, 47, 1810–1818. [Google Scholar] [CrossRef]
- da Silva, W.P.; e Silva, C.M.D.P.S.; Gama, F.J.A.; Gomes, J.P. Mathematical models to describe thin-layer drying and to determine drying rate of whole bananas. J. Saudi Soc. Agric. Sci. 2014, 13, 67–74. [Google Scholar] [CrossRef] [Green Version]
- Ertekin, C.; Firat, M.Z. A comprehensive review of thin-layer drying models used in agricultural products. Crit. Rev. Food Sci. Nutr. 2017, 57, 701–717. [Google Scholar] [CrossRef]
- Roberts, J.S.; Kidd, D.R.; Padilla-Zakour, O. Drying kinetics of grape seeds. J. Food Eng. 2008, 89, 460–465. [Google Scholar] [CrossRef]
- Taşeri, L.; Aktaş, M.; Şevik, S.; Gülcü, M.; Seçkin, G.U.; Aktekeli, B. Determination of drying kinetics and quality parameters of grape pomace dried with a heat pump dryer. Food Chem. 2018, 260, 152–159. [Google Scholar] [CrossRef]
- Cruz, L.; Clemente, G.; Mulet, A.; Ahmad-Qasem, M.H.; Barrajón-Catalán, E.; García-Pérez, J.V. Air-borne ultrasonic application in the drying of grape skin: Kinetic and quality considerations. J. Food Eng. 2016, 168, 251–258. [Google Scholar] [CrossRef]
- İsmail, O.; Beyribey, B.; Doymaz, İ. Effect of drying methods on drying characteristic, energy consumption and color of nectarine. J. Therm. Eng. 2016, 2, 801–806. [Google Scholar] [CrossRef]
- da Silva, E.S.; Rupert Brandão, S.C.; Lopes da Silva, A.; Fernandes da Silva, J.H.; Duarte Coêlho, A.C.; Azoubel, P.M. Ultrasound-assisted vacuum drying of nectarine. J. Food Eng. 2019, 246, 119–124. [Google Scholar] [CrossRef]
- Vega-Gálvez, A.; Miranda, M.; Díaz, L.P.; Lopez, L.; Rodriguez, K.; Di Scala, K. Effective moisture diffusivity determination and mathematical modelling of the drying curves of the olive-waste cake. Bioresour. Technol. 2010, 101, 7265–7270. [Google Scholar] [CrossRef] [PubMed]
- Aregbesola, O.A.; Ogunsina, B.S.; Sofolahan, A.E.; Chime, N.N. Mathematical modeling of thin layer drying characteristics of dika (Irvingia gabonensis) nuts and kernels. Niger. Food J. 2015, 33, 83–89. [Google Scholar] [CrossRef] [Green Version]
- Arufe, S.; Valle, G.D.; Chiron, H.; Chenlo, F.; Sineiro, J.; Moreira, R. Effect of brown seaweed powder on physical and textural properties of wheat bread. Eur. Food Res. Technol. 2018, 244, 1–10. [Google Scholar] [CrossRef]
- Sridhar, K.; Charles, A.L. Application of multivariate statistical techniques to assess the phenolic compounds and the in vitro antioxidant activity of commercial grape cultivars. J. Chemom. 2018, 32, e3073. [Google Scholar] [CrossRef]
- Katalinić, V.; Možina, S.S.; Skroza, D.; Generalić, I.; Abramovič, H.; Miloš, M.; Ljubenkov, I.; Piskernik, S.; Pezo, I.; Terpinc, P.; et al. Polyphenolic profile, antioxidant properties and antimicrobial activity of grape skin extracts of 14 Vitis vinifera varieties grown in Dalmatia (Croatia). Food Chem. 2010, 119, 715–723. [Google Scholar] [CrossRef]
- Doshi, P.; Adsule, P.; Banerjee, K.; Oulkar, D. Phenolic compounds, antioxidant activity and insulinotropic effect of extracts prepared from grape (Vitis vinifera L.) byproducts. J. Food Sci. Technol. 2015, 52, 181–190. [Google Scholar] [CrossRef] [Green Version]
- Özkan-Karabacak, A.; Özcan-Sinir, G.; Çopur, A.E.; Bayizit, M. Effect of osmotic dehydration pretreatment on the drying characteristics and quality properties of semi-dried (intermediate) kumquat (Citrus japonica) slices by vacuum dryer. Foods 2022, 11, 2139. [Google Scholar] [CrossRef]
- Esmaiili, M.; Sotudeh-Gharebagh, R.; Cronin, K.; Mousavi, M.A.E.; Rezazadeh, G. Grape drying: A review. Food Rev. Int. 2007, 23, 257–280. [Google Scholar] [CrossRef]
- André, M.; Lacampagne, S.; Barsacq, A.; Gontier, E.; Petrel, M.; Mercier, L.; Courot, D.; Gény-Denis, L. Physical, anatomical, and biochemical composition of skins cell walls from two grapevine cultivars (Vitis vinifera) of Champagne region related to their susceptibility to botrytis cinerea during ripening. Horticulturae 2021, 7, 413. [Google Scholar] [CrossRef]
- Ma, Y.; Liu, D.; Zhang, W.; Li, J.; Wang, H. Effects of hot-air coupled microwave on characteristics and kinetics drying of lotus root slices. ACS Omega 2021, 6, 3951–3960. [Google Scholar] [CrossRef] [PubMed]
- Avhad, M.R.; Marchetti, J.M. Mathematical modelling of the drying kinetics of Hass avocado seeds. Ind. Crop. Prod. 2016, 91, 76–87. [Google Scholar] [CrossRef]
- Planinić, M.; Velić, D.; Tomas, S.; Bilić, M.; Bucić, A. Modelling of drying and rehydration of carrots using Peleg’s model. Eur. Food Res.Technol. 2005, 221, 446–451. [Google Scholar] [CrossRef]
- Song, X.-D.; Mujumdar, A.S.; Law, C.-L.; Fang, X.-M.; Peng, W.-J.; Deng, L.-Z.; Wang, J.; Xiao, H.-W. Effect of drying air temperature on drying kinetics, color, carotenoid content, antioxidant capacity and oxidation of fat for lotus pollen. Dry. Technol. 2020, 38, 1151–1164. [Google Scholar] [CrossRef]
- Adnouni, M.; Jiang, L.; Zhang, X.J.; Zhang, L.Z.; Pathare, P.B.; Roskilly, A.P. Computational modelling for decarbonised drying of agricultural products: Sustainable processes, energy efficiency, and quality improvement. J. Food Eng. 2022, 338, 111247. [Google Scholar] [CrossRef]
- Doymaz, İ. Drying kinetics of black grapes treated with different solutions. J. Food Eng. 2006, 76, 212–217. [Google Scholar] [CrossRef]
- Senadeera, W.; Adilettta, G.; di Matteo, M.; Russo, P. Drying kinetics, quality changes and shrinkage of two grape varieties of Italy. Appl. Mech. Mater. 2014, 553, 362–366. [Google Scholar] [CrossRef] [Green Version]
- Yaldiz, O.; Ertekin, C.; Uzun, H.I. Mathematical modeling of thin layer solar drying of sultana grapes. Energy 2001, 26, 457–465. [Google Scholar] [CrossRef]
- Teles, A.S.C.; Chávez, D.W.H.; Gomes, F.d.S.; Cabral, L.M.C.; Tonon, R.V. Effect of temperature on the degradation of bioactive compounds of Pinot Noir grape pomace during drying. Braz. J. Food Technol. 2018, 21, 1–8. [Google Scholar] [CrossRef] [Green Version]
- Sharma, G.P.; Verma, R.C.; Pathare, P. Mathematical modeling of infrared radiation thin layer drying of onion slices. J. Food Eng. 2005, 71, 282–286. [Google Scholar] [CrossRef]
- Toyosi, Y.T.-A. Mathematical modelling of thin layer sun and solar drying of cassava chips. Int. J. Food Eng. 2010, 6, 1–20. [Google Scholar]
- Khawas, P.; Das, A.J.; Dash, K.K.; Deka, S.C. Thin-layer drying characteristics of kachkal banana peel (Musa ABB) of Assam, India. Int. Food Res. J. 2014, 21, 975–982. [Google Scholar]
- Celma, A.R.; López-Rodríguez, F.; Blázquez, F.C. Experimental modelling of infrared drying of industrial grape by-products. Food Bioprod. Process. 2009, 87, 247–253. [Google Scholar] [CrossRef]
- Alara, O.R.; Abdurahman, N.H.; Abdul Mudalip, S.K.; Olalere, O.A. Mathematical modeling of thin layer drying using open sun and shade of Vernonia amygdalina leaves. Agric. Nat. Resour. 2018, 52, 53–58. [Google Scholar] [CrossRef]
- Sacilik, K. Effect of drying methods on thin-layer drying characteristics of hull-less seed pumpkin (Cucurbita pepo L.). J. Food Engg. 2007, 79, 23–30. [Google Scholar] [CrossRef]
- Jéssica, L.; Vega-Gálvez, A.; Torres, M.J.; Lemus-Mondaca, R.; Quispe-Fuentes, I.; Di Scala, K. Effect of dehydration temperature on physico-chemical properties and antioxidant capacity of goldenberry (Physalis peruviana L.). Chil. J. Agric. Res. 2013, 73, 293–300. [Google Scholar]
- Xie, H.; Zhao, R.; Liu, C.; Wu, Y.; Duan, X.; Hu, J.; Yang, F.; Wang, H. Dynamic changes in volatile flavor compounds, amino acids, organic acids, and soluble sugars in lemon juice vesicles during freeze-drying and hot-air drying. Foods 2022, 11, 2862. [Google Scholar] [CrossRef]
- Bingol, G.; Roberts, J.S.; Balaban, M.O.; Devres, Y.O. Effect of dipping temperature and dipping time on drying rate and color change of grapes. Dry. Technol. 2012, 30, 597–606. [Google Scholar] [CrossRef]
- Langová, R.; Jůzl, M.; Cwiková, O.; Kos, I. Effect of different method of drying of five varieties grapes (Vitis vinifera L.) on the bunch stem on physicochemical, microbiological, and sensory quality. Foods 2020, 9, 1183. [Google Scholar] [CrossRef] [PubMed]
- Lim, Y.J.; Eom, S.H. The different contributors to antioxidant activity in thermally dried flesh and peel of astringent persimmon fruit. Antioxidants 2022, 11, 597. [Google Scholar] [CrossRef] [PubMed]
- Kahraman, O.; Malvandi, A.; Vargas, L.; Feng, H. Drying characteristics and quality attributes of apple slices dried by a non-thermal ultrasonic contact drying method. Ultrason. Sonochem. 2021, 73, 105510. [Google Scholar] [CrossRef] [PubMed]
- Sridhar, K.; Inbaraj, B.S.; Chen, B.-H. Recent advances on nanoparticle based strategies for improving carotenoid stability and biological activity. Antioxidants 2021, 10, 713. [Google Scholar] [CrossRef]
- Serratosa, M.P.; Marquez, A.; Lopez-Toledano, A.; Medina, M.; Merida, J. Changes in hydrophilic and lipophilic antioxidant activity in relation to their phenolic composition during the chamber drying of red grapes at a controlled temperature. J. Agric. Food Chem. 2011, 59, 1882–1892. [Google Scholar] [CrossRef]
- Kumar, D.; Ladaniya, M.S.; Gurjar, M.; Kumar, S. Impact of drying methods on natural antioxidants, phenols and flavanones of immature dropped Citrus sinensis L. Osbeck fruits. Sci. Rep. 2022, 12, 6684. [Google Scholar] [CrossRef]
- Çoklar, H.; Akbulut, M. Effect of sun, oven and freeze-drying on anthocyanins, phenolic compounds and antioxidant activity of black grape (Ekşikara) (Vitis vinifera L.). S. Afr. J. Enol. Vitic. 2017, 38, 264–272. [Google Scholar] [CrossRef] [Green Version]
- Pedroza, M.A.; Carmona, M.; Pardo, F.; Salinas, M.R.; Zalacain, A. Waste grape skins thermal dehydration: Potential release of colour, phenolic and aroma compounds into wine. CyTA-J. Food 2012, 10, 225–234. [Google Scholar] [CrossRef]
- Cecchi, L.; Khatib, M.; Bellumori, M.; Civa, V.; Domizio, P.; Innocenti, M.; Balli, D.; Mulinacci, N. Industrial drying for agrifood by-products re-use: Cases studies on pomegranate peel (Punica granatum L.) and stoned olive pomace (pâtè, Olea europaea L.). Food Chem. 2022, 403, 134338. [Google Scholar] [CrossRef]


| Model | Equation |
|---|---|
| Lewis | MR = = (exp – kt) |
| Page | MR = = exp(–ktN) |
| Henderson–Pabis | MR = = a exp(–kt) |
| Logarithmic | MR = = a exp(–kt) + c |
| Two-term | MR = = a1 exp (–k1t) + a2 exp (–k2t) |
| Temperature (K) | Lewis | Page | Henderson–Pabis | Logarithmic | Two-Term | ||||||||||||
|---|---|---|---|---|---|---|---|---|---|---|---|---|---|---|---|---|---|
| k | R2 | k | N | R2 | k | a | R2 | k | a | c | R2 | k1 | k2 | a1 | a2 | R2 | |
| 303.15 | 0.2311 ± 0.01 | 0.9236 | 0.1171 ± 0.05 | 1.4720 ± 0.17 | 0.9815 | 0.2827 ± 0.10 | 1.2060 ± 0.71 | 0.9640 | 0.2441 ± 0.08 | 1.2470 ± 1.05 | −0.0715 ± 0.03 | 0.9659 | −2.2010 ± 0.71 | 0.2896 ± 0.05 | 2.414 ± 0.21 × 10⁻¹⁰ | 1.2310 ± 0.31 | 0.9643 |
| 313.15 | 0.3685 ± 0.10 | 0.9395 | 0.2815 ± 0.08 | 1.2520 ± 0.13 | 0.9577 | 0.4270 ± 0.19 | 1.1560 ± 0.22 | 0.9582 | 0.4686 ± 0.16 | 1.1520 ± 0.08 | 0.0320 ± 0.004 | 0.9595 | −1.0570 ± 0.04 | 1.1820 ± 0.54 | 4.1050 ± 1.48 × 10⁻⁵ | 1.1820 ± 0.076 | 0.9639 |
| 323.15 | 0.5615 ± 0.18 | 0.9158 | 0.4438 ± 0.10 | 1.3800 ± 0.51 | 0.9479 | 0.7283 ± 0.31 | 1.306 ± 1.05 | 0.9606 | 0.8887 ± 0.28 | 1.3500 ± 0.34 | 0.0601 ± 0.04 | 0.9692 | 0.7949 ± 0.33 | −0.8514 ± 0.08 | 1.372 ± 0.22 | 0.0011 ± 0.001 | 0.9737 |
| 333.15 | 0.7772 ± 0.05 | 0.8741 | 0.6230 ± 0.20 | 1.7810 ± 0.66 | 0.9685 | 1.1430 ± 0.90 | 1.5290 ± 0.07 | 0.9667 | −0.0014 ± 0.01 | −293.50 ± 147.08 | 294.30 ± 125.70 | 0.8040 | 0.3829 ± 0.17 | 0.4025 ± 0.16 | −19.28 ± 2.57 | 20.45 ± 4.08 | 0.9378 |
| Temperature (K) | Lewis | Page | Henderson–Pabis | Logarithmic | Two-Term | ||||||||||
|---|---|---|---|---|---|---|---|---|---|---|---|---|---|---|---|
| χ2 | RMSE | SSE | χ2 | RMSE | SSE | χ2 | RMSE | SSE | χ2 | RMSE | SSE | χ2 | RMSE | SSE | |
| 303.15 | 0.0827 | 0.0827 | 0.1096 | 0.0239 | 0.0504 | 0.0381 | 0.0586 | 0.0586 | 0.0519 | 0.0590 | 0.0591 | 0.0488 | 0.0627 | 0.0627 | 0.0512 |
| 313.15 | 0.0614 | 0.0681 | 0.0664 | 0.1009 | 0.0603 | 0.0422 | 0.0545 | 0.0607 | 0.0417 | 4.3924 | 0.0606 | 0.0403 | 0.0543 | 0.0600 | 0.0360 |
| 323.15 | 0.0618 | 0.0824 | 0.0611 | 0.0808 | 0.0688 | 0.0378 | 0.0436 | 0.0598 | 0.0286 | 0.0573 | 0.0565 | 0.0223 | 0.0383 | 0.0564 | 0.0191 |
| 333.15 | 0.0622 | 0.1113 | 0.0619 | 0.0220 | 0.0622 | 0.0154 | 0.0330 | 0.0640 | 0.0164 | 0.1889 | 0.1793 | 0.0964 | 0.0485 | 0.1236 | 0.0305 |
| Temperature (K) | Deff (m2/s) × 10−8 | Ea(kJ/mol) | R2 |
|---|---|---|---|
| 303.15 | 2.87 ± 1.37 a | 33.78 ± 1.06 | 0.9355 |
| 313.15 | 3.60 ± 1.08 b | 0.9852 | |
| 323.15 | 5.15 ± 1.00 c | 0.9733 | |
| 333.15 | 9.82 ± 1.74 d | 0.9804 |
| Temperature (K) | L | a | b | ΔE |
|---|---|---|---|---|
| 303.15 | 24.67 ± 0.38 a | 18.28 ± 0.11 b | 2.71 ± 0.01 b | 1.45 ±0.23 a |
| 313.15 | 26.28 ± 0.27 b | 16.62 ± 0.05 a | 3.49 ± 0.05 d | 3.22 ± 0.04 b |
| 323.15 | 28.74 ± 0.78 c | 20.20 ± 0.47 c | 3.05 ± 0.03 c | 3.83 ± 0.67 b |
| 333.15 | 30.41 ± 0.15 d | 21.53 ± 0.17 d | 2.06 ± 0.02 a | 5.66 ± 0.06 c |
| Temperature (K) | TPC (mg GAE/g) | TFC (mg QE/g) |
|---|---|---|
| 303.15 | 0.37 ± 0.04 b | 2.36 ± 0.78 b |
| 313.15 | 0.33 ± 0.03 b | 2.19 ± 0.74 ab |
| 323.15 | 0.30 ± 0.04 ab | 1.35 ± 0.43 ab |
| 333.15 | 0.23 ± 0.03 a | 1.05 ± 0.33 a |
| Temperature (K) | Antioxidant Activity | |
|---|---|---|
| DPPH• Method | ABTS• Method | |
| 303.15 | 93.06 ± 0.48 c | 96.69 ± 1.17 d |
| 313.15 | 84.57 ± 0.19 b | 82.24 ± 0.94 c |
| 323.15 | 85.38 ± 0.40 b | 43.14 ± 2.02 b |
| 333.15 | 73.31 ± 1.13 a | 11.87 ± 1.89 a |
| Parameter | 303.15 K | 313.15 K | ||||||
|---|---|---|---|---|---|---|---|---|
| TPC | TFC | DPPH• | ABTS• | TPC | TFC | DPPH• | ABTS• | |
| TPC | 1 | 0.95 | 0.94 | −0.33 | 1 | 0.99 | 0.53 | −1 * |
| TFC | 1 | 0.79 | −0.61 | 1 | 0.42 | −0.99 | ||
| DPPH• | 1 | −0.01 | 1 | −0.51 | ||||
| ABTS• | 1 | 1 | ||||||
| Parameter | 323.15 K | 333.15 K | ||||||
| TPC | TFC | DPPH• | ABTS• | TPC | TFC | DPPH• | ABTS• | |
| TPC | 1 | 1 ** | 0.50 | 0.07 | 1 | 1 ** | -0.82 | −0.93 |
| TFC | 1 | 0.50 | 0.08 | 1 | -0.82 | −0.93 | ||
| DPPH• | 1 | −0.81 | 1 | 0.97 | ||||
| ABTS• | 1 | 1 | ||||||
Publisher’s Note: MDPI stays neutral with regard to jurisdictional claims in published maps and institutional affiliations. |
© 2022 by the authors. Licensee MDPI, Basel, Switzerland. This article is an open access article distributed under the terms and conditions of the Creative Commons Attribution (CC BY) license (https://creativecommons.org/licenses/by/4.0/).
Share and Cite
Sridhar, K.; Charles, A.L. Mathematical Modeling to Describe Drying Behavior of Kyoho (Vitis labruscana) Skin Waste: Drying Kinetics and Quality Attributes. Processes 2022, 10, 2092. https://doi.org/10.3390/pr10102092
Sridhar K, Charles AL. Mathematical Modeling to Describe Drying Behavior of Kyoho (Vitis labruscana) Skin Waste: Drying Kinetics and Quality Attributes. Processes. 2022; 10(10):2092. https://doi.org/10.3390/pr10102092
Chicago/Turabian StyleSridhar, Kandi, and Albert Linton Charles. 2022. "Mathematical Modeling to Describe Drying Behavior of Kyoho (Vitis labruscana) Skin Waste: Drying Kinetics and Quality Attributes" Processes 10, no. 10: 2092. https://doi.org/10.3390/pr10102092