Article

The Efficacy of Plant Enzymes Bromelain and Papain as a Tool for Reducing Gluten Immunogenicity from Wheat Bran

by
Vijole Bradauskiene
1,*,
Lina Vaiciulyte-Funk
1,
Darius Cernauskas
1,
Reda Dzingeleviciene
2,
Joao P. M. Lima
3,4,
Aida Bradauskaite
5 and
Mihaela Adriana Tita
6
1
Food Institute, Kaunas University of Technology, Radvilenu Road 19, 44307 Kaunas, Lithuania
2
Faculty of Health Sciences, Klaipeda University, H. Manto Street 84, 92294 Klaipeda, Lithuania
3
Politechnical of Coimbra, ESTeSC, UCPDN, Rua 5 de Outubro–SM Bispo, Apartado 7006, 3046-854 Coimbra, Portugal
4
GreenUPorto—Sustainable Agrifood Production Research Centre, Rua da Agrária 747, 4485-646 Vairão, Portugal
5
Faculty of Veterinary and Experimental Sciences, Catholic University of Valencia San Vicente Mártir, Calle de Guillem de Castro 94, 46001 València, Spain
6
Department of Agricultural Sciences and Food Engineering, Lucian Blaga University of Sibiu, Doctor Ion Rațiu 7, 550012 Sibiu, Romania
*
Author to whom correspondence should be addressed.
Processes 2022, 10(10), 1948; https://doi.org/10.3390/pr10101948
Submission received: 8 September 2022 / Revised: 23 September 2022 / Accepted: 24 September 2022 / Published: 27 September 2022
(This article belongs to the Special Issue Applications of Structural Biology Techniques in Enzymology)

Abstract

:
Gluten-free products made from naturally gluten-free raw materials have an inferior taste and can cause deficiencies in various nutrients, especially non-starch polysaccharides. To address this problem, scientists are searching for new strategies to eliminate harmful gluten from wheat, rye, and barley and to produce balanced products with good organoleptic properties. This study evaluated the possibility of hydrolysing gluten in wheat bran, a by-product obtained after the dry fractionation of wheat, using plant enzymes. The gluten content of wheat bran after treatment with papain, bromelain, and their combination under different hydrolysis conditions was investigated. The amount of gluten was determined using an enzyme-linked immunosorbent assay ELISA R5 and the reduction in immunogenic gliadins was analysed using high-performance reverse phase liquid chromatography. The results of the study showed that 4 h hydrolysis with bromelain and papain reduced the levels of gluten immunogenic compounds in bran from 58,650.00 to 2588.20–3544.50 mg/kg; however, they did not reach the gluten-free limit. A higher hydrolysis efficiency of 95.59% was observed after treatment with papain, while the combination of both enzymes and bromelain alone were less effective. The results presented in this article will be helpful to other researchers and manufacturers of wheat-based products when selecting methods to reduce gluten immunogenicity and contribute to the development of sustainable technologies.

1. Introduction

With increasing wheat consumption, the prevalence of wheat allergies and celiac disease (CD) is also rising worldwide [1,2]. People with gluten-intolerance-related diseases depend on a gluten-free (GF) diet, and therefore the demand for products suitable for this diet is increasing. Gluten-free bread and pastry products made from natural GF raw materials, such as rice, corn, buckwheat, sorghum, and amaranth flour, have an inferior taste [3] and can cause deficiencies in a variety of nutrients including fibre, niacin, folate, thiamine, vitamin A, vitamin B12, calcium, phosphorus, magnesium, iron, zinc, and selenium [4]. The GF diet is unbalanced and usually has a higher percentage of calories from fat and sugars and a high glycaemic index but a low intake of non-starch polysaccharides [5]. These polysaccharides, predominantly arabinoxylans, are important for reducing risk factors of chronic diseases and are particularly important in the diet of people with CD, as their deficiency causes dysbacteriosis [6].
The increasing demand for high-quality GF bread products makes it necessary to look for new ways to produce balanced GF products with good organoleptic properties from wheat, rye, and barley. The GF diet should also be healthy and provide the body with the necessary vitamins and minerals [7]. Therefore, it is essential to investigate methods to remove or reduce the immunogenicity of cereals and to use their valuable components in GF products.
Gluten, also known as reserve protein, is the main protein in wheat cereals and accounts for around 75–80% of all wheat protein. Gluten consists of a series of interrelated proteins of different structures and molecular weights, which are divided into two main fractions according to their solubility in alcohol–water solutions: soluble gliadins and insoluble glutenins. Gliadins are a polymorphic mixture of 70% alcohol-soluble proteins [8]. The molecular weight of gliadins varies between 30,000–80,000 Da. They are further subdivided into four groups: α, β, γ, and ω based on polyacrylamide gel electrophoresis. This classification is based on the amino acid sequences and composition and the molecular weights of the gliadins. The α-, β-, and γ-gliadins have interchain disulfide bonds, while the ω-gliadins do not contain cysteine and do not form these bonds. Gluten contains high levels of the amino acids glutamine (26–53%) and proline (10–29%), making it highly resistant to human digestive tract enzymes [9]. Consequently, the protein peptides are left undigested. They penetrate the mucosa of the small intestine and, together with tissue transglutaminase receptors and HLA-DQ2 and HLA-DQ8 antigens, initiate the immune response of antigenic cells in the case of CD or induce recognition by IgE antibodies that promote allergic inflammation [10]. Most immunogenic peptides are composed of at least nine amino acids and contain celiac toxic motifs of four or five amino acid sequences such as: Gln-Gln-Gln-Pro-Pro, Gln-Pro-Tyr-Pro, Gln-Gln-Pro-Tyr, or Pro-Ser-Gln-Gln, related to celiac toxicity and IgE-mediated allergies in food products [11]. Therefore, gluten must be hydrolysed to form peptides that are as small as possible, which will not bind to the receptor, and the immune response will not occur. Consequently, enzymes capable of hydrolysing gluten into small peptides are theoretically suitable for eliminating the immunogenicity of gluten from cereals. It can be performed using a variety of endogenous and exogenous enzymes of different origins, including bacteria, fungi, plants, and animals [8,12].
Previous studies [13,14] suggested the use of enzymatically hydrolysed wheat flour for the production of GF products. This process requires high enzyme concentrations and long-term treatment. As a result, the viscoelastic properties of gluten during hydrolysis are lost [15], and cereal products cannot be prepared from processed wheat flours without the use of additives. However, most enzymes currently used for gluten hydrolysis are of microbial or fungal origin and have not been validated for safe long-term human use [16]. It is unclear whether the technological properties of such detoxified flours are superior to those of wheat starch obtained by wet fractionation. Studies on the removal of small amounts of gluten from wheat starch have been reported in scientific literature [17]. Some of these methods have been patented [18] and used in the production of gluten-free products.
To produce healthier wheat products, the use of other wheat components, including bran, in gluten-free products must be investigated. The wheat bran fraction is rich in arabinoxylans, which are not only beneficial to human health, but can also improve the textural properties of gluten-free bread products [19]; however, they have high levels of gluten. Therefore, it is important to determine whether enzymes can remove immunoreactive residues from wheat bran.
Proteases of plant origin are among the most suitable enzymes for this purpose. Plant proteases are mostly found in fruits, such as papaya, pineapples, figs, leek, ginger, kiwifruit, and vegetables, such as leek, broccoli, and red pepper [20]. Pineapples, figs, and papaya are commonly used to produce highly active, commercial proteases. Previous studies [21,22,23,24] have demonstrated the potential of bromelain and papain in reducing allergenic gliadins in wheat flour. However, this effect was not sufficient to break down the high levels of gluten found in flour, making it unsuitable for the manufacture of GF products. To the best of our knowledge, no studies have been carried out to investigate whether they can decompose gluten in wheat processing by-products (e.g., bran) to safe levels, which would allow them to be used in the production of valuable GF products.
This study aimed to investigate the efficacy of enzymes of plant origin, bromelain and papain, as tools for removing or reducing gluten immunogenicity from wheat bran.

2. Materials and Methods

2.1. Materials

Samples of wheat (Triticum aestivum) bran were provided by Roquette Amilina (AB, Lithuania). A fraction of wheat bran was obtained as a by-product of dry milling of wheat grains, and no heat treatment was applied during the process.
Two commercially available plant enzymes, papain and bromelain, were used in the present study. Papain (EC 3.4.22.2) from papaya (Carica papaya) (enzymatic activity 3000 U/g) and bromelain (EC 3.4.22.32) from pineapple (Ananas comosus) stems (enzymatic activity 3000 U/g) were purchased from Sigma-Aldrich Chemie GmbH (Munich, Germany).

2.2. Preparation of Samples

Wheat bran was ground in a laboratory mill Perten 3303 (Perten Instruments GmbH, Hamburg, Germany). The total plate count of microorganisms in samples was performed according to standard procedures LST EN ISO 4833:2003.

2.2.1. The Conditions of Enzymatic Hydrolysis

Samples of wheat bran (1 g) were weighed and placed in glass tubes (15 mL), 5 mL of distilled water was added to the tubes for control, and solutions of distilled water and enzymes (5 mL) were added to the others at the enzyme concentrations 0.25, 0.5, and 0.75% of substrate (54, 108, and 162 U/1 g of substrate protein) and mixed well. Enzymatic hydrolysis was carried out at 37 °C, 45 °C, and 50 °C for 1–4 h.
To determine the optimal pH for protease activity, enzymatic hydrolysis was performed by suspending the enzymes in buffers of pH 4, 5, 6, 7, 8, and water. After each hour of hydrolysis, the samples were shaken with a vortex and the pH was measured. The total protease activity in the samples was performed after the 4 h hydrolysis process, then the hydrolysis reaction was stopped by heating of samples for 10 min at 90 °C, the samples were flash-frozen and stored at −18 °C for gluten fractionation and assays.

2.2.2. Extraction of Gluten Proteins

Gluten was extracted as described by Dhaka and Khatkar [25]. After the separation of water-soluble albumins and salt-soluble globulins, the samples were weighed and used for gluten protein extraction. For extraction of gliadins, the tubes with sediment samples were filled with 5 mL of ethanol/water 70/30 (v/v) solution, shaken for 1 h at room temperature, centrifuged at 6000 rpm for 20 min, and the supernatant fraction containing gliadins was used for further analysis.

2.3. Physico-Chemical Analysis of the Composition of Wheat Bran and Hydrolysates

The total protein content in bran was determined using the Kjeldahl method (ICC Standard Method No. 105/2:1994) by multiplying the determined nitrogen content by 5.7.
The pH of samples was measured using a pH meter (PP–15, Sartorius AG, Göttingen, Germany).

2.3.1. Determination of Soluble Proteins

The soluble protein content of wheat bran substrates was evaluated spectrophotometrically [26]. This method is based on the ability of protein solutions to absorb UV rays at 280 and 260 nm. Amino acids with aromatic rings absorb UV rays at a wavelength of 280 nm, and the absorption at 260 nm is attributed to nucleic acids.

2.3.2. Evaluation of Protease Activity

The Sigma-Aldrich SSCASE01.001 protocol, described by Cupp-Enyard [27], was used to determine the protease activity. Under the action of a protease, casein is cleaved into amino acids, including tyrosine, which react with the Folin–Ciocalteu phenolic reagent (Sigma Aldrich Chemie GmbH, Munich, Germany) to form blue compounds. The free tyrosine content, which depends on the intensity of the blue colour, was determined colourimetrically by measuring the absorption of the test solution at 660 nm using a UV-VIS spectrophotometer UV3100PC (VWR International, Leuven, Belgium). Protease activity, expressed in units of activity (micromoles of tyrosine equivalents released from a casein substrate over 1 min at a different pH from 4 to 8, at 37 °C temperature), was determined using a calibration line based on the colour reaction results of known concentrations tyrosine solutions with Folin–Ciocalteu phenolic reagent.

2.3.3. Immunological Analysis

After hydrolysis, the samples were weighed and used for immunological analysis. Gluten residues in the wheat bran samples were quantified by competitive ELISA using a monoclonal R5 antibody (R-Biopharm AG, Darmstadt, Germany). ELISA measurements were performed according to the manufacturer’s instructions. Briefly, 0.25 g of the sample was weighed, 2.5 mL of cock-tail solution was added for gluten extraction, followed by incubation for 40 min at 50 °C. The gliadins were dissolved in ethyl alcohol solution by adding 7.5 mL of ethanol/water (80/20, v/v) solution and shaking for 1 h on a Biosan Multi Bio 3D shaker (Biosan, Riga, Latvia). The resulting liquid was centrifuged at 6000 rpm for 15 min, and the supernatant was collected to determine gliadin concentration using an ELISA kit. A Multiscan EX microplate reader (Thermo Fisher Scientific Inc., Waltham, MA, USA) with a 450 nm filter was used to read the strips. Gliadin concentrations were established based on the calibration curve and converted into gluten concentrations by multiplying by a factor of two.

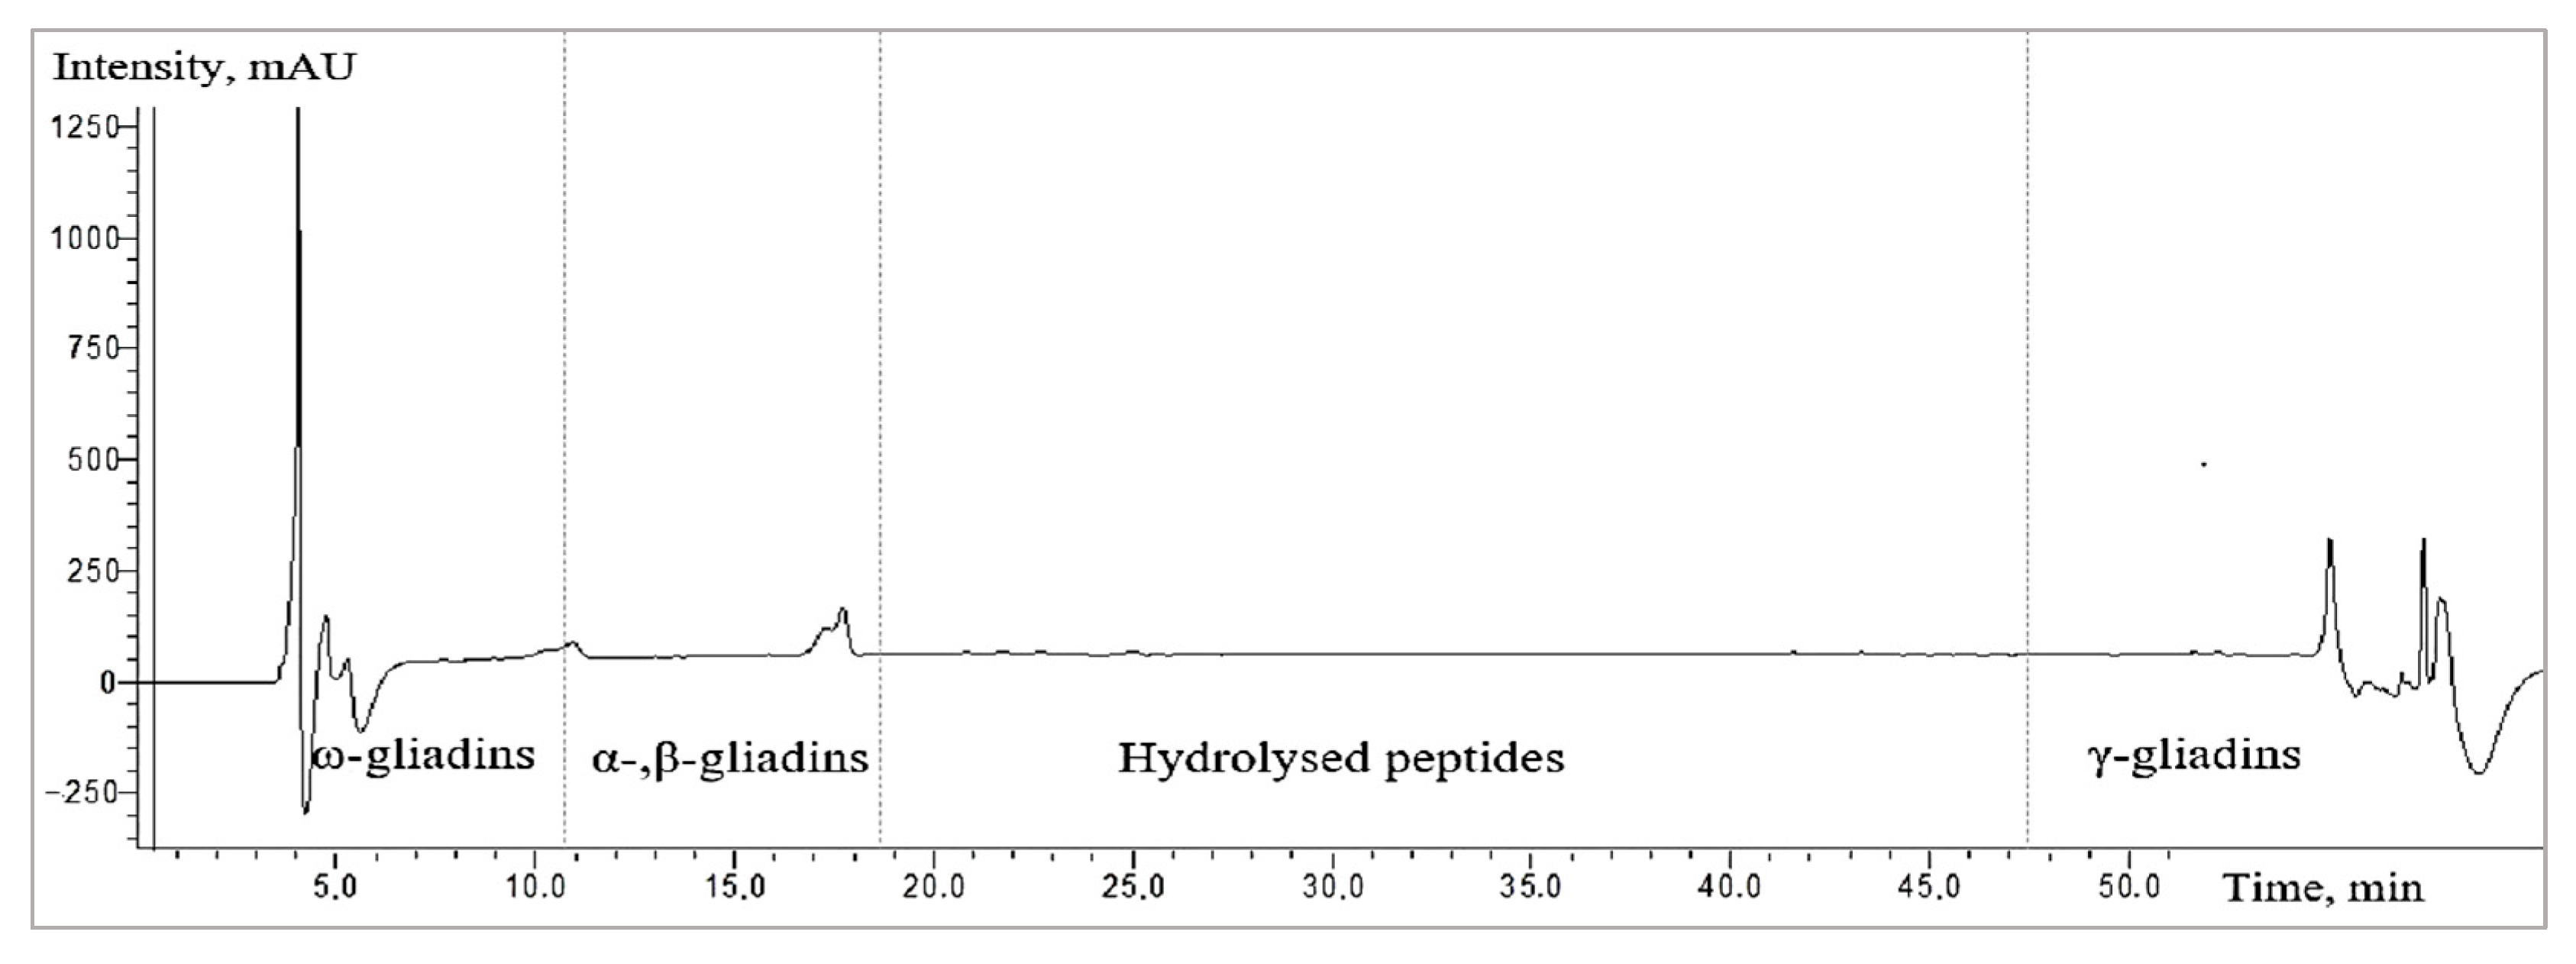
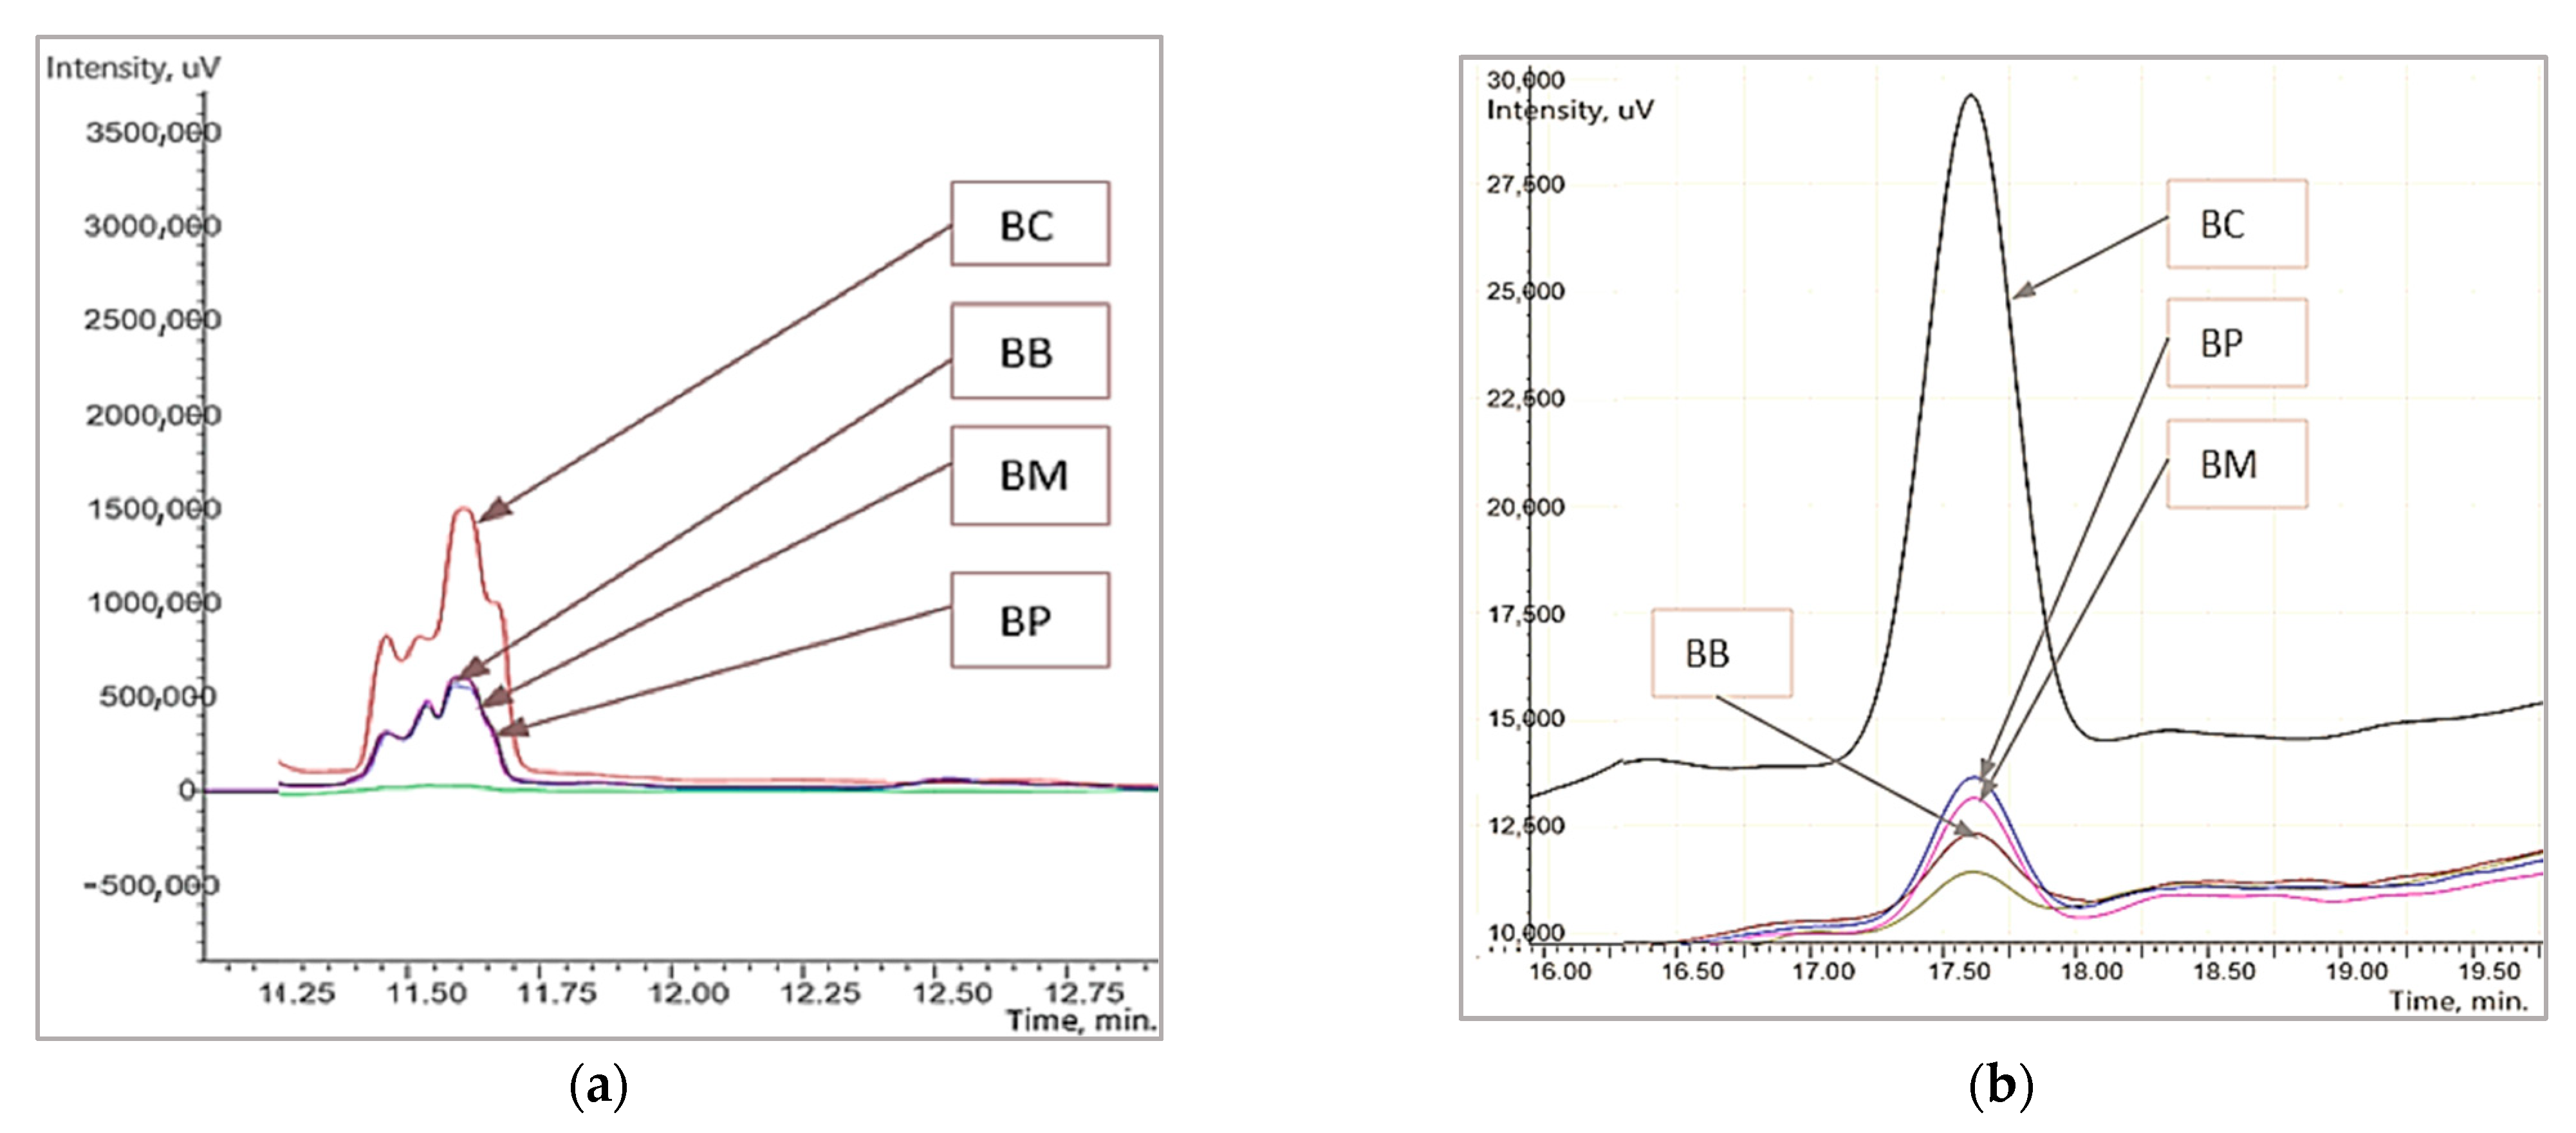
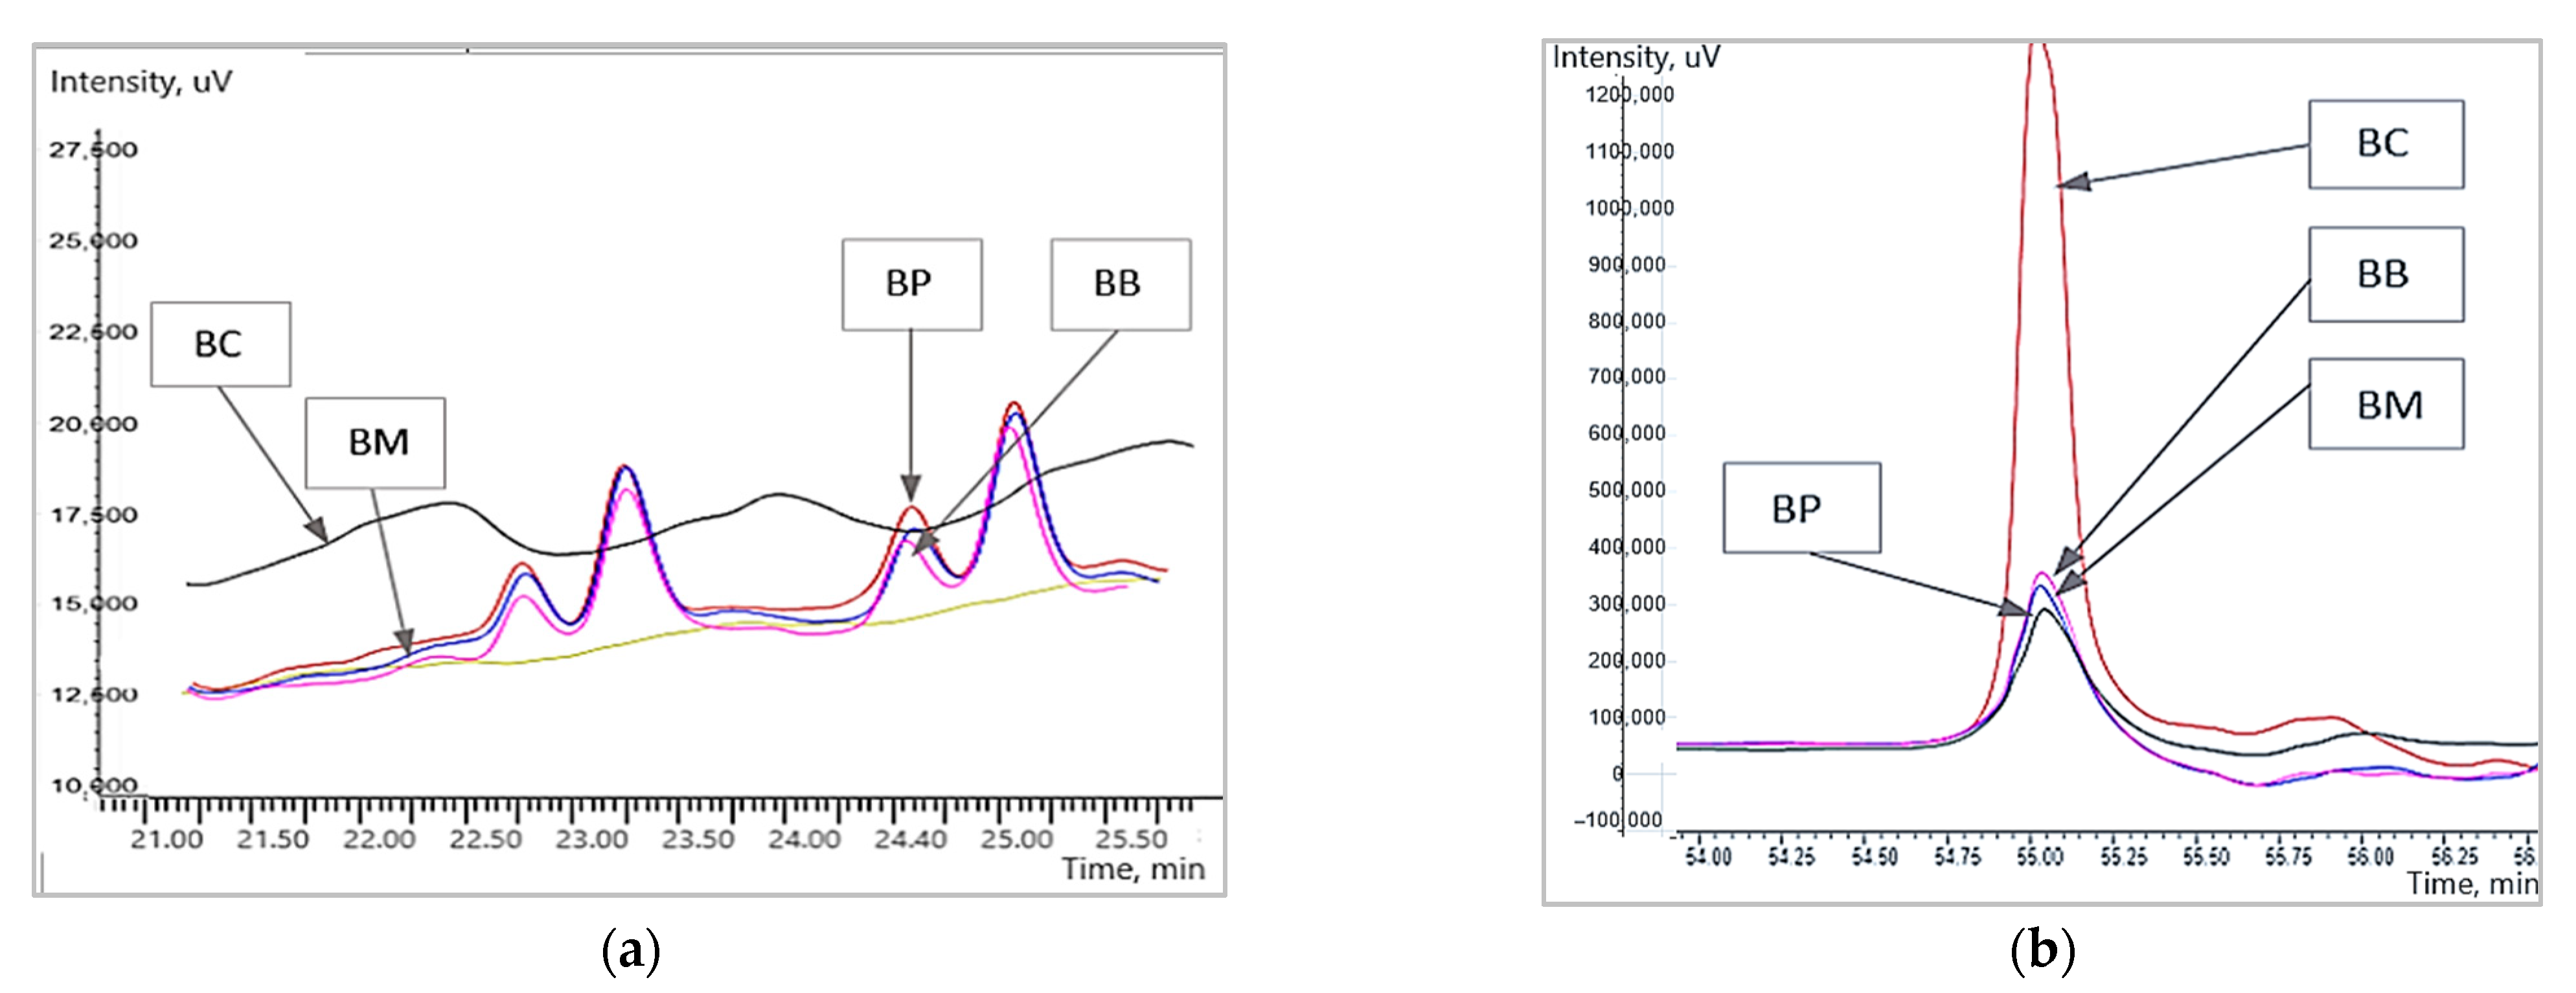
2.3.4. Liquid Chromatography (HPLC) Analysis

Aliquots of 1 mL of the 70/30 (v/v) ethanol aqueous solution extracts of the samples were mixed with 0.05% (v/v) trifluoroacetic acid (TFA) and centrifuged at 10.000× g for 10 min. The supernatant was filtered through a 0.45 μm filter (Millipore Ltd., Cork, Ireland) and used for analysis with a SHIMADZU LC 2040-C 3D Nexera-i Plus chromatograph (Shimadzu Corp., Kyoto, Japan), equipped with a UV DAD detector, operating at 210 nm using a reverse-phase Inertsil WP300-C18 (wide pore size of 300 Å) 5 µm analytical column 4.0 × 150 mm; GL Sciences, Tokyo, Japan). A gradient of acetonitrile in water with 0.1% (v/v) TFA (from 5 to 85% over 60 min), a flow rate of 0.4 mL/min at 45 °C was used. The injection volume was 10 µL. The chromatographic conditions were optimised and maintained constant throughout the experiment.

2.4. Statistical Analysis

IBM SPSS version 26 (SPSS Inc., IBM, Chicago, IL, USA) was used for statistical analyses. All experiments were performed three times and measurements were repeated twice, analysis of variance ANOVA was performed, the significance level of the factor was determined by Fisher’s (F) test at 95% confidence level, and Pearson’s correlation coefficient was calculated to estimate the correlation between fermentation temperature, duration, matrix pH, and gluten content reduction in wheat bran. Statistical significance was set at p < 0.05.

3. Results

Wheat bran fraction had 13.43 ± 0.62% moisture content and 13.88% total protein content. After performing the total plate count of microorganisms in samples 2.1 × 10² CFU/g yeast count, and 1.2 × 101 CFU/g of mould were found. The small amounts of microorganisms allowed the use of samples for analysis without sterilisation because the heat treatment of bran makes them resistant to enzymatic decomposition. An initial gluten concentration of 58650.00 ± 2204.00 mg/kg was detected in the wheat bran fraction by competitive ELISA R5.

3.1. The Influence of Hydrolysis Conditions on the Degradation of Gluten in Wheat Bran

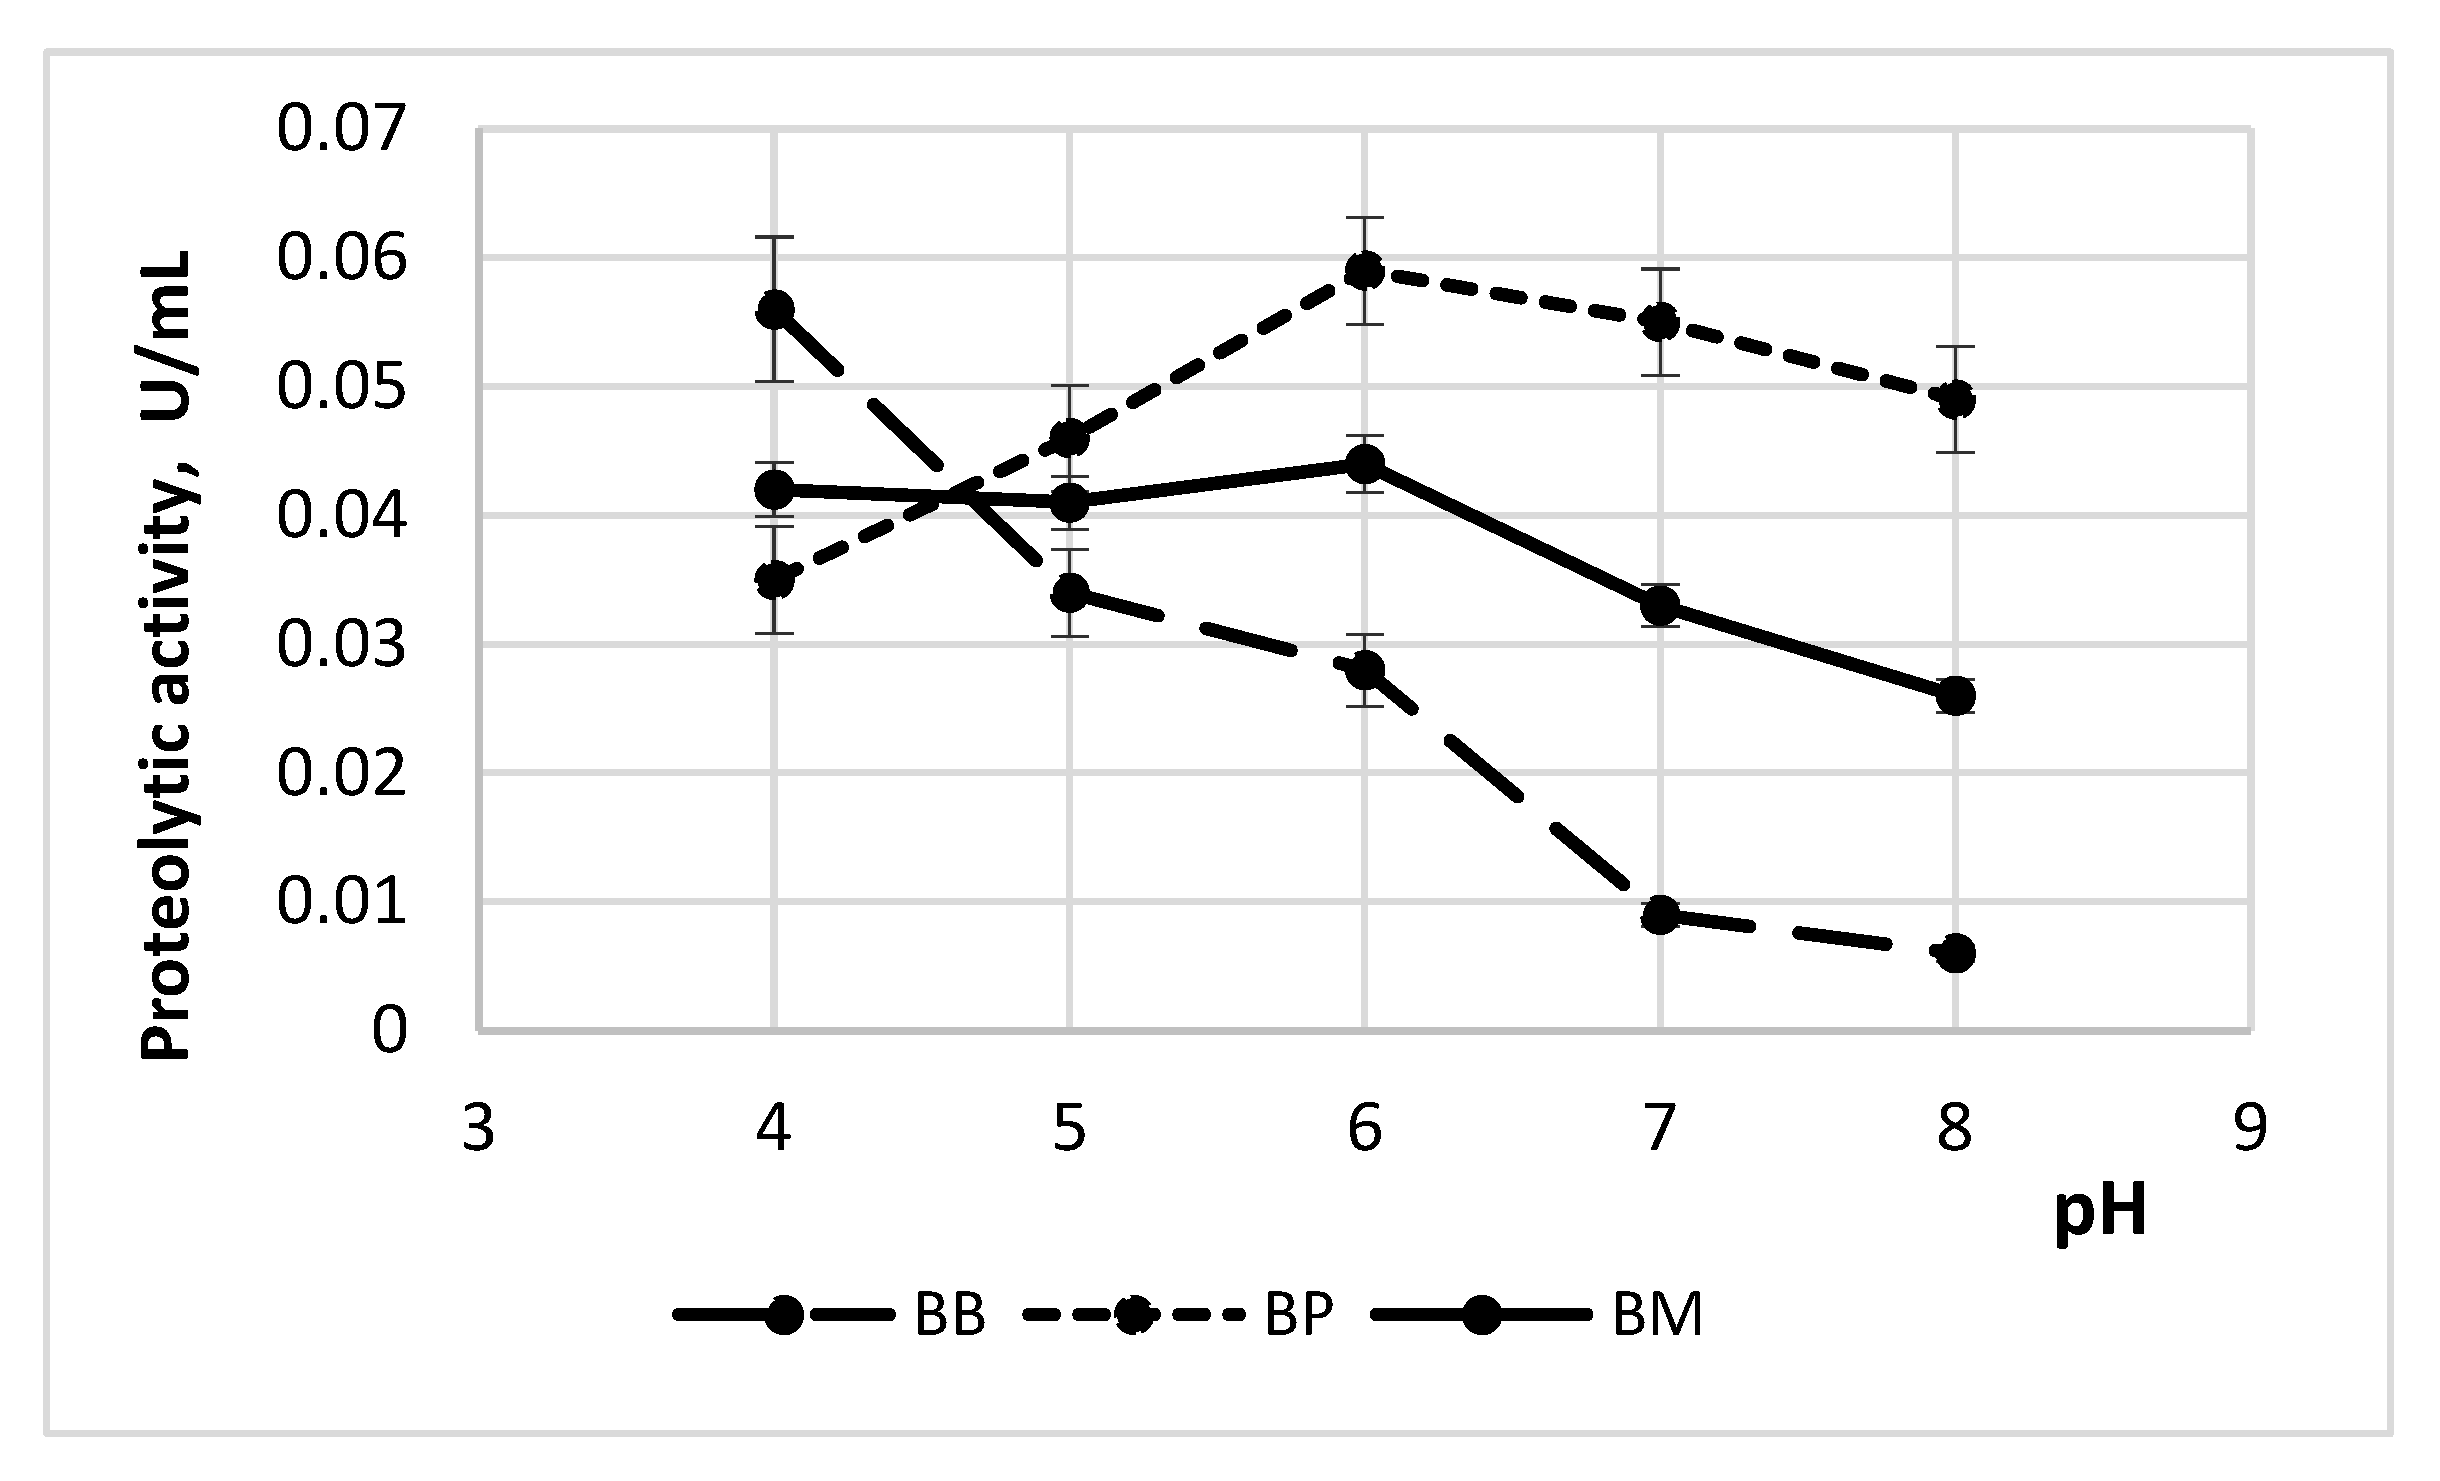
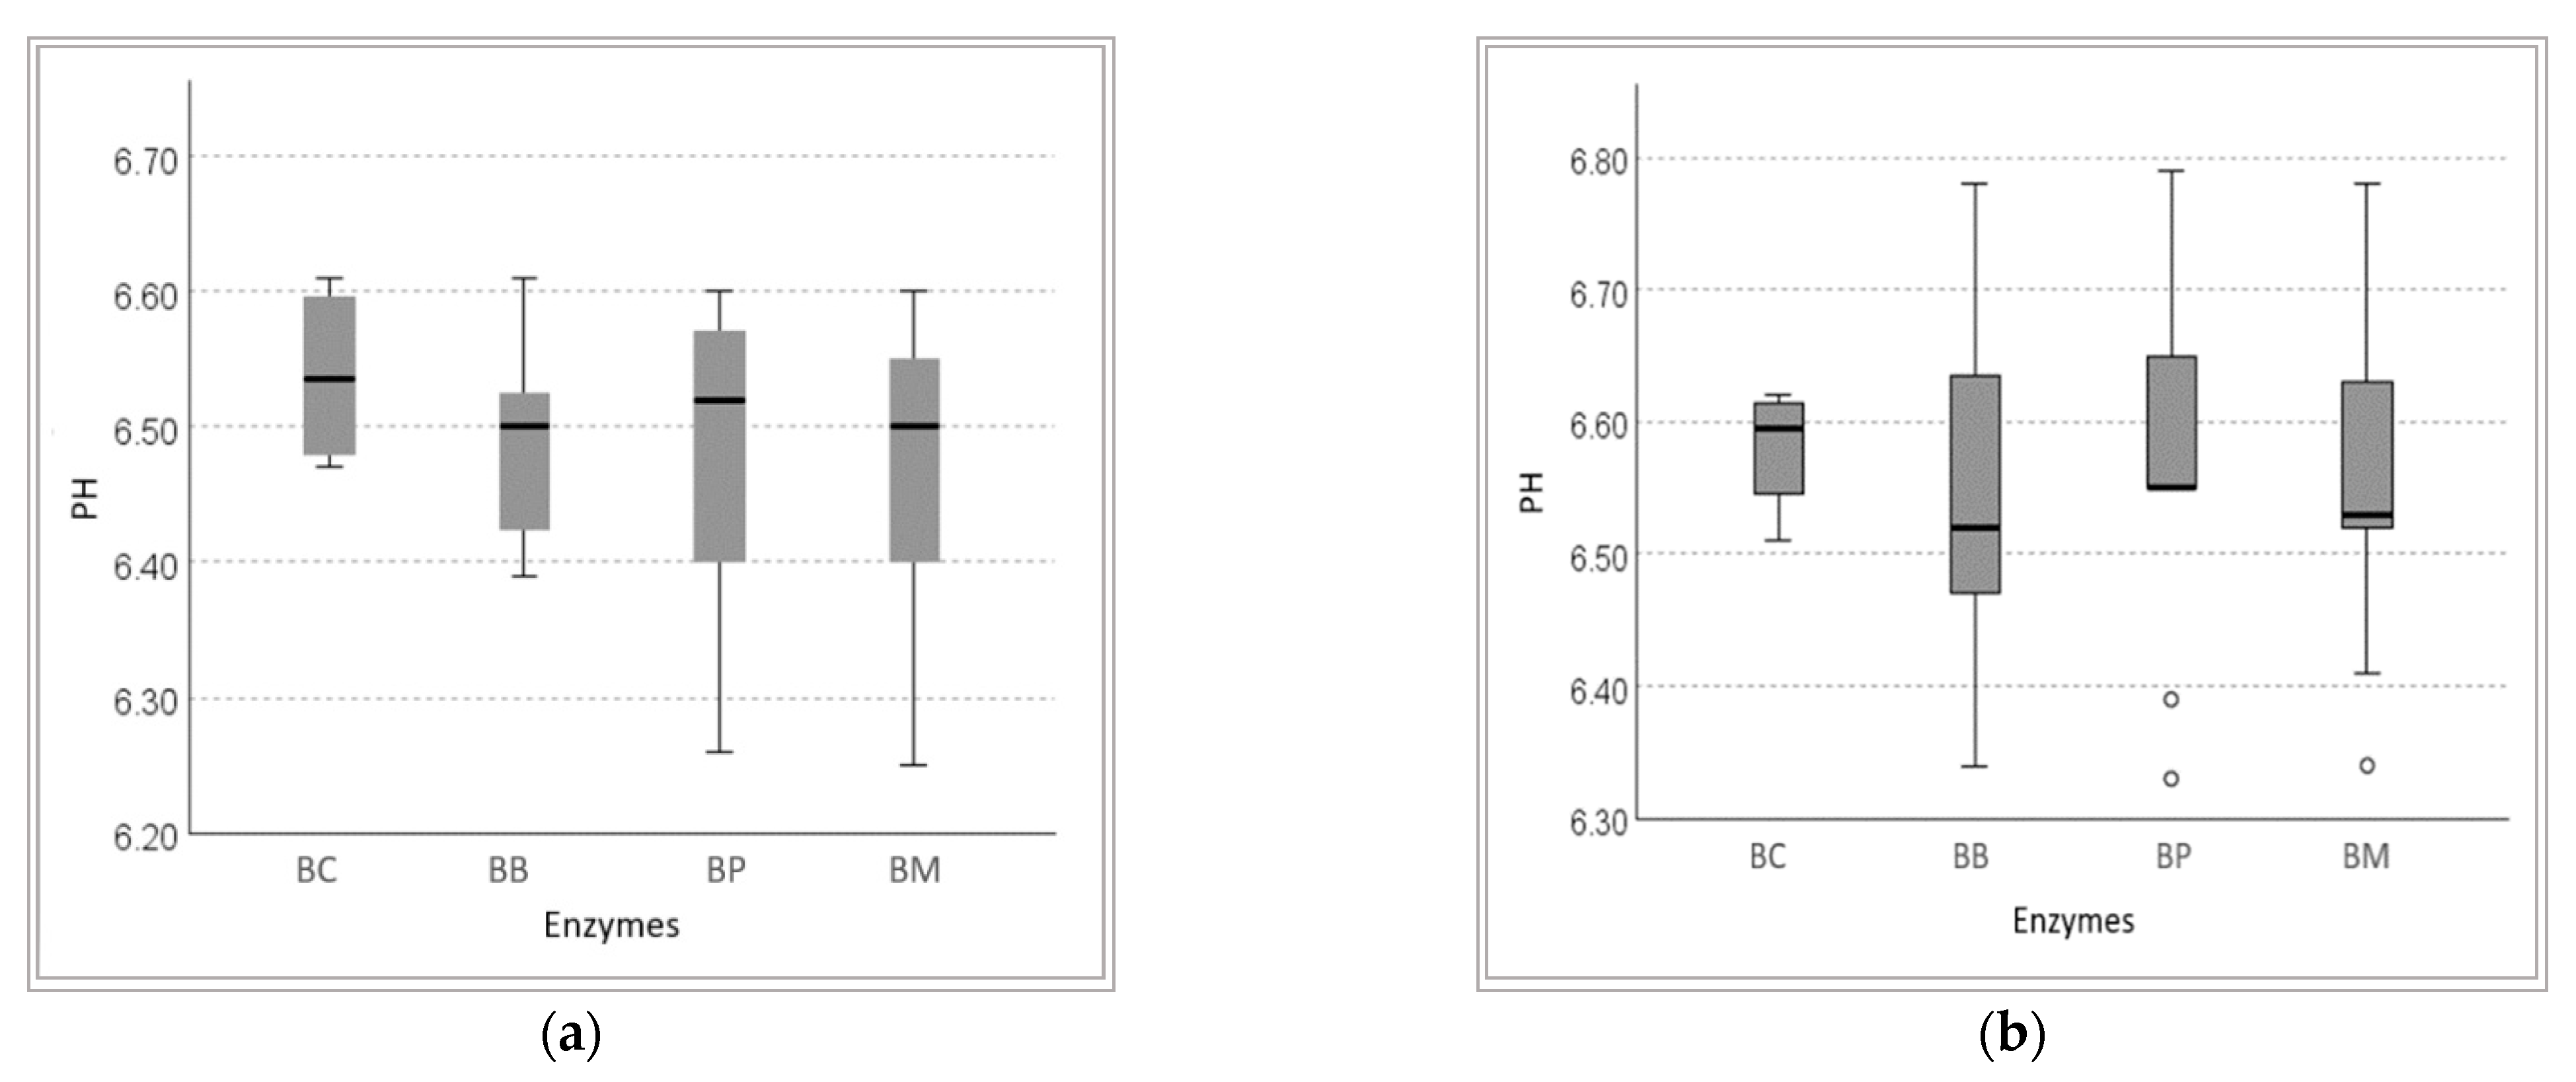
3.1.1. Enzyme Activity Depending on pH

Bromelain was found to have the strongest effect at pH 4 (Figure 1); as the pH increased, its activity decreased. The proteolytic activity of papain was less affected by the acidity of the substrate, it was the highest at pH 6–7), furthermore, the proteolytic activity of the combination of these enzymes was similar over a wider pH range (at pH 4–6.5).
Because the initial acidity of wheat bran samples with aqueous suspensions of plant enzymes is close to pH 6.5, enzymatic hydrolysis was performed without the addition of buffers to monitor pH changes during the process, aiming for its potential application in the production.
The data showed that the hydrolysis conditions of wheat bran had a significant effect on the soluble protein and gluten content. Statistical analysis revealed statistically significant differences between the pH values of the substrates, depending on the enzyme used (p < 0.05). During the hydrolysis of wheat bran at higher temperatures, a smaller pH difference was observed between the control sample and hydrolysates. As the treatment time increased, the pH increased slightly.
These differences are also illustrated by the results of the Kruskal–Wallis test (Figure 2), which shows the differences between the samples and their means. The test graphs show that after both 2 h (a) and 4 h (b) of enzymatic hydrolysis, the lowest pH occurred in the samples with bromelain and with the combination of both enzymes.

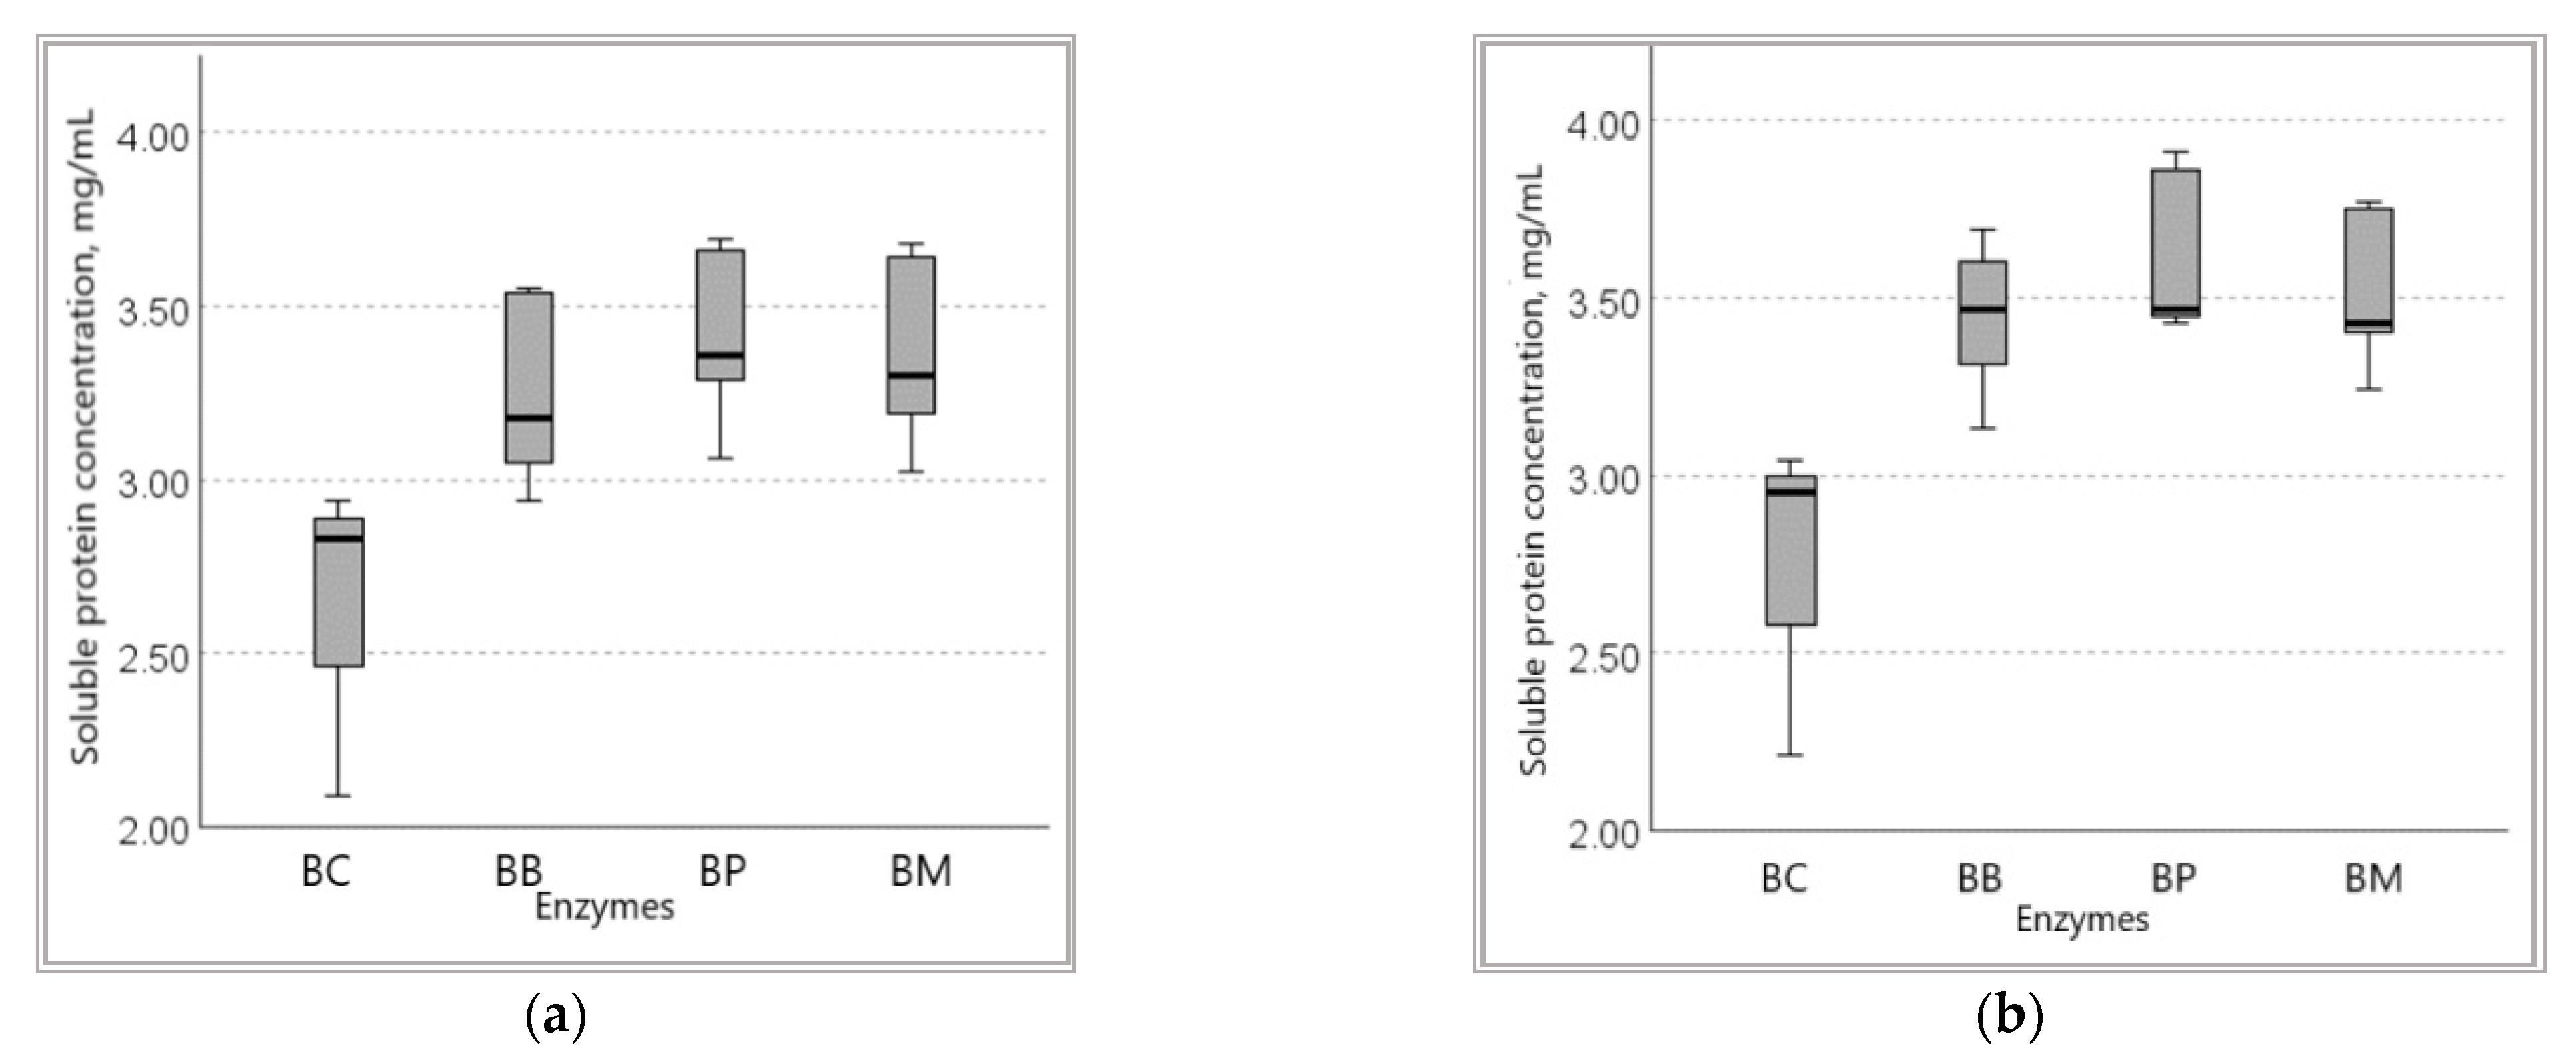
3.1.2. Soluble Protein Content in Wheat Bran Hydrolysates

Spectrophotometric evaluation of soluble protein content (SPC) in wheat bran substrates also showed significant differences (p < 0.05) compared to the control sample. After 2 h and 4 h of hydrolysis, the highest soluble protein content was found in the samples with papain (3.06–3.91 mg/mL, depending on enzyme concentration, temperature, and duration) (Figure 3). In contrast, samples with bromelain had a lower SPC (2.94–3.60 mg/mL), and the combination of the two enzymes had a medium SPC (3.02–3.77 mg/mL).

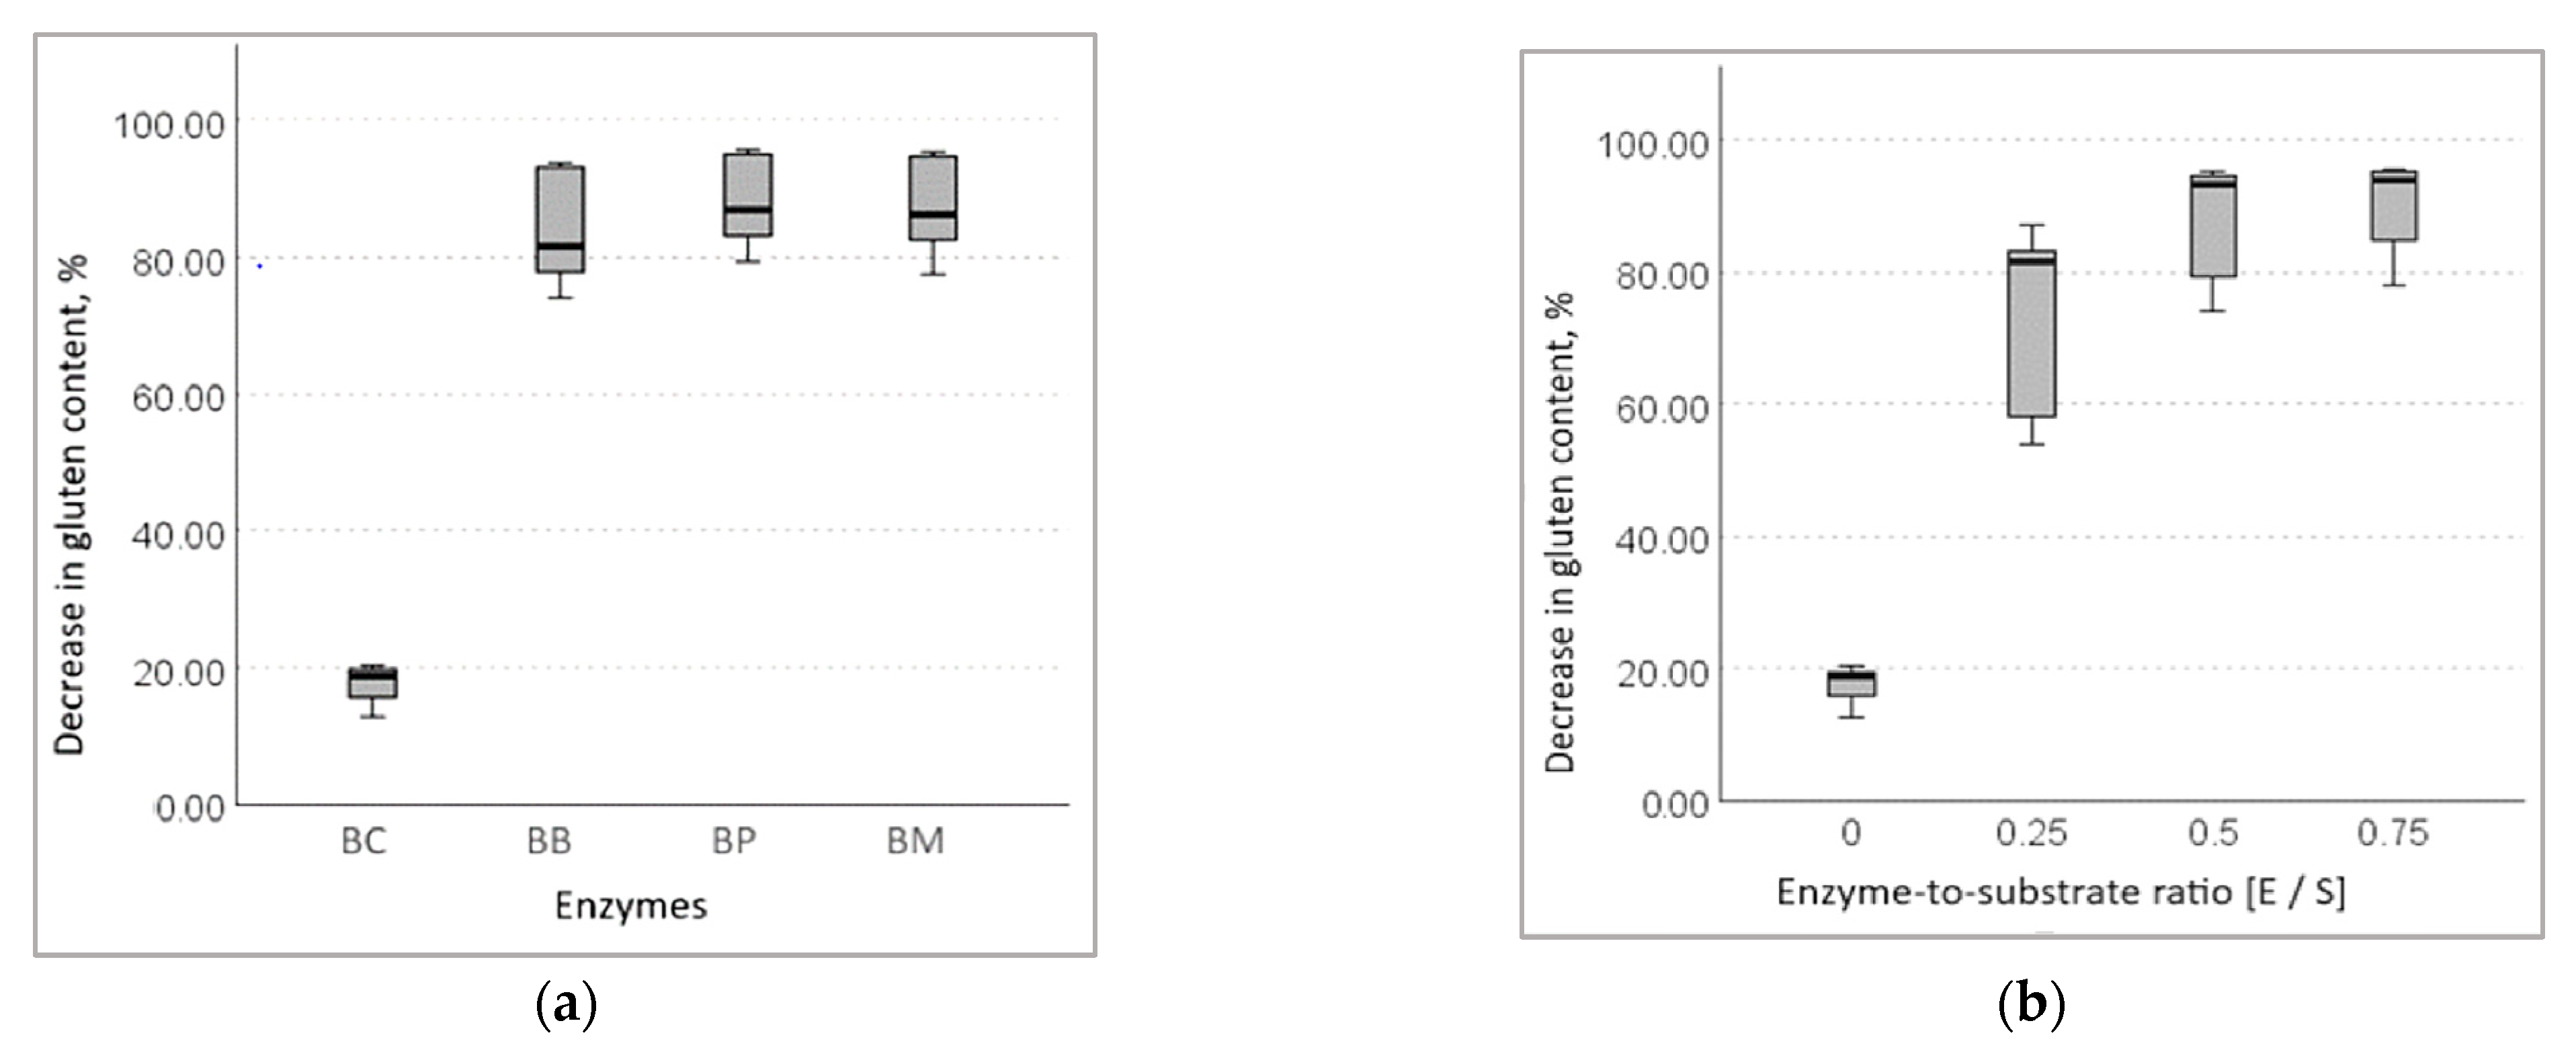
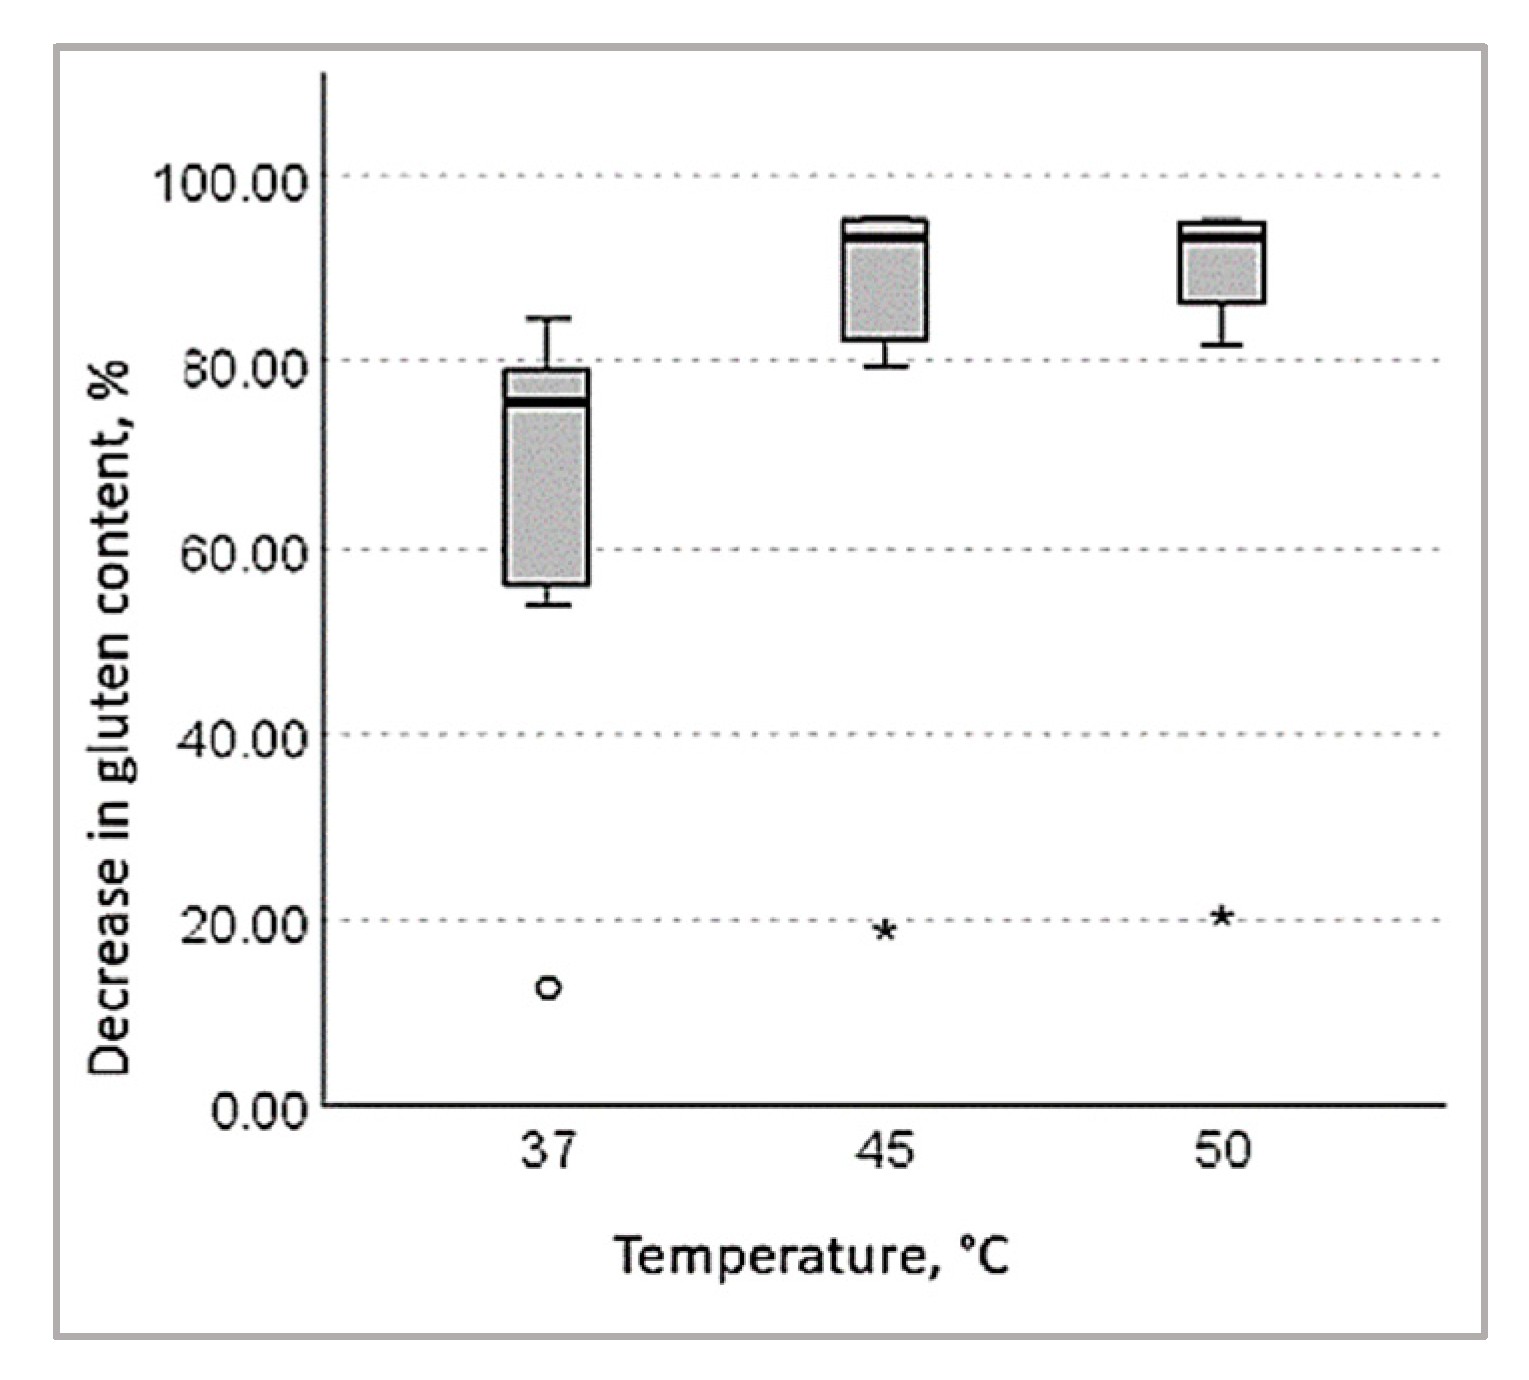
3.1.3. Decrease in Gluten Content in Wheat Bran Hydrolysates

The residual immunochemical reactivity of cleaved prolamins after 2 and 4 h of proteolysis detected by the R5 antibody showed that both enzymes have gluten degrading properties (Table 1). The treatment with papain reduced the levels of gluten content in bran from initial 58,650.00 to 2588.20 mg/kg, bromelain—to 3544.50 mg/kg in the best case (with a 0.75 E/S ratio and a temperature of 45 °C, within 4 h). The gluten content of the substrates after 2 and 4 h of enzymatic treatment showed a significant decrease in the percentage of gluten in wheat bran compared to the control sample. Figure 4 shows the dependence of gluten hydrolysis on enzyme (a) and enzyme/substrate ratio (b) for all bran substrates.
The data showed that papain was the most active in degrading gluten and that higher enzyme concentrations resulted in a higher hydrolysis effect. The small proportion of hydrolysed gliadins found in the control sample showed that incubation of the bran for up to 4 h activated the endogenous enzymes.
Fisher’s exact test showed that enzyme concentration had the greatest effect on gluten reduction (F = 45.89, p < 0.01). It also had the greatest effect on soluble protein content (F = 8.97, p < 0.05). The second most important factor, the choice of enzyme, had a significant effect on the decrease in gluten concentration (F = 15.60, p < 0.05) and the increase in soluble protein concentration (F = 7.42, p < 0.05). A weak relationship was found between the temperature of enzymatic hydrolysis and the percentage decrease in gluten (F = 2.08, p < 0.5), on the other hand, the effect of temperature has strong correlations with the pH of fermented media (F = 20.73, p < 0.05) and the amount of soluble proteins (F = 8.27, p < 0.05). A significant relationship was observed between the active acidity formed during enzymatic hydrolysis and the amount of soluble protein (F = 7.26, p < 0.05), and a decrease in gluten (F = 7.25, p < 0.05). Pearson’s correlation analysis showed a moderate negative correlation between the pH of the medium and the percentage of hydrolysed gluten (r = −0.45, p < 0.05), which means that a lower pH resulted in a higher efficiency of gluten hydrolysis.
Pearson’s correlation coefficient also confirmed a strong statistically significant relationship (r = 0.75, p < 0.05) between enzyme/substrate ratio and gluten hydrolysis level, and a moderate relationship (r = 0.43, p < 0.05) between temperature and gluten depletion. When the effect of temperature was considered, it was found that the efficiency of gluten hydrolysis was significantly lower at 37 °C for all wheat bran samples, but there was no significant difference between the results at 45 and 50 °C (Figure 5). Analysis of the effect of temperature on the activity of the individual enzymes showed that higher temperatures had a greater effect (r = 0.71, p < 0.05) on bromelain activity and a slightly lower effect (r = 0.68, p < 0.05) on papain activity.
A statistical model, linear regression, was constructed using multifactorial ANOVA. The linear relationship between the degree of hydrolysis, expressed as a percentage of gluten reduction, and the controlled parameters of enzymatic hydrolysis (enzyme/substrate ratio, temperature, and duration) can be written in the form of equations:
(a).
when treated with bromelain:
HD = −14.3295 + 32.6292 × C + 1.6454 × T + 1.9619 × t
(b).
when treated with papain:
HD = −1.786 + 30.782 × C + 1.450 × T + 2.146 × t
(c).
when treated with a combination of bromelain and papain:
HD = −8.0312 + 31.8085 × C + 1.5585 × T + 2.1355 × t
where HD is the degree of gluten hydrolysis, expressed as a percentage of the reduction in gluten; C is the enzyme concentration (%); T is the duration (h); and t is the temperature (°C).
Linear regression equations were developed with the weighting coefficients for enzyme concentration and temperature set at p < 0.001 in all cases, and the weighting coefficient for the effect of enzyme hydrolysis time at p < 0.1. The linear regression equations also showed that enzyme concentration had the greatest influence on hydrolysis efficiency, whereas reaction temperature and time had less influence.

3.2. The Changes in the Fractions of Wheat Gliadins Detected by Liquid Chromatography

Changes in the immunoreactive fractions of wheat gliadins were analysed using liquid chromatography. Gliadin fractions were prepared from wheat bran control samples and samples treated with enzymes at 45 °C for 4 h. Ninety-one peaks were identified in the chromatogram of the wheat bran sample treated with papain, the highest of which are visible in the chromatogram (Figure 6).
Proteins that were not retained by the column eluted first (up to 5 min), followed by the fractions of wheat gliadins in the order of hydrophobicity: ω-gliadins, mixed α, β-gliadin fraction, and γ-gliadins. Hydrolysed peptides eluted between 17 and 48 min with the highest fraction observed at 20–26 min. Significant differences were observed between the chromatograms of the gliadin fractions of the wheat bran control and those treated with different enzymes. For a more detailed analysis of the peak intensities, chromatograms were analysed in “overlay mode”. First, when comparing the chromatograms of the wheat bran control sample and enzymatically digested gliadins, a difference was observed between the ω-gliadins eluted between 11 and 12 min (Figure 7a). The peak areas of the control bran sample (BC) were 2–2.5 times higher than those of the enzyme-treated samples, suggesting that the control sample had a much higher concentration of ω-gliadins than the enzyme-treated wheat bran gliadin fractions. The wheat starch sample was also omitted for comparison because it had very low protein content, resulting in very small peak areas.
α-Gliadins have the highest immunoreactivity; therefore, their changes are most relevant. The highest peak at 17.5 min is shown in Figure 7b. HPLC results showed that α-gliadin content decreased significantly after enzymatic hydrolysis. Comparing the peak areas of the gliadin peaks between the control bran sample and the samples treated with different enzymes, it can be stated that the proteolytic effect of the plant enzymes was different, with the α-gliadins being better degraded by bromelain, as a slightly lower peak of α-gliadins was observed in the bran substrate with bromelain.
The chromatograms show that peaks of gliadin degradation products were detected throughout most of the digestion but were more intense up to 50 min. In this case, the peaks were higher in the chromatograms of the samples treated with the plant enzymes, whereas in the control sample, they were either not detected or significantly smaller peak areas were detected (Figure 8a).
The relative decrease in γ-gliadin peak area, which shows how the concentrations of the various gliadin fractions changed after enzymatic hydrolysis with bromelain, papain, and their mixture at 45 °C are shown in Figure 8b. Here, again, a higher efficacy of papain than that of bromelain or the enzyme combination was observed.

4. Discussion

The relatively high gluten content found in wheat bran (58,650.00 mg/kg) is similar to that reported by other authors [28], which states that the average gluten content of commercially available bran is 50,000.00 mg/kg but can be as high as 10,7285 mg/kg in individual samples. In contrast, gluten-free products may only contain up to 20 mg/kg [29]; therefore, sufficiently active proteases are required to hydrolyse this level of gluten.
Several authors [16] agree that plant proteases are among the most suitable for this purpose. Bromelain and papain are the most widely known commercially available fruit-derived proteases that are safely used in the baking industry [30] and can be used in protein hydrolysis. However, it is necessary to carefully manage the hydrolysis process to achieve the desired effects. Hydrolysis parameters such as pH, temperature, and enzyme-to-substrate ratio can greatly influence the efficiency of enzymatic hydrolysis [22]; therefore, these parameters were investigated in this study.
Although the manufacturers recommend pH 4–6 for bromelain and pH 4–10 for papain, we found that bromelain activity was highest at pH 4–5 and papain at pH 6–7. However, both were quite active at pH 6.5, which is the pH that naturally occurs when wheat bran samples are diluted with aqueous enzyme solutions. The temperature range for the enzyme efficiency tests was selected based on the manufacturer’s recommendations and results of previous studies. The recommended temperature by the manufacturer is 35–65 °C for bromelain and 25–70 °C for papain. We have found that the most suitable temperature is 45 °C or slightly above for both enzymes. These results are very similar to previous studies: Liu et al. [31] and Li et al. [22] obtained the optimal temperature for papain treatment at 48 °C, a similar temperature of 37 °C [21], 40 °C [32], or 50 °C [33] as the right temperature has been established for bromelain in previous studies.
The soluble protein content (SPC) of the substrates shows which part of the gluten macropolymers has been depolymerised [34]; thus, it is one way to evaluate the efficiency of enzymatic hydrolysis. This was confirmed by the strong linear correlation (r = 0.82, p < 0.05) found in our study between the concentration of soluble proteins and the percentage of gluten reduction determined by the ELISA R5. The highest soluble protein content found in the samples with papain (3.06–3.91 mg/mL) confirmed the higher activity of papain in gluten hydrolysis.
In this study, the most pronounced reduction in gluten content of 95.59% was found after 4 h of treatment with papain at 45 °C at an enzyme-substrate ratio [E/S] of 0.75%. A maximum bromelain efficiency of 93.96% was achieved under the same conditions, is slightly lower, and the combination of both enzymes showed an average reduction in gluten content with the best result of 95.25%. The hydrolysis efficiency of plant enzymes obtained in our research are higher than those of the study by Buddrick et al. [35], where papain was used for reduction of toxic gliadin content in wheat flour and found 70.1% decrease in gluten after 5 h treatment. However, a lower hydrolysis efficiency was achieved than of Li et al., where even with a lower enzyme-substrate ratio [E/S] (0.1–0.4%) and reaction time of 60–90 min, a very high reduction in gliadin content (up to 99.99%) was achieved in wheat flour for papain [22] and bromelain [23]. However, bromelain is used in medical therapy; it is relatively inexpensive and safe for long-term use [36,37].
HPLC chromatograms showed that bromelain was more active in degrading α-gliadins and papain was more active in degrading γ-gliadins, and they had very similar effects in hydrolysing ω-gliadins. This demonstrated the specificity of these plant enzymes. Both papain and bromelain belong to the cysteine protease family; however, their enzymatic hydrolysis mechanism is specific, and they cleave different protein bonds [29]. Therefore, the combination of these two enzymes was expected to be more active than either enzyme alone. However, the results of this study did not confirm the expected synergistic effect because the hydrolysis capacity of both enzymes was moderate. Similar results have also been reported by other authors. Cornell, Doherty, and Stelmasiak [38] also investigated the synergistic effect of papain with other enzymes in the hydrolysis of gluten and found that it increased in the case of the interaction with porcine gastrointestinal enzymes but decreased slightly when papain was used in combination with bromelain.
Thus, this study confirmed the high gluten-hydrolysing capacity of papain and bromelain using wheat bran as a substrate; however, these enzymes are not active enough to remove gluten residues from wheat bran. The treatment of bran with plant enzymes can be used for the production of wheat products with reduced gluten content, but not for products for gluten-free diets.

5. Conclusions

It can be concluded that the plant-derived enzymes bromelain and papain are appropriate for gluten hydrolysis in wheat bran. The results of the immunological analysis were complementary to those of the chromatographic analysis and confirmed the high efficiency of the proteolysis. Papain had a higher hydrolytic activity than bromelain under similar conditions, and the combination of both enzymes had intermediate efficiency. Although a significant decrease in the immunoreactive gliadin fractions by 95.59% was observed after enzymatic hydrolysis of wheat bran, the potential allergenicity of gliadins was not eliminated. The minimum level of gluten in wheat bran achieved (2588.20–3544.50 mg/kg) is above the permissible gluten-free limit. Thus, for the use of wheat bran hydrolysed in this way for the enrichment of wheat products for gluten-sensitive people, the hydrolysis time should be extended, or a combined approach with other gluten-degrading tools should be used, such as lactic acid fermentation or germination.

Author Contributions

Conceptualization, V.B. and L.V.-F.; methodology, V.B.; software, A.B.; validation, R.D. and M.A.T.; investigation, V.B. and D.C.; data curation, R.D.; writing—original draft preparation, V.B.; writing—review and editing, M.A.T. and J.P.M.L.; visualization, V.B. and A.B; supervision, L.V.-F. All authors have read and agreed to the published version of the manuscript.

Funding

This research received no external funding.

Informed Consent Statement

Not applicable.

Data Availability Statement

Not applicable.

Acknowledgments

The authors thank Roquette Amilina, AB, for wheat bran samples.

Conflicts of Interest

The authors declare no conflict of interest.

References

  1. Singh, P.; Arora, A.; Strand, T.A.; Leffler, D.A.; Catassi, C.; Green, P.H.; Kelly, C.P.; Ahuja, V.; Makharia, G.K. Global prevalence of celiac disease: Systematic review and meta-analysis. Clin. Gastroenterol. Hepatol. 2018, 16, 823–836. [Google Scholar] [CrossRef] [PubMed]
  2. King, J.A.; Jeong, J.; Underwood, F.E.; Quan, J.; Panaccione, N.; Windsor, J.W.; Ronksley, P.; Shaheen, A.M.; Quan, H.; Van, S.V. Incidence of celiac disease is increasing over time: A systematic review and meta-analysis. Am. J. Gastroenterol. 2020, 115, 507–525. [Google Scholar] [CrossRef]
  3. Hager, A.S.; Wolter, A.; Czerny, M.; Bez, J.; Zannini, E.; Arendt, E.K.; Czerny, M. Investigation of product quality, sensory profile and ultrastructure of breads made from a range of commercial gluten-free flours compared to their wheat counterparts. Eur. Food Res. Technol. 2012, 235, 333–344. [Google Scholar] [CrossRef]
  4. Pellegrini, N.; Agostoni, C. Nutritional aspects of gluten-free products. J. Sci. Food Agric. 2015, 95, 2380–2385. [Google Scholar] [CrossRef] [PubMed]
  5. Hopkins, S.; Soon, J.M. Nutritional quality, cost and availability of gluten-free food in England. Br. Food J. 2019, 121, 2867–2882. [Google Scholar] [CrossRef]
  6. Losurdo, G.; Principi, M.; Iannone, A.; Ierardi, E.; Di Leo, A. The interaction between celiac disease and intestinal microbiota. J. Clin. Gastroenterol. 2016, 50, S145–S147. [Google Scholar] [CrossRef]
  7. Bascunan, K.A.; Vespa, M.C.; Araya, M. Celiac disease: Understanding the gluten-free diet. Eur. J. Nutr. 2017, 56, 449–459. [Google Scholar] [CrossRef]
  8. Scherf, K.A.; Wieser, H.; Koehler, P. Novel approaches for enzymatic gluten degradation to create high-quality gluten-free products. Food Res. Int. 2018, 110, 62–72. [Google Scholar] [CrossRef]
  9. Giménez, M.J.; Sánchez-León, S.; Barro, F.; García-Molina, M.D. Gluten free wheat: Are we there? Nutrients 2019, 11, 487. [Google Scholar] [CrossRef]
  10. Cabanillas, B. Gluten-related disorders: Celiac disease, wheat allergy, and nonceliac gluten sensitivity. Crit. Rev. Food Sci. Nutr. 2020, 60, 2606–2621. [Google Scholar] [CrossRef]
  11. Bromilow, S.; Gethings, L.A.; Buckley, M.; Bromley, M.; Shewry, P.R.; Langridge, J.I.; Mills, E.C. A curated gluten protein sequence database to support development of proteomics methods for determination of gluten in gluten-free foods. J. Proteom. 2017, 163, 67–75. [Google Scholar] [CrossRef] [PubMed]
  12. Bradauskiene, V.; Vaiciulyte-Funk, L.; Shah, B.R.; Cernauskas, D.; Tita, M.A. Recent advances in biotechnological methods for wheat gluten immunotoxicity abolishment—A review. Pol. J. Food Nutr. Sci. 2021, 71, 5–20. [Google Scholar] [CrossRef]
  13. Curiel, J.A.; Coda, R.; Limitone, A.; Katina, K.; Raulio, M.; Giuliani, G.; Rizzello, C.G.; Gobbetti, M. Manufacture and characterization of pasta made with wheat flour rendered gluten-free using fungal proteases and selected sourdough lactic acid bacteria. J. Cereal Sci. 2014, 59, 79–87. [Google Scholar] [CrossRef]
  14. Giuliani, G.; Benedusi, A.; Di Cagno, R.; Rizzello, C.G.; De Angelis, M.; Gobbetti, M.; Cassone, A. Process of Microbic Biotechnology for Completely Degrading Gluten in Flours. U.S. Patent No. 9,386,777, 12 July 2016. [Google Scholar]
  15. Engström, N.; Sandberg, A.S.; Scheers, N. Sourdough fermentation of wheat flour does not prevent the interaction of transglutaminase 2 with α2-gliadin or gluten. Nutrients 2015, 7, 2134–2144. [Google Scholar] [CrossRef]
  16. Jayawardana, I.A.; Montoya, C.A.; McNabb, W.C.; Boland, M.J. Possibility of minimizing gluten intolerance by co-consumption of some fruits—A case for positive food synergy? Trends Food Sci. Technol. 2019, 94, 91–97. [Google Scholar] [CrossRef]
  17. Walter, T.; Wieser, H.; Koehler, P. Production of gluten-free wheat starch by peptidase treatment. J. Cereal Sci. 2014, 60, 202–209. [Google Scholar] [CrossRef]
  18. Bassi, N.D. Gluten-Free Starch and Methods of Producing the Same. U.S. Patent Application No. 039,541, 27 June 2016. [Google Scholar]
  19. Hemdane, S.; Jacobs, P.J.; Dornez, E.; Verspreet, J.; Delcour, J.A.; Courtin, C.M. Wheat (Triticum aestivum L.) bran in bread making: A critical review. Compr. Rev. Food Sci. Food Saf. 2016, 15, 28–42. [Google Scholar] [CrossRef]
  20. Sun, Q.; Zhang, B.; Yan, Q.J.; Jiang, Z.Q. Comparative analysis on the distribution of protease activities among fruits and vegetable resources. Food Chem. 2016, 213, 708–713. [Google Scholar] [CrossRef]
  21. Watanabe, M.; Watanabe, J.; Sonoyama, K.; Tanabe, S. Novel method for producing hypoallergenic wheat flour by enzymatic fragmentation of the constituent allergens and its application to food processing. Biosci. Biotechnol. Biochem. 2000, 64, 2663–2667. [Google Scholar] [CrossRef]
  22. Li, Y.; Yu, J.; Goktepe, I.; Ahmedna, M. The potential of papain and alcalase enzymes and process optimizations to reduce allergenic gliadins in wheat flour. Food Chem. 2016, 196, 1338–1345. [Google Scholar] [CrossRef] [Green Version]
  23. Li, Y.; Zhou, J.; Wang, W.; Wang, J. Bromelain treatment of wheat flour to reduce the allergenicity. J. Chin. Cereals Oils Assoc. 2016, 31, 56–60. [Google Scholar]
  24. Pahlavan, A.; Sharma, G.M.; Pereira, M.; Williams, K.M. Effects of grain species and cultivar, thermal processing, and enzymatic hydrolysis on gluten quantitation. Food Chem. 2016, 208, 264–271. [Google Scholar] [CrossRef]
  25. Dhaka, V.; Khatkar, B.S. Microstructural, thermal and IR spectroscopy characterisation of wheat gluten and its sub fractions. J. Food Sci. Technol. 2016, 53, 3356–3363. [Google Scholar] [CrossRef] [PubMed]
  26. Layne, E. Spectrophotometric and turbidimetric methods for measuring proteins. Meth. Enzymol. 1957, 3, 447–454. [Google Scholar]
  27. Cupp-Enyard, C. Sigma’s non-specific protease activity assay-casein as a substrate. J. Vis. Exp. 2008, 19, 899. [Google Scholar] [CrossRef]
  28. Walter, T.; Wieser, H.; Koehler, P. Degradation of gluten in wheat bran and bread drink by means of a proline-specific peptidase. J. Nutr. Food Sci. 2014, 4, 10–4172. [Google Scholar] [CrossRef]
  29. Standard 118–1979. Codex Standard for Foods for Special Dietary Use for Persons Intolerant to Gluten. Codex Alimentarius Commission, Revision 2015. Available online: http://www.codexalimentarius.net/download/standards/291/cxs_118e.pdf (accessed on 16 May 2021).
  30. Meshram, A.; Singhal, G.; Bhagyawant, S.S.; Srivastava, N. Plant-Derived Enzymes: A Treasure for Food Biotechnology. In Enzymes in Food Biotechnology; Kuddus, M., Ed.; Elsevier: Amsterdam, The Netherlands, 2019; pp. 483–502. [Google Scholar] [CrossRef]
  31. Liu, X.; Luo, Y.; Li, Z. Effects of pH, temperature, enzyme-to-substrate ratio and reaction time on the antigenicity of casein hydrolysates prepared by papain. Food Agric. Immunol. 2012, 23, 69–82. [Google Scholar] [CrossRef]
  32. Pang, W.C.; Ramli, A.N.M.; Hamid, A.A.A. Comparative modelling studies of fruit bromelain using molecular dynamics simulation. J. Mol. Model. 2020, 26, 142. [Google Scholar] [CrossRef]
  33. Wang, J.S.; Zhao, M.M.; Zhao, Q.Z.; Jiang, Y.M. Antioxidant properties of papain hydrolysates of wheat gluten in different oxidation systems. Food Chem. 2007, 101, 1658–1663. [Google Scholar] [CrossRef]
  34. Thiele, C.; Grassl, S.; Gänzle, M. Gluten hydrolysis and depolymerization during sourdough fermentation. J. Agric. Food Chem. 2004, 52, 1307–1314. [Google Scholar] [CrossRef]
  35. Buddrick, O.; Cornell, H.J.; Small, D.M. Reduction of toxic gliadin content of wholegrain bread by the enzyme caricain. Food Chem. 2015, 170, 343–347. [Google Scholar] [CrossRef] [PubMed]
  36. Ramli, A.N.M.; Aznan, T.N.T.; Illias, R.M. Bromelain: From production to commercialisation. J. Sci. Food Agric. 2017, 97, 1386–1395. [Google Scholar] [CrossRef] [PubMed]
  37. Fernández-Lucas, J.; Castañeda, D.; Hormigo, D. New trends for a classical enzyme: Papain, a biotechnological success story in the food industry. Trends Food Sci. Technol. 2017, 68, 91–101. [Google Scholar] [CrossRef]
  38. Cornell, H.J.; Doherty, W.; Stelmasiak, T. Papaya latex enzymes capable of detoxification of gliadin. Amino Acids 2010, 38, 155–165. [Google Scholar] [CrossRef] [PubMed]
Figure 1. Protease activity of plant enzymes at different pH (BB, bran treated with bromelain; BP, bran treated with papain; BM, bran treated with combination of bromelain and papain).
Processes 10 01948 g001
Figure 2. Changes in pH of all tested bran samples: (a) after 2 h; (b) and 4 h of hydrolysis with different enzymes (BC, control bran sample; BB, bran treated with bromelain; BP, bran treated with papain; BM, bran treated with a combination of bromelain and papain; the “°” marks indicate the median of pH for the bran control samples).
Processes 10 01948 g002
Figure 3. Changes in soluble proteins: (a) after 2 h; (b) and 4 h of hydrolysis with different enzymes for all bran samples tested (BC, control bran sample; BB, bran treated with bromelain; BP, bran treated with papain; BM, bran treated with a combination of bromelain and papain).
Processes 10 01948 g003
Figure 4. The dependence of decrease in gluten content: (a) on the enzyme; (b) on the enzyme/substrate ratio (BC, control bran sample; BB, bran treated with bromelain; BP, bran treated with papain; BM, bran treated with a combination of bromelain and papain).
Processes 10 01948 g004
Figure 5. Reduction of gluten content in wheat bran samples after hydrolysis at different temperatures (The “°” and “*”marks indicate the median of the decrease of gluten content values for the bran control samples. The * marks indicate that the difference between the median values of the control sample and the enzyme-treated samples is statistically significant (p < 0.05)).
Processes 10 01948 g005
Figure 6. HPLC chromatogram of gliadin fraction of wheat bran samples treated with bromelain 4 h at 45 °C.
Processes 10 01948 g006
Figure 7. Peak area of HPLC chromatogram of wheat bran samples gliadin extract after incubation of 4 h at 45 °C: (a) ω-gliadins; (b) α-gliadins (BC, control bran sample; BB, bran treated with bromelain; BP, bran treated with papain, BM, bran treated with a combination of bromelain and papain).
Processes 10 01948 g007
Figure 8. Peak area of HPLC chromatogram of wheat bran samples gliadin extract after incubation: (a) gliadin degradation products; (b) γ-gliadins (BC, control bran sample; BB, bran treated with bromelain; BP, bran treated with papain; BM, bran treated with a combination of bromelain and papain).
Processes 10 01948 g008
Table 1. PH, soluble protein, and gluten content in wheat bran substrates after 2–4 h enzymatic hydrolysis under different conditions.
SamplesE/S RatioTemperature, °CpHSoluble Protein
Content *, mg/mL
Gluten Content, mg/kgDecrease in Gluten Content, %
Duration of Enzymatic Hydrolysis, h
24242424
BC0376.586.612.09 ± 0.022.21 ± 0.0255,588.47 ± 280051,250.00 ± 22045.2212.62
BB0.25376.616.622.94 ± 0.033.13 ± 0.0328,597.74 ± 121227,060.00 ± 102851.2453.86
BP0.25376.606.653.06 ± 0.043.47 ± 0.0426,222.42 ± 105524,548.75 ± 93355.2958.14
BM0.25376.606.633.02 ± 0.043.24 ± 0.0427,500.99 ± 96025,856.25 ± 94653.1155.91
BB0.5376.616.783.15 ± 0.053.28 ± 0.0417,465.97 ± 86215,321.25 ± 73470.2273.88
BP0.5376.606.793.21 ± 0.063.44 ± 0.0414,498.28 ± 74012,167.50 ± 62875.2879.25
BM0.5376.606.783.19 ± 0.063.35 ± 0.0515,559.85 ± 71513,218.75 ± 73773.4777.46
BB0.75376.556.753.18 ± 0.063.31 ± 0.0415,219.68 ± 78812,962.50 ± 72074.0577.90
BP0.75376.576.773.29 ± 0.083.54 ± 0.0511,395.70 ± 6568911.25 ± 61980.5784.81
BM0.75376.556.763.28 ± 0.083.43 ± 0.0612,281.31 ± 7459860.00 ± 71679.0683.19
BC0456.496.582.83 ± 0.082.95 ± 0.0551,870.06 ± 121547,606.00 ± 101111.5618.83
BB0.25456.506.523.31 ± 0.063.47 ± 0.0414,269.55 ± 86812,072.60 ± 80075.6779.42
BP0.25456.526.553.36 ± 0.063.45 ± 0.0712,251.99 ± 9239851.00 ± 76679.1183.20
BM0.25456.506.533.34 ± 0.053.41 ± 0.0512,715.32 ± 54310,258.20 ± 77078.3282.51
BB0.5456.506.523.05 ± 0.063.62 ± 0.046011.63 ± 386.544100.00 ± 22789.7593.01
BP0.5456.526.553.40 ± 0.093.43 ± 0.045600.08 ± 3542800.00 ± 21590.4595.23
BM0.5456.506.543.15 ± 0.083.54 ± 0.045958.84 ± 385.473150.00 ± 22089.8494.63
BB0.75456.446.343.55 ± 0.063.69 ± 0.056340.06 ± 421.123544.50 ± 20389.1993.96
BP0.75456.266.333.66 ± 0.053.86 ± 0.045348.88 ± 198.562588.20 ± 19990.8895.59
BM0.75456.256.343.64 ± 0.063.77 ± 0.065577.62 ± 3252784.60 ± 18290.4995.25
BC0506.476.512.94 ± 0.043.04 ± 0.0650,550.44 ± 136546,740.00 ± 101213.8120.31
BB0.25506.506.523.02 ± 0.043.32 ± 0.0513,272.50 ± 86610,785.00 ± 60677.3781.61
BP0.25506.526.553.32 ± 0.063.46 ± 0.0610,169.91 ± 7137606.25 ± 55582.6687.03
BM0.25506.506.533.30 ± 0.063.40 ± 0.0610,580.46 ± 9638062.50 ± 56981.9686.25
BB0.5506.396.443.56 ± 0.083.57 ± 0.056703.70 ± 6954010.00 ± 17688.5793.16
BP0.5506.366.393.67 ± 0.063.88 ± 0.065683.19 ± 3652800.00 ± 15790.3195.23
BM0.5506.376.413.67 ± 0.053.75 ± 0.055964.71 ± 5433197.50 ± 15389.8394.55
BB0.75506.416.503.54 ± 0.043.60 ± 0.086633.32 ± 4153946.25 ± 16388.6993.27
BP0.75506.406.563.69 ± 0.063.91 ± 0.055501.37 ± 3592743.75 ± 14890.6295.32
BM0.75506.406.523.68 ± 0.063.77 ± 0.085647.99 ± 3972855.12 ± 14690.3795.13
* Mean value of duplicate measurements ± standard deviation (BC, bran control sample; BB, bran treated with bromelain; BP, bran treated with papain; BM, bran treated with a combination of bromelain and papain).
Publisher’s Note: MDPI stays neutral with regard to jurisdictional claims in published maps and institutional affiliations.

