Article

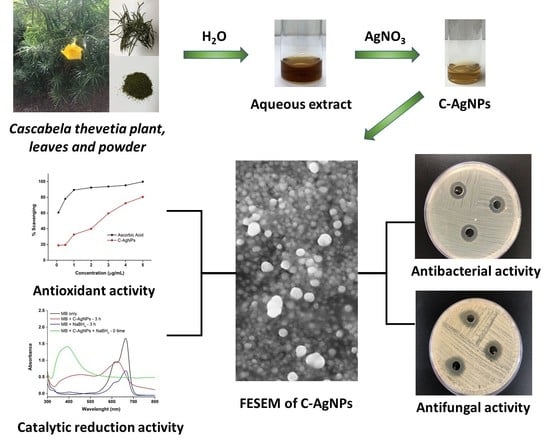
Excellent Antimicrobial, Antioxidant, and Catalytic Activities of Medicinal Plant Aqueous Leaf Extract Derived Silver Nanoparticles

by
Amna Nisar Khan
1,†,
Najla Nader Ali Aldowairy
1,†,
Hajer Saed Saad Alorfi
1,
Mohammad Aslam
2,
Wafa AbuBaker Bawazir
1,
Abdul Hameed
2,3 and
Muhammad Tahir Soomro
2,*
1
Department of Chemistry, Faculty of Science, King Abdulaziz University, Jeddah 21589, Saudi Arabia
2
Center of Excellence in Environmental Studies, King Abdulaziz University, Jeddah 21589, Saudi Arabia
3
National Center of Physics, Quaid-e-Azam University, Islamabad 44000, Pakistan
*
Author to whom correspondence should be addressed.
These authors contributed equally to this work.
Processes 2022, 10(10), 1949; https://doi.org/10.3390/pr10101949
Submission received: 13 August 2022 / Revised: 15 September 2022 / Accepted: 16 September 2022 / Published: 27 September 2022

Abstract

:
Antimicrobial resistance is one of the crucial public health challenges that we need to combat. Thus, in concern over public health and the economy, controlling the emergence of infectious diseases is critical worldwide. One of the ways to overcome the influences of antimicrobial resistance is by developing new, efficient, and improved antimicrobial agents. Medicinal plant-derived silver nanoparticles (AgNPs) are under intensive examination for a variety of therapeutic purposes and targeted applications in nanomedicine and nanotechnology. Plants belonging to the genus Thevetia [Syn. Casabela], which is known for its medicinal uses and has rarely been applied for the synthesis of AgNPs, is an attractive alternative as they have a high content of secondary metabolites. Herein, using aqueous leaf extract of Cascabela thevetia, which was locally found in the Makkah region, Saudi Arabia, green synthesis of AgNPs is reported. Active components of Cascabela thevetia aqueous leaf extract were sufficient to reduce AgNO3 into AgNPs and stabilize them as this was confirmed through UV-Visible absorption, Fourier transforms infrared (FTIR), X-ray diffraction (XRD), filed emission scanning electron microscopy (FESEM), and transmission electron microscopy (TEM) studies. UV-Visible, HPLC, and FTIR analysis demonstrated the presence of gallic acid in aqueous extract and solution of C-AgNPs. The spherical Cascabela thevetia derived C-AgNPs with an average diameter in the range of 20–30 nm were highly dispersed, as seen from FESEM and TEM images, and demonstrated the high antibacterial and antifungal activities when incubated with Gram-positive bacteria Methicillin-resistant Staphylococcus aureus (MRSA), Staphylococcus aureus (S. aureus), Enterococcus faecalis (E. faecalis), Gram-negative bacteria Escherichia coli (E. coli), Salmonella typhimurium (S. typhimurium), Klebsiella pneumoniae (K. pneumoniae), Pseudomonas aeruginosa (P. aeruginosa) and fungi Candida albicans (C. albicans) and Candida parapsilosis (C. parapsilosis). The lowest MIC values of C-AgNPs versus S. aureus, E. faecalis, and E. coli were found. Finally, the antioxidant activity and catalytic property of C-AgNPs were assessed by neutralizing DPPH free radical and reducing methylene blue and rhodamine B dyes, respectively.

Graphical Abstract

1. Introduction

The antimicrobial activity of biosynthesized medicinal plant-derived AgNPs is becoming increasingly effective in reducing antimicrobial resistance due to the rapid advancement in nanotechnology today [1,2,3]. The synthesis procedure is one of the ways that can control AgNPs’ shape, dimension, and properties. Compared to the chemical or physical method, the biological or green method is a one-step procedure to synthesize AgNPs with greater stability, small dimensions, and higher antimicrobial activity [4,5,6]. Various undesirable chemicals and parameters are also eliminated when synthesis proceeds by biological method [7,8]. Green synthesis utilizes biological sources such as plants, algae, bacteria, and fungi to synthesize AgNPs [9,10,11,12]. Among all these biological sources, the plant has more advantages as it is widely available and suitable for large-scale production of AgNPs with faster kinetics.
Plant extracts are used as antimicrobial agents as they possessed a wide variety of organic compounds to present that may inhibit the growth of medically relevant bacterial and fungal pathogens. Within these contexts, the antimicrobial activity of ethanolic and aqueous extracts of various plants has been demonstrated to cure infectious conditions by several researchers [13,14]. Notable phytochemicals such as phenols, flavonoids, tannins, alkaloids, steroids, terpenoids, and cardiac glycosides were found to accumulate in different parts of the plant [15,16,17,18]. However, other than several benefits, plant extracts with higher content of secondary metabolites often carried health risks for humans [19,20]. Conversely, if the plant extracts contain lower content of secondary metabolites than normal, they do not necessarily reveal antimicrobial effects [21,22,23,24,25]. With that in mind, nanoparticle synthesis using plant extract is found to be much safer because it requires a very small quantity of bioactive compounds, utilizes them as reducing as well as stabilizing agents, and eventually convert them into harmless by-products.
Cascabela thevetia, native to tropical America and commonly known as yellow oleander, is a fast-growing species of the family Apocynaceae widely cultivated in various parts of the world and traditionally used as medicine [18,26,27,28]. The pharmacological importance of Cascabela thevetia is known for centuries, however, the high content of cardiac glycoside especially thevetin, thevetoxin, and peruvoside in almost all parts of Cascabela thevetia plant was linked with its toxic effects [18,25,29]. Upon ingestion, nausea, vomiting, abdominal pain, diarrhea, cardiac dyshythmias, and hyperkalemia resulted [18,25,30]. The yellow oleander tree also contains cardiac glycosides known as cardenolides [25]. The most effective use of cardenolides is its effects in the treatment of cardiac failure [31]. Positive inotropic effects of peruvoside on the heart are also reported [25,32]. Besides, in relation to its phytochemical investigation, the various extracts of Cascabela thevetia were also found very potent in phenols, phenolic acid, flavonoids, tannins, saponins, carbohydrates, alkaloids, and terpenoids. To the best of our knowledge, there are no known studies that substantiate the presence of cardiac glycosides in aqueous extract of Cascabela thevetia, but several publications in peer-reviewed and non-peer-review journals have confirmed the presence of polyphenols and flavonoids. Moreover, the synthesis of AgNPs using an aqueous extract of Cascabela thevetia and their catalytic activity against methylene blue is reported by Bonigala et al. [33,34], however, the compounds responsible for the formation of AgNPs, mechanism of synthesis, and antimicrobial activities are not explicated. While in another study by Omolara et al. [35] the antimicrobial activity of aqueous leaf extract of Cascabela thevetia-derived AgNPs is evaluated but the MIC values, growth inhibition effects, antioxidant activity, and catalytic efficiency of AgNPs are not examined. Since in Cascabela thevetia plant extracts flavonoids are often reported [36,37] which are a subgroup of more polar phenolic compounds, therefore, it is highly plausible that the reported flavonoids in the aqueous extract of Cascabela thevetia were actually polyphenols or phenolic acids. With that in mind, perhaps this study might confirm the presence of phenolic compounds in the aqueous extract of Cascabela thevetia, develop a basic understanding of the exact mechanism of synthesis of C-AgNPs, and unravel the antibacterial and antifungal mode of action of C-AgNPs.
Presently, antimicrobial resistance is accountable for more than 1.2 million deaths a year worldwide [38,39]. Infections caused by resistant bacteria and fungi are hard to treat when original antimicrobials no longer work [40,41], therefore, new antimicrobial agents must be developed. In connection, AgNPs have emerged as a viable alternative solution to combat antimicrobial-resistant bacteria and fungi [42,43]. Furthermore, compared to chemical synthesis, plant-based AgNPs, known for their broad range of antimicrobial activity, are preferable choice to overcome antimicrobial resistance owing to the surface chemical functionalization of bioactive compounds which drastically alter their physio-chemical properties, making them more suitable to interact with microbe via multiple pathways and achieve higher antimicrobial efficiency. The plant-based AgNPs have already proven their antioxidant activity, because of the presence of structurally various phenolic compounds on the surface, which are known to neutralize free radicals, quench singlet or triple oxygen, and even decompose peroxides, and are recommended as an alternative to ascorbic acid to administer oxidative stress associated diseases. Recently, plant-based AgNPs were also employed in the catalytic reduction of textile dyes to benign products as they are one of the main sources of water pollution due to unrolled release into water resources. Hence revealing the importance of bioactive compounds which can tune the overall properties of the AgNPs by surface modification and make them an attractive choice for a variety of applications.
Therefore, in the present study, AgNPs were synthesized by a green method using an aqueous extract of Cascabela thevetia leaves and labeled as C-AgNPs for clarity. The synthesized C-AgNPs were thoroughly characterized using standard techniques, including UV-Visible, FTIR, XRD, and FESEM. The C-AgNPs were tested against seven bacterial strains, MRSA, S. aureus, E. faecalis, E. coli, S. typhimurium, K. pneumoniae, P. aeruginosa, and two fungal strains C. albicans and C. parapsilosis by agar well diffusion method. Minimum inhibitory concentration (MIC) of C-AgNPs against representative bacteria S. aureus, E. faecalis, and E. coli was established by broth microdilution assay and compared with those reported for plant-based AgNPs. The bacteriostatic and bactericidal effects of C-AgNPs again the same representative bacteria were found dose-dependent by the growth curve measurement. The synthesized C-AgNPs were also used to scavenge DPPH radicals for antioxidant activity. Finally, smaller, spherical, and highly dispersed C-AgNPs were also employed as a catalyst to reduce toxic textile dyes methylene blue and rhodamine B.

2. Experimental

2.1. Collection of Cascabela thevetia Leaves

Cascabela thevetia leaves (Figure 1) were collected from Makkah, Saudi Arabia by hand picking method. Due to the poisonous nature of the Cascabela thevetia, hand gloves were used in each step from collection to transportation, washing, cleaning, and grinding. Identification of Cascabela thevetia essentially was done through various literature on plant taxonomy. The collected Cascabela thevetia leaves were carefully washed to remove any dirt, disinfected to kill bacterial or other living microorganisms, and rinsed with distilled water. The plant leaves were then air dried in shade and kept in a sealed plastic bag under ambient conditions for synthesis purposes.

2.2. Preparation of Aqueous Extract

The dried Cascabela thevetia leaves were chopped into small pieces and then ground into a fine powder using. The aqueous extract (0.1 g/mL) was prepared by precisely weighing 0.5 g of Cascabela thevetia powder that was soaked into 5 mL of water. The soaked Cascabela thevetia powder was left overnight to extract maximum active compounds in the water. These extracted compounds were intended to use both as reducing and stabilizing agents, respectively. After centrifugation, for 15 min at 5000 rpm, the supernatant collected was brown and kept at room temperature. The Cascabela thevetia aqueous leaf extract was administered for one week on daily basis for the synthesis of fresh C-AgNPs.

2.3. Synthesis of C-AgNPs

The green synthesis of C-AgNPs was carried out as follows: 50 µL of 0.1 M AgNO3 (Sigma-Aldrich) was diluted with double distilled water and stirred well before adding 50 µL Cascabela thevetia aqueous leaf extract. The total volume of the reaction vessel was maintained at 5 mL all the time. Initially, the color of the reaction mixture was light brown but was gradually darkened into brown within 2 h signifying the formation of C-AgNPs. The concentration of the prepared C-AgNPs was ~108 µg/mL. Two more concentrations of C-AgNPs were also prepared, ~216 and ~432 µg/mL, respectively, by varying the volumes of AgNO3 solution and Cascabela thevetia aqueous leaf extract. The formation of C-AgNPs was monitored by a UV-Visible spectrophotometer to determine the time course of the synthesis. The room temperature stability of C-AgNPs was reflected by storing the C-AgNPs solution in a closed vial under normal storage conditions.

2.4. Characterization of C-AgNPs

The surface plasmon resonance (SPR) absorption spectra of Cascabela thevetia aqueous leaf extract and synthesized C-AgNPs at different time intervals were obtained in the scan range of 200–800 nm using Cary 60 UV-Vis spectrophotometer (Agilent Technology, Santa Clara, CA 95051, USA). The high-performance liquid chromatographic (HPLC) identification of compounds present in Cascabela thevetia aqueous leaf extract was performed with SPD-20A HPLC (Shimadzu, Japan) equipped with a 254 nm UV detector and RP-C18 column. The mobile phase comprised of acetonitrile:1% acetic acid (50:50) was used with a flow rate of 1.0 mL min−1. The retention times of the peaks were compared with the standards that were run under the same operating conditions. The surface functional groups of C-AgNPs attached during the reduction and stabilization process were identified with the help of the Cary 630 Fourier transform infrared (FTIR) spectrophotometer (Agilent Technology, Santa Clara, CA 95051 USA). The FTIR spectra usually in the 4000–400 cm−1 wavenumber range were collected. The composition and crystalline nature of the synthesized C-AgNPs was confirmed through the X-ray diffraction (XRD) pattern obtained Ultima IV multipurpose X-ray diffractometer (Rigaku, Tokyo 196-8666, Japan). The morphology, particle size distribution, and dispersibility of C-AgNPs were seen by field emission scanning electron microscopy (FESEM), JEOL, SM-IT700HR (Tokyo Japan). For FTIR and XRD, colloidal C-AgNPs were drop coated on a glass slide, whereas for FESEM analysis on a silicon wafer, finally air dried before each analysis. The shape and size analysis of C-AgNPs was performed by High-Resolution Transmission Electron Microscope, JEOL, JEM-2100, Inc. 11 Dearborn Road Peabody, MA 01960 USA.

2.5. Antibacterial Activity Assessment of C-AgNPs

Bacteria chosen for assessing antibacterial activity were Gram-positive bacteria MRSA (ATCC 33591), S. aureus (ATCC 29213), and E. faecalis (clinically isolated from King Abdulaziz Hospital, Jeddah, Saudi Arabia), and Gram-negative E. coli (ATCC 25922), S. typhimurium (ATCC 14028), K. pneumoniae (ATCC 5205733), and P. aeruginosa (ATCC 9027), respectively, and they were supplied by King Fahad Medical Research Center, Jeddah, Saudi Arabia. The antibacterial activity was quantified by agar well diffusion. Nutrient agar slants (Himedia, India) were used to maintain bacterial cultures at 4 °C. For agar well diffusion assay, the bacteria were subcultured by growing a full loop on a nutrient agar plate at 35 °C overnight. The bacterial suspensions were then suspended individually in sterile sodium chloride (B. Braun, 34212 Melsungen, Germany) to match the turbidity to 0.5 McFarland standard. Bacterial cultures were then spread on Mueller-Hinton agar, and wells of about 7 mm diameter were punched on each agar plate. The wells were filled with 0.1 mL of three different concentrations of C-AgNPs, respectively, and incubated for 24 h at 37 °C. Antibacterial activity experiments were performed in triplicates and diameters (mm) of the inhibition zones were used to relate to the susceptibility of the bacteria towards C-AgNPs, while control antibiotics were 5 μg/mL Ciprofloxacin and 30 μg/mL Kanamycin (Thermo Fisher Scientific, Waltham, Massachusetts), respectively.

2.6. Minimum Inhibitory Concentration Test

A 0.02% (wt/vol) solution of resazurin sodium salt (Sigma-Aldrich, 82024 Taufkirchen, Germany) was prepared by dispersing 0.002 g in 10 mL of distilled water. The solution was vortexed to ensure homogeneity, filtered using a 0.2 µm Millipore membrane filter, and stored at 4 °C. The Broth microdilution was adopted and each well of sterile 96-well round-bottom microtiter plate was filled with 100 µL of Muller Hinton Broth (MHB). Columns 1 and 2 were assigned as negative controls containing only MHB and MHB with C-AgNPs. Wells in column 3 were filled with MHB and bacterial culture and labeled as a positive control. The wells from columns 4 to 10 were having MHB, 100 µL of bacterial culture, and different concentrations of C-AgNPs. The concentration of C-AgNPs was estimated as follows: 50 µL of C-AgNPs stock solution was injected in wells of column 4 and then diluted by the successive two-fold method in other wells from columns 5 to 10. The concentrations of synthesized C-AgNPs diluted in wells from column 4 to 10 were 54, 27, 13.5, 6.75, 3.38, 1.69, 0.84, 0.42, 0.21, 0.105 µg/mL, respectively. The numbers 1–10 were used to represent these concentrations in the microtiter plate, where 1 was the higher concentration and 10 was the lower. The plate was incubated for 22 h at 37 °C, then 20 µL of resazurin solution was dispensed in each well and allowed to further incubate for 4 h at 37 °C. The blue (or purple) color is referred to no bacterial growth, while the pink (or colorless) color is indicated bacterial growth. Therefore, the lowest concentration (MIC) was considered column a with no apparent color change.

2.7. Bacterial Growth Study

The effect of synthesized C-AgNPs on S. aureus, E. faecalis, and E. coli growth behavior was studied. The bacteria were cultured in MHB (at 37 °C for 24 h) and distributed in wells of a 96-well microtiter plate. The C-AgNPs were two-fold concentrated in the range of 0.105–54 µg/mL. Subsequently, the plate was inoculated with 106 CFU/mL of each bacterial culture, separately. The wells with only MHB and bacteria were labeled as a positive control. The absorbance values were recorded for 0, 0.5, 1, 2, 4, 8, and 20 h at OD600 nm using Cary 60 UV-Vis spectrophotometer. The absorbances for wells containing bacteria and C-AgNPs were corrected by subtracting the absorbance of the control. The absorbance vs. time graph was plotted for all three bacteria.

2.8. Studies of Antifungal Activity

For the antifungal activity test, two fungal strains namely C. albicans (ATCC 10231) and C. parapsilosis (ATCC 20019) were used. Both fungal cultures were maintained for 24 at 37 °C in yeast malt broth by transferring 20 µL of each, and growth was performed on potato dextrose agar at 35 °C for 24 h. Later, a loop full of 2–3 colonies of each fungal strain was suspended in sterile sodium chloride and the McFarland turbidity standard was retained at 0.5. Before punching wells, fungal culture was evenly inoculated on the agar plate. The wells were then filled with 50 µL of three different concentrations of C-AgNPs, separately. The plates were incubated, and the diameters of zones of inhibition were approximated, accordingly.

2.9. Antioxidant Activity Test

The antioxidant activity test of C-AgNPs was performed as described in the literature. The simple and well-known DPPH (2,2-diphenyl-1-picryl-hydrazyl-hydrate) radical scavenging assay was followed. The stock solution of DPPH of 4.3 mg/3 mL in methanol was prepared and homogenized through a vortex mixture. C-AgNPs in the concentration range of 0.1–5 µg/mL were mixed with 5 µg/mL DPPH. The mixture was kept in dark for about 30 min and the absorbance measurements at 517 nm were performed. The observed absorbances were corrected against the blank, which was methanol. The antioxidant activity of C-AgNPs was signified as
%   s c a v e n g i n g = 100   B l a n k A b s S a m p l e A b s B l a n k A b s
where % scavenging is the antioxidant activity of C-AgNPs to capture DPPH radical, BlankAbs was the absorbance of the methanol and SampleAbs was the absorbance of the reaction mixture. The standard was ascorbic acid.

2.10. Catalytic Reduction Experiment

The catalytic reduction of methylene blue and rhodamine B using C-AgNPs was investigated. Typically, 100 µL of the prepared 108 µg/mL C-AgNPs was mixed with 10 mL of the 10 µg/mL of each dye in a 100 mL glass beaker. The final concentration of C-AgNPs was 1.08 µg/mL. The concertation of NABH4 was equivalent to or double the dye concentration. Glass beakers containing only C-AgNPs and NABH4, separately, served as the controls. The mixtures were stirred well before being examined by Cary 60 UV-Vis spectrophotometer. The reduction of dyes was monitored by the naked eye and by spectrophotometrically.

2.11. Statistical Analysis

Experiments were conducted in triplicate and the results are expressed as mean and standard deviation. Means of Gram-positive and Gram-negative bacteria, separately and collectively, were subjected to a one-way analysis of variance and compared to the P values.

3. Results and Discussion

3.1. Color Transformation and UV-Visible Study of C-AgNPs

The formation of C-AgNPs was ascertained by color transformation. The aqueous leaf extract of Cascabela thevetia was dark brown, and when mixed with AgNO3 solution, a color change from dull brown to yellowish-brown was observed within a few minutes, which is an indication of the reduction of Ag+ ions into AgNPs. The color intensity is related to the formation of C-AgNPs and the maximum color intensity, as well as absorbance, was observed after 60 min as shown in Figure 2a. The UV-Visible spectra for Cascabela thevetia aqueous leaf extract alone and with AgNO3 solution at different time intervals are illustrated in Figure 2b, where two weak to medium intensity absorption bands of Cascabela thevetia aqueous leaf extract were clearly seen at 280 and 327 nm, respectively. These exhibited bands exactly lay in the region of 270–320 nm that was reported to reveal phenolic compounds in plant extracts [44,45]. Almost, all phenolic compounds comprised one phenol moiety or more with attached at least one carboxylic acid on an aromatic ring. By virtue of their resonance stabilized structure, phenolic acids with multiple hydroxyl groups such as gallic acid, ellagic acid, caffeic acid and many more are excellent free radical scavengers. [46,47]. In most cases, phenolic compounds in natural plant extracts are identified as phenolic acids. Among reported phenolic compounds in yellow oleander, gallic acid was in abundance. And since the UV-visible spectrum of gallic acid was characterized by two visible absorption peaks in the region 220–280 and 280–360 nm, respectively, as detected in various literature [48,49,50,51,52], therefore it is highly probable that the two-week absorptions in the UV-visible spectrum (Figure 2b) of Cascabela thevetia aqueous leaf extract were actually due to gallic acid.
Next, when mixed the Cascabela thevetia aqueous extract and AgNO3 mixture didn’t show any peak at zero time likely due to interactions of Ag+ ion with gallic acid, which in turn produced C-AgNPs. At 30 min, the mixture solution revealed conspicuous surface plasmon resonance at 431 nm, confirming the formation of C-AgNPs, which reached its maximum at 60 min. No further increase in the absorbance of C-AgNPs was observed after 60 min. The slight blue shift of the absorption edge of C-AgNPs was observed which meant the C-AgNPs size was further reduced. Therefore, the rest of the study was carried out with AgNPs prepared at 60 min. The colloidal stability of the C-AgNPs was observed under normal storage conditions through UV-visible spectra. The C-AgNPs remained stable over a 7-day period without any obvious change in their color, absorbance maxima, and wavelength.

3.2. HPLC Analysis of Cascabela thevetia Aqueous Leaf Extract

The composition of Cascabela thevetia aqueous leaf extract was analyzed by HPLC for the identification of compounds. The HPLC chromatogram of Cascabela thevetia aqueous leaf extract along with standard are shown in Figure 3, where a major peak at a retention time of 2.70 min was identified as gallic acid in the aqueous extract of Cascabela thevetia. The HPLC finding is in good agreement with this literature [53,54,55]. Another less prominent peak at a retention time of 2.18 min, however not identified but as per literature, may be associated with tannic acid, another phenolic compound. Thus, the HPLC analysis of Cascabela thevetia aqueous leaf extract highlighted the presence of phenolic acids as a major constituent in it.

3.3. FTIR Spectra of the Prepared C-AgNPs

To reveal functional groups responsible for the bioreduction of Ag+ ions and stabilization of C-AgNPs, an FTIR study was conducted. Depending on the spectral features such as peak position, band shapes, and intensities, the fundamental components responsible can be identified [56,57]. The FTIR spectrum of Cascabela thevetia aqueous leaf extract in Figure 4a, showed a single broad stretching band at 3292 cm−1, which was assigned to phenolic OH. The weak alkyl C-H symmetric and asymmetric vibrations appeared at 2972 and 2869 cm−1, respectively, due to the complex nature of the aqueous extract and because the FTIR study was performed by depositing Cascabela thevetia aqueous leaf extract or C-AgNPs solution as a dried film on the glass slide. The C=O linkage of carboxylic acid was demonstrated by the band at 1622 cm−1, whereas the band at 1419 cm−1 was contributed by OH deformation vibrations (coupled with C-O stretching). The sharp and broadband at 912 cm−1 were possibly due to C-O stretching vibrations of phenol and carboxylic acid [55,56]. The bands that emerged in the lower frequency region 500–780 cm−1 were generated by aromatic ring deformation vibrations of C-H and C-C. While in the case of C-AgNPs FTIR spectrum the phenolic, C-O stretching, and aromatic out-of-plane vibrations remained unchanged or even increased, however, the bands associated with OH stretching and deformation vibrations, and carboxylic acid C=O linkage were drastically reduced in intensities thereby confirming the involvement of hydroxyl groups of gallic acid in the biosynthesis process of C-AgNPs. The absence of carboxylic vibrations may be due to the spatial arrangement of the bond or some of the modifications in the structure when gallic acid is conjugated with C-AgNPs during the capping process. Based on the above discussion, the reasonable mechanism for the synthesis of C-AgNPs using Cascabela thevetia aqueous leaf extract, involving phenolic OH groups of gallic acid and Ag+ ions, is depicted in Scheme 1.

3.4. Synthesis Mechanism of C-AgNPs

The mechanism of formation of C-AgNPs using gallic acid in Scheme 1. The reduction of Ag+ ions was triggered by interactions with the hydroxyl groups at the 3 and 4 positions [9,46,51,52,58]. The interactions, which were favored by the steric hindrance, involved the removal of acidic protons and generated an intermediate gallic acid-Ag complex. Next, Ag0 was released and deprotonated gallic acid, which was unstable, converted into a stable o-quinone form. Thus, by simple oxidation of hydroxyl groups of gallic acid C-AgNPs were produced. Moreover, the produced o-quinone was then combined with C-AgNPs to create a feasible environment and stabilized C-AgNPs by preventing aggregation. Compared to the hydroxyl of carboxylic acid, the oxidation of phenolic hydroxyls is favored as the end product is more stable in this case.

3.5. X-ray Diffraction Pattern of C-AgNPs

The XRD analysis was performed to reflect the crystal nature and structure of C-AgNPs. The colloidal C-AgNPs were deposited on a glass slide and air dried prior to measurements. The pattern was collected in the range of 10–80° at 2θ angles and is displayed in Figure 4b. The four distinct peaks of Ag were identified at 37.83°, 46.34°, 63.96°, and 77.81°, respectively, and were indexed to the lattice planes of (111), (200), (220), and (311) [9,10,11,59]. Thus, the structure of C-AgNPs synthesized by aqueous leaf extract of Cascabela thevetia was face-centered cubic. Moreover, the two intense peaks with steric were unassigned and could be attributed to the unreacted carboxyl groups of gallic acid that stabilized C-AgNPs in the colloidal solution. The XRD analysis endorsed that the crystallite particles in the colloidal solution were primarily C-AgNPs. The mean crystallite size of C-AgNPs was estimated by the Scherrer equation:
d = 0.9 λ/β cosθ
where λ is the wavelength of the radiation, β is the full width at half maximum (FWHM) of the most intense peak (here in this case (111)) at the diffraction angle of θ [60,61]. The C-AgNPs displayed a mean crystallite size of approximately 22.3 nm which is in good agreement with FESEM results where the mean particle size is in the range of 20–30 nm.

3.6. FESEM Micrographs of C-AgNPs

FESEM images of C-AgNPs at (a) 25,000×, (b) 50,000×, (c) 75,000× and (d) 100,000× magnification are shown in Figure 5a–d. The aqueous leaf extract of Cascabela thevetia supported highly dense C-AgNPs with uniform spherical morphology can be seen all over the silicon wafer support and the particles were dispersed rather than separated individually. The observable amorphous matrix around C-AgNPs was the capping surface. The sizes of C-AgNPs were approximated by adding a scale bar in a FESEM image of 100,000× magnification, which is shown in Figure 5e where the smaller C-AgNPs less than 30 nm, larger C-AgNPs between 30–50 nm range, and aggregated C-AgNPs above the size of 50 nm were clearly visible. The particle size distribution was evaluated and the C-AgNPs in the range of 40–50 nm size were higher in volume faction, Figure 5f. Some particles were agglomerated during the sample deposition and drying process and can be seen in SEM micrographs. These agglomerated particles were included in the particle size distribution graph, however, ignored in the mean particle size estimation of C-AgNPs. Therefore, the mean particle size of C-AgNPs was in the range of 20–30 nm. The particle size, shape, and surface functional groups are essential factors in determining the antimicrobial effects of prepared C-AgNPs, otherwise, the antimicrobial activity will be restricted or not occur. Smaller particles with spherical morphology have a greater tendency to interact with the bacterial cell membrane and easily get internalized [62,63,64]. Furthermore, it has been reported that nanoparticles with plant-based surface functional groups provide high interaction with the bacterial cell and give a bactericidal effect more than chemically stabilized nanoparticles [42,65]. Thus, spherical C-AgNPs with diameters in the range of 20–30 nm, which were stabilized by carboxyl groups of gallic acid, are expected to exhibit superior antimicrobial activity.

3.7. TEM Analysis of C-AgNPs

In the TEM investigation, Figure 6a–d, at the scale of 100 nm, 50 nm, and 20 nm, respectively, spherical C-AgNPs were clearly observable. As per images at various magnifications, although the particle size distribution ranged between 10–30 nm, however, majority of the particles exhibited a particle size range of 10–20 nm. The larger particles are probably aggregates due to the electrostatic forces. Uniformity in the shape is also observable in the images [66,67]. The TEM analysis further elaborated the particle size distribution extracted from the FESEM analysis.

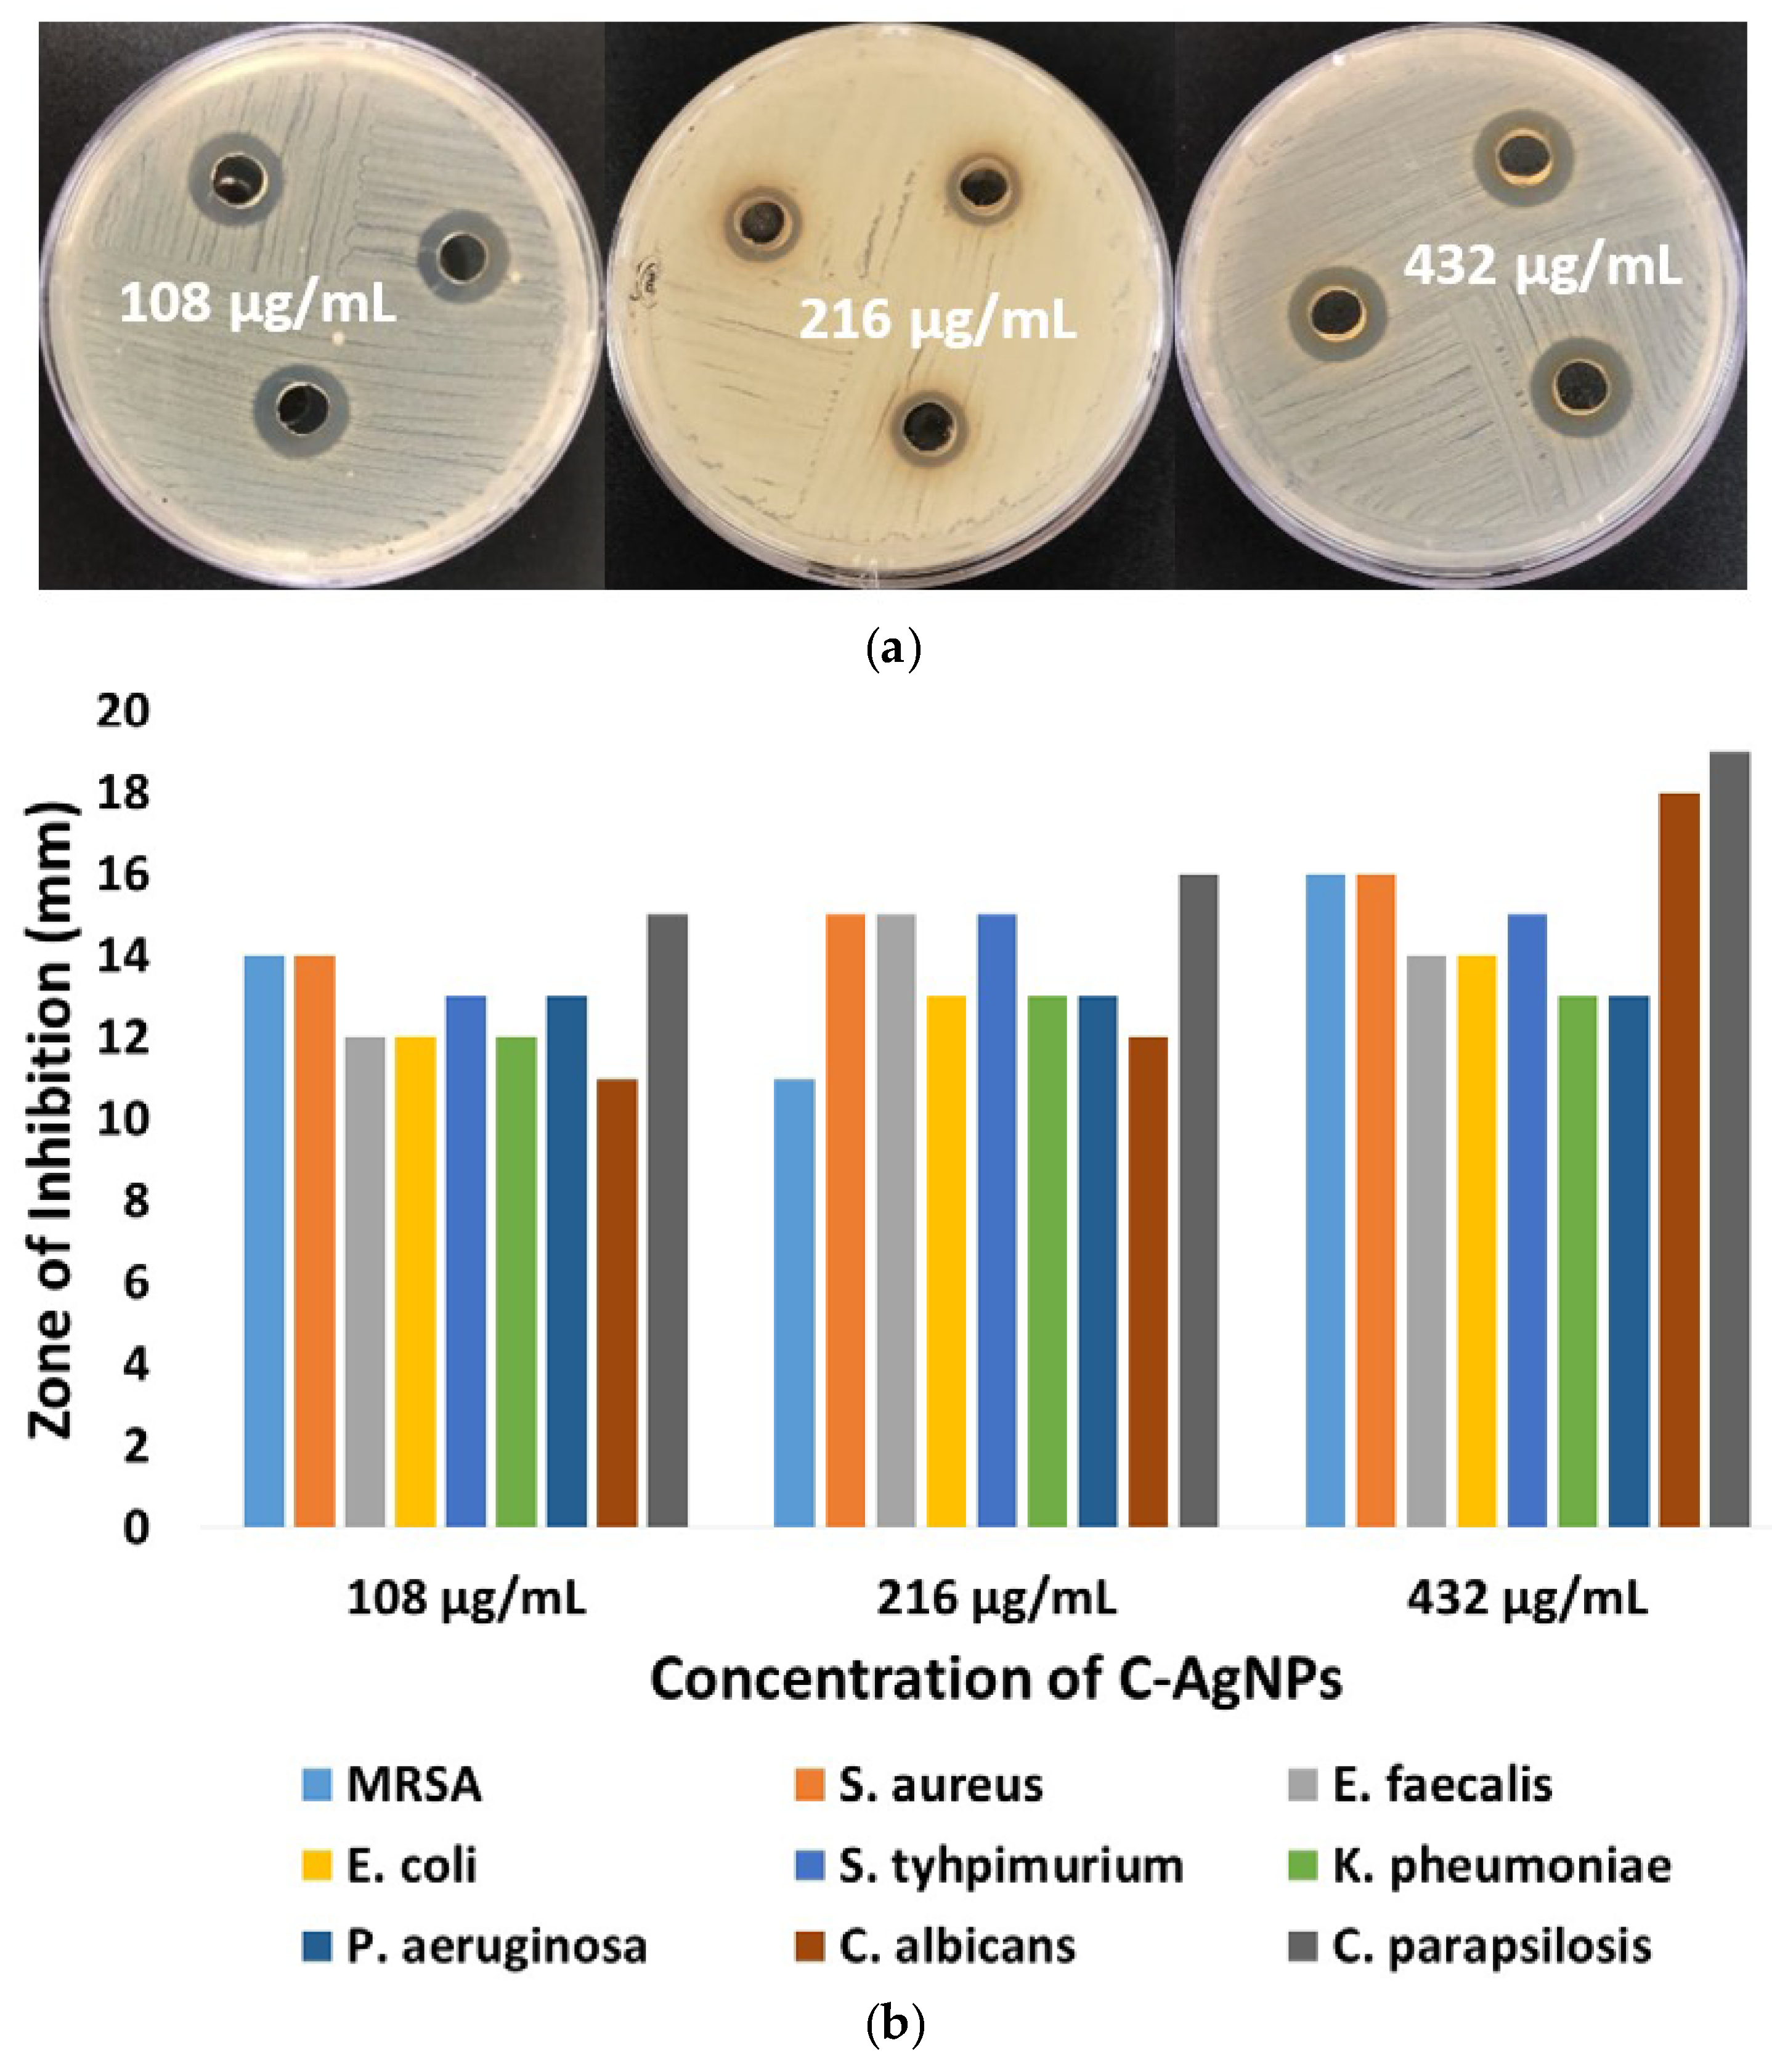
3.8. Antimicrobial Activity of C-AgNPs

Agar well diffusion method was used to assess and compare the antibacterial effects of synthesized C-AgNPs on seven selected bacterial pathogens namely MRSA, S. aureus, E. faecalis, E. coli, S. typhimurium, K. pneumoniae, and P. aeruginosa. Although the exact mechanism of action of nanoparticles against bacteria is still unclear, the most widely accepted theories are that the interaction of nanoparticles with membrane proteins of bacteria initiates cell killing by penetrating the cell membrane to reach inside of the cell, where they attack the respiratory enzymes that leads to cell division. The prepared C-AgNPs have a higher surface area to volume ratio as confirmed by FESEM analysis. Therefore, C-AgNPs interactions with bacterial surfaces are inevitable which may implicate enhancing the antibacterial activity of C-AgNPs. To confirm, the bacterial susceptibly was tested against the stock concentration of 108 µg/mL C-AgNPs. The observed agar well diffusion susceptibility results are shown in Figure 7a–g, in which marginally higher zones of inhibition were observed against Gram-positive MRSA and S. aureus. The diameters of the zone of inhibition around the wells as a function of C-AgNPs sensitivity were approximated by a ruler and are presented in Table 1 as a mean of three evaluations ± standard deviation. The sensitivity of C-AgNPs reached 14 ± 0.4 for MRSA, 14 ± 0.3 for S. aureus, 12 ± 0.8 for E. faecalis, 12 ± 0.1 for E. coli, 13 ± 0.7 for S. tyhpimurium, 12 ± 0.1 for K. pheumoniae and 13±0.2 for P. aeruginosa and comparatively higher than the previously reported except S. aureus [35]. Thus, the observed susceptibility of selected bacteria towards C-AgNPs can be arranged in the order MRSA = S. aureus > S. typhimurium = P. aeruginosa > E. faecalis = E. coli = K. pneumoniae. Upon comparison with the results obtained with tested antibiotics, even so, the inhibition potential of the synthesized C-AgNPs was relatively unattractive to that induced by Ciprofloxacin and Kanamycin against MRSA, S. aureus, E. faecalis, and E. coli, Kanamycin had no inhibitory effect on the three tested bacterial pathogens S. typhimurium K. pneumoniae and P. aeruginosa. Concerning Ciprofloxacin, the observed inhibition zones against all the seven bacteria were 26 ± 0.3, 26 ± 0.9, 21 ± 0.8, 31 ± 0.4, 24 ± 0.1, 25 ± 0.5, 30 ± 0.8, whereas Kanamycin showed activity against MRSA, S. aureus, and E. coli and the observed zones diameters were 19 ± 0.6, 18 ± 0.3, and 20 ± 0.4, respectively, Figure 7i–l. Thus, C-AgNPs have proved to be effective against a wide range of bacterial pathogens, which is in agreement with the data reported for other various plant-based AgNPs [68,69,70]. Moreover, concerning the results presented in Figure 7a–g and Table 1, it was assessed that Gram-positive MRSA and S. aureus had inhibition zone sizes that were 7% higher than those produced by Gram-negative S. typhimurium and P. aeruginosa and 14% than Gram-positive E. faecalis and Gram-negative E. coli and K. pneumoniae. This observation could suggest higher tolerance of Gram-negative bacteria against C-AgNPs. However, this interpretation requires further evaluation to validate. Consequently, one-way ANOVA showed a significant difference between the means of MRSA, S. aureus, and E. faecalis with p < 0.05, while means of E. coli, S. typhimurium, K. pneumoniae, and P. aeruginosa were about the same (p > 0.05). This means that C-AgNPs had parallel antibacterial sensitivity against all four Gram-negative bacteria but varied against Gram-positive bacteria depending upon the potential binding on the bacterial surfaces. This variation in C-AgNPs sensitivity against the three tested Gram-positive bacteria may prove to be more significant against the wide range of the bacterial spectrum. The Cascabela thevetia aqueous leaf extract inhibition activity against all the tested bacteria was also investigated. The Cascabela thevetia aqueous leaf extract had no antibacterial activity as no zone of inhibition was observed against any of the bacteria tested, Figure 7h. This means that the C-AgNPs produced from Cascabela thevetia aqueous leaf extract appeared to be more effective than the plant itself.
The concentration-dependent inhibitory effects of C-AgNPs were evaluated. Three different concentrations of C-AgNPs, say, 108, 216, and 432 µg/mL, separately, were prepared by varying the volumes of AgNO3 and Cascabela thevetia aqueous leaf extract and keeping the total volume of 5 mL of the solution mixture. The variation in the zone of inhibition diameters, for all the bacteria, as a function of C-AgNPs concentration is demonstrated in Figure 8. In the case of MRSA, the diameter of the zone of inhibition was first decreased and then increased with increasing the concentration of C-AgNPs, as illustrated in Figure 8 and Table 1, while for P. aeruginosa concentrations variation didn’t result in any change in the zone of inhibition diameter. This means that P. aeruginosa was not susceptible to any change that occurred in the concentration of C-AgNPs. For S. aureus, E. coli, and K. pheumoniae, the results showed a gradual increment in the zone of inhibition diameter when the concentration of C-AgNPs increased from 108 to 432 µg/mL. The diameters of the zone of inhibition for the other two bacteria, E. faecalis and S. typhimurium, were either decreased after first increasing or remained unchanged with the change in the concentration of C-AgNPs. Since the change in the diameters of the zone of inhibition was not very significant or consistent and the increased concentration of C-AgNPs resulted in either higher or lower zones of inhibition, therefore, it was perceived that the lower concentration of C-AgNPs is more effective in inhibiting the bacterial growth. One-way ANOVA confirmed the null hypothesis (p > 0.05) that there were no significant differences between the means obtained at three different concentrations of C-AgNPs for all the tested bacteria. The reason can be explained that with the increase of the concentration more C-AgNPs were agglomerated, thus, limiting the physical contact between C-AgNPs and bacteria, which was crucial in determining the antibacterial potential of C-AgNPs as an antibacterial agent.
Since antifungal activity is another important parameter that would affect the overall antimicrobial effect, therefore the influence of C-AgNPs concentration on the C. albicans and C. parapsilosis was investigated by the agar well diffusion method. Figure 9, showed the observed zones of inhibition for C. albicans and C. parapsilosis at 108, 216, and 432 µg/mL of C-AgNPs, separately. The diameters were estimated in Table 1 as a mean of three readings ± standard deviation and also included as a bar graph in Figure 8. Contrary to bacteria, the fungi were regarded as more sensitive to any change that occurred in C-AgNPs concentration. The increased concentration of C-AgNPs from 108 to 216 µg/mL led to the increase in diameter of C. albicans and C. parapsilosis by 9% and 6.6%, respectively. However, the maximum increase in the diameter of C. albicans and C. parapsilosis was observed when the concentration of C-AgNPs was increased from 216 to 432 µg/mL were 50 and 19%, respectively. Furthermore, C. parapsilosis exhibited a higher zone of inhibitions than C. albicans at all three concentrations of C-AgNPs, hence, was the most susceptible fungi. The increased antifungal effects at higher concentrations of C-AgNPs might be due to fundamental cellular differences between bacteria and fungi, and while the antibacterial activity mechanism is arguably the most generalized mechanism, the modes of the antifungal mechanism are yet to be classified [71,72]. It has been reported that AgNPs were found most lethal to bacteria than fungal pathogens [73,74]. This may be due to the differences in their cell wall structure. However, our results showed that the synthesized C-AgNPs at higher concentrations were more effective against fungal than bacterial pathogens. The fungi, being made up of chitin, a large polysaccharide chain of modified glucose, are likely to attract more gallic acid-capped C-AgNPs on their surfaces than bacteria. The hydroxyl and carboxyl groups of gallic acid may attach to chitin. Thus, as the concentration increases, there are high chances for C-AgNPs to adhere and interact with fungi cells better than with bacteria cells. In short, by using aqueous leaf extract of Cascabela thevetia surprisingly efficient and potent antimicrobial C-AgNPs were prepared.

3.9. MICs of C-AgNPs

Microdilution including resazurin dye is arguably the simple, straight forward and quantitative method to determine the minimum inhibitory concentration (MIC) values of C-AgNPs, therefore, was employed on three representative bacterial pathogens such as S. aureus, E. faecalis, and E. coli. The resazurin dye, which is a redox indicator and blue in color, is usually irreversibly reduced and turned into pink when sensed bacterial growth in the medium. No bacterial growth in the medium means no change in color, hence, the MIC. The MIC experiments were conducted in such a way that the concentration of C-AgNPs in column 4 was 54 µg/mL and after successive two-fold dilution, the concentrations of C-AgNPs from columns 3–10 were estimated as 27, 13.5, 6.76, 3.38, 1.69, 0.84, 0.42, 0.21 and 0.105 µg/mL, respectively. The images of MIC experiments are displayed in Figure 10, whereas the data is presented in Table 2. The MICs of S. aureus, E. faecalis, and E. coli detected by unaided eye were found at 27, 13.5, and 27 µg/mL, respectively. Therefore, the MICs were in the order of E. faecalis > S. aureus = E. coli. The lowest MIC of C-AgNPs was obtained against E. faecalis. Although promising, the MIC results were not in agreement with those obtained by the agar well diffusion method, where the most sensitive bacteria among the three was S. aureus. This discrepancy between agar well diffusion and MIC result could be partly due to a lower concentration of C-AgNPs and also the employment of different methods. Nevertheless, in terms of antibacterial properties, MIC results well indicated that the C-AgNPs exhibited bactericidal effects against clinically important bacteria in the concentration range of 54-13.5 µg/mL. To the best of our knowledge, agar well diffusions, as well as MICs antibacterial effects of the Cascabela thevetia aqueous leaf extract, mediated C-AgNPs had never been determined or reported. Furthermore, it should also note that the MIC values obtained for C-AgNPs were found lower than those reported for various plant-based AgNPs [9,10,70].

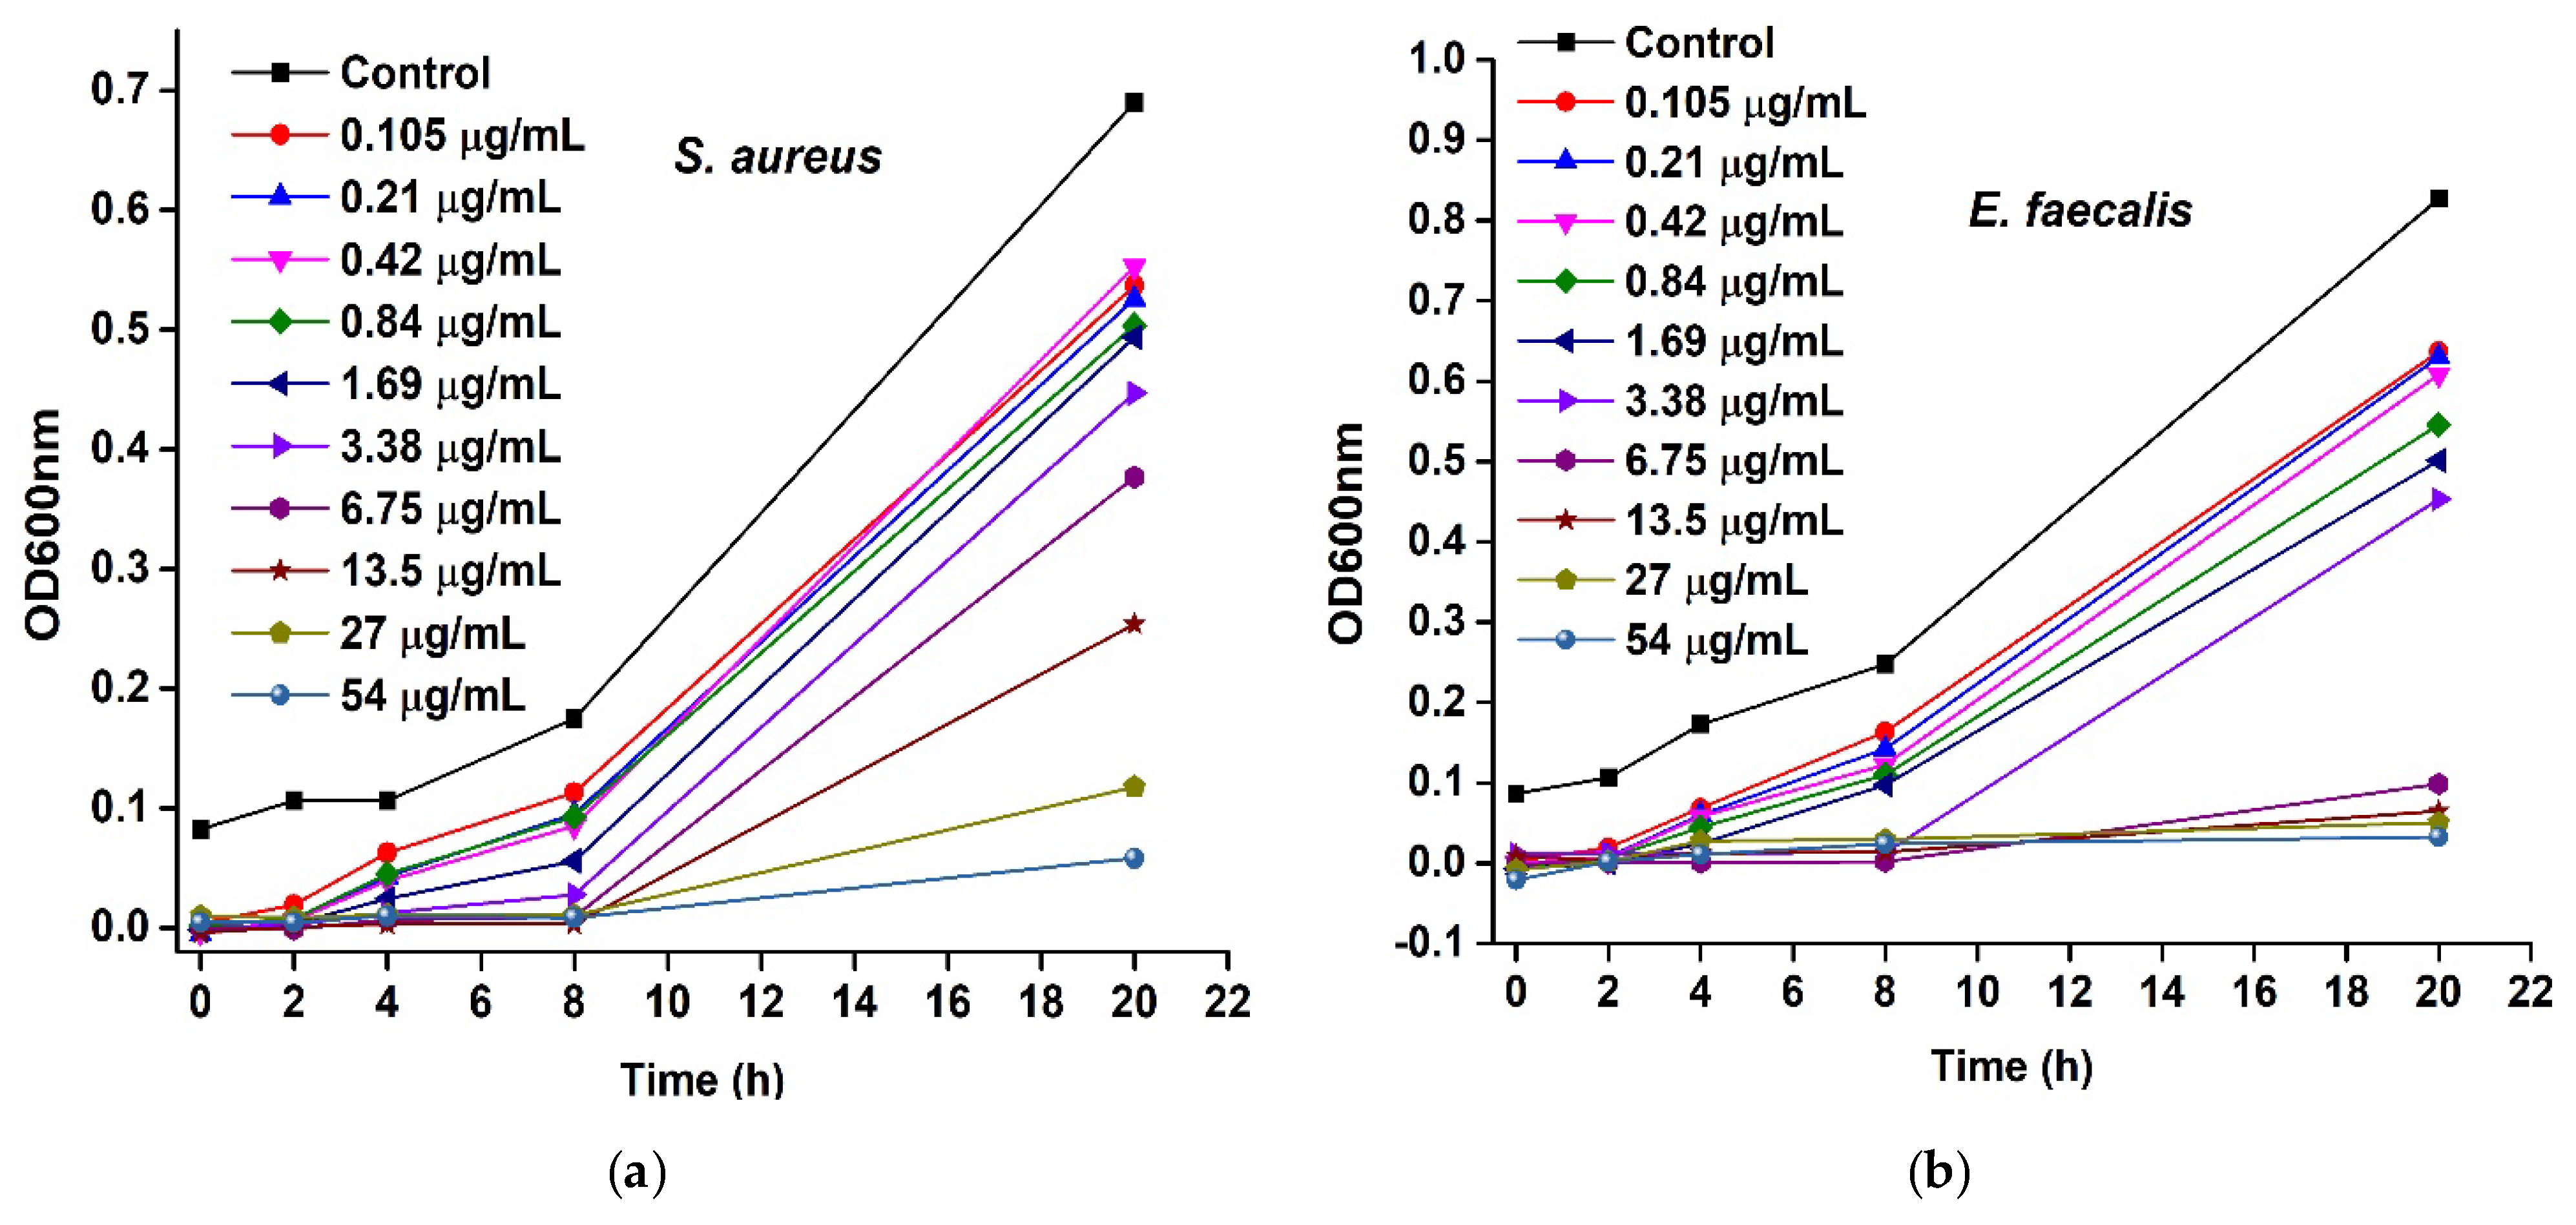
3.10. Bacterial Growth Curves

The bacteriostatic and bactericidal properties of C-AgNPs were evaluated by measuring bacterial growth curves. The three bacteria S. aureus, E. faecalis, and E. coli cultivated in MHB medium were treated with different concentrations of C-AgNPs and the growth curves were recorded at the optical density of OD600 nm until 20 h. As can be seen in Figure 11, C-AgNPs can significantly affect the growth of all three bacteria in the concentration range of 0.105–54 µg/mL. Somewhat, identical growth behavior was exhibited. The growth of S. aureus and E. faecalis was slow in the initial phase however, later in the linear phase more decline in the growth of E. faecalis was noticed. Interestingly, there was significant growth inhibition for E. faecalis, almost complete, at the MIC concentration of 13.5 µg/mL of C-AgNPs. Similar to this, S. aureus also showed substantial growth inhibition at the concentration of 27 µg/mL, which was the MIC concentration of C-AgNPs against S. aureus. A growth delay of about 4-8 h was observed in the case of E. coli and then linearly increased that was gradually decreased upon treatment of different concentrations of C-AgNPs with time. Again, the significant growth inhibition for E. coli was observed at the MIC concentration of 27 µg/mL. The results are in good agreement with the MIC data and the comparative order of inhibition by C-AgNPs was E. faecalis > S. aureus = E. coli. The results indicated that C-AgNPs inhibited the growth of S. aureus and E. faecalis in the initial phase at a higher rate than E. coli therefore, C-AgNPs appeared bactericidal for S. aureus and E. faecalis, and bacteriostatic for E. coli in the lower concentration range. However, at the bacteria’s respective MIC values, the bactericidal effects of C-AgNPs against all three bacteria were evidently promising. The data showed the potential antimicrobial effects of Cascabela thevetia aqueous leaf extract mediated C-AgNPs, which were not evaluated before, in the concentration range of 13.5–27 µg/mL. Moreover, this data also suggested that C-AgNPs have bactericidal properties at about twice the MIC value.

3.11. Antioxidant Activity Test

The synthesized C-AgNPs were subjected to the DPPH radical scavenging test, which is specifically suitable for the rapid, easy to perform, and inexpensive determination of antioxidant potential. The concentration of C-AgNPs and ascorbic acid, which is a reference, was gradually increased in the range of 0.1–5 µg/mL, while the concentration of DPPH was kept constant at 5 µg/mL. The violet solution of DPPH was turned colorless within 30 min when mixed with different concentrations of C-AgNPs and ascorbic acid, which indicated the antioxidant activity of C-AgNPs and ascorbic acid that was confirmed by UV-Visible measurements. The obtained %scavenging values of C-AgNPs and ascorbic acid were plotted against concentration and are displayed in Figure 12. As can be seen, the %scavenging ability of both C-AgNPs and ascorbic acid was increased linearly with the increase of the concentration. Although ascorbic acid was able to neutralize DPPH radical to 100%, the scavenging potential of AgNPs reached 80% at 5 µg/mL. DPPH is nitrogen centered free radical which can accept or donate electrons as well as hydrogen radicals to convert into a stable diamagnetic molecule. Thus, the observed antioxidant activity of Cascabela thevetia aqueous leaf extract mediated C-AgNPs was attributed to the presence of hydroxyl and carboxyl groups on the surface of C-AgNPs, which are supposedly reducing agents, and to Ag0 as the Ag0 has the ability to donate one electron to become Ag+. The DPPH scavenging mechanism by nanoparticles either chemical or plant-based is extensively reviewed in various literature [75,76,77]. The results demonstrated the competitive antioxidant activity of C-AgNPs compared to ascorbic acid and therefore, can be used as a new natural alternative to already existing antioxidant agents for the treatment of oxidative stress-associated diseases.

3.12. Catalytic Reduction of Textile Dyes

The synthesized C-AgNPs exhibited strong catalytic activity in the reduction of two textile dyes such as methylene blue and rhodamine B according to the mechanism described in the literature [78,79,80]. Textile dyes are widely present in the environment because of their excessive discharge from various industries including, textile, paint, and paper. Being soluble in water, these dyes are particularly hard to eliminate from the environment such as wastewater, and therefore, posed continuous threats to public health. As a sustainable approach, the catalytic reduction of various textile dyes using nanoparticles (chemical or plant-derived) as a catalyst and NaBH4 as a reducing agent is extensively investigated. However, agglomeration of nanoparticles, which may result in poor catalytic activity, is an issue to address. Therefore, highly dispersed C-AgNPs were utilized as a catalyst in the reduction of methylene blue and rhodamine B to find a new alternative. The catalytic activity of C-AgNPs was investigated in the reduction of methylene blue and rhodamine B with NaBH4 and monitored spectrophotometrically. The obtained results are compared in Figure 13, where no reduction, either for methylene blue or rhodamine B, was observed in the absence of NaBH4 until 2–3 h and the solution mixtures retained their color without any obvious change. However, with NaBH4 alone, the dyes showed some reductions but took a considerably longer time, and also the reactions were incomplete, as can be seen in Figure 13. When C-AgNPs and NaBH4 were introduced with methylene blue and rhodamine B, separately, the reduction of dyes occurred within no time as confirmed by the discoloration of the solutions and the absence of the absorption peaks in the UV-Visible spectrum of methylene blue and rhodamine B. The results affirmed that C-AgNPs play an important role in the reduction of methylene blue and rhodamine B, and the catalytic ability of C-AgNPs is comparable to that reported before [33,34]. Mechanistically, in the absence of C-AgNPs, alone NaBH4 can not reduce methylene blue or rhodamine B, however, together they both could catalytically convert methylene blue and rhodamine B to the corresponding low molecular weight derivatives. The C-AgNPs surface acts as a catalyst facilitator, which can carry electrons from the NaBH4 to the dyes and overcome the kinetic barrier, which resulted in the hydrogenation of methylene blue into leuco-methylene blue and de-ethylation of rhodamine B at the -N(C2H5)2 site into aromatic amines, respectively [78,79,80]. Thus, Cascabela thevetia aqueous leaf extract mediated C-AgNPs as potential candidates can be successfully employed for the catalytic reduction of textile dyes.

4. Conclusions

In summary, the green synthesis of C-AgNPs using an aqueous leaf extract of the medicinally important plant Cascabela thevetia is successfully demonstrated. The thorough characterization revealed that the resulting C-AgNPs were spherical in shape, sized in the 20–30 nm range, highly dispersed in an aqueous solution, and capped with carboxyl groups of gallic acid. The agar well diffusion assay established the appreciable antibacterial and antifungal activities of C-AgNPs against three Gram-positive bacteria MRSA, S. aureus, E. faecalis, four Gram-negative bacteria E. coli, S. typhimurium, K. pneumoniae, P. aeruginosa, and two fungal strains C. albicans and C. parapsilosis. The MIC values of C-AgNPs obtained for S. aureus, E. faecalis and E. coli were in the range of 13.5-27 µg/mL, whereas the growth behavior curves showed the bactericidal effects of C-AgNPs for the same three bacteria at double the MIC values Moreover, the antioxidant and catalytic experiments confirmed scavenging ability of C-AgNPs up to 80%, compared to ascorbic acid, and catalytic activity for the removal of methylene blue and rhodamine B textile dyes from the wastewater.

Author Contributions

A.N.K.: Conceptualization, Supervision, Methodology, Investigation, Writing—original draft, Writing—reviewing & editing. N.N.A.A.: Methodology, Investigation, Writing—original draft. H.S.S.A.: Administration, Resources, Writing—reviewing & editing. M.A.: Investigation, Software, Resources. W.A.B.: Resources, Methodology. A.H.: Investigation, Writing—reviewing & editing. M.T.S.: Conceptualization, Supervision, Methodology, Resources, Writing—original draft, Writing—reviewing & editing. All authors have read and agreed to the published version of the manuscript.

Funding

This research received no external funding.

Data Availability Statement

Data will be made available from the corresponding author on request.

Acknowledgments

The authors would like to acknowledge the Department of Chemistry, Center of Excellence in Environmental Studies (CEES) and King Fahad Medical Research Center, King Abdualziz University, and Ministry of Higher Education, Kingdom of Saudi Arabia, for providing all the facilities to carry out this research work.

Conflicts of Interest

The authors declare no conflict of interest.

References

  1. Durán, N.; Durán, M.; De Jesus, M.B.; Seabra, A.B.; Fávaro, W.J.; Nakazato, G. Silver nanoparticles: A new view on mechanistic aspects on antimicrobial activity. Nanomed.: Nanotechnol. Biol. Med. 2016, 12, 789–799. [Google Scholar] [CrossRef] [PubMed]
  2. Al-Otibi, F.; Alkhudhair, S.K.; Alharbi, R.I.; Al-Askar, A.A.; Aljowaie, R.M.; Al-Shehri, S. The antimicrobial activities of silver nanoparticles from aqueous extract of grape seeds against pathogenic bacteria and fungi. Molecules 2021, 26, 6081. [Google Scholar] [CrossRef] [PubMed]
  3. Urnukhsaikhan, E.; Bold, B.E.; Gunbileg, A.; Sukhbaatar, N.; Mishig-Ochir, T. Antibacterial activity and characteristics of silver nanoparticles biosynthesized from Carduus crispus. Sci. Rep. 2021, 11, 21047. [Google Scholar] [CrossRef] [PubMed]
  4. Chahar, V.; Sharma, B.; Shukla, G.; Srivastava, A.; Bhatnagar, A. Study of antimicrobial activity of silver nanoparticles synthesized using green and chemical approach. Colloids Surf. A Physicochem. Eng. Asp. 2018, 554, 149–155. [Google Scholar] [CrossRef]
  5. Shalaby, T.I.; Mahmoud, O.A.; El Batouti, G.A.; Ibrahim, E.E. Green synthesis of silver nanoparticles: Synthesis, characterization and antibacterial activity. Nanosci. Nanotechnol. 2015, 5, 23–29. [Google Scholar]
  6. Sreelekha, E.; George, B.; Shyam, A.; Sajina, N.; Mathew, B. A comparative study on the synthesis, characterization, and antioxidant activity of green and chemically synthesized silver nanoparticles. BioNanoScience 2021, 11, 489–496. [Google Scholar] [CrossRef]
  7. Guan, Z.; Ying, S.; Ofoegbu, P.C.; Clubb, P.; Rico, C.; He, F.; Hong, J. Green synthesis of nanoparticles: Current developments and limitations. Environ. Technol. Innov. 2022, 26, 102336. [Google Scholar]
  8. Patra, J.K.; Baek, K.H. Green nanobiotechnology: Factors affecting synthesis and characterization techniques. J. Nanomater. 2014, 2014, 417305. [Google Scholar] [CrossRef]
  9. Jain, S.; Mehata, M.S. Medicinal plant leaf extract and pure flavonoid mediated green synthesis of silver nanoparticles and their enhanced antibacterial property. Sci. Rep. 2017, 7, 15867. [Google Scholar] [CrossRef]
  10. Hamouda, R.A.; Hussein, M.H.; Abo-Elmagd, R.A.; Bawazir, S.S. Synthesis and biological characterization of silver nanoparticles derived from the cyanobacterium Oscillatoria limnetica. Sci. Rep. 2019, 9, 13071. [Google Scholar] [CrossRef]
  11. Garibo, D.; Borbón-Nuñez, H.A.; de León, J.N.D.; García Mendoza, E.; Estrada, I.; Toledano-Magaña, Y.; Tiznado, H.; Ovalle-Marroquin, M.; Soto-Ramos, A.G.; Blanco, A.; et al. Green synthesis of silver nanoparticles using Lysiloma acapulcensis exhibit high-antimicrobial activity. Sci. Rep. 2020, 10, 12805. [Google Scholar] [CrossRef]
  12. Rafique, M.; Sadaf, I.; Rafique, M.S.; Tahir, M.B. A review on green synthesis of silver nanoparticles and their applications. Artif. Cells Nanomed. Biotechnol. 2017, 45, 1272–1291. [Google Scholar] [CrossRef]
  13. Mostafa, A.A.; Al-Askar, A.A.; Almaary, K.S.; Dawoud, T.M.; Sholkamy, E.N.; Bakri, M.M. Antimicrobial activity of some plant extracts against bacterial strains causing food poisoning diseases. Saudi J. Bio. Sci. 2018, 25, 361–366. [Google Scholar] [CrossRef]
  14. Chen, J.; Sun, Z.; Chen, J.; Luan, M. Metabolomic Profile and Antibacterial Bioactivity of Akebia trifoliata (Thunb.) Koidz Pericarp Extract. Processes 2022, 10, 1394. [Google Scholar] [CrossRef]
  15. Pradeep, M.; Kruszka, D.; Kachlicki, P.; Mondal, D.; Franklin, G. Uncovering the phytochemical basis and the mechanism of plant extract-mediated eco-friendly synthesis of silver nanoparticles using ultra-performance liquid chromatography coupled with a photodiode array and high-resolution mass spectrometry. ACS Sustain. Chem. Eng. 2021, 10, 562–571. [Google Scholar] [CrossRef]
  16. Salih, A.M.; Al-Qurainy, F.; Khan, S.; Tarroum, M.; Nadeem, M.; Shaikhaldein, H.O.; Gaafar, A.-R.Z.; Alfarraj, N.S. Biosynthesis of zinc oxide nanoparticles using Phoenix dactylifera and their effect on biomass and phytochemical compounds in Juniperus procera. Sci. Rep. 2021, 11, 19136. [Google Scholar] [CrossRef]
  17. Tomilova, S.V.; Kitashov, A.V.; Nosov, A.M. Cardiac Glycosides: Distribution, Properties and Specificity of Formation in Plant Cell and Organ Cultures In Vitro. Russ. J. Plant Physiol. 2022, 69, 41. [Google Scholar] [CrossRef]
  18. González-Stuart, A.E.; Rivera, J.O. Herbal weight loss supplements: From dubious efficacy to direct toxicity. In Dietary Interventions in Liver Disease; Academic Press: Cambridge, MA, USA, 2019; pp. 175–181. [Google Scholar]
  19. Lavecchia, T.; Rea, G.; Antonacci, A.; Giardi, M.T. Healthy and adverse effects of plant-derived functional metabolites: The need of revealing their content and bioactivity in a complex food matrix. Crit. Rev. Food Sci. Nutr. 2013, 53, 198–213. [Google Scholar] [CrossRef]
  20. Twaij, B.M.; Hasan, M.N. Bioactive Secondary Metabolites from Plant Sources: Types, Synthesis, and Their Therapeutic Uses. Int. J. Plant Biol. 2022, 13, 4–14. [Google Scholar] [CrossRef]
  21. Mahomoodally, M.F.; Gurib-Fakim, A.; Subratty, A.H. Antimicrobial activities and phytochemical profiles of endemic medicinal plants of Mauritius. Pharm. Biol. 2005, 43, 237–242. [Google Scholar] [CrossRef]
  22. Manandhar, S.; Luitel, S.; Dahal, R.K. In vitro antimicrobial activity of some medicinal plants against human pathogenic bacteria. J. Trop. Med. 2019, 2019, 1895340. [Google Scholar] [CrossRef] [PubMed]
  23. Srinivasan, D.; Nathan, S.; Suresh, T.; Perumalsamy, P.L. Antimicrobial activity of certain Indian medicinal plants used in folkloric medicine. J. Ethnopharmacol. 2001, 74, 217–220. [Google Scholar] [CrossRef]
  24. Ushimaru, P.I.; Silva, M.T.N.D.; Di Stasi, L.C.; Barbosa, L.; Fernandes Junior, A. Antibacterial activity of medicinal plant extracts. Braz. J. Microbiol. 2007, 38, 717–719. [Google Scholar] [CrossRef]
  25. Marasini, B.P.; Baral, P.; Aryal, P.; Ghimire, K.R.; Neupane, S.; Dahal, N.; Singh, A.; Ghimire, L.; Shrestha, K. Evaluation of antibacterial activity of some traditionally used medicinal plants against human pathogenic bacteria. BioMed Res. Int. 2015, 2015, 265425. [Google Scholar] [CrossRef]
  26. González-Stuart, A. Dangerous herbal weight-loss supplements. In Bioactive Food as Dietary Interventions for Liver and Gastrointestinal Disease, 1st ed.; Watson, R.R., Preedy, V.R., Eds.; Academic Press: Cambridge, MA, USA; Elsevier: Amsterdam, The Netherlands, 2013; p. 119. [Google Scholar]
  27. Kohls, S.; Scholz-Böttcher, B.M.; Teske, J.; Zark, P.; Rullkötter, J. Cardiac glycosides from Yellow Oleander (Thevetia peruviana) seeds. Phytochemistry 2012, 75, 114–127. [Google Scholar] [CrossRef]
  28. Zibbu, G.; Batra, A. Thevetia peruviana (Pers.) Schum.: A plant with enormous therapeutic potential. J. Pharm. Res. 2011, 4, 4461–4464. [Google Scholar]
  29. Falih, H.Y.; Nasser, N.M.; Jasiem, T.M. Pharmacognostical Study and Antibacterial Activity of Cardio Active Glycoside of Iraqi Yellow Oleander (Thevetia Peruviana L.). Indian J. Public Health Res. Dev. 2019, 10, 3128. [Google Scholar] [CrossRef]
  30. Pillay, V.V.; Sasidharan, A. Oleander and datura poisoning: An update. Indian J. Crit. Care Med. 2019, 23, S250–S255. [Google Scholar] [CrossRef]
  31. Yamane, H.; Konno, K.; Sabelis, M.; Takabayashi, J.; Sassa, T.; Oikawa, H. Chemical defence and toxins of plants. In Comprehensive Natural Products II: Chemistry and Biology; Elsevier: Amsterdam, The Netherlands, 2010; Volume 4, pp. 339–385. [Google Scholar]
  32. Botelho, A.F.M.; Pierezan, F.; Soto-Blanco, B.; Melo, M.M. A review of cardiac glycosides: Structure, toxicokinetics, clinical signs, diagnosis and antineoplastic potential. Toxicon 2019, 158, 63–68. [Google Scholar] [CrossRef]
  33. Bonigala, B.; YVV, A.K.; Kondabolu, U.L.; Poda, S. Ecofriendly Synthesis of Silver Nanoparticles by using Indian Plants and Screening their Catalytic Activity. Curr. Trends Biotechnol. Pharm. 2016, 10, 316–323. [Google Scholar]
  34. Bonigala, B.; Mangamuri, U.K.; Anuhya, G.; Saraswathi, Y.Y.; Rao, K.R.S.; Poda, S. Green Synthesis of Silver Nanoparticles using two Apocyanaceae plants and Screening for their Catalytic activity. Curr. Trends Biotechnol. Pharm. 2017, 11, 84–90. [Google Scholar]
  35. Oluwaniyi, O.O.; Adegoke, H.I.; Adesuji, E.T.; Alabi, A.B.; Bodede, S.O.; Labulo, A.H.; Oseghale, C.O. Biosynthesis of silver nanoparticles using aqueous leaf extract of Thevetia peruviana Juss and its antimicrobial activities. Appl. Nanosci. 2016, 6, 903–912. [Google Scholar] [CrossRef]
  36. Dias, M.C.; Pinto, D.C.; Silva, A.M. Plant flavonoids: Chemical characteristics and biological activity. Molecules 2021, 26, 5377. [Google Scholar] [CrossRef]
  37. Stobiecki, M. Application of mass spectrometry for identification and structural studies of flavonoid glycosides. Phytochemistry 2000, 54, 237–256. [Google Scholar] [CrossRef]
  38. Morehead, M.S.; Scarbrough, C. Emergence of global antibiotic resistance. Prim. Care Clin. Off. Pract. 2018, 45, 467–484. [Google Scholar] [CrossRef]
  39. Murray, C.J.; Ikuta, K.S.; Sharara, F.; Swetschinski, L.; Aguilar, G.R.; Gray, A.; Han, C.; Bisignano, C.; Rao, P.; Wool, E.; et al. Global burden of bacterial antimicrobial resistance in 2019: A systematic analysis. Lancet 2022, 399, 629–655. [Google Scholar] [CrossRef]
  40. Qadri, H.; Shah, A.H.; Andrabi, S.M.; Alshehri, B.; Almilaibary, A.; Mir, M.A. Natural Products And Their Semi-synthetic Derivatives Against Antimicrobial-resistant Human Pathogenic Bacteria and Fungi. Saudi J. Biol. Sci. 2022, 29, 103376. [Google Scholar] [CrossRef]
  41. Uddin, T.M.; Chakraborty, A.J.; Khusro, A.; Zidan, B.R.M.; Mitra, S.; Emran, T.B.; Dhama, K.; Ripon, K.H.; Gajdács, M.; Sahibzada, M.U.K.; et al. Antibiotic resistance in microbes: History, mechanisms, therapeutic strategies and future prospects. J. Infec. Public Health 2021, 14, 1750–1766. [Google Scholar] [CrossRef]
  42. Wahab, S.; Khan, T.; Adil, M.; Khan, A. Mechanistic aspects of plant-based silver nanoparticles against multi-drug resistant bacteria. Heliyon 2021, 7, e07448. [Google Scholar] [CrossRef]
  43. Skóra, B.; Krajewska, U.; Nowak, A.; Dziedzic, A.; Barylyak, A.; Kus-Liśkiewicz, M. Noncytotoxic silver nanoparticles as a new antimicrobial strategy. Sci. Rep. 2021, 11, 13451. [Google Scholar] [CrossRef]
  44. Chen, H.; Zuo, Y.; Deng, Y. Separation and determination of flavonoids and other phenolic compounds in cranberry juice by high-performance liquid chromatography. J. Chromatogr. 2001, 913, 387–395. [Google Scholar] [CrossRef]
  45. Bystrom, L.M.; Lewis, B.A.; Brown, D.L.; Rodriguez, E.; Obendorf, R.L. Characterisation of phenolics by LC–UV/Vis, LC–MS/MS and sugars by GC in Melicoccus bijugatus Jacq. ‘Montgomery’ fruits. Food Chem. 2008, 111, 1017–1024. [Google Scholar] [CrossRef] [PubMed]
  46. Feng, W.; Hao, Z.; Li, M. Isolation and structure identification of flavonoids. In Flavonoids, From Biosynthesis to Human Health; Justino, G.C., Ed.; IntechOpen: London, UK, 2017; pp. 17–43. [Google Scholar]
  47. El-Sawi, S.A.; Maamoun, A.A.; Salama, A.H.; Farghaly, A.A. Chemical profiling of Thevetia peruviana leaves cytotoxic active extracts enhanced by microemulsion formulation. Bull. Natl. Res. Cent. 2020, 44, 93. [Google Scholar] [CrossRef]
  48. Vankar, P.S.; Shukla, D. Spectrum of colors from reseda luteola and other natural yellow dyes. J. Tex. Eng. Fash. Technol. 2018, 4, 107–120. [Google Scholar] [CrossRef]
  49. Thilagavathi, R.; Kavitha, H.P.; Venkatraman, B.R. Isolation, characterization and anti-inflammatory property of Thevetia peruviana. J. Chem. 2010, 7, 1584–1590. [Google Scholar]
  50. Durán, M.D.L.; Zabala, M.E.A.; Londoño, G.A.C. Optimization of Flavonoid Production in Plant Cell Culture of Thevetia peruviana Elicited with Methyl Jasmonate and Salicylic Acid. Braz. Arch. Biol. Technol. 2021, 64, 2021210022. [Google Scholar] [CrossRef]
  51. Pinho, E.; Soares, G.; Henriques, M. Cyclodextrin modulation of gallic acid in vitro antibacterial activity. J. Incl. Phenom. Macrocycl. Chem. 2015, 81, 205–214. [Google Scholar] [CrossRef]
  52. Badhani, B.; Kakkar, R. DFT study of structural and electronic properties of gallic acid and its anions in gas phase and in aqueous solution. Struct. Chem. 2017, 28, 1789–1802. [Google Scholar] [CrossRef]
  53. Raza, M.A.; Shahwar, D.; Khan, T. Radical scavenging, proteases activities, and phenolics composition of bark extracts from 21 medicinal plants. J. Chem. 2015, 2015, 951840. [Google Scholar]
  54. Ramachandran, S.; Asokkumar, K.; Maheswari, M.U.; Ravi, T.K.; Sivashanmugam, A.T.; Saravanan, S.; Rajasekaran, A.; Dharman, J. Investigation of antidiabetic, antihyperlipidemic, and in vivo antioxidant properties of Sphaeranthus indicus Linn. in type 1 diabetic rats: An identification of possible biomarkers. Evid. Based Complementary Altern. Med. 2011, 2011, 571721. [Google Scholar] [CrossRef]
  55. Esmaeili, A.H.; Moghaddam, A.H.; Chaichi, M.J. Identification, determination, and study of antioxidative activities of hesperetin and gallic acid in hydro-alcoholic extract from flowers of Eriobotrya japonica (Lindl.). Avicenna J. Phytomedicine 2014, 4, 260. [Google Scholar]
  56. Manthey, J.A. Fourier transform infrared spectroscopic analysis of the polymethoxylated flavone content of orange oil residues. J. Agric. Food Chem. 2006, 54, 3215–3218. [Google Scholar] [CrossRef]
  57. Patle, T.K.; Shrivas, K.; Kurrey, R.; Upadhyay, S.; Jangde, R.; Chauhan, R. Phytochemical screening and determination of phenolics and flavonoids in Dillenia pentagyna using UV–vis and FTIR spectroscopy. Spectrochim. Acta A Mol. Biomol. Spectrosc. 2020, 242, 118717. [Google Scholar] [CrossRef]
  58. Chahardoli, A.; Hajmomeni, P.; Ghowsi, M.; Qalekhani, F.; Shokoohinia, Y.; Fattahi, A. Optimization of Quercetin-Assisted Silver Nanoparticles Synthesis and Evaluation of Their Hemocompatibility, Antioxidant, Anti-Inflammatory, and Antibacterial effects. Glob. Chall. 2021, 5, 2100075. [Google Scholar] [CrossRef]
  59. Bashami, R.M.; Soomro, M.T.; Khan, A.N.; Aazam, E.S.; Ismail, I.M.; El-Shahawi, M.S. A highly conductive thin film composite based on silver nanoparticles and malic acid for selective electrochemical sensing of trichloroacetic acid. Anal. Chim. Acta 2018, 1036, 33–48. [Google Scholar] [CrossRef]
  60. Yazdanshenas, M.E.; Mohammad, S.-K. The effect of alkali pre-treatment on formation and adsorption of silver nanoparticles on cotton surface. Fibers Polym. 2012, 13, 1170–1178. [Google Scholar] [CrossRef]
  61. Tan, M.; Choi, Y.; Kim, J.; Kim, J.-H.; Fromm, K.M. Polyaspartamide functionalized catechol-based hydrogels embedded with silver nanoparticles for antimicrobial properties. Polymers 2018, 10, 1188. [Google Scholar] [CrossRef]
  62. Naseer, F.; Zahir, E.; Danish, E.Y.; Gull, M.; Noman, S.; Soomro, M.T. Superior antibacterial activity of reduced graphene oxide upon decoration with iron oxide nanorods. J. Environ. Chem. Eng. 2020, 8, 104424. [Google Scholar] [CrossRef]
  63. Brandelli, A. The interaction of nanostructured antimicrobials with biological systems: Cellular uptake, trafficking and potential toxicity. Food Sci. Hum. Wellness 2020, 9, 8–20. [Google Scholar] [CrossRef]
  64. Vijayakumar, G.; Kesavan, H.; Kannan, A.; Arulanandam, D.; Kim, J.H.; Kim, K.J.; Sogn, H.J.; Kim, H.J.; Rangarajulu, S.K. Phytosynthesis of copper nanoparticles using extracts of spices and their antibacterial properties. Processes 2021, 9, 1341. [Google Scholar] [CrossRef]
  65. Anand, U.; Carpena, M.; Kowalska-Góralska, M.; Garcia-Perez, P.; Sunita, K.; Bontempi, E.; Dey, A.; Prieto, M.A.; Prockow, J.; Simal-Gandara, J. Safer plant-based nanoparticles for combating antibiotic resistance in bacteria: A comprehensive review on its potential applications, recent advances, and future perspective. Sci. Total Environ. 2022, 821, 153472. [Google Scholar] [CrossRef]
  66. Al-Qasmi, N.; Soomro, M.T.; Aslam, M.; Rehman, A.U.; Ali, S.; Danish, E.Y.; Ismail, I.M.I.; Hameed, A. The efficacy of the ZnO:α-Fe2O3 composites modified carbon paste electrode for the sensitive electrochemical detection of loperamide: A detailed investigation. J. Electroanal. Chem. 2016, 783, 112–124. [Google Scholar] [CrossRef]
  67. Aslam, M.; Qamar, M.T.; Ali, S.; Rehman, A.U.; Soomro, M.T.; Ahmed, I.; Ismail, I.M.I.; Hameed, A. Evaluation of SnO2 for sunlight photocatalytic decontamination of water. J. Environ. Manag. 2018, 217, 805–814. [Google Scholar] [CrossRef]
  68. Singh, P.; Mijakovic, I. Antibacterial Effect of Silver Nanoparticles Is Stronger If the Production Host and the Targeted Pathogen Are Closely Related. Biomedicines 2022, 10, 628. [Google Scholar] [CrossRef]
  69. Alahmad, A.; Al-Zereini, W.A.; Hijazin, T.J.; Al-Madanat, O.Y.; Alghoraibi, I.; Al-Qaralleh, O.; Al-Qaraleh, S.; Feldhoff, A.; Walter, J.-G.; Scheper, T. Green Synthesis of Silver Nanoparticles Using Hypericum perforatum L. Aqueous Extract with the Evaluation of Its Antibacterial Activity against Clinical and Food Pathogens. Pharmaceutics 2022, 14, 1104. [Google Scholar] [CrossRef]
  70. Naveed, M.; Batool, H.; Javed, A.; Makhdoom, S.I.; Aziz, T.; Mohamed, A.A.; Sameeh, M.Y.; Alruways, M.W.; Dablool, A.S.; Almalki, A.A.; et al. Characterization and Evaluation of the Antioxidant, Antidiabetic, Anti-Inflammatory, and Cytotoxic Activities of Silver Nanoparticles Synthesized Using Brachychiton populneus Leaf Extract. Processes 2022, 10, 1521. [Google Scholar] [CrossRef]
  71. Cowen, L.E.; Sanglard, D.; Howard, S.J.; Rogers, P.D.; Perlin, D.S. Mechanisms of antifungal drug resistance. Cold Spring Harb. Perspect. Med. 2015, 5, a019752. [Google Scholar] [CrossRef]
  72. Kumari, M.; Giri, V.P.; Pandey, S.; Kumar, M.; Katiyar, R.; Nautiyal, C.S.; Mishra, A. An insight into the mechanism of antifungal activity of biogenic nanoparticles than their chemical counterparts. Pestic. Biochem. Physiol. 2019, 157, 45–52. [Google Scholar] [CrossRef]
  73. Mansoor, S.; Zahoor, I.; Baba, T.R.; Padder, S.A.; Bhat, Z.A.; Koul, A.M.; Jiang, L. Fabrication of silver nanoparticles against fungal pathogens. Front. Nanotech. 2021, 3, 679358. [Google Scholar] [CrossRef]
  74. Padhi, S.; Behera, A. Silver-based nanostructures as antifungal agents: Mechanisms and applications. In Silver Nanomaterials for Agri-Food Applications; Abd-Elsalam, K.A., Ed.; Elsevier: Amsterdam, The Netherlands, 2021; pp. 17–38. [Google Scholar]
  75. de Torre, M.P.; Cavero, R.Y.; Calvo, M.I.; Vizmanos, J.L. A simple and a reliable method to quantify antioxidant activity in vivo. Antioxidants 2019, 8, 142. [Google Scholar] [CrossRef]
  76. Liang, N.; Kitts, D.D. Antioxidant property of coffee components: Assessment of methods that define mechanisms of action. Molecules 2014, 19, 19180–19208. [Google Scholar] [CrossRef] [PubMed]
  77. Xiao, F.; Xu, T.; Lu, B.; Liu, R. Guidelines for antioxidant assays for food components. Food Front. 2020, 1, 60–69. [Google Scholar] [CrossRef]
  78. Ismail, M.; Khan, M.I.; Khan, S.B.; Akhtar, K.; Khan, M.A.; Asiri, A.M. Catalytic reduction of picric acid, nitrophenols and organic azo dyes via green synthesized plant supported Ag nanoparticles. J. Mol. Liq. 2018, 268, 87–101. [Google Scholar] [CrossRef]
  79. Ajitha, B.; Reddy, Y.A.K.; Lee, Y.; Kim, M.J.; Ahn, C.W. Biomimetic synthesis of silver nanoparticles using Syzygium aromaticum (clove) extract: Catalytic and antimicrobial effects. Appl. Organomet. Chem. 2019, 33, e4867. [Google Scholar] [CrossRef]
  80. Hu, M.; Yan, X.; Hu, X.; Feng, R.; Zhou, M. Synthesis of silver decorated silica nanoparticles with rough surfaces as adsorbent and catalyst for methylene blue removal. J. Sol-Gel Sci. Technol. 2019, 89, 754–763. [Google Scholar] [CrossRef]
Figure 1. (a) Cascabela thevetia plant and (b) Cascabela thevetia leaves.
Processes 10 01949 g001
Figure 2. (A) Cascabela thevetia aqueous leaf extract color (E), and color transformation after mixing with AgNO3 solution at (a) 0 time, (b) after 30 min, and (c) after 60 min, and (B) UV-Vis absorption spectra of Cascabela thevetia aqueous leaf extract alone and with AgNO3 at 0, 30, and 60 min time interval.
Processes 10 01949 g002
Figure 3. HPLC chromatograms of standard gallic acid and Cascabela thevetia aqueous leaf extract color.
Processes 10 01949 g003
Scheme 1. Schematic illustration of Ag+ ions reduction into C-AgNPs by the gallic acid identified in Cascabela thevetia aqueous leaf extract.
Processes 10 01949 sch001
Figure 4. (a) FTIR spectra of Cascabela thevetia aqueous leaf extract and C-AgNPs, and (b) XRD pattern of C-AgNPs where Bragg reflections were matched exactly with face-centered cubic lattice structure of Ag. The peaks with steric were unassigned. The steric represents unidentified peaks probably due to unreacted carboxyl groups of gallic acid.
Processes 10 01949 g004aProcesses 10 01949 g004b
Figure 5. FESEM images of C-AgNPs at (a) 25,000×, (b) 50,000×, (c) 75,000× and (d) 100,000× magnification, (e) C-AgNPs size determination by adding scale bar on them, and (f) particle size distribution analysis.
Processes 10 01949 g005aProcesses 10 01949 g005b
Figure 6. The comparison of TEM images of C-AgNPs at various magnifications showing morphology and particle size distribution.
Processes 10 01949 g006
Figure 7. The inhibition zones of C-AgNPs against (a) MRSA, (b) S. aureus, (c) E. faecalis, (d) E. coli, (e) S. typhimurium, (f) K. pneumoniae, and (g) P. aeruginosa, and in (h) Cascabela thevetia aqueous leaf extract antibacterial activity test against the same seven bacterial pathogens. The zones of inhibition formed by Ciprofloxacin and Kanamycin against MRSA are shown in (i,j), respectively, whereas Kanamycin’s ineffectiveness against K. pneumoniae and P. aeruginosa are demonstrated in (k,l), separately.
Processes 10 01949 g007aProcesses 10 01949 g007b
Figure 8. (a) Measurements of the zone of inhibition diameters at 108, 216, and 432 µg/mL concentrations of C-AgNPs against the MRSA, S. aureus, E. faecalis, E. coli, S. typhimurium, K. pneumoniae, and P. aeruginosa, and (b) bar graph representation.
Processes 10 01949 g008
Figure 9. Produced zones of inhibition of C-AgNPs against C. albicans and C. parapsilosis at three different concentrations, 108, 216, and 432 µg/mL, respectively.
Processes 10 01949 g009
Figure 10. Images of MIC experiments that were conducted with a 96-well round-bottom microtiter plate using a resazurin redox indicator. The concentrations of C-AgNPs were 54, 27, 13.5, 6.76, 3.38, 1.69, 0.84, 0.42, 0.21 and 0.105 µg/mL, respectively, that were labelled as 1–10, where 1 was a higher concentration and 10 was a lower.
Processes 10 01949 g010
Figure 11. Growth curves of (a) S. aureus, (b) E. faecalis, and (c) E. coli as a function of C-AgNPs concentration.
Processes 10 01949 g011aProcesses 10 01949 g011b
Figure 12. Comparison of antioxidant activity of ascorbic acid and C-AgNPs by DPPH assay.
Processes 10 01949 g012
Figure 13. UV-Visible spectra of catalytic reductions of (a) methylene blue and (b) rhodamine B, alone, with C-AgNPs and NaBH4 separately, and with both C-AgNPs and NaBH4.
Processes 10 01949 g013
Table 1. The estimation of the zone of inhibition diameters formed by C-AgNPs against the tested bacterial and fungal pathogens.
MicroorganismsZone of Inhibition (mm)
Cascabela thevetia Aqueous Leaf ExtractC-AgNPs
100 µL108 µg/mL216 µg/mL432 µg/mL
MRSA-14 ± 0.411 ± 0.116 ± 0.4
S. aureus-14 ± 0.315 ± 0.616 ± 0.5
E. faecalis-12 ± 0.815 ± 0.414 ± 0.1
E. coli-12 ± 0.113 ± 0.114 ± 0.3
S. tyhpimurium-13 ± 0.715 ± 0.215 ± 0.7
K. pheumoniae-12 ± 0.113 ± 0.914 ± 0.3
P. aeruginosa-13 ± 0.213 ± 0.113 ± 0.6
C. albicans-11 ± 0.812 ± 0.418 ± 0.9
C. parapsilosis-15 ± 0.716 ± 0.619 ± 0.4
Table 2. MIC values were obtained for C-AgNPs.
Bacterial PathogensC-AgNPs (µg/mL)
542713.56.753.381.690.840.420.210.105
S. aureus++++++++
E. faecalis+++++++
E. coli++++++++
Key: − there is inhibition, + no inhibition.
Publisher’s Note: MDPI stays neutral with regard to jurisdictional claims in published maps and institutional affiliations.

