


Motor Competence Assessment (MCA) Scoring Method
 , , , and
Abstract
:1. Introduction
2. Materials and Methods
2.1. Participants
2.2. Instruments and Procedures
2.3. Statistical Analysis
3. Results
4. Discussion
5. Practical Implications
6. Conclusions
Author Contributions
Funding
Institutional Review Board Statement
Informed Consent Statement
Data Availability Statement
Conflicts of Interest
References
- Barnett, L.M.; Morgan, P.J.; van Beurden, E.; Beard, J.R. Perceived Sports Competence Mediates the Relationship between Childhood Motor Skill Proficiency and Adolescent Physical Activity and Fitness: A Longitudinal Assessment. Int. J. Behav. Nutr. Phys. Act. 2008, 5, 40. [Google Scholar] [CrossRef] [PubMed] [Green Version]
- Chagas, D.V.; Marinho, B. Exploring the Importance of Motor Competence for Behavioral and Health Outcomes in Youth. Percept. Mot. Ski. 2021, 128, 2544–2560. [Google Scholar] [CrossRef] [PubMed]
- Lima, R.A.; Bugge, A.; Ersbøll, A.K.; Stodden, D.F.; Andersen, L.B. The longitudinal relationship between motor competence and measures of fatness and fitness from childhood into adolescence. J. Pediatr. 2019, 95, 482–488. [Google Scholar] [CrossRef] [PubMed]
- Barnett, L.M.; Webster, E.K.; Hulteen, R.M.; De Meester, A.; Valentini, N.C.; Lenoir, M.; Pesce, C.; Getchell, N.; Lopes, V.P.; Robinson, L.E.; et al. Through the Looking Glass: A Systematic Review of Longitudinal Evidence, Providing New Insight for Motor Competence and Health. Sports Med. 2022, 52, 875–920. [Google Scholar] [CrossRef] [PubMed]
- Leonard, H.C.; Hill, E.L. Review: The Impact of Motor Development on Typical and Atypical Social Cognition and Language: A Systematic Review. Child Adolesc. Ment. Health 2014, 19, 163–170. [Google Scholar] [CrossRef]
- Robinson, L.E.; Stodden, D.F.; Barnett, L.M.; Lopes, V.P.; Logan, S.W.; Rodrigues, L.P.; D’Hondt, E. Motor Competence and Its Effect on Positive Developmental Trajectories of Health. Sports Med. 2015, 45, 1273–1284. [Google Scholar] [CrossRef]
- De Meester, A.; Barnett, L.M.; Brian, A.; Bowe, S.J.; Jiménez-Díaz, J.; Van Duyse, F.; Irwin, J.M.; Stodden, D.F.; D’Hondt, E.; Lenoir, M.; et al. The Relationship Between Actual and Perceived Motor Competence in Children, Adolescents and Young Adults: A Systematic Review and Meta-Analysis. Sports Med. 2020, 50, 2001–2049. [Google Scholar] [CrossRef]
- Rodrigues, L.P.; Cordovil, R.; Luz, C.; Lopes, V.P. Model Invariance of the Motor Competence Assessment (MCA) from Early Childhood to Young Adulthood. J. Sports Sci. 2021, 39, 2353–2360. [Google Scholar] [CrossRef]
- Luz, C.; Rodrigues, L.P.; Almeida, G.; Cordovil, R. Development and Validation of a Model of Motor Competence in Children and Adolescents. J. Sci. Med. Sport 2016, 19, 568–572. [Google Scholar] [CrossRef]
- Rodrigues, L.P.; Luz, C.; Cordovil, R.; Bezerra, P.; Silva, B.; Camões, M.; Lima, R. Normative Values of the Motor Competence Assessment (MCA) from 3 to 23 Years of Age. J. Sci. Med. Sport 2019, 22, 1038–1043. [Google Scholar] [CrossRef]
- Sigmundsson, H.; Lorås, H.; Haga, M. Assessment of Motor Competence Across the Life Span: Aspects of Reliability and Validity of a New Test Battery. SAGE Open 2016, 6, 2158244016633273. [Google Scholar] [CrossRef] [Green Version]
- Coppens, E.; Laureys, F.; Mostaert, M.; D’Hondt, E.; Deconinck, F.J.A.; Lenoir, M. Validation of a Motor Competence Assessment Tool for Children and Adolescents (KTK3+) With Normative Values for 6- to 19-Year-Olds. Front. Physiol. 2021, 12, 652952. [Google Scholar] [CrossRef] [PubMed]
- Folio, M.R.; Fewell, R.R. Peabody Developmental Motor Scales, 2nd ed.; Pearson’s Clinical Assessment: San Antonio TX, USA, 2000. [Google Scholar]
- Ulrich, D.A. Test of Gross Motor Development, 3rd ed.; Pro-Ed: Austin, TX, USA, 2016. [Google Scholar]
- Henderson, S.E.; Sugden, D.A.; Barnett, A.L. Movement Assessment Battery for Children-2, 2nd ed.; The Psychological Corporation: London, UK, 2007. [Google Scholar]
- Luz, C.; Cordovil, R.; Rodrigues, L.P.; Gao, Z.; Goodway, J.D.; Sacko, R.S.; Nesbitt, D.R.; Ferkel, R.C.; True, L.K.; Stodden, D.F. Motor competence and health-related fitness in children: A cross-cultural comparison between Portugal and the United States. J. Sport Health Sci. 2019, 8, 130–136. [Google Scholar] [CrossRef] [PubMed]
- Silva, A.F.; Nobari, H.; Badicu., G.; Ceylan, H.I.; Lima, R.; Lagoa, M.J.; Luz, C.; Clemente, F.M. Reliability levels of motor competence in youth athletes. BMC Pediatr. 2022, 20, 430. [Google Scholar] [CrossRef]
- Sá, C.D.S.C.D.; Luz, C.; Pombo, A.; Rodrigues, L.P.; Cordovil, R. Motor Competence in Children With and Without Ambliopia. Percept. Mot. Skills 2021, 128, 746–765. [Google Scholar] [CrossRef]
- Gabbard, C. Lifelong Motor Development, 7th ed.; Wolters Kluwer: Philadelphia, PA, USA, 2018. [Google Scholar]
- Goodway, J.D.; Ozmun, J.C.; Gallahue, D.L. Understanding Motor Development: Infants, Children, Adolescents, Adults; Jones & Bartlett Learning: Burlington, MA, USA, 2019. [Google Scholar]
- World Medical Association. World Medical Association Declaration of Helsinki. Ethical Principles for Medical Research Involving Human Subjects. Bull. World Health Organ. 2001, 79, 373. [Google Scholar]
- Iivonen, S.; Sääkslahti, A.; Laukkanen, A. A review of studies using the körperkoordinationstest für kinder (ktk). Eur. J. Adapt. Phys. Act. 2015, 8, 18–36. [Google Scholar] [CrossRef] [Green Version]
- AAHPER. Aapher Youth Fitness Test Manual; American Alliance for Health, Physical Education, and Recreation: Washington DC, USA, 1975. [Google Scholar]
- Fernandez-Santos, J.R.; Ruiz, J.R.; Cohen, D.D.; Gonzalez-Montesinos, J.L.; Castro-Piñero, J. Reliability and validity of tests to assess lower-body muscular power in children. J. Strength Cond. Res. 2015, 29, 2277–2285. [Google Scholar] [CrossRef]
- Moreira, J.; Lopes, M.C.; Miranda-Júnior, M.V.; Valentini, N.C.; Lage, G.M.; Albuquerque, M.R. Körperkoordinationstest Für Kinder (KTK) for Brazilian Children and Adolescents: Factor Analysis, Invariance and Factor Score. Front. Psychol. 2019, 10, 2524. [Google Scholar] [CrossRef]
- Nevill, A.M.; Atkinson, G. Assessing Agreement between Measurements Recorded on a Ratio Scale in Sports Medicine and Sports Science. Br. J. Sports Med. 1997, 31, 314–318. [Google Scholar] [CrossRef] [Green Version]
- Bland, J.M.; Altman, D.G. Statistical Methods for Assessing Agreement between Two Methods of Clinical Measurement. Antimicrob. Agents Chemother. 1986, 2, 307–310. [Google Scholar] [CrossRef]


| Weighted Age Group Model | Overall Model | Configural Model | ||||||
|---|---|---|---|---|---|---|---|---|
| 3 to 6 | 7 to 10 | 11 to 16 | 17 to 22 | |||||
| Stability | LJ | 0.86 | 0.85 | 0.77 | 0.73 | 0.94 | 1 | |
| SP | 0.90 | 0.59 | 0.82 | 0.66 | 0.93 | 1 | ||
| Locomotor | SLJ | 0.89 | 0.63 | 0.94 | 0.88 | 0.94 | 1 | |
| SHR | −0.82 | −0.86 | −0.86 | −0.79 | 0.89 | 1 | ||
| Manipulative | BKV | 0.82 | 0.85 | 0.89 | 0.93 | 0.97 | 1 | |
| BTV | 0.78 | 0.76 | 0.91 | 0.91 | 0.95 | 1 | ||
| Cronbach’s Alpha | Intraclass Correlation Coefficient | Bland–Altman | ||||
|---|---|---|---|---|---|---|
| Mean Bias (95%CI) | Lower Limit | Upper Limit | ||||
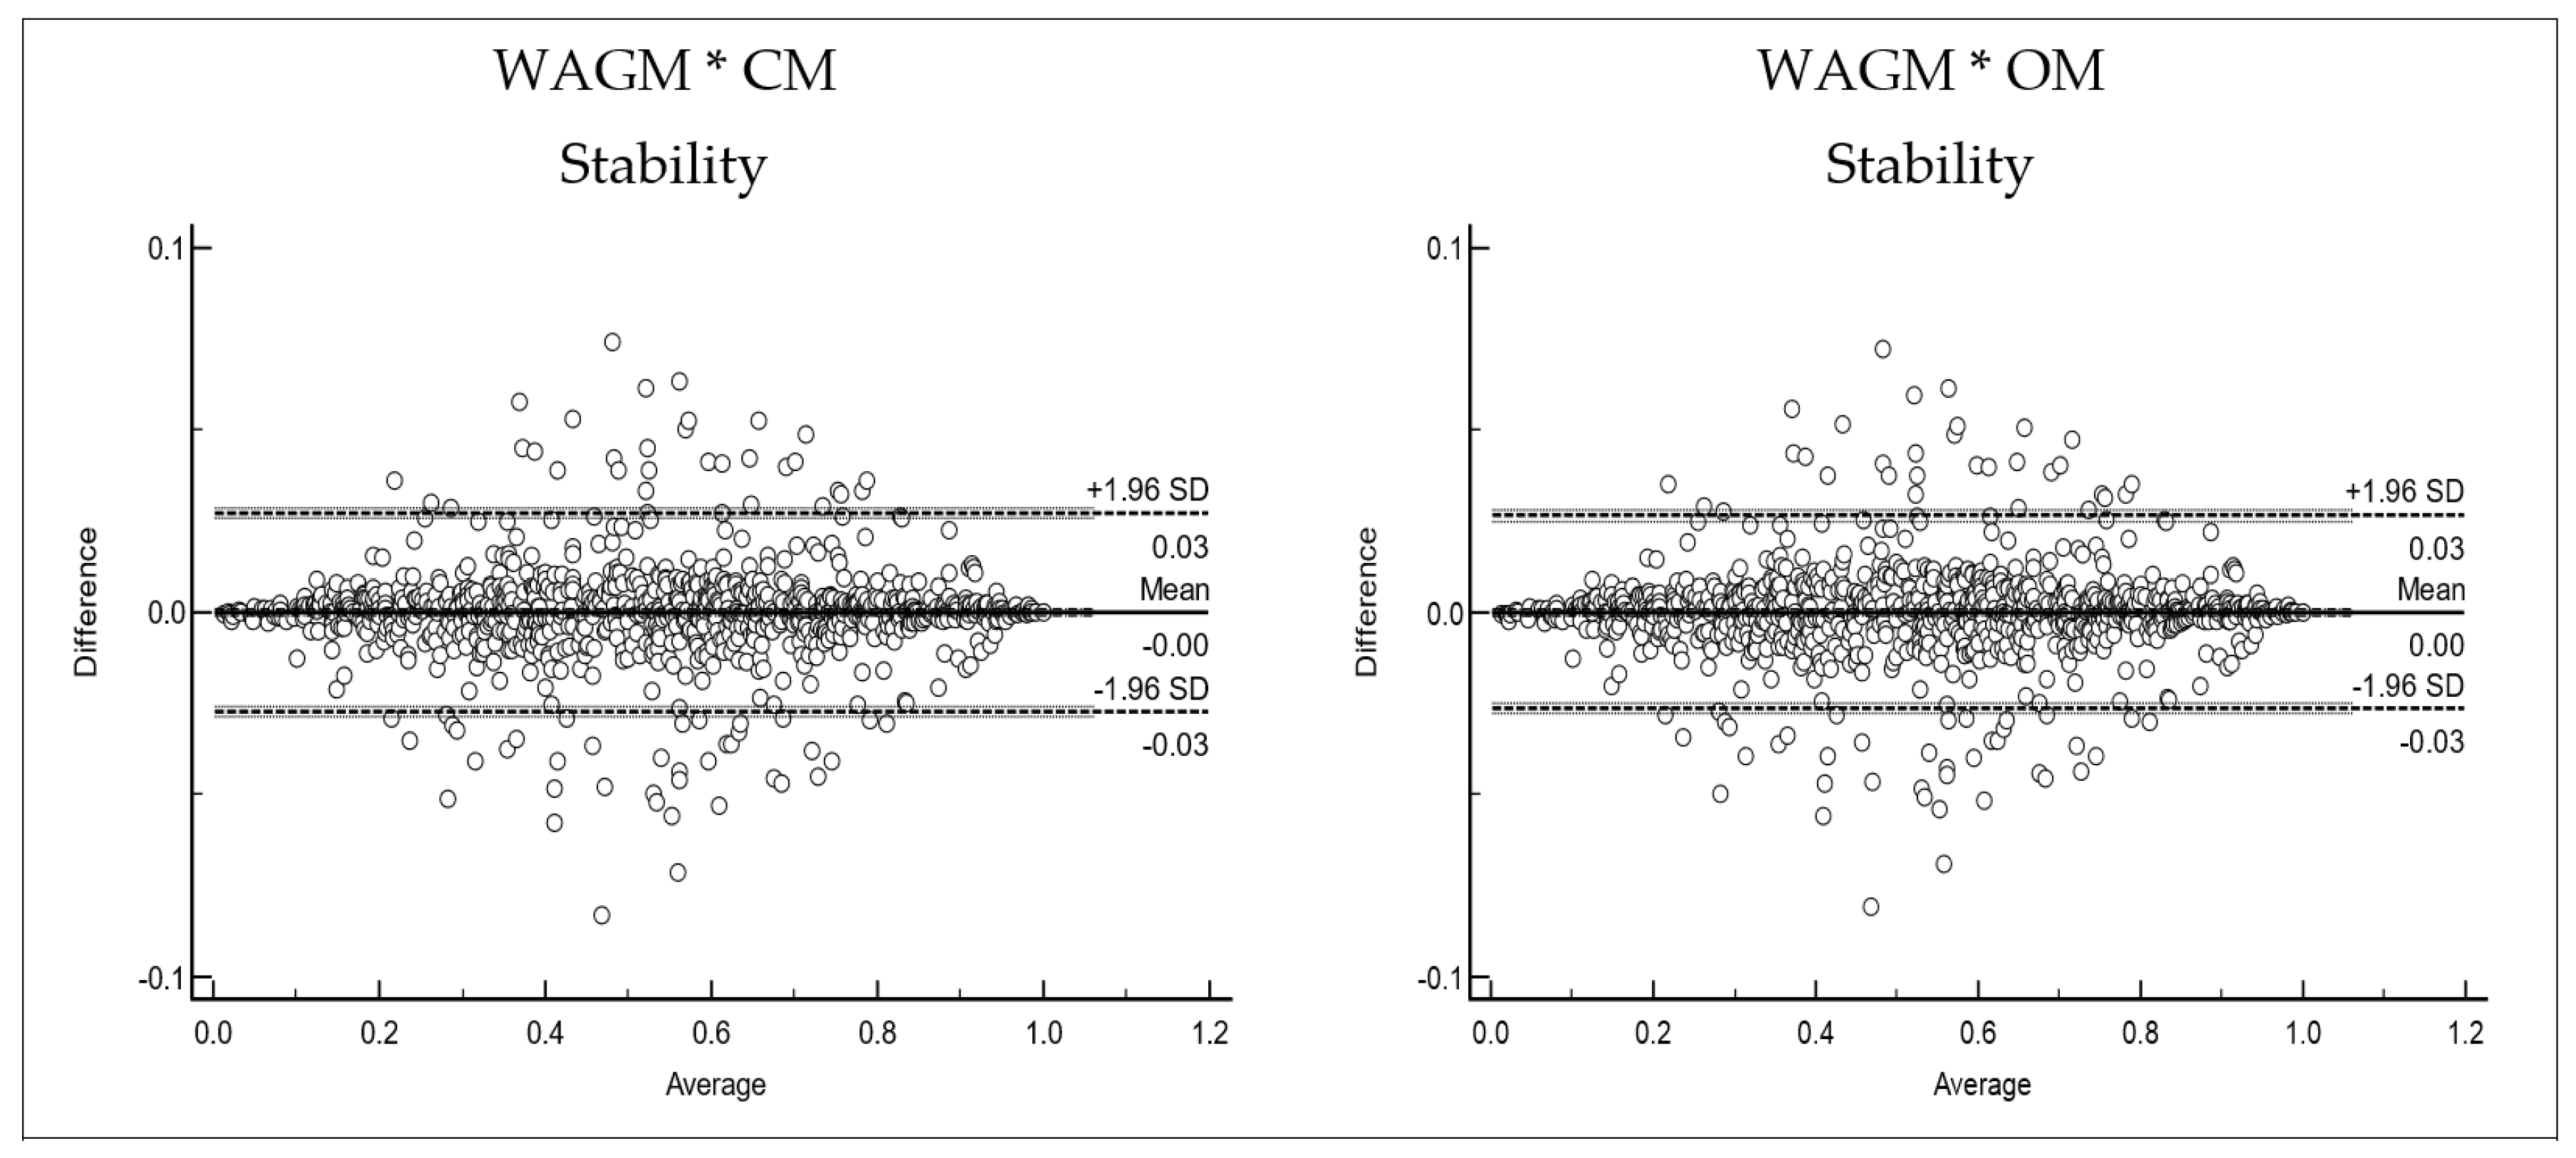
| Stability | ||||||
| WAGM * CM | 0.999 | 0.999 | 0.00001 (−0.0009 to 0.0009) | −0.0271 | 0.0271 | |
| WAGM * OM | 0.999 | 0.999 | −0.00006 (−0.0009 to 0.0008) | −0.0266 | 0.0264 | |
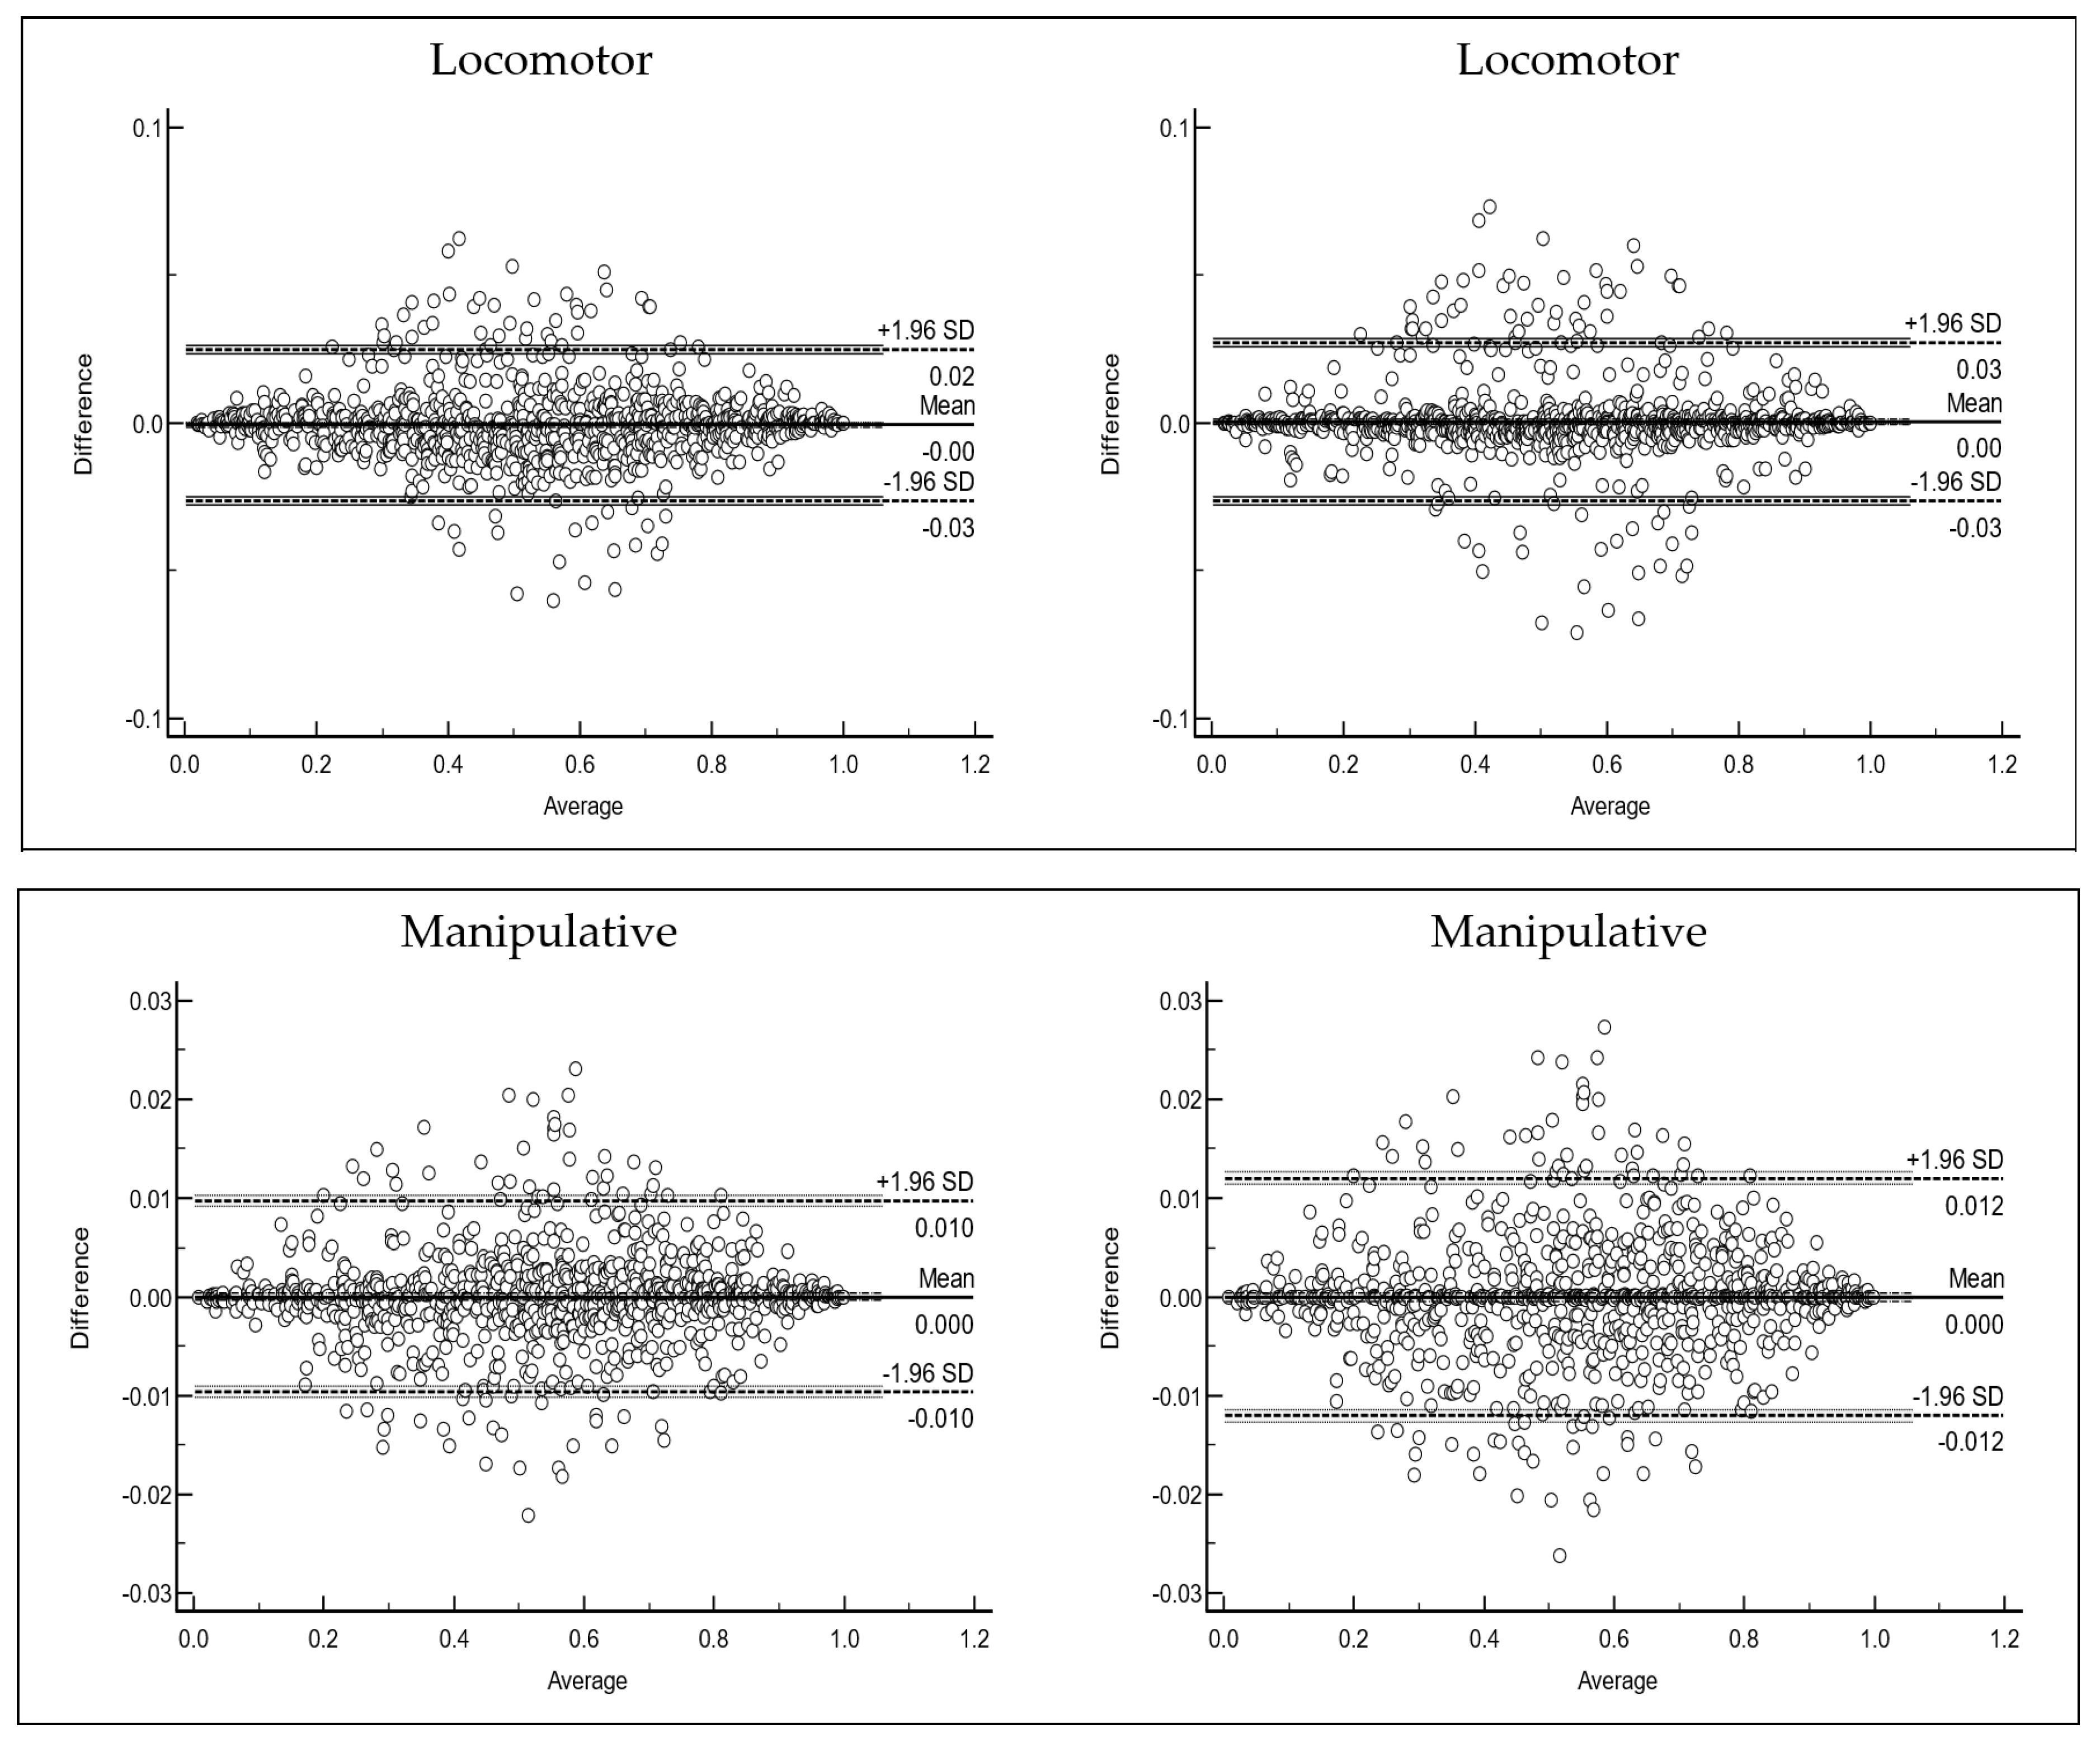
| Locomotor | ||||||
| WAGM * CM | 0.999 | 0.999 | −0.0006 (−0.0015 to 0.0001) | −0.0261 | 0.0248 | |
| WAGM * OM | 0.999 | 0.999 | 0.000500 (−0.0004 to 0.0013) | −0.0263 | 0.0272 | |
| Manipulative | ||||||
| WAGM * CM | 1.000 | 1.000 | −0.00007 (−0.0004 to 0.0002) | −0.0097 | 0.0096 | |
| WAGM * OM | 1.000 | 1.000 | −0.000006 (−0.0004 to 0.0004) | −0.012 | 0.012 | |
| Cronbach’s Alpha | Intraclass Correlation Coefficient | Bland–Altman | ||||
|---|---|---|---|---|---|---|
| Mean Bias (95%CI) | Lower Limit | Upper Limit | ||||
| Total MCA | ||||||
| WAGM * CM | 0.999 | 0.999 | −0.0006458 (−0.0010 to 0.000004) | −0.01779 | 0.01649 | |
| WAGM * OM | 1.000 | 1.000 | −0.0005122 (−0.0011 to −0.0001) | −0.01681 | 0.01578 | |
Publisher’s Note: MDPI stays neutral with regard to jurisdictional claims in published maps and institutional affiliations. |
© 2022 by the authors. Licensee MDPI, Basel, Switzerland. This article is an open access article distributed under the terms and conditions of the Creative Commons Attribution (CC BY) license (https://creativecommons.org/licenses/by/4.0/).
Share and Cite
Rodrigues, L.P.; Luz, C.; Cordovil, R.; Pombo, A.; Lopes, V.P. Motor Competence Assessment (MCA) Scoring Method. Children 2022, 9, 1769. https://doi.org/10.3390/children9111769
Rodrigues LP, Luz C, Cordovil R, Pombo A, Lopes VP. Motor Competence Assessment (MCA) Scoring Method. Children. 2022; 9(11):1769. https://doi.org/10.3390/children9111769
Chicago/Turabian StyleRodrigues, Luis Paulo, Carlos Luz, Rita Cordovil, André Pombo, and Vitor P. Lopes. 2022. "Motor Competence Assessment (MCA) Scoring Method" Children 9, no. 11: 1769. https://doi.org/10.3390/children9111769