
Targeting the Metabolic Paradigms in Cancer and Diabetes


Abstract
:1. Introduction
2. The Metabolic Shift in Cancer
2.1. Why Do Tumors Adopt Glycolysis over OXPHOS?
2.1.1. Reason 1: Mitochondrial Dysfunction

| Gene | Encoding DNA | Protein | Cycle | Reported Dysregulation in Cancer | Publications |
|---|---|---|---|---|---|
| Aco2 | Nuclear | Aconitase 2 | TCA (Krebs cycle) |
| [78,94] |
| IDH1 | Nuclear | Isocitrate Dehydrogenase 1 | TCA | Point mutations | [76,78,95,96,97,98,99] |
| SDH | Nuclear | Succinate Dehydrogenase | TCA and ETC cycles |
| [74,78,100,101,102,103,104,105,106,107,108] |
| FH | Nuclear | Fumarate Hydratase | TCA |
| [75,78,109,110,111,112,113] |
| Gene | Class | Genetic Alteration | Pathway Affected | Effects on OXPHOS (ETC Cycle) | Effect of Cancer Progression | References |
|---|---|---|---|---|---|---|
| MYC (MYC proto-oncogene protein) | Oncogene | Point mutation, amplification | TGF-β signaling pathway | Stimulates mitochondrial biogenesis and function through regulating the transcription factor A mitochondrial gene | Self-sufficiency in growth status | [78,114,115,116] |
| AKT (alpha serine/threonine kinase) | Oncogene | Point mutation, amplification, overexpression | AKT pathway |
| Evade apoptosis | [115,117,118] |
| P53 | Tumor suppressor gene | Point mutation, deletion | P53 pathway, cell cycle control: G2/M DNA damage checkpoint |
| Evade apoptosis, insensitivity to anti-growth signals | [115,119,120] |
| PI3K (phophatidylinositol-4,5-bisphosphate 3-kinase) | Tumor suppressor | Point mutation | AKT pathway |
| Evade apoptosis | [115,121] |
| PTEN (phosphatase and tensin homolog) | Tumor suppressor | Point mutation, deletion | PI3K pathway |
| Evade apoptosis | [115,122] |
| MDM2 (mouse double minute 2, human homolog of; P53-binding protein) | Oncogenes | Amplification | Cell cycle control: G1/S checkpoint |
| Evade apoptosis | [115,123] |
| BRAF (B-Raf proto-oncogene, serine/threonine kinase) | Oncogenes | Point mutation, amplification, increased expression | MAPK pathway (RAS) | BRAF upregulation inhibits oxidative phosphorylation gene transcription, mitochondrial b, biogenesis, and the expression of PGC1a by targeting the melanocyte lineage factor (MITF). | Self-sufficiency in growth status | [115,124] |
| KRAS (Kirsten rat sarcoma viral oncogene homolog, GTPase) | Oncogene | Point mutation | MAPK pathway | KRAS activation of MAPK and PI3K pathways stabilizes and activates hypoxia-inducible factor-1 alpha and factor-2 alpha (HIF-1α and HIF-2, respectively), which facilitates ischemic adaptation. KRAS stimulates aerobic glycolysis by overexpressing hexokinase, lactate dehydrogenase, and glucose transporters. KRAS induces glutaminolysis by upregualting glutamate oxaloacetate transaminase 1,2 (GOT), leading to aspartate and NADPH generation and the activation of the NRF2 antioxidant system. Upregulation of RAS leads to increased autophagy and micropinocytosis, contributing to the disruption of cellular energy balance and nutrient scavenging. | Self-sufficiency in growth status | [115,125,126,127,128] |
| NF-κB (nuclear factor kappa B) | Oncogene | Amplification, rearrangement, chromosomal translocation in several members of the NF-κB protein family or constitutional activation of NF-κB | NF-κB pathway | NF-κB upregulation and activity cause a decline in mitochondrial respiratory capacity and reduce the expression of key mitochondrial proteins, including SDHA, ANT-1, UCP3, and MFN2, and cause increased fission and mitophagy of mitochondrial organelles. It upregulates PGC1α and correlates with high ROS. | Tumor growth | [115,129,130] |
| EGFR (ErbB1 epidermal growth factor receptor) | Oncogene | Amplification, upregulation | PI3K and MAPK pathways | EGFR modulates mitochondrial function through modification of Cox-II. | Self-sufficiency in growth status | [115,131] |
| IGFR (insulin-like growth factor receptor) | Oncogene | Amplification | AKT, PI3K, and MAPK pathways | Increased IGFR expression alters ATP synthesis, increases mitochondrial function, and decreases mitochondrial ROS production associated with the induction of antioxidant response. | Antiapoptotic, cell-survival, and transforming activities | [115,132] |
| ErbB2 (HER2, receptor tyrosine protein kinase erbB-2 ) | Oncogene | Amplification | MAPK, PI3K, AKT, and mTOR | ErbB2 overexpression causes downregulation of pro-apoptotic Bcl-2 family protein (Bcl-xS) and increases levels of anti-apoptotic Bcl-xL. This leads to mitochondrial dysfunction and a loss of mitochondrial membrane potential, a 35% decline in ATP levels, and a loss of redox capacity (mitochondrial reductase activity). | Anti-apoptotic and pro-proliferative effects | [115,133] |
| HIF-1 α (hypoxia inducible factor 1 subunit alpha) | Oncogene | It is stabilized and activated in hypoxic tumor conditions and by inactivating mutations of SDH, FH, and IDH as well as due to oncogenic mutation activating other signaling pathways (MAPK, AKT, and mTOR) | HIF-1α induces the expression of pyruvate dehydrogenase kinase 1 (PDK1). PDK1 phosphorylates and inactivates mitochondrial pyruvate dehydrogenase and enhances the dependence of cells on glycolysis for ATP production instead of OXPHOS. | Metabolism, cell survival, erythropoiesis, angiogenesis | [134,135,136] |
2.1.2. Reason 2: Glycolysis Supports the Proliferative Needs of Cancer Cells
2.1.3. Reason 3: Activation of HIF-1α by ROS
2.1.4. Reason 4: Dysregulation of the Glycolytic Machinery
| Gene ID | Gene Name | Mutation/Deregulation | Function in Glycolysis | Publication |
|---|---|---|---|---|
| HK | Hexokinase | Upregulated by p53 in cancer and promotes tumor growth and survival | Phosphorylates glucose when it enters the cells | [78,172,173,174] |
| PFK1 | 6-Phosphofructokinsae-1 | Amplification and/or upregulation, posttranslational modification reported in multiple cancer types | PFK1 catalyzes the phosphorylation of fructose-6-phosphate (F6P) to fructose-1, 6-bisphosphate (Fru-1,6-P2) using Mg-ATP as a phosphoryl donor. | [78,175,176,177] |
| PK | Pyruvate kinase | Posttranslational modification or enhanced expression that benefits cancer | PK is involved in the final step of glycolysis, and it mediates the transfer of a phosphate group from phosphoenolpyruvate (PEP) to ADP, resulting in pyruvate and ATP. | [78,178,179,180,181] |
| PDK-1 | Pyruvate dehydrogenase kinase-1 | Upregulation | PDK is a kinase enzyme that inactivates pyruvate dehydrogenase by phosphorylation dephosphorylation at different specific serine residues. PDK decreases the oxidation of pyruvate in mitochondria and increases the conversion of pyruvate to lactate in the cytosol. | [78,182,183,184] |
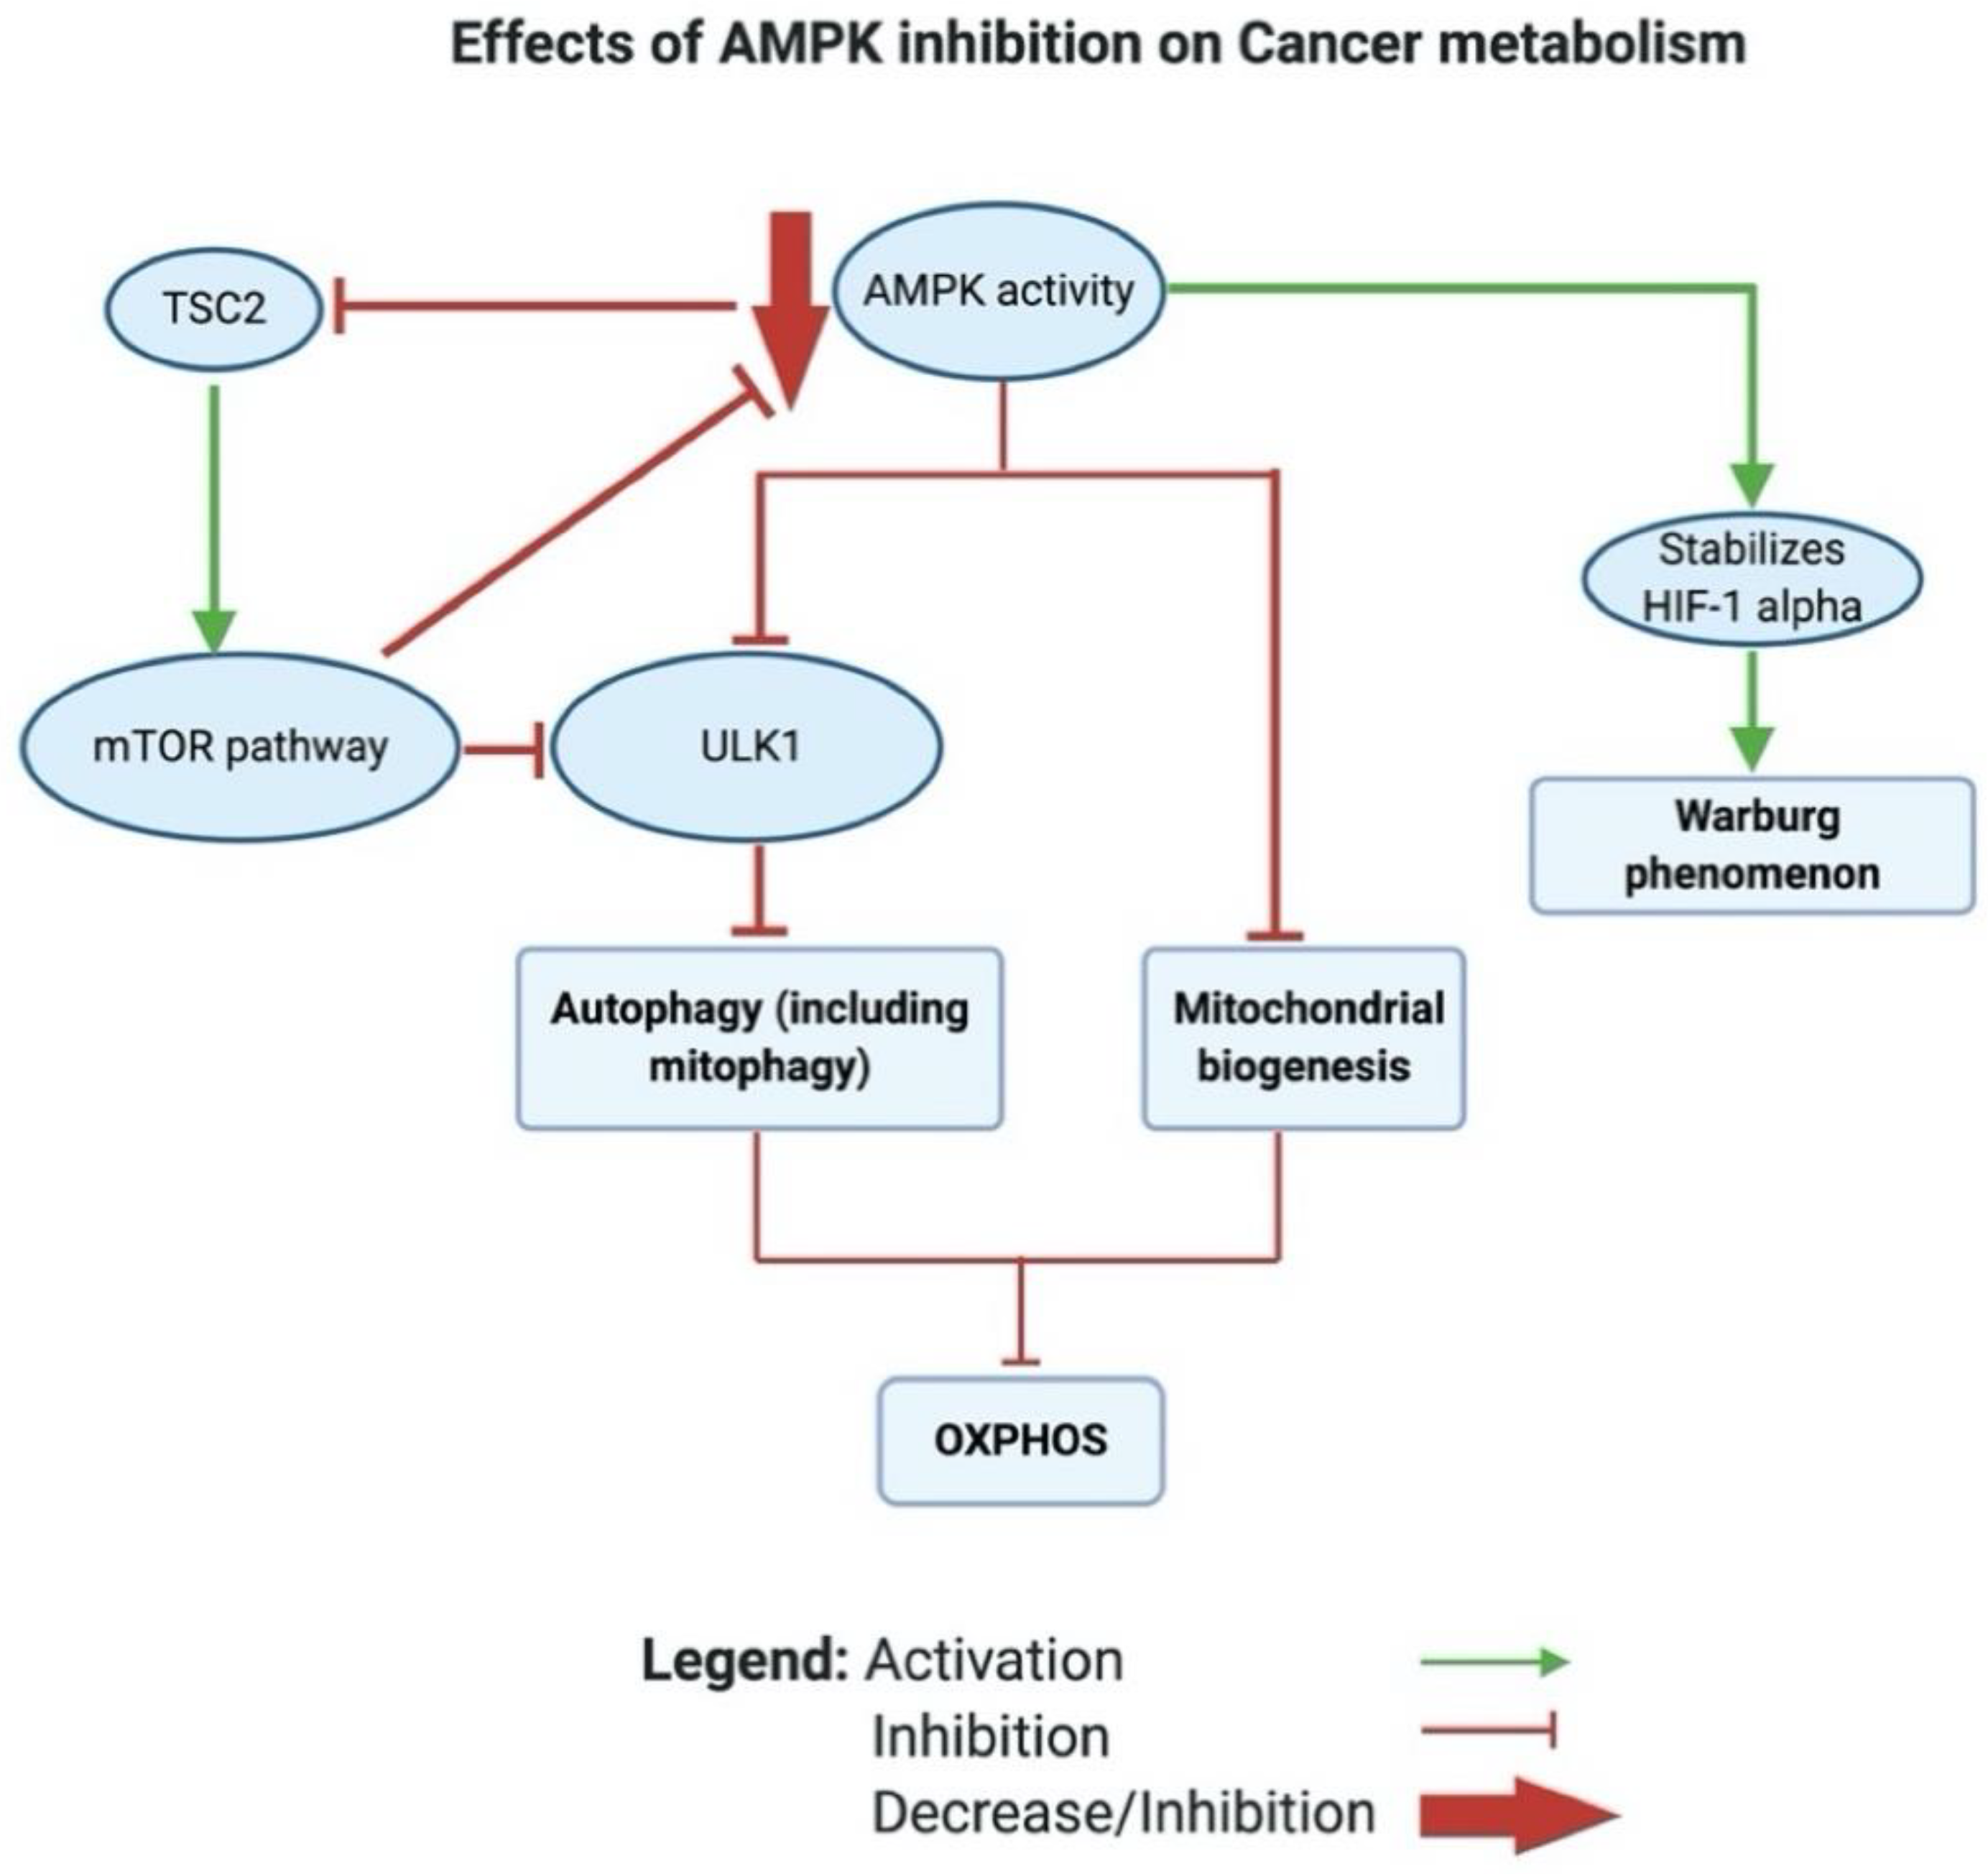
2.1.5. Reason 5: AMPK Inhibition in Cancer Leads to a Glycolytic Shift
3. The Metabolic Shift in T2D
3.1. The Metabolic Shift during the Pathogenesis of Insulin Resistance and T2D
3.2. The Metabolic Shift in Established Insulin Resistance and T2D
3.3. Mitochondrial Dysfunction Is a Result of Insulin Resistance
3.4. The Role of ROS in Insulin Resistance and T2D
3.5. AMPK Inhibition Is Implicated in Insulin Resistance and T2D
4. Metabolic Therapeutic Approaches in Cancer and T2D
4.1. Pharmacological-Based Approaches Targeting Mitochondrial Metabolism in Cancer
4.1.1. BACH1 Depletion Activates OXPHOS and Sensitizes Tumor Cells to Metformin
4.1.2. Dichloroacetate and EGFR-Inhibitors Reverse the Warburg Effect in Cancer
4.1.3. Metformin Activates AMPK to Induce Apoptosis in Cancer
4.1.4. Targeting PI3K/AKT Pathway in Cancer
4.2. Pharmacological-Based Approaches Targeting Mitochondrial Metabolism in T2D
4.2.1. Apoptosis-Inducing Factor Ablation in Diabetic Mice Inhibited OXPHOS
4.2.2. Targeting PI3K/AKT Pathway in T2D
4.2.3. Metformin as a Metabolic Inhibitor in T2D
4.3. Metformin and Other AMPK-Activators in Cancer Clinical Trials
5. Nutritional Therapeutic Approaches in Cancer and T2D
5.1. Nutritional- and Dietary-Based Approaches Targeting Mitochondrial Metabolism in Cancer
5.1.1. Alpha-Lipoic Acid as a Metabolic Modulator in Cancer
5.1.2. Flavonoids as a Metabolic Modulator in Cancer
5.1.3. Glutamine as a Nutritional Supplement in Cancer
5.2. Nutritional- and Dietary-Based Approaches Targeting Mitochondrial Metabolism in T2D
5.2.1. ALA as a Metabolic Modulator in T2D
5.2.2. Flavonoids as a Metabolic Modulator in T2D
5.2.3. Effects of Glutamine Supplementation on T2D
6. Conclusions
Supplementary Materials
Author Contributions
Funding
Data Availability
Acknowledgments
Conflicts of Interest
References
- DeBeradinis, R.; Thompson, C. Cellular metabolism and disease: What do metabolic outliers teach us? NIH Public Access 2012, 148, 1132–1144. [Google Scholar]
- O’Connor, C.; Adams, J.U. Essentials of Cell Biology; NPG Education: Cambridge, MA, USA, 2001. [Google Scholar]
- Noto, H.; Goto, A.; Tsujimoto, T.; Noda, M. Cancer risk in diabetic patients treated with metformin: A systematic review and meta-analysis. PLoS ONE 2012, 7, e33411. [Google Scholar] [CrossRef] [PubMed]
- Zhang, P.X.; Xing, Y.Q.; Niu, Y.D. Fundamentals of the Warburg Effect in Cancer. J. Nutr. Oncol. 2019, 4, 108–114. [Google Scholar] [CrossRef]
- Warburg, O. On the origin of cancer cells. Science 1956, 123, 309–314. [Google Scholar] [PubMed]
- Warburg, O. The metabolism of carcinoma cells. J. Cancer Res. 1925, 9, 148–163. [Google Scholar]
- Warburg, O.; Minami, S. Experiments on surviving carcinoma tissue. J. Moelcular Med. 1923, 2, 776–777. [Google Scholar]
- Koukourakis, M.I.; Giatromanolaki, A.; Bougioukas, G.; Sivridis, E. Lung cancer: A Comparative Study of Metabolism Related Protein Expression in Cancer Cells and Tumor Associated Stroma. Cancer Biol. Ther. 2007, 6, 1472–1475. [Google Scholar] [CrossRef]
- Isidoro, A.; Casado, E.; Redondo, A.; Acebo, P.; Espinosa, E.; Alonso, A.M.; Cejas, P.; Hardisson, D.; Fresno Vara, J.A.; Belda-Iniesta, C.; et al. Breast carcinomas fulfill the Warburg hypothesis and provide metabolic markers of cancer prognosis. Carcinogenesis 2005, 26, 2095–2104. [Google Scholar] [CrossRef]
- Leung, C.O.N.; Wong, C.C.L.; Fan, D.N.Y.; Kai, A.K.L.; Tung, E.K.K.; Xu, I.M.J.; Ng, I.O.L.; Lo, R.C.L. PIM1 regulates glycolysis and promotes tumor progression in hepatocellular carcinoma. Oncotarget 2015, 6, 10880–10892. [Google Scholar] [CrossRef]
- Fan, P.; Wang, B.; Meng, Z.; Zhao, J.; Jin, X. PES1 is transcriptionally regulated by BRD4 and promotes cell proliferation and glycolysis in hepatocellular carcinoma. Int. J. Biochem. Cell Biol. 2018, 104, 1–8. [Google Scholar]
- Marie, S.K.N.; Shinjo, S.M.O. Metabolism and brain cancer. Clinics 2011, 66, 33–43. [Google Scholar]
- Martiny, P.B.; Alcoba, D.D.; Neto, B.S.; Carvalho, P.C.; Brum, I.S. A proteomic glimpse into the oncogenesis of prostate cancer. J. Appl. Biomed. 2018, 16, 328–336. [Google Scholar] [CrossRef]
- Kobayashi, Y.; Banno, K.; Kunitomi, H.; Takahashi, T.; Takeda, T.; Nakamura, K.; Tsuji, K.; Tominaga, E.; Aoki, D. Warburg effect in Gynecologic cancers. J. Obstet. Gynaecol. Res. 2019, 45, 542–548. [Google Scholar] [CrossRef] [PubMed]
- Zhou, W.; Capello, M.; Fredolini, C.; Racanicchi, L.; Piemonti, L.; Liotta, L.A.; Novelli, F.; Petricoin, E.F. Proteomic analysis reveals warburg effect and anomalous metabolism of glutamine in pancreatic cancer cells. J. Proteome Res. 2012, 11, 554–563. [Google Scholar] [CrossRef] [PubMed]
- Altenberg, B.; Greulich, K.O. Genes of glycolysis are ubiquitously overexpressed in 24 cancer classes. Genomics 2004, 84, 1014–1020. [Google Scholar] [PubMed]
- Kim, T.M.; Paeng, J.C.; Chun, I.K.; Keam, B.; Jeon, Y.K.; Lee, S.H.; Kim, D.W.; Lee, D.S.; Kim, C.W.; Chung, J.K.; et al. Total lesion glycolysis in positron emission tomography is a better predictor of outcome than the International Prognostic Index for patients with diffuse large B cell lymphoma. Cancer 2013, 119, 1195–1202. [Google Scholar] [CrossRef]
- Guo, B.; Tan, X.; Ke, Q.; Cen, H. Prognostic value of baseline metabolic tumor volume and total lesion glycolysis in patients with lymphoma: A meta-analysis. PLoS ONE 2019, 14, e0210224. [Google Scholar]
- Suganuma, K.; Miwa, H.; Imai, N.; Shikami, M.; Gotou, M.; Goto, M.; Mizuno, S.; Takahashi, M.; Yamamoto, H.; Hiramatsu, A.; et al. Energy metabolism of leukemia cells: Glycolysis versus oxidative phosphorylation. Leuk. Lymphoma 2010, 51, 2112–2119. [Google Scholar] [CrossRef]
- Chen, L.; Hu, N.; Wang, C.; Zhao, H. HOTAIRM1 knockdown enhances cytarabine-induced cytotoxicity by suppression of glycolysis through the Wnt/β-catenin/PFKP pathway in acute myeloid leukemia cells. Arch. Biochem. Biophys. 2020, 680, 108244. [Google Scholar] [CrossRef]
- Whitaker-Menezes, D.; Martinez-Outschoorn, U.E.; Flomenberg, N.; Birbe, R.C.; Witkiewicz, A.K.; Howell, A.; Pavlides, S.; Tsirigos, A.; Ertel, A.; Pestell, R.G.; et al. Hyperactivation of oxidative mitochondrial metabolism in epithelial cancer cells in situ: Visualizing the therapeutic effects of metformin in tumor tissue. Cell Cycle 2011, 10, 4047–4064. [Google Scholar]
- Viale, A.; Corti, D.; Draetta, G.F. Tumors and mitochondrial respiration: A neglected connection. Cancer Res. 2015, 75, 3685–3686. [Google Scholar]
- Simonnet, H. Low mitochondrial respiratory chain content correlates with tumor aggressiveness in renal cell carcinoma. Carcinogenesis 2002, 23, 759–768. [Google Scholar] [CrossRef] [PubMed]
- Faure-Vigny, H.; Heddi, A.; Giraud, S.; Chautard, D.; Stepien, G. Expression of oxidative phosphorylation genes in renal tumors and tumoral cell lines. Mol. Carcinog. 1996, 16, 165–172. [Google Scholar] [PubMed]
- Hayashi, J.I.; Takemitsu, M.; Nonaka, I. Recovery of the missing tumorigenicity in mitochondrial DNA-less HeLa cells by introduction of mitochondrial DNA from normal human cells. Somat. Cell Mol. Genet. 1992, 18, 123–129. [Google Scholar] [CrossRef] [PubMed]
- Cavalli, L.R.; Varella-Garcia, M.; Liang, B.C. Diminished tumorigenic phenotype after depletion of mitochondrial DNA. Cell Growth Differ. 1997, 8, 1189–1198. [Google Scholar] [PubMed]
- Tan, A.S.; Baty, J.W.; Dong, L.F.; Bezawork-Geleta, A.; Endaya, B.; Goodwin, J.; Bajzikova, M.; Kovarova, J.; Peterka, M.; Yan, B.; et al. Mitochondrial genome acquisition restores respiratory function and tumorigenic potential of cancer cells without mitochondrial DNA. Cell Metab. 2015, 21, 81–94. [Google Scholar] [CrossRef] [PubMed]
- Lebleu, V.S.; O’Connell, J.T.; Gonzalez Herrera, K.N.; Wikman, H.; Pantel, K.; Haigis, M.C.; De Carvalho, F.M.; Damascena, A.; Domingos Chinen, L.T.; Rocha, R.M.; et al. PGC-1α mediates mitochondrial biogenesis and oxidative phosphorylation in cancer cells to promote metastasis. Nat. Cell Biol. 2014, 16, 992–1003. [Google Scholar]
- Yang, L.; Venneti, S.; Nagrath, D. Glutaminolysis: A Hallmark of Cancer Metabolism. Annu. Rev. Biomed. Eng. 2017, 19, 163–194. [Google Scholar] [CrossRef]
- Moreadith, R.W.; Lehninger, A.L. The pathways of glutamate and glutamine oxidation by tumor cell mitochondria. Role of mitochondrial NAD(P)+-dependent malic enzyme. J. Biol. Chem. 1984, 259, 6215–6221. [Google Scholar]
- Schiliro, C.; Firestein, B.L. Mechanisms of Metabolic Reprogramming in Cancer Cells Supporting Enhanced Growth and Proliferation. Cells 2021, 10, 1056. [Google Scholar] [CrossRef]
- Fan, J.; Kamphorst, J.J.; Mathew, R.; Chung, M.K.; White, E.; Shlomi, T.; Rabinowitz, J.D. Glutamine-driven oxidative phosphorylation is a major ATP source in transformed mammalian cells in both normoxia and hypoxia. Mol. Syst. Biol. 2013, 9, 712. [Google Scholar]
- Tardito, S.; Oudin, A.; Ahmed, S.U.; Fack, F.; Keunen, O.; Zheng, L.; Miletic, H.; Sakariassen, P.Ø.; Weinstock, A.; Wagner, A.; et al. Glutamine synthetase activity fuels nucleotide biosynthesis and supports growth of glutamine-restricted glioblastoma. Nat. Cell Biol. 2015, 17, 1556–1568. [Google Scholar] [CrossRef]
- Williams, J.C.; Kizaki, H.; Weber, G.; Morris, H.P. Increased CTP synthetase activity in cancer cells. Nature 1978, 271, 71–73. [Google Scholar] [CrossRef] [PubMed]
- Kodama, M.; Oshikawa, K.; Shimizu, H.; Yoshioka, S.; Takahashi, M.; Izumi, Y.; Bamba, T.; Tateishi, C.; Tomonaga, T.; Matsumoto, M.; et al. A shift in glutamine nitrogen metabolism contributes to the malignant progression of cancer. Nat. Commun. 2020, 11, 1320. [Google Scholar] [CrossRef] [PubMed]
- DeFronzo, R.A.; Tripathy, D. Skeletal muscle insulin resistance is the primary defect in type 2 diabetes. Diabetes Care 2009, 32, S157–S163. [Google Scholar] [CrossRef] [PubMed]
- Weir, G.C.; Leahy, J.L.; Bonner-Weiner, S. B-Cell Dysfunction Induced by Chronic Hyperglycemia. Diabetes Care 1992, 15, 442–455. [Google Scholar]
- Robertson, R.; Zhou, H.; Zhang, T.; Harmon, J.S. Chronic oxidative stress as a mechanism for glucose toxicity of the beta cell in type 2 diabetes. Cell Biochem. Biophys. 2007, 48, 139–146. [Google Scholar] [CrossRef] [PubMed]
- Sakai, K.; Matsumoto, K.; Nishikawa, T.; Suefuji, M.; Nakamaru, K.; Hirashima, Y.; Kawashima, J.; Shirotani, T.; Ichinose, K.; Brownlee, M.; et al. Mitochondrial reactive oxygen species reduce insulin secretion by pancreatic β-cells. Biochem. Biophys. Res. Commun. 2003, 300, 216–222. [Google Scholar] [CrossRef]
- Lortz, S.; Tiedge, M. Glucose toxicity in B-cells: Type 2 diabetes, good radicals gone bad, and the glutathione connection. Free Radic. Biol. Med. 2003, 34, 581–587. [Google Scholar]
- Larsen, S.; Scheede-Bergdahl, C.; Whitesell, T.; Boushel, R.; Bergdahl, A. Increased intrinsic mitochondrial respiratory capacity in skeletal muscle from rats with streptozotocin-induced hyperglycemia. Physiol. Rep. 2015, 3, e12467. [Google Scholar]
- Boirie, Y. Insulin regulation of mitochondrial proteins and oxidative phosphorylation in human muscle. Trends Endocrinol. Metab. 2003, 14, 393–394. [Google Scholar] [PubMed]
- Zhang, Y.; Ye, J. Mitochondrial inhibitor as a new class of insulin sensitizer. Acta Pharm. Sin. B 2012, 2, 341–349. [Google Scholar] [CrossRef] [PubMed]
- Stump, C.S.; Short, K.R.; Bigelow, M.L.; Schimke, J.M.; Nair, K.S. Effect of insulin on human skeletal muscle mitochondrial ATP production, protein synthesis, and mRNA transcripts. Proc. Natl. Acad. Sci. USA 2003, 100, 7996–8001. [Google Scholar] [CrossRef] [PubMed]
- Špaček, T.; Šantorová, J.; Zacharovová, K.; Berková, Z.; Hlavatá, L.; Saudek, F.; Ježek, P. Glucose-stimulated insulin secretion of insulinoma INS-1E cells is associated with elevation of both respiration and mitochondrial membrane potential. Int. J. Biochem. Cell Biol. 2008, 40, 1522–1535. [Google Scholar]
- Ahmad, W.; Ijaz, B.; Shabbiri, K.; Ahmed, F.; Rehman, S. Oxidative toxicity in diabetes and Alzheimer’s disease: Mechanisms behind ROS/ RNS generation. J. Biomed. Sci. 2017, 24, 76. [Google Scholar]
- Bhansali, S.; Bhansali, A.; Walia, R.; Saikia, U.N.; Dhawan, V. Alterations in mitochondrial oxidative stress and mitophagy in subjects with prediabetes and type 2 diabetes mellitus. Front. Endocrinol. 2017, 8, 347. [Google Scholar]
- Bitar, M.S.; Al-Saleh, E.; Al-Mulla, F. Oxidative stress—Mediated alterations in glucose dynamics in a genetic animal model of type II diabetes. Life Sci. 2005, 77, 2552–2573. [Google Scholar] [CrossRef] [PubMed]
- Petersen, K.F.; Dufour, S.; Befroy, D.; Garcia, R.; Shulman, G.I. Impaired Mitochondrial Activity in the Insulin-Resistant Offspring of Patients with Type 2 Diabetes. N. Engl. J. Med. 2004, 350, 664–671. [Google Scholar] [PubMed]
- Kelley, D.E.; He, J.; Menshikova, E.V.; Ritov, V.B. Dysfunction of mitochondria in human skeletal muscle in type 2 diabetes. Diabetes 2002, 51, 2944–2950. [Google Scholar] [CrossRef]
- Frederiksen, C.M.; Højlund, K.; Hansen, L.; Oakeley, E.J.; Hemmings, B.; Abdallah, B.M.; Brusgaard, K.; Beck-Nielsen, H.; Gaster, M. Transcriptional profiling of myotubes from patients with type 2 diabetes: No evidence for a primary defect in oxidative phosphorylation genes. Diabetologia 2008, 51, 2068–2077. [Google Scholar] [CrossRef]
- Boushel, R.; Gnaiger, E.; Schjerling, P.; Skovbro, M.; Kraunsøe, R.; Dela, F. Patients with type 2 diabetes have normal mitochondrial function in skeletal muscle. Diabetologia 2007, 50, 790–796. [Google Scholar]
- Fisher-Wellman, K.H.; Weber, T.M.; Cathey, B.L.; Brophy, P.M.; Gilliam, L.A.A.; Kane, C.L.; Maples, J.M.; Gavin, T.P.; Houmard, J.A.; Neufer, P.D. Mitochondrial respiratory capacity and content are normal in young insulin-resistant obese humans. Diabetes 2014, 63, 132–141. [Google Scholar] [PubMed]
- Misu, H.; Takamura, T.; Matsuzawa, N.; Shimizu, A.; Ota, T.; Sakurai, M.; Ando, H.; Arai, K.; Yamashita, T.; Honda, M.; et al. Genes involved in oxidative phosphorylation are coordinately upregulated with fasting hyperglycaemia in livers of patients with type 2 diabetes. Diabetologia 2006, 50, 268–277. [Google Scholar] [PubMed]
- Buchner, D.A.; Yazbek, S.N.; Solinas, P.; Burrage, L.C.; Morgan, M.G.; Hoppel, C.L.; Nadeau, J.H. Increased mitochondrial oxidative phosphorylation in the liver is associated with obesity and insulin resistance. Obesity 2011, 19, 917–924. [Google Scholar] [CrossRef]
- Ciapaite, J.; Bakker, S.J.L.; Van Eikenhorst, G.; Wagner, M.J.; Teerlink, T.; Schalkwijk, C.G.; Fodor, M.; Ouwens, D.M.; Diamant, M.; Heine, R.J.; et al. Functioning of oxidative phosphorylation in liver mitochondria of high-fat diet fed rats. Biochim. Biophys. Acta-Mol. Basis Dis. 2007, 1772, 307–316. [Google Scholar]
- Petersen, K.F.; Befroy, D.; Dufour, S.; Dziura, J.; Ariyan, C.; Rothman, D.L.; DiPietro, L.; Cline, G.W.; Shulman, G.I. Mitochondrial dysfunction in the elderly: Possible role in insulin resistance. Science 2003, 300, 1140–1142. [Google Scholar]
- Chen, H.; Fang, Y.; Liang, L.; Wang, C. Insulin Resistance Leads to Mitochondrial Dysfunction in Hepatocyte. Eur. Soc. Paediatr. Endocrinol. 2019, 92, 57. [Google Scholar]
- Sasaki, M.; Fujimoto, S.; Sato, Y.; Nishi, Y.; Mukai, E.; Yamano, G.; Sato, H.; Tahara, Y.; Ogura, K.; Nagashima, K.; et al. Reduction of reactive oxygen species ameliorates metabolism-secretion coupling in islets of diabetic GK rats by suppressing lactate overproduction. Diabetes 2013, 62, 1996–2003. [Google Scholar] [CrossRef]
- Cantley, J.; Biden, T.J. Sweet and sour β-cells: ROS and Hif1α induce warburg-like lactate production during type 2 diabetes. Diabetes 2013, 62, 1823–1825. [Google Scholar] [CrossRef]
- Choi, C.S.; Kim, Y.B.; Lee, F.N.; Zabolotny, J.M.; Kahn, B.B.; Youn, J.H. Lactate induces insulin resistance in skeletal muscle by suppressing glycolysis and impairing insulin signaling. Am. J. Physiol.-Endocrinol. Metab. 2002, 283, 233–240. [Google Scholar] [CrossRef]
- Akram, M. Citric Acid Cycle and Role of its Intermediates in Metabolism. Cell Biochem. Biophys. 2014, 68, 475–478. [Google Scholar] [PubMed]
- Akram, M. Mini-review on glycolysis and cancer. J. Cancer Educ. 2013, 28, 454–457. [Google Scholar] [PubMed]
- Nolfi-Donegan, D.; Braganza, A.; Shiva, S. Mitochondrial electron transport chain: Oxidative phosphorylation, oxidant production, and methods of measurement. Redox Biol. 2020, 37, 101674. [Google Scholar] [CrossRef] [PubMed]
- Simonnet, H.; Demont, J.; Pfeiffer, K.; Guenaneche, L.; Bouvier, R.; Brandt, U.; Schägger, H.; Godinot, C. Mitochondrial complex I is deficient in renal oncocytomas. Carcinogenesis 2003, 24, 1461–1466. [Google Scholar] [PubMed]
- Baracca, A.; Chiaradonna, F.; Sgarbi, G.; Solaini, G.; Alberghina, L.; Lenaz, G. Mitochondrial Complex I decrease is responsible for bioenergetic dysfunction in K-ras transformed cells. Biochim. Biophys. Acta-Bioenerg. 2010, 1797, 314–323. [Google Scholar] [CrossRef] [PubMed]
- Bonora, E.; Porcelli, A.M.; Gasparre, G.; Biondi, A.; Ghelli, A.; Carelli, V.; Baracca, A.; Tallini, G.; Martinuzzi, A.; Lenaz, G.; et al. Defective oxidative phosphorylation in thyroid oncocytic carcinoma is associated with pathogenic mitochondrial DNA mutations affecting complexes I and III. Cancer Res. 2006, 66, 6087–6096. [Google Scholar]
- Bellance, N.; Benard, G.; Furt, F.; Begueret, H.; Smolková, K.; Passerieux, E.; Delage, J.P.; Baste, J.M.; Moreau, P.; Rossignol, R. Bioenergetics of lung tumors: Alteration of mitochondrial biogenesis and respiratory capacity. Int. J. Biochem. Cell Biol. 2009, 41, 2566–2577. [Google Scholar] [CrossRef]
- Liberti, M.V.; Locasale, J.W. The Warburg Effect: How Does it Benefit Cancer Cells? Trends Biochem. Sci. 2016, 41, 287. [Google Scholar] [CrossRef]
- Lee, M.; Yoon, J. Metabolic interplay between glycolysis and mitochondrial oxidation: The reverse Warburg effect and its therapeutic implication. World J. Biol. Chem. 2015, 6, 148–162. [Google Scholar]
- Kim, S.Y. Cancer Energy Metabolism: Shutting Power off Cancer Factory. Biomol. Ther. 2018, 26, 39–44. [Google Scholar] [CrossRef]
- Fu, Y.; Liu, S.; Yin, S.; Niu, W.; Xiong, W. The reverse Warburg effect is likely to be an Achilles ’ heel of cancer that can be exploited for cancer therapy. Oncotarget 2017, 8, 57813–57825. [Google Scholar]
- Luis, C.; Duarte, F.; Faria, I.; Jarak, I.; Oliveira, P.F.; Alves, M.G.; Soares, R.; Fernandes, R. Warburg Effect Inversion: Adiposity shifts central primary metabolism in MCF-7 breast cancer cells. Life Sci. 2019, 223, 38–46. [Google Scholar] [CrossRef]
- Slane, B.G.; Aykin-Burns, N.; Smith, B.J.; Kalen, A.L.; Goswami, P.C.; Domann, F.E.; Spitz, D.R. Mutation of succinate dehydrogenase subunit C results in increased O 2.-, oxidative stress, and genomic instability. Cancer Res. 2006, 66, 7615–7620. [Google Scholar]
- Alam, N.A.; Olpin, S.; Rowan, A.; Kelsell, D.; Leigh, I.M.; Tomlinson, I.P.M.; Weaver, T. Missense mutations in fumarate hydratase in multiple cutaneous and uterine leiomyomatosis and renal cell cancer. J. Mol. Diagnostics 2005, 7, 437–443. [Google Scholar]
- Gross, S.; Cairns, R.A.; Minden, M.D.; Driggers, E.M.; Bittinger, M.A.; Jang, H.G.; Sasaki, M.; Jin, S.; Schenkein, D.P.; Su, S.M.; et al. Cancer-associated metabolite 2-hydroxyglutarate accumulates in acute myelogenous leukemia with isocitrate dehydrogenase 1 and 2 mutations. J. Exp. Med. 2010, 207, 339–344. [Google Scholar]
- Grassian, A.R.; Parker, S.J.; Davidson, S.M.; Divakaruni, A.S.; Green, C.R.; Zhang, X.; Slocum, K.L.; Pu, M.; Lin, F.; Vickers, C.; et al. IDH1 mutations alter citric acid cycle metabolism and increase dependence on oxidative mitochondrial metabolism. Cancer Res. 2014, 74, 3317–3331. [Google Scholar] [CrossRef]
- Chen, J.Q.; Russo, J. Dysregulation of glucose transport, glycolysis, TCA cycle and glutaminolysis by oncogenes and tumor suppressors in cancer cells. Biochim. Biophys. Acta-Rev. Cancer 2012, 1826, 370–384. [Google Scholar]
- Bourgeron, T.; Rustin, P.; Chretien, D.; Birch-machin, M.; Bourgeois, M.; Viegas-pequignot, E.; Munnich, A.; Rotig, A. Mutation of a nuclear succinate dehydrogenase gene results in mitochondrial respiratory chain deficiency. Nat. Genet. 1995, 11, 144–149. [Google Scholar] [CrossRef]
- Böttcher, M.; Renner, K.; Berger, R.; Mentz, K.; Thomas, S.; Cardenas-Conejo, Z.E.; Dettmer, K.; Oefner, P.J.; Mackensen, A.; Kreutz, M.; et al. D-2-hydroxyglutarate interferes with HIF-1α stability skewing T-cell metabolism towards oxidative phosphorylation and impairing Th17 polarization. Oncoimmunology 2018, 7, e1445454. [Google Scholar] [CrossRef]
- Ferro, F.; Servais, S.; Besson, P.; Roger, S.; Dumas, J.F.; Brisson, L. Autophagy and mitophagy in cancer metabolic remodelling. Semin. Cell Dev. Biol. 2020, 98, 129–138. [Google Scholar]
- Gonzalez, C.D.; Alvarez, S.; Ropolo, A.; Rosenzvit, C.; Gonzalez Bagnes, M.F.; Vaccaro, M.I. Autophagy, warburg, and warburg reverse effects in human cancer. Biomed Res. Int. 2014, 2014, 926729. [Google Scholar] [CrossRef]
- Bhattacharya, B.; Mohd Omar, M.F.; Soong, R. The Warburg effect and drug resistance. Br. J. Pharmacol. 2016, 173, 970–979. [Google Scholar] [CrossRef]
- Das, C.K.; Mandal, M.; Kögel, D. Pro-survival autophagy and cancer cell resistance to therapy. Cancer Metastasis Rev. 2018, 37, 749–766. [Google Scholar] [CrossRef]
- Poulogiannis, G.; McIntyre, R.E.; Dimitriadi, M.; Apps, J.R.; Wilson, C.H.; Ichimura, K.; Luo, F.; Cantley, L.C.; Wyllie, A.H.; Adams, D.J.; et al. PARK2 deletions occur frequently in sporadic colorectal cancer and accelerate adenoma development in Apc mutant mice. Proc. Natl. Acad. Sci. USA 2010, 107, 15145–15150. [Google Scholar]
- Veeriah, S.; Taylor, B.S.; Meng, S.; Fang, F.; Yilmaz, E.; Vivanco, I.; Janakiraman, M.; Schultz, N.; Hanrahan, A.J.; Pao, W.; et al. Somatic mutations of the Parkinson’s disease-associated gene PARK2 in glioblastoma and other human malignancies. Nat. Genet. 2010, 42, 77–82. [Google Scholar] [CrossRef]
- Hu, H.H.; Kannengiesser, C.; Lesage, S.; André, J.; Mourah, S.; Michel, L.; Descamps, V.; Basset-Seguin, N.; Bagot, M.; Bensussan, A.; et al. PARKIN Inactivation Links Parkinson’s Disease to Melanoma. J. Natl. Cancer Inst. 2016, 108, djv340. [Google Scholar] [CrossRef]
- Lee, S.B.; She, J.; Deng, B.; Kim, J.J.; de Andrade, M.; Na, J.; Sun, Z.; Wampfler, J.A.; Cunningham, J.M.; Wu, Y.; et al. Multiple-level validation identifies PARK2 in the development of lung cancer and chronic obstructive pulmonary disease. Oncotarget 2016, 7, 44211–44223. [Google Scholar] [CrossRef]
- Letessier, A.; Garrido-Urbani, S.; Ginestier, C.; Fournier, G.; Esterni, B.; Monville, F.; Adélaïde, J.; Geneix, J.; Xerri, L.; Dubreuil, P.; et al. Correlated break at PARK2/FRA6E and loss of AF-6/Afadin protein expression are associated with poor outcome in breast cancer. Oncogene 2007, 26, 298–307. [Google Scholar]
- Sreedhar, A.; Petruska, P.; Miriyala, S.; Panchatcharam, M.; Zhao, Y. UCP2 overexpression enhanced glycolysis via activation of PFKFB2 during skin cell transformation. Oncotarget 2017, 8, 95504–95515. [Google Scholar]
- Xu, X.D.; Shao, S.X.; Jiang, H.P.; Cao, Y.W.; Wang, Y.H.; Yang, X.C.; Wang, Y.L.; Wang, X.S.; Niu, H.T. Warburg effect or reverse warburg effect? a review of cancer metabolism. Oncol. Res. Treat. 2015, 38, 117–122. [Google Scholar] [CrossRef]
- Brandi, J.; Cecconi, D.; Cordani, M.; Torrens-Mas, M.; Pacchiana, R.; Dalla Pozza, E.; Butera, G.; Manfredi, M.; Marengo, E.; Oliver, J.; et al. The antioxidant uncoupling protein 2 stimulates hnRNPA2/B1, GLUT1 and PKM2 expression and sensitizes pancreas cancer cells to glycolysis inhibition. Free Radic. Biol. Med. 2016, 101, 305–316. [Google Scholar]
- Pons, D.G.; Nadal-Serrano, M.; Torrens-Mas, M.; Valle, A.; Oliver, J.; Roca, P. UCP2 inhibition sensitizes breast cancer cells to therapeutic agents by increasing oxidative stress. Free Radic. Biol. Med. 2015, 86, 67–77. [Google Scholar]
- Mycielska, M.E.; Broke-Smith, T.P.; Palmer, C.P.; Beckerman, R.; Nastos, T.; Erguler, K.; Djamgoz, M.B.A. Citrate enhances in vitro metastatic behaviours of PC-3M human prostate cancer cells: Status of endogenous citrate and dependence on aconitase and fatty acid synthase. Int. J. Biochem. Cell Biol. 2006, 38, 1766–1777. [Google Scholar] [CrossRef]
- Arceci, R.J. An Integrated Genomic Analysis of Human Glioblastoma Multiforme. Yearb. Oncol. 2009, 2009, 185–186. [Google Scholar]
- Yan, H.; Parsons, D.W.; Jin, G.; McLendon, R.; Rasheed, B.A.; Yuan, W.; Kos, I.; Batinic-Haberle, I.; Jones, S.; Riggins, G.J.; et al. IDH1 and IDH2 Mutations in Gliomas. N. Engl. J. Med. 2009, 360, 765–773. [Google Scholar] [CrossRef]
- Ward, P.S.; Patel, J.; Wise, D.R.; Abdel-Wahab, O.; Bennett, B.D.; Coller, H.A.; Cross, J.R.; Fantin, V.R.; Hedvat, C.V.; Perl, A.E.; et al. The Common Feature of Leukemia-Associated IDH1 and IDH2 Mutations Is a Neomorphic Enzyme Activity Converting α-Ketoglutarate to 2-Hydroxyglutarate. Cancer Cell 2010, 17, 225–234. [Google Scholar] [CrossRef]
- Kranendijk, M.; Struys, E.A.; Van Schaftingen, E.; Gibson, K.M.; Kanhai, W.A.; Knaap, M.S.V.D.; Amiel, J.; Buist, N.R.; Das, A.M.; De Klerk, J.B.; et al. IDH2 Mutations in Patients with D-2-Hydroxyglutaric Aciduria. Science 2010, 330, 7. [Google Scholar] [CrossRef]
- Dang, L.; White, D.W.; Gross, S.; Bennett, B.D.; Bittinger, M.A.; Driggers, E.M.; Fantin, V.R.; Jang, H.G.; Jin, S.; Keenan, M.C.; et al. Cancer-associated IDH1 mutations produce 2-hydroxyglutarate. Nature 2009, 462, 739–744. [Google Scholar] [CrossRef]
- Oyedotun, K.S.; Lemire, B.D. The quaternary structure of the Saccharomyces cerevisiae succinate dehydrogenase: Homology modeling, cofactor docking, and molecular dynamics simulation studies. J. Biol. Chem. 2004, 279, 9424–9431. [Google Scholar] [CrossRef]
- Baysal, B.E. On the association of succinate dehydrogenase mutations with hereditary paraganglioma. Trends Endocrinol. Metab. 2003, 14, 453–459. [Google Scholar] [CrossRef]
- Neumann, H.P.H.; Pawlu, C.; Peczkowska, M.; Bausch, B.; McWhinney, S.R.; Muresan, M.; Buchta, M.; Franke, G.; Klisch, J.; Bley, T.A.; et al. Distict Clinical features of Paraganglioma Syndromes Associated With SDHB and SDHD Gene Mutations. J. Am. Med. Assoc. 2004, 292, 943–952. [Google Scholar] [CrossRef]
- Pollard, P.J.; Wortham, N.C.; Tomlinson, I.P.M. The TCA cycle and tumorigenesis: The examples of fumarate hydratase and succinate dehydrogenase. Ann. Med. 2003, 35, 634–635. [Google Scholar] [CrossRef]
- Habano, W.; Sugai, T.; Nakamura, S.I.; Uesugi, N.; Higuchi, T.; Terashima, M.; Horiuchi, S. Reduced expression and loss of heterozygosity of the SDHD gene in colorectal and gastric cancer. Oncol. Rep. 2003, 10, 1375–1380. [Google Scholar] [CrossRef]
- Gimenez-Roqueplo, A.P.; Favier, J.; Rustin, P.; Mourad, J.J.; Plouin, P.F.; Corvol, P.; Rötig, A.; Jeunemaitre, X. The R22X mutation of the SDHD gene in hereditary paraganglioma abolishes the enzymatic activity of complex II in the mitochondrial respiratory chain and activates the hypoxia pathway. Am. J. Hum. Genet. 2001, 69, 1186–1197. [Google Scholar] [CrossRef]
- Gimenez-Roqueplo, A.P.; Favier, J.; Rustin, P.; Rieubland, C.; Crespin, M.; Nau, V.; Van Kien, P.K.; Corvol, P.; Plouin, P.F.; Jeunemaitre, X. Mutations in the SDHB gene are associated with extra-adrenal and/or malignant phaeochromocytomas. Cancer Res. 2003, 63, 5615–5621. [Google Scholar]
- Selak, M.A.; Armour, S.M.; MacKenzie, E.D.; Boulahbel, H.; Watson, D.G.; Mansfield, K.D.; Pan, Y.; Simon, M.C.; Thompson, C.B.; Gottlieb, E. Succinate links TCA cycle dysfunction to oncogenesis by inhibiting HIF-α prolyl hydroxylase. Cancer Cell 2005, 7, 77–85. [Google Scholar]
- Bardella, C.; Pollard, P.J.; Tomlinson, I. SDH mutations in cancer. Biochim. Biophys. Acta-Bioenerg. 2011, 1807, 1432–1443. [Google Scholar]
- Jaramillo, M.C.; Zhang, D.D. The emerging role of the Nrf2-Keap1 signaling pathway in cancer. Genes Dev. 2013, 27, 2179–2191. [Google Scholar]
- Tomlinson, I.P.M.; Alam, N.A.; Rowan, A.J.; Barclay, E.; Jaeger, E.E.M.; Kelsell, D.; Leigh, I.; Gorman, P.; Lamlum, H.; Rahman, S.; et al. Germline mutations in FH predispose to dominantly inherited uterine fibroids, skin leiomyomata and papillary renal cell cancer the multiple leiomyoma consortium. Nat. Genet. 2002, 30, 406–410. [Google Scholar]
- Martinez-Mir, A.; Glaser, B.; Chuang, G.S.; Horev, L.; Waldman, A.; Engler, D.E.; Gordon, D.; Spelman, L.J.; Hatzibougias, I.; Green, J.; et al. Germline Fumarate Hydratase Mutations in Families with Multiple Cutaneous and Uterine Leiomyomata. J. Investig. Dermatol. 2003, 121, 741–744. [Google Scholar] [CrossRef]
- Bardella, C.; El-Bahrawy, M.; Frizzell, N.; Adam, J.; Ternette, N.; Hatipoglu, E.; Howarth, K.; O’Flaherty, L.; Roberts, I.; Turner, G.; et al. Aberrant succination of proteins in fumarate hydratase-deficient mice and HLRCC patients is a robust biomarker of mutation status. J. Pathol. 2011, 225, 4–11. [Google Scholar]
- Ooi, A.; Furge, K.A. Fumarate hydratase inactivation in renal tumors: HIF1α, NRF2 and “cryptic targets” of transcription factors. Chin. J. Cancer 2012, 31, 413–420. [Google Scholar] [CrossRef] [PubMed]
- Goetzman, E.S.; Prochownik, E.V. The role for myc in coordinating glycolysis, oxidative phosphorylation, glutaminolysis, and fatty acid metabolism in normal and neoplastic tissues. Front. Endocrinol. 2018, 9, 129. [Google Scholar] [CrossRef]
- Levine, A.J.; Puzio-Kuter, A.M. The control of the metabolic switch in cancers by oncogenes and tumor suppressor genes. Science 2010, 330, 1340–1344. [Google Scholar] [CrossRef]
- Li, F.; Wang, Y.; Zeller, K.I.; Potter, J.J.; Wonsey, D.R.; O’Donnell, K.A.; Kim, J.-w.; Yustein, J.T.; Lee, L.A.; Dang, C.V. Myc Stimulates Nuclearly Encoded Mitochondrial Genes and Mitochondrial Biogenesis. Mol. Cell. Biol. 2005, 25, 6225–6234. [Google Scholar] [CrossRef] [PubMed]
- Song, H.P.; Zhang, L.; Dang, Y.M.; Yan, H.; Chu, Z.G.; Huang, Y.S. The phosphatidylinositol 3-kinase-Akt pathway protects cardiomyocytes from ischaemic and hypoxic apoptosis via mitochondrial function. Clin. Exp. Pharmacol. Physiol. 2010, 37, 598–604. [Google Scholar] [CrossRef]
- Goo, C.K.; Lim, H.Y.; Ho, Q.S.; Too, H.P.; Clement, M.V.; Wong, K.P. PTEN/Akt Signaling Controls Mitochondrial Respiratory Capacity through 4E-BP1. PLoS ONE 2012, 7, e45806. [Google Scholar]
- Lebedeva, M.A.; Eaton, J.S.; Shadel, G.S. Loss of p53 causes mitochondrial DNA depletion and altered mitochondrial reactive oxygen species homeostasis. Biochim. Biophys. Acta-Bioenerg. 2009, 1787, 328–334. [Google Scholar] [CrossRef]
- Matoba, S.; Kang, J.G.; Patino, W.D.; Wragg, A.; Boehm, M.; Gavrilova, O.; Hurley, P.J.; Bunz, F.; Hwang, P.M. P53 Regulates Mitochondrial Respiration. Science 2006, 312, 1650–1653. [Google Scholar]
- Goan, Y.G.; Wu, W.T.; Liu, C.I.; Neoh, C.A.; Wu, Y.J. Involvement of mitochondrial dysfunction, endoplasmic reticulum stress, and the PI3K/AKT/mTOR pathway in nobiletin-induced apoptosis of human bladder cancer cells. Molecules 2019, 24, 2881. [Google Scholar]
- Luo, J.; Manning, B.D.; Cantley, L.C. Targeting the PI3K-Akt pathway in human cancer: Rationale and promise. Cancer Cell 2003, 4, 257–262. [Google Scholar] [CrossRef] [PubMed]
- Rubio-Patiño, C.; Trotta, A.P.; Chipuk, J.E. MDM2 and mitochondrial function: One complex intersection. Biochem. Pharmacol. 2019, 162, 14–20. [Google Scholar]
- Haq, R.; Shoag, J.; Andreu-Perez, P.; Yokoyama, S.; Edelman, H.; Rowe, G.C.; Frederick, D.T.; Hurley, A.D.; Nellore, A.; Kung, A.L.; et al. Oncogenic BRAF regulates oxidative metabolism via PGC1α and MITF. Cancer Cell 2013, 23, 302–315. [Google Scholar] [PubMed]
- Chun, S.Y.; Johnson, C.; Washburn, J.G.; Cruz-Correa, M.R.; Dang, D.T.; Dang, L.H. Oncogenic KRAS modulates mitochondrial metabolism in human colon cancer cells by inducing HIF-1α and HIF-2α target genes. Mol. Cancer 2010, 9, 293. [Google Scholar] [CrossRef] [PubMed]
- Pylayeva-Gupta, Y.; Grabocka, E.; Bar-Sagi, D. RAS oncogenes: Weaving a tumorigenic web. Nat. Rev. Cancer 2011, 11, 761–774. [Google Scholar] [CrossRef]
- Mukhopadhyay, S.; Vander Heiden, M.G.; McCormick, F. The metabolic landscape of RAS-driven cancers from biology to therapy. Nat. Cancer 2021, 2, 271–283. [Google Scholar]
- Moss, D.Y.; McCann, C.; Kerr, E.M. Rerouting the drug response: Overcoming metabolic adaptation in KRAS-mutant cancers. Sci. Signal. 2022, 15, eabj3490. [Google Scholar] [CrossRef]
- Holmström, K.M.; Kostov, R.V.; Dinkova-Kostova, A.T. The multifaceted role of Nrf2 in mitochondrial function. Curr. Opin. Toxicol. 2016, 2, 80–91. [Google Scholar] [CrossRef]
- Nisr, R.B.; Shah, D.S.; Ganley, I.G.; Hundal, H.S. Proinflammatory NFkB signalling promotes mitochondrial dysfunction in skeletal muscle in response to cellular fuel overloading. Cell. Mol. Life Sci. 2019, 76, 4887–4904. [Google Scholar] [CrossRef]
- Demory, M.L.; Boerner, J.L.; Davidson, R.; Faust, W.; Miyake, T.; Lee, I.; Hüttemann, M.; Douglas, R.; Haddad, G.; Parsons, S.J. Epidermal growth factor receptor translocation to the mitochondria. J. Biol. Chem. 2009, 284, 36592–36604. [Google Scholar]
- Logan, S.; Pharaoh, G.A.; Marlin, M.C.; Masser, D.R.; Matsuzaki, S.; Wronowski, B.; Yeganeh, A.; Parks, E.E.; Premkumar, P.; Farley, J.A.; et al. Insulin-like growth factor receptor signaling regulates working memory, mitochondrial metabolism, and amyloid-β uptake in astrocytes. Mol. Metab. 2018, 9, 141–155. [Google Scholar] [CrossRef] [PubMed]
- Grazette, L.P.; Boecker, W.; Matsui, T.; Semigran, M.; Force, T.L.; Hajjar, R.J.; Rosenzweig, A. Inhibition of ErbB2 causes mitochondrial dysfunction in cardiomyocytes: Implications for herceptin-induced cardiomyopathy. J. Am. Coll. Cardiol. 2004, 44, 2231–2238. [Google Scholar] [CrossRef]
- Bui, T.; Thompson, C.B. Cancer’s sweet tooth. Cancer Cell 2006, 9, 419–420. [Google Scholar] [CrossRef] [PubMed]
- Kim, J.W.; Tchernyshyov, I.; Semenza, G.L.; Dang, C.V. HIF-1-mediated expression of pyruvate dehydrogenase kinase: A metabolic switch required for cellular adaptation to hypoxia. Cell Metab. 2006, 3, 177–185. [Google Scholar] [PubMed]
- Papandreou, I.; Cairns, R.A.; Fontana, L.; Lim, A.L.; Denko, N.C. HIF-1 mediates adaptation to hypoxia by actively downregulating mitochondrial oxygen consumption. Cell Metab. 2006, 3, 187–197. [Google Scholar] [CrossRef]
- Wasylenko, T.M.; Ahn, W.S.; Stephanopoulos, G. The oxidative pentose phosphate pathway is the primary source of NADPH for lipid overproduction from glucose in Yarrowia lipolytica. Metab. Eng. 2015, 30, 27–39. [Google Scholar] [CrossRef]
- De Preter, G.; Neveu, M.A.; Danhier, P.; Brisson, L.; Payen, V.L.; Porporato, P.E.; Jordan, B.F.; Sonveaux, P.; Gallez, B. Inhibition of the pentose phosphate pathway by dichloroacetate unravels a missing link between aerobic glycolysis and cancer cell proliferation. Oncotarget 2016, 7, 2910–2920. [Google Scholar] [CrossRef]
- DeBerardinis, R.J.; Mancuso, A.; Daikhin, E.; Nissim, I.; Yudkoff, M.; Wehrli, S.; Thompson, C.B. Beyond aerobic glycolysis: Transformed cells can engage in glutamine metabolism that exceeds the requirement for protein and nucleotide synthesis. Proc. Natl. Acad. Sci. USA 2007, 104, 19345–19350. [Google Scholar] [CrossRef]
- Locasale, J.W.; Grassian, A.R.; Melman, T.; Lyssiotis, C.A.; Mattaini, K.R.; Bass, A.J.; Heffron, G.; Metallo, C.M.; Muranen, T.; Sharfi, H.; et al. Phosphoglycerate dehydrogenase diverts glycolytic flux and contributes to oncogenesis. Nat. Genet. 2011, 43, 869–874. [Google Scholar] [CrossRef]
- Luengo, A.; Li, Z.; Gui, D.Y.; Sullivan, L.B.; Zagorulya, M.; Spranger, S.; Matheson, N.J.; Vander Heiden, M.G. Increased demand for NAD+ relative to ATP drives aerobic glycolysis. bioRxiv 2020. [Google Scholar] [CrossRef]
- White, K.A.; Grillo-Hill, B.K.; Barber, D.L. Cancer cell behaviors mediated by dysregulated pH dynamics at a glance. J. Cell Sci. 2017, 130, 663–669. [Google Scholar] [CrossRef]
- Heiden, M.G.V. the warburg effect: T. metabolic requirements of cell proliferation; Cantley, L.C.; Thompson, C.B. Understanding the warburg effect: The metabolic requirements of cell proliferation. Science 2009, 324, 1029–1033. [Google Scholar] [CrossRef]
- Luengo, A.; Li, Z.; Gui, D.Y.; Sullivan, L.B.; Zagorulya, M.; Do, B.T.; Ferreira, R.; Naamati, A.; Ali, A.; Lewis, C.A.; et al. Increased demand for NAD+ relative to ATP drives aerobic glycolysis. Mol. Cell 2021, 81, 691–707. [Google Scholar] [CrossRef]
- Kondoh, H.; Lleonart, M.E.; Nakashima, Y.; Yokode, M.; Tanaka, M.; Bernard, D.; Gil, J.; Beach, D. A High Glycolytic Flux Supports the Proliferative Potential of Murine Embryonic Stem Cells. Antioxid. Redox Signal. 2007, 9, 293–299. [Google Scholar] [PubMed]
- Ciavardelli, D.; Rossi, C.; Barcaroli, D.; Volpe, S.; Consalvo, A.; Zucchelli, M.; De Cola, A.; Scavo, E.; Carollo, R.; D’Agostino, D.; et al. Breast cancer stem cells rely on fermentative glycolysis and are sensitive to 2-deoxyglucose treatment. Cell Death Dis. 2014, 5, e1336. [Google Scholar] [CrossRef]
- Ravera, S.; Podestà, M.; Sabatini, F.; Fresia, C.; Columbaro, M.; Bruno, S.; Fulcheri, E.; Ramenghi, L.A.; Frassoni, F. Mesenchymal stem cells from preterm to term newborns undergo a significant switch from anaerobic glycolysis to the oxidative phosphorylation. Cell. Mol. Life Sci. 2018, 75, 889–903. [Google Scholar] [CrossRef] [PubMed]
- Da Veiga Moreira, J.; Hamraz, M.; Abolhassani, M.; Bigan, E.; Pérès, S.; Paulevé, L.; Nogueira, M.L.; Steyaert, J.M.; Schwartz, L. The redox status of cancer cells supports mechanisms behind the Warburg effect. Metabolites 2016, 6, 33. [Google Scholar] [CrossRef] [PubMed]
- Pouysségur, J.; Franchi, A.; L’Allemain, G.; Paris, S. Cytoplasmic pH, a key determinant of growth factor-induced DNA synthesis in quiescent fibroblasts. FEBS Lett. 1985, 190, 115–119. [Google Scholar]
- Aerts, R.J.; Durston, A.J.; Moolenaar, W.H. Cytoplasmic pH and the regulation of the dictyostelium cell cycle. Cell 1985, 43, 653–657. [Google Scholar] [CrossRef]
- Birkeland, E.S.; Koch, L.M.; Dechant, R. Another Consequence of the Warburg Effect? Metabolic Regulation of Na+/H+ Exchangers May Link Aerobic Glycolysis to Cell Growth. Front. Oncol. 2020, 10, 1561. [Google Scholar]
- Calderón Montaño, J.; Burgos Morón, E.; Pérez Guerrero, M.; Salvador Bofill, F.; Robles Frías, A.; López Lázaro, M. Role of the Intracellular pH in the Metabolic Switch between Oxidative Phosphorylation and AerobicGlycolysis-Relevance to Cancer. WebmedCentral 2011, 2, 1–10. [Google Scholar]
- Icard, P.; Shulman, S.; Farhat, D.; Steyaert, J.M.; Alifano, M.; Lincet, H. How the Warburg effect supports aggressiveness and drug resistance of cancer cells? Drug Resist. Updat. 2018, 38, 1–11. [Google Scholar] [CrossRef]
- Alreshidi, M.M.; Dunstan, R.H.; Gottfries, J.; Macdonald, M.M.; Crompton, M.J.; Ang, C.S.; Williamson, N.A.; Roberts, T.K. Changes in the cytoplasmic composition of amino acids and proteins observed in Staphylococcus aureus during growth under variable growth conditions representative of the human wound site. PLoS ONE 2016, 11, e0159662. [Google Scholar]
- Reshkin, S.J.; Bellizzi, A.; Caldeira, S.; Albarani, V.; Malanchi, I.; Poignee, M.; Alunni-Fabbroni, M.; Casavola, V.; Tommasino, M. Na+ /H+ exchanger-dependent intracellular alkalinization is an early event in malignant transformation and plays an essential role in the development of subsequent transformation-associated phenotypes. FASEB J. 2000, 14, 2185–2197. [Google Scholar] [CrossRef] [PubMed]
- Riddle, S.R.; Ahmad, A.; Ahmad, S.; Deeb, S.S.; Malkki, M.; Schneider, B.K.; Allen, C.B.; White, C.W.; Suzette, R.; Ahmad, A.; et al. Hypoxia induces hexokinase II gene expression inhuman lung cell line A549. Am. J. Physiol.-Lung Cell. Mol. Physiol. 2000, 278, L407–L416. [Google Scholar] [CrossRef] [PubMed]
- Bergeron, M.; Yu, A.Y.; Solway, K.E.; Semenza, G.L.; Sharp, F.R. Induction of hypoxia-inducible factor-1 (HIF-1) and its target genes following focal ischaemia in rat brain. Eur. J. Neurosci. 1999, 11, 4159–4170. [Google Scholar] [CrossRef]
- Cota-Ruiz, K.; Leyva-Carrillo, L.; Peregrino-Uriarte, A.B.; Valenzuela-Soto, E.M.; Gollas-Galván, T.; Gómez-Jiménez, S.; Hernández, J.; Yepiz-Plascencia, G. Role of HIF-1 on phosphofructokinase and fructose 1, 6-bisphosphatase expression during hypoxia in the white shrimp Litopenaeus vannamei. Comp. Biochem. Physiol.-Part A Mol. Integr. Physiol. 2016, 198, 1–7. [Google Scholar]
- Pelletier, J.; Bellot, G.; Gounon, P.; Lacas-Gervais, S.; Pouysségur, J.; Mazure, N.M. Glycogen synthesis is induced in hypoxia by the hypoxia-inducible factor and promotes cancer cell survival. Front. Oncol. 2012, 2, 18. [Google Scholar] [CrossRef]
- Semenza, G.L.; Jiang, B.H.; Leung, S.W.; Passantino, R.; Concordat, J.P.; Maire, P.; Giallongo, A. Hypoxia response elements in the aldolase A, enolase 1, and lactate dehydrogenase a gene promoters contain essential binding sites for hypoxia-inducible factor 1. J. Biol. Chem. 1996, 271, 32529–32537. [Google Scholar] [CrossRef]
- Wigfield, S.M.; Winter, S.C.; Giatromanolaki, A.; Taylor, J.; Koukourakis, M.L.; Harris, A.L. PDK-1 regulates lactate production in hypoxia and is associated with poor prognosis in head and neck squamous cancer. Br. J. Cancer 2008, 98, 1975–1984. [Google Scholar] [CrossRef]
- Rosafio, K.; Pellerin, L. Oxygen tension controls the expression of the monocarboxylate transporter MCT4 in cultured mouse cortical astrocytes via a hypoxia-inducible factor-1α-mediated transcriptional regulation. Glia 2014, 62, 477–490. [Google Scholar] [CrossRef]
- McClelland, G.B.; Brooks, G.A. Changes in MCT 1, MCT 4, and LDH expression are tissue specific in rats after long-term hypobaric hypoxia. J. Appl. Physiol. 2002, 92, 1573–1584. [Google Scholar] [CrossRef]
- Ullah, M.S.; Davies, A.J.; Halestrap, A.P. The plasma membrane lactate transporter MCT4, but not MCT1, is up-regulated by hypoxia through a HIF-1α-dependent mechanism. J. Biol. Chem. 2006, 281, 9030–9037. [Google Scholar] [CrossRef]
- Baumann, M.U.; Zamudio, S.; Illsley, N.P. Hypoxic upregulation of glucose transporters in BeWo choriocarcinoma cells is mediated by hypoxia-inducible factor-1. Am. J. Physiol.-Cell Physiol. 2007, 293, 477–485. [Google Scholar]
- Hervouet, E.; Cízková, A.; Demont, J.; Vojtísková, A.; Pecina, P.; Franssen-van Hal, N.L.W.; Keijer, J.; Simonnet, H.; Ivének, R.; Kmoch, S.; et al. HIF and reactive oxygen species regulate oxidative phosphorylation in cancer. Carcinogenesis 2008, 29, 1528–1537. [Google Scholar] [CrossRef]
- Hervouet, E.; Demont, J.; Pecina, P.; Vojtísková, A.; Houstek, J.; Simonnet, H.; Godinot, C. A new role for the von Hippel-Lindau tumor suppressor protein: Stimulation of mitochondrial oxidative phosphorylation complex biogenesis. Carcinogenesis 2005, 26, 531–539. [Google Scholar]
- Fukuda, R.; Zhang, H.; Kim, J.W.; Shimoda, L.; Dang, C.V.; Semenza, G.L.L. HIF-1 Regulates Cytochrome Oxidase Subunits to Optimize Efficiency of Respiration in Hypoxic Cells. Cell 2007, 129, 111–122. [Google Scholar] [PubMed]
- Kang, J.H.; Lee, S.H.; Lee, J.S.; Nam, B.; Seong, T.W.; Son, J.; Jang, H.; Hong, K.M.; Lee, C.; Kim, S.Y. Aldehyde dehydrogenase inhibition combined with phenformin treatment reversed NSCLC through ATP depletion. Oncotarget 2016, 7, 49397–49410. [Google Scholar] [CrossRef]
- Kang, J.H.; Lee, S.H.; Hong, D.; Lee, J.S.; Ahn, H.S.; Ahn, J.H.; Seong, T.W.; Lee, C.H.; Jang, H.; Hong, K.M.; et al. Aldehyde dehydrogenase is used by cancer cells for energy metabolism. Exp. Mol. Med. 2016, 48, e272. [Google Scholar]
- Hong, S.M.; Hwang, S.W.; Wang, T.; Park, C.W.; Ryu, Y.M.; Jung, J.H.; Shin, J.H.; Kim, S.Y.; Lee, J.L.; Kim, C.W.; et al. Increased nicotinamide adenine dinucleotide pool promotes colon cancer progression by suppressing reactive oxygen species level. Cancer Sci. 2019, 110, 629–638. [Google Scholar] [CrossRef]
- Rempel, A.; Mathupala, S.P.; Griffin, C.A.; Hawkins, A.L.; Pedersen, P.L. Glucose catabolism in cancer cells: Amplification of the gene encoding type II hexokinase. Cancer Res. 1996, 56, 2468–2471. [Google Scholar]
- Chen, Z.; Zhang, H.; Lu, W.; Huang, P. Role of mitochondria-associated hexokinase II in cancer cell death induced by 3-bromopyruvate. Biochim. Biophys. Acta-Bioenerg. 2009, 1787, 553–560. [Google Scholar] [CrossRef]
- Anderson, M.; Marayati, R.; Moffitt, R.; Yeh, J.J. Hexokinase 2 promotes tumor growth and metastasis by regulating lactate production in pancreatic cancer. Oncotarget 2017, 8, 56081–56094. [Google Scholar]
- Yi, W.; Clark, P.M.; Mason, D.E.; Keenan, M.C.; Hill, C.; William, A.; Iii, G.; Peters, E.C.; Driggers, E.M.; Hsieh-wilson, L.C. PFK1 Glycosylation Is a Key Regulator of Cancer Cell Growth and Central Metabolic Pathways Wen. Science 2013, 337, 975–980. [Google Scholar]
- Zancan, P.; Sola-Penna, M.; Furtado, C.M.; Da Silva, D. Differential expression of phosphofructokinase-1 isoforms correlates with the glycolytic efficiency of breast cancer cells. Mol. Genet. Metab. 2010, 100, 372–378. [Google Scholar] [CrossRef]
- Sun, C.M.; Xiong, D.B.; Yan, Y.; Geng, J.; Liu, M.; Yao, X.D. Genetic alteration in phosphofructokinase family promotes growth of muscle-invasive bladder cancer. Int. J. Biol. Markers 2016, 31, e286–e293. [Google Scholar] [CrossRef] [PubMed]
- Mazurek, S.; Boschek, C.B.; Hugo, F.; Eigenbrodt, E. Pyruvate kinase type M2 and its role in tumor growth and spreading. Semin. Cancer Biol. 2005, 15, 300–308. [Google Scholar] [CrossRef] [PubMed]
- Prakasam, G.; Iqbal, M.A.; Bamezai, R.N.K.; Mazurek, S. Posttranslational modifications of pyruvate kinase M2: Tweaks that benefit cancer. Front. Oncol. 2018, 8, 22. [Google Scholar] [CrossRef]
- Zahra, K.; Dey, T.; Ashish; Mishra, S.P.; Pandey, U. Pyruvate Kinase M2 and Cancer: The Role of PKM2 in Promoting Tumorigenesis. Front. Oncol. 2020, 10, 505842. [Google Scholar] [CrossRef]
- Shiroki, T.; Yokoyama, M.; Tanuma, N.; Maejima, R.; Tamai, K.; Yamaguchi, K.; Oikawa, T.; Noguchi, T.; Miura, K.; Fujiya, T.; et al. Enhanced expression of the M2 isoform of pyruvate kinase is involved in gastric cancer development by regulating cancer-specific metabolism. Cancer Sci. 2017, 108, 931–940. [Google Scholar] [CrossRef]
- Kolobova, E.; Tuganova, A.; Boulatnikov, I.; Popov, K.M. Regulation of pyruvate dehydrogenase activity through phosphorylation at multiple sites. Biochemistry 2001, 77, 69–77. [Google Scholar] [CrossRef]
- Dai, Z.J.; Pan, S.; Chen, C.; Cao, L.; Li, X.; Chen, X.; Su, X.; Lin, S. Down-regulation of succinate dehydrogenase subunit B and up-regulation of pyruvate dehydrogenase kinase 1 predicts poor prognosis in recurrent nasopharyngeal carcinoma. Tumor Biol. 2016, 37, 5145–5152. [Google Scholar]
- Wang, J.J.; Siu, M.K.; Jiang, Y.X.; Leung, T.H.; Chan, D.W.; Cheng, R.R.; Cheung, A.N.; Ngan, H.Y.; Chan, K.K. Aberrant upregulation of PDK1 in ovarian cancer cells impairs CD8+ T cell function and survival through elevation of PD-L1. Oncoimmunology 2019, 8, 1659092. [Google Scholar]
- Herzig, S.; Shaw, R.J. AMPK: Guardian of metabolism and mitochondrial homeostasis. Nat. Rev. Mol. Cell Biol. 2018, 19, 121–135. [Google Scholar] [CrossRef]
- Hong, S.P.; Leiper, F.C.; Woods, A.; Carling, D.; Carlson, M. Activation of yeast Snf1 and mammalian AMP-activated protein kinase by upstream kinases. Proc. Natl. Acad. Sci. USA 2003, 100, 8839–8843. [Google Scholar] [CrossRef] [PubMed]
- Shaw, R.J.; Kosmatka, M.; Bardeesy, N.; Hurley, R.L.; Witters, L.A.; DePinho, R.A.; Cantley, L.C. The tumor suppressor LKB1 kinase directly activates AMP-activated kinase and regulates apoptosis in response to energy stress. Proc. Natl. Acad. Sci. USA 2004, 101, 3329–3335. [Google Scholar]
- Xiao, B.; Sanders, M.J.; Underwood, E.; Heath, R.; Mayer, F.V.; Carmena, D.; Jing, C.; Walker, P.A.; Eccleston, J.F.; Haire, L.F.; et al. Structure of mammalian AMPK and its regulation by ADP. Nature 2011, 472, 230–233. [Google Scholar]
- Liu, Q.; Gauthier, M.; Sun, L.; Ruderman, N.; Lodish, H. Activation of AMP-activated protein kinase signaling pathway by adiponectin and insulin in mouse adipocytes: Requirement of acyl-CoA synthetases FATP1 and Acsl1 and association with an elevation in AMP/ATP ratio. FASEB J. 2010, 24, 4229–4239. [Google Scholar] [CrossRef]
- Hardie, D.G. Molecular pathways: Is AMPK a friend or a foe in cancer? Clin. Cancer Res. 2015, 21, 3836–3840. [Google Scholar] [CrossRef]
- Li, N.; Huang, D.; Lu, N.; Luo, L. Role of the LKB1/AMPK pathway in tumor invasion and metastasis of cancer cells (Review). Oncol. Rep. 2015, 34, 2821–2826. [Google Scholar] [CrossRef]
- Yung, M.M.H.; Chan, D.W.; Liu, V.W.S.; Yao, K.M.; Ngan, H.Y.S. Activation of AMPK inhibits cervical cancer cell growth through AKT/FOXO3a/FOXM1 signaling cascade. BMC Cancer 2013, 13, 327. [Google Scholar] [CrossRef]
- Zhou, J.; Huang, W.; Tao, R.; Ibaragi, S.; Lan, F.; Ido, Y.; Wu, X.; Alekseyev, Y.O.; Lenburg, M.E.; Hu, G.F.; et al. Inactivation of AMPK alters gene expression and promotes growth of prostate cancer cells. Oncogene 2009, 28, 1993–2002. [Google Scholar] [CrossRef] [PubMed]
- Mack, H.I.D.; Zheng, B.; Asara, J.M.; Thomas, S.M. AMPK-dependent phosphorylation of ULK1 regulates ATG9 localization. Autophagy 2012, 8, 1197–1214. [Google Scholar] [CrossRef] [PubMed]
- Petherick, K.J.; Conway, O.J.L.; Mpamhanga, C.; Osborne, S.A.; Kamal, A.; Saxty, B.; Ganley, I.G. Pharmacological inhibition of ULK1 kinase blocks mammalian target of rapamycin (mTOR)-dependent autophagy. J. Biol. Chem. 2015, 290, 11376–11383. [Google Scholar] [CrossRef] [PubMed]
- Di Nardo, A.; Wertz, M.H.; Kwiatkowski, E.; Tsai, P.T.; Leech, J.D.; Greene-Colozzi, E.; Goto, J.; Dilsiz, P.; Talos, D.M.; Clish, C.B.; et al. Neuronal Tsc1/2 complex controls autophagy through AMPK-dependent regulation of ULK1. Hum. Mol. Genet. 2014, 23, 3865–3874. [Google Scholar]
- Faubert, B.; Boily, G.; Izreig, S.; Griss, T.; Samborska, B.; Dong, Z.; Dupuy, F.; Chambers, C.; Fuerth, B.J.; Viollet, B.; et al. AMPK is a negative regulator of the warburg effect and suppresses tumor growth in vivo. Cell Metab. 2013, 17, 113–124. [Google Scholar]
- Inoki, K.; Zhu, T.; Guan, K.-L.G. TSC2 Mediates Cellular Energy Response to Control Cell Growth and Survival. Cell 2003, 115, 577–590. [Google Scholar] [CrossRef]
- Inoki, K.; Li, Y.; Zhu, T.; Wu, J.; Guan, K.-L. TSC2 is phosphorylated and inhibited by Akt and suppresses mTOR signalling. Nat. Cell Biol. 2002, 4, 648–657. [Google Scholar] [CrossRef]
- Inoki, K.; Li, Y.; Xu, T.; Guan, K.L. Rheb GTpase is a direct target of TSC2 GAP activity and regulates mTOR signaling. Genes Dev. 2003, 17, 1829–1834. [Google Scholar] [CrossRef]
- Sun, Q.; Chen, X.; Ma, J.; Peng, H.; Wang, F.; Zha, X.; Wang, Y.; Jing, Y.; Yang, H.; Chen, R.; et al. Mammalian target of rapamycin up-regulation of pyruvate kinase isoenzyme type M2 is critical for aerobic glycolysis and tumor growth. Proc. Natl. Acad. Sci. USA 2011, 108, 4129–4134. [Google Scholar] [CrossRef]
- Ling, N.X.Y.; Kaczmarek, A.; Hoque, A.; Davie, E.; Ngoei, K.R.W.; Morrison, K.R.; Smiles, W.J.; Forte, G.M.; Wang, T.; Lie, S.; et al. mTORC1 directly inhibits AMPK to promote cell proliferation under nutrient stress. Nat. Metab. 2020, 2, 41–49. [Google Scholar] [CrossRef]
- Guo, X.; Li, H.; Xu, H.; Woo, S.; Dong, H.; Lu, F.; Lange, A.J.; Wu, C. Glycolysis in the control of blood glucose homeostasis. Acta Pharm. Sin. B 2012, 2, 358–367. [Google Scholar] [CrossRef]
- Nesher, R.; Praiss, M.; Cerasi, E. Immediate and time-dependent effects of gluoce on insulin release: Differential calcium requirements. Acta Endocrinol. 1988, 117, 409–416. [Google Scholar]
- Pottout, V.; Robertson, R.P. Secondary B-cell failure in Type 2 Diabetes-A convergence of Glucotoxicity and lipotoxicity. Endocrinology 2002, 143, 339–342. [Google Scholar] [CrossRef]
- Rossetti, L.; Shulman, G.I.; Zawalich, W.; DeFronzo, R.A. Effect of chronic hyperglycemia on in vivo insulin secretion in partially pancreatectomized rats. J. Clin. Investig. 1987, 80, 1037–1044. [Google Scholar]
- Gerber, P.A.; Rutter, G.A. The Role of Oxidative Stress and Hypoxia in Pancreatic Beta-Cell Dysfunction in Diabetes Mellitus. Antioxidants Redox Signal. 2017, 26, 501–518. [Google Scholar]
- Noguchi, R.; Kubota, H.; Yugi, K.; Toyoshima, Y.; Komori, Y.; Soga, T.; Kuroda, S. The selective control of glycolysis, gluconeogenesis and glycogenesis by temporal insulin patterns. Mol. Syst. Biol. 2013, 9, 664. [Google Scholar]
- Bitar, M.S.; Al-Mulla, F. ROS constitute a convergence nexus in the development of IGF1 resistance and impaired wound healing in a rat model of type 2 diabetes. DMM Dis. Model. Mech. 2012, 5, 375–388. [Google Scholar]
- Al-Lahham, R.; Deford, J.H.; Papaconstantinou, J. Mitochondrial-generated ROS down regulates insulin signaling via activation of the p38MAPK stress response pathway. Mol. Cell. Endocrinol. 2016, 419, 1–11. [Google Scholar] [CrossRef] [PubMed]
- Ogihara, T.; Asano, T.; Katagiri, H.; Sakoda, H.; Anai, M.; Shojima, N.; Ono, H.; Fujishiro, M.; Kushiyama, A.; Fujita, Y.; et al. Oxidative stress induces insulin resistance by activating the nuclear factor-kappa B pathway and disrupting normal subcellular distribution of phosphatidylinositol 3-kinase. Diabetologia 2004, 47, 794–805. [Google Scholar] [PubMed]
- Newsholme, P.; Haber, E.P.; Hirabara, S.M.; Rebelato, E.L.O.; Procopio, J.; Morgan, D.; Oliveira-Emilio, H.C.; Carpinelli, A.R.; Curi, R. Diabetes associated cell stress and dysfunction: Role of mitochondrial and non-mitochondrial ROS production and activity. J. Physiol. 2007, 583, 9–24. [Google Scholar]
- Hoeks, J.; Van Herpen, N.A.; Mensink, M.; Moonen-Kornips, E.; Van Beurden, D.; Hesselink, M.K.C.; Schrauwen, P. Prolonged fasting identifies skeletal muscle mitochondrial dysfunction as consequence rather than cause of human insulin resistance. Diabetes 2010, 59, 2117–2125. [Google Scholar] [CrossRef]
- Bonnard, C.; Durand, A.; Peyrol, S.; Chanseaume, E.; Chauvin, M.A.; Morio, B.; Vidal, H.; Rieusset, J. Mitochondrial dysfunction results from oxidative stress in the skeletal muscle of diet-induced insulin-resistant mice. J. Clin. Investig. 2008, 118, 789–800. [Google Scholar] [CrossRef]
- Mootha, V.K.; Lindgren, C.M.; Eriksson, K.F.; Subramanian, A.; Sihag, S.; Lehar, J.; Puigserver, P.; Carlsson, E.; Ridderstråle, M.; Laurila, E.; et al. PGC-1α-responsive genes involved in oxidative phosphorylation are coordinately downregulated in human diabetes. Nat. Genet. 2003, 34, 267–273. [Google Scholar] [CrossRef]
- Asmann, Y.W.; Stump, C.S.; Short, K.R.; Coenen-Schimke, J.M.; Guo, Z.K.; Bigelow, M.L.; Nair, K.S. Skeletal muscle mitochondrial functions, mitochondrial DNA copy numbers, and gene transcript profiles in type 2 diabetic and nondiabetic subjects at equal levels of low or high insulin and euglycemia. Diabetes 2006, 55, 3309–3319. [Google Scholar] [CrossRef]
- Sparks, L.M.; Xie, H.; Koza, R.A.; Mynatt, R.; Hulver, M.W.; Bray, G.A.; Smith, S.R. A High-Fat Diet Coordinately Downregulates Genes Required for Mitochondrial Oxidative Phosphorylation in Skeletal Muscle. Diabetes 2005, 54, 1926–1933. [Google Scholar] [CrossRef]
- Mogensen, M.; Sahlin, K.; Fernström, M.; Glintborg, D.; Vind, B.F.; Beck-Nielsen, H.; Højlund, K. Mitochondrial respiration is decreased in skeletal muscle of patients with type 2 diabetes. Diabetes 2007, 56, 1592–1599. [Google Scholar]
- Poussin, C.; Ibberson, M.; Hall, D.; Ding, J.; Soto, J.; Abel, E.D.; Thorens, B. Oxidative phosphorylation flexibility in the liver of mice resistant to high-fat diet-induced hepatic steatosis. Diabetes 2011, 60, 2216–2224. [Google Scholar] [CrossRef] [PubMed]
- Pospisilik, J.A.; Knauf, C.; Joza, N.; Benit, P.; Orthofer, M.; Cani, P.D.; Ebersberger, I.; Nakashima, T.; Sarao, R.; Neely, G.; et al. Targeted Deletion of AIF Decreases Mitochondrial Oxidative Phosphorylation and Protects from Obesity and Diabetes. Cell 2007, 131, 476–491. [Google Scholar] [CrossRef] [PubMed]
- Roden, M. Muscle triglycerides and mitochondrial function: Possible mechanisms for the development of type 2 diabetes. Int. J. Obes. 2005, 29, S111–S115. [Google Scholar]
- Fazakerley, D.J.; Minard, A.Y.; Krycer, J.R.; Thomas, K.C.; Stöckli, J.; Harney, D.J.; Burchfield, J.G.; Maghzal, G.J.; Caldwell, S.T.; Hartley, R.C.; et al. Mitochondrial oxidative stress causes insulin resistance without disrupting oxidative phosphorylation. J. Biol. Chem. 2018, 293, 7315–7328. [Google Scholar] [CrossRef]
- Lewis, M.T.; Kasper, J.D.; Bazil, J.N.; Frisbee, J.C.; Wiseman, R.W. Quantification of mitochondrial oxidative phosphorylation in metabolic disease: Application to type 2 diabetes. Int. J. Mol. Sci. 2019, 20, 5271. [Google Scholar] [CrossRef]
- Lund, M.T.; Kristensen, M.; Hansen, M.; Tveskov, L.; Floyd, A.K.; Støckel, M.; Vainer, B.; Poulsen, S.S.; Helge, J.W.; Prats, C.; et al. Hepatic mitochondrial oxidative phosphorylation is normal in obese patients with and without type 2 diabetes. J. Physiol. 2016, 594, 4351–4358. [Google Scholar] [CrossRef]
- El-Najjar, N.; Chatila, M.; Moukadem, H.; Vuorela, H.; Ocker, M.; Gandesiri, M.; Schneider-Stock, R.; Gali-Muhtasib, H. Reactive oxygen species mediate thymoquinone-induced apoptosis and activate ERK and JNK signaling. Apoptosis 2010, 15, 183–195. [Google Scholar] [CrossRef]
- Schreck, R.; Rieber, P.; Baeuerle, P.A. Reactive oxygen intermediates as apparently widely used messengers in the activation of the NF-κB transcription factor and HIV-1. EMBO J. 1991, 10, 2247–2258. [Google Scholar] [CrossRef]
- Gloire, G.; Legrand-Poels, S.; Piette, J. NF-κB activation by reactive oxygen species: Fifteen years later. Biochem. Pharmacol. 2006, 72, 1493–1505. [Google Scholar] [CrossRef]
- Dabrowski, A.; Boguslowicz, C.; Dabrowska, M.; Tribillo, I.; Gabryelewicz, A. Reactive oxygen species activate mitogen-activated protein kinases in pancreatic acinar cells. Pancreas 2000, 21, 376–384. [Google Scholar] [CrossRef]
- Ringvold, H.C.; Khalil, R.A. Chapter Six-Protein Kinase C as Regulator of Vascular Smooth Muscle Function and Potential Target in Vascular Disorders. In Vascular Pharmacology; Academic Press: Cambridge, MA, USA, 2017; Volume 78, pp. 203–301. [Google Scholar]
- Bitar, M.S.; Al-Mulla, F. Upregulation of CREM/ICER suppresses wound endothelial CRE-HIF-1α-VEGF-dependent signaling and impairs angiogenesis in type 2 diabetes. DMM Dis. Model. Mech. 2015, 8, 65–80. [Google Scholar]
- Bitar, M.S.; Wahid, S.; Mustafa, S.; Al-Saleh, E.; Dhaunsi, G.S.; Al-Mulla, F. Nitric oxide dynamics and endothelial dysfunction in type II model of genetic diabetes. Eur. J. Pharmacol. 2005, 511, 53–64. [Google Scholar] [CrossRef]
- Bitar, M.S.; Al-Mulla, F. A defect in nrf2 signaling constitutes a mechanism for cellular stress hypersensitivity in a genetic rat model of type 2 diabetes. Am. J. Physiol.-Endocrinol. Metab. 2011, 301, E1119–E1129. [Google Scholar] [PubMed]
- Akhter, N.; Madhoun, A.; Arefanian, H.; Wilson, A.; Kochumon, S.; Thomas, R.; Shenouda, S.; Al-Mulla, F.; Ahmad, R.; Sindhu, S. Oxidative stress induces expression of the toll-like receptors (TLRs) 2 and 4 in the human peripheral blood mononuclear cells: Implications for metabolic inflammation. Cell. Physiol. Biochem. 2019, 53, 1–18. [Google Scholar]
- Ben Djoudi Ouadda, A.; Levy, E.; Ziv, E.; Lalonde, G.; Sané, A.T.; Delvin, E.; Elchebly, M. Increased hepatic lipogenesis in insulin resistance and Type 2 diabetes is associated with AMPK signalling pathway up-regulation in Psammomys obesus. Biosci. Rep. 2009, 29, 283–292. [Google Scholar] [CrossRef]
- Ji, J.; Petropavlovskaia, M.; Khatchadourian, A.; Patapas, J.; Makhlin, J.; Rosenberg, L.; Maysinger, D. Type 2 diabetes is associated with suppression of autophagy and lipid accumulation in β-cells. J. Cell. Mol. Med. 2019, 23, 2890–2900. [Google Scholar] [CrossRef]
- Luo, Z.; Zhang, Y.; Li, F.; He, J.; Ding, H.; Yan, L.; Cheng, H. Resistin induces insulin resistance by both AMPK-dependent and AMPK-independent mechanisms in HepG2 cells. Endocrine 2009, 36, 60–69. [Google Scholar]
- Fujii, N.; Ho, R.C.; Manabe, Y.; Jessen, N.; Toyoda, T.; Holland, W.L.; Summers, S.A.; Hirshman, M.F.; Goodyear, L.J. Ablation of AMP-activated protein kinase α 2 activity exacerbates insulin resistance induced by high-fat feeding of mice. Diabetes 2008, 57, 2958–2966. [Google Scholar] [CrossRef]
- Kraegen, E.W.; Saha, A.K.; Preston, E.; Wilks, D.; Hoy, A.J.; Cooney, G.J.; Ruderman, N.B. Increased malonyl-CoA and diacylglycerol content and reduced AMPK activity accompany insulin resistance induced by glucose infusion in muscle and liver of rats. Am. J. Physiol.-Endocrinol. Metab. 2006, 290, 471–479. [Google Scholar] [CrossRef]
- Lee, J.M.; Seo, W.Y.; Song, K.H.; Chanda, D.; Kim, Y.D.; Kim, D.K.; Lee, M.W.; Ryu, D.; Kim, Y.H.; Noh, J.R.; et al. AMPK-dependent repression of hepatic gluconeogenesis via disruption of CREB·CRTC2 complex by orphan nuclear receptor small heterodimer partner. J. Biol. Chem. 2010, 285, 32182–32191. [Google Scholar] [CrossRef]
- Lu, J. The Warburg metabolism fuels tumor metastasis. Cancer Metastasis Rev. 2019, 38, 157–164. [Google Scholar] [CrossRef]
- Hsu, C.C.; Tseng, L.M.; Lee, H.C. Role of mitochondrial dysfunction in cancer progression. Exp. Biol. Med. 2016, 241, 1281–1295. [Google Scholar]
- Chaudhary, A.K.; Bhat, T.A.; Kumar, S.; Kumar, A.; Kumar, R.; Underwood, W.; Koochekpour, S.; Shourideh, M.; Yadav, N.; Dhar, S.; et al. Mitochondrial dysfunction-mediated apoptosis resistance associates with defective heat shock protein response in African-American men with prostate cancer. Br. J. Cancer 2016, 114, 1090–1100. [Google Scholar] [PubMed]
- Esner, M.; Graifer, D.; Lleonart, M.E.; Lyakhovich, A. Targeting cancer cells through antibiotics-induced mitochondrial dysfunction requires autophagy inhibition. Cancer Lett. 2017, 384, 60–69. [Google Scholar] [CrossRef] [PubMed]
- Sun, J.; Hoshino, H.; Takaku, K.; Nakajima, O.; Muto, A.; Suzuki, H.; Tashiro, S.; Takahashi, S.; Shibahara, S.; Alam, J.; et al. Hemoprotein Bach1 regulates enhancer availability of heme oxygenase-1 gene. EMBO J. 2002, 21, 5216–5224. [Google Scholar] [CrossRef] [PubMed]
- Dohi, Y.; Ikura, T.; Hoshikawa, Y.; Katoh, Y.; Ota, K.; Nakanome, A.; Muto, A.; Omura, S.; Ohta, T.; Ito, A.; et al. Bach1 inhibits oxidative stress-induced cellular senescence by impeding p53 function on chromatin. Nat. Struct. Mol. Biol. 2008, 15, 1246–1254. [Google Scholar] [CrossRef] [PubMed]
- Rosner, M.R.; Lee, J.; Yesilkanal, A.E.; Wynne, J.P.; Frankenberger, C.; Liu, J.; Yan, J.; Elbaz, M.; Rabe, D.C.; Rustandy, F.D.; et al. Effective breast cancer combination therapy targeting BACH1 and mitochondrial metabolism. Nature 2019, 568, 254–258. [Google Scholar]
- Pomatto, L.C.D.; Davies, K.J.A. The role of declining adaptive homeostasis in ageing. J. Physiol. 2017, 595, 7275–7309. [Google Scholar] [PubMed]
- Wiel, C.; Le Gal, K.; Ibrahim, M.X.; Jahangir, C.A.; Kashif, M.; Yao, H.; Ziegler, D.V.; Xu, X.; Ghosh, T.; Mondal, T.; et al. BACH1 Stabilization by Antioxidants Stimulates Lung Cancer Metastasis. Cell 2019, 178, 330–345.e22. [Google Scholar] [CrossRef] [PubMed]
- Mansoori, B.; Dehghan, R.; Duijf, P.; Mohammadi, A. miR-142-3p as tumor suppressor miRNA in the regulation of tumorigenicity, invasion and migration of human breast cancer by targeting Bach-1 expression. J. Cell. Physiol. 2018, 234, 9816–9825. [Google Scholar]
- Id, S.S.; Mansoori, B.; Mohammadi, A.; Shajari, N.; Duijf, P.H.G.; Najafi, S. miR-330 Regulates Colorectal Cancer Oncogenesis by Targeting BACH1. Tabriz Univ. Med. Sci. 2020, 10, 444–451. [Google Scholar]
- Zhou, L.; Zhang, H.; Davies, K.J.A.; Forman, H.J. Aging-related decline in the induction of Nrf2-regulated antioxidant genes in human bronchial epithelial cells. Redox Biol. 2018, 14, 35–40. [Google Scholar] [CrossRef]
- Sun, R.C.; Fadia, M.; Dahlstrom, J.E.; Parish, C.R.; Board, P.G.; Blackburn, A.C. Reversal of the glycolytic phenotype by dichloroacetate inhibits metastatic breast cancer cell growth in vitro and in vivo. Breast Cancer Res. Treat. 2010, 120, 253–260. [Google Scholar] [CrossRef]
- De Rosa, V.; Iommelli, F.; Monti, M.; Fonti, R.; Votta, G.; Stoppelli, M.P.; Del Vecchio, S. Reversal of warburg effect and reactivation of oxidative phosphorylation by differential inhibition of EGFR signaling pathways in non-small cell lung cancer. Clin. Cancer Res. 2015, 21, 5110–5120. [Google Scholar] [CrossRef]
- Zhuang, Y.; Keith, W.K. Cell cycle arrest in Metformin treated breast cancer cells involves activation of AMPK, downregulation of cyclin D1, and requires p27Kip1 or p21Cip1. J. Mol. Signal. 2008, 3, 18. [Google Scholar] [CrossRef] [PubMed]
- Liang, J.; Shao, S.H.; Xu, Z.X.; Hennessy, B.; Ding, Z.; Larrea, M.; Kondo, S.; Dumont, D.J.; Gutterman, J.U.; Walker, C.L.; et al. The energy sensing LKB1-AMPK pathway regulates p27 phosphorylation mediating the decision to enter autophagy or apoptosis. Nat. Cell Biol. 2007, 9, 218–224. [Google Scholar] [CrossRef] [PubMed]
- Yang, J.; Nie, J.; Ma, X.; Wei, Y.; Peng, Y.; Wei, X. Targeting PI3K in cancer: Mechanisms and advances in clinical trials. Mol. Cancer 2019, 18, 26. [Google Scholar] [CrossRef] [PubMed]
- Khan, K.H.; Wong, M.; Rihawi, K.; Bodla, S.; Morganstein, D.; Banerji, U.; Molife, L.R. Hyperglycemia and Phosphatidylinositol 3-Kinase/Protein Kinase B/Mammalian Target of Rapamycin (PI3K/AKT/mTOR) Inhibitors in Phase I Trials: Incidence, Predictive Factors, and Management. Oncologist 2016, 21, 855–860. [Google Scholar] [CrossRef]
- Cui, Y.; Zhou, J.; Rong, F. Combination of metformin and RG7388 enhances inhibition of growth and induction of apoptosis of ovarian cancer cells through the PI3K/AKT/mTOR pathway. Biochem. Biophys. Res. Commun. 2020, 533, 665–671. [Google Scholar]
- Candido, S.; Abrams, S.L.; Steelman, L.; Lertpiriyapong, K.; Martelli, A.M.; Cocco, L.; Ratti, S.; Follo, M.Y.; Murata, R.M.; Rosalen, P.L.; et al. Metformin influences drug sensitivity in pancreatic cancer cells. Adv. Biol. Regul. 2018, 68, 13–30. [Google Scholar] [CrossRef]
- Cantley, L.C. The Phosphoinositide 3-Kinase Pathway. Science 2002, 296, 1655–1657. [Google Scholar] [CrossRef]
- Lennartz, M.R. Phospholipases and phagocytosis: The role of phospholipid-derived second messengers in phagocytosis. Int. J. Biochem. Cell Biol. 1999, 31, 415–430. [Google Scholar] [CrossRef]
- Fang, Y.; Park, I.H.; Wu, A.L.; Du, G.; Huang, P.; Frohman, M.A.; Walker, S.J.; Brown, H.A.; Chen, J. PLD1 Regulates mTOR Signaling and Mediates Cdc42 Activation of S6K1. Curr. Biol. 2003, 13, 2037–2044. [Google Scholar] [CrossRef]
- O’neil, T.K.; Duffy, L.R.; Frey, J.W.; Hornberger, T.A. The role of phosphoinositide 3-kinase and phosphatidic acid in the regulation of mammalian target of rapamycin following eccentric contractions. J. Physiol. 2009, 587, 3691–3701. [Google Scholar] [CrossRef]
- Hong-Brown, L.Q.; Brown, C.R.; Navaratnarajah, M.; Lang, C.H. Activation of AMPK/TSC2/PLD by Alcohol Regulates mTORC1 and mTORC2 Assembly in C2C12 Myocytes. Alcohol. Clin. Exp. Res. 2013, 37, 1849–1861. [Google Scholar] [CrossRef]
- Standaert, M.L.; Avignon, A.; Yamada, K.; Bandyopadhyay, G.; Farese, R. V The phosphatidylinositol 3-kinase inhibitor, wortmannin, inhibits insulin-induced activation of phosphatidylcholine hydrolysis and associated protein kinase C translocation in rat adipocytes. Biochem. J. 1996, 313, 1039–1046. [Google Scholar] [CrossRef]
- Lee, J.S.; Kim, J.H.; Jang, I.H.; Kim, H.S.; Han, J.M.; Kazlauskas, A.; Yagisawa, H.; Suh, P.-G.; Ryu, S.H. Phosphatidylinositol (3,4,5)-trisphosphate specifically interacts with the phox homology domain of phospholipase D1 and stimulates its activity. J. Cell Sci. 2005, 118, 4405–4413. [Google Scholar]
- Toschi, A.; Lee, E.; Xu, L.; Garcia, A.; Gadir, N.; Foster, D.A. Regulation of mTORC1 and mTORC2 Complex Assembly by Phosphatidic Acid: Competition with Rapamycin. Mol. Cell. Biol. 2009, 29, 1411–1420. [Google Scholar] [CrossRef]
- Franke, T.F.; Kaplan, D.R.; Cantley, L.C.; Toker, A. Direct Regulation of the Akt Proto-Oncogene Product by Phosphatidylinositol-3,4-bisphosphate. Science 1997, 275, 665–668. [Google Scholar] [CrossRef]
- Frame, S.; Cohen, P.; Biondi, R.M. A common phosphate binding site explains the unique substrate specificity of GSK3 and its inactivation by phosphorylation. Mol. Cell 2001, 7, 1321–1327. [Google Scholar] [PubMed]
- Salazar, M.; Rojo, A.I.; Velasco, D.; de Sagarra, R.M.; Cuadrado, A. Glycogen Synthase Kinase-3β Inhibits the Xenobiotic and Antioxidant Cell Response by Direct Phosphorylation and Nuclear Exclusion of the Transcription Factor Nrf2*. J. Biol. Chem. 2006, 281, 14841–14851. [Google Scholar] [CrossRef] [PubMed]
- Kensler, T.W.; Wakabayashi, N.; Biswal, S. Cell Survival Responses to Environmental Stresses Via the Keap1-Nrf2-ARE Pathway. Annu. Rev. Pharmacol. Toxicol. 2007, 47, 89–116. [Google Scholar] [PubMed]
- Wang, X.-J.; Sun, Z.; Villeneuve, N.F.; Zhang, S.; Zhao, F.; Li, Y.; Chen, W.; Yi, X.; Zheng, W.; Wondrak, G.T.; et al. Nrf2 enhances resistance of cancer cells to chemotherapeutic drugs, the dark side of Nrf2. Carcinogenesis 2008, 29, 1235–1243. [Google Scholar] [CrossRef]
- Mitsuishi, Y.; Taguchi, K.; Kawatani, Y.; Shibata, T.; Nukiwa, T.; Aburatani, H.; Yamamoto, M.; Motohashi, H. Nrf2 Redirects Glucose and Glutamine into Anabolic Pathways in Metabolic Reprogramming. Cancer Cell 2012, 22, 66–79. [Google Scholar] [CrossRef]
- DeNicola, G.M.; Karreth, F.A.; Humpton, T.J.; Gopinathan, A.; Wei, C.; Frese, K.; Mangal, D.; Yu, K.H.; Yeo, C.J.; Calhoun, E.S.; et al. Oncogene-induced Nrf2 transcription promotes ROS detoxification and tumorigenesis. Nature 2011, 475, 106–109. [Google Scholar] [CrossRef] [PubMed]
- Wang, H.; Liu, X.; Long, M.; Huang, Y.; Zhang, L.; Zhang, R.; Zheng, Y.; Liao, X.; Wang, Y.; Liao, Q.; et al. NRF2 activation by antioxidant antidiabetic agents accelerates tumor metastasis. Sci. Transl. Med. 2016, 8, 334ra51. [Google Scholar] [CrossRef]
- Padmanabhan, B.; Tong, K.I.; Ohta, T.; Nakamura, Y.; Scharlock, M.; Ohtsuji, M.; Kang, M.-I.; Kobayashi, A.; Yokoyama, S.; Yamamoto, M. Structural Basis for Defects of Keap1 Activity Provoked by Its Point Mutations in Lung Cancer. Mol. Cell 2006, 21, 689–700. [Google Scholar] [CrossRef]
- Mukhopadhyay, S.; Goswami, D.; Adiseshaiah, P.P.; Burgan, W.; Yi, M.; Guerin, T.M.; Kozlov, S.V.; Nissley, D.V.; McCormick, F. Undermining Glutaminolysis Bolsters Chemotherapy While NRF2 Promotes Chemoresistance in KRAS-Driven Pancreatic Cancers. Cancer Res. 2020, 80, 1630–1643. [Google Scholar] [CrossRef] [PubMed]
- Hayes, J.D.; Dinkova-Kostova, A.T. The Nrf2 regulatory network provides an interface between redox and intermediary metabolism. Trends Biochem. Sci. 2014, 39, 199–218. [Google Scholar] [CrossRef]
- Taguchi, K.; Motohashi, H.; Yamamoto, M. Molecular mechanisms of the Keap1–Nrf2 pathway in stress response and cancer evolution. Genes to Cells 2011, 16, 123–140. [Google Scholar] [PubMed]
- Joza, N.; Oudit, G.Y.; Brown, D.; Bénit, P.; Kassiri, Z.; Vahsen, N.; Benoit, L.; Patel, M.M.; Nowikovsky, K.; Vassault, A.; et al. Muscle-Specific Loss of Apoptosis-Inducing Factor Leads to Mitochondrial Dysfunction, Skeletal Muscle Atrophy, and Dilated Cardiomyopathy. Mol. Cell. Biol. 2005, 25, 10261–10272. [Google Scholar] [PubMed]
- Susin, S.A.; Lorenzo, H.K.; Zamzami, N.; Marzo, I.; Snow, B.E.; Brothers, G.M.; Mangion, J.; Jacotot, E.; Costantini, P.; Loef¯er, M.; et al. Molecular characterization of mitochondrial apoptosis-inducing factor. Lett. to Nat. 1999, 353, 441–446. [Google Scholar] [CrossRef] [PubMed]
- Vahsen, N.; Candé, C.; Brière, J.J.; Bénit, P.; Joza, N.; Larochette, N.; Mastroberardino, P.G.; Pequignot, M.O.; Casares, N.; Lazar, V.; et al. AIF deficiency compromises oxidative phosphorylation. EMBO J. 2004, 23, 4679–4689. [Google Scholar] [CrossRef]
- Cheung, E.C.C.; Joza, N.; Steenaart, N.A.E.; McClellan, K.A.; Neuspiel, M.; McNamara, S.; MacLaurin, J.G.; Rippstein, P.; Park, D.S.; Shore, G.C.; et al. Dissociating the dual roles of apoptosis-inducing factor in maintaining mitochondrial structure and apoptosis. EMBO J. 2006, 25, 4061–4073. [Google Scholar] [CrossRef]
- Huang, X.; Liu, G.; Guo, J.; Su, Z.Q. The PI3K/AKT pathway in obesity and type 2 diabetes. Int. J. Biol. Sci. 2018, 14, 1483–1496. [Google Scholar] [CrossRef]
- Kousteni, S. FoxO1, the transcriptional chief of staff of energy metabolism. Bone 2012, 50, 437–443. [Google Scholar] [CrossRef]
- Sullivan, I.; Zhang, W.; Wasserman, D.H.; Liew, C.W.; Liu, J.; Paik, J.; Depinho, R.A.; Stolz, D.B.; Kahn, C.R.; Schwartz, M.W.; et al. FoxO1 integrates direct and indirect effects of insulin on hepatic glucose production and glucose utilization. Nat. Commun. 2015, 6, 7079. [Google Scholar] [CrossRef]
- Hay, N. Interplay between FOXO, TOR, and Akt. Biochim. Biophys. Acta-Mol. Cell Res. 2011, 1813, 1965–1970. [Google Scholar] [CrossRef]
- Cross, D.A.E.; Alessi, D.R.; Cohen, P.; Andjelkovich, M.; Hemmings, B.A. Inhibition of glycogen synthase kinase-3 by insulin mediated by protein kinase B. Nature 1995, 378, 785–789. [Google Scholar] [CrossRef]
- Krycer, J.R.; Sharpe, L.J.; Luu, W.; Brown, A.J. The Akt-SREBP nexus: Cell signaling meets lipid metabolism. Trends Endocrinol. Metab. 2010, 21, 268–276. [Google Scholar]
- Ortega-Molina, A.; Lopez-Guadamillas, E.; Mattison, J.A.; Mitchell, S.J.; Muñoz-Martin, M.; Iglesias, G.; Gutierrez, V.M.; Vaughan, K.L.; Szarowicz, M.D.; González-García, I.; et al. Pharmacological inhibition of PI3K reduces adiposity and metabolic syndrome in obese mice and rhesus monkeys. Cell Metab. 2015, 21, 558–570. [Google Scholar]
- Wang, C.; Chi, Y.; Li, J.; Miao, Y.; Li, S.; Su, W.; Jia, S.; Chen, Z.; Du, S.; Zhang, X.; et al. FAM3A activates PI3K p110α/Akt signaling to ameliorate hepatic gluconeogenesis and lipogenesis. Hepatology 2014, 59, 1779–1790. [Google Scholar]
- Berg, J.; Tymoczko, J.; Stryer, L. Gluconeogenesis and Glycolysis Are Reciprocally Regulated. In Biochemistry, 5th ed.; Freeman, W.H., Ed.; ACS Publications: New York, NY, USA, 2002; pp. 1–4. [Google Scholar]
- Pizarro-Delgado, J.; Deeney, J.T.; Corkey, B.E.; Tamarit-Rodriguez, J. Direct stimulation of islet insulin secretion by glycolytic and mitochondrial metabolites in KCL-depolarized islets. PLoS ONE 2016, 11, e0166111. [Google Scholar]
- OWEN, M.R.; DORAN, E.; HALESTRAP, A.P. Evidence that metformin exerts its anti-diabetic effects through inhibition of complex 1 of the mitochondrial respiratory chain. Biochem. J. 2000, 348, 607–614. [Google Scholar]
- Wheaton, W.W.; Weinberg, S.E.; Hamanaka, R.B.; Soberanes, S.; Sullivan, L.B.; Anso, E.; Glasauer, A.; Dufour, E.; Mutlu, G.M.; Scott Budigner, G.R.; et al. Metformin inhibits mitochondrial complex I of cancer cells to reduce tumorigenesis. Elife 2014, 2014, e02242. [Google Scholar]
- Anedda, A.; Rial, E.; Gonza, M.M. Metformin induces oxidative stress in white adipocytes and raises uncoupling protein 2 levels. J. Endocrinol. 2008, 199, 33–40. [Google Scholar] [PubMed]
- Saraei, P.; Asadi, I.; Kakar, M.A.; Moradi-Kor, N. The beneficial effects of metformin on cancer prevention and therapy: A comprehensive review of recent advances. Cancer Manag. Res. 2019, 11, 3295–3313. [Google Scholar] [CrossRef] [PubMed]
- Mallik, R.; Chowdhury, T.A. Metformin in cancer. Diabetes Res. Clin. Pract. 2018, 143, 409–419. [Google Scholar] [CrossRef] [PubMed]
- Chen, T.M.; Lin, C.C.; Huang, P.T.; Wen, C.F. Metformin associated with lower mortality in diabetic patients with early stage hepatocellular carcinoma after radiofrequency ablation. J. Gastroenterol. Hepatol. 2011, 26, 858–865. [Google Scholar] [CrossRef] [PubMed]
- Doherty, J.R.; Yang, C.; Scott, K.E.N.; Cameron, M.D.; Fallahi, M.; Li, W.; Hall, M.A.; Amelio, A.L.; Mishra, J.K.; Li, F.; et al. Blocking lactate export by inhibiting the myc target MCT1 disables glycolysis and glutathione synthesis. Cancer Res. 2014, 74, 908–920. [Google Scholar] [CrossRef]
- Buzzai, M.; Jones, R.G.; Amaravadi, R.K.; Lum, J.J.; DeBerardinis, R.J.; Zhao, F.; Viollet, B.; Thompson, C.B. Systemic treatment with the antidiabetic drug metformin selectively impairs p53-deficient tumor cell growth. Cancer Res. 2007, 67, 6745–6752. [Google Scholar] [CrossRef]
- DeCensi, A.; Puntoni, M.; Goodwin, P.; Cazzaniga, M.; Gennari, A.; Bonanni, B.; Gandini, S. Metformin and cancer risk in diabetic patients: A systematic review and meta-analysis. Cancer Prev. Res. 2010, 3, 1451–1461. [Google Scholar]
- Wang, Z.; Lai, S.-T.; Xie, L.; Zhao, J.-D.; Ma, N.-Y.; Zhu, J.; Ren, Z.-G.; Jiang, G.-L. Metformin is associated with reduced risk of pancreatic cancer in patients with type 2 diabetes mellitus: A systematic review and meta-analysis. Diabetes Res. Clin. Pract. 2014, 106, 19–26. [Google Scholar] [CrossRef]
- Kim, Y.S.; Choi, E.A.; Lee, J.W.; Kim, Y.; You, H.S.; Han, Y.E.; Kim, H.S.; Bae, Y.J.; Kang, H.T.; Kim, J. Metformin use reduced the overall risk of cancer in diabetic patients: A study based on the Korean NHIS-HEALS cohort. Nutr. Metab. Cardiovasc. Dis. 2020, 30, 1714–1722. [Google Scholar] [CrossRef] [PubMed]
- Kim, J.; Hyun, H.J.; Choi, E.A.; Kim, Y.; Bae, Y.J.; Kang, H.T. Metformin use reduced the risk of stomach cancer in diabetic patients in Korea: An analysis of Korean NHIS-HEALS database. Gastric Cancer 2020, 23, 1075–1083. [Google Scholar] [CrossRef]
- Shuai, Y.; Li, C.; Zhou, X. The effect of metformin on gastric cancer in patients with type 2 diabetes: A systematic review and meta-analysis. Clin. Transl. Oncol. 2020, 22, 1580–1590. [Google Scholar] [CrossRef]
- Hu, J.; Fan, H.D.; Gong, J.P.; Mao, Q.S. The relationship between the use of metformin and the risk of pancreatic cancer in patients with diabetes: A systematic review and meta-analysis. BMC Gastroenterol. 2023, 23, 50. [Google Scholar]
- Zhang, K.; Bai, P.; Dai, H.; Deng, Z. Metformin and risk of cancer among patients with type 2 diabetes mellitus: A systematic review and meta-analysis. Prim. Care Diabetes 2021, 15, 52–58. [Google Scholar] [CrossRef]
- Mekuria, A.N.; Ayele, Y.; Tola, A.; Mishore, K.M. Monotherapy with Metformin versus Sulfonylureas and Risk of Cancer in Type 2 Diabetic Patients: A Systematic Review and Meta-Analysis. J. Diabetes Res. 2019, 2019, 7676909. [Google Scholar] [CrossRef] [PubMed]
- Cunha, V.; Cotrim, H.P.; Rocha, R.; Carvalho, K.; Lins-Kusterer, L. Metformin in the prevention of hepatocellular carcinoma in diabetic patients: A systematic review. Ann. Hepatol. 2020, 19, 232–237. [Google Scholar] [CrossRef] [PubMed]
- Farmer, R.E.; Ford, D.; Mathur, R.; Chaturvedi, N.; Kaplan, R.; Smeeth, L.; Bhaskaran, K. Metformin use and risk of cancer in patients with type 2 diabetes: A cohort study of primary care records using inverse probability weighting of marginal structural models. Int. J. Epidemiol. 2019, 48, 527–537. [Google Scholar]
- Govindarajan, R.; Ratnasinghe, L.; Simmons, D.L.; Siegel, E.R.; Midathada, M.V.; Kim, L.; Kim, P.J.; Owens, R.J.; Lang, N.P. Thiazolidinediones and the risk of lung, prostate, and colon cancer in patients with diabetes. J. Clin. Oncol. 2007, 25, 1476–1481. [Google Scholar] [CrossRef]
- Du, R.; Lin, L.; Cheng, D.; Xu, Y.; Xu, M.; Chen, Y.; Wang, W.; Bi, Y.; Li, D.; Lu, J. Thiazolidinedione therapy and breast cancer risk in diabetic women: A systematic review and meta-analysis. Diabetes. Metab. Res. Rev. 2018, 34, 9–11. [Google Scholar]
- Chang, C.H.; Lin, J.W.; Wu, L.C.; Lai, M.S.; Chuang, L.M.; Arnold Chan, K. Association of thiazolidinediones with liver cancer and colorectal cancer in type 2 diabetes mellitus. Hepatology 2012, 55, 1462–1472. [Google Scholar] [PubMed]
- Lin, H.C.; Hsu, Y.T.; Kachingwe, B.H.; Hsu, C.Y.; Uang, Y.S.; Wang, L.H. Dose effect of thiazolidinedione on cancer risk in type 2 diabetes mellitus patients: A six-year population-based cohort study. J. Clin. Pharm. Ther. 2014, 39, 354–360. [Google Scholar] [PubMed]
- Liao, K.F.; Lin, C.L.; Lai, S.W. Association between colorectal cancer and thiazolidinediones administration in a case-control study. Biomedicine 2019, 9, 31–36. [Google Scholar] [CrossRef] [PubMed]
- Ramos-Nino, M.E.; MacLean, C.D.; Littenberg, B. Association between cancer prevalence and use of thiazolidinediones: Results from the Vermont Diabetes Information System. BMC Med. 2007, 5, 17. [Google Scholar] [CrossRef]
- Bsch, I.N.C.; Bowker, S.L.; Majumdar, S.R.; Johnson, J.A. Use of thiazolidinediones and the risk of bladder cancer among people with type 2 diabetes: A meta-analysis. Can. Med. Assoc. J. 2012, 184, 675–683. [Google Scholar]
- Dankner, R.; Roth, J. More recent, better designed studies have weakened links between antidiabetes medications and cancer risk. Diabet. Med. 2019, 37, 194–202. [Google Scholar] [CrossRef]
- Kim, J.; Yang, G.; Kim, Y.; Kim, J.; Ha, J. AMPK activators: Mechanisms of action and physiological activities. Exp. Mol. Med. 2016, 48, e224. [Google Scholar]
- Miller, R.A.; Chu, Q.; Xie, J.; Foretz, M.; Viollet, B.; Birnbaum, M.J. Biguanides suppress hepatic glucagon signaling by decreasing production of cyclic AMP. Physiol. Behav. 2019, 176, 139–148. [Google Scholar]
- Foretz, M.; Hébrard, S.; Leclerc, J.; Zarrinpashneh, E.; Soty, M.; Mithieux, G.; Sakamoto, K.; Andreelli, F.; Viollet, B. Metformin inhibits hepatic gluconeogenesis in mice independently of the LKB1/AMPK pathway via a decrease in hepatic energy state. J. Clin. Investig. 2010, 120, 2355–2369. [Google Scholar] [CrossRef]
- Coughlan, K.A.; Valentine, R.J.; Ruderman, N.B.; Saha, A.K. AMPK activation: A therapeutic target for type 2 diabetes? Diabetes, Metab. Syndr. Obes. Targets Ther. 2014, 7, 241–253. [Google Scholar]
- Golbidi, S.; Badran, M.; Laher, I. Diabetes and alpha lipoic acid. Front. Pharmacol. 2011, 2, 69. [Google Scholar] [CrossRef] [PubMed]
- Schwartz, L.; Seyfried, T.; Alfarouk, K.O.; Da Veiga Moreira, J.; Fais, S. Out of Warburg effect: An effective cancer treatment targeting the tumor specific metabolism and dysregulated pH. Semin. Cancer Biol. 2017, 43, 134–138. [Google Scholar] [CrossRef] [PubMed]
- Babu, P.V.A.; Liu, D.; Gilbert, E.R. Recent advances in understanding the anti-diabetic actions of dietary flavonoids. J. Nutr. Biochem. 2013, 24, 1777–1789. [Google Scholar] [PubMed]
- Sak, K. Cytotoxicity of Dietary flavonoids on diffeernt human cancer types. Pharmacogn. Rev. 2014, 8, 122. [Google Scholar] [CrossRef] [PubMed]
- Feuerecker, B.; Pirsig, S.; Seidl, C.; Aichler, M.; Feuchtinger, A.; Bruchelt, G.; Senekowitsch-Schmidtke, R. Lipoic acid inhibits cell proliferation of tumor cells in vitro and in vivo. Cancer Biol. Ther. 2012, 13, 1425–1435. [Google Scholar]
- Na, M.H.; Seo, E.Y.; Kim, W.K. Effects of α-lipoic acid on cell proliferation and apoptosis in MDA-MB-231 human breast cells. Nutr. Res. Pract. 2009, 3, 265. [Google Scholar]
- Jeon, M.J.; Kim, W.G.; Lim, S.; Choi, H.J.; Sim, S.; Kim, T.Y.; Shong, Y.K.; Kim, W.B. Alpha lipoic acid inhibits proliferation and epithelial mesenchymal transition of thyroid cancer cells. Mol. Cell. Endocrinol. 2016, 419, 113–123. [Google Scholar] [CrossRef]
- Konrad, T.; Vicini, P.; Kusterer, K.; Höflich, A.; Assadkhani, A.; Böhles, H.J.; Sewell, A.; Tritschler, H.J.; Cobelli, C.; Usadel, K.H. A-Lipoic Acid Treatment Decreases Serum Lactate and Pyruvate Concentrations and Improves Glucose Effectiveness in Lean and Obese Patients With Type 2 Diabetes. Diabetes Care 1999, 22, 280–287. [Google Scholar] [CrossRef]
- Korotchkina, L.G.; Sidhu, S.; Patel, M.S. R-lipoic acid inhibits mammalian pyruvate dehydrogenase kinase. Free Radic. Res. 2004, 38, 1083–1092. [Google Scholar] [CrossRef]
- Gandhi, V.M.; Wagh, S.S.; Natraj, C.V.; Menon, K.K.G. Lipoic acid and diabetes II: Mode of action of lipoic acid. J. Biosci. 1985, 9, 117–127. [Google Scholar] [CrossRef]
- Wenzel, U.; Nickel, A.; Daniel, H. α-lipoic acid induces apoptosis in human colon cancer cells by increasing mitochondrial respiration with a concomitant O2-.-generation. Apoptosis 2005, 10, 359–368. [Google Scholar] [CrossRef] [PubMed]
- Mantovani, G.; Macciò, A.; Madeddu, C.; Mura, L.; Gramignano, G.; Lusso, M.R.; Murgia, V.; Camboni, P.; Ferreli, L.; Mocci, M.; et al. The impact of different antioxidant agents alone or in combination on reactive oxygen species, antioxidant enyzmes and cytokines in a series of advanced cancer patients at different sites: Correlation with disease progression. Free Radic. Res. 2003, 37, 213–223. [Google Scholar] [CrossRef]
- Mantovani, G.; Macciò, A.; Madeddu, C.; Mura, L.; Massa, E.; Gramignano, G.; Lusso, M.R.; Murgia, V.; Camboni, P.; Ferreli, L. Reactive oxygen species, antioxidant mechanisms and serum cytokine levels in cancer patients: Impact of an antioxidant treatment. J. Cell. Mol. Med. 2002, 6, 570–582. [Google Scholar] [CrossRef] [PubMed]
- Dörsam, B.; Fahrer, J. The disulfide compound α-lipoic acid and its derivatives: A novel class of anticancer agents targeting mitochondria. Cancer Lett. 2016, 371, 12–19. [Google Scholar]
- Dörsam, B.; Göder, A.; Seiwert, N.; Kaina, B.; Fahrer, J. Lipoic acid induces p53-independent cell death in colorectal cancer cells and potentiates the cytotoxicity of 5-fluorouracil. Arch. Toxicol. 2015, 89, 1829–1846. [Google Scholar] [CrossRef] [PubMed]
- Kafara, P.; Icard, P.; Guillamin, M.; Schwartz, L.; Lincet, H. Lipoic acid decreases Mcl-1, Bcl-xL and up regulates Bim on ovarian carcinoma cells leading to cell death. J. Ovarian Res. 2015, 8, 36. [Google Scholar] [PubMed]
- Piotrowski, P.; Wierzbicka, K.; Śmiałek, M. Neuronal death in the rat hippocampus in experimental diabetes and cerebral ischaemia treated with antioxidants. Folia Neuropathol. 2001, 39, 147–154. [Google Scholar]
- Pierce, R.H.; Campbell, J.S.; Stephenson, A.B.; Franklin, C.C.; Chaisson, M.; Poot, M.; Kavanagh, T.J.; Rabinovitch, P.S.; Fausto, N. Disruption of redox homeostasis in tumor necrosis factor-induced apoptosis in a murine hepatocyte cell line. Am. J. Pathol. 2000, 157, 221–236. [Google Scholar] [CrossRef]
- Lin, H.Y.; Han, H.W.; Sun, W.X.; Yang, Y.S.; Tang, C.Y.; Lu, G.H.; Qi, J.L.; Wang, X.M.; Yang, Y.H. Design and characterization of α-lipoic acyl shikonin ester twin drugs as tubulin and PDK1 dual inhibitors. Eur. J. Med. Chem. 2018, 144, 137–150. [Google Scholar]
- Shen, Q.W.; Zhu, M.J.; Tong, J.; Ren, J.; Du, M. Ca2+/calmodulin-dependent protein kinase kinase is involved in AMP-activated protein kinase activation by α-lipoic acid in C2C12 myotubes. Am. J. Physiol.-Cell Physiol. 2007, 293, 1395–1403. [Google Scholar]
- Dozio, E.; Ruscica, M.; Passafaro, L.; Dogliotti, G.; Steffani, L.; Pagani, A.; Demartini, G.; Esposti, D.; Fraschini, F.; Magni, P. The natural antioxidant alpha-lipoic acid induces p27Kip1-dependent cell cycle arrest and apoptosis in MCF-7 human breast cancer cells. Eur. J. Pharmacol. 2010, 641, 29–34. [Google Scholar] [CrossRef] [PubMed]
- Yadav, V.R.; Prasad, S.; Sung, B.; Kannappan, R.; Aggarwal, B.B. Targeting inflammatory pathways by triterpenoids for prevention and treatment of cancer. Toxins 2010, 2, 2428–2466. [Google Scholar] [CrossRef] [PubMed]
- Wei, J.; Huang, Q.; Bai, F.; Lin, J.; Nie, J.; Lu, S.; Lu, C.; Huang, R.; Lu, Z.; Lin, X. Didymin induces apoptosis through mitochondrial dysfunction and up-regulation of RKIP in human hepatoma cells. Chem. Biol. Interact. 2017, 261, 118–126. [Google Scholar] [PubMed]
- Zhao, Y.; Zhou, Y.; Wang, M. Brosimone I, an isoprenoid-substituted flavonoid, induces cell cycle G1 phase arrest and apoptosis through ROS-dependent endoplasmic reticulum stress in HCT116 human colon cancer cells. Food Funct. 2019, 10, 2729–2738. [Google Scholar] [CrossRef]
- Al-Mulla, F. Novel flavonoid didymin inhibits neuroblastomas-Letter. Cancer Prev. Res. 2012, 5, 883. [Google Scholar] [CrossRef]
- Singhal, J.; Nagaprashantha, L.D.; Vatsyayan, R.; Ashutosh; Awasthi, S.; Singhal, S.S. Didymin induces apoptosis by inhibiting N-Myc and upregulating RKIP in neuroblastoma. Cancer Prev. Res. 2012, 5, 473–483. [Google Scholar] [CrossRef]
- Samec, M.; Liskova, A.; Koklesova, L.; Samuel, S.M.; Zhai, K.; Buhrmann, C.; Varghese, E.; Abotaleb, M.; Qaradakhi, T.; Zulli, A.; et al. Flavonoids against the Warburg phenotype—Concepts of predictive, preventive and personalised medicine to cut the Gordian knot of cancer cell metabolism. EPMA J. 2020, 11, 377–398. [Google Scholar] [CrossRef]
- Shan, S.; Shi, J.; Yang, P.; Jia, B.; Wu, H.; Zhang, X.; Li, Z. Apigenin Restrains Colon Cancer Cell Proliferation via Targeted Blocking of Pyruvate Kinase M2-Dependent Glycolysis. J. Agric. Food Chem. 2017, 65, 8136–8144. [Google Scholar]
- Wei, R.; Mao, L.; Xu, P.; Zheng, X.; Hackman, R.M.; MacKenzie, G.G.; Wang, Y. Suppressing glucose metabolism with epigallocatechin-3-gallate (EGCG) reduces breast cancer cell growth in preclinical models. Food Funct. 2018, 9, 5682–5696. [Google Scholar] [CrossRef]
- Feng, J.; Wu, L.; Ji, J.; Chen, K.; Yu, Q.; Zhang, J.; Chen, J.; Mao, Y.; Wang, F.; Dai, W.; et al. PKM2 is the target of proanthocyanidin B2 during the inhibition of hepatocellular carcinoma. J. Exp. Clin. Cancer Res. 2019, 38, 204. [Google Scholar] [CrossRef]
- Chen, J.; Xie, J.; Jiang, Z.; Wang, B.; Wang, Y.; Hu, X. Shikonin and its analogs inhibit cancer cell glycolysis by targeting tumor pyruvate kinase-M2. Oncogene 2011, 30, 4297–4306. [Google Scholar] [CrossRef] [PubMed]
- Zhao, X.; Zhu, Y.; Hu, J.; Jiang, L.; Li, L.; Jia, S.; Zen, K. Shikonin Inhibits Tumor Growth in Mice by Suppressing Pyruvate Kinase M2-mediated Aerobic Glycolysis. Sci. Rep. 2018, 8, 14517. [Google Scholar] [CrossRef]
- Jia, L.; Huang, S.; Yin, X.; Zan, Y.; Guo, Y.; Han, L. Quercetin suppresses the mobility of breast cancer by suppressing glycolysis through Akt-mTOR pathway mediated autophagy induction. Life Sci. 2018, 208, 123–130. [Google Scholar] [CrossRef] [PubMed]
- Liu, W.; Li, W.; Liu, H.; Yu, X. Xanthohumol inhibits colorectal cancer cells via downregulation of hexokinases ii-mediated glycolysis. Int. J. Biol. Sci. 2019, 15, 2497–2508. [Google Scholar] [CrossRef] [PubMed]
- Deng, X.; Liu, R.; Li, J.; Li, Z.; Liu, J.; Xiong, R.; Lei, X.; Zheng, X.; Xie, Z.; Tang, G. Design, synthesis, and preliminary biological evaluation of 3′,4′,5′-trimethoxy flavonoid salicylate derivatives as potential anti-tumor agents. New J. Chem. 2019, 43, 1874–1884. [Google Scholar] [CrossRef]
- Guo, Y.; Wei, L.; Zhou, Y.; Lu, N.; Tang, X.; Li, Z.; Wang, X. Flavonoid GL-V9 induces apoptosis and inhibits glycolysis of breast cancer via disrupting GSK-3β-modulated mitochondrial binding of HKII. Free Radic. Biol. Med. 2020, 146, 119–129. [Google Scholar] [CrossRef] [PubMed]
- Zhou, Y.; Lu, N.; Qiao, C.; Ni, T.; Li, Z.; Yu, B.; Guo, Q.; Wei, L. FV-429 induces apoptosis and inhibits glycolysis by inhibiting Akt-mediated phosphorylation of hexokinase II in MDA-MB-231 cells. Mol. Carcinog. 2016, 55, 1317–1328. [Google Scholar] [CrossRef]
- Tao, L.; Liu, Y.; Ding, Y.; Liu, X.; Zhang, X.; Hu, R.; Wei, L.; Wang, X.; Yao, Y.; Lu, J.; et al. Gen-27, a newly synthesized flavonoid, inhibits glycolysis and induces cell apoptosis via suppression of hexokinase II in human breast cancer cells. Biochem. Pharmacol. 2017, 125, 12–25. [Google Scholar] [CrossRef]
- Li, W.; Hao, J.; Zhang, L.; Cheng, Z.; Deng, X.; Shu, G. Astragalin Reduces Hexokinase 2 through Increasing miR-125b to Inhibit the Proliferation of Hepatocellular Carcinoma Cells in Vitro and in Vivo. J. Agric. Food Chem. 2017, 65, 5961–5972. [Google Scholar] [CrossRef]
- Mazlaghaninia, M.; Atri, M.S.; Seyedalipour, B. Scopoletin and Morin Inhibit Lactate Dehydrogenase Enzyme Activity is Critical for Cancer Metabolism. Hormozgan Med. J. 2019, 23, e88269. [Google Scholar] [CrossRef]
- Liu, Y.; Venna, C.K.; Morgan, J.B.; Mohammed, K.A.; Jekabsons, M.B.; Nagle, D.G.; Zhou, Y.D. Methylalpinumisoflavone inhibits hypoxia-inducible factor-1 (HIF-1) activation by simultaneously targeting multiple pathways. J. Biol. Chem. 2009, 284, 5859–5868. [Google Scholar] [PubMed]
- Wei, L.; Zhou, Y.; Qiao, C.; Ni, T.; Li, Z.; You, Q.; Guo, Q.; Lu, N. Oroxylin A inhibits glycolysis-dependent proliferation of human breast cancer via promoting SIRT3-mediated SOD2 transcription and HIF1α destabilization. Cell Death Dis. 2015, 6, e1714. [Google Scholar] [CrossRef] [PubMed]
- Chen, F.; Zhuang, M.; Zhong, C.; Peng, J.; Wang, X.; Li, J.; Chen, Z.; Huang, Y. Baicalein reverses hypoxia-induced 5-FU resistance in gastric cancer AGS cells through suppression of glycolysis and the PTEN/Akt/HIF-1α signaling pathway. Oncol. Rep. 2015, 33, 457–463. [Google Scholar]
- Wang, H.; Zhao, L.; Zhu, L.T.; Wang, Y.; Pan, D.; Yao, J.; You, Q.D.; Guo, Q.L. Wogonin reverses hypoxia resistance of human colon cancer HCT116 cells via downregulation of HIF-1α and glycolysis, by inhibiting PI3K/Akt signaling pathway. Mol. Carcinog. 2014, 53, E107–E118. [Google Scholar] [CrossRef]
- Zhao, Y.; Zhang, L.; Wu, Y.; Dai, Q.; Zhou, Y.; Li, Z.; Yang, L.; Guo, Q.; Lu, N. Selective anti-tumor activity of wogonin targeting the Warburg effect through stablizing p53. Pharmacol. Res. 2018, 135, 49–59. [Google Scholar]
- Li, J.; Zou, Y.; Pei, M.; Zhang, Y.; Jiang, Y. Berberine inhibits the Warburg effect through TET3/miR-145/HK2 pathways in ovarian cancer cells. J. Cancer 2021, 12, 207–216. [Google Scholar]
- Li, Z.; Li, H.; Lu, Y.; Yang, P.; Li, Z. Berberine inhibited the proliferation of cancer cells by suppressing the activity of tumor pyruvate kinase M2. Nat. Prod. Commun. 2017, 12, 1415–1418. [Google Scholar] [CrossRef]
- Li, W.; Ma, X.; Li, N.; Liu, H.; Dong, Q.; Zhang, J.; Yang, C.; Liu, Y.; Liang, Q.; Zhang, S.; et al. Resveratrol inhibits Hexokinases II mediated glycolysis in non-small cell lung cancer via targeting Akt signaling pathway. Exp. Cell Res. 2016, 349, 320–327. [Google Scholar] [CrossRef]
- Saunier, E.; Antonio, S.; Regazzetti, A.; Auzeil, N.; Laprévote, O.; Shay, J.W.; Coumoul, X.; Barouki, R.; Benelli, C.; Huc, L.; et al. Resveratrol reverses the Warburg effect by targeting the pyruvate dehydrogenase complex in colon cancer cells. Sci. Rep. 2017, 7, 6945. [Google Scholar] [CrossRef]
- Omidian, K.; Rafiei, H.; Bandy, B. Increased mitochondrial content and function by resveratrol and select flavonoids protects against benzo[a]pyrene-induced bioenergetic dysfunction and ROS generation in a cell model of neoplastic transformation. Free Radic. Biol. Med. 2020, 152, 767–775. [Google Scholar]
- Samec, M.; Liskova, A.; Koklesova, L.; Mersakova, S.; Strnadel, J.; Kajo, K.; Pec, M.; Zhai, K.; Smejkal, K.; Mirzaei, S.; et al. Flavonoids Targeting HIF-1: Implications on Cancer Metabolism. Cancers 2021, 13, 130. [Google Scholar] [CrossRef] [PubMed]
- Bisol, Â.; de Campos, P.S.; Lamers, M.L. Flavonoids as anticancer therapies: A systematic review of clinical trials. Phyther. Res. 2020, 34, 568–582. [Google Scholar]
- Thilakarathna, S.H.; Vasantha Rupasinghe, H.P. Flavonoid bioavailability and attempts for bioavailability enhancement. Nutrients 2013, 5, 3367–3387. [Google Scholar]
- dos Santos Lima, B.; Shanmugam, S.; de Souza Siqueira Quintans, J.; Quintans-Júnior, L.J.; de Souza Araújo, A.A. Inclusion complex with cyclodextrins enhances the bioavailability of flavonoid compounds: A systematic review. Phytochem. Rev. 2019, 18, 1337–1359. [Google Scholar] [CrossRef]
- Martins, H.A.; Sehaber, C.C.; Hermes-Uliana, C.; Mariani, F.A.; Guarnier, F.A.; Vicentini, G.E.; Bossolani, G.D.P.; Jussani, L.A.; Lima, M.M.; Bazotte, R.B.; et al. Supplementation with l-glutamine prevents tumor growth and cancer-induced cachexia as well as restores cell proliferation of intestinal mucosa of Walker-256 tumor-bearing rats. Amino Acids 2016, 48, 2773–2784. [Google Scholar] [CrossRef] [PubMed]
- Chang, S.C.; Lai, Y.C.; Hung, J.C.; Chang, C.Y. Oral glutamine supplements reduce concurrent chemoradiotherapy-induced esophagitis in patients with advanced non-small cell lung cancer. Medicine 2019, 98, e14463. [Google Scholar] [CrossRef] [PubMed]
- Topkan, E.; Parlak, C.; Topuk, S.; Pehlivan, B. Influence of oral glutamine supplementation on survival outcomes of patients treated with concurrent chemoradiotherapy for locally advanced non-small cell lung cancer. BMC Cancer 2012, 12, 502. [Google Scholar]
- Peng, T.R.; Lin, H.H.; Yang, L.J.; Wu, T.W. Effectiveness of glutamine in the management of oral mucositis in cancer patients: A meta-analysis of randomized controlled trials. Support. Care Cancer 2021, 29, 4885–4892. [Google Scholar] [CrossRef]
- Foretz, M.; Ancellin, N.; Andreelli, F.; Saintillan, Y.; Grondin, P.; Kahn, A.; Thorens, B.; Vaulont, S.; Viollet, B. Short-term overexpression of a constitutively active form of AMP-activated protein kinase in the liver leads to mild hypoglycemia and fatty liver. Diabetes 2005, 54, 1331–1339. [Google Scholar] [CrossRef]
- Woo, J.L.; Song, K.H.; Eun, H.K.; Jong, C.W.; Hyoun, S.K.; Park, H.S.; Kim, M.S.; Kim, S.W.; Lee, K.U.; Park, J.Y. α-Lipoic acid increases insulin sensitivity by activating AMPK in skeletal muscle. Biochem. Biophys. Res. Commun. 2005, 332, 885–891. [Google Scholar]
- Gosselin, L.E.; Chrapowitzky, L.; Rideout, T.C. Metabolic effects of α-lipoic acid supplementation in pre-diabetics: A randomized, placebo-controlled pilot study. Food Funct. 2019, 10, 5732–5738. [Google Scholar] [CrossRef]
- Kamenova, P. Improvement of insulin sensitivity in patients with type 2 diabetes mellitus after oral administration of alpha-lipoic acid. Hormones 2006, 5, 251–258. [Google Scholar] [CrossRef] [PubMed]
- Ziegler, D.; Hanefeld, M.; Ruhnau, K.J.; Mei\ner, H.P.; Lobisch, M.; Schütte, K.; Gries, F.A. Treatment of symptomatic diabetic peripheral neuropathy with the anti-oxidant α-lipoic acid—A 3-week multicentre randomized controlled trial (ALADIN Study). Diabetologia 1995, 38, 1425–1433. [Google Scholar] [CrossRef]
- Kyriakis, E.; Stravodimos, G.A.; Kantsadi, A.L.; Chatzileontiadou, D.S.M.; Skamnaki, V.T.; Leonidas, D.D. Natural flavonoids as antidiabetic agents. The binding of gallic and ellagic acids to glycogen phosphorylase b. FEBS Lett. 2015, 589, 1787–1794. [Google Scholar] [CrossRef] [PubMed]
- Lagouge, M.; Argmann, C.; Gerhart-Hines, Z.; Meziane, H.; Lerin, C.; Daussin, F.; Messadeq, N.; Milne, J.; Lambert, P.; Elliott, P.; et al. Resveratrol Improves Mitochondrial Function and Protects against Metabolic Disease by Activating SIRT1 and PGC-1α. Cell 2006, 127, 1109–1122. [Google Scholar] [CrossRef] [PubMed]
- Meng, Q. extracted from mulberry (Morus alba L.. leaf improve skeletal muscle mitochondrial function by activating A. in type 2 diabetes; Qi, X.; Fu, Y.; Chen, Q.; Cheng, P.; Yu, X.; Sun, X.; Wu, J.; Li, W.; Zhang, Q.; et al. Flavonoids extracted from mulberry (Morus alba L.) leaf improve skeletal muscle mitochondrial function by activating AMPK in type 2 diabetes. J. Ethnopharmacol. 2020, 248, 112326. [Google Scholar]
- Han, G.; Takahashi, H.; Murao, N.; Gheni, G.; Yokoi, N.; Hamamoto, Y.; Asahara, S.-I.; Seino, Y.; Kido, Y.; Seino, S. Glutamate is an essential mediator in glutamine-amplified insulin secretion. J Diabetes Investig 2021, 12, 920–930. [Google Scholar]
- Satapati, S.; Sunny, N.E.; Kucejova, B.; Fu, X.; He, T.T.; Méndez-Lucas, A.; Shelton, J.M.; Perales, J.C.; Browning, J.D.; Burgess, S.C. Elevated TCA cycle function in the pathology of diet-induced hepatic insulin resistance and fatty liver. J. Lipid Res. 2012, 53, 1080–1092. [Google Scholar] [CrossRef]
- Maurer, J.; Hoene, M.; Weigert, C. Signals from the Circle: Tricarboxylic Acid Cycle Intermediates as Myometabokines. Metabolites 2021, 11, 474. [Google Scholar]
- Gilbert, M. Role of skeletal muscle lipids in the pathogenesis of insulin resistance of obesity and type 2 diabetes. J. Diabetes Investig. 2021, 12, 1934–1941. [Google Scholar] [CrossRef]
- Nagao, H.; Nishizawa, H.; Bamba, T.; Nakayama, Y.; Isozumi, N.; Nagamori, S.; Kanai, Y.; Tanaka, Y.; Kita, S.; Fukuda, S.; et al. Increased Dynamics of Tricarboxylic Acid Cycle and Glutamate Synthesis in Obese Adipose Tissue: In vivo metabolic turnover analysis. J. Biol. Chem. 2017, 292, 4469–4483. [Google Scholar] [PubMed]
- Newsholme, P.; Rowlands, J.; Rose’meyer, R.; Cruzat, V. Metabolic Adaptions/Reprogramming in Islet Beta-Cells in Response to Physiological Stimulators-What Are the Consequences. Antioxidants 2022, 11, 108. [Google Scholar] [PubMed]
- Zhang, G.F.; Jensen, M.V.; Gray, S.M.; El, K.; Wang, Y.; Lu, D.; Becker, T.C.; Campbell, J.E.; Newgard, C.B. Reductive TCA cycle metabolism fuels glutamine- and glucose-stimulated insulin secretion. Cell Metab. 2021, 33, 804–817.e5. [Google Scholar] [CrossRef]
- Heart, E.; Cline, G.W.; Collis, L.P.; Pongratz, R.L.; Gray, J.P.; Smith, P.J.S. Role for malic enzyme, pyruvate carboxylation, and mitochondrial malate import in glucose-stimulated insulin secretion. Am. J. Physiol. Endocrinol. Metab. 2009, 296, E1354–E1362. [Google Scholar] [CrossRef]
- Wang, L.; Yi, D.; Hou, Y.; Ding, B.; Li, K.; Li, B.; Zhu, H.; Liu, Y.; Wu, G. Dietary Supplementation with a-Ketoglutarate Activates mTOR Signaling and Enhances Energy Status in Skeletal Muscle of Lipopolysaccharide-Challenged Piglets. J. Nutr. 2016, 146, 1514–1520. [Google Scholar] [CrossRef]
- Yao, K.; Yin, Y.; Li, X.; Xi, P.; Wang, J.; Lei, J.; Hou, Y.; Wu, G. Alpha-ketoglutarate inhibits glutamine degradation and enhances protein synthesis in intestinal porcine epithelial cells. Amino Acids 2012, 42, 2491–2500. [Google Scholar] [CrossRef] [PubMed]
- Fazakerley, D.J.; Krycer, J.R.; Kearney, A.L.; Hocking, S.L.; James, D.E. Muscle and adipose tissue insulin resistance: Malady without mechanism? J. Lipid Res. 2019, 60, 1720–1732. [Google Scholar] [CrossRef] [PubMed]
- Tretter, L.; Adam-Vizi, V. Alpha-ketoglutarate dehydrogenase: A target and generator of oxidative stress. Philos. Trans. R. Soc. Lond. B. Biol. Sci. 2005, 360, 2335–2345. [Google Scholar]
- Gabryelska, A.; Karuga, F.F.; Szmyd, B.; Białasiewicz, P. HIF-1α as a Mediator of Insulin Resistance, T2DM, and Its Complications: Potential Links With Obstructive Sleep Apnea. Front. Physiol. 2020, 11, 1035. [Google Scholar] [CrossRef]
- Badole, S.L.; Chaudhari, S.M.; Bagul, P.P.; Mahamuni, S.P.; Khose, R.D. Effect of Concomitant Administration of L-Glutamine and Cycloart-23-ene-3b, 25-diol (B2) with Sitagliptin in GLP-1 (7-36) Amide Secretion, Biochemical and Oxidative Stress in Streptozotocin-Nicotinamide Induced Diabetic Sprague Dawley Rats. PLoS ONE 2013, 8, 72817. [Google Scholar]
- Badole, S.L.; Jangam, G.B.; Chaudhari, S.M.; Ghule, A.E.; Zanwar, A.A. L-Glutamine Supplementation Prevents the Development of Experimental Diabetic Cardiomyopathy in Streptozotocin-Nicotinamide Induced Diabetic Rats. PLoS ONE 2014, 9, e92697. [Google Scholar]
- Tsai, P.H.; Liu, J.J.; Yeh, C.L.; Chiu, W.C.; Yeh, S.L. Effects of glutamine supplementation on oxidative stress-related gene expression and antioxidant properties in rats with streptozotocin-induced type 2 diabetes. Br. J. Nutr. 2012, 107, 1112–1118. [Google Scholar] [CrossRef] [PubMed]
- Tsai, P.H.; Liu, J.J.; Chiu, W.C.; Pai, M.H.; Yeh, S.L. Effects of dietary glutamine on adhesion molecule expression and oxidative stress in mice with streptozotocin-induced type 1 diabetes. Clin. Nutr. 2011, 30, 124–129. [Google Scholar] [CrossRef] [PubMed]
- Tsai, P.H.; Yeh, C.L.; Liu, J.J.; Chiu, W.C.; Yeh, S.L. Effects of dietary glutamine on inflammatory mediator gene expressions in rats with streptozotocin-induced diabetes. Nutrition 2012, 28, 288–293. [Google Scholar]
- Jafari-Vayghan, H.; Varshosaz, P.; Hajizadeh-Sharafabad, F.; Razmi, H.R.; Amirpour, M.; Tavakoli-Rouzbehani, O.M.; Alizadeh, M.; Maleki, V. A comprehensive insight into the effect of glutamine supplementation on metabolic variables in diabetes mellitus: A systematic review. Nutr. Metab. 2020, 17, 80. [Google Scholar] [CrossRef]


| Flavonoid Name | Flavonoid Subfamily | Mechanism of Targeting Warburg Glycolysis | Warburg Glycolytic Target | References |
|---|---|---|---|---|
| Apegenin | Flavones |
| PKM2 | [351] |
| Epigallocatechin-3-gallate (EGCG) | Flavan-3-ols |
| PKM2 HK2 HIF-1a | [352] |
| Proanthocyanidin B2 (PB2) | Anthocyanidins |
| PKM2 | [353] |
| Shikonin (SHI) | Naphthoquinone flavonoid |
| PKM2 | [354,355] |
| Quercetin (QUE) | Flavonol |
| PKM2 | [356] |
| HK2 | [356] | ||
| LDH | [356] | ||
| Xanthohumol (XA) | Prenylated flavonoid |
| HK2 | [357] |
| 10v | Synthetic flavonoid |
| HK2 | [358] |
| GL-V9 | Synthetic flavonoid |
| HK2 | [359] |
| FV-429 | Synthetic flavonoid |
| HK2 | [360] |
| Gen-27 | Synthetic flavonoid |
| HK2 | [361] |
| Astragalin (ASG) | O-glycoside flavonoid |
| HK2 | [362] |
| Morin (MO) | Flavonol |
| LDH | [363] |
| Methylalpinumisoflavon (MF) | Isoflavone |
| HIF-1α | [364] |
| Oroxylin A (OX-A) | Flavone |
| HIF-1α | [365] |
| Baicalein (BA) | Flavone |
| HIF-1α | [366] |
| Wogonin | O-methylated flavone |
| HIF-1α | [367,368] |
| Berberine (BBR) | Isoquinoline flavonoid |
| HK2 | [369,370] |
| Resveratrol |
| HK2 PDH complex | [371,372,373] |
Disclaimer/Publisher’s Note: The statements, opinions and data contained in all publications are solely those of the individual author(s) and contributor(s) and not of MDPI and/or the editor(s). MDPI and/or the editor(s) disclaim responsibility for any injury to people or property resulting from any ideas, methods, instructions or products referred to in the content. |
© 2024 by the authors. Licensee MDPI, Basel, Switzerland. This article is an open access article distributed under the terms and conditions of the Creative Commons Attribution (CC BY) license (https://creativecommons.org/licenses/by/4.0/).
Share and Cite
Bosso, M.; Haddad, D.; Al Madhoun, A.; Al-Mulla, F. Targeting the Metabolic Paradigms in Cancer and Diabetes. Biomedicines 2024, 12, 211. https://doi.org/10.3390/biomedicines12010211
Bosso M, Haddad D, Al Madhoun A, Al-Mulla F. Targeting the Metabolic Paradigms in Cancer and Diabetes. Biomedicines. 2024; 12(1):211. https://doi.org/10.3390/biomedicines12010211
Chicago/Turabian StyleBosso, Mira, Dania Haddad, Ashraf Al Madhoun, and Fahd Al-Mulla. 2024. "Targeting the Metabolic Paradigms in Cancer and Diabetes" Biomedicines 12, no. 1: 211. https://doi.org/10.3390/biomedicines12010211