
Comparison of the Fecal Bacteriome of HIV-Positive and HIV-Negative Older Adults

 , , , and
Abstract
:1. Introduction
2. Materials and Methods
2.1. Study Design and Patients
2.2. Data Collection
2.3. Frailty
2.4. Metataxonomic Analysis
2.5. Statistical Analysis
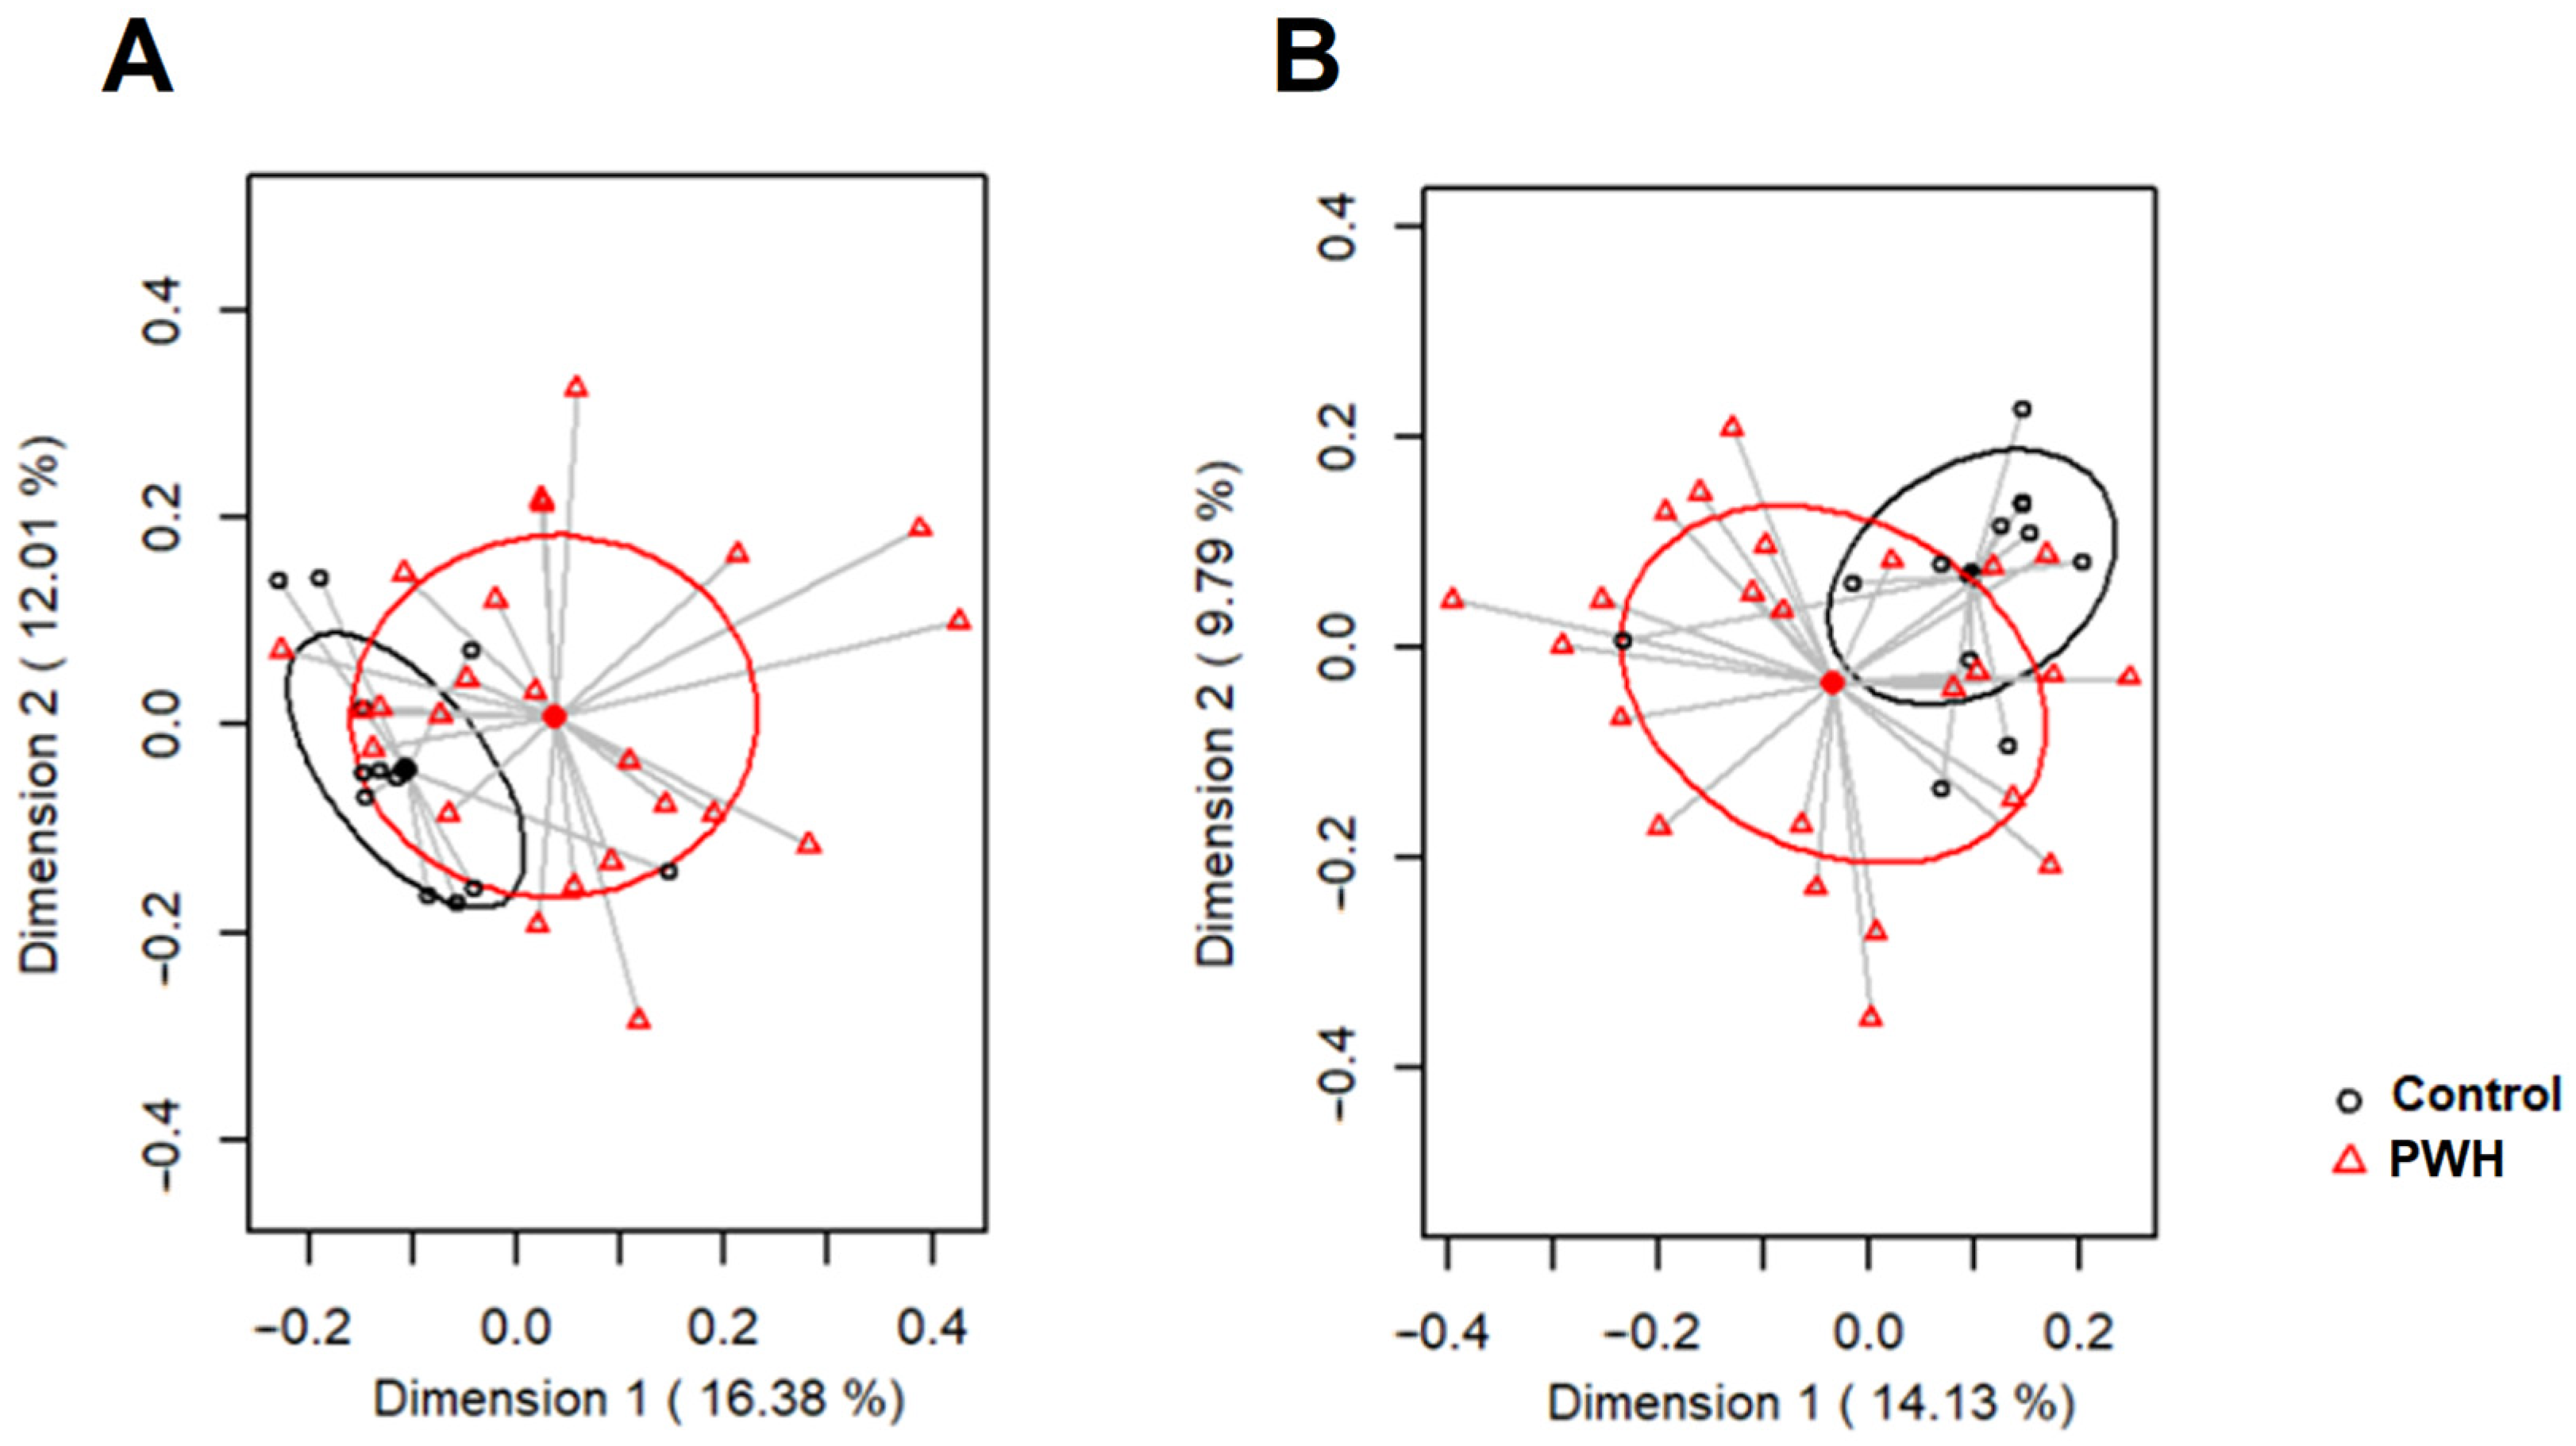
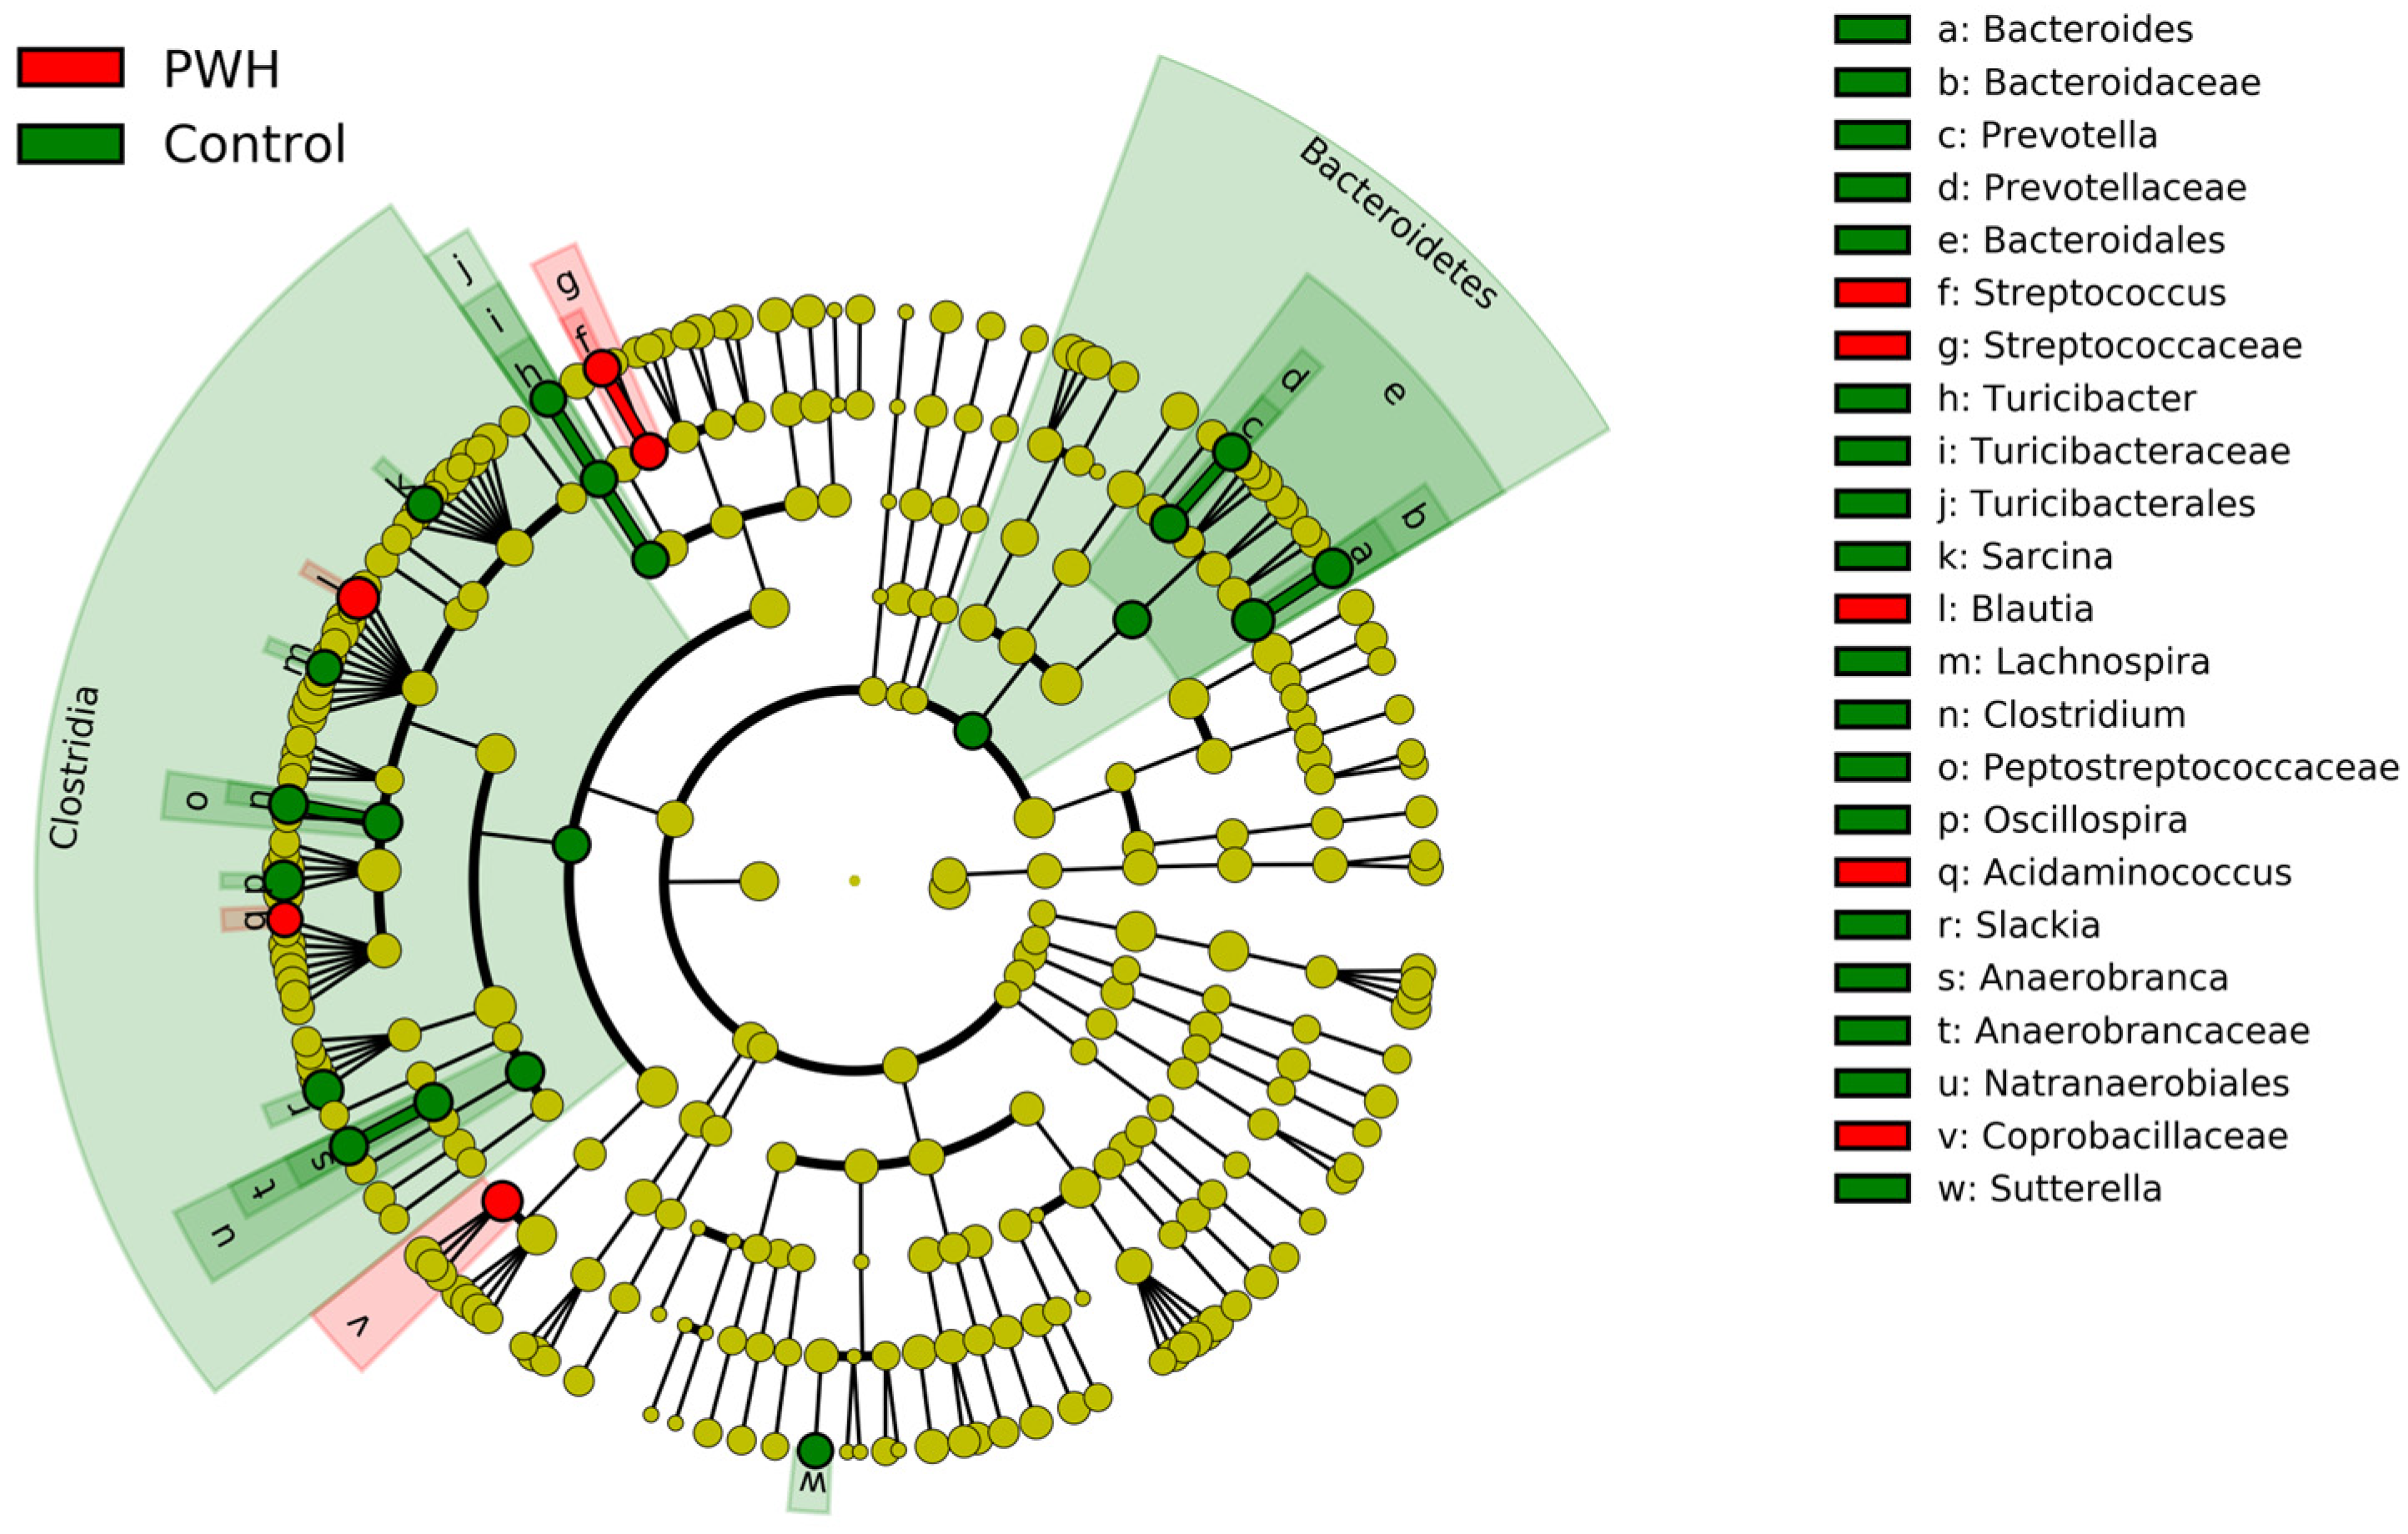
3. Results
4. Discussion
5. Conclusions
Supplementary Materials
Author Contributions
Funding
Institutional Review Board Statement
Informed Consent Statement
Data Availability Statement
Acknowledgments
Conflicts of Interest
References
- Deeks, S.G. HIV infection, inflammation, immunosenescence, and aging. Annu. Rev. Med. 2011, 62, 141–155. [Google Scholar] [CrossRef]
- Dillon, S.M.; Frank, D.N.; Wilson, C.C. The gut microbiome and HIV-1 pathogenesis: A two-way street. AIDS 2016, 30, 2737–2751. [Google Scholar] [CrossRef]
- Ishizaka, A.; Koga, M.; Mizutani, T.; Parbie, P.K.; Prawisuda, D.; Yusa, N.; Sedohara, A.; Kikuchi, T.; Ikeuchi, K.; Adachi, E.; et al. Unique gut microbiome in HIV Patients on antiretroviral therapy (ART) suggests association with chronic inflammation. Microbiol. Spectr. 2021, 9, e0070821. [Google Scholar] [CrossRef] [PubMed]
- Shirazi, M.S.R.; Al-Alo, K.Z.K.; Al-Yasiri, M.H.; Lateef, Z.M.; Ghasemian, A. Microbiome dysbiosis and predominant bacterial species as human cancer biomarkers. J. Gastrointest. Cancer 2020, 51, 725–728. [Google Scholar] [CrossRef] [PubMed]
- Zevin, A.S.; McKinnon, L.; Burgener, A.; Klatt, N.R. Microbial translocation and microbiome dysbiosis in HIV-associated immune activation. Curr. Opin. HIV AIDS 2016, 11, 182–190. [Google Scholar] [CrossRef] [PubMed]
- Guaraldi, G.; Orlando, G.; Zona, S.; Menozzi, M.; Carli, F.; Garlassi, E. Premature age-related comorbidities among HIV-infected persons compared with the general population. Clin. Infect. Dis. 2011, 53, 1120–1126. [Google Scholar] [CrossRef]
- Greene, M.; Justice, A.C.; Covinsky, K.E. Assessment of geriatric syndromes and physical function in people living with HIV. Virulence 2016, 8, 586–598. [Google Scholar] [CrossRef] [PubMed]
- Liu, C.K.; Fielding, R.A. Exercise as an intervention for frailty. Clin. Geriatr. Med. 2011, 27, 101–110. [Google Scholar] [CrossRef]
- Bray, N.W.; Smart, R.R.; Jakobi, J.M.; Jones, G.R. Exercise prescription to reverse frailty. Appl. Physiol. Nutr. Metab. 2016, 41, 1112–1116. [Google Scholar] [CrossRef] [PubMed]
- Abizanda, P.; Sánchez-Jurado, P.M.; Romero, L.; Paterna, G.; Martínez-Sánchez, E.; Atienzar-Núñez, P. Prevalence of frailty in a Spanish elderly population: The Frailty and Dependence in Albacete Study. J. Am. Geriatr. Soc. 2011, 59, 1356–1359. [Google Scholar] [CrossRef]
- Santos-Eggimann, B.; Cuenoud, P.; Spagnoli, J.; Junod, J. Prevalence of frailty in middle-aged and older community-dwelling Europeans living in 10 countries. J. Gerontol. A Biol. Sci. Med. Sci. 2009, 64, 675–681. [Google Scholar] [CrossRef]
- Danon-Hersch, N.; Rodondi, N.; Spagnoli, J.; Santos-Eggimann, B. Prefrailty and chronic morbidity in the youngest old: An insight from the Lausanne cohort Lc65+. J. Am. Geriatr. Soc. 2012, 60, 1687–1694. [Google Scholar] [CrossRef] [PubMed]
- Macklai, N.S.; Spagnoli, J.; Junod, J.; Santos-Eggimann, B. Prospective association of the SHARE-operationalized frailty phenotype with adverse health outcomes: Evidence from 60+ community-dwelling Europeans living in 11 countries. BMC Geriatr. 2013, 13, 3. [Google Scholar] [CrossRef] [PubMed]
- Brañas, F.; Jiménez, Z.; Sánchez-Conde, M.; Dronda, F.; De Quirós, J.C.L.B.; Pérez-Elías, M.J.; Miralles, P.; Ramírez, M.; Moreno, A.; Berenguer, J.; et al. Frailty and physical function in older HIV-infected adults. Age Ageing 2017, 46, 522–526. [Google Scholar] [CrossRef] [PubMed]
- Brothers, T.D.; Kirkland, S.; Guaraldi, G.; Falutz, J.; Theou, O.; Johnston, B.L.; Rockwood, K. Frailty in people aging with human immunodeficiency virus (HIV) infection. J. Infect. Dis. 2014, 210, 1170–1179. [Google Scholar] [CrossRef] [PubMed]
- Sánchez-Conde, M.; Rodriguez-Centeno, J.; Dronda, F.; López, J.C.; Jiménez, Z.; Berenguer, J.; Pérez-Elías, M.J.; Moreno, S.; Rodés, B.; Brañas, F. Frailty phenotype: A clinical marker of age acceleration in the older HIV-infected population. Epigenomics 2019, 11, 501–509. [Google Scholar] [CrossRef]
- Desquilbet, L.; Margolick, J.B.; Fried, L.P.; Phair, J.P.; Jamieson, B.D.; Holloway, M.; Jacobson, L.P.; Multicenter AIDS Cohort Study. Relationship between a frailty-related phenotype and progressive deterioration of the immune system in HIV-infected men. J. Acquir. Immune Defic. Syndr. 2009, 1, 299–306. [Google Scholar] [CrossRef]
- Weidner, C.; Lin, Q.; Koch, C.; Eisele, L.; Beier, F.; Ziegler, P.; Bauerschlag, D.O.; Jöckel, K.H.; Erbel, R.; Mühleisen, T.W.; et al. Aging of blood can be tracked by DNA methylation changes at just three CpG sites. Genome Biol. 2014, 15, R24. [Google Scholar] [CrossRef]
- Vázquez-Castellanos, J.F.; Serrano-Villar, S.; Latorre, A.; Artacho, A.; Ferrus, M.L.; Madrid, N.; Vallejo, A.; Sainz, T.; Martínez-Botas, J.; Ferrando-Martínez, S.; et al. Altered metabolism of gut microbiota contributes to chronic immune activation in HIV-infected individuals. Mucosal Immunol. 2015, 8, 760–772. [Google Scholar] [CrossRef]
- Dillon, S.M.; Lee, E.J.; Kotter, C.V.; Austin, G.L.; Dong, Z.; Hecht, D.K.; Gianella, S.; Siewe, B.; Smith, D.M.; Landay, A.L.; et al. An altered intestinal mucosal microbiome in HIV-1 infection is associated with mucosal and systemic immune activation and endotoxemia. Mucosal Immunol. 2014, 7, 983–994. [Google Scholar] [CrossRef]
- Buford, T.W. (Dis)Trust your gut: The gut microbiome in age-related inflammation, health, and disease. Microbiome 2017, 5, 80. [Google Scholar] [CrossRef] [PubMed]
- Biagi, E.; Nylund, L.; Candela, M.; Ostan, R.; Bucci, L.; Pini, E.; Nikkïla, J.; Monti, D.; Satokari, R.; Franceschi, C.; et al. Through ageing, and beyond: Gut microbiota and inflammatory status in seniors and centenarians. PLoS ONE 2010, 5, e10667. [Google Scholar] [CrossRef]
- Burke, W.J.; Wengel, R.W.H. The short form of the Geriatric Depression Scale: A comparison with the 30-item form. J. Geriatr. Psychiatry Neurol. 1991, 4, 173–178. [Google Scholar] [CrossRef] [PubMed]
- Guralnik, J.M.; Simonsick, E.M.; Ferrucci, L.; Glynn, R.J.; Berkman, L.F.; Blazer, D.G.; Scherr, P.A.; Wallace, R.B. A short physical performance battery assessing lower extremity function: Association with self-reported disability and prediction of mortality and nursing home admission. J. Gerontol. 1994, 49, M85–M94. [Google Scholar] [CrossRef] [PubMed]
- Fried, L.P.; Tangen, C.M.; Walston, J.; Newman, A.B.; Hirsch, C.; Gottdiener, J.; Seeman, T.; Tracy, R.; Kop, W.J.; Burke, G.; et al. Frailty in older adults: Evidence for a phenotype. J. Gerontol. Mar. 2001, 56, M146–M157. [Google Scholar] [CrossRef] [PubMed]
- Afgan, E.; Baker, D.; Batut, B.; van den Beek, M.; Bouvier, D.; Cech, M.; Chilton, J.; Clements, D.; Coraor, N.; Grüning, B.A.; et al. The Galaxy platform for accessible, reproducible and collaborative biomedical analyses: 2018 update. Nucleic Acids Res. 2018, 46, W537–W544. [Google Scholar] [CrossRef]
- Erlandson, K.M.; MaWhinney, S.; Wilson, M.; Gross, L.; McCandless, S.A.; Campbell, T.B.; Kohrt, W.M.; Schwartz, R.; Brown, T.T.; Jankowski, C.M. Physical function improvements with moderate or high-intensity exercise among older adults with or without HIV infection. AIDS 2018, 32, 2317–2326. [Google Scholar] [CrossRef]
- Mutlu, E.A.; Keshavarzian, A.; Losurdo, J.; Swanson, G.; Siewe, B.; Forsyth, C.; French, A.; Demarais, P.; Sun, Y.; Koenig, L.; et al. A compositional look at the human gastrointestinal microbiome and immune activation parameters in HIV infected subjects. PLoS Pathog. 2014, 10, e1003829. [Google Scholar]
- Ellis, R.J.; Heaton, R.K.; Gianella, S.; Rahman, G.; Knight, R. Reduced gut microbiome diversity in people with HIV who have distal neuropathic pain. J. Pain 2022, 23, 318–325. [Google Scholar] [CrossRef]
- Tuddenham, S.A.; Koay, W.L.A.; Zhao, N.; White, J.R.; Ghanem, K.G.; Sears, C.L. The Impact of human immunodeficiency virus infection on gut microbiota alpha-diversity: An individual-level meta-analysis. Clin. Infect. Dis. 2020, 70, 615–627. [Google Scholar] [CrossRef]
- Dinh, D.M.; Volpe, G.E.; Duffalo, C.; Bhalchandra, S.; Tai, A.K.; Kane, A.V.; Wanke, C.A.; Ward, H.D. Intestinal microbiota, microbial translocation, and systemic inflammation in chronic HIV infection. J. Infect. Dis. 2015, 211, 19–27. [Google Scholar] [CrossRef]
- Monaco, C.L.; Gootenberg, D.B.; Zhao, G.; Handley, S.A.; Ghebremichael, M.S.; Lim, E.S.; Lankowski, A.; Baldridge, M.T.; Wilen, C.B.; Flagg, M.; et al. Altered virome and bacterial microbiome in human immunodeficiency virus-associated acquired immunodeficiency syndrome. Cell Host Microbe 2016, 19, 311–322. [Google Scholar] [CrossRef]
- Tanes, C.; Walker, E.M.; Slisarenko, N.; Gerrets, G.L.; Grasperge, B.F.; Qin, X.; Jazwinski, S.M.; Bushman, F.D.; Bittinger, K.; Rout, N. Gut microbiome changes associated with epithelial barrier damage and systemic inflammation during antiretroviral therapy of chronic SIV infection. Viruses 2021, 13, 1567. [Google Scholar] [CrossRef]
- Dillon, S.M.; Wilson, C.C. What is the collective effect of aging and HIV on the gut microbiome? Curr. Opin. HIV AIDS 2020, 15, 94–100. [Google Scholar] [CrossRef] [PubMed]
- Lozupone, C.A.; Li, M.; Campbell, T.B.; Flores, S.C.; Linderman, D.; Gebert, M.J.; Knight, R.; Fontenot, A.P.; Palmer, B.E. Alterations in the gut microbiota associated with HIV-1 infection. Cell Host Microbe 2013, 14, 329–339. [Google Scholar] [CrossRef] [PubMed]
- Yang, L.; Poles, M.A.; Fisch, F.S.; Ma, Y.G.; Nossa, C.; Phelan, J.A.; Pei, Z. HIV-induced immunosuppression is associated with colonization of the proximal gut by environmental bacteria. AIDS 2016, 30, 19–29. [Google Scholar] [CrossRef]
- Rajilić-Stojanović, M.; Biagi, E.; Heilig, H.G.; Kajander, K.; Kekkonen, R.A.; Tims, S.; de Vos, W.M. Global and deep molecular analysis of microbiota signatures in fecal samples from patients with irritable bowel syndrome. Gastroenterology 2011, 141, 1792–1801. [Google Scholar] [CrossRef]
- Nishino, K.; Nishida, A.; Inoue, R.; Kawada, Y.; Ohno, M.; Sakai, S.; Inatomi, O.; Bamba, S.; Sugimoto, M.; Kawahara, M.; et al. Analysis of endoscopic brush samples identified mucosa-associated dysbiosis in inflammatory bowel disease. J. Gastroenterol. 2018, 53, 95–106. [Google Scholar] [CrossRef] [PubMed]
- Luu, T.H.; Michel, C.; Bard, J.M.; Dravet, F.; Nazih, H.; Bobin-Dubigeon, C. Intestinal proportion of Blautia sp. is associated with clinical stage and histoprognostic grade in patients with early-stage breast cancer. Nutr. Cancer. 2017, 69, 267–275. [Google Scholar] [CrossRef]
- San-Juan-Vergara, H.; Zurek, E.; Ajami, N.J.; Mogollon, C.; Pena, M.; Portnoy, I.; Vélez, J.I.; Cadena-Cruz, C.; Diaz-Olmos, Y.; Hurtado-Gómez, L.; et al. A Lachnospiraceae-dominated bacterial signature in the fecal microbiota of HIV-infected individuals from Colombia, South America. Sci. Rep. 2018, 8, 4479. [Google Scholar] [CrossRef]
- Vesterbacka, J.; Rivera, J.; Noyan, K.; Parera, M.; Neogi, U.; Calle, M.; Paredes, R.; Sönnerborg, A.; Noguera-Julian, M.; Nowak, P. Richer gut microbiota with distinct metabolic profile in HIV infected elite controllers. Sci. Rep. 2017, 7, 6269. [Google Scholar] [CrossRef] [PubMed]
- Meng, J.; Tao, J.; Abu, Y.; Sussman, D.A.; Girotra, M.; Franceschi, D.; Roy, S. HIV-positive patients on antiretroviral therapy have an altered mucosal intestinal but not oral microbiome. Microbiol. Spectr. 2023, 11, e0247222. [Google Scholar] [CrossRef] [PubMed]
- Fontana, A.; Manchia, M.; Panebianco, C.; Paribello, P.; Arzedi, C.; Cossu, E.; Garzilli, M.; Montis, M.A.; Mura, A.; Pisanu, C.; et al. Exploring the role of gut microbiota in major depressive disorder and in treatment resistance to antidepressants. Biomedicines 2020, 8, 311. [Google Scholar] [CrossRef]
- Manchia, M.; Fontana, A.; Panebianco, C.; Paribello, P.; Arzedi, C.; Cossu, E.; Garzilli, M.; Montis, M.A.; Mura, A.; Pisanu, C.; et al. Involvement of gut microbiota in schizophrenia and treatment resistance to antipsychotics. Biomedicines 2021, 9, 875. [Google Scholar] [CrossRef] [PubMed]
- Jiang, H.; Ling, Z.; Zhang, Y.; Mao, H.; Ma, Z.; Yin, Y.; Wang, W.; Tang, W.; Tan, Z.; Shi, J.; et al. Altered fecal microbiota composition in patients with major depressive disorder. Brain Behav. Immun. 2015, 48, 186–194. [Google Scholar] [CrossRef]
- Zheng, P.; Zeng, B.; Zhou, C.; Liu, M.; Fang, Z.; Xu, X.; Zeng, L.; Chen, J.; Fan, S.; Du, X.; et al. Gut microbiome remodeling induces depressive-like behaviors through a pathway mediated by the host’s metabolism. Mol. Psychiatry 2016, 21, 786–796. [Google Scholar] [CrossRef] [PubMed]
- Wong, M.L.; Inserra, A.; Lewis, M.D.; Mastronardi, C.A.; Leong, L.; Choo, J.; Kentish, S.; Xie, P.; Morrison, M.; Wesselingh, S.L.; et al. Inflammasome signaling affects anxiety- and depressive-like behavior and gut microbiome composition. Mol. Psychiatry 2016, 21, 797–805. [Google Scholar] [CrossRef]
- Inserra, A.; Rogers, G.B.; Licinio, J.; Wong, M.L. The microbiota-inflammasome hypothesis of major depression. BioEssays 2018, 40, e1800027. [Google Scholar] [CrossRef]
- Barandouzi, Z.A.; Starkweather, A.R.; Henderson, W.A.; Gyamfi, A.; Cong, X.S. Altered composition of gut microbiota in depression: A systematic review. Front. Psychiatry 2020, 11, 541. [Google Scholar] [CrossRef]
- Jianguo, L.; Xueyang, J.; Cui, W.; Changxin, W.; Xuemei, Q. Altered gut metabolome contributes to depression-like behaviors in rats exposed to chronic unpredictable mild stress. Transl. Psychiatry 2019, 9, 40. [Google Scholar] [CrossRef]
- Galkin, F.; Mamoshina, P.; Aliper, A.; Putin, E.; Moskalev, V.; Gladyshev, V.N.; Zhavoronkov, A. Human gut microbiome aging clock based on taxonomic profiling and deep learning. iScience 2020, 23, 101199. [Google Scholar] [CrossRef] [PubMed]
- Trottein, F.; Sokol, H. Potential causes and consequences of gastrointestinal disorders during a SARS-CoV-2 infection. Cell Rep. 2020, 32, 107915. [Google Scholar] [CrossRef] [PubMed]
- Martino, C.; Kellman, B.P.; Sandoval, D.R.; Clausen, T.M.; Marotz, C.A.; Song, S.J.; Wandro, S.; Zaramela, L.S.; Salido Benítez, R.A.; Zhu, Q.; et al. Bacterial modification of the host glycosaminoglycan heparan sulfate modulates SARS-CoV-2 infectivity. bioRxiv 2020. [Google Scholar] [CrossRef]
- Chen, Y.R.; Zheng, H.M.; Zhang, G.X.; Chen, F.L.; Chen, L.D.; Yang, Z.C. High Oscillospira abundance indicates constipation and low BMI in the Guangdong Gut Microbiome Project. Sci. Rep. 2020, 10, 9364. [Google Scholar] [CrossRef]
- Del Chierico, F.; Manco, M.; Gardini, S.; Guarrasi, V.; Russo, A.; Bianchi, M.; Tortosa, V.; Quagliariello, A.; Shashaj, B.; Fintini, D.; et al. Fecal microbiota signatures of insulin resistance, inflammation, and metabolic syndrome in youth with obesity: A pilot study. Acta Diabetol. 2021, 58, 1009–1022. [Google Scholar] [CrossRef]
- Wang, Z.; Usyk, M.; Sollecito, C.C.; Qiu, Y.; Williams-Nguyen, J.; Hua, S.; Gradissimo, A.; Wang, T.; Xue, X.; Kurland, I.J.; et al. Altered gut microbiota and host metabolite profiles in women with human immunodeficiency virus. Clin. Infect. Dis. 2020, 71, 2345–2353. [Google Scholar] [CrossRef] [PubMed]
- Piggott, D.A.; Tuddenham, S. The gut microbiome and frailty. Transl. Res. 2020, 221, 23–43. [Google Scholar] [CrossRef]
- Haran, J.P.; Bucci, V.; Dutta, P.; Ward, D.; McCormick, B. The nursing home elder microbiome stability and associations with age, frailty, nutrition and physical location. J. Med. Microbiol. 2018, 67, 40–51. [Google Scholar] [CrossRef] [PubMed]
- Jackson, M.A.; Jeffery, I.B.; Beaumont, M.; Bell, J.T.; Clark, A.G.; Ley, R.E.; O’Toole, P.W.; Spector, T.D.; Steves, C.J. Signatures of early frailty in the gut microbiota. Genome Med. 2016, 8, 8. [Google Scholar] [CrossRef] [PubMed]
- Dickson, I. Gut microbiota: Frailty associated with gut microbiota. Nat. Rev. Gastroenterol. Hepatol. 2016, 13, 122. [Google Scholar]
- Maffei, V.J.; Kim, S.; Blanchard, E.; Luo, M.; Jazwinski, S.M.; Taylor, C.M.; Welsh, D.A. Biological aging and the human gut microbiota. J. Gerontol. A Biol. Sci. Med. Sci. 2017, 72, 1474–1482. [Google Scholar] [CrossRef] [PubMed]
- Li, S.X.; Armstrong, A.; Neff, C.P.; Shaffer, M.; Lozupone, C.A.; Palmer, B.E. Complexities of gut microbiome dysbiosis in the context of HIV infection and antiretroviral therapy. Clin. Pharmacol. Ther. 2016, 99, 600–611. [Google Scholar] [CrossRef] [PubMed]
- Campbell, C.; Kandalgaonkar, M.R.; Golonka, R.M.; Yeoh, B.S.; Vijay-Kumar, M.; Saha, P. Crosstalk between gut microbiota and host immunity: Impact on inflammation and immunotherapy. Biomedicines 2023, 11, 294. [Google Scholar] [CrossRef] [PubMed]


| All PWH N = 24 | Frail-PWH N = 7 | Non-Frail-PWH N = 17 | Healthy Controls N = 12 | p | ||
|---|---|---|---|---|---|---|
| Prefrail N = 9 | Robust N = 8 | |||||
| Sex at birth (Women/Men) | 4 W/20 M | 2 W/5 M | 2 W/7 M | 0 W/8 M | 4 W/8 M | |
| Age (years) Media (SD) | 61.9 (7.6) | 60 (3.9) | 65.3 (10.9) | 59.7 (4.2) | 60.6 (6.1) | 0.245 |
| Years living with known HIV Media (SD) | 16.5 (7.7) | 19.8 (6.5) | 17.5 (8.5) | 12.5 (6.6) | - | 0.164 |
| CD4+ nadir cells/mm3 Median (IQR) | 170.6 (154) | 171 (141.2) | 116.6 (105.6) | 231 (200) | - | 0.325 |
| Current CD4+ (cells/mm3) Media (SD) | 589.2 (342.1) | 662.8 (579.4) | 523.7 (207.8) | 598.5 (191) | - | 0.737 |
| Rate CD4/CD8 Median (IQR) | 0.87 (0.5) | 0.70 (0.3) | 0.74 (0.3) | 1.1 (0.6) | - | 0.124 |
| Diagnosed with depression (N) | 7 | 3 | 2 | 2 | - | 0.634 |
| Polypharmacy * (N) | 12 | 6 | 5 | 1 | - | 0.017 |
| BMI kg/m2 (N) | - | 0.293 | ||||
| <25 | 15 | 5 | 6 | 4 | ||
| 25–29 | 5 | 0 | 3 | 2 | ||
| >29 | 4 | 2 | 0 | 2 | ||
| Control | PWH | ||||
|---|---|---|---|---|---|
| Phyla/Genera | N (%) a | Median (IQR) | N (%) | Median (IQR) | p-Value * |
| Firmicutes/Bacillota | 12 (100%) | 73.27 (67.71–77.6) | 24 (100%) | 74.51 (66.49–80.73) | 0.730 |
| Faecalibacterium | 12 (100%) | 9.25 (8.4–14.04) | 24 (100%) | 9.1 (5.07–15.04) | 0.560 |
| Blautia | 12 (100%) | 7.16 (5.82–8.48) | 24 (100%) | 11.18 (9.53–14.57) | <0.001 |
| Ruminococcus | 12 (100%) | 9.99 (8.12–14.64) | 24 (100%) | 9.08 (6.42–11.71) | 0.500 |
| Clostridium | 12 (100%) | 5.49 (4.17–7.21) | 24 (100%) | 3.08 (2.42–3.72) | 0.005 |
| Collinsella | 10 (83.33%) | 2.59 (1.11–4.78) | 21 (87.5%) | 2.83 (0.67–7.56) | 0.450 |
| Coprococcus | 12 (100%) | 1.79 (0.79–3.13) | 22 (91.67%) | 2.54 (1.32–4.58) | 0.180 |
| Slackia | 12 (100%) | 3.23 (1.45–3.93) | 23 (95.83%) | 2.01 (0.38–3.88) | 0.180 |
| Oscillospira | 12 (100%) | 3.99 (2.5–4.49) | 23 (95.83%) | 1.32 (0.78–2.89) | 0.018 |
| Alkaliphilus | 11 (91.67%) | 3.44 (2.08–4.46) | 22 (91.67%) | 0.76 (0.33–2.13) | 0.010 |
| Catenibacterium | 2 (16.67%) | <0.01 (<0.01–<0.01) | 9 (37.5%) | <0.01 (<0.01–1.83) | 0.210 |
| Roseburia | 12 (100%) | 1.54 (0.86–2.49) | 22 (91.67%) | 1.21 (0.53–2.59) | 0.700 |
| Eubacterium | 9 (75%) | 0.57 (0.06–2.23) | 17 (70.83%) | 0.64 (<0.01–2.48) | 0.970 |
| Erysipelothrix | 10 (83.33%) | 0.55 (0.25–1.4) | 24 (100%) | 0.83 (0.39–1.65) | 0.250 |
| Dorea | 12 (100%) | 0.58 (0.35–0.71) | 23 (95.83%) | 0.9 (0.66–1.38) | 0.022 |
| Bacteroidetes/Bacteroidota | 12 (100%) | 10.11 (6.6–13.5) | 23 (95.83%) | 7.31 (1.86–9.81) | 0.072 |
| Bacteroides | 12 (100%) | 5.89 (4.36–8.97) | 21 (87.5%) | 1.54 (0.5–6.61) | 0.033 |
|
Proteobacteria/ Pseudomonota | 12 (100%) | 1.89 (1.45–5.5) | 24 (100%) | 1.55 (0.88–4.79) | 0.560 |
| Escherichia | 8 (66.67%) | 0.37 (<0.01–1.22) | 13 (54.17%) | 0.18 (<0.01–1.92) | 0.740 |
|
Actinobacteria/ Actinomycetota | 12 (100%) | 3.33 (1.36–6.68) | 19 (79.17%) | 1.29 (0.39–4.41) | 0.320 |
| Bifidobacterium | 12 (100%) | 3.21 (0.63–6.55) | 15 (62.5%) | 0.99 (<0.01–4.17) | 0.240 |
| Minor_phyla | 9 (75%) | 0.55 (<0.01–0.88) | 20 (83.33%) | 0.85 (0.3–2.23) | 0.310 |
| Akkermansia | 4 (33.33%) | <0.01 (<0.01–0.25) | 7 (29.17%) | <0.01 (<0.01–0.26) | 0.950 |
| Minor_genera | 12 (100%) | 13.87 (10.3–17.63) | 24 (100%) | 11.99 (8.66–19.25) | 0.750 |
| Unclassified_phyla | 12 (100%) | 7.21 (6.66–7.58) | 24 (100%) | 7.09 (6.46–7.66) | 0.700 |
| Unclassified_genera | 12 (100%) | 15.01 (13.96–15.5) | 24 (100%) | 12.22 (11.16–14.94) | 0.210 |
| Robust (n = 8) | Pre-Frail (n = 9) | Frail (n = 7) | p-Value * | ||||
|---|---|---|---|---|---|---|---|
| Shannon index | 3.38 (3.28–3.65) | 3.63 (3.51–3.7) | 3.59 (3.37–3.62) | 0.45 | |||
| Bray–Curtis a | A | A | A | 0.70 ** | |||
| Jaccard a | A | A | A | 0.19 ** | |||
| Phylum/genera | N (%) | median (IQR) | N (%) | median (IQR) | N (%) | median (IQR) | |
| Firmicutes/Bacillota | 8 (100%) | 75.48 (66.12–82.3) | 9 (100%) | 70.64 (64.59–76.33) | 7 (100%) | 78.84 (69.33–81.75) | 0.79 |
| Blautia | 8 (100%) | 10.22 (8.31–12.12) | 9 (100%) | 10.81 (9.11–13.66) | 7 (100%) | 13.41 (11.39–15) | 0.23 |
| Faecalibacterium | 8 (100%) | 8.84 (3.43–12.44) | 9 (100%) | 10.59 (8.5–18.26) | 7 (100%) | 7.12 (4.12–15.45) | 0.47 |
| Ruminococcus | 8 (100%) | 9.08 (8.49–12.74) | 9 (100%) | 11.12 (4.77–11.7) | 7 (100%) | 8.7 (6.87–11.76) | 0.88 |
| Collinsella | 7 (87.5%) | 4.56 (0.63–10.24) | 8 (88.89%) | 2.69 (2.3–3.61) | 6 (85.71%) | 5.14 (1.61–7.71) | 0.74 |
| Clostridium | 8 (100%) | 2.96 (2.33–4) | 9 (100%) | 3.22 (2.98–3.63) | 7 (100%) | 2.77 (1.59–3.67) | 0.47 |
| Coprococcus | 8 (100%) | 1.96 (1.35–3.22) | 9 (100%) | 3.79 (2.27–4.08) | 5 (71.43%) | 2.22 (0.67–5.09) | 0.60 |
| Slackia | 7 (87.5%) | 2.57 (1.16–3.9) | 9 (100%) | 0.97 (0.46–2.88) | 7 (100%) | 2.12 (0.34–4.48) | 0.79 |
| Catenibacterium | 4 (50%) | 0.27 (<0.01–4.37) | 2 (22.22%) | <0.01 (<0.01–<0.01) | 3 (42.86%) | <0.01 (<0.01–1.89) | 0.41 |
| Oscillospira | 8 (100%) | 1.41 (0.77–2.37) | 9 (100%) | 1.59 (0.8–4.21) | 6 (85.71%) | 1.05 (0.8–2.49) | 0.87 |
| Roseburia | 8 (100%) | 0.84 (0.6–1.42) | 9 (100%) | 1.86 (1.29–3.27) | 5 (71.43%) | 1.14 (0.27–3.25) | 0.56 |
| Eubacterium | 5 (62.5%) | 1.51 (<0.01–4.01) | 6 (66.67%) | 0.27 (<0.01–1.3) | 6 (85.71%) | 1.3 (0.13–2.3) | 0.71 |
| Erysipelothrix | 8 (100%) | 0.8 (0.47–2.18) | 9 (100%) | 0.48 (0.36–0.78) | 7 (100%) | 1.45 (0.9–2.64) | 0.13 |
| Alkaliphilus | 7 (87.5%) | 0.42 (0.2–0.91) | 9 (100%) | 0.94 (0.58–1.52) | 6 (85.71%) | 1.58 (0.55–2.88) | 0.22 |
| Dorea | 8 (100%) | 1.4 (1.02–1.74) | 9 (100%) | 0.77 (0.64–0.85) | 6 (85.71%) | 0.89 (0.45–1.58) | 0.08 |
| Bacteroidetes/ Bacteroidota | 7 (87.5%) | 5.84 (0.72–10.17) | 9 (100%) | 7.43 (5.96–8.95) | 7 (100%) | 2.91 (1.17–8.26) | 0.42 |
| Bacteroides | 6 (75%) | 1.05 (0.39–3.22) | 9 (100%) | 3.76 (1.55–6.59) | 6 (85.71%) | 0.44 (0.2–4.19) | 0.16 |
| Proteobacteria/ Pseudomonodota | 8 (100%) | 1.55 (0.91–3.96) | 9 (100%) | 4.4 (1.32–9.24) | 7 (100%) | 1.42 (0.85–2.5) | 0.38 |
| Escherichia | 4 (50%) | 0.12 (<0.01–0.3) | 5 (55.56%) | 1.84 (<0.01–5.31) | 4 (57.14%) | 0.11 (<0.01–0.75) | 0.62 |
| Actinobacteria/ Actinomycetota | 5 (62.5%) | 0.74 (<0.01–6.77) | 8 (88.89%) | 1.23 (0.63–3.4) | 6 (85.71%) | 3.74 (0.96–4.04) | 0.79 |
| Bifidobacterium | 3 (37.5%) | <0.01 (<0.01–6.26) | 6 (66.67%) | 1.23 (<0.01–3.07) | 6 (85.71%) | 3.01 (0.47–3.72) | 0.68 |
| Minor_phyla | 7 (87.5%) | 0.68 (0.24–1.08) | 7 (77.78%) | 1 (0.43–2.22) | 6 (85.71%) | 0.72 (0.33–10.34) | 0.79 |
| Akkermansia | 2 (25%) | <0.01 (<0.01–0.05) | 2 (22.22%) | <0.01 (<0.01–<0.01) | 3 (42.86%) | <0.01 (<0.01–8.1) | 0.51 |
| Minor_genera | 8 (100%) | 10.23 (7.57–14.83) | 9 (100%) | 11.91 (10.59–19.03) | 7 (100%) | 12.07 (9.1–18.79) | 0.68 |
| Unclassified_phyla | 8 (100%) | 7.33 (6.56–7.74) | 9 (100%) | 6.77 (6.45–7.17) | 7 (100%) | 7.26 (6.73–7.71) | 0.46 |
| Unclassified_genera | 8 (100%) | 12.38 (11.77–15.71) | 9 (100%) | 11.85 (11.21–13.19) | 7 (100%) | 12.33 (11.15–13.89) | 0.88 |
Disclaimer/Publisher’s Note: The statements, opinions and data contained in all publications are solely those of the individual author(s) and contributor(s) and not of MDPI and/or the editor(s). MDPI and/or the editor(s) disclaim responsibility for any injury to people or property resulting from any ideas, methods, instructions or products referred to in the content. |
© 2023 by the authors. Licensee MDPI, Basel, Switzerland. This article is an open access article distributed under the terms and conditions of the Creative Commons Attribution (CC BY) license (https://creativecommons.org/licenses/by/4.0/).
Share and Cite
Sánchez-Conde, M.; Alba, C.; Castro, I.; Dronda, F.; Ramírez, M.; Arroyo, R.; Moreno, S.; Rodríguez, J.M.; Brañas, F. Comparison of the Fecal Bacteriome of HIV-Positive and HIV-Negative Older Adults. Biomedicines 2023, 11, 2305. https://doi.org/10.3390/biomedicines11082305
Sánchez-Conde M, Alba C, Castro I, Dronda F, Ramírez M, Arroyo R, Moreno S, Rodríguez JM, Brañas F. Comparison of the Fecal Bacteriome of HIV-Positive and HIV-Negative Older Adults. Biomedicines. 2023; 11(8):2305. https://doi.org/10.3390/biomedicines11082305
Chicago/Turabian StyleSánchez-Conde, Matilde, Claudio Alba, Irma Castro, Fernando Dronda, Margarita Ramírez, Rebeca Arroyo, Santiago Moreno, Juan Miguel Rodríguez, and Fátima Brañas. 2023. "Comparison of the Fecal Bacteriome of HIV-Positive and HIV-Negative Older Adults" Biomedicines 11, no. 8: 2305. https://doi.org/10.3390/biomedicines11082305