Article

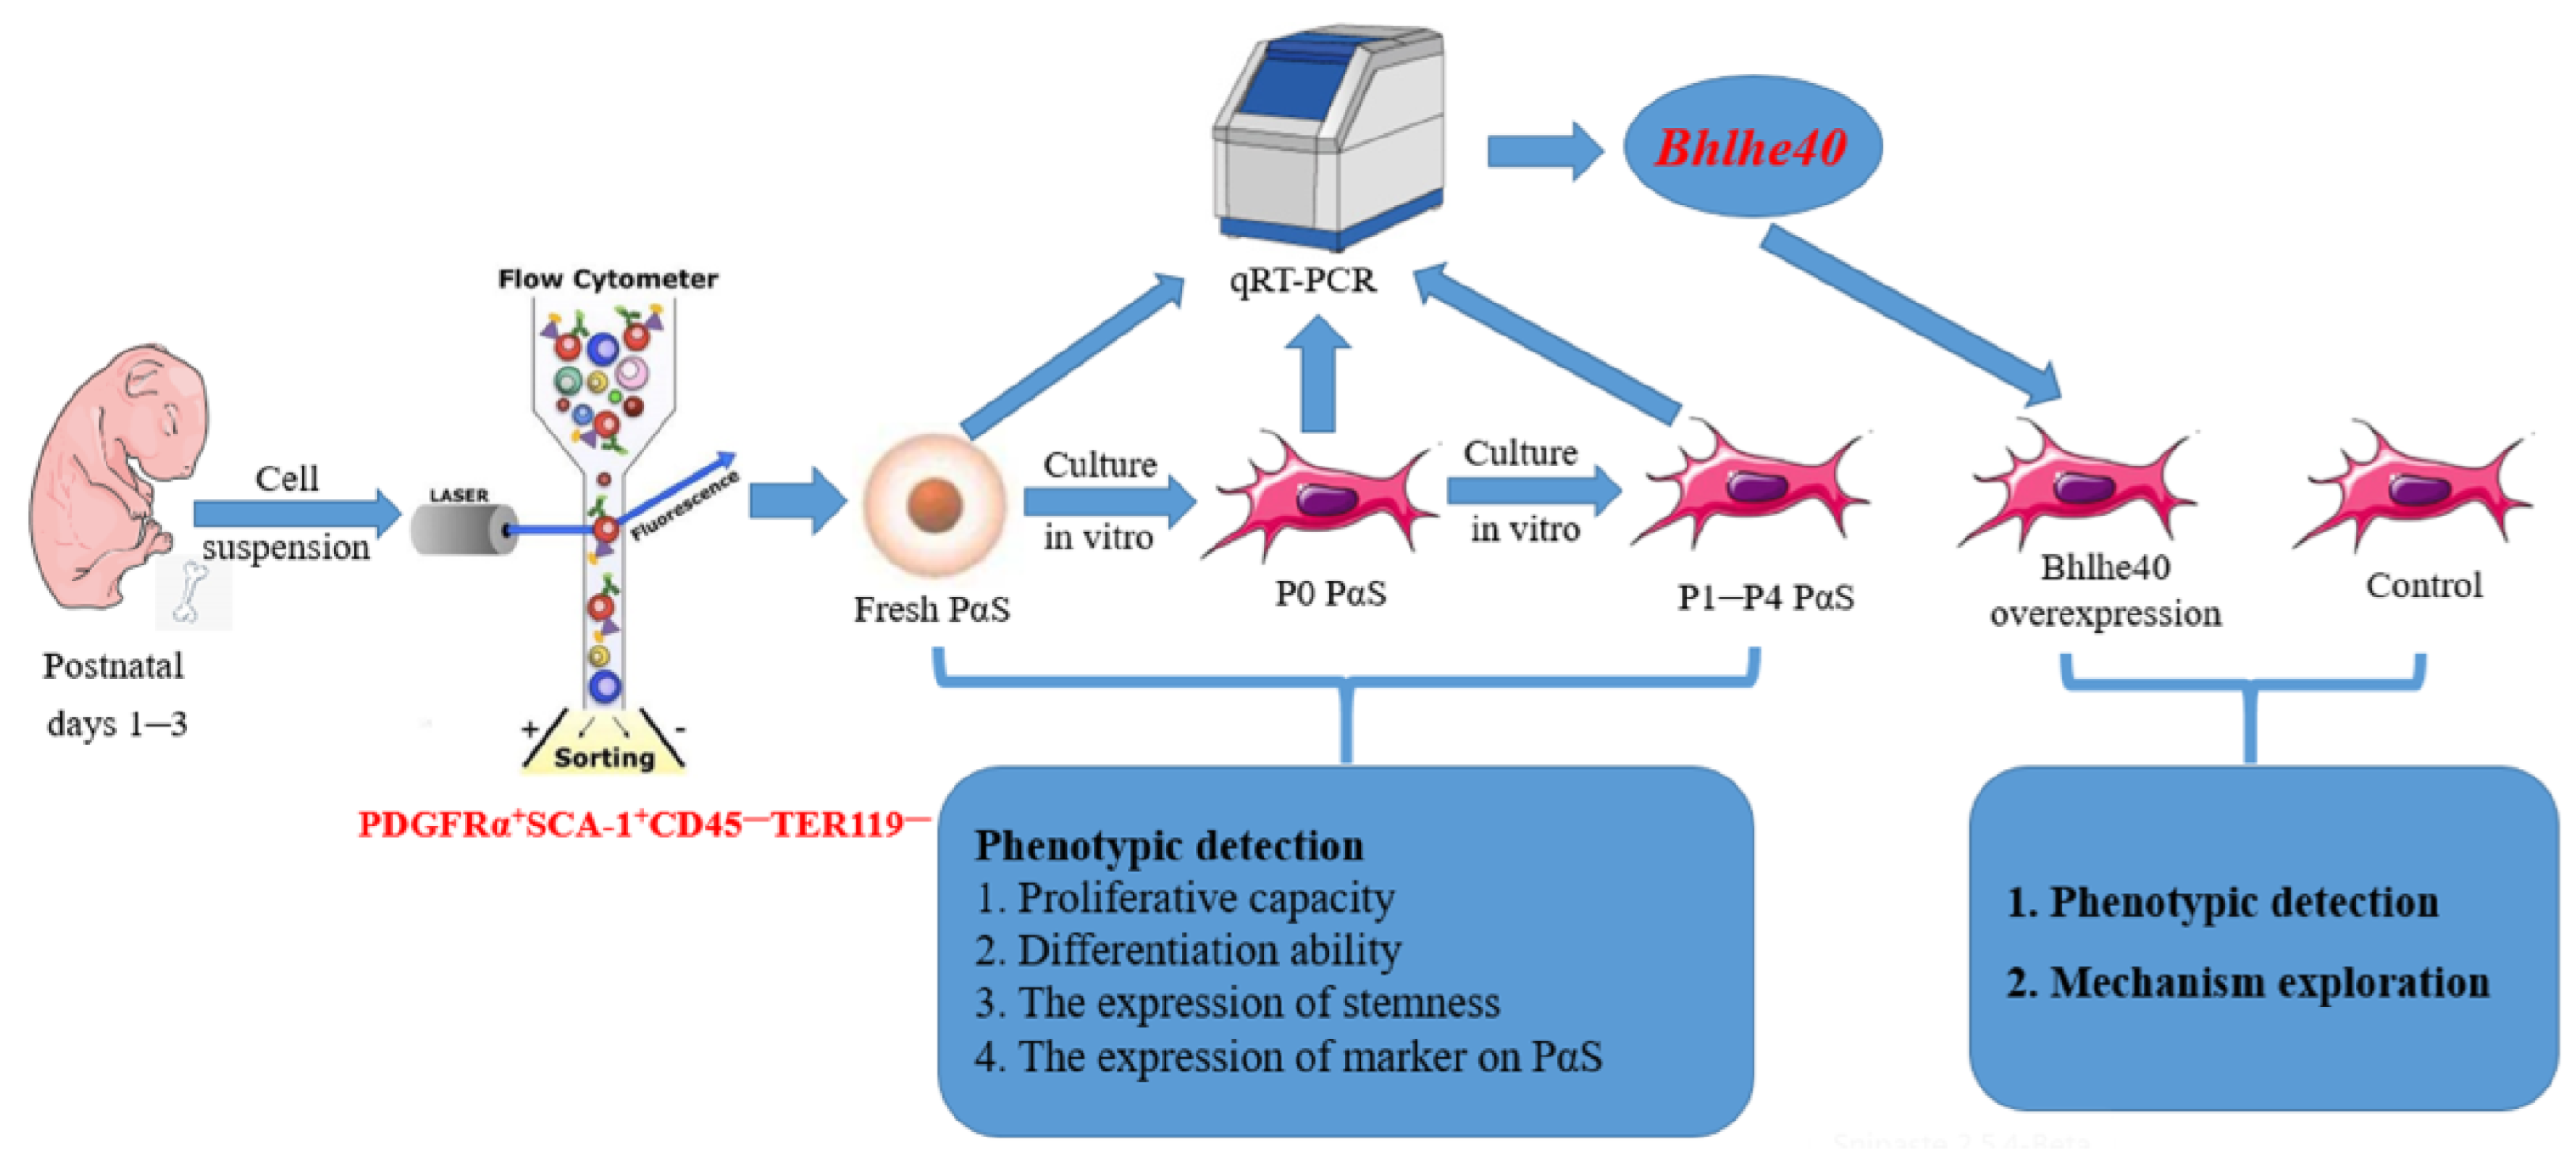
BHLHE40 Maintains the Stemness of PαS Cells In Vitro by Targeting Zbp1 through the Wnt/β-Catenin Signaling Pathway

1
Department of Prosthodontics, Peking University School and Hospital of Stomatology, 22 Zhongguancun South Avenue, Haidian District, Beijing 100081, China
2
National Center for Stomatology & National Clinical Research Center for Oral Diseases & National Engineering Research Center of Oral Biomaterials and Digital Medical Devices & Beijing Key Laboratory of Digital Stomatology, 22 Zhongguancun South Avenue, Haidian District, Beijing 100081, China
*
Authors to whom correspondence should be addressed.
Biomedicines 2023, 11(8), 2190; https://doi.org/10.3390/biomedicines11082190
Submission received: 23 June 2023 / Revised: 30 July 2023 / Accepted: 1 August 2023 / Published: 3 August 2023
(This article belongs to the Special Issue Editorial Board Members' Collection Series: Gene and Cell Therapy)

Abstract

:
Primary bone mesenchymal stem cells (BMSCs) gradually lose stemness during in vitro expansion, which significantly affects the cell therapeutic effects. Here, we chose murine PαS (SCA-1+PDGFRα+CD45TER119) cells as representative of BMSCs and aimed to explore the premium culture conditions for PαS cells. Freshly isolated (fresh) PαS cells were obtained from the limbs of C57/6N mice by fluorescence-activated cell sorting (FACS). We investigated the differences in the stemness of PαS cells by proliferation, differentiation, and stemness markers in vitro and by ectopic osteogenesis and chondrogenesis ability in vivo, as well as the changes in the stemness of PαS cells during expansion in vitro. Gain- and loss-of-function experiments were applied to investigate the critical role and underlying mechanism of the basic helix–loop–helix family member E40 (BHLHE40) in maintaining the stemness of PαS cells. The stemness of fresh PαS cells representative in vivo was superior to that of passage 0 (P0) PαS cells in vitro. The stemness of PαS cells in vitro decreased gradually from P0 to passage 4 (P4). Moreover, BHLHE40 plays a critical role in regulating the stemness of PαS cells during in vitro expansion. Mechanically, BHLHE40 regulates the stemness of PαS cells by targeting Zbp1 through the Wnt/β-catenin signaling pathway. This work confirms that BHLHE40 is a critical factor for regulating the stemness of PαS cells during expansion in vitro and may provide significant indications in the exploration of premium culture conditions for PαS cells.

1. Introduction

Bone mesenchymal stem cells (BMSCs) have been widely used in bone tissue engineering and stem cell therapy due to their good proliferative capacity and strong multidirectional differentiation [1,2]. However, only approximately 1/100,000 bone marrow monocytes in vivo are BMSCs; therefore, in vitro culture expansion is required to obtain sufficient BMSCs [3]. Unfortunately, the stemness of BMSCs may decrease during in vitro culture and expansion, leading to reduced effectiveness of BMSCs in regenerative tissue engineering and cell therapy [4,5]. Therefore, maintaining the stemness of BMSCs during in vitro expansion is key for effective stem cell therapy [6]. In addition, the biological characteristics of in vivo BMSCs may differ considerably from those of BMSCs cultured in vitro, although differences in stemness have not been investigated [7,8]. Understanding differences in stemness between in vivo and in vitro BMSCs would be of great help in maintaining the stemness of BMSCs during in vitro expansion.
BMSCs are heterogeneous and include different cell subsets that have different functions [9]. Therefore, cell subsets with strong proliferative capacity and multidirectional differentiation are more suitable for investigating the stemness of BMSCs during in vitro expansion culture [10]. Mouse PαS cells (PDGFRα+SCA-1+CD45TER119) are a subset of mouse BMSCs, with strong proliferative potential and trilineage differentiation capacity [11]. In addition, some studies have noted that PαS cells have similar homology with human BMSCs, which can reflect the status of human BMSCs to a certain extent [11,12].
Basic helix–loop–helix family member E40 (BHLHE40) is a transcription factor that is highly conserved in mammalian species [13]. Previous research showed that BHLHE40 is involved in a variety of basic cellular processes, which included cell proliferation, cell differentiation, cell cycle regulation, metabolism, apoptosis, and immune regulation [13,14,15,16,17,18,19]. For example, studies have shown that BHLHE40 either promotes or inhibits cell proliferation and regulates the production of adipose tissue [20,21,22,23]. In addition, BHLHE40 promotes the metastasis of liver tumor cells and the growth of gastric tumor cells and breast tumor cells [24,25,26,27,28,29]. Such studies indicate that BHLHE40 plays a critical role in cell biology, however, the role of BHLHE40 in maintaining stemness in PαS cells is still unclear.
In this study, PαS cells were chosen to represent BMSCs. The research process is shown in Figure 1. We found that the expression of stemness genes and surface markers, as well as the ectopic osteogenic differentiation capacity, were significantly higher in freshly isolated (Fresh) PαS cells than in passage 0 (P0) PαS cells. In addition, the expression of stemness and surface marker genes in PαS cells decreased gradually from P0 to passage 4 (P4). The proliferation and differentiation capacities of PαS cells also decreased gradually from P0 to P4 both in vitro and in vivo. Moreover, we noted that the mRNA expression level of Bhlhe40 not only in fresh PαS cells was significantly lower than in P0 PαS cells, but also decreased gradually from P0 to P4 culture in vitro. Most importantly, overexpression of Bhlhe40 promoted cell proliferation, as well as osteogenic and chondrogenic differentiation of PαS cells in vitro. Mechanically, BHLHE40 activated Z-DNA binding protein 1 (Zbp1) to regulate the osteogenic and chondrogenic differentiation potential of PαS cells through Wnt/β-catenin signaling.
Collectively, our present work provided significant indication for exploration of better culture conditions for PαS cells. Small molecule drugs that stimulate BHLHE40 expression may be developed to maintain the stemness of PαS cells when they are expanded and cultured in vitro.

2. Materials and Methods

The specific information of animals, materials, and reagents used in the present study is listed in Table S1.

2.1. Cell Culture

Fresh PαS cells were extracted from the limbs of C57BL/6N mice 1 to 3 days after birth, which were not inoculated on the well plate. The method used is described by Matsuzaki and Zeller et al. [11,30]. The main steps were to extract the limbs of C57/6N mice, cut the limbs in the tube, decompose them with collagenase I and II at 37 °C, filter, break the red blood cells, incubate the flow antibody, and then to obtain the fresh PαS cells (SCA-1+PDGFRα+CD45TER119) through fluorescence-activated cell sorting (FACS). Fresh PαS cells were inoculated on a well plate to obtain P0 PαS cells, and passage 1 (P1) to P4 PαS cells were also obtained by digestion and passage in the well plate.
PαS cells were cultured in a proliferation medium that consisted of minimum essential medium α, fetal bovine serum (10%), penicillin G (100 U/mL), and streptomycin (100 mg/mL). Osteogenic medium was created by supplementing the proliferation medium with L-ascorbic acid (0.2 mM), β-glycerophosphoric acid (10 mM), and dexamethasone (100 nM). Chondrogenic medium was created by supplementing the proliferation medium with L-lactic acid diphosphate (1 µM), sodium pyruvate (0.1%), dexamethasone (100 nM), insulin-transferrin-selenium (1%), L-proline (40 µg/mL), and transforming growth factor-β1 (10 ng/mL). The cell culture conditions were 95% air, 5% CO2, and 37 °C [31].

2.2. Lentivirus Infection, RNA Transfection and Use of Inhibitor of Wnt/β-Catenin Signaling Pathway

Bhlhe40-overexpressing lentivirus (Bhlhe40) and negative control (Vector) were purchased from GenePharma. To construct cell lines with stable Bhlhe40 overexpression, lentivirus suspension containing polystyrene (5 mg/mL) was added to the cell proliferation medium when the fusion rate of P1 or Passage 2 (P2) PαS cells reached 50 to 70%. After 72 to 96 h of lentivirus infection, the cells were screened using puromycin (1 µg/mL). Passage 3 (P3) or P4 PαS cells with stable mRNA overexpression of Bhlhe40 were used in subsequent experiments.
The short interference (si) RNA sequences used to target Zbp1 (siZbp1) and the negative control (siNC) are listed in Table 1. The siRNAs were transfected using Lipofectamine 3000, in accordance with the manufacturer’s instructions. Cells were collected 48 h after transfection, to analyze gene expression. During differentiation induction, transfection was repeated every 2 to 3 days. To investigate the signal pathway mechanisms, the cell media were supplemented with IWR-1 endo (10 µM), which is a Wnt/β-catenin signaling pathway inhibitor.

2.3. Cell Proliferation Capacity Test

Initially, 103 cells were seeded in a 96-well plate and the culture medium changed every 2 to 3 days. Cell Counting Kit-8 (CCK8) proliferation assay was performed in accordance with the manufacturer’s instructions.
Single cells were added to 96-well plates where media were added, using the FACS apparatus. In addition, each well of the 6-well plate was seeded with 500 cells. And the media were changed every 2 to 3 days. On day 14, the culture media were removed from the plates and the cells were washed by phosphate-buffered saline (PBS). Then, the cells were fixed with paraformaldehyde (4%) and stained with crystal violet (1%). Finally, the 96-well plates and 6-well plate were scanned and photographed.

2.4. Alkaline Phosphatase (ALP) Staining and Activity

PαS cells were seeded in 12-well plates; the cells were fixed in cold ethanol and washed with PBS after 7 days of osteogenic induction. ALP staining and quantification were performed in accordance with the manufacturer’s instructions. We used an ALP staining and detection kit and a bicinchoninic acid assay protein detection kit. ALP-stained images were scanned and the absorbance of ALP quantification solution was measured. Total protein concentrations were measured after normalization.

2.5. Alizarin Red S (ARS) Staining and Quantification

PαS cells were inoculated in 12-well plates, the cells were fixed in ethanol and rinsed with distilled water after 14 days of osteogenic induction. Then, cells were stained with ARS solution (2%, pH 4.2), and ARS-stained images were scanned. The plates were incubated with cetylpyridine chloride (100 mM), and the absorbance of the ARS quantification solution was measured.

2.6. PαS Cells in Well Plates Stained with Alcian Blue

PαS cells were seeded in 12-well plates. After 21 days of chondrogenic induction, PαS cells were fixed with ethanol, washed with PBS, stained with Alcian blue solution (pH 2.5), and photographed under a microscope [32].

2.7. Chondrosphere Sections Stained with Alcian Blue and Sirius Red

After digestion, PαS cells were counted and resuspended at 5 × 10⁵ cells in a 15 mL centrifugal tube and centrifuged (1000 rpm, 5 min) to collect the cells. Next, chondrogenic induction medium was added and, after 21 days, the cell pellets were rinsed with PBS and fixed in paraformaldehyde (4%) overnight. Finally, the chondrospheres were then stained with Alcian blue and Sirius red.

2.8. RNA Extraction and Quantitative Reverse Transcription-Polymerase Chain Reaction (qRT-PCR)

PαS cells were inoculated in 6-well plates and total RNA was extracted by TRIzol reagent. A Nano Drop 8000 spectrophotometer was used to measured the RNA concentrations. In accordance with the manufacturer’s instructions, total RNA was reverse transcribed into single-stranded cDNA by the Prime Script RT Reagent Kit, and qRT-PCR reactions were performed using Power SYBR Green PCR Master Mix. Glyceraldehyde 3-phosphate dehydrogenase (Gapdh) was used as an internal reference, and gene expression was normalized. The gene expression was analyzed by the 2−ΔΔCT method. The mouse primers used in the present study are listed in Table 1.
Table 1. Sequences of siRNA and primers used in this study.
NameSense Strand/Sense Primer (5′–3′)Antisense Strand/Antisense Primer (5′–3′)
si-RNA
si-Zbp1GCCUGCAACAUGGAGCAUATTUAUGCUCCAUGUUG-CAGGCTT
Si-NCUUCUCCGAACGUGUCACGUTTACGUGACACGUUCGGAGAATT
Primers
mGapdhTGGCCTTCCGTGTTCCTACGAGTTGCTGTTGAAGTCGCA
mAlpCCAACTCTTTTGTGCCAGAGAGGCTACATTGGTGTTGAGCTTTT
mRunx2AGAGTCAGATTACAGATCCCAGGTGGCTCTTCTTACTGA-GAGAGG
mNanogAGGACAGGTTTCAGAAGCAGACCATTGCTAG-TCTTCAACCACTG
mSox2GCGGAGTGGAAACTTTTGTCCGGGAAGCGTGTACTTATCCTTCT
mOct4AGAGGATCACCTTGGGGTACACGAA-GCGACAGATGGTGGTC
mPdgfrαTATCCTCCCAAACGAGAATGAGAGTGGTTGTAGTAG-CAAGTGTACC
mSca-1CTGACTGGAAAGCCGAAACTCCGACCCGTCCTTT-GAATTTCT
mBhlhe40CTGTCAGGGATGGATTTTGCCGCTGTCTTCGCTCCGTTTTATTC
mBglapCTGACCTCACAGATCCCAAGCTGGTCTGATAGCTCGTCACAAG
mCol1a1TAAGGGTCCCCAATGGTGAGAGGGTCCCTCGACTCC-TACAT
mAcanCCTGCTACTTCATCGACCCCAGATGCTGTTGACTCGAACCT
mSox9CGGAACAGACTCACATCTCTCCGCTTGCACGTCGGTTTTGG
mCompACTGCCTGCGTTCTAGTGCCGCCGCATTAGTCTCCTGAA
mZbp-1AAGAGTCCCCTGCGATTATTTGTCTGGATGGCGTTT-GAATTGG
mWnt3aCTCCTCTCGGATACCTCTTAGTGGCATGATCTCCACGTAG-TTCCTG
mCtnnb1ATGGAGCCGGACAGAAAAGCCTTGCCACTCAGGGAAGGA
mCcnd1GCGTACCCTGACACCAATCTCCTCCTCTTCGCACTTCTGCTC
mSpp1AGCAAGAAACTCTTCCAAGCAAGTGAGATTCGTCAGAT-TCATCCG

2.9. Enzyme Linked Immunosorbent Assay (ELISA)

After the PαS cells were rinsed twice with PBS, a cell scraper was used to carefully detach the cells. Next, the culture medium was centrifuged (3000 rpm, 10 min) and the supernatant was discarded. ELISAs were performed with reference to the kit manufacturer’s instructions. The optical density of each well was measured against a blank control well at 450 nm using a microplate reader. Protein concentrations of the samples were calculated using a standard curve [33].

2.10. Chromatin Immunoprecipitation (ChIP) Assay

ChIP assays were performed as described previously [34]. Soluble chromatin was diluted and immunoprecipitated with a BHLHE40 antibody. After crosslinks were removed, the immune complexes containing the DNA were purified and eluted. The precipitated DNA was analyzed by qRT-PCR. The ChIP primer sequences for Zbp1 were 5′–ATTGTGAGCTGAGTGGTGGA–3′ (forward) and 5′–TTCTCAGTGACCCGTGAACA–3′ (reverse).

2.11. Ectopic Osteogenesis and Chondrogenesis In Vivo

Ectopic osteogenic transplantation of PαS cells and lentivirus-infected PαS cells (Bhlhe40 or Vector) was investigated in nude mice. After trypsinization and resuspension, cells were mixed with β-tricalcium phosphate granules. The complex was subcutaneously implanted into the dorsal space of BALB/C mice (6-week-old, n = 5 per group). Considering animal ethics and the reliability of experimental results, 5 mice were selected in each group [34,35,36]. After 8 weeks, samples were collected, fixed with paraformaldehyde (4%) for 24 h, and decalcified in ethylenediamine-tetra-acetic acid (10%, pH 7.4) for 14 days. The samples were then subjected to follow-up treatment and stained with hematoxylin and eosin (H&E), Masson’s trichome, and immunohistochemistry (IHC)–osteocalcin (OCN). In addition, in the results of H&E, Masson’s trichome, and IHC-OCN staining, the area proportion of newly formed lamellar bone was compared and analyzed. If there was no lamellar bone formation, the homogeneous stained areas that represented the new bone were compared.
Ectopic chondrogenic transplantation of PαS cells and lentivirus-infected PαS cells (Bhlhe40 or Vector) was also investigated in nude mice. After 7 days of chondrogenic induction, PαS cells were collected and mixed with collagen membrane, and the complex was also subcutaneously implanted into the dorsal space of BALB/C mice (6-week-old, n = 5 per group). After 4 weeks, samples were collected and fixed with paraformaldehyde (4%) for 24 h. The samples were then subjected to follow-up treatment and stained with Alcian blue and Sirius red. Moreover, in the results of Alcian blue and Sirius red stained, the homogeneous stained areas that represented the new chondrogenic were compared.

2.12. Statistical Analyses

SPSS software (ver. 25.0; IBM Corp., Armonk, NY, USA) was used for statistical analyses in this study. The Q–Q plots and Shapiro–Wilk tests were used to evaluate the distribution of measured data, which indicated the normality of the data in this study. For normally distributed data, the Student’s t-test was used to analyze the differences between two groups, and one-way analysis of variance (ANOVA) was used for comparisons between more than two groups, followed by Tukey’s post hoc test. For data with obvious asymmetry, the non-parametric Kruskal–Wallis test was used in this study. All values in the present study are shown as means ± standard deviation for three independent experiments per group [37,38,39,40,41]. p < 0.05 was considered statistically significant (* p < 0.05; ** p < 0.01; *** p < 0.001).

3. Results

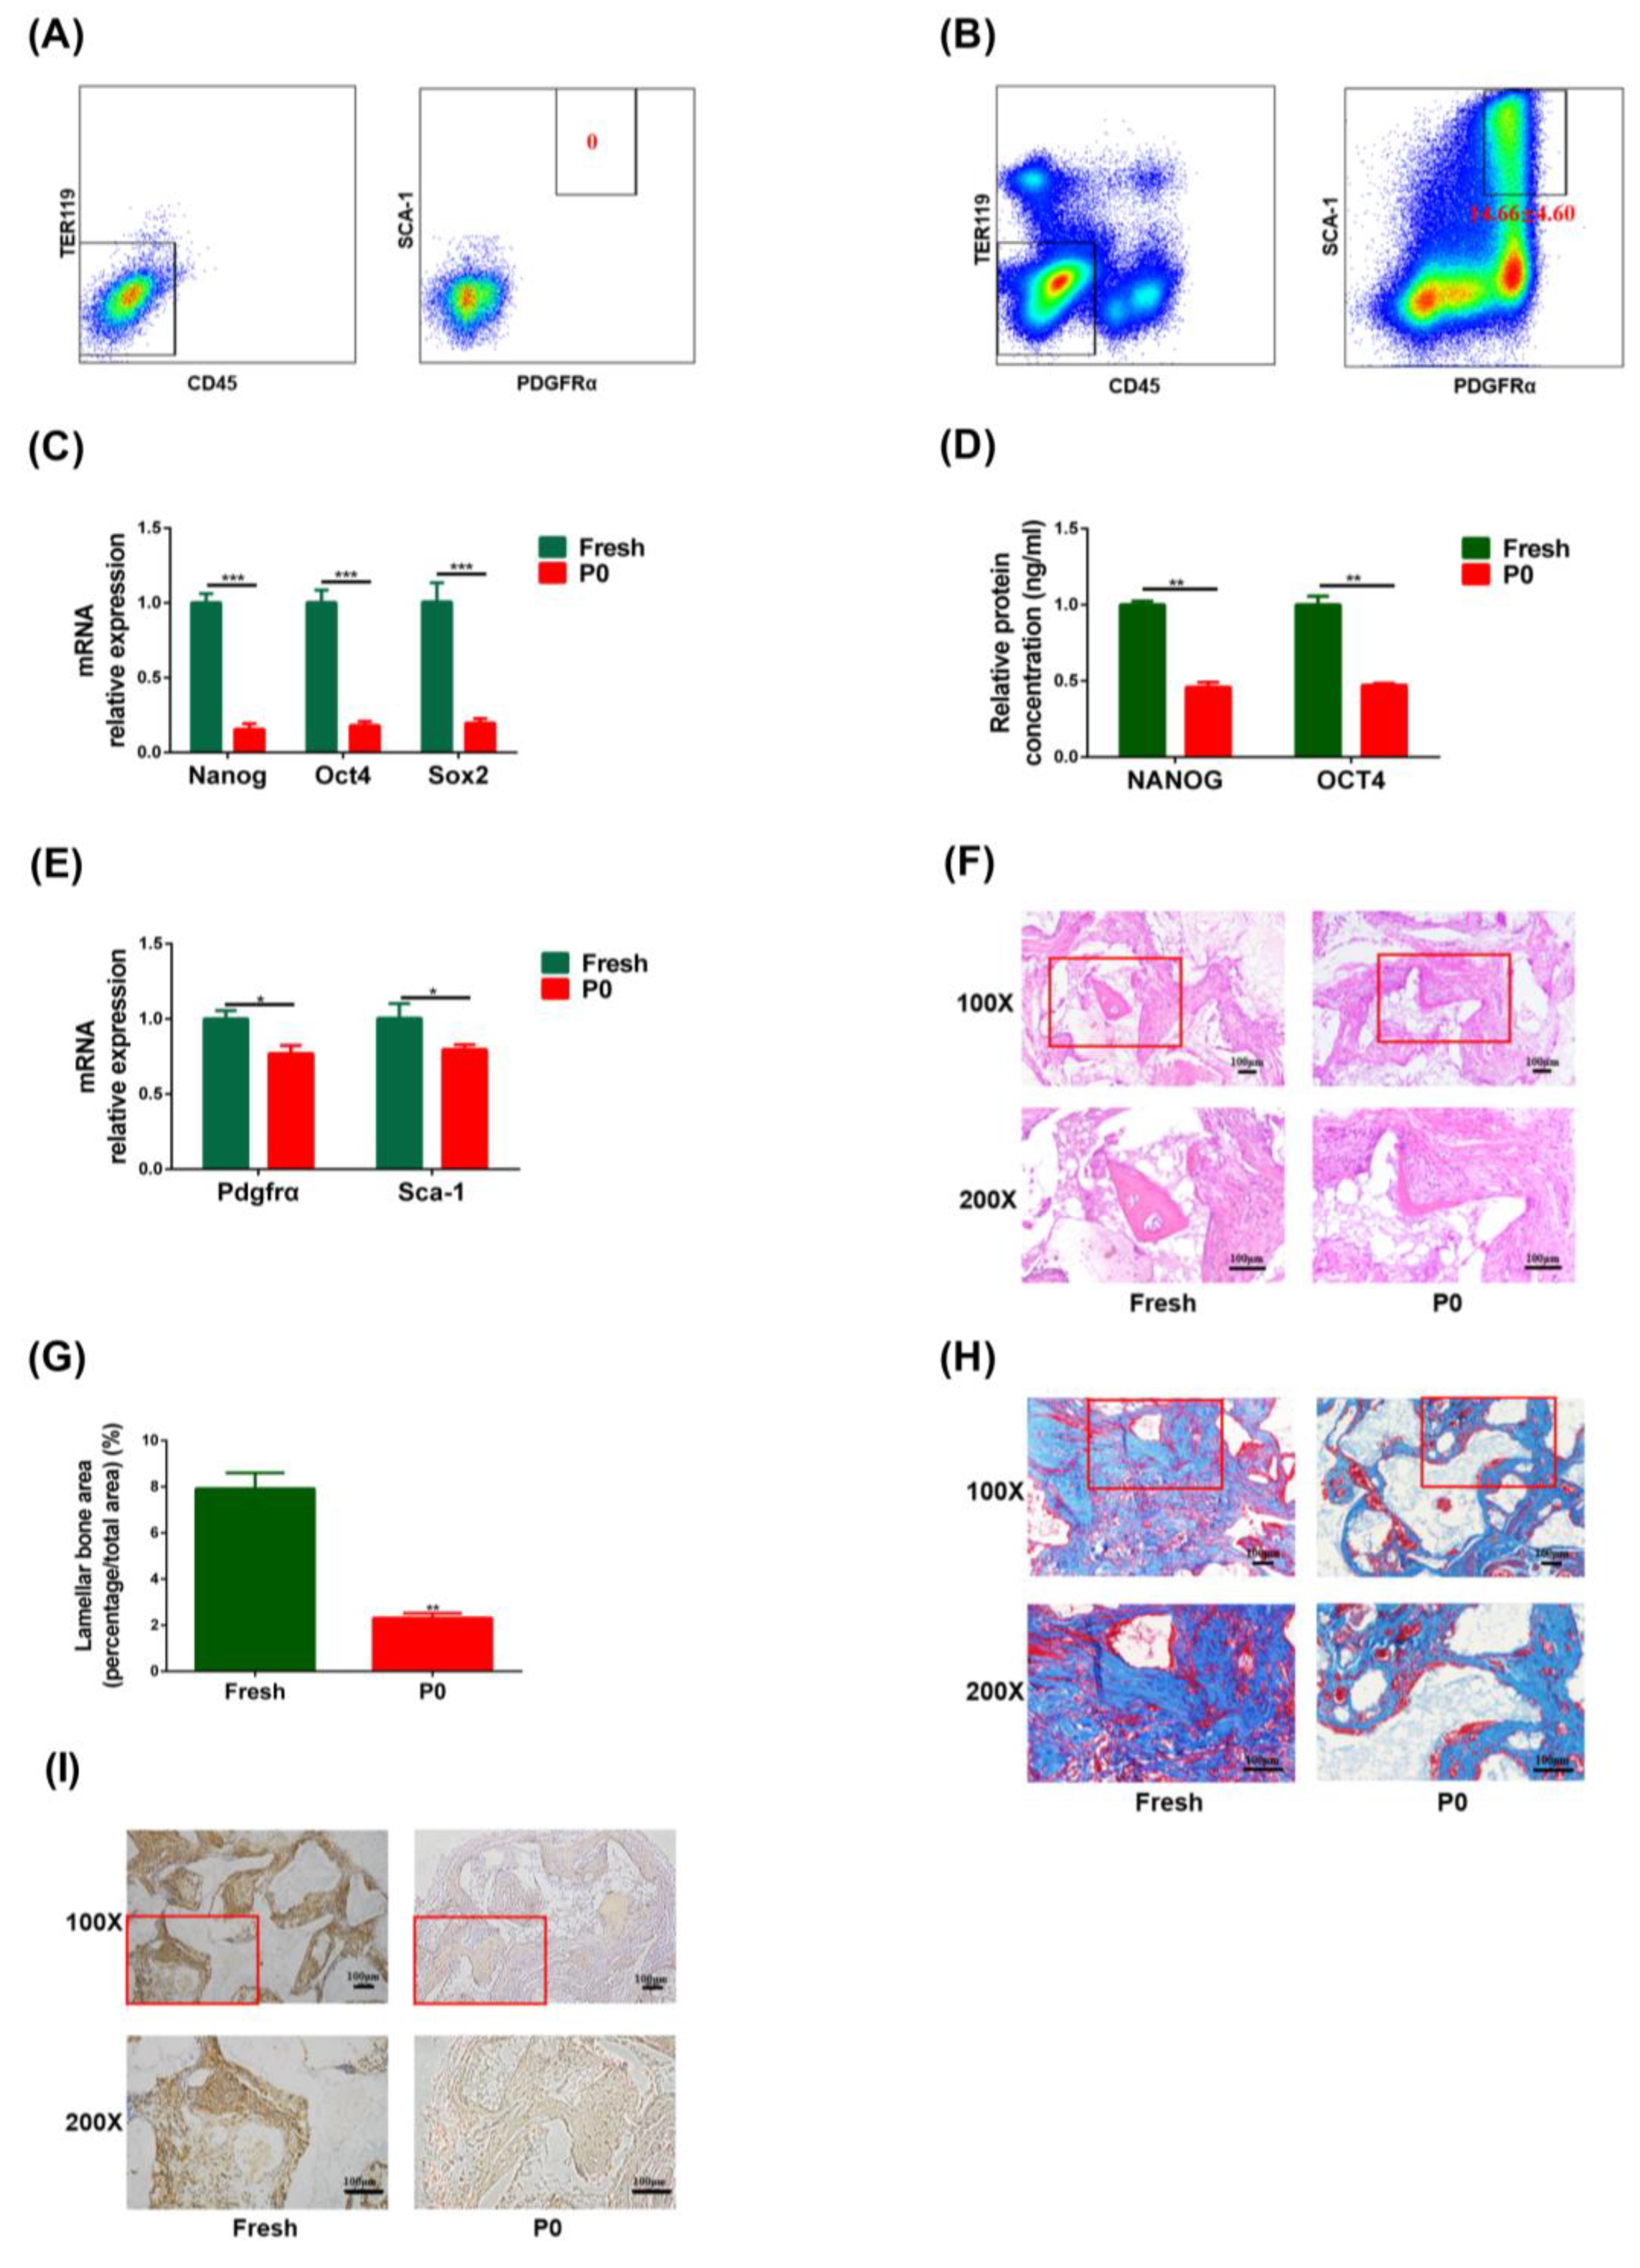
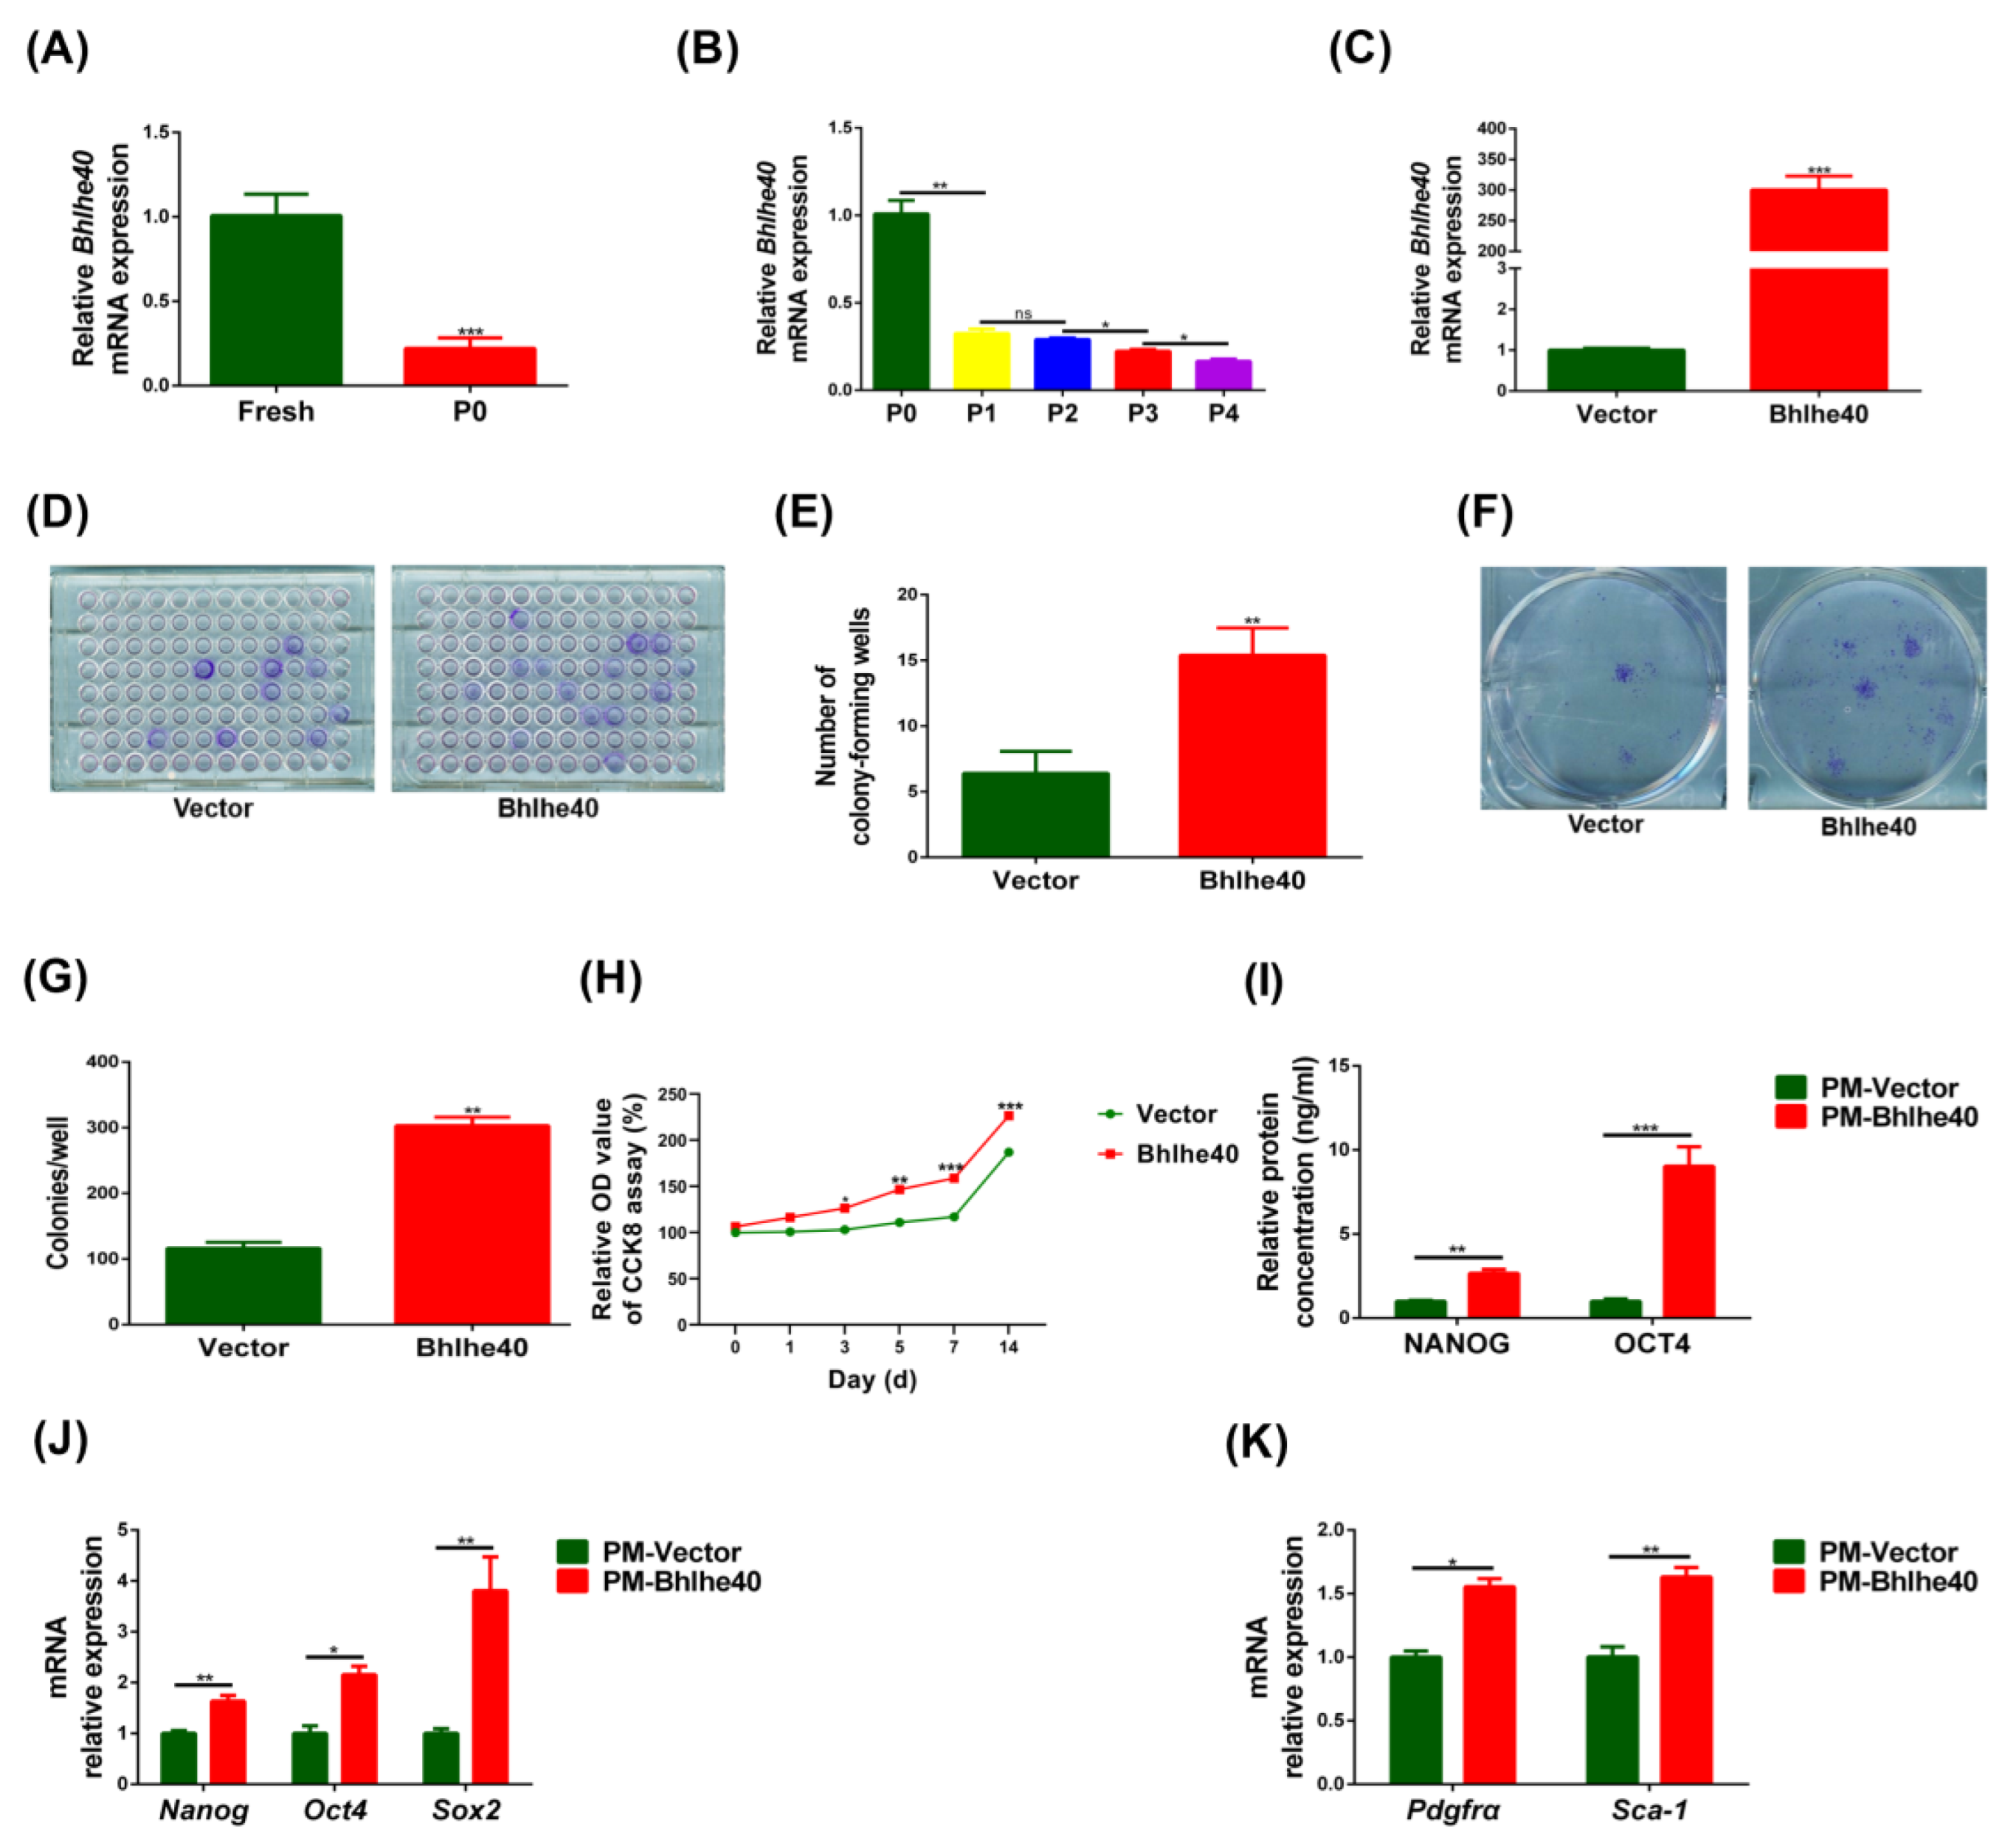
3.1. The Stemness of Fresh PαS Cells Was Superior to That of In Vitro P0 Cells

The flow sorting results for the C57/6N fresh PαS cells are shown in Figure 2A,B. Approximately 2 to 3 million PαS cells were obtained from the limbs of 20 C57/6N mice 1 to 3 days after birth, and the proportion of PαS cells obtained was 14.66% ± 4.60%.
qRT-PCR results displayed the expression level of the stemness genes (Oct4, Sox2, and Nanog) and the surface marker genes (Pdgfrα and Sca-1) were significantly lower in P0 PαS cells than in fresh PαS cells (Figure 2C,E). The ELISA results demonstrated that protein expression of the OCT4 and NANOG was also significantly lower in P0 PαS cells than in fresh PαS cells (Figure 2D).
H&E staining showed that there was new eosinophilic homogeneous red-stained lamellar bone in both the Fresh and P0 groups; the structure of this bone resembled lacunae, but there was significantly more new lamellar bone in the Fresh group than in the P0 group (Figure 2F). This finding was confirmed by quantitative analysis of the new lamellar bone tissue (Figure 2G). Furthermore, Masson’s trichome and IHC staining showed that there were significantly more blue-stained collagen fibers or more OCN staining (brown) in the cytoplasm and interstitia in the Fresh group than in the P0 group (Figure 2H,I). These data demonstrated that freshly isolated PαS cells possessed great differentiation potential compared with P0 cells.

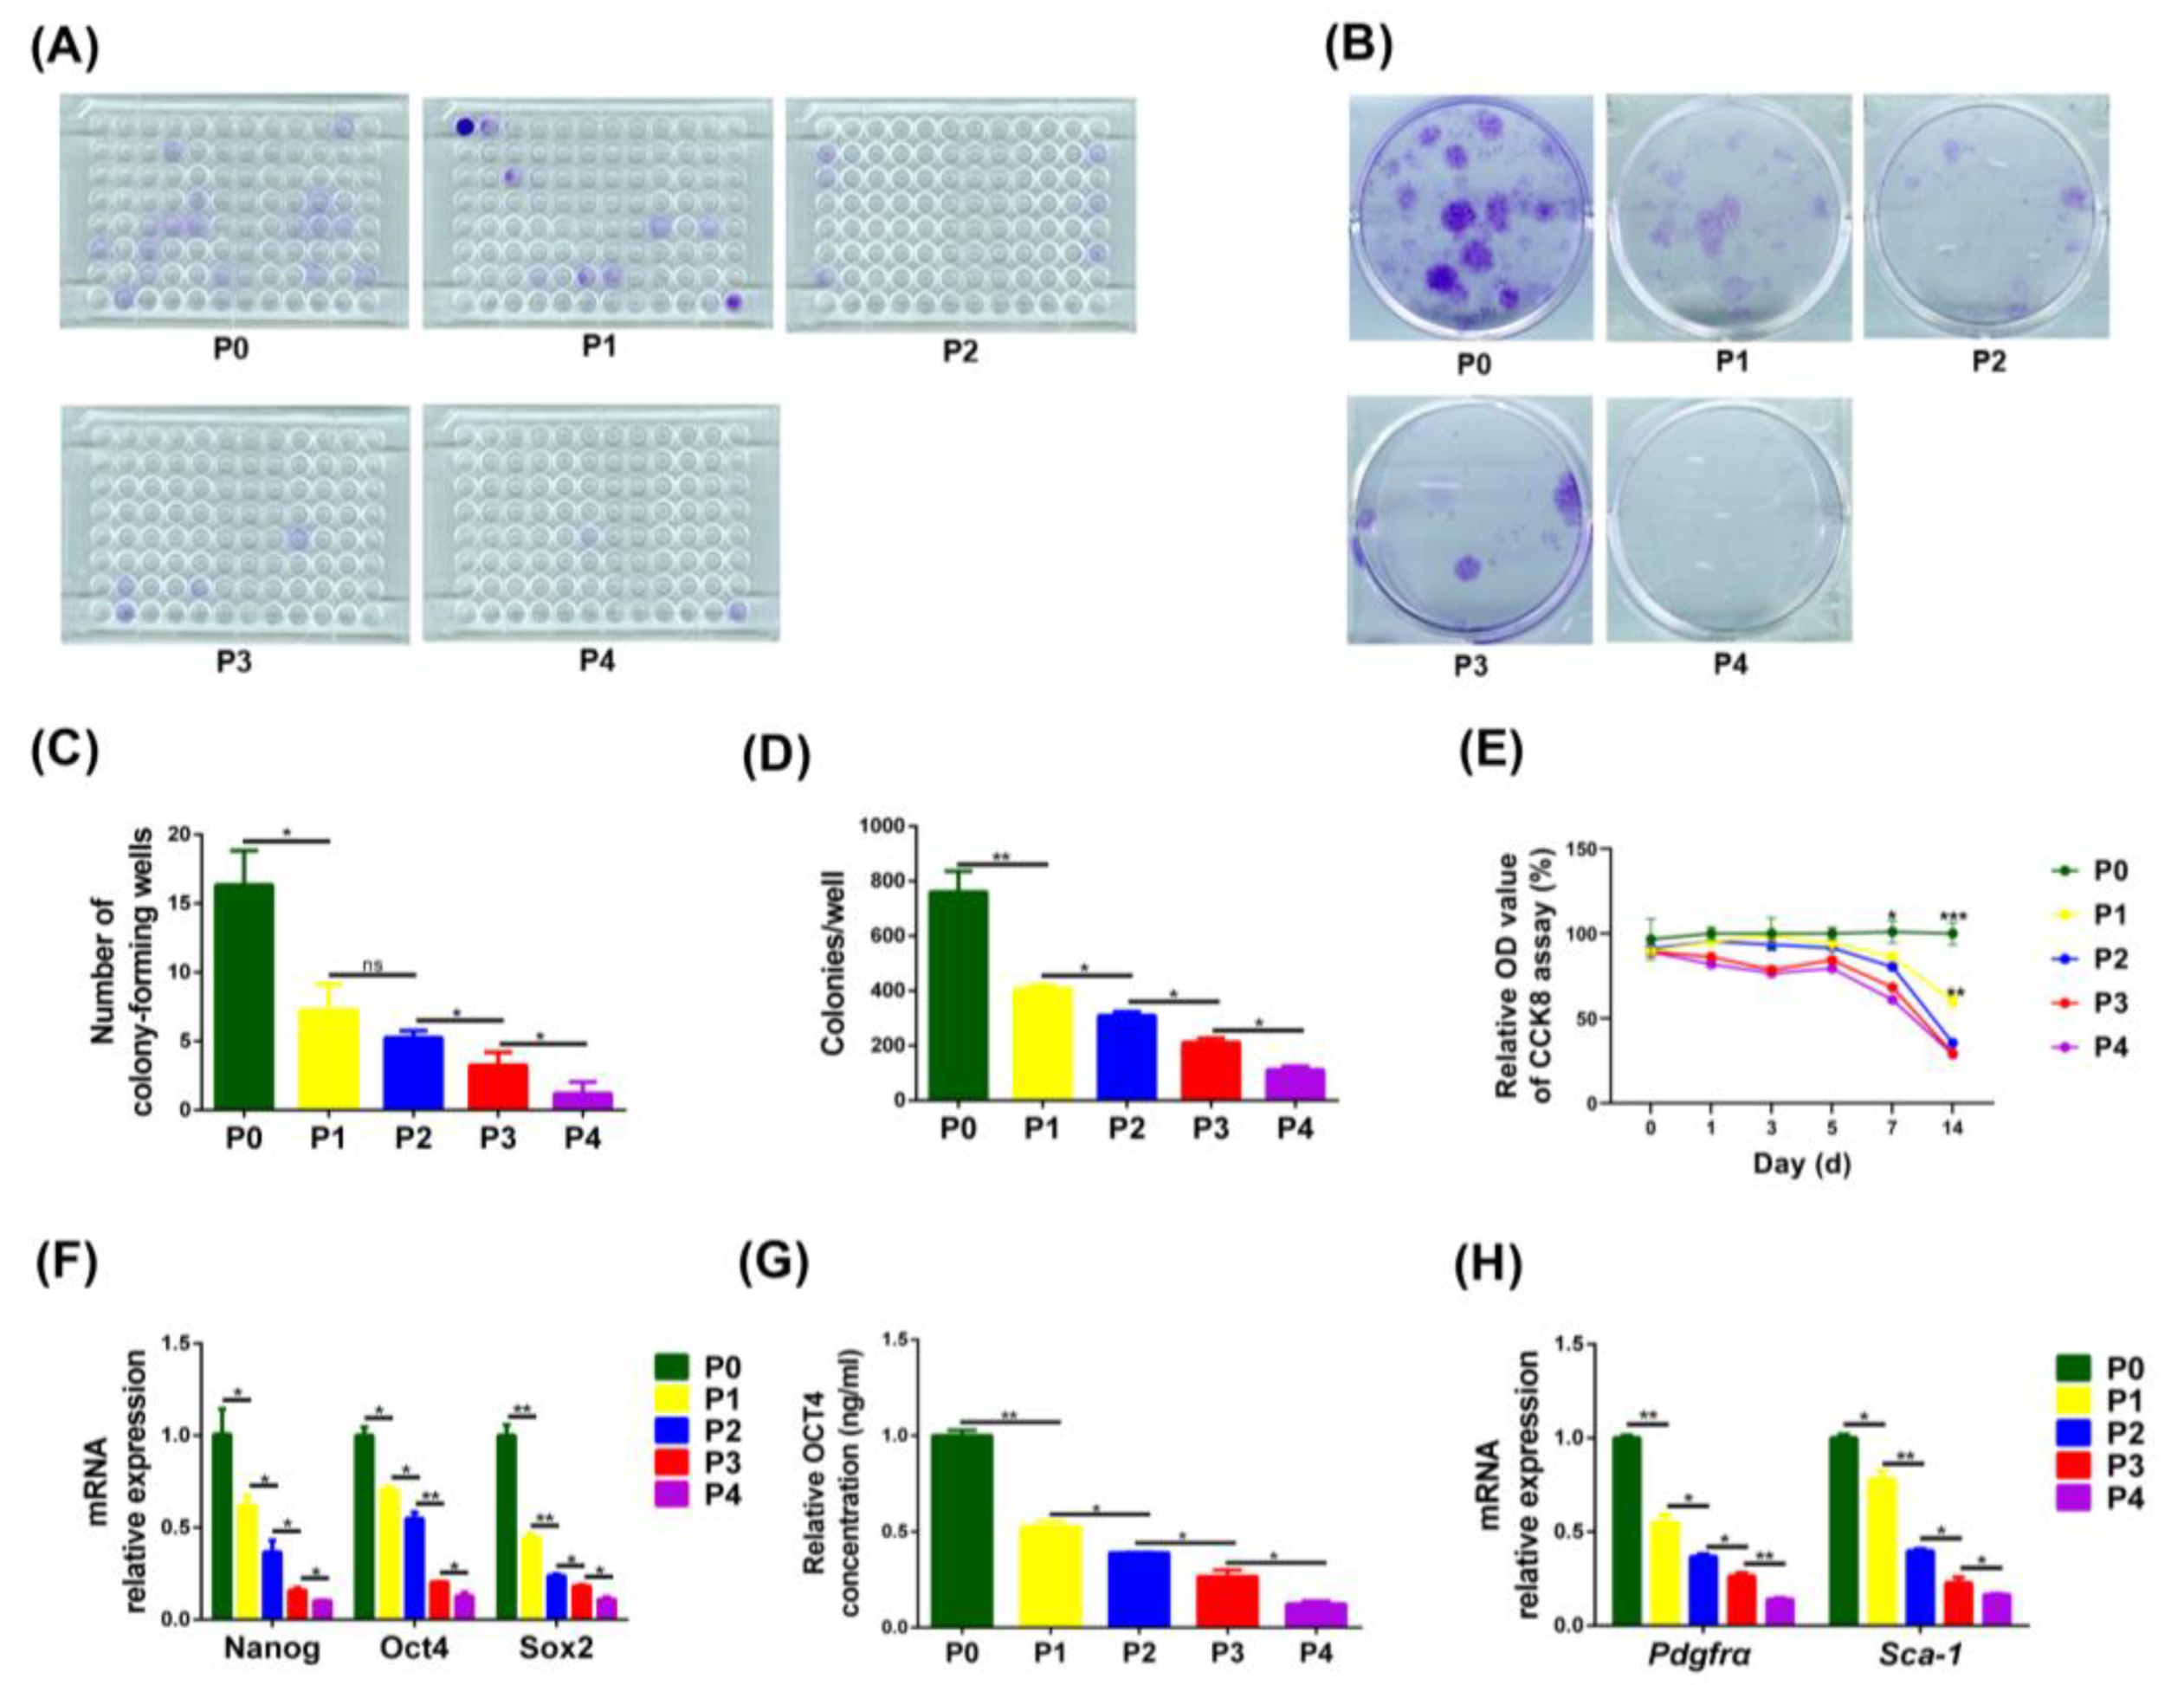
3.2. The Proliferative Capacity, Expression of Stemness Genes and Cell Surface Markers in PαS Cells Decreased Gradually from P0 to P4

The single-cell and multicellular clone formation capacity of PαS cells also decreased gradually from P0 to P4 (Figure 3A,D). In addition, the CCK8 proliferation assay displayed a significant difference in proliferative capacity between PαS cells at P0 and PαS cells at P1 to P4 at 14 days, and between cells at P1 and P2 to P4 at 14 days, but there was no significant difference among PαS cells at P2 to P4 at 14 days (Figure 3E).
The qRT-PCR results showed the expression of the stemness genes and surface marker genes in PαS cells decreased gradually from P0 to P4 (Figure 3F,H). Furthermore, the ELISA results indicated the expression of the OCT4 in PαS cells decreased gradually from P0 to P4 (Figure 3G). All the data indicated that the proliferative capacity, expression of stemness genes and cell surface markers in PαS cells decreased gradually from P0 to P4.

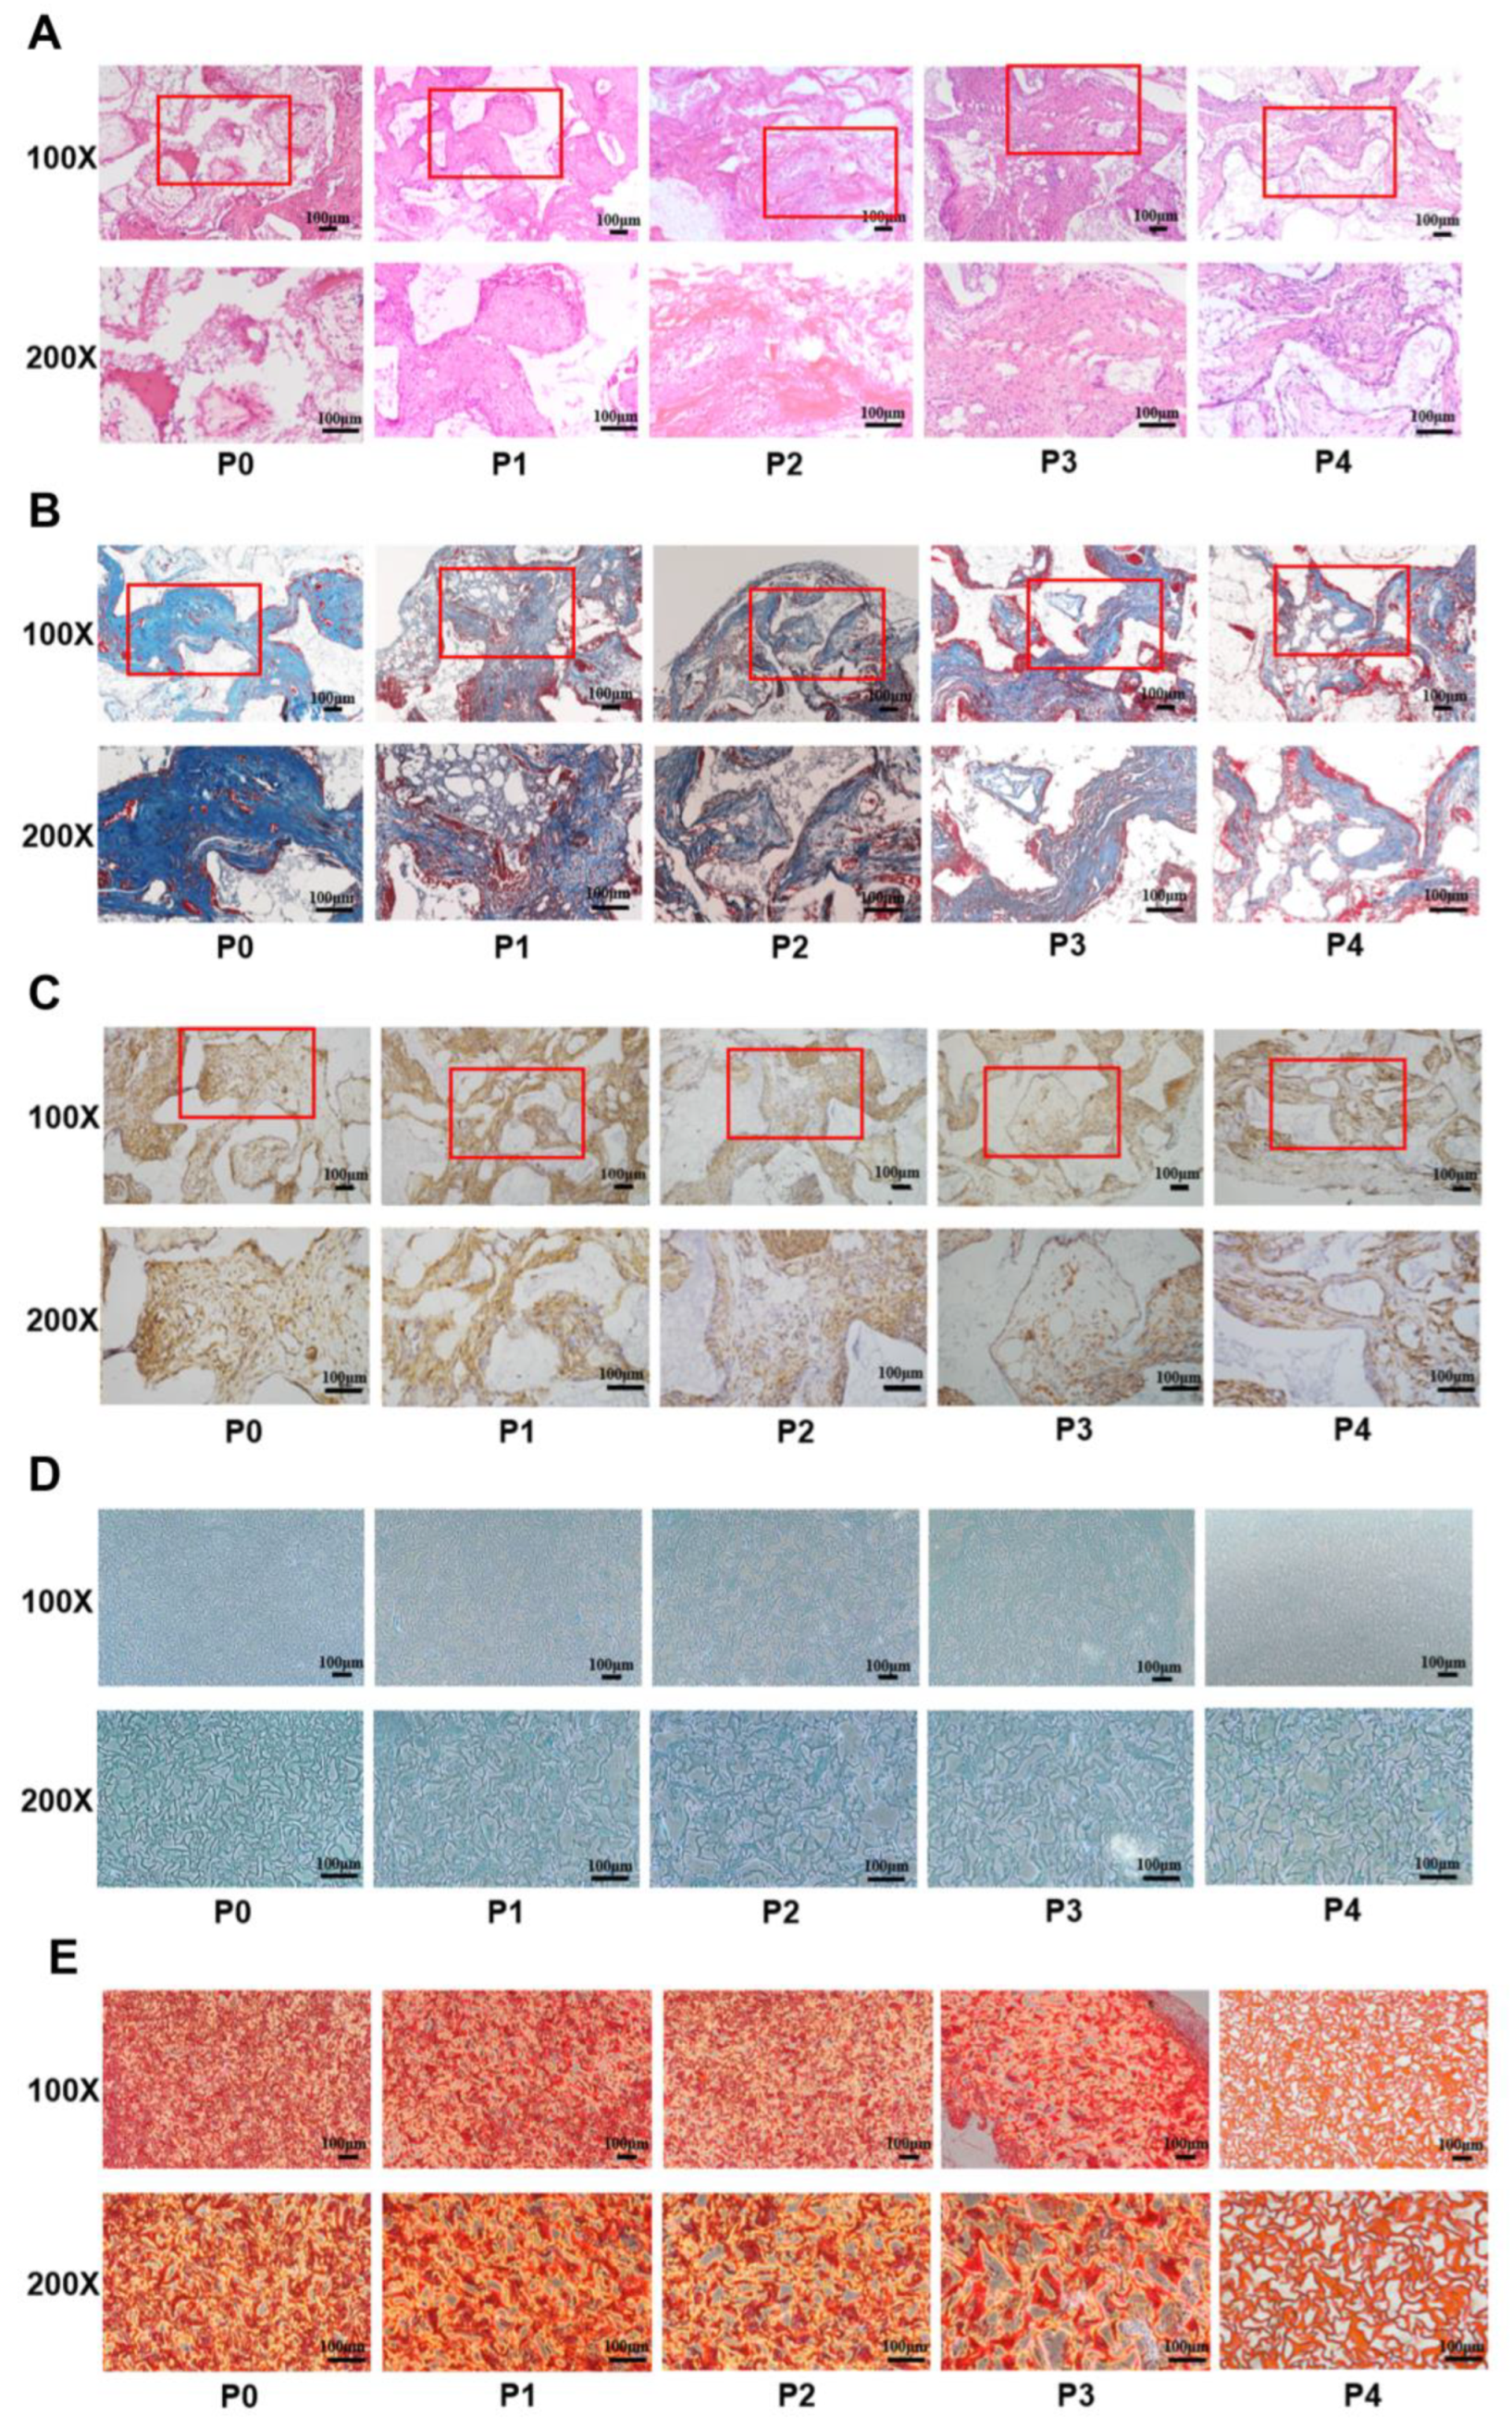
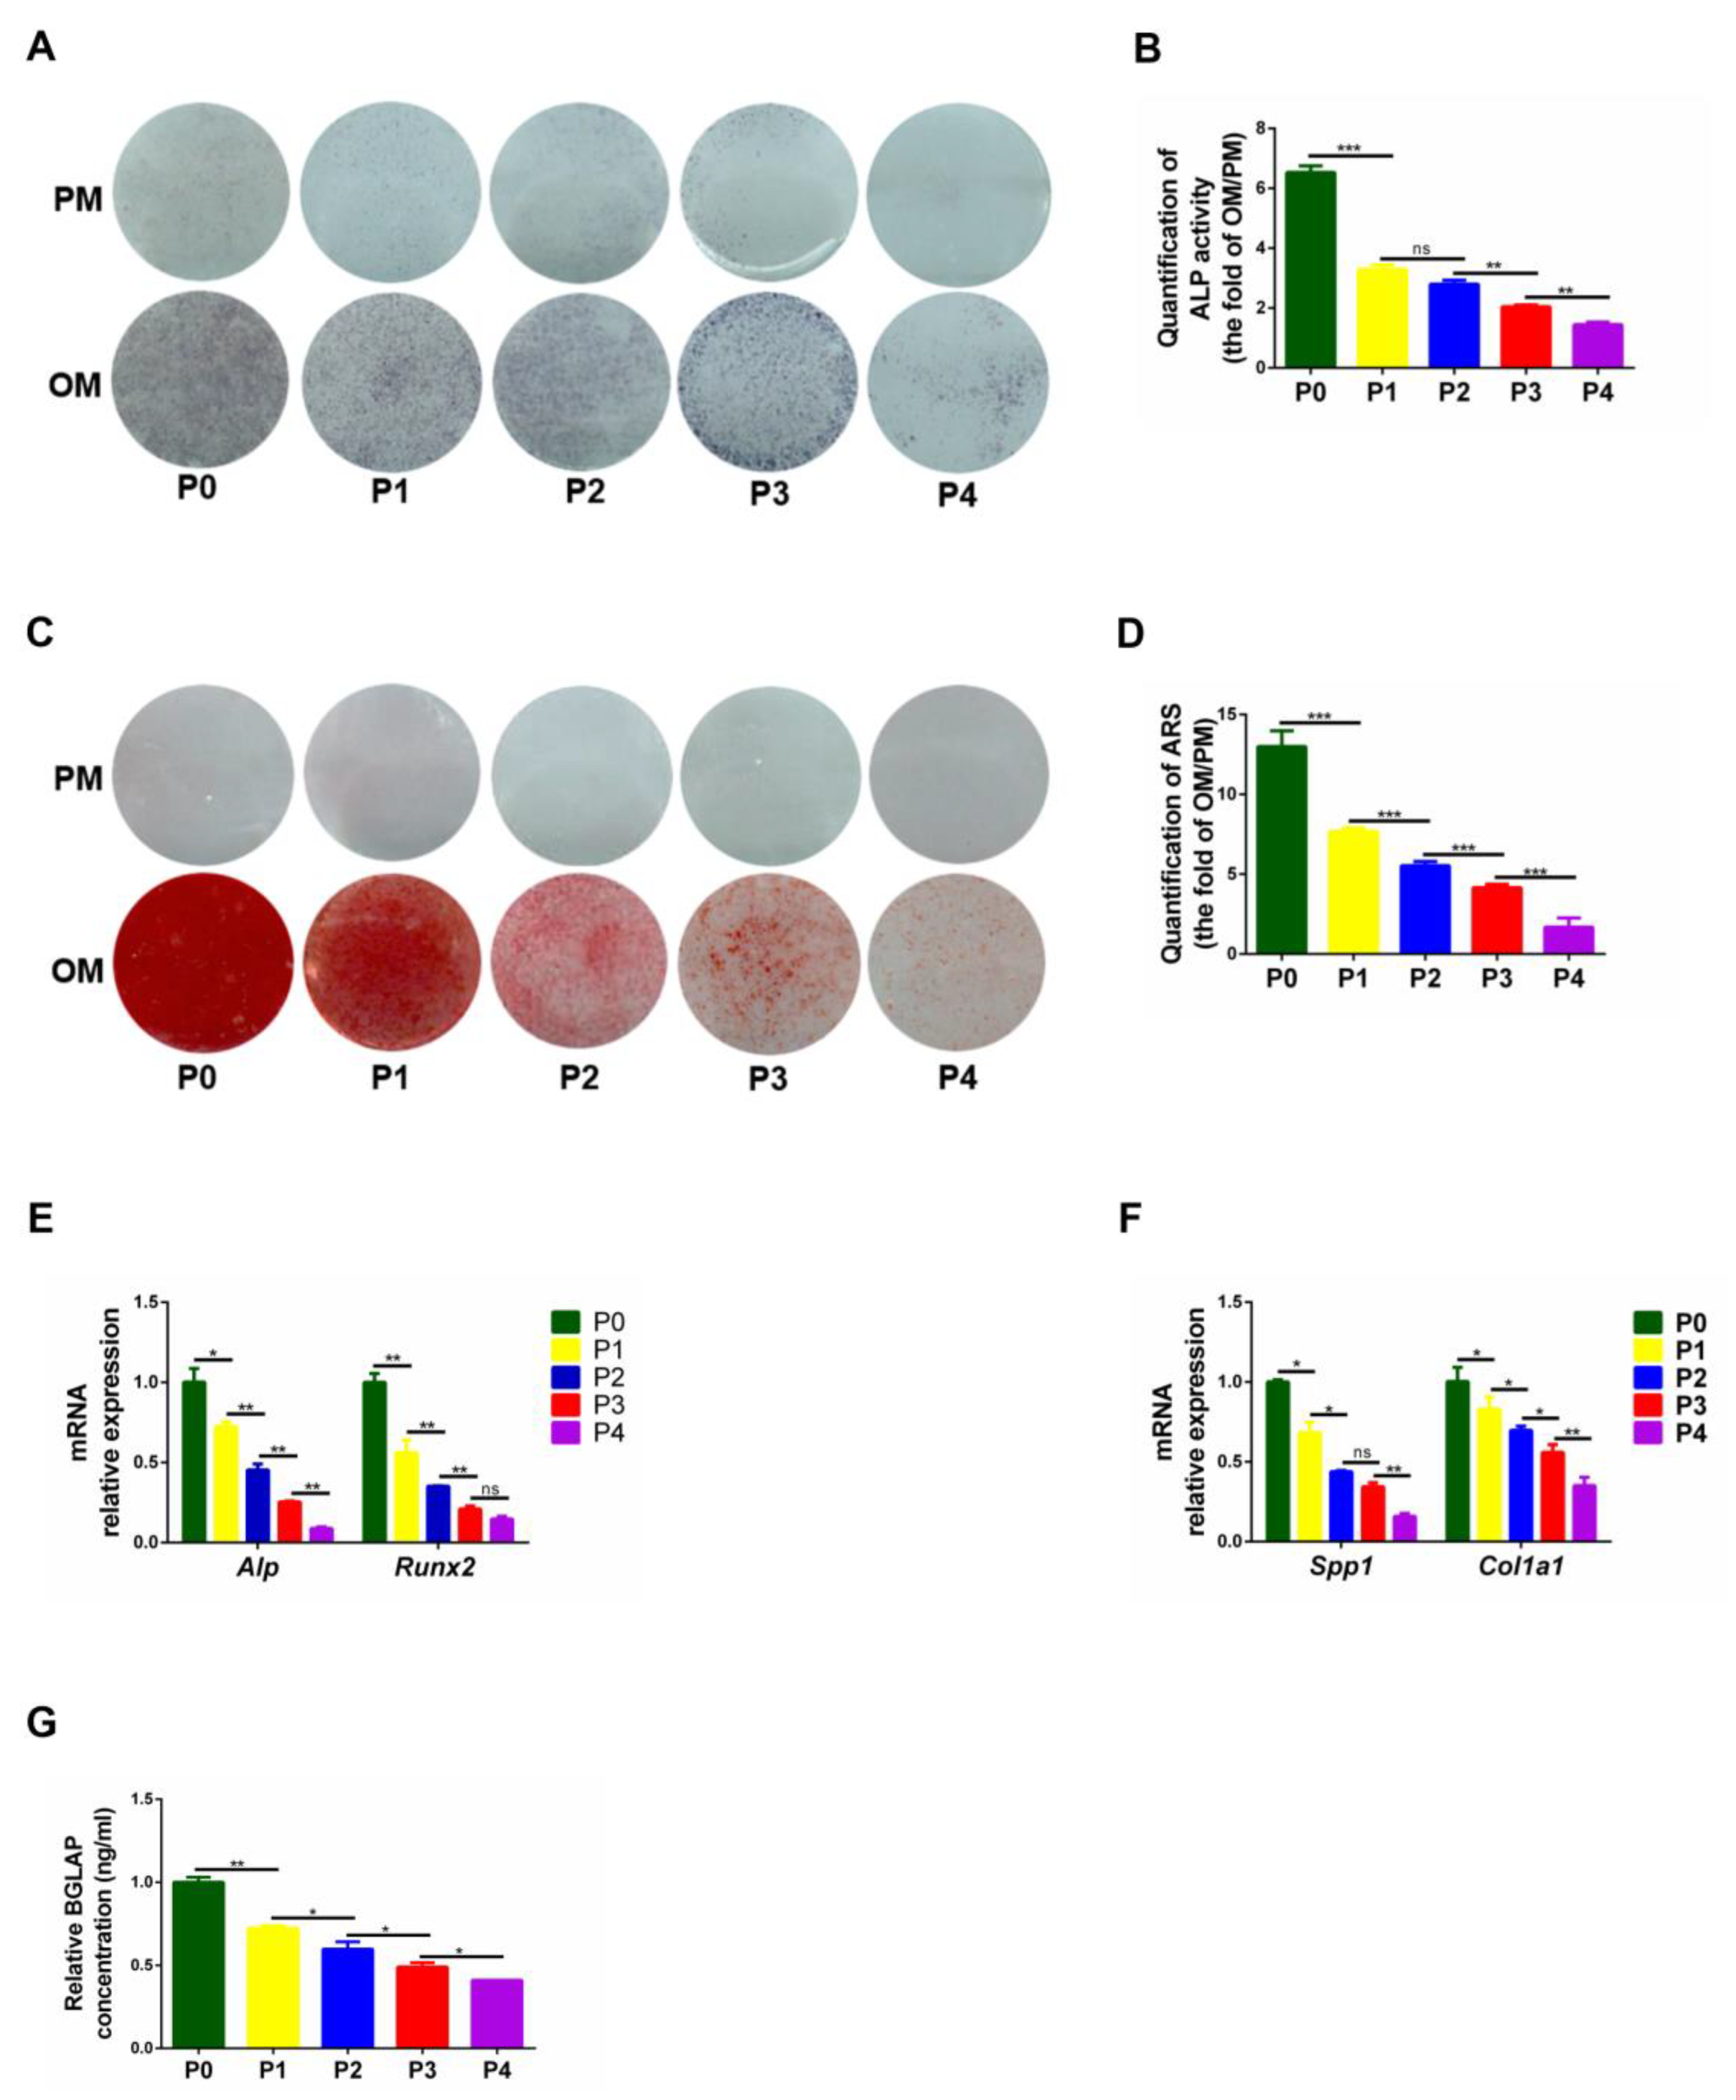
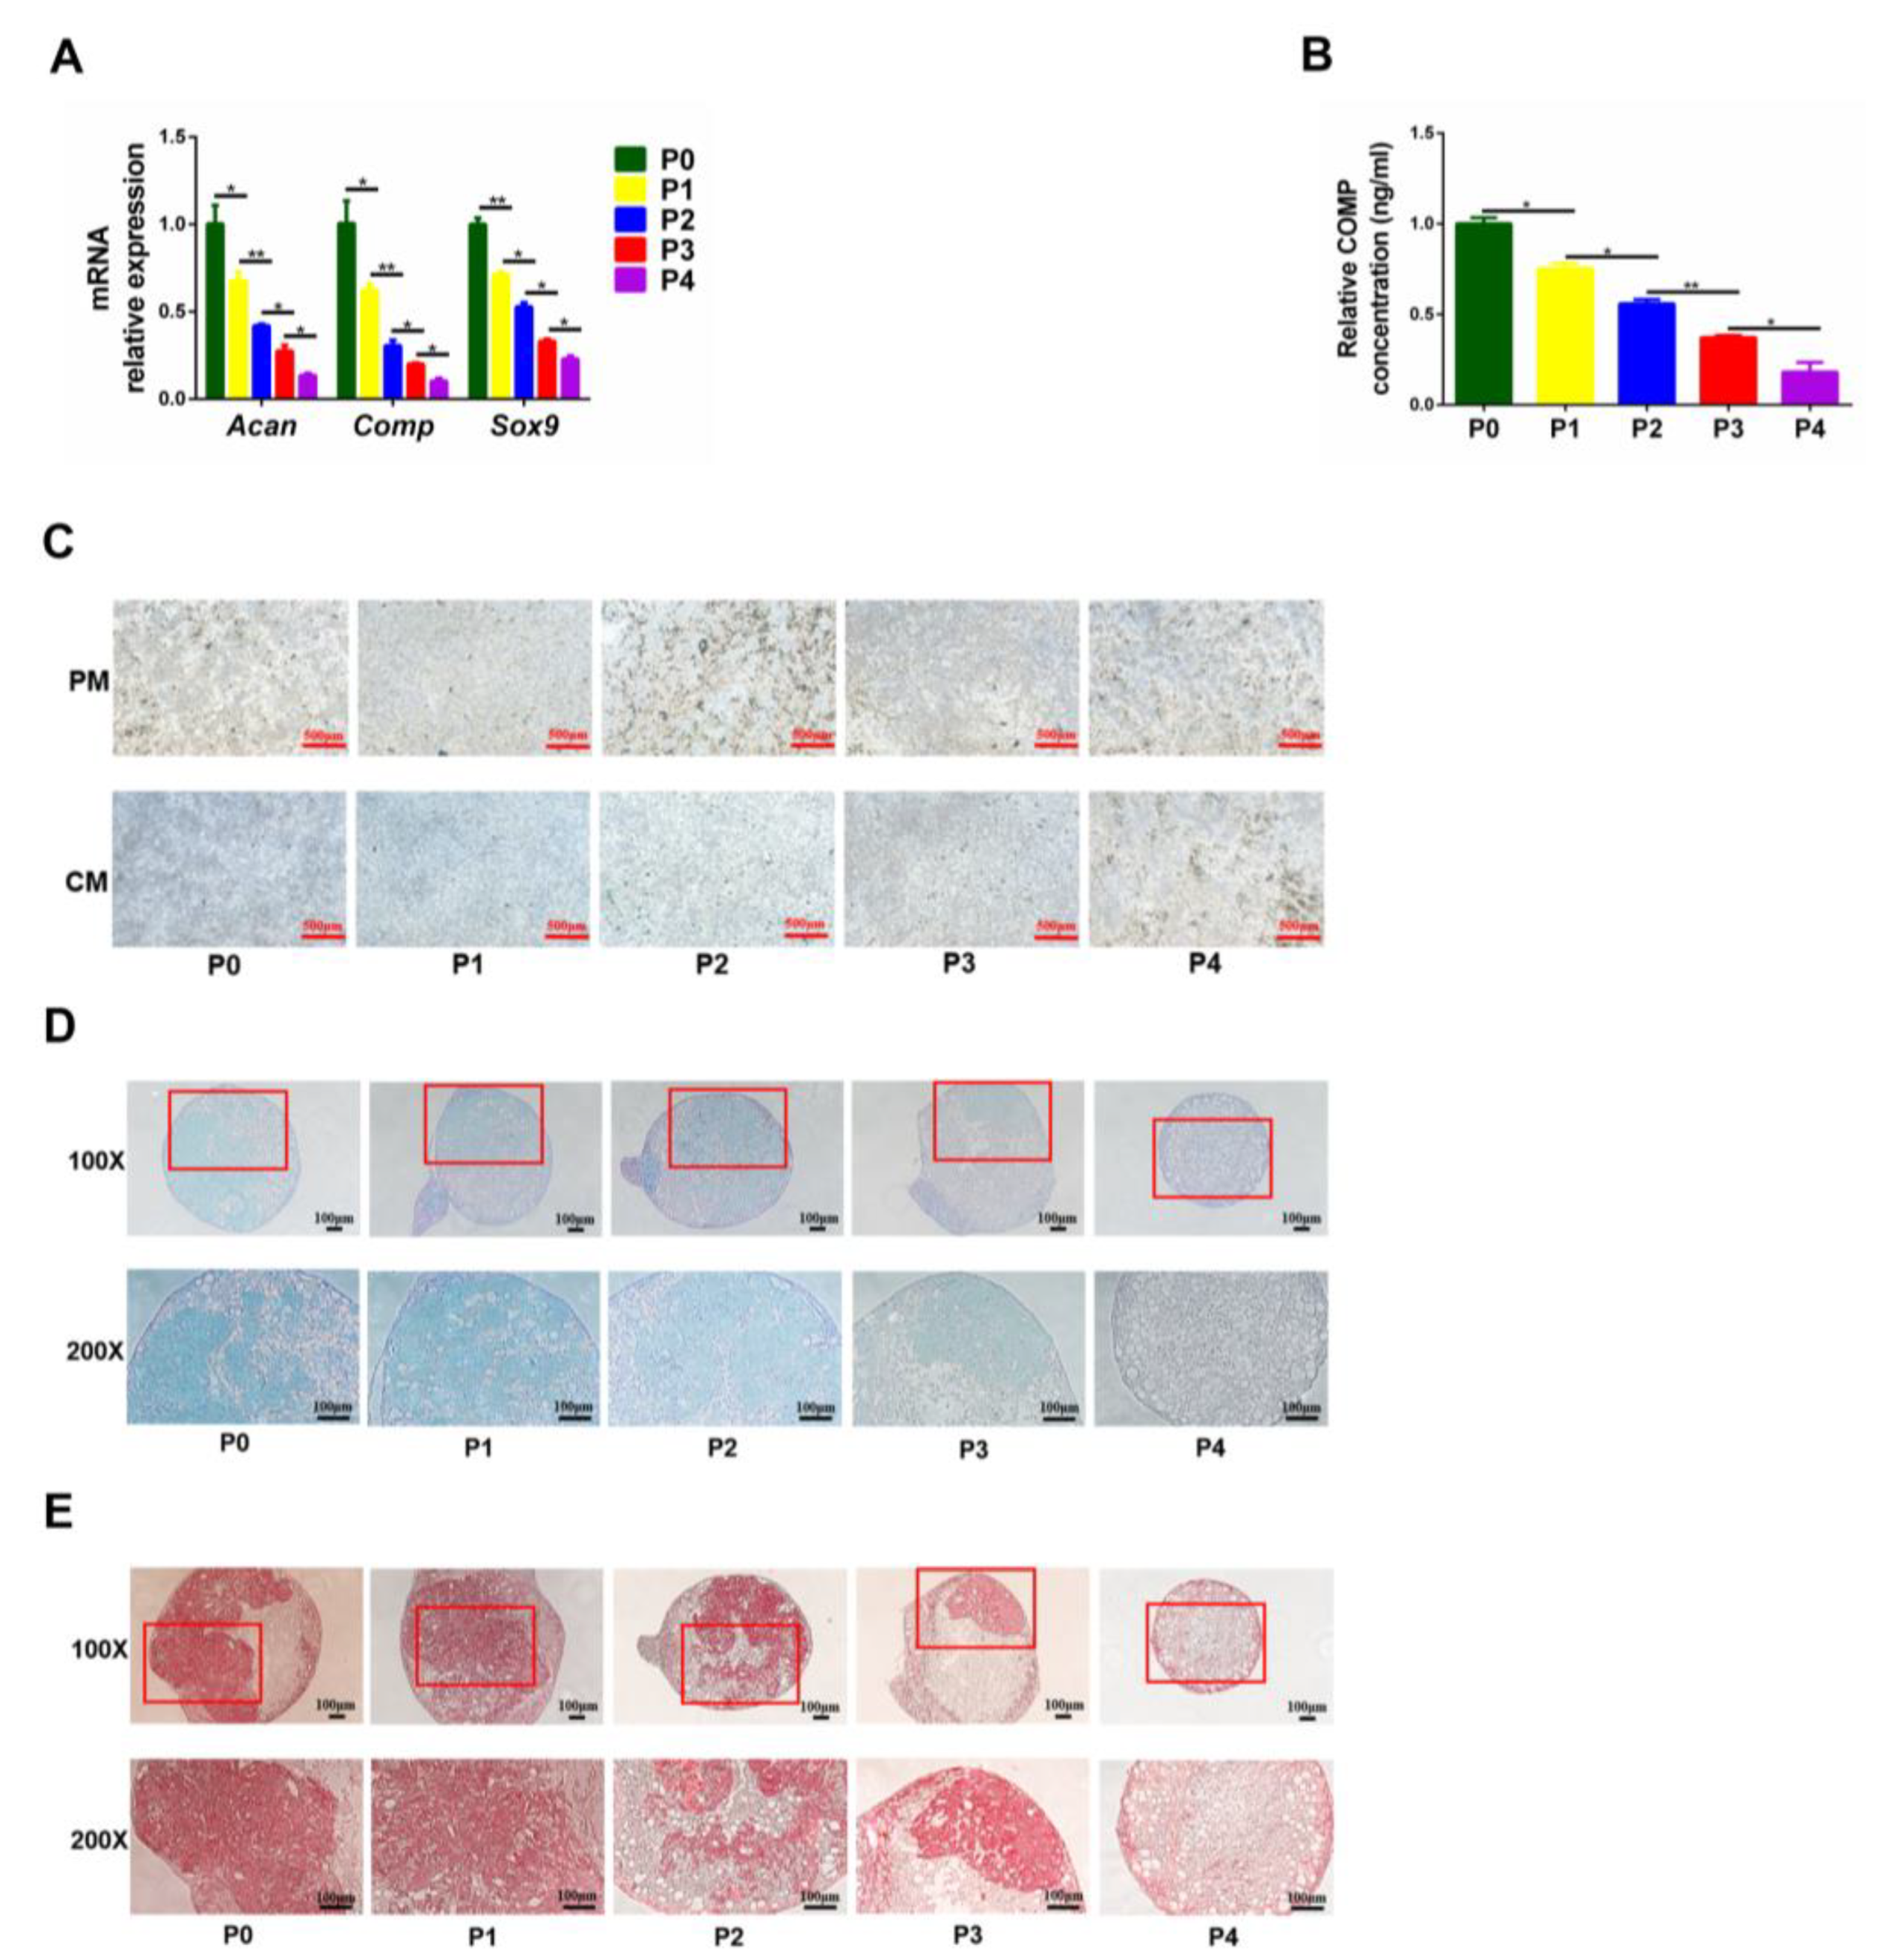
3.3. The Osteogenic and Chondrogenic Differentiation Capacity of PαS Cells Decreased Gradually from P0 to P4

After 7 or 14 days of osteogenic induction, ALP staining and activity in PαS cells decreased gradually from P0 to P4 (Figure A1A,B). ARS staining and quantitative PαS cells showed a consistent trend (Figure A1C,D). In addition, the mRNA expression of the Alp, Runx2, Spp1, Col1a1 as well as the protein expression of BGLAP in PαS cells all decreased gradually from P0 to P4 (Figure A1E,G).
After 21 days of chondrogenic induction, the mRNA expression of the Acan, Sox9, and Comp and the protein expression of COMP in PαS cells all showed a decreased trend (Figure A2A,B). In addition, the Alcian blue staining in well plates and the Alcian blue and Sirius red staining of chondrosphere sections all showed gradually less staining of PαS cells from P0 to P4 (Figure A2C,E).
H&E staining showed that there was new eosinophilic homogeneous red-stained lamellar bone in the P0 group, but there was no obvious new lamellar bone in groups P1 to P4. In addition, the proportion of eosinophilic red-stained tissue also showed a decreased trend from P0 to P4 (Figure 4A). Moreover, Masson’s trichome staining and the IHC-OCN staining results both showed that the degree of staining decreased gradually from P0 to P4 (Figure 4B,C). Furthermore, the ectopic chondrogenesis staining results in vivo displayed that the proportions of Alcian blue- and Sirius red-stained new cartilage tissue also decreased gradually from P0 to P4 (Figure 4D,E). These data demonstrated that the stemness of PαS cells decreased gradually from P0 to P4.

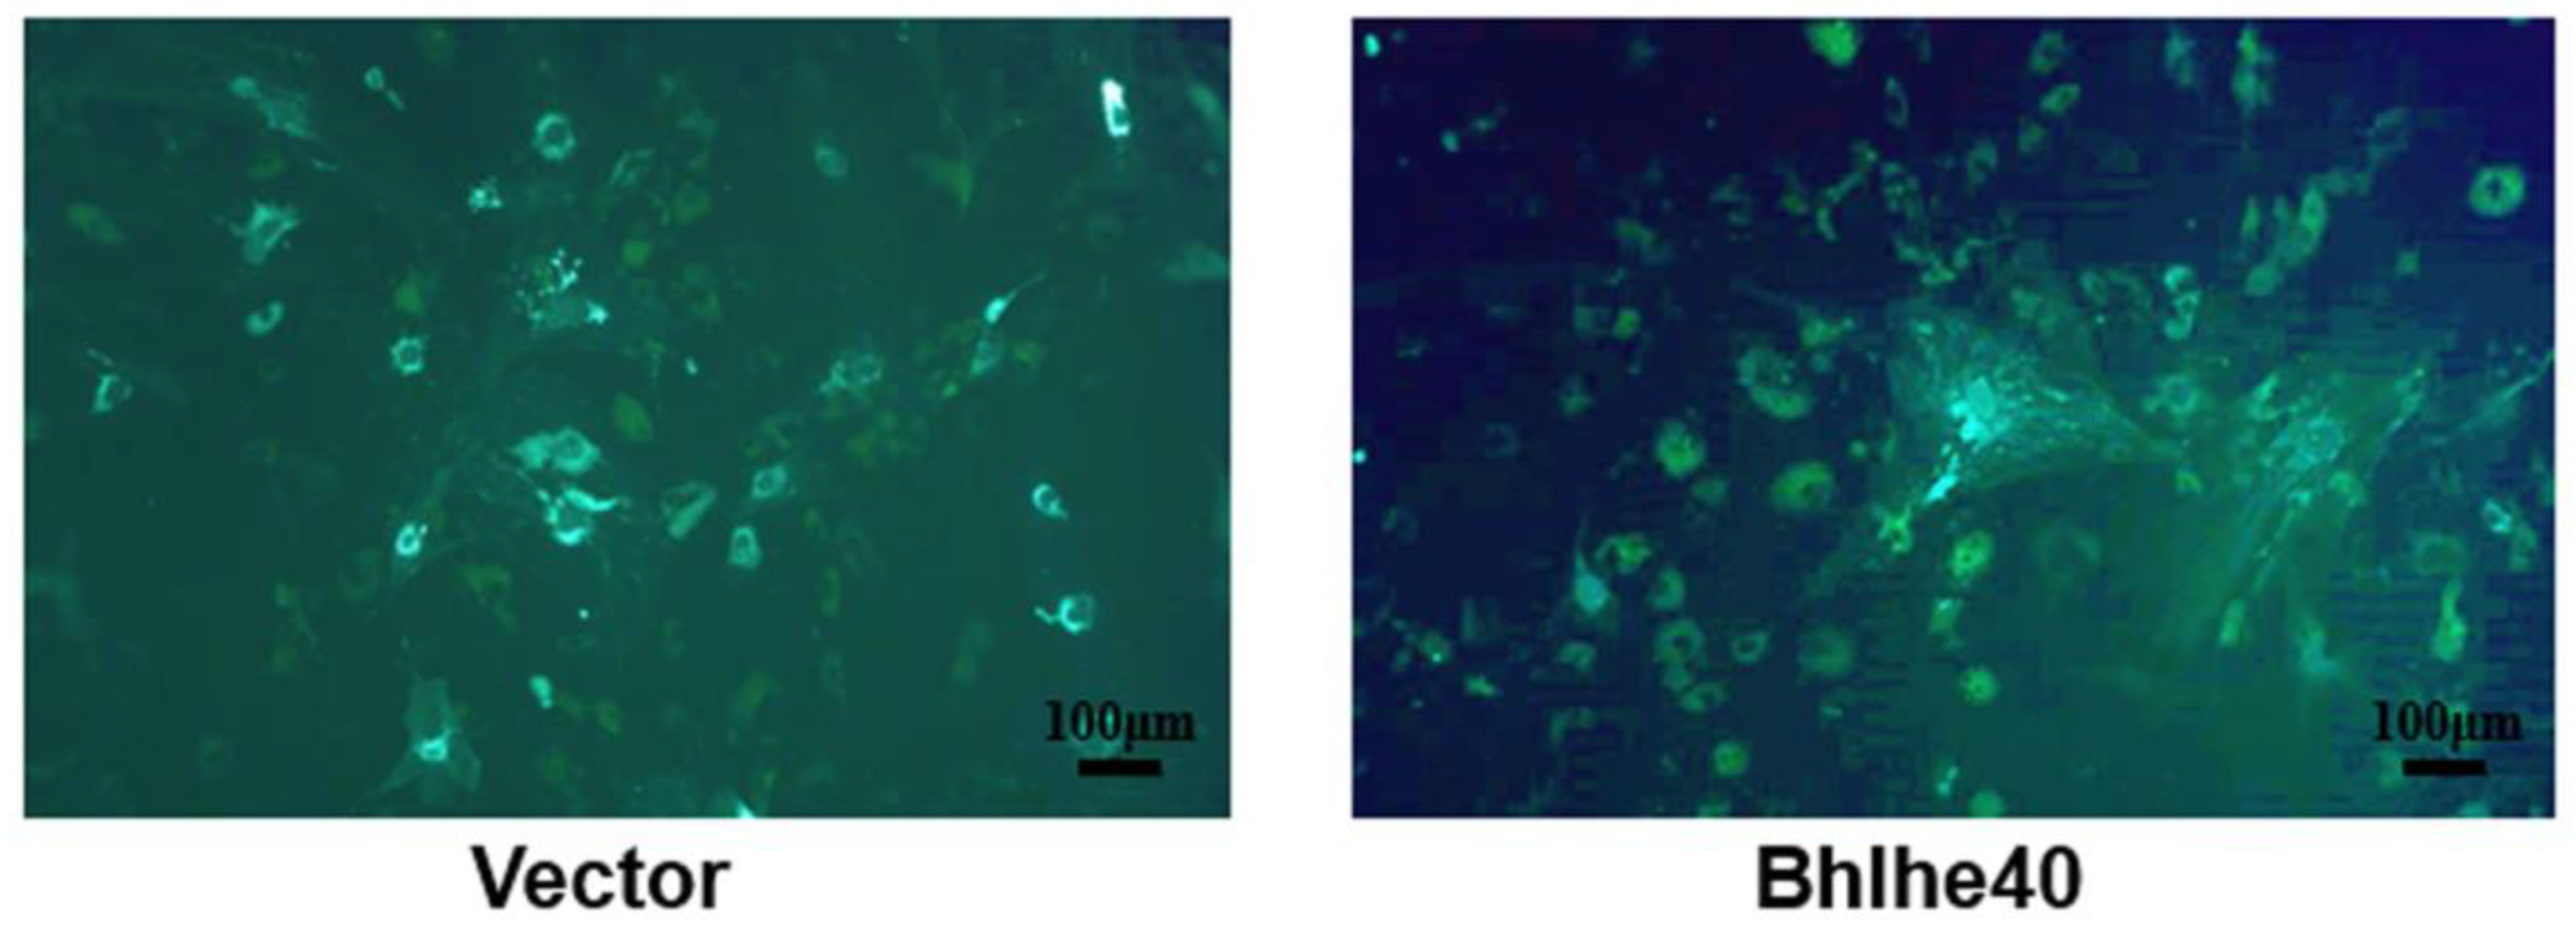
3.4. BHLHE40 Stimulated Proliferation, the Expression of Stemness Genes and Cell Surface Markers in PαS Cells

In order to explore better culture conditions for freshly isolated cells, we screened transcriptomic changes between primary PαS cells and cultured cells, and detected some changes of expression of transcription factors. qRT-PCR results further verified that Bhlhe40 expression was significantly lower in P0 PαS cells than in fresh PαS cells (Figure 5A). In addition, the mRNA expression of Bhlhe40 also decreased gradually from P0 to P4, and decreased most significantly from P0 to P1 (Figure 5B). We next infected Bhlhe40 into P1 and P2 PαS cells; fluorescent staining and qRT-PCR were used to verify the infection efficiency (Figure 5C and Figure A3).
The overexpressed-Bhlhe40 (Bhlhe40) group exhibited significantly greater potential for single-cell and multicellular clone formation than the negative control (Vector) group (Figure 5D,G). Moreover, the results of CCK8 proliferation assay displayed that there was a significant difference between the Bhlhe40 group and the Vector group from day 3 to day 14 (Figure 5H).
qRT-PCR showed that stemness genes and surface marker genes were significantly higher in the Bhlhe40 group than in the Vector group (Figure 5J,K). In addition, the ELISA results of OCT4, NANOG displayed that the Bhlhe40 group was significantly higher than the Vector group (Figure 5I). All the data indicated that BHLHE40 promoted proliferation, the expression of stemness genes, and cell surface markers of PαS cells.

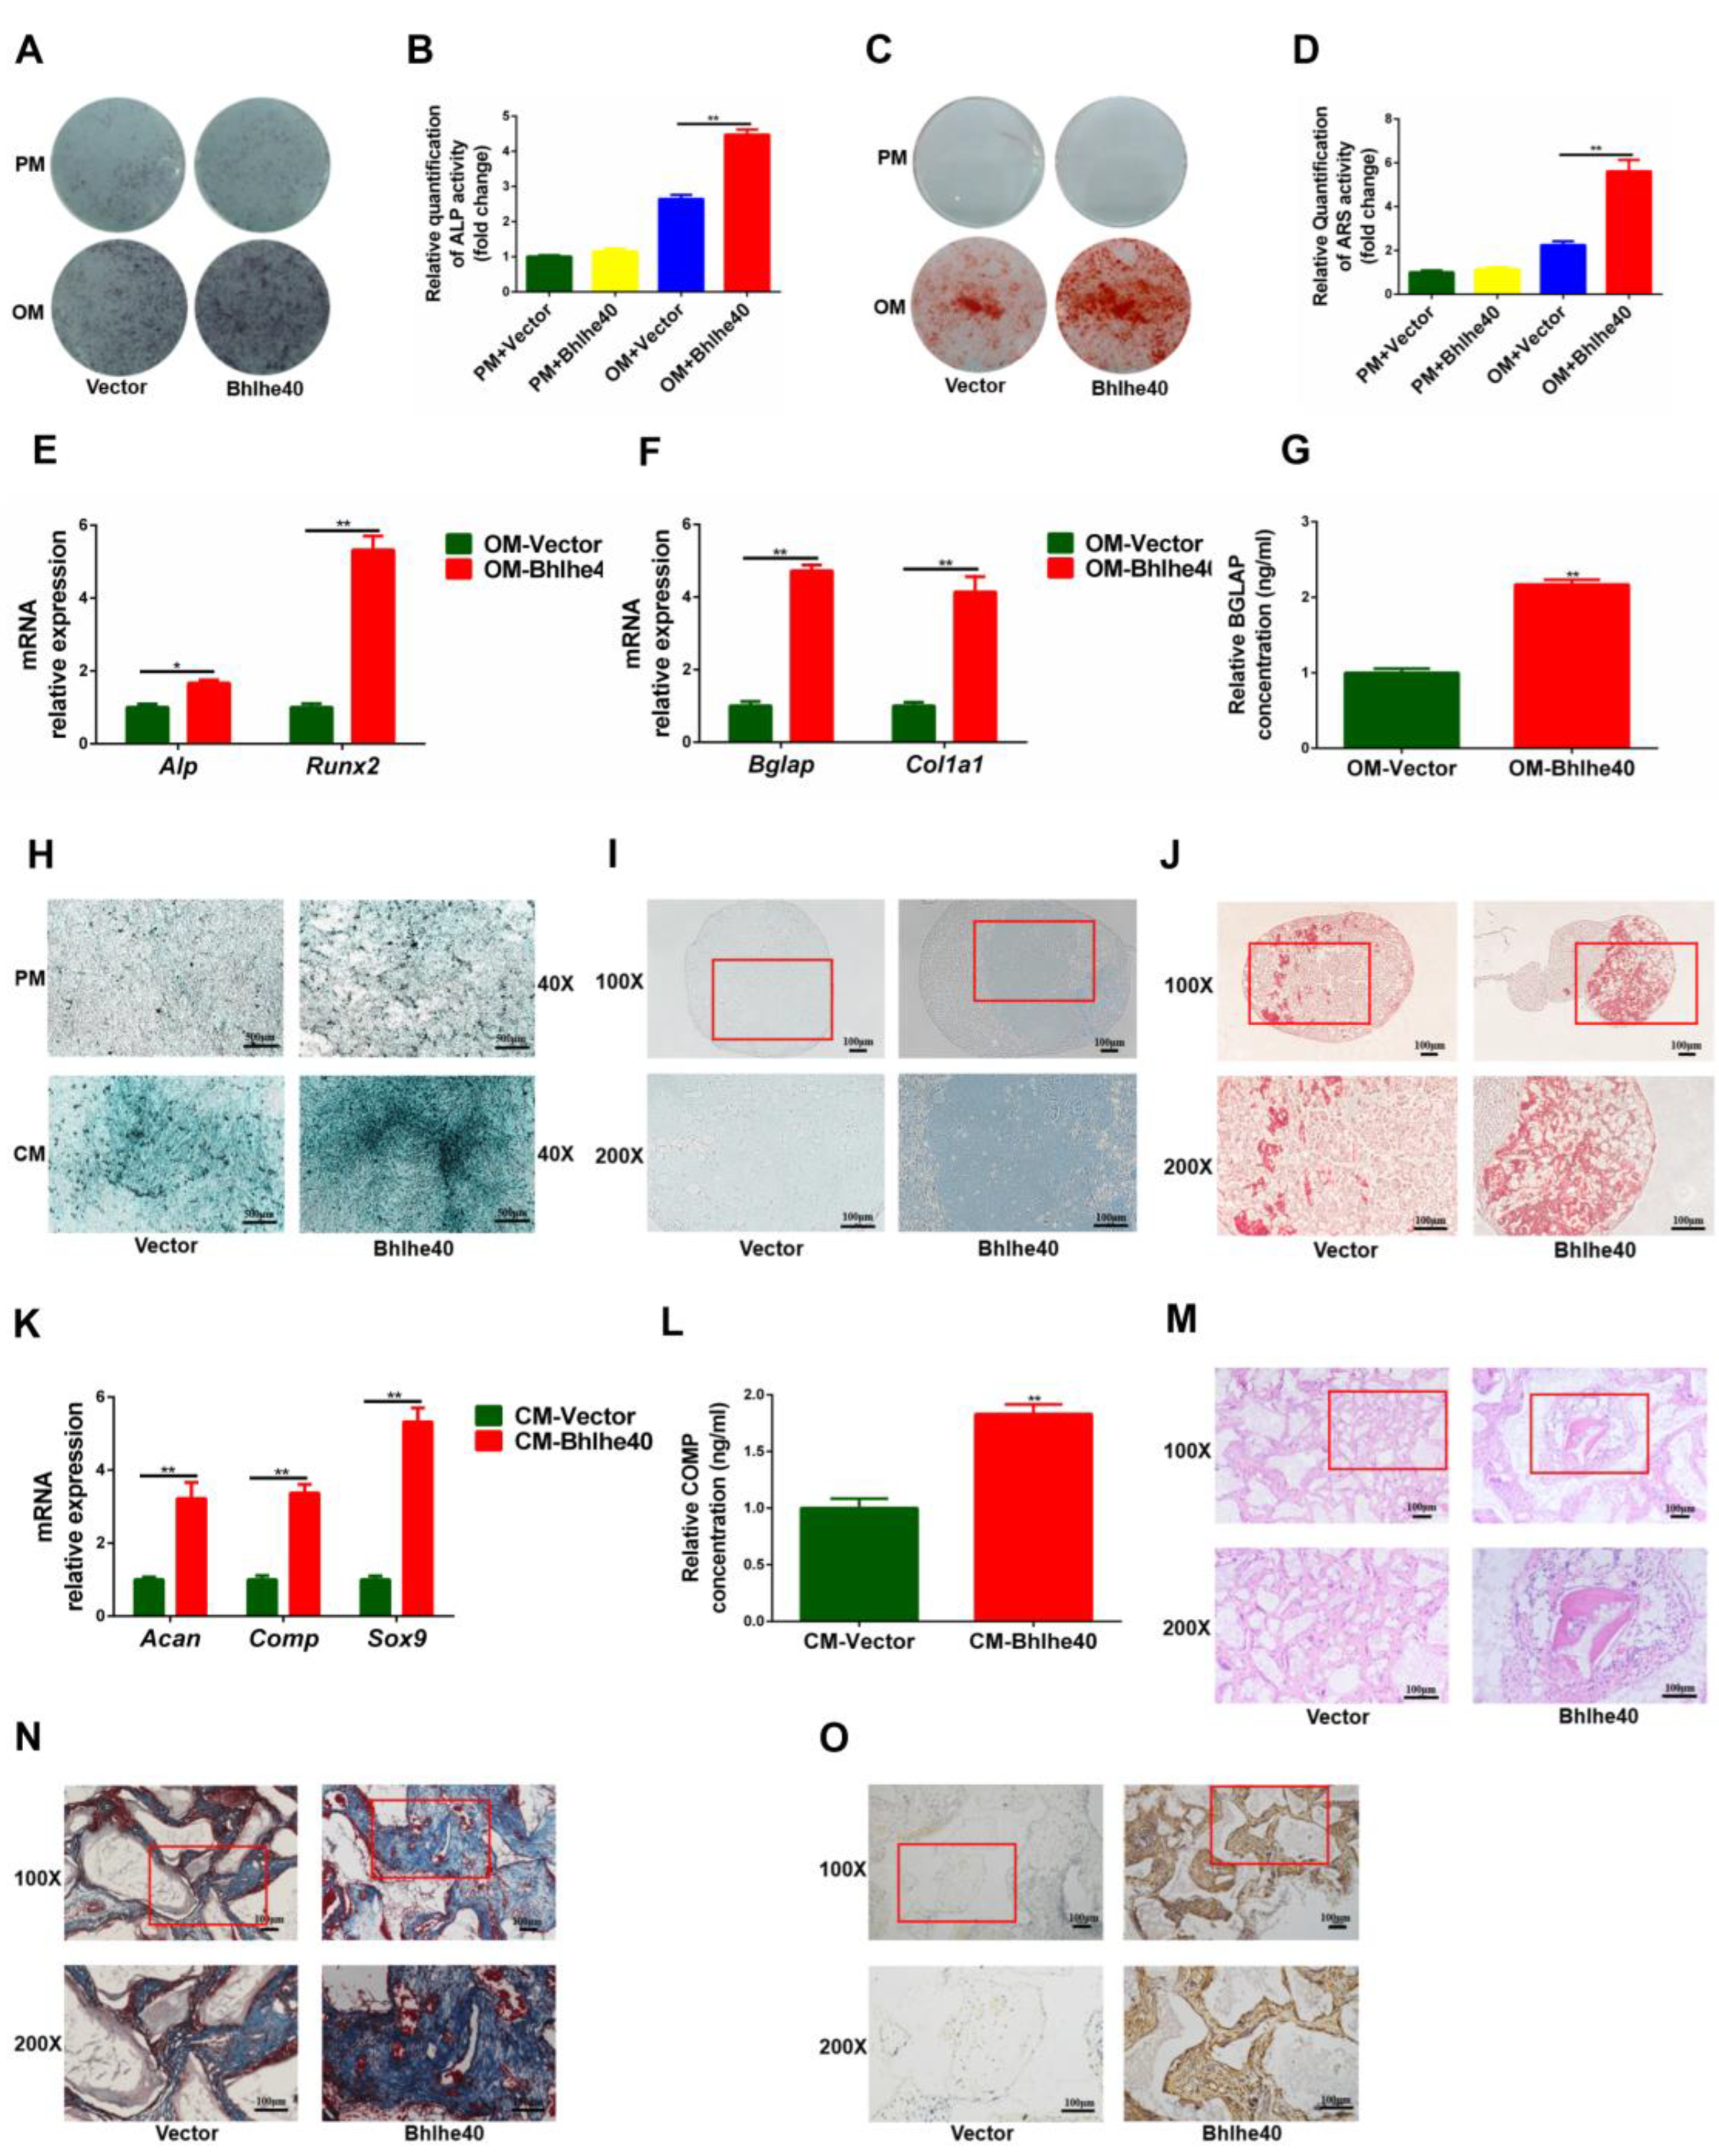
3.5. Overexpression of Bhlhe40 Stimulated Osteogenic and Chondrogenic Differentiation of PαS Cells

After 7 or 14 days of osteogenic induction, ALP staining and activity in the Bhlhe40 group was significantly greater than in the Vector group (Figure 6A,B). In addition, there was a similar trend in ARS staining and quantification (Figure 6C,D). In addition, the mRNA expression of Alp, Runx2, Bglap, Col1a1 and the protein expression of BGLAP all showed that the Bhlhe40 group was significantly higher than the Vector group (Figure 6E,G).
After 21 days of chondrogenic induction, the results of Alcian blue staining in well plates and the results of Alcian blue and Sirius red staining of chondrosphere sections both showed significantly more staining in the Bhlhe40 group than in the Vector group (Figure 6H,J). Moreover, the qRT-PCR results of the Acan, Sox9, Comp and the ELISA results of COMP were all significantly higher in the Bhlhe40 group than in the Vector group (Figure 6K,L).
H&E staining results showed that the Bhlhe40 group exhibited eosinophilic neoplasia of homogeneous, red-stained lamellar bone, but there was no obvious neoplasia lamellar bone in the Vector group. In addition, the proportion of eosinophilic, red-stained tissue was significantly greater in the Bhlhe40 group than in the Vector group (Figure 6M). Moreover, Masson’s trichome and IHC-OCN staining showed similar results (Figure 6N,O). These data suggested that BHLHE40 promoted stemness of PαS cells.

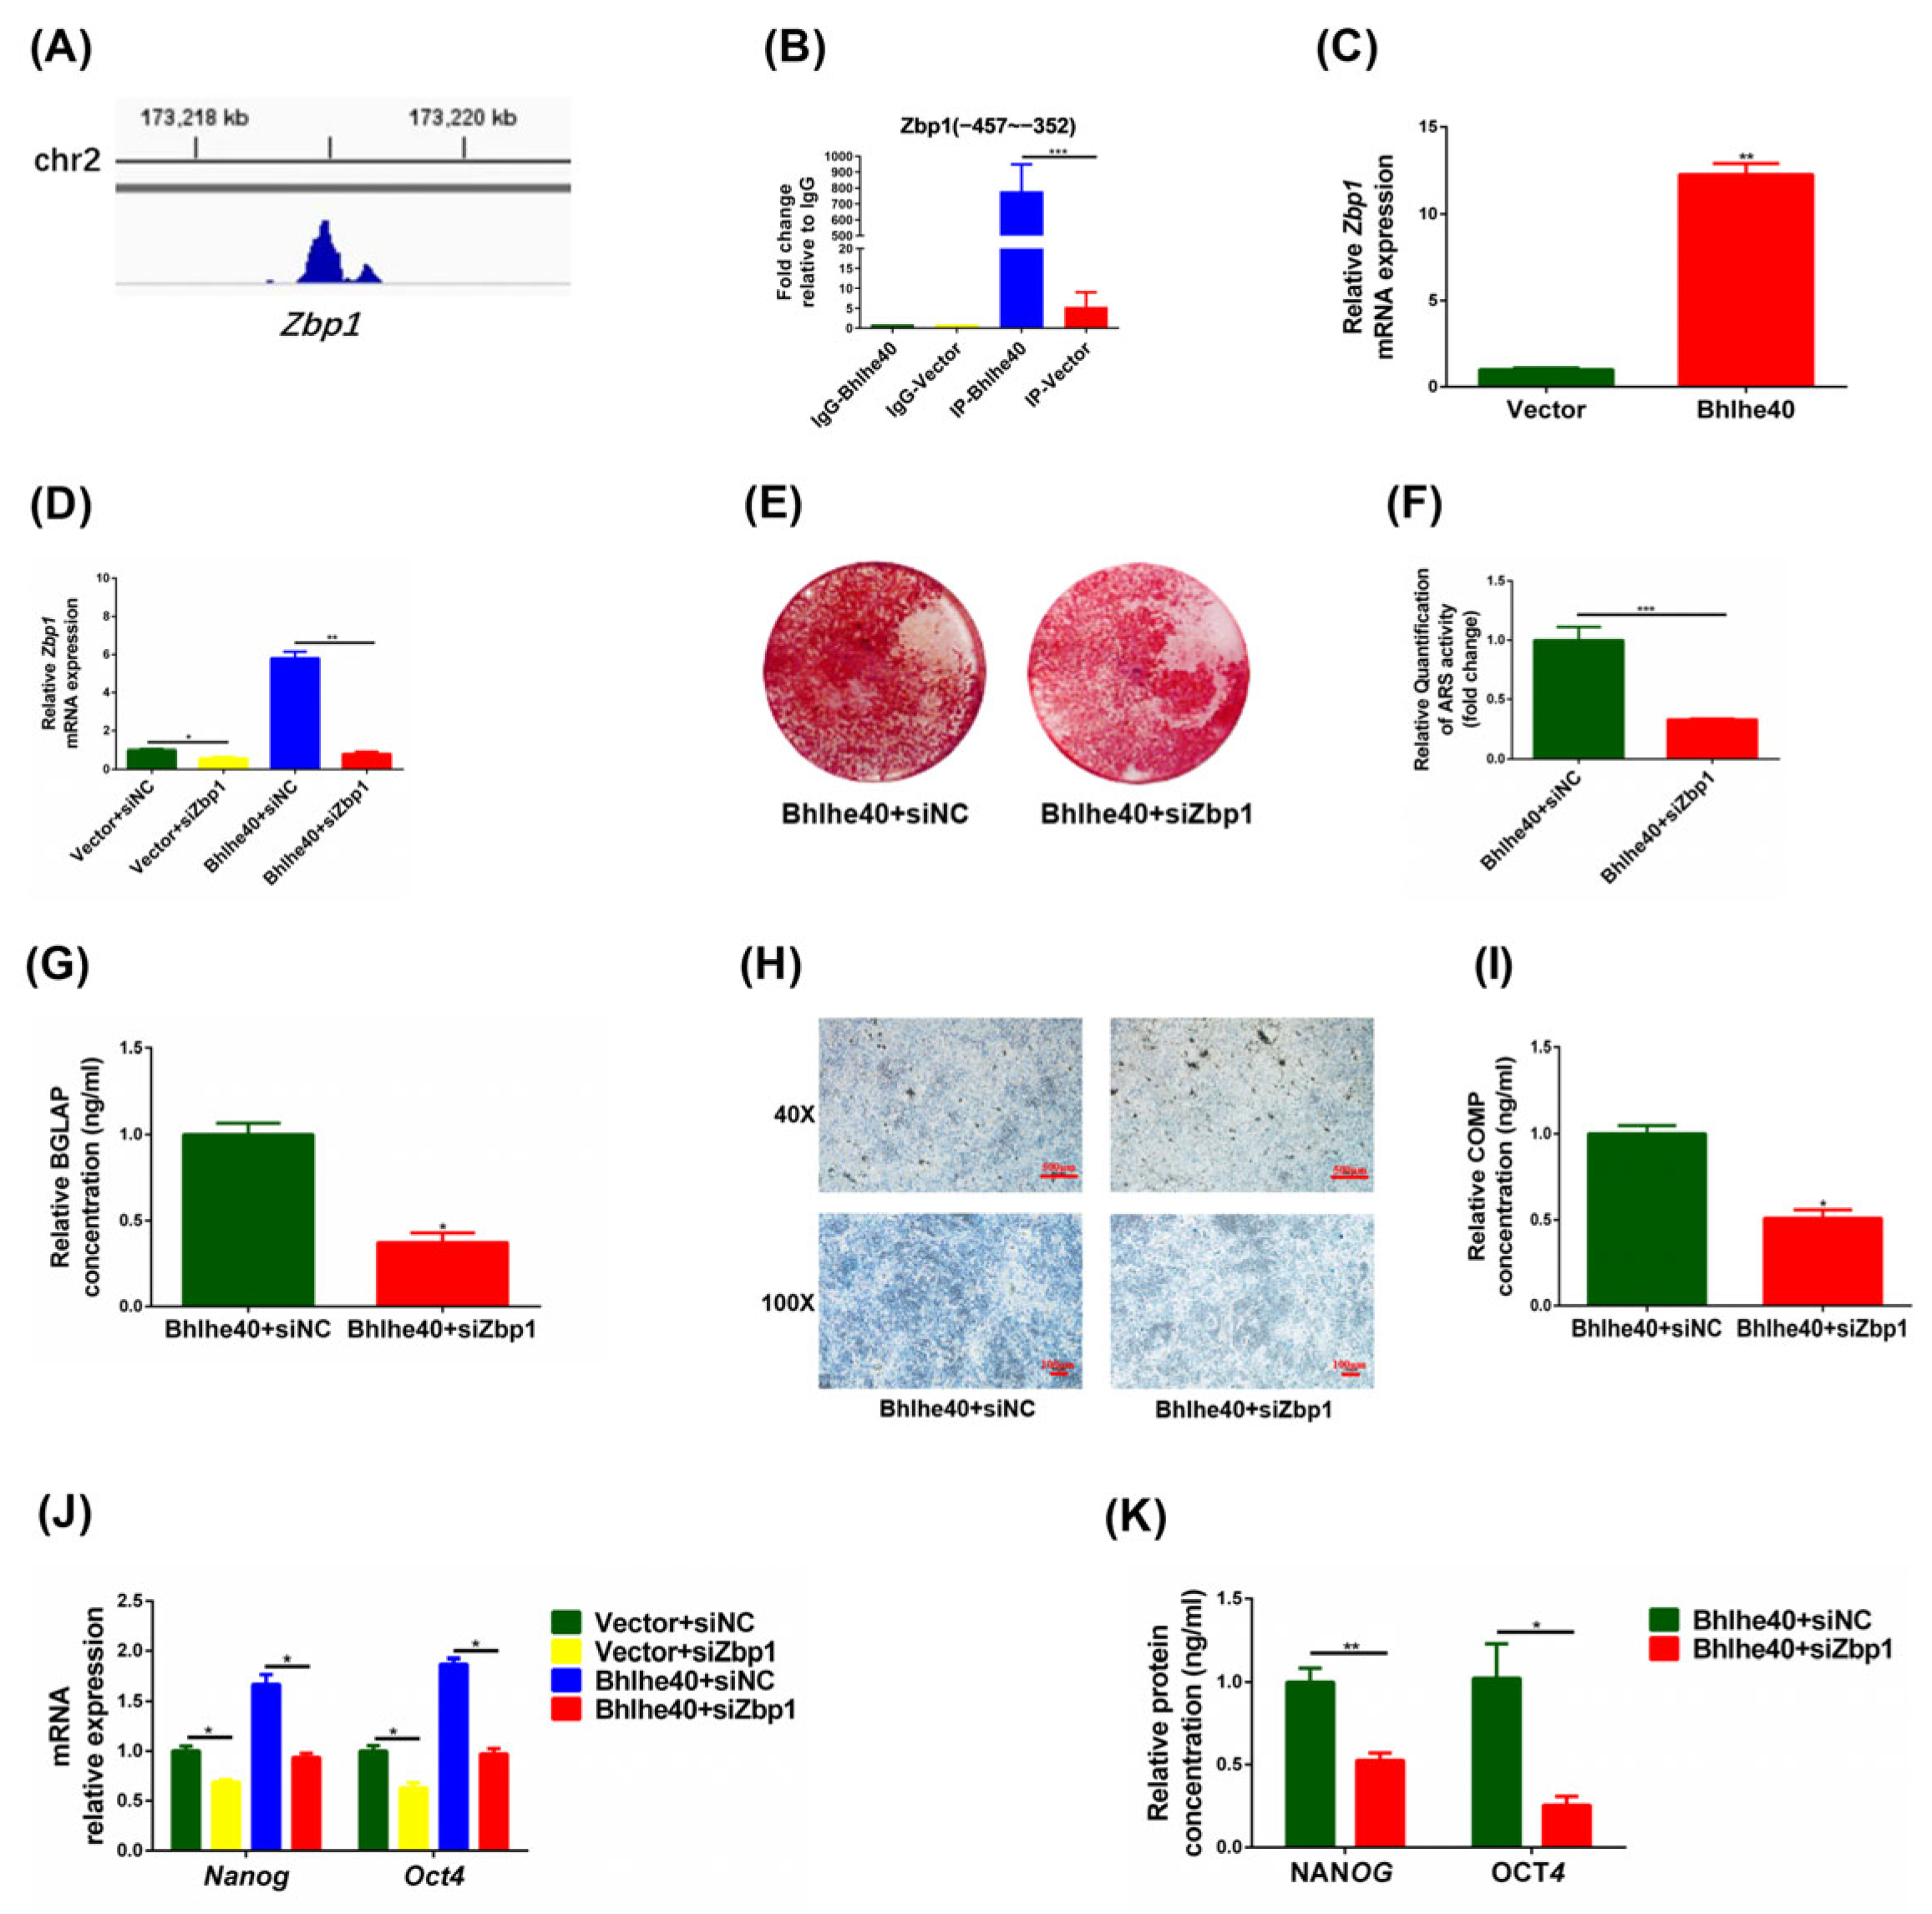
3.6. BHLHE40 Maintains the Stemness of PαS Cells by Activating Zbp1

To further investigate the underlying mechanism, we next analyzed the BHLHE40 ChIP-Seq data [42], and summarized the target genes which may be involved in the regulation of stemness (Table 2). Among which, we found that BHLHE40 showed great enrichment for the target gene Zbp1 (Figure 7A). We next performed ChIP-qPCR to verify the ChIP-seq data, which showed that BHLHE40 bound strongly to Zbp1, and the binding region was 457 to 352 bases upstream of the Zbp1 promoter (Figure 7B). Furthermore, the mRNA expression of Zbp1 increased significantly when Bhlhe40 was overexpressed in PαS cells (Figure 7C). Next, qRT-PCR results showed Zbp1 in the Bhlhe40 + siZbp1 group was significantly lower than in the Bhlhe40 + siNC group, which indicates that siZbp1 was successfully transfected into Bhlhe40-overexpressing PαS cells (Figure 7D).
After 14 days of osteogenic induction, the ARS staining and quantitative results showed that the Bhlhe40 + siZbp1 group was significantly lower than the Bhlhe40 + siNC group (Figure 7E,F). In addition, the ELISA results of BGLAP showed that the Bhlhe40 + siZbp1 group was significantly less than the Bhlhe40 + siNC group (Figure 7G). After 21 days of chondrogenic induction, the Alcian blue staining in well plates and the ELISA results of COMP both displayed that the Bhlhe40 + siZbp1 group was significantly less than the Bhlhe40 + siNC group (Figure 7H,I). In addition, qRT-PCR and ELISA results both showed that the expression of stemness genes in the Bhlhe40 + siZbp1 group was significantly lower than in the Bhlhe40 + siNC group (Figure 7J,K). These results demonstrated that BHLHE40 maintains the stemness of PαS cells by activating Zbp1.

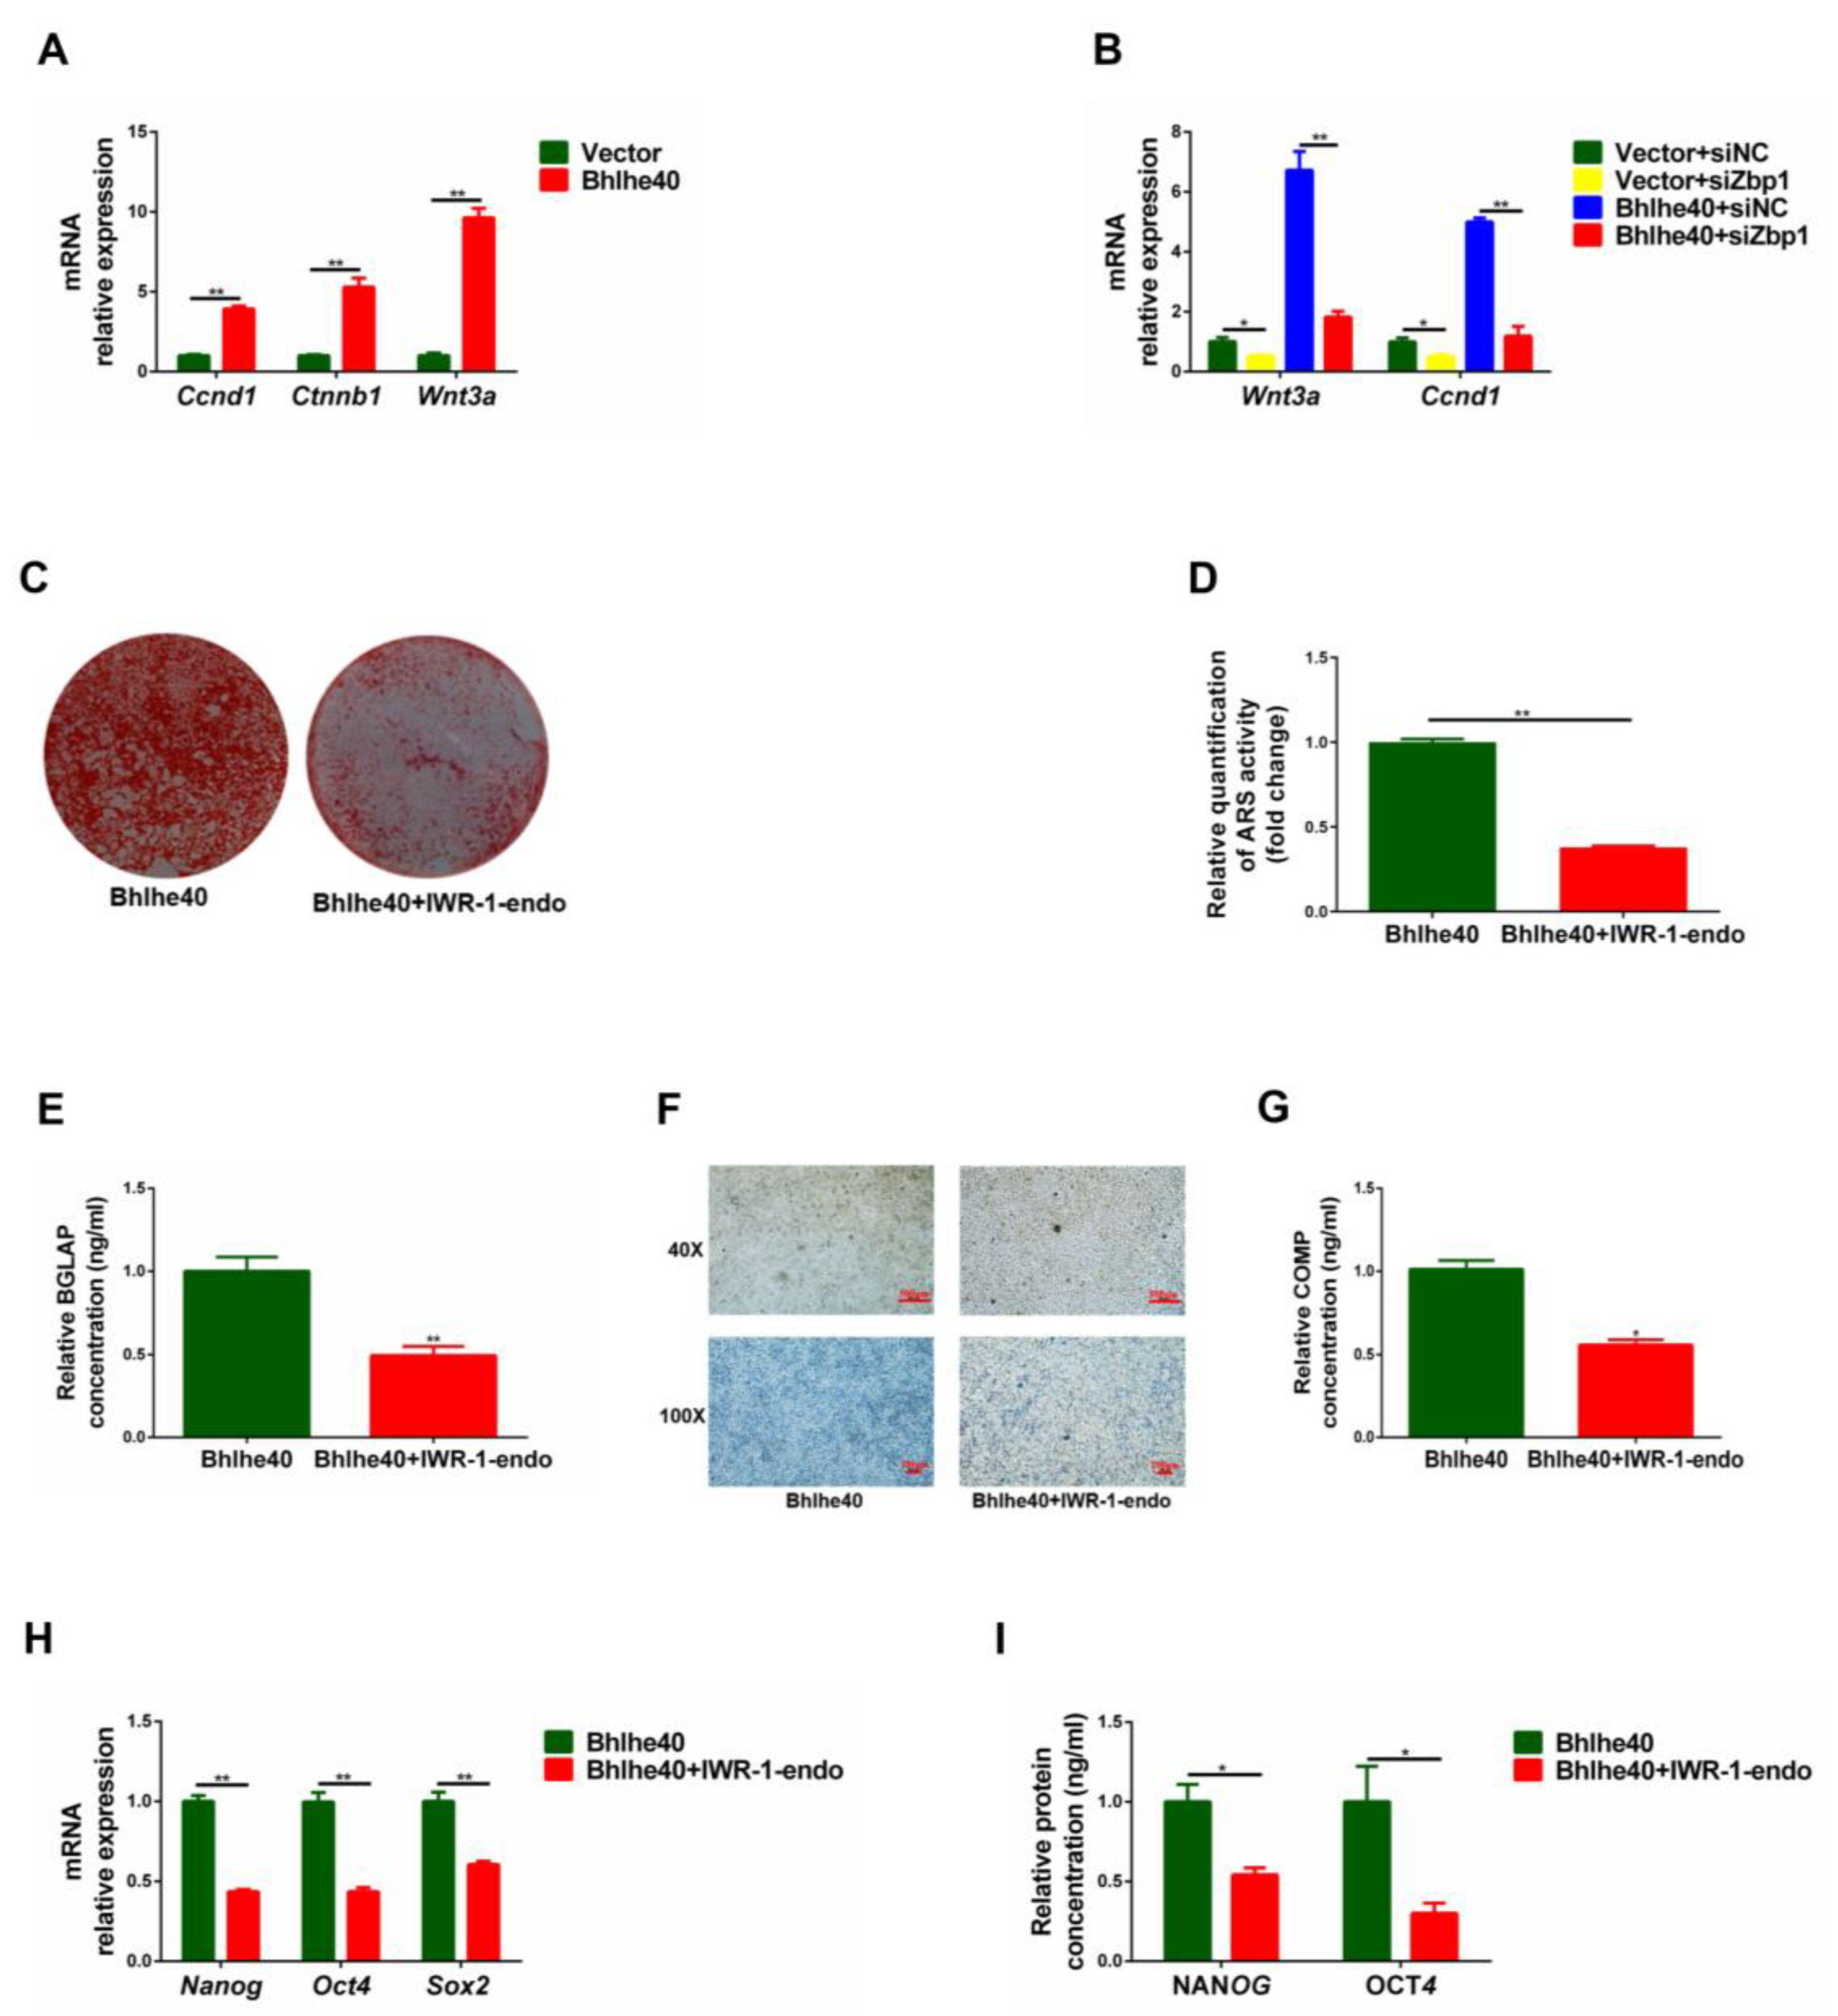
3.7. BHLHE40 Regulates the Stemness of PαS Cells through the Wnt/β-Catenin Signaling Pathway

Studies have reported that Zbp1 regulates the Wnt/β-catenin signaling pathway to promote osteogenesis, so we subsequently explored the function of the Wnt/β-catenin signaling pathway in this study [43,44]. The mRNA expression of key genes (Wnt3a, Ctnnb1, and Ccnd1) in the Wnt/β-catenin signaling pathway displayed that the Bhlhe40 group was significantly higher than the Vector group (Figure 8A). Moreover, Wnt3a and Ccnd1 were significantly higher in the Bhlhe40 + siZbp1 group than in the Bhlhe40 + siNC group (Figure 8B). These results indicated that BHLHE40 may activate Wnt/β-catenin signaling in PαS cells.
After 14 days of osteogenic induction, the ARS staining and quantitative results showed that the Bhlhe40 + IWR-1-endo group was significantly less than the Bhlhe40 group (Figure 8C,D). In addition, the ELISA results of BGLAP showed a similar trend (Figure 8E). After 21 days of chondrogenic induction, the Alcian blue staining in well plate results and the ELISA results of COMP both displayed that the Bhlhe40 + IWR-1-endo group was significantly less than the Bhlhe40 group (Figure 8F,G). Furthermore, qRT-PCR and ELISA results displayed that the expression of stemness genes in the Bhlhe40 + IWR-1-endo group was significantly lower than in the Bhlhe40 group (Figure 8H,I). These results demonstrated that BHLHE40 regulates the stemness of PαS cells through the Wnt/β-catenin signaling pathway.

4. Discussion

The age of a stem cell donor has a significant effect on the number and stemness of the cells obtained [45,46,47]. A previous study compared the proportions of PαS cells found in the long bones of C57/6N mice at four different stages of development and found that the highest proportions of PαS cells were obtained from the limbs of C57/6N mice at embryonic day 18.5 and postnatal days 1 to 3 [30]. Therefore, considering the difficulty of the experimental procedure, the experimental cost, and the number of cells extracted, C57/6N mice at postnatal day 1 to 3 were selected for the extraction of fresh PαS cells in this study.
Previous studies have investigated stemness changes during in vitro culture, whereas few studies have focused on differences in stemness between stem cells that have been freshly collected from the body and those that have been cultured in vitro [48,49]. In this study, fresh PαS cells were isolated prospectively by FACS, and we compared the stemness of fresh and P0 PαS cells. We found that fresh PαS cells once adherent cultured in vitro, show some irregular differentiation tendency. This further illustrates the importance of establishing safe and effective amplification methods in vitro. However, the fresh PαS cells obtained by FACS in our current work were not identical to real PαS cells in vivo. Implementing a lineage tracing experiment for PαS cells in mice may help to address this problem [50].
In this study, flow cytometry displayed that the expression of surface markers was significantly higher in fresh PαS cells than in P0 PαS cells. These results also suggest that the characteristics of fresh PαS cells change considerably when the cells are cultured in vitro. Few previous studies have noted that markers are lost from the surface of PαS cells cultured in vitro. H&E staining of ectopic osteogenesis in vivo showed more lamellar bone tissue in fresh PαS cells than in P0 PαS cells. Our results also confirmed that there are many differences in the biological characteristics of BMSCs in vivo, compared to BMSCs that have been cultured in vitro [7,8]. As far as we know, no research has reported on differences in stemness between PαS cells freshly sorted representative of in vivo and PαS cells cultured in vitro. In addition, we found that the stemness of fresh PαS cells sorted representative of in vivo was superior to that of P0 PαS cells cultured in vitro. The results of this part also suggest that in order to maintain the characteristics of stem cells, more attention needs to be paid to the changes of stem cells from in vivo to in vitro nodes to obtain a better effect of stem cell therapy.
The PαS cells used in this study were only cultured in vitro to P4, because the growth of these PαS cells was very slow, and the differentiation potential of these cells was quite weak. In addition, the cell proliferation and differentiation capacities of PαS cells changed significantly from P0 to P4. Therefore, we only investigated changes in the proliferation and differentiation capacities of PαS cells from P0 to P4. Importantly, we noted that the proliferation and differentiation capacities of PαS cells decreased considerably from P0 to P1 in vitro, and this was confirmed by in vivo ectopic osteogenesis experiments (Figure 3A). H&E staining of P0 PαS cells clearly identified lamellar bone tissue, whereas P1 PαS cells did not. These results suggest that we should pay more attention to the biological changes of PαS cells from P0 to P1 in vitro.
Our flow cytometry and mRNA expression results displayed that the expression of surface markers in PαS cells in vitro decreased gradually from P0 to P4. These results demonstrated that the stemness of PαS cells decreased gradually due to the loss of some of their original characteristics during in vitro culture. In addition, these results were also consistent with the above trend of reduced proliferation and differentiation ability of PαS cells from P0 to P4 in vitro. Previous studies reported that SCA-1+ stem cells have a higher proliferative capacity and greater osteogenic differentiation capacities than SCA-1 stem cells [51]. Therefore, the decreased stemness of PαS cells may be linked to decreased expression of the SCA-1 surface marker. Even if the stemness of PαS cells in vitro is linked to the expression of markers on the cell surface, further studies will be needed to elucidate the relevant mechanisms.
Of course, there are still some limitations of this study. First of all, overexpression of Bhlhe40 may cause a ripple reaction, which can lead to some unexpected effects on the PαS cells. In addition, the animal model of stemness research in vivo is relatively simple, and this animal research model can be enriched in the future when conditions are available. Furthermore, this study did not explore what regulates the transcription factor BHLHE40, which will be our next step. Finally, due to time and money constraints, this study did not use a transgenic mouse to further confirm the role of BHLHE40 in vivo, which is also the focus of our future research work.
This present work first investigated the pivotal role of BHLHE40 in maintaining the stemness of PαS cells in vitro, and demonstrated that BHLHE40 activated the Wnt/β-catenin signaling pathway in PαS cells by targeting Zbp1. These data provide a basis for the development of small molecule drugs that target BHLHE40 or stimulate BHLHE40 expression. A better understanding of the properties of freshly isolated stem cells and how to optimize the regulation of stem cell differentiation during in vitro expansion will inform practitioners and help to alleviate the bottleneck of clinical application.

5. Conclusions

Our study indicated that the stemness of fresh PαS cells representative in vivo was superior to that of P0 PαS cells in vitro. In addition, the stemness of PαS cells decreased gradually from P0 to P4 in vivo and in vitro. Moreover, BHLHE40 maintained the stemness of PαS cells by targeting Zbp1 through the Wnt/β-catenin signaling pathway in vitro. This work may provide significant indications to improve the clinical applications of PαS cells in the future.

Supplementary Materials

The following supporting information can be downloaded at: https://www.mdpi.com/article/10.3390/biomedicines11082190/s1, Table S1: The specific information of animals, materials, and reagents used in this study.

Author Contributions

Conceptualization: Y.Z. and P.Z.; data curation: M.H., Y.Z. and P.Z.; formal analysis: M.H.; funding acquisition: Y.Z. and P.Z.; investigation: M.H., Y.T. and X.L.; methodology: M.H., Y.T., X.L., Q.G., D.L. and X.W.; project administration: Y.L., Y.Z. and P.Z.; resources: X.L., Q.G., D.L, X.W., L.L., X.Z. and Y.L.; software: M.H., Y.T., Q.G. and D.L.; supervision: Y.Z. and P.Z.; Validation: M.H. and Y.T.; writing—original draft: M.H.; writing—review & editing: M.H., Y.T., X.L, Q.G., D.L., X.W., L.L., X.Z., Y.L., Y.Z. and P.Z. All authors agree to be accountable for all aspects of the work, ensuring integrity and accuracy. All authors have read and agreed to the published version of the manuscript.

Funding

This research was funded by National Natural Science Foundation of China, Grant/Award Numbers: 81970911 and 81930026.

Institutional Review Board Statement

All in vivo studies were performed under the approval of the Institutional Animal Care and Use Committee of the Peking University Health Science Center (LA2019019), and were performed in accordance with the Institutional Animal Guidelines.

Informed Consent Statement

Not applicable, for this study as not involving humans.

Data Availability Statement

All data are included in the manuscript and supporting information. The datasets generated during and/or analyzed during the current study is available from the corresponding author on reasonable request.

Acknowledgments

The authors would like to expressed their deep appreciation to Xuejiao Liu and Yangge Du for their help in the technical guidance of the experiments.

Conflicts of Interest

The authors declare no conflict of interest.

Appendix A

Figure A1. The osteogenic differentiation capacity of PαS cells decreased gradually from P0 to P4 in vitro. (A,B) ALP staining and activity of PαS cells from P0 to P4 in vitro. (C,D) ARS staining and quantification of PαS cells from P0 to P4 in vitro. (E) Relative expression of Alp and Runx2 mRNA was evaluated by qRT-PCR in PαS cells from P0 to P4 in vitro after 7 days of osteogenic differentiation. Gapdh was used for normalization. (F) Relative expression of Spp1 and Col1a1 mRNA was evaluated by qRT-PCR in PαS cells from P0 to P4 in vitro after 14 days of osteogenic differentiation. Gapdh was used for normalization. (G) Relative expression of BGLAP protein was evaluated by ELISA in PαS cells from P0 to P4 in vitro after 14 days of osteogenic differentiation. Data are represented as mean ± SD of three independent experiments. * p < 0.05; ** p < 0.01; *** p < 0.001; ns p > 0.05.
Biomedicines 11 02190 g0a1
Figure A2. The chondrogenic differentiation capacity of PαS cells decreased gradually from P0 to P4 in vitro. (A) Relative expression of Acan, Comp, and Sox9 mRNA was evaluated by qRT-PCR in PαS cells from P0 to P4 in vitro after 21 days of chondrogenic differentiation. Gapdh was used for normalization. (B) Relative expression of COMP protein was evaluated by ELISA in PαS cells from P0 to P4 in vitro after 21 days of chondrogenic differentiation. (C) Alcian blue staining in well plates of PαS cells from P0 to P4 in vitro after 21 days of chondrogenic differentiation. Scale bar = 500 μm, n = 3. (D,E) Alcian blue and Sirius red staining of chondrosphere sections of PαS cells from P0 to P4 in vitro after 21 days of chondrogenic differentiation. Scale bar = 100 μm, n = 3. Data are represented as mean ± SD of three independent experiments. * p < 0.05; ** p < 0.01; ns p > 0.05.
Biomedicines 11 02190 g0a2
Figure A3. A Lentivirus infection of Bhlhe40 group and Vector group in vitro, observed under an inverted fluorescence microscope. Scale bar = 100 μm, n = 3.
Biomedicines 11 02190 g0a3

References

  1. Bieback, K.; Hecker, A.; Kocaömer, A.; Lannert, H.; Schallmoser, K.; Strunk, D.; Klüter, H. Human Alternatives to Fetal Bovine Serum for the Expansion of Mesenchymal Stromal Cells from Bone Marrow. Stem Cells 2009, 27, 2331–2341. [Google Scholar] [CrossRef] [PubMed]
  2. Lin, G.L.; Hankenson, K.D. Integration of BMP, Wnt, and notch signaling pathways in osteoblast differentiation. J. Cell. Biochem. 2011, 112, 3491–3501. [Google Scholar] [CrossRef] [Green Version]
  3. Leveque, X.; Hochane, M.; Geraldo, F.; Dumont, S.; Gratas, C.; Oliver, L.; Gaignier, C.; Trichet, V.; Layrolle, P.; Heymann, D.; et al. Low-Dose Pesticide Mixture Induces Accelerated Mesenchymal Stem Cell Aging In Vitro. Stem Cells 2019, 37, 1083–1094. [Google Scholar] [CrossRef] [PubMed] [Green Version]
  4. Pasumarthy, K.K.; Jayavelu, N.D.; Kilpinen, L.; Andrus, C.; Battle, S.L.; Korhonen, M.; Lehenkari, P.; Lund, R.; Laitinen, S.; Hawkins, R.D. Methylome Analysis of Human Bone Marrow MSCs Reveals Extensive Age- and Culture-Induced Changes at Distal Regulatory Elements. Stem Cell Rep. 2017, 9, 999–1015. [Google Scholar] [CrossRef] [Green Version]
  5. Tokalov, S.V.; Grüner, S.; Schindler, S.; Wolf, G.; Baumann, M.; Abolmaali, N. Age-Related Changes in the Frequency of Mesenchymal Stem Cells in the Bone Marrow of Rats. Stem Cells Dev. 2007, 16, 439–446. [Google Scholar] [CrossRef]
  6. Bourillot, P.-Y.; Savatier, P. Krüppel-like transcription factors and control of pluripotency. BMC Biol. 2010, 8, 125–127. [Google Scholar] [CrossRef] [PubMed] [Green Version]
  7. Rombouts, W.J.C.; E Ploemacher, R. Primary murine MSC show highly efficient homing to the bone marrow but lose homing ability following culture. Leukemia 2003, 17, 160–170. [Google Scholar] [CrossRef] [Green Version]
  8. Abbuehl, J.-P.; Tatarova, Z.; Held, W.; Huelsken, J. Long-Term Engraftment of Primary Bone Marrow Stromal Cells Repairs Niche Damage and Improves Hematopoietic Stem Cell Transplantation. Cell Stem Cell 2017, 21, 241–255.e6. [Google Scholar] [CrossRef]
  9. Mo, C.; Guo, J.; Qin, J.; Zhang, X.; Sun, Y.; Wei, H.; Cao, D.; Zhang, Y.; Zhao, C.; Xiong, Y.; et al. Single-cell transcriptomics of LepR-positive skeletal cells reveals heterogeneous stress-dependent stem and progenitor pools. EMBO J. 2022, 41, e108415. [Google Scholar] [CrossRef]
  10. Peister, A.; Mellad, J.A.; Larson, B.L.; Hall, B.M.; Gibson, L.F.; Prockop, D.J. Adult stem cells from bone marrow (MSCs) isolated from different strains of inbred mice vary in surface epitopes, rates of proliferation, and differentiation potential. Blood 2004, 103, 1662–1668. [Google Scholar] [CrossRef] [Green Version]
  11. Morikawa, S.; Mabuchi, Y.; Kubota, Y.; Nagai, Y.; Niibe, K.; Hiratsu, E.; Suzuki, S.; Miyauchi-Hara, C.; Nagoshi, N.; Sunabori, T.; et al. Prospective identification, isolation, and systemic transplantation of multipotent mesenchymal stem cells in murine bone marrow. J. Exp. Med. 2009, 206, 2483–2496. [Google Scholar] [CrossRef]
  12. Ogawa, Y.; Morikawa, S.; Okano, H.; Mabuchi, Y.; Suzuki, S.; Yaguchi, T.; Sato, Y.; Mukai, S.; Yaguchi, S.; Inaba, T.; et al. MHC-compatible bone marrow stromal/stem cells trigger fibrosis by activating host T cells in a scleroderma mouse model. Elife 2016, 5, e09394. [Google Scholar] [CrossRef] [PubMed]
  13. Ow, J.R.; Tan, Y.H.; Jin, Y.; Bahirvani, A.G.; Taneja, R. Stra13 and Sharp-1, the Non-Grouchy Regulators of Development and Disease. Curr. Top. Dev. Biol. 2014, 110, 317–338. [Google Scholar] [PubMed]
  14. Zhu, Y.; Xu, L.; Zhang, J.; Hu, X.; Liu, Y.; Yin, H.; Lv, T.; Zhang, H.; Liu, L.; An, H.; et al. Sunitinib induces cellular senescence via p53/Dec1 activation in renal cell carcinoma cells. Cancer Sci. 2013, 104, 1052–1061. [Google Scholar] [CrossRef] [PubMed]
  15. Iizuka, K.; Horikawa, Y. Regulation of lipogenesis via BHLHB2/DEC1 and ChREBP feedback looping. Biochem. Biophys. Res. Commun. 2008, 374, 95–100. [Google Scholar] [CrossRef]
  16. Gosselin, D.; Link, V.M.; Romanoski, C.E.; Fonseca, G.J.; Eichenfield, D.Z.; Spann, N.J.; Stender, J.D.; Chun, H.B.; Garner, H.; Geissmann, F.; et al. Environment Drives Selection and Function of Enhancers Controlling Tissue-Specific Macrophage Identities. Cell 2014, 159, 1327–1340. [Google Scholar] [CrossRef]
  17. Zafar, A.; Ng, H.P.; Kim, G.; Chan, E.R.; Mahabeleshwar, G.H. BHLHE40 promotes macrophage pro-inflammatory gene expression and functions. FASEB J. 2021, 35, e21940. [Google Scholar] [CrossRef]
  18. Rauschmeier, R.; Gustafsson, C.; Reinhardt, A.; A-Gonzalez, N.; Tortola, L.; Cansever, D.; Subramanian, S.; Taneja, R.; Rossner, M.J.; Sieweke, M.H.; et al. Bhlhe40 and Bhlhe41 transcription factors regulate alveolar macrophage self-renewal and identity. EMBO J. 2019, 38, e101233. [Google Scholar] [CrossRef] [PubMed]
  19. Teng, Y.; Zhao, Y.; Li, M.; Liu, Y.; Cheng, P.; Lv, Y.; Mao, F.; Chen, W.; Yang, S.; Hao, C.; et al. Upexpression of BHLHE40 in gastric epithelial cells increases CXCL12 production through interaction with p-STAT3 in Helicobacter pylori -associated gastritis. FASEB J. 2020, 34, 1169–1181. [Google Scholar] [CrossRef] [Green Version]
  20. Kiss, Z.; Mudryj, M.; Ghosh, P.M. Non-circadian aspects of BHLHE40 cellular function in cancer. Genes Cancer 2020, 11, 1–19. [Google Scholar] [CrossRef] [Green Version]
  21. Jarjour, N.N.; Schwarzkopf, E.A.; Bradstreet, T.R.; Shchukina, I.; Lin, C.-C.; Huang, S.C.-C.; Lai, C.-W.; Cook, M.E.; Taneja, R.; Stappenbeck, T.S.; et al. Bhlhe40 mediates tissue-specific control of macrophage proliferation in homeostasis and type 2 immunity. Nat. Immunol. 2019, 20, 687–700. [Google Scholar] [CrossRef] [PubMed]
  22. Yun, Z.; Maecker, H.L.; Johnson, R.S.; Giaccia, A.J. Inhibition of PPAR gamma 2 gene expression by the HIF-1-regulated gene DEC1/Stra13: A mechanism for regulation of adipogenesis by hypoxia. Dev. Cell 2002, 2, 331–341. [Google Scholar] [CrossRef] [PubMed] [Green Version]
  23. Ozaki, N.; Noshiro, M.; Kawamoto, T.; Nakashima, A.; Honda, K.; Fukuzaki-Dohi, U.; Honma, S.; Fujimoto, K.; Tanimoto, K.; Tanne, K.; et al. Regulation of basic helix-loop-helix transcription factors Dec1 and Dec2 by RORα and their roles in ad-ipogenesis. Genes Cells 2012, 17, 109–121. [Google Scholar] [CrossRef]
  24. Sethuraman, A.; Brown, M.; Krutilina, R.; Wu, Z.-H.; Seagroves, T.N.; Pfeffer, L.M.; Fan, M. BHLHE40 confers a pro-survival and pro-metastatic phenotype to breast cancer cells by modulating HBEGF secretion. Breast Cancer Res. 2018, 20, 117–133. [Google Scholar] [CrossRef] [Green Version]
  25. Chen, Y.; Henson, E.S.; Xiao, W.; Huang, D.; McMillan-Ward, E.M.; Israels, S.J.; Gibson, S.B. Tyrosine kinase receptor EGFR regulates the switch in cancer cells between cell survival and cell death induced by autophagy in hypoxia. Autophagy 2016, 12, 1029–1046. [Google Scholar] [CrossRef] [PubMed] [Green Version]
  26. Jia, Y.; Hu, R.; Li, P.; Zheng, Y.; Wang, Y.; Ma, X. DEC1 is required for anti-apoptotic activity of gastric cancer cells under hypoxia by promoting Survivin expression. Gastric Cancer 2018, 21, 632–642. [Google Scholar] [CrossRef] [PubMed] [Green Version]
  27. Jia, Y.-F.; Xiao, D.-J.; Ma, X.-L.; Song, Y.-Y.; Hu, R.; Kong, Y.; Zheng, Y.; Han, S.-Y.; Hong, R.-L.; Wang, Y.-S. Differentiated embryonic chondrocyte-expressed gene 1 is associated with hypoxia-inducible factor 1α and Ki67 in human gastric cancer. Diagn. Pathol. 2013, 8, 37–43. [Google Scholar] [CrossRef] [Green Version]
  28. Xiong, J.; Yang, H.; Luo, W.; Shan, E.; Liu, J.; Zhang, F.; Xi, T.; Yang, J. The anti-metastatic effect of 8-MOP on hepatocellular carcinoma is potentiated by the down-regulation of bHLH transcription factor DEC1. Pharmacol. Res. 2016, 105, 121–133. [Google Scholar] [CrossRef]
  29. Murakami, K.; Wu, Y.; Imaizumi, T.; Aoki, Y.; Liu, Q.; Yan, X.; Seino, H.; Yoshizawa, T.; Morohashi, S.; Kato, Y.; et al. DEC1 promotes hypoxia-induced epithelial-mesenchymal transition (EMT) in human hepatocellular carcinoma cells. Biomed. Res. 2017, 38, 221–227. [Google Scholar] [CrossRef] [Green Version]
  30. Nusspaumer, G.; Jaiswal, S.; Barbero, A.; Reinhardt, R.; Ronen, D.I.; Haumer, A.; Lufkin, T.; Martin, I.; Zeller, R. Ontogenic Identification and Analysis of Mesenchymal Stromal Cell Populations during Mouse Limb and Long Bone Development. Stem Cell Rep. 2017, 9, 1124–1138. [Google Scholar] [CrossRef] [Green Version]
  31. Lin, X.; Dong, R.; Diao, S.; Yu, G.; Wang, L.; Li, J.; Fan, Z. SFRP2 enhanced the adipogenic and neuronal differentiation potentials of stem cells from apical papilla. Cell Biol. Int. 2017, 41, 534–543. [Google Scholar] [CrossRef] [PubMed]
  32. Wang, J.-J.; Dong, R.; Wang, L.-P.; Wang, J.-S.; Du, J.; Wang, S.-L.; Shan, Z.-C.; Fan, Z.-P. Histone demethylase KDM2B inhibits the chondrogenic differentiation potentials of stem cells from apical papilla. Int. J. Clin. Exp. Med. 2015, 8, 2165–2173. [Google Scholar] [PubMed]
  33. Liu, X.; Li, Z.; Liu, H.; Zhu, Y.; Xia, D.; Wang, S.; Gu, R.; Wu, W.; Zhang, P.; Liu, Y.; et al. Low concentration flufenamic acid enhances osteogenic differentiation of mesenchymal stem cells and suppresses bone loss by inhibition of the NF-κB signaling pathway. Stem Cell Res. Ther. 2019, 10, 213–226. [Google Scholar] [CrossRef] [PubMed]
  34. Zhang, P.; Liu, Y.; Jin, C.; Zhang, M.; Lv, L.; Zhang, X.; Liu, H.; Zhou, Y. Histone H3K9 Acetyltransferase PCAF Is Essential for Osteogenic Differentiation Through Bone Morphogenetic Protein Signaling and May Be Involved in Osteoporosis. Stem Cells 2016, 34, 2332–2341. [Google Scholar] [CrossRef]
  35. Min, Z.; Xiaomeng, L.; Zheng, L.; Yangge, D.; Xuejiao, L.; Longwei, L.; Xiao, Z.; Yunsong, L.; Ping, Z.; Yongsheng, Z. Asymmetrical methyltransferase PRMT3 regulates human mesenchymal stem cell osteogenesis via miR-3648. Cell Death Dis. 2019, 10, 581–597. [Google Scholar] [CrossRef] [Green Version]
  36. Zhang, P.; Liu, Y.; Wang, Y.; Zhang, M.; Lv, L.; Zhang, X.; Zhou, Y. SIRT6 promotes osteogenic differentiation of mesenchymal stem cells through BMP signaling. Sci. Rep. 2017, 7, 10229–10238. [Google Scholar] [CrossRef] [Green Version]
  37. Nagele, P. Misuse of standard error of the mean (SEM) when reporting variability of a sample. A critical evaluation of four anaesthesia journals. Br. J. Anaesth. 2003, 90, 514–516. [Google Scholar] [CrossRef] [Green Version]
  38. Barde, M.P.; Barde, P.J. What to use to express the variability of data: Standard deviation or standard error of mean? Perspect Clin. Res. 2012, 3, 113–116. [Google Scholar] [CrossRef]
  39. Jaykaran, J. “Mean ± SEM” or “Mean (SD)”? Indian J. Pharmacol. 2010, 42, 329. [Google Scholar] [CrossRef]
  40. Gomez-Larrauri, A.; Gangoiti, P.; Camacho, L.; Presa, N.; Martin, C.; Gomez-Muñoz, A. Phosphatidic Acid Stimulates Lung Cancer Cell Migration through Interaction with the LPA1 Receptor and Subsequent Activation of MAP Kinases and STAT3. Biomedicines 2023, 11, 1804–1821. [Google Scholar] [CrossRef]
  41. Barbur, I.; Opris, H.; Colosi, H.A.; Baciut, M.; Opris, D.; Cuc, S.; Petean, I.; Moldovan, M.; Dinu, C.M.; Baciut, G. Improving the Mechanical Properties of Orthodontic Occlusal Splints Using Nanoparticles: Silver and Zinc Oxide. Biomedicines 2023, 11, 1965–1979. [Google Scholar] [CrossRef]
  42. Yue, F.; Cheng, Y.; Breschi, A.; Vierstra, J.; Wu, W.; Ryba, T.; Sandstrom, R.; Ma, Z.; Davis, C.; Pope, B.D.; et al. A comparative encyclopedia of DNA elements in the mouse genome. Nature 2014, 515, 355–364. [Google Scholar] [CrossRef] [Green Version]
  43. Zhao, X.; Xie, L.; Wang, Z.; Wang, J.; Xu, H.; Han, X.; Bai, D.; Deng, P. ZBP1 (DAI/DLM-1) promotes osteogenic differentiation while inhibiting adipogenic differentiation in mesenchymal stem cells through a positive feedback loop of Wnt/β-catenin signaling. Bone Res. 2020, 8, 12–21. [Google Scholar] [CrossRef]
  44. D’amico, R.; Cordaro, M.; Siracusa, R.; Impellizzeri, D.; Salinaro, A.T.; Scuto, M.; Ontario, M.L.; Crea, R.; Cuzzocrea, S.; Di Paola, R.; et al. Wnt/β-Catenin Pathway in Experimental Model of Fibromyalgia: Role of Hidrox®. Biomedicines 2021, 9, 1683–1693. [Google Scholar] [CrossRef]
  45. Chua, K.-H.; Safwani, W.K.Z.W.; Hamid, A.A.; Shuhup, S.K.; Haflah, N.H.M.; Yahaya, N.H.M. Retropatellar fat pad–derived stem cells from older osteoarthritic patients have lesser differentiation capacity and expression of stemness genes. Cytotherapy 2014, 16, 599–611. [Google Scholar] [CrossRef]
  46. Chen, Q.; Zhou, H.; Hu, P. Stemness distinctions between the ectomesenchymal stem cells from neonatal and adult mice. Acta Histochem. 2017, 119, 822–830. [Google Scholar] [CrossRef] [PubMed]
  47. Tratwal, J.; Rojas-Sutterlin, S.; Bataclan, C.; Blum, S.; Naveiras, O. Bone marrow adiposity and the hematopoietic niche: A historical perspective of reciprocity, heterogeneity, and lineage commitment. Best Pr. Res. Clin. Endocrinol. Metab. 2021, 35, 101564–101582. [Google Scholar] [CrossRef] [PubMed]
  48. Angelopoulos, I.; Brizuela, C.; Khoury, M. Gingival Mesenchymal Stem Cells Outperform Haploidentical Dental Pulp-derived Mesenchymal Stem Cells in Proliferation Rate, Migration Ability, and Angiogenic Potential. Cell Transplant. 2018, 27, 967–978. [Google Scholar] [CrossRef] [PubMed] [Green Version]
  49. Dhanasekaran, M.; Indumathi, S.; Lissa, R.P.; Harikrishnan, R.; Rajkumar, J.S.; Sudarsanam, D. A comprehensive study on optimization of proliferation and differentiation potency of bone marrow derived mesenchymal stem cells under prolonged culture condition. Cytotechnology 2013, 65, 187–197. [Google Scholar] [CrossRef] [PubMed] [Green Version]
  50. Snippert, H.J.; Clevers, H. Tracking adult stem cells. EMBO Rep. 2011, 12, 113–122. [Google Scholar] [CrossRef] [Green Version]
  51. Baustian, C.; Hanley, S.; Ceredig, R. Isolation, selection and culture methods to enhance clonogenicity of mouse bone marrow derived mesenchymal stromal cell precursors. Stem Cell Res. Ther. 2015, 6, 151–163. [Google Scholar] [CrossRef] [PubMed]
Figure 1. Schematic diagram of the whole research process.
Biomedicines 11 02190 g001
Figure 2. The stemness of freshly isolated (Fresh) PαS cells representative in vivo was superior to that of P0 PαS cells in vitro. (A,B) Fresh PαS cells from C57/6N mice were obtained by FACS. (C) Relative expression of Nanog, Oct4, and Sox2 mRNA was evaluated by qRT-PCR in fresh and P0 PαS cells. Gapdh was used for normalization. (D) Relative expression of NANOG and OCT4 protein was evaluated by ELISA in fresh and P0 PαS cells. (E) Relative expression of Pdgfrα and Sca-1 mRNA was evaluated by qRT-PCR in fresh and P0 PαS cells. Gapdh was used for normalization. (F,H,I) Ectopic bone formation of fresh and P0 PαS cells in vivo was evaluated by H&E, Masson’s trichome, and IHC-OCN staining assays. Scale bar = 100 μm, n = 3. (G) Quantitative analysis of new lamellar bone by H&E staining of fresh and P0 PαS cells. Data are represented as mean ± SD of three independent experiments. * p < 0.05; ** p < 0.01; *** p < 0.001, Student’s t-test and one-way ANOVA. P0, passage 0; FACS, fluorescence activated cell sorting; Gapdh, glyceraldehyde 3-phosphate dehydrogenase; OCT4, organic cation/carnitine transporter4; NANOG, nanog homeobox; Sox2, sex determining region Y-box 2; ELISA, enzyme linked immunosorbent assay; Pdgfrα, platelet derived growth factor receptor, alpha polypeptide; qRT-PCR, quantitative reverse transcription polymerase chain reaction; H&E, hematoxylin and eosin; IHC, immunohistochemical; OCN, osteocalcin; ANOVA, analysis of variance.
Biomedicines 11 02190 g002
Figure 3. Proliferative capacity and expression of stemness genes and cell-surface markers in PαS cells decreased gradually from P0 to P4 in vitro. (A,C) Results of a single-cell clone formation assay for PαS cells from P0 to P4 in vitro. (B,D) Results of a multicellular clone formation assay for PαS cells from P0 to P4 in vitro. (E) Relative OD value of the CCK8 assay (%) for PαS cells from P0 to P4 in vitro. (F) Relative expression of Nanog, Oct4, and Sox2 mRNA was evaluated by qRT-PCR in PαS cells from P0 to P4 in vitro. Gapdh was used for normalization. (G) Relative expression of OCT4 protein was evaluated by ELISA in PαS cells from P0 to P4 in vitro. (H) Relative expression of Pdgfrα and Sca-1 mRNA was evaluated by qRT-PCR in PαS cells from P0 to P4 in vitro. Gapdh was used for normalization. Data are represented as mean ± SD of three independent experiments. * p < 0.05; ** p < 0.01; *** p < 0.001; ns p > 0.05, Student’s t-test and one-way ANOVA. P0, passage 0; P4, passage 4; OD, optical density; CCK8, cell counting kit-8; Oct4, organic cation/carnitine transporter4; Nanog, nanog homeobox; Sox2, sex determining region Y-box 2; Gapdh, glyceraldehyde 3-phosphate dehydrogenase; ELISA, enzyme linked immunosorbent assay; Pdgfrα, platelet derived growth factor receptor, alpha polypeptide; qRT-PCR, quantitative reverse transcription polymerase chain reaction; ANOVA, analysis of variance.
Biomedicines 11 02190 g003
Figure 4. The osteogenic and chondrogenic differentiation capacity of PαS cells decreased gradually from P0 to P4 in vivo. (AC) Ectopic bone formation of PαS cells from P0 to P4 in vivo was evaluated by H&E, Masson’s trichome, and IHC-OCN staining assays. Scale bar = 100 μm, n = 3. (D,E) Ectopic cartilage formation of PαS cells from P0 to P4 in vivo was evaluated by Alcian blue and Sirius red staining assays. Scale bar = 100 μm, n = 3. P0, passage 0; P4, passage 4; H&E, hematoxylin and eosin; IHC, immunohistochemical; OCN, osteocalcin.
Biomedicines 11 02190 g004
Figure 5. Overexpression of Bhlhe40 promoted proliferation, expression of stemness genes, and cell surface markers in PαS cells in vitro. (A) Relative expression of Bhlhe40 mRNA was evaluated by qRT-PCR in fresh and P0 PαS cells. Gapdh was used for normalization. (B) Relative expression of Bhlhe40 mRNA was evaluated by qRT-PCR in PαS cells from P0 to P4 in vitro. Gapdh was used for normalization. (C) Relative expression of Bhlhe40 mRNA in overexpressed-Bhlhe40 (Bhlhe40) group and negative control (Vector) group in vitro was evaluated by qRT-PCR. Gapdh was used for normalization. (D,E) Results of a single-cell clone formation assay for Bhlhe40 group and Vector group in vitro. (F,G) Results of a multicellular clone formation assay for Bhlhe40 group and Vector group in vitro. (H) Relative OD value of the CCK8 assay (%) for Bhlhe40 group and Vector group in vitro. (I) Relative expression of NANOG and OCT4 protein was evaluated by ELISA in Bhlhe40 group and Vector group in vitro. (J) Relative expression of Nanog, Oct4, and Sox2 mRNA was evaluated by qRT-PCR in Bhlhe40 group and Vector group in vitro. Gapdh was used for normalization. (K) Relative expression of Pdgfrα and Sca-1 mRNA was evaluated by qRT-PCR in Bhlhe40 group and Vector group in vitro. Gapdh was used for normalization. Data are represented as mean ± SD of three independent experiments. * p < 0.05; ** p < 0.01; *** p < 0.001, ns p > 0.05, Student’s t-test and one-way ANOVA. P0, passage 0; P4, passage 4; OD, optical density; CCK8, cell counting kit-8; Oct4, organic cation/carnitine transporter4; Nanog, nanog homeobox; Sox2, sex determining region Y-box 2; Gapdh, glyceraldehyde 3-phosphate dehydrogenase; ELISA, enzyme linked immunosorbent assay; Pdgfrα, platelet derived growth factor receptor, alpha polypeptide; qRT-PCR, quantitative reverse transcription polymerase chain reaction; ANOVA, analysis of variance.
Biomedicines 11 02190 g005
Figure 6. Overexpression of Bhlhe40 promoted osteogenic and chondrogenic differentiation of PαS cells in vivo and in vitro. (A,B) ALP staining and activity of overexpressed Bhlhe40 (Bhlhe40) group and negative control (Vector) group in vitro. (C,D) ARS staining and quantification of Bhlhe40 group and Vector group in vitro. (E) Relative expression of Alp and Runx2 mRNA was evaluated by qRT-PCR in Bhlhe40 group and Vector group in vitro after 7 days of osteogenic differentiation. Gapdh was used for normalization. (F) Relative expression of Bglap and Col1a1 mRNA was evaluated by qRT-PCR in Bhlhe40 group and Vector group in vitro after 14 days of osteogenic differentiation. Gapdh was used for normalization. (G) Relative expression of BGLAP protein was evaluated by ELISA in Bhlhe40 group and Vector group in vitro after 14 days of osteogenic differentiation. (H) Alcian blue staining in well plate of Bhlhe40 group and Vector group in vitro after 21 days of chondrogenic differentiation. Scale bar = 500 μm, n = 3. (I,J) Alcian blue and Sirius red staining of chondrosphere sections of Bhlhe40 group and Vector group in vitro after 21 days of chondrogenic differentiation. Scale bar = 100 μm, n = 3. (K) Relative expression of Acan, Comp, and Sox9 mRNA was evaluated by qRT-PCR in Bhlhe40 group and Vector group in vitro after 21 days of chondrogenic differentiation. Gapdh was used for normalization. (L) Relative expression of COMP protein was evaluated by ELISA in Bhlhe40 group and Vector group in vitro after 21 days of chondrogenic differentiation. (MO) Ectopic bone formation in Bhlhe40 group and Vector group in vivo was evaluated by H&E, Masson’s trichome, and IHC-OCN staining assays. Scale bar = 100 μm, n = 3. Data are represented as mean ± SD of three independent experiments. * p < 0.05; ** p < 0.01, Student’s t-test and one-way ANOVA. ALP, alkaline phosphatase; ARS, alizarin red S; Runx2, runt-related transcription factor 2; Col1a1, collagen, type I, alpha 1; Acan, aggrecan; Sox9, sex determining region Y-box 9; BGLAP, bone gamma-carboxyglutamate (gla) protein; COMP, cartilage oligomeric matrix protein; Gapdh, glyceraldehyde 3-phosphate dehydrogenase; ELISA, enzyme linked immunosorbent assay; qRT-PCR, quantitative reverse transcription polymerase chain reaction; H&E, hematoxylin and eosin; IHC, immunohistochemical; OCN, osteocalcin; ANOVA, analysis of variance.
Biomedicines 11 02190 g006
Figure 7. BHLHE40 maintains the stemness of PαS cells by activating Zbp1. (A) BHLHE40 ChIP-Seq data analysis of C57 mouse cells. The blue shaded part indicates the Zbp1 enriched region obtained by peak calling. (B) ChIP-qPCR results show BHLHE40 bound to Zbp1 at the promoter region from 457 to 352 bases in overexpressed Bhlhe40 (Bhlhe40) group compare to negative control (Vector) group. (C) Relative expression of Zbp1 mRNA was evaluated by qRT-PCR in Bhlhe40 group and Vector group in vitro. Gapdh was used for normalization. (D) Relative expression of Zbp1 mRNA was evaluated by qRT-PCR in Bhlhe40 group and Vector group transfected with siZbp1 and siNC, respectively. Gapdh was used for normalization. (E,F) ARS staining and quantification of Bhlhe40 group and Vector group transfected with siZbp1 and siNC after 14 days of osteogenic differentiation, respectively. (G) Relative expression of BGLAP protein was evaluated by ELISA in Bhlhe40 + siNC group and Bhlhe40 + siZbp1 in vitro after 14 days of osteogenic differentiation. (H) Alcian blue staining in well plates of Bhlhe40 + siNC group and Bhlhe40 + siZbp1 group after 21 days chondrogenic differentiation. Scale bar = 100 μm and 500 μm, n = 3. (I) Relative expression of COMP protein was evaluated by ELISA in Bhlhe40 + siNC group and Bhlhe40 + siZbp1 in vitro after 21 days of chondrogenic differentiation. (J) Relative expression of Nanog and Oct4 mRNA was evaluated by qRT-PCR in Bhlhe40 group and Vector group transfected with siZbp1 and siNC, respectively. Gapdh was used for normalization. (K) Relative expression of NANOG and OCT4 protein was evaluated by ELISA in Bhlhe40 + siNC group and Bhlhe40 + siZbp1 in vitro. Data are represented as mean ± SD of three independent experiments. * p < 0.05; ** p < 0.01; *** p < 0.001, Student’s t-test and one-way ANOVA. BHLHE40, basic helix–loop–helix family member E40; ChIP-Seq, chromatin immunoprecipitation sequencing; ARS, alizarin red S; Gapdh, glyceraldehyde 3-phosphate dehydrogenase; siZbp1, small interfering Z-DNA binding protein 1; siNC, short interfering negative control; qRT-PCR, quantitative reverse transcription polymerase chain reaction; ELISA, enzyme linked immunosorbent assay; BGLAP, bone gamma carboxyglutamate protein; COMP, cartilage oligomeric matrix protein; Nanog, nanog homeobox; OCT4, organic cation/carnitine transporter4; ANOVA, analysis of variance.
Biomedicines 11 02190 g007
Figure 8. BHLHE40 regulates the stemness of PαS cells through Wnt/β-catenin signaling pathway. (A) Relative expression of Ccnd1, Ctnnb1, and Wnt3a mRNA was evaluated by qRT-PCR in overexpressed Bhlhe40 (Bhlhe40) group and negative control (Vector) group in vitro. Gapdh was used for normalization. (B) Relative expression of Wnt3a, and Ccnd1 mRNA was evaluated by qRT-PCR in Bhlhe40 group and Vector group transfected with siZbp1 and siNC, respectively. Gapdh was used for normalization. (C,D) ARS staining and quantification of Bhlhe40 group and Bhlhe40 + IWR-1-endo group in vitro after 14 days of osteogenic differentiation. (E) Relative expression of BGLAP protein was evaluated by ELISA in Bhlhe40 group and Bhlhe40 + IWR-1-endo group in vitro after 14 days of osteogenic differentiation. (F) Alcian blue staining in well plates of Bhlhe40 group and Bhlhe40 + IWR-1-endo group after 21 days of chondrogenic differentiation. Scale bar = 100 μm and 500 μm, n = 3. (G) Relative expression of COMP protein was evaluated by ELISA in Bhlhe40 group and Bhlhe40 + IWR-1-endo in vitro after 21 days of chondrogenic differentiation. (H) Relative expression of Nanog, Oct4, and Sox2 mRNA was evaluated by qRT-PCR in Bhlhe40 group and Bhlhe40+IWR-1-endo group in vitro. Gapdh was used for normalization. (I) Relative expression of NANOG and OCT4 protein was evaluated by ELISA in Bhlhe40 + IWR-1-endo group and Vector group in vitro. Data are represented as mean ± SD of three independent experiments. * p < 0.05; ** p < 0.01, Student’s t-test and one-way ANOVA. BHLHE40, basic helix–loop–helix family member E40; Wnt3a, wingless-type MMTV integration site family, member 3A; Ctnnb1, cadherin associated protein, beta 1; Ccnd1, cyclin D1; ARS, alizarin red S; Gapdh, glyceraldehyde 3-phosphate dehydrogenase; siZbp1, small interfering Z-DNA binding protein 1; siNC, short interfering negative control; qRT-PCR, quantitative reverse transcription polymerase chain reaction; ELISA, enzyme linked immunosorbent assay; BGLAP, bone gamma carboxyglutamate protein; COMP, cartilage oligomeric matrix protein; Nanog, nanog homeobox; Sox2, sex determining region Y-box 2; OCT4, organic cation/carnitine transporter4; ANOVA, analysis of variance.
Biomedicines 11 02190 g008
Table 2. BHLHE40 may bind to candidate target genes related to stemness.
GeneChrScore of SignificanceRegion
Chd7chr4406.97581genebody
Mettl3chr1426.26893promoter
Foxo3chr10352.03472promoter
Foxp1chr684.28053promoter
Kdm4cchr428.58553genebody
Kdm3achr623.25266promoter
Kdm2bchr527.44679promoter
Zbp1chr276.28664promoter
Kdm6achrX83.51532promoter
Kdm1achr42.56084promoter
Cdk6chr53.24094promoter
P2rx7chr526.09183promoter
Hoxc10chr1529.97397promoter
Smad3chr9105.85294promoter
Hdac4chr1106.92581promoter
Tet2chr3210.94673promoter
Sirt1chr10164.0141promoter
Disclaimer/Publisher’s Note: The statements, opinions and data contained in all publications are solely those of the individual author(s) and contributor(s) and not of MDPI and/or the editor(s). MDPI and/or the editor(s) disclaim responsibility for any injury to people or property resulting from any ideas, methods, instructions or products referred to in the content.

