Article

Effects of Monoamino-Oxidase-A (MAO-A) Inhibition on Skeletal Muscle Inflammation and Wasting through Pancreatic Ductal Adenocarcinoma in Triple Transgenic Mice

1
Anatomy and Cell Biology, Department of Medical Cell Biology, University of Marburg, 35032 Marburg, Germany
2
Department of Visceral-, Thoracic- and Vascular Surgery, Philipps University Marburg, 35043 Marburg, Germany
*
Author to whom correspondence should be addressed.
Current address: Department of Anaesthesiology and Intensive Care Medicine, University Hospital Marburg, Philipps University of Marburg, 35043 Marburg, Germany.
Current address: Clinic of General, Visceral and Pediatric Surgery, University Medical Center Göttingen, 37075 Göttingen, Germany.
§
Current address: Clinic for Endocrine Surgery, Schön Klinik Hamburg, 22081 Hamburg, Germany.
These authors contributed equally to this work.
Biomedicines 2023, 11(3), 912; https://doi.org/10.3390/biomedicines11030912
Submission received: 15 December 2022 / Revised: 8 March 2023 / Accepted: 10 March 2023 / Published: 15 March 2023
(This article belongs to the Special Issue Mechanisms and Novel Therapeutic Approaches for Muscle Disease)

Abstract

:
Cancer cachexia describes a syndrome of muscle wasting and lipolysis that is still largely untreatable and negatively impacts prognosis, mobility, and healthcare costs. Since upregulation of skeletal muscle monoamine-oxidase-A (MAO-A), a source of reactive oxygen species, may contribute to cachexia, we investigated the effects of the MAO-inhibitor harmine-hydrochloride (HH, intraperitoneal, 8 weeks) on muscle wasting in a triple-transgenic mouse model of pancreatic ductal adenocarcinoma (PDAC) and wild type (WT) mice. Gastrocnemius and soleus muscle cryo-cross-sections were analyzed for fiber type-specific cross-sectional area (CSA), fraction and capillarization using ATPase- and lectin-stainings. Transcripts of pro-apoptotic, -atrophic, and -inflammatory signals were determined by RT-qPCR. Furthermore, we evaluated the integrity of neuromuscular junction (NMJ, pre-/post-synaptic co-staining) and mitochondrial ultrastructure (transmission electron microscopy). MAO-A expression in gastrocnemius muscle was increased with PDAC vs. WT (immunohistochemistry: p < 0.05; Western blot: by trend). PDAC expectedly reduced fiber CSA and upregulated IL-1β in both calf muscles, while MuRF1 expression increased in soleus muscle only. Although IL-1β decreased, HH caused an additional 38.65% (p < 0.001) decrease in gastrocnemius muscle (IIBX) fiber CSA. Moreover, soleus muscle CSA remained unchanged despite the downregulation of E3-ligases FBXO32 (p < 0.05) and MuRF1 (p < 0.01) through HH. Notably, HH significantly decreased the post-synaptic NMJ area (quadriceps muscle) and glutathione levels (gastrocnemius muscle), thereby increasing mitochondrial damage and centronucleation in soleus and gastrocnemius type IIBX fibers. Moreover, although pro-atrophic/-inflammatory signals are reversed, HH unfortunately fails to stop and rather promotes PDAC-related muscle wasting, possibly via denervation or mitochondrial damage. These differential adverse vs. therapeutic effects warrant studies regarding dose-dependent benefits and risks with consideration of other targets of HH, such as the dual-specificity tyrosine phosphorylation regulated kinases 1A and B (DYRK1A/B).

1. Introduction

Cachexia describes a complex inflammatory, catabolic syndrome that is highly prevalent in chronic diseases, such as cancer and manifests itself by wasting of skeletal muscle with or without loss of fat mass [1,2], both of which cannot be compensated for by food intake [3]. Cachexia has a massively negative impact on the patients’ quality of life [1,4,5] and imposes high costs on healthcare systems [6,7]. Despite multiple therapeutic approaches, including nutrition, exercise, anti-inflammatory drugs, such as NSAID, megestrol, or cannabis [8,9,10,11,12,13], a causal treatment does not exist until now.
Although cachexia is a multi-organ syndrome [14], the role of skeletal muscle tissue during its development is crucial. Cachectic patients show a dramatic decrease in life expectancy [15], which is aggravated by the occurrence of obesity and occult muscle loss [16,17]. On a histological level, a wide range of human and animal studies, including pancreatic, lung, and colon cancer, show that a loss of fiber types I and II cross-sectional area (CSA) is the main feature of muscle wasting, in addition to altered myofibrillar structure, local apoptosis, or impaired regeneration, and, in some cases, fiber-type transition [4,18,19,20,21,22,23]. Thereby, fiber atrophy is found in comparison to both healthy controls and non-cachectic tumor-bearing animals or humans. This phenotype varies widely between muscle and fiber type, the entity, mass, or inoculation site of tumor, and the definition and stage of cachexia, among other factors [18,24,25,26,27,28,29].
Oxidative stress is considered to be a major factor of muscle wasting [30,31]. In glucocorticoid-induced proteolysis, gene expression of monoamine oxidase A (MAO-A) is upregulated in skeletal muscle, and thus leads to an increased production of H2O2 and related reactive oxygen species (ROS) [32]. In several studies on cardiac and skeletal muscle, ROS have been shown to induce mitochondrial damages, apoptosis, fibrosis, etc. [33,34,35,36,37].
Since to date, the impact of MAO-derived ROS on cancer cachexia has remained unclear, we presently aimed to evaluate for the first time the expression of MAO-A protein and the effect of MAO-A inhibition in cancer-related muscle wasting. Since PDAC is clinically associated with the highest incidence and most rapid progression of cachexia as a major contributor to this 4th and 5th leading cause of cancer-associated death [14,38,39,40,41,42,43], we chose a mouse model of orthotopic PDAC established by Hingurani et al. [44]. It is based on the 3x-transgenig KrasG12D/+; LSL-Trp53R172H/+; Pdx-1-Cre (KPC) mutants (Kras: Kirsten Rat Sarcoma, Trp53: Transformation-related protein 53, Pdx-1-Cre: Pancreatic and duodenal homeobox 1-cyclization recombination) and commonly utilized for PDAC research and preclinical therapeutic testing, since it mimics well clinical features of human PDAC, such as metastatic pattern (liver 80%, lung 50–60%, adrenal gland 20%, and peritoneum 20–30%), ascites and, importantly, of cachexia development [44,45,46]. Moreover, it recapitulates the mutant-based cancerogenesis from pancreatic intraepithelial neoplasia (PanIN) stages 1–3 to PDAC [44,45,47,48], with a PDAC incidence of 96.3% [44]. According to a previous study of our group, this KPC model develops a likely inflammation-driven fiber atrophy in both, ‘red’ (soleus) and ‘white’ (gastrocnemius) muscle [49]. This muscle wasting coincides with the completion of cancerogenesis and occurs in the absence of altered integrity of mitochondrial ultrastructure or neuromuscular junction (NMJ).
Using this KPC mouse model, we presently evaluated the effect of MAO inhibition via the β-carboline alkaloid harmine-hydrochloride (HH), a competitive and selective MAO-A inhibitor [50,51,52] on cancer-related muscle wasting, with regard to histomorphometry of fiber types, pro-inflammatory, -atrophic, and -apoptotic gene expression, capillarization, NMJ, intramyocellular glutathione (GSH) content and redox state, and relevant transcripts. In addition, the effect of this therapeutic approach was assessed in WT mice without cachexia. The study focused on the hindlimb muscles as commonly performed in the field of cancer- or other disease-related cachexia [4,18,31,49] and evaluated the mixed slow-twitch (‘red’) soleus muscle (containing fiber types I, IIA, and IIBX) as well as the fast-twitch (‘white’) gastrocnemius or quadriceps muscle, which predominantly consists of type IIBX fibers.

2. Material and Methods

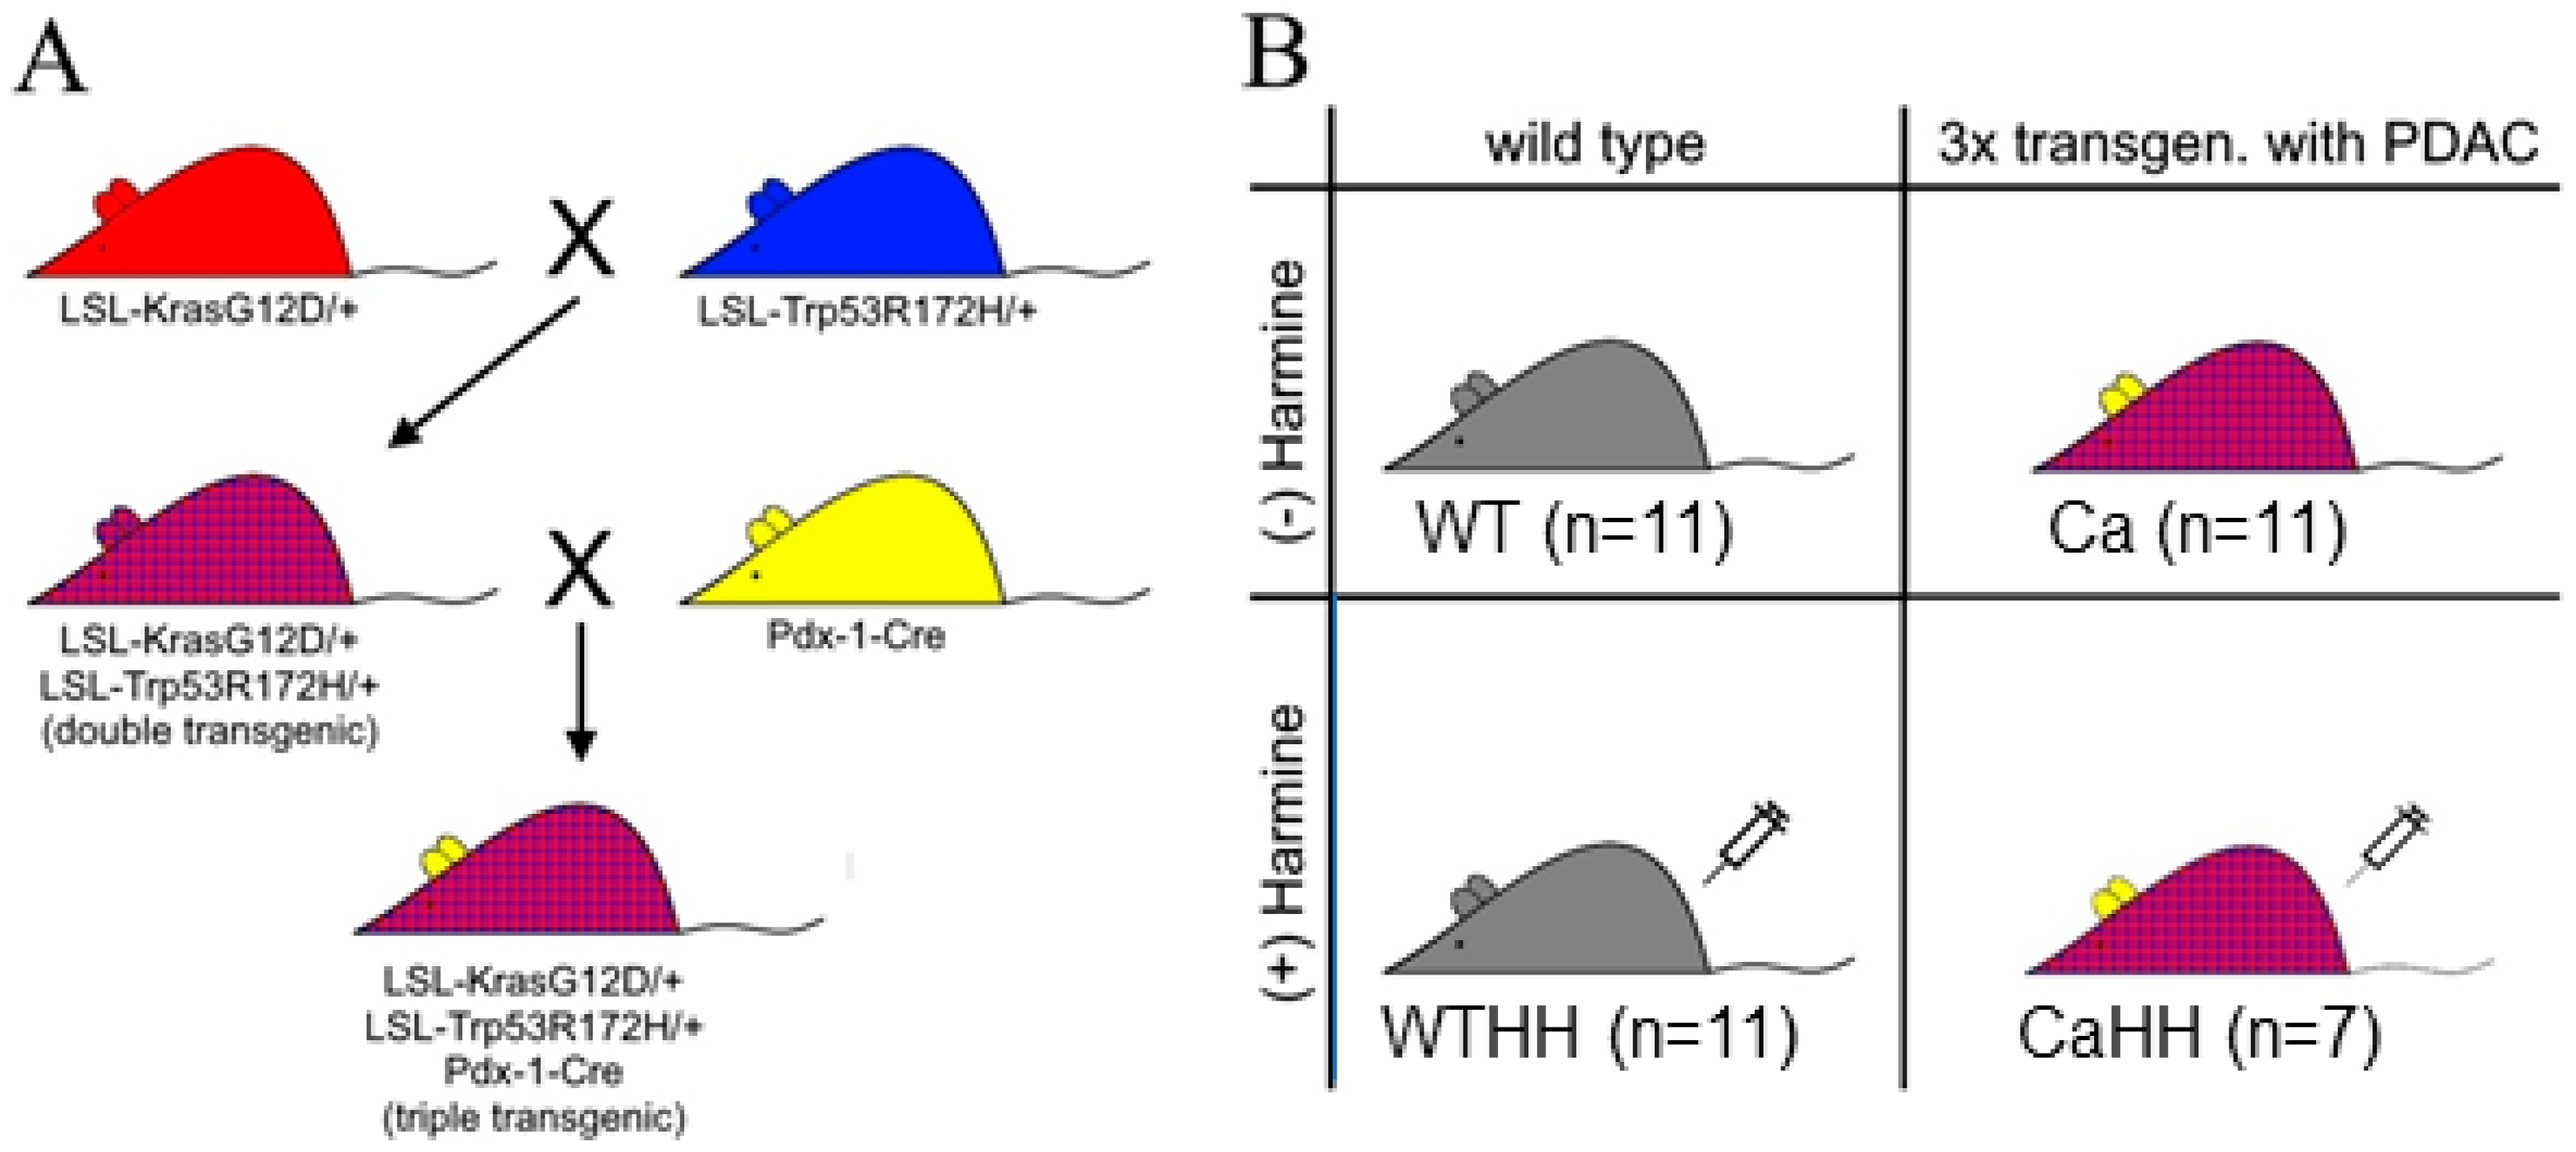
2.1. Tumor Mouse Model

The present study used a triple transgenic mouse model of PDAC first described by Hingorani et al. [45]. It is based on three mutations—Trp53, Kras, and Pdx-1-Cre (Figure 1)—and largely recapitulates the development of PDAC in humans [45]. Mice were cross-bred by the Biomedical Research Centre of the University of Marburg and received food and water ad libitum with a periodic day-night cycle of 12 h. At the age of 3 months, each group of triple transgenic and wild type (WT) mice was treated intraperitoneally with HH (30 mg/kg/day) for 2 months.
After the treatment, the mice were sacrificed by cervical dislocation and the right triceps surae (i.e., gastrocnemius, soleus, and plantaris muscle) as well as the quadriceps muscle were removed and snap-frozen in liquid nitrogen-cooled isopentane. Small samples of gastrocnemius and soleus muscles were fixed for transmission electron microscopy (TEM) as previously described [49]. The post-mortem histopathological diagnosis of PDAC was made by two independent experienced investigators, and triple transgenic mice without PDAC were excluded from the study. In addition, WT mice were assessed for normal pancreatic histology. The study was approved by the Regional Commission Giessen (MR 20/11-Nr.70/2009) and performed in compliance with the regulations for animal experiments at the Philipps-University Marburg.

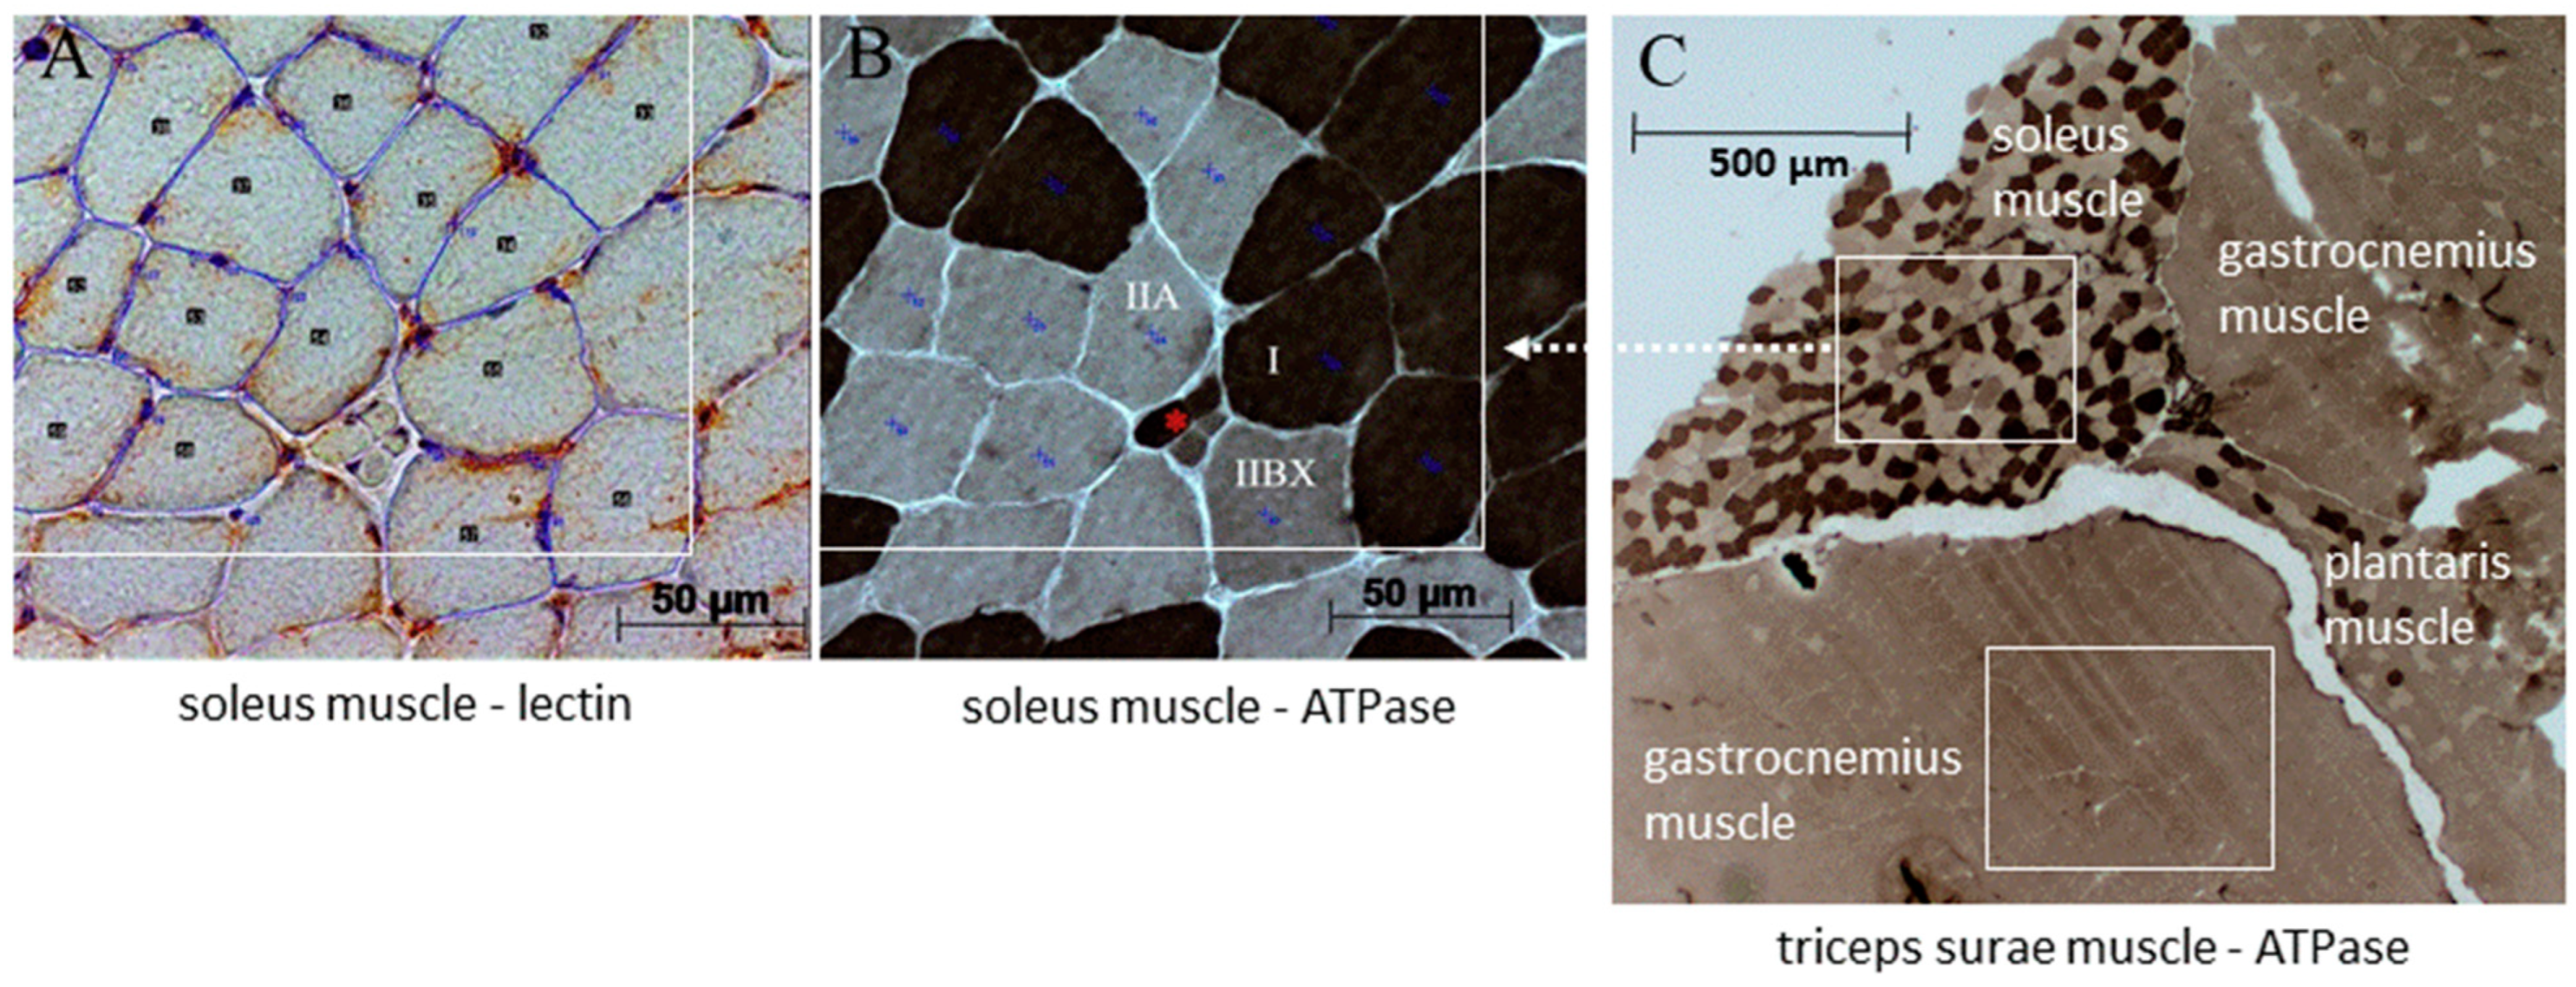
2.2. Histological Examination

For lectin-staining [53], cross-sections (8 μm) of snap-frozen gastrocnemius and soleus muscles were cut in a cryostat, fixed in 4% paraformaldehyde/phosphate-buffered saline (PFA/PBS) for 10 min at room temperature. Hydrogen peroxide (0.05% in PBS; pH 7.4) was used to block endogenous peroxidases. Then, cross-sections were incubated (30 min; 37 °C) with 40 μg/mL horseradish-peroxidase conjugated Isolectin B4 of Bandeiraea simplicifolia (BSI–B4) (Merck-Sigma-Aldrich Co. LLC, St. Louis, MO, USA) in PBS. A negative control with D-Galactose was performed. Thereafter, cross-sections were washed with PBS, incubated in a solution of 25 mg 3-3′-diaminobenzidine (Merck-Sigma), 50 µL hydrogen peroxide 30%, solved in 100 mL PBS, rinsed with PBS, and immediately counterstained with Mayer’s hematoxylin (Carl Roth GmbH, Karlsruhe, Germany).
Fiber types I, IIA, and IIBX were identified according to the acid-sensitive activity of their adenosine triphosphatase (ATPase) in unfixed serial cross-sections (8 μm), as previously described [54,55] (Figure 2). Microscopic images of the ATPase- and lectin-stained cross-sections were recorded using an Axio Imager M2 microscope (Carl Zeiss GmbH, Oberkochen, Germany) including the high-resolution imaging system Axio-Cam HRc/AxioVision Rel. 4.8 (Carl Zeiss GmbH). After ATPase-staining or lectin-staining, serial cross-sections with at least 100 fibers were selected and edged by a rectangle (region of interest—ROI) (Figure 2A,B). Only fibers with a cross-sectional area (CSA) >50% within the ROI were examined. Histomorphological parameters assessed were fiber-type-specific CSA, minimal Feret diameter (minFeret), fraction of total fiber population, capillary contacts, and centronucleation. For capillary density, only capillaries inside the rectangle were considered. For fiber-capillary contacts, all capillaries around the fibers were considered. Image analyses were performed using the ImageJ/Fiji (National Institute of Health, Bethesda, MD, USA a.o.). Analyses in the gastrocnemius muscle were limited to its large homogenous ‘white’ (i.e., superficial) area consisting of type IIBX only, since its soleus muscle-adjacent portion may variably contain type IIA, and sometimes type I fibers (Figure 2C).
For immunohistochemistry of MAO-A expression, gastrocnemius muscle cryo-cross-sections were fixed by 5% paraformaldehyde (10 min), blocked with bovine serum albumin (BSA), and incubated with MAO-A monoclonal rabbit IgG antibody (Abcam, Cambridge, UK; 1:100) detected by an anti-rabbit secondary antibody that was conjugated with horseradish peroxidase (HRP) for metabolization of 3,3′-diaminobenzidine (DAB) with H2O2 as chromogene substrate. Nuclei were counterstained with Mayer’s hematoxylin (Carl Roth GmbH, Germany). In digital images (200×) obtained by the Zeiss Axio Imager.M2 microscope (Carl Zeiss AG; Oberkochen, Germany) combined with Axio-Cam HRc/AxioVision (Carl Zeiss GmbH), the MAO-A positive area in terms of percentage of intact muscle tissue was quantified in two representative areas with >150 type IIBX fibers using ImageJ/Fiji.
To evaluate NMJ integrity (innervation status) in quadriceps muscle, every 6th out of 60 serial cryo-cross-sections (8 µm), i.e., 10 cross-sections per mouse were used for pre- and post-synaptic NMJ co-staining in subgroups (n = 5 WT, n = 4 PDAC, n = 5 WT with HH and n = 5 PDAC with HH). After fixation with 4% PFA/PBS and block by 1% BSA/PBS for 30 min, PBS-washed cross-sections were incubated in a humidified chamber overnight with biotin-XX-conjugated α-bungarotoxin (BTX, 1:500; Invitrogen, Eugene, OR 97402, USA) for post-synaptic staining, and an antibody against the vesicular acetylcholine transporter (vAChT antibody (1:1000, Lee Eiden, 80259, Lot No.: bl. 6/97) for pre-synaptic staining. After washing, cross-sections were incubated for 2 h with Cy3-conjugated streptavidin (1:200, Dianova GmbH, Hamburg, Germany) or Alexa Fluor®488 labeled donkey anti-rabbit IgG (1:200, MoBiTec GmbH, Göttingen, Germany) for the detection of BTX and vAChT antibodies, respectively. Slides were mounted using Immu-Mount™ (Fisher Scientific GmbH, Schwerte, Germany) and glass coverslips. Cross-sections were treated identically except for incubation with BTX or the primary vAChT antibodies served as controls. Con-focal images were collected with a C2 system on an Eclipse Ti2 inverted microscope (Ni-kon GmbH, Düsseldorf, Germany) using the software NIS-Elements AR 4.30.01 (Nikon GmbH). Each NMJ was scanned in a 630-fold magnification at 250 Hz with an image size of 1024 × 1024 pixels. Subsequently, Fiji software was used for morphometrical analysis, determining the BTX and vAChT immunolabeled areas, as well as their overlap area.
To assess the NMJ density of BTX+ post-synapses, every 7th cross-section was treated for 10 min with 3% H2O2 to block endogenous peroxidases, and thereafter, post-synaptic NMJ were detected by incubation with biotin-XX-conjugated α-BTX and horseradish peroxidase (HRP)-conjugated streptavidin (Jackson ImmunoResearch Laboratories. Inc., West Grove, PA, USA) using DAB as a chromogen substrate. Nuclei were counterstained with Mayer’s hematoxylin (Carl Roth GmbH, Germany). NMJ count per area was determined in digital images (200-fold magnification) obtained by the Zeiss Axio Imager.M2 microscope combined with Axio-Cam HRc/AxioVision.

2.3. Mitochondrial Ultrastructure

Using TEM, the ultrastructural integrity of gastrocnemius and soleus muscle mitochondria was studied at 25,000-fold magnification as previously described [56], in 5–8 mice per WT, Ca, WTHH, or CaHH group and >10 images per animal. Mitochondrial ultrastructure was categorized as ‘damaged’ in the case of >50% loss of the cristae, and/or >50% disruption of the outer membrane, or as ‘normal’ otherwise. The ‘damaged’ fractions (%) of each muscle were compared between the groups.

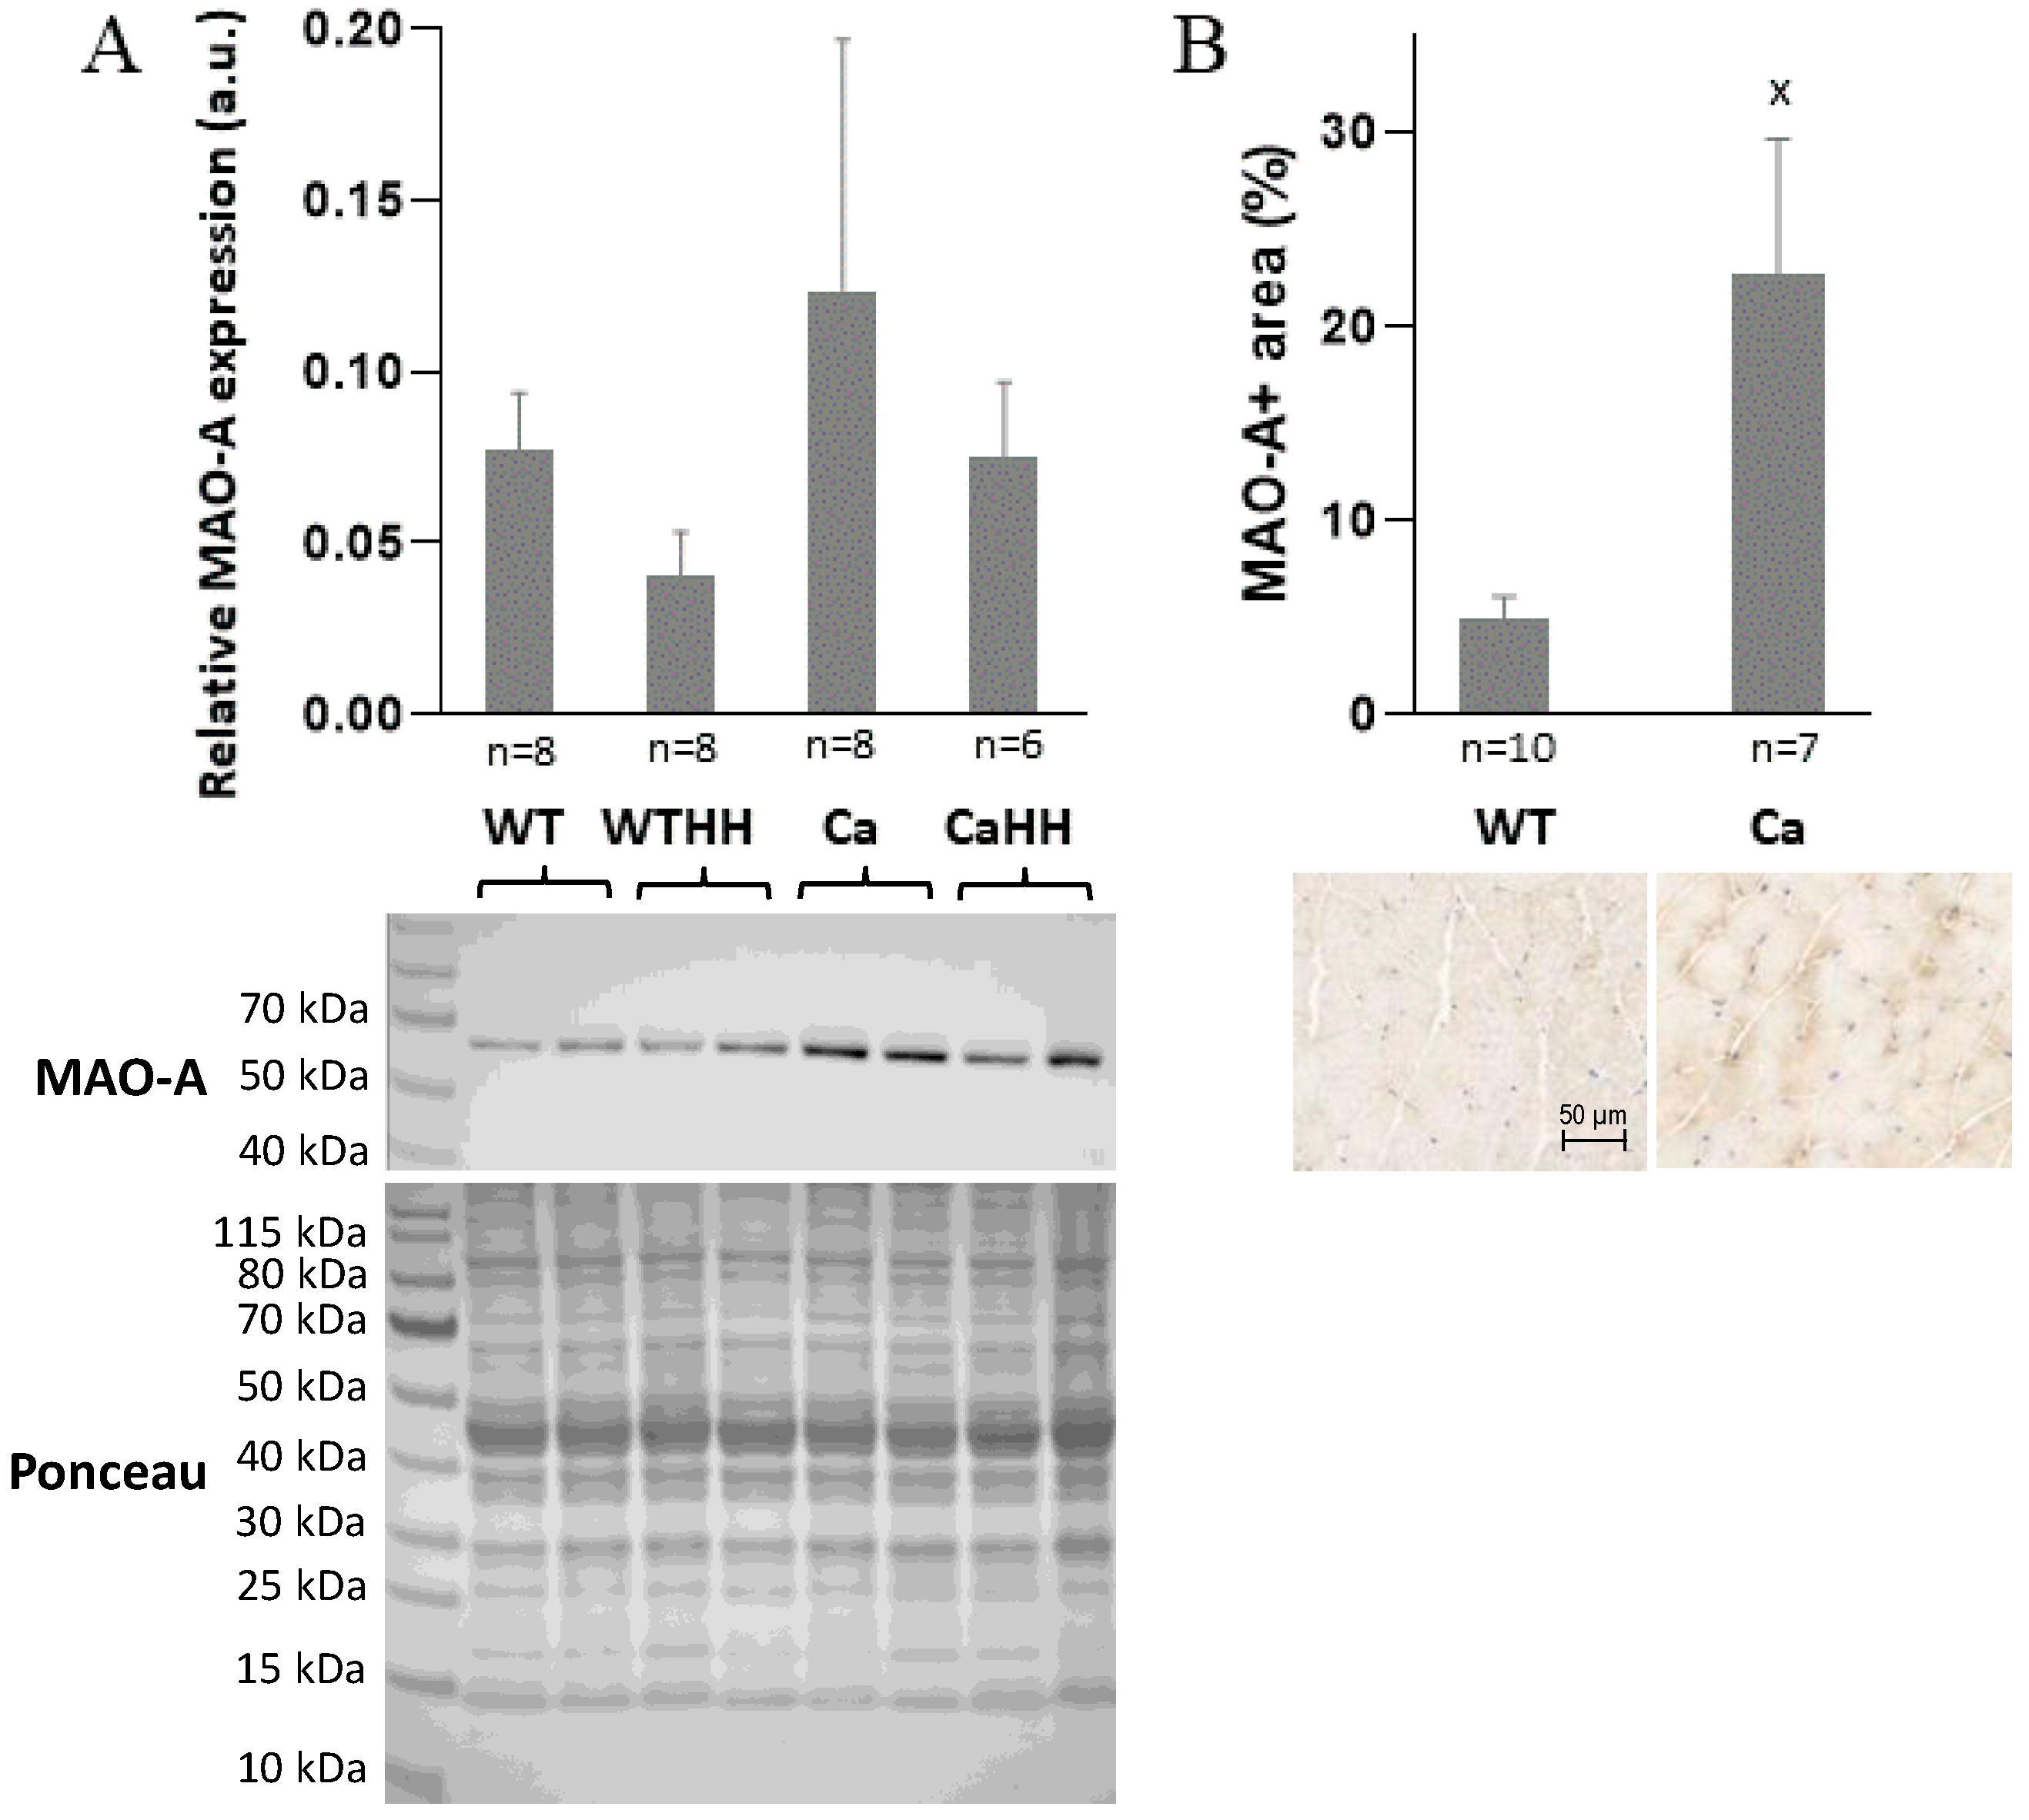
2.4. Western Blotting of MAO-A Expression

Gastrocnemius samples were lysed using RIPA (radioimmunoprecipitation assay) buffer pH 7.5 (Cell Signaling Technology Europa, Leiden, The Netherlands), containing the protease/phosphatase inhibitor cocktail (Cell Signaling Technology, Boston, MA, USA). The total protein concentrations were determined using the Pierce BCA assay (bicinchoninic acid) (Thermo Scientific, Rockford, IL, USA) according to the manufacturer’s instructions. Proteins were loaded on pre-cast polyacrylamide NuPAGE® 4–12% Bis-Tris gels (Life Technologies GmbH, Darmstadt, Germany). After SDS-PAGE, proteins were transferred onto 0.45 µm nitrocellulose membranes [Millipore (Billerica, MA, USA)]. Before performing the immunoreactions, the membranes were stained for 1 min with Ponceau S solution (0.1% in 3% trichloroacetic acid) at RT, and then rinsed with distilled water to remove the background and documented by the Fusion-SL Advance™ imaging system (Peqlab) according to the instruction manual. Membranes were destained in blocking buffer (5% milk in tris-buffered saline [TBS]). Thereafter, membranes were incubated with the primary antibodies (rabbit monoclonal anti-Monoamine Oxidase A [MAO-A] antibody, ab126751, Abcam plc., Cambridge, UK) overnight at 4 °C in blocking buffer. After washing with TBS 0.1% Tween 20, membranes were incubated with ECL-anti-rabbit IgG-horseradish peroxidase (HRP) antibody (MA9340, GE Healthcare, Amersham, UK). Moreover, after washing, the peroxidase reaction was visualized with ImmobilonTM Western (HRP) Substrat (Merck Chemicals GmbH. Darmstadt, Germany). The intensity of WB bands and Ponceau S total protein was quantified using ImageJ/Fiji software from the National Institutes of Health (Bethesda, MD, USA). Total proteins according to Ponceau staining < 140 kDa were used to normalize the intensity of the bands [57].

2.5. Intramyocellular Glutathione (GSH) Content and Glutathione Redox State

Gastrocnemius muscle GSH content and glutathione redox state were determined according to Tietze (1969) [58] as previously described [59]. Briefly, 20–30 mg of muscle tissue were homogenized, deproteinized with 500 µL 2.5% sulfosalicylic acid (SSA), sonicated, and centrifugated for 10 min at 13,000× g and 5 °C. The supernatant was used to determine its content of total GSH (tGSH) and its oxidized disulfide GSSG form. Reduced GSH (rGSH) was calculated by subtraction of GSSG from tGSH. The total protein content of the pellet, corresponding to the supernatant volume was quantified by the colorimetric Bio-Rad protein assay (BioradLaboratories, Munich, Germany) to normalize the intracellular tGSH and GSSG.

2.6. Quantitative Reverse Transcription Polymerase Chain Reaction (qRT-PCR)

RNA was extracted from tissue using peqGOLDTriFast™ (VWR International GmbH, Darmstadt, Germany) according to the manufacturer’s instructions. RNA concentration was assessed using a NanoDrop 2000c spectrophotometer (Thermo Fisher Scientific Inc., Waltham, MA, USA) by optical density (OD) 260 nm, and purity by OD260 nm/OD280 nm. A ratio of 1.8 to 2.0 was accepted as pure. RNA integrity (RIN) was confirmed using a RNA 6000 NanoChip kit on an Agilent 2100 Bioanalyzer (Agilent Technologies Inc., Santa Clara, CA, USA). RNA samples with a RIN between 8 and 10 were considered as suitable for reverse transcription (RT). An aliquot of total RNA was treated with 1 unit DNAse (Thermo Fisher Scientific Inc.) (30 min; 37 °C). The treated RNA was employed to perform the RT for 1 h at 42 °C, using oligo primer (dT)12–18 (Agilent Technologies Inc.), 20 units of the reverse transcriptase, included in the Affinity Script multiple temperature cDNA synthesis kit (Agilent Technologies Inc.), 24 units of Ribo Lock™ RNAse inhibitor (Thermo Fisher Scientific Inc.), and 4 mM dNTP mix (Agilent Technologies Inc.). The cDNA was used for RT-qPCR using the QuantiTect-primer assays (Table 1) (Qiagen N.V., Venlo, The Netherlands) along with Takyon™ Low Rox Probe Master-Mix dTTP Blue (Eurogentec, Seraing, Belgium) or Agilent™ Brilliant III Ultra-Fast SYBR® Green QPCR Master-Mix (Agilent Technologies Inc.). The thermal profile consisted of 3 min at 95 °C followed by 45 cycles at 95 °C for 10 s and 60 °C for 20 s. The qPCR and data analyses were performed using the Stratagene Mx3005P™ qPCR System (Agilent Technologies Inc.). For each unknown sample, the relative amount was calculated by linear regression analysis from their respective standard curves, which were generated from a pool of cDNA. Specificity of the amplified product was confirmed by the melting curve analysis (55–95 °C). The expression of housekeeping (Table 1) genes (RER1 for soleus muscle and β-actin for gastrocnemius muscle) were selected with the use of the software Normfinder [60].

2.7. Statistical Analyses

Statistical analyses were performed using R Deducer [https://www.R-project.org/]. Shapiro-Wilk normality test, Levene’s test for homogeneity of variance, two-factorial ANOVA, and Tukey’s test were performed. Two-factorial ANOVA was applied to the total study population to assess the effect of PDAC (Ca and CaHH group) vs. WT (WT and WTHH groups) as well as the effect of HH (WTHH and CaHH group) vs. untreated mice (WT and Ca group) with significant differences being presented in separate boxes within the graphs. Significant differences between two groups (post hoc) are indicated within the graph by x (for PDAC effects) or # (for HH effects). A significance level of ≤5% was chosen for this study.

3. Results

The average weight of the mice was between 24.03 and 27.88 g, with no significant difference between groups. Concerning age, a significant difference by PDAC and an interaction existed by ANOVA. In the post-hoc test, all groups were significantly different in age, except for the comparison between CaHH and WTHH (Ca—WT p < 0.001; WTHH—WT p < 0.01; CaHH—WT p < 0.05; WTHH—Ca p < 0.01; CaHH—Ca p < 0.01) (Table 2).

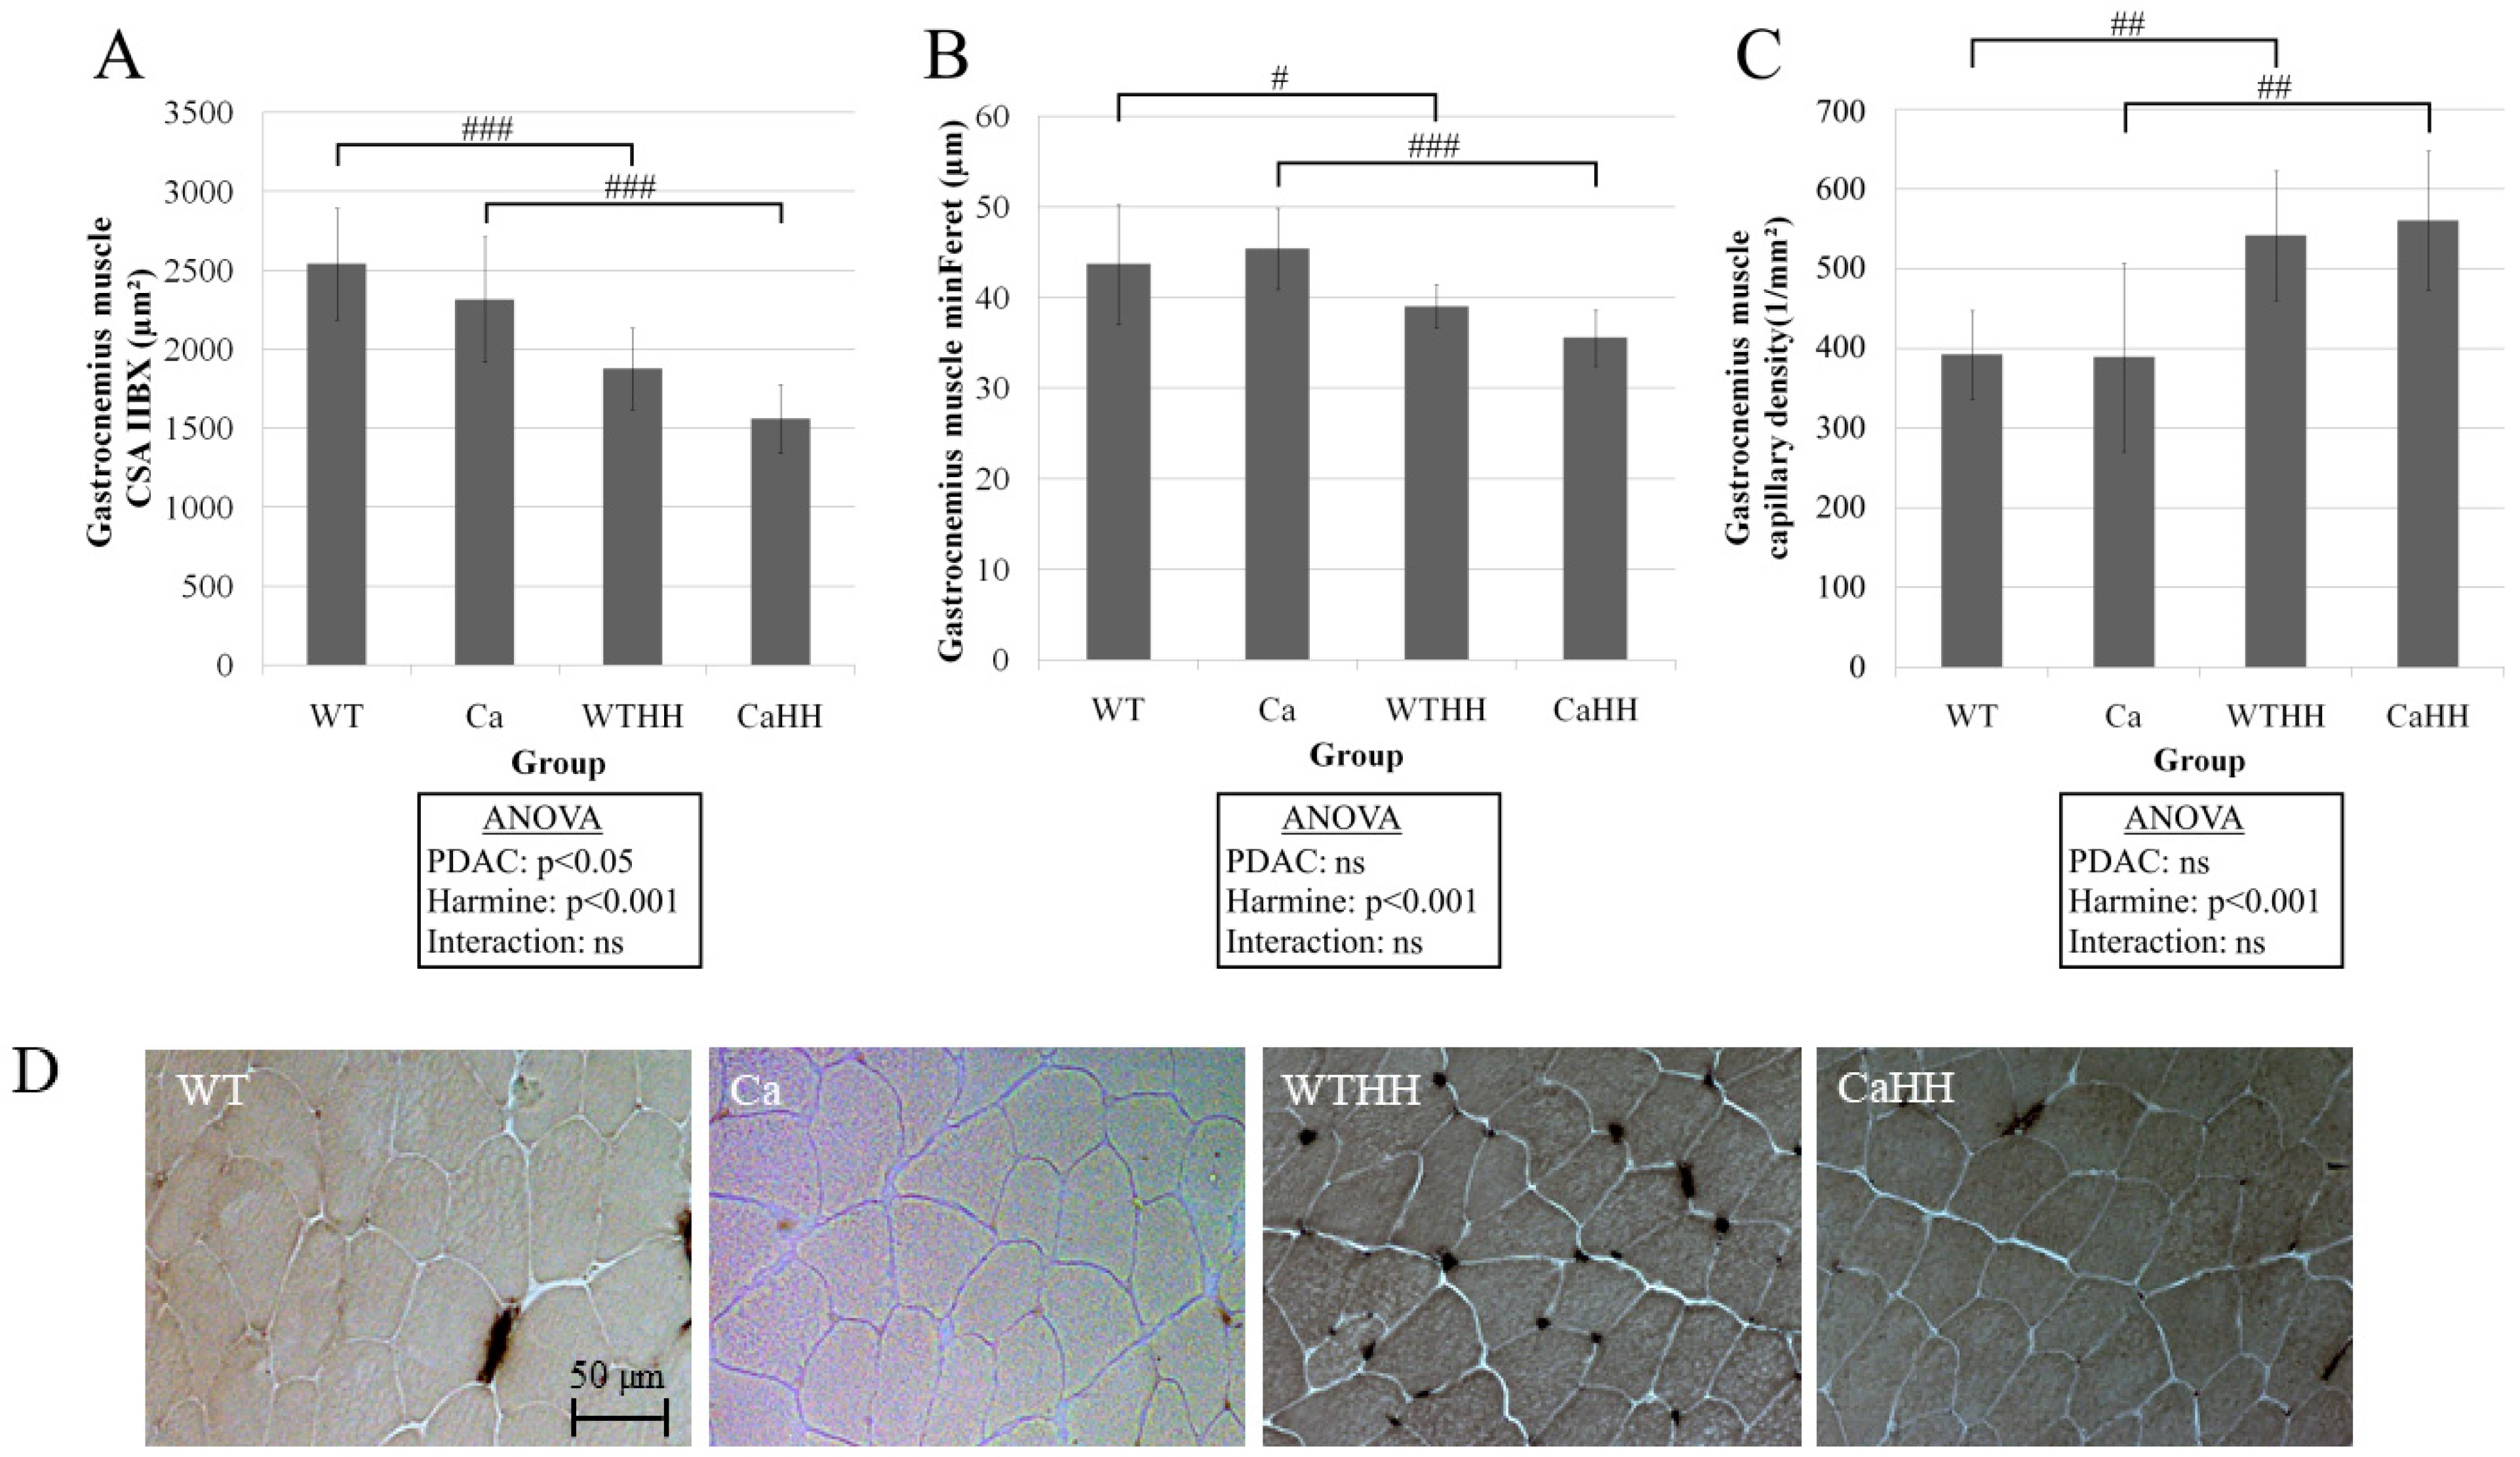
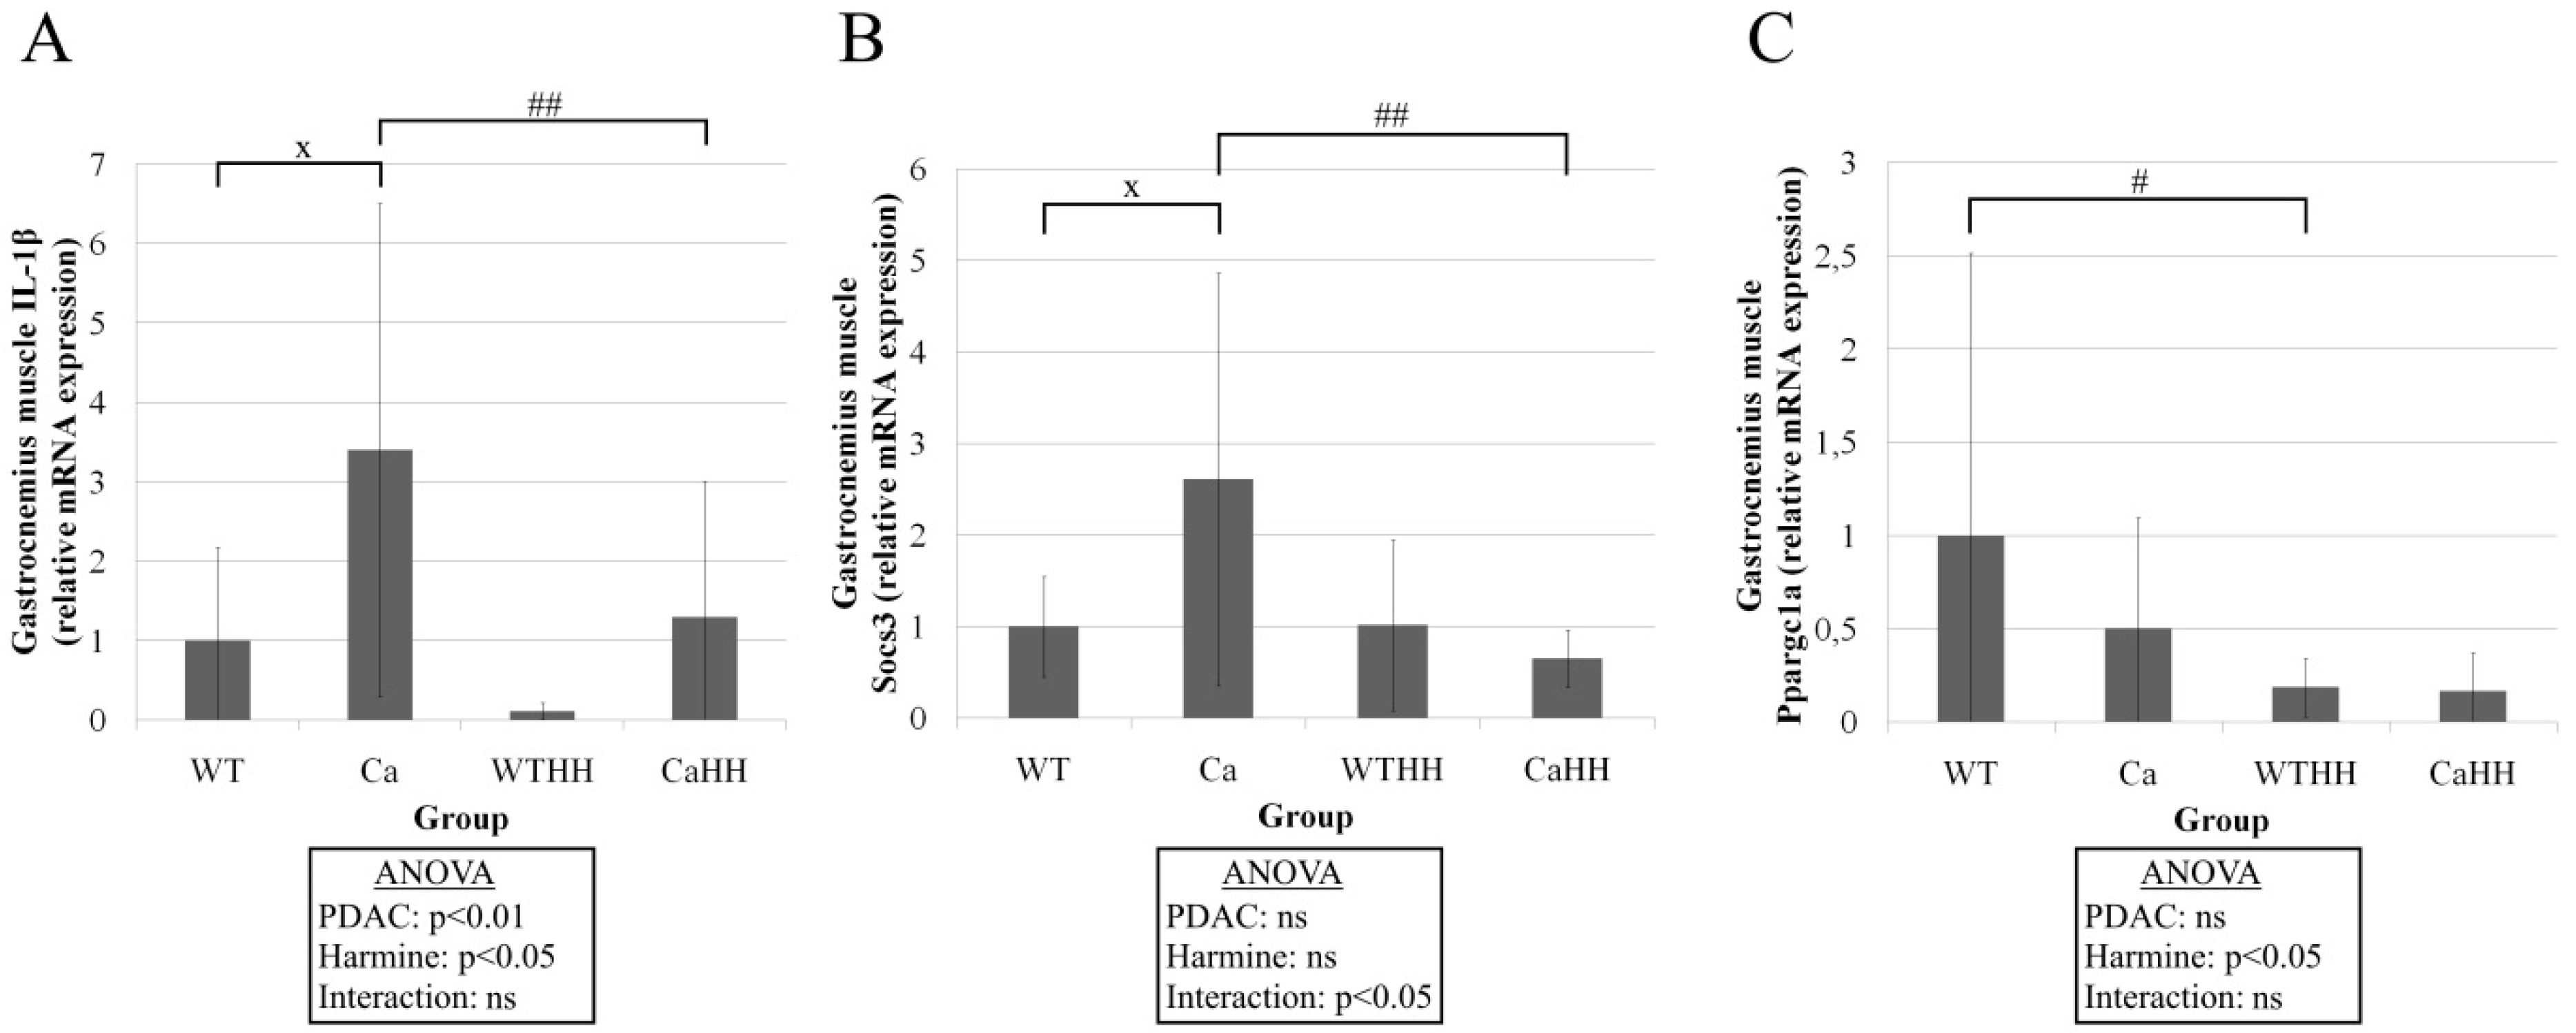
3.1. Gastrocnemius Muscle

As a target for HH treatment, MAO-A expression was confirmed by Western blot with normalization for total protein in gastrocnemius muscle of all four groups, i.e., WT, Ca WTHH, and CaHH (Figure 3A). There was a trend toward a PDAC-related increase in the highly variable MAO-A expression, which tended to decrease with HH treatment in both WT and PDAC-bearing mice. In addition, immunohistochemistry revealed a significantly higher MAO-A expression in Ca compared to WT mice (Figure 3B). Notably, no data were obtained regarding MAO-A enzyme activity and its change with HH treatment.
PDAC (p < 0.05) and HH (p < 0.001) led to a significant decrease in type IIBX CSA (Figure 4). A significant HH-mediated, as well as a PDAC-induced, reduction in CSA was found (Figure 4A). Additionally, HH treatment led to a decrease (Ca—CaHH: −9.85 µm; WT—WTHH: −4.64 µm) in the minFeret (Figure 4B), which is a CSA-corresponding length indicating the shortest distance between two parallel tangents on the fiber diameter. Thereby, in line with fiber atrophy, HH treatment significantly increased capillary density by 38.10% in WT and by 44.21% in PDAC mice (Figure 4C), while capillary fiber contacts remained unchanged (not shown).
Moreover, RT-qPCR analyses revealed that neither the expression of apoptosis-relevant genes (BAX, Caspase 3, BCL-2) nor E3 ligases MuRF1 and FBXO32, or of MAO-A and MAO-B were significantly altered with PDAC or HH. Similarly, the expression of proinflammatory genes, such as TNFα, IL-6, and COX2 showed no related differences (Table 3).
However, IL-1β expression was found to be significantly increased by PDAC (p < 0.01) and, importantly, significantly decreased by HH (p < 0.05) (Figure 5A).
Furthermore, ANOVA revealed a non-synergistic interaction at the mRNA expression of Socs3, increasing in Ca compared to WT mice by 160.43% and decreasing in CaHH compared to Ca mice by 195.7% (Figure 5B). As another significant effect in gastrocnemius muscle, HH led to a decreased mRNA expression of Ppargc1a by 81.52% in WTHH compared to WT mice (Figure 5C).
Analyses of GSH content and redox state in gastrocnemius muscle homogenate by ANOVA revealed (Table 4) that, overall, PDAC had no significant impact. However, HH treatment led to a significant decrease in total (WT—WTHH p < 0.001; WT—CaHH p < 0.05) as well as in reduced GSH (WT—WTHH p < 0.05). Since HH and PDAC tended to decrease GSSG as well (WT—Ca p < 0.01; WT—WTHH p < 0.001), the ratio of reduced GSH to GSSG (WT—Ca p < 0.05; Ca—WTHH p < 0.05) was not significantly changed by HH. Overall, HH appeared to impair intra(myo)cellular GSH availability, however, without a major shift in oxidation status.

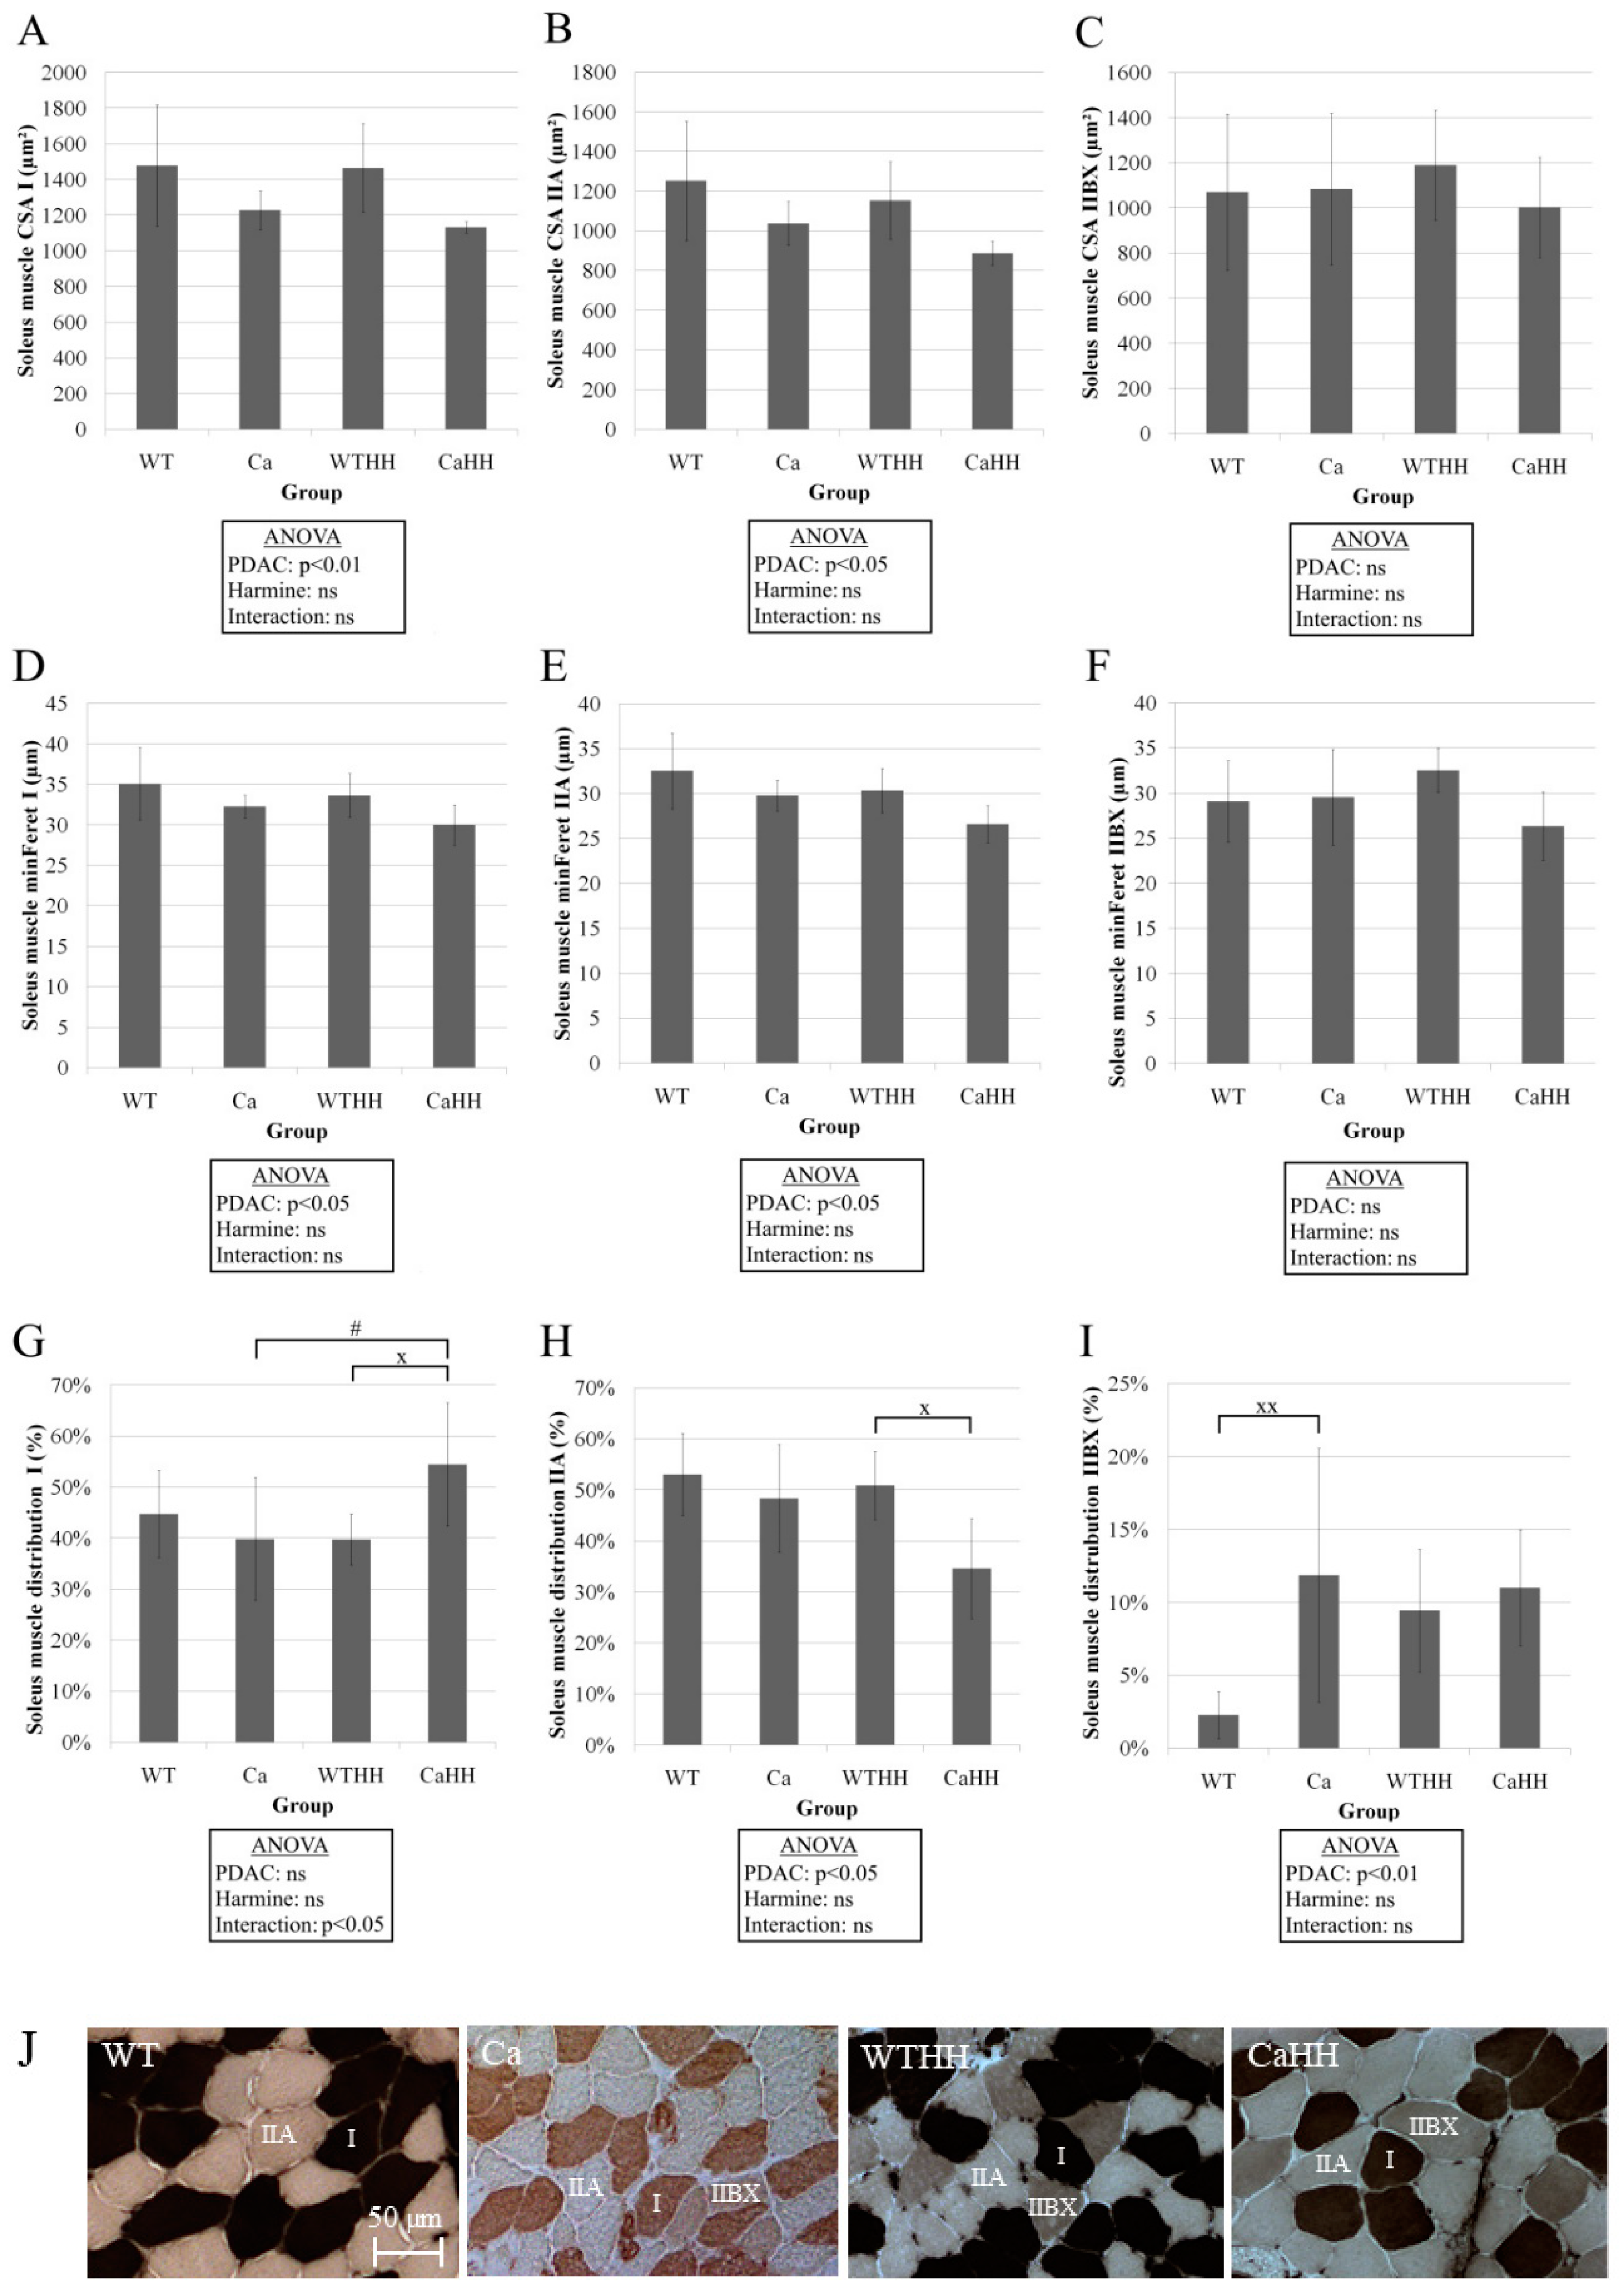
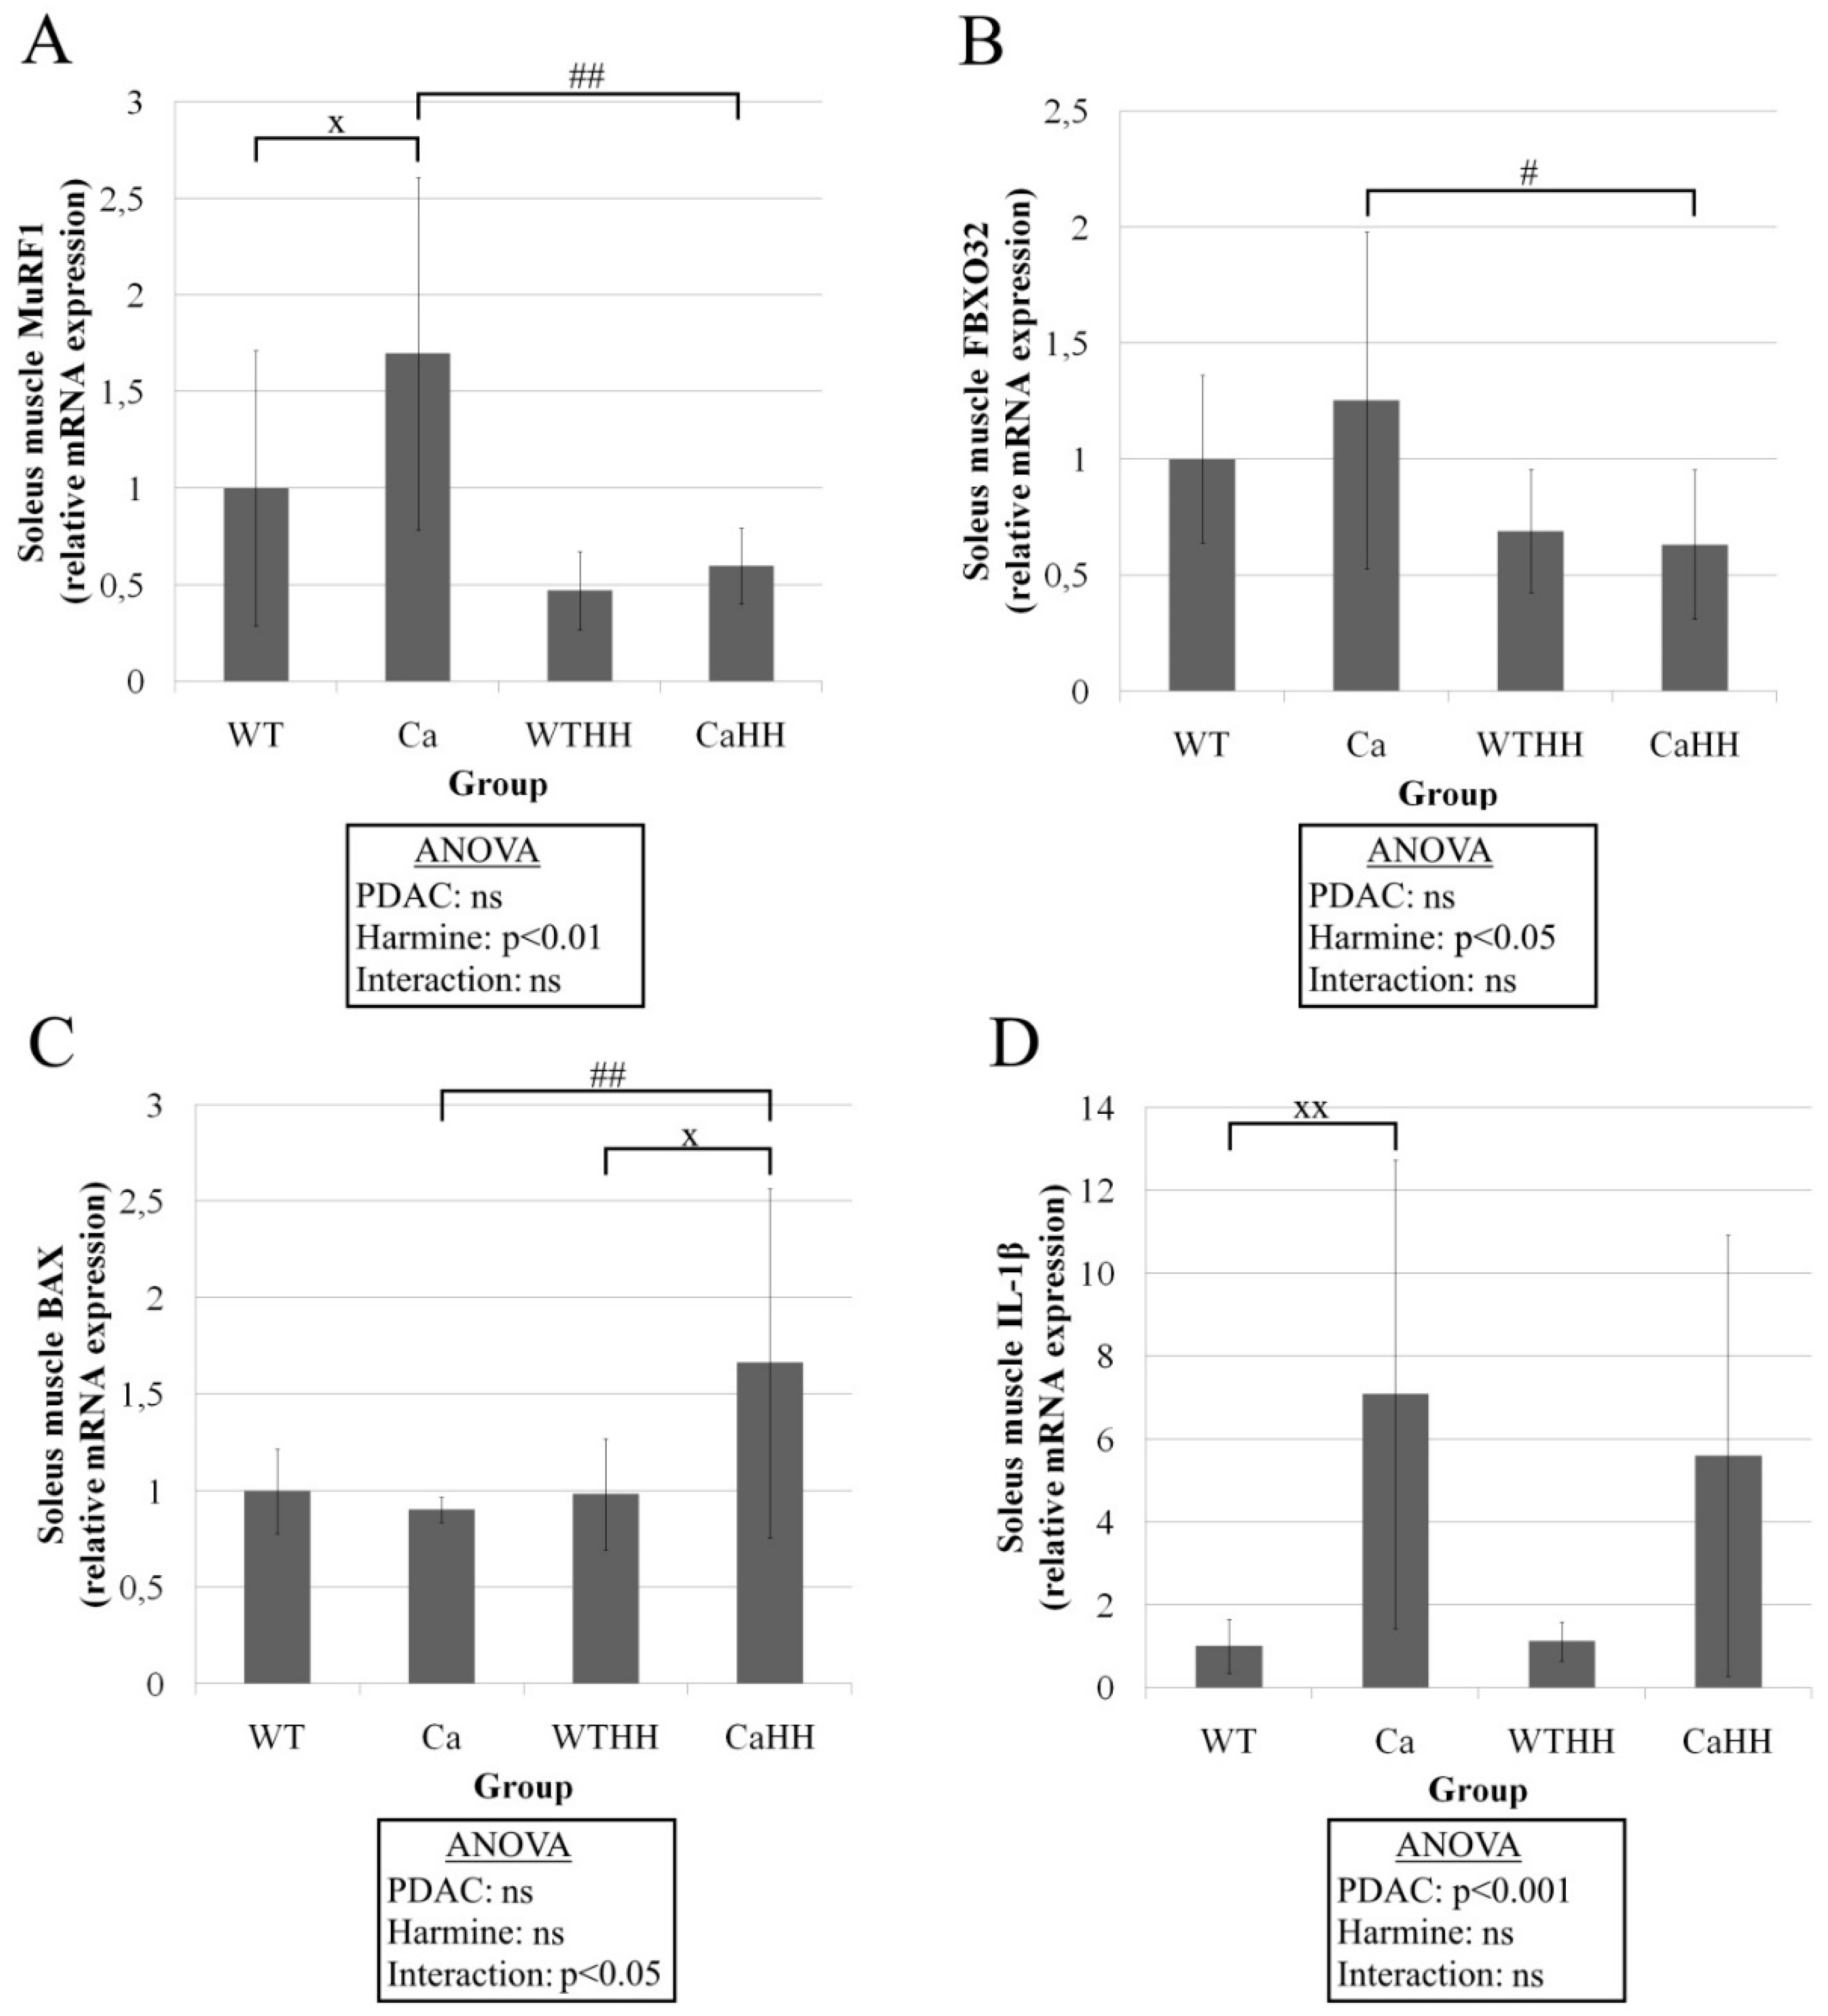
3.2. Soleus Muscle—Histomorphometry and Gene Expression

In soleus muscle, PDAC led to a decrease in CSA in fiber types I (p < 0.01) and IIA (p < 0.05) (Figure 6A,B) and to a corresponding reduction in minFeret in fiber types I (p < 0.05) and IIA (p < 0.05) (Figure 6D,E). Furthermore, interaction of PDAC and HH resulted in a significantly (p < 0.05) increased number of type I fibers by 14.59% in soleus muscle of CaHH mice in comparison to the WTHH or Ca group (Figure 6G). Driven by PDAC, the number of type IIA fibers in soleus muscle of CaHH mice significantly (p < 0.05) decreased by 16.27% compared to the WTHH group (Figure 6H). In soleus muscle of PDAC mice, the number of type IIBX fibers significantly (p < 0.01) increased by 9.57% compared to WT mice (Figure 6I). Capillary density and fiber-capillary contacts were similar in all groups under test (Table 5).
Regarding relevant proteolytic signals and markers in soleus muscle, a PDAC-driven increase in MuRF1 mRNA, but not in FBXO32 mRNA expression was found (Figure 7A). As a potentially anti-cachectic effect, HH treatment led to a significant decrease in MuRF1 and FBXO32 expression by 64.78% (p < 0.01) and 49.55% (p < 0.05), respectively (Figure 7B). Due to an interaction between PDAC and HH (p < 0.05), BAX expression in CaHH significantly increased by 68.81% (p < 0.05) compared to WTHH mice and by 84.07% (p < 0.01) compared to Ca mice (Figure 7C). ANOVA and Tukey’s test showed a significant (p < 0.001) increase in IL-1β expression driven by PDAC (Figure 7D). As with gastrocnemius muscle, Caspase 3, BCL-2, MAO-A, and MAO-B gene expressions were unchanged in soleus muscle (Table 6). The expressions of proinflammatory CD68, TNFα, IL-6, and COX2 genes were not altered, as well (Table 6). However, HH led to a significant downregulation of MMP9 overall. Furthermore, MyoG was found to be significantly upregulated through HH by interaction with PDAC.

3.3. Gastrocnemius and Soleus Muscles—Mitochondrial Integrity and Centronucleation

In gastrocnemius muscle, no significant global effect of PDAC (p = 0.595) or HH (p = 0.160) was detected regarding the mitochondrial integrity as assessed by TEM. Among the total mitochondrial number analyzed per animal in WT (n = 220.0 ± 50.4), Ca (n = 230.8 ± 44.9), WTHH (n = 137.5 ± 13.0), and CaHH (n = 153.1 ± 14.8), the ‘damaged’ fractions amounted to 39.8% ± 3.7%, 37.8% ± 4.3%, 42.5% ± 5.8%, and 50.1% ± 5.0%, respectively.
Similarly, no significant global effect of PDAC (p = 0.513) or HH (p = 0.075) was found regarding the mitochondrial integrity in soleus muscle. Among the total mitochondrial number analyzed per animal in WT (n = 364.6 ± 25.7), Ca (n = 311.3 ± 42.0), WTHH (n = 307.5 ± 49.3), and CaHH (n = 370.3 ± 57.0), the ‘damaged’ fractions were 41.1% ± 3.1%, 39.4% ± 2.4%, 49.2% ± 4.4%, and 45.8% ± 4.40%, respectively.
However, a combined analysis of both muscles revealed a significant effect of HH (p = 0.022) but not PDAC (p = 0.930) in terms of increased mitochondrial damage.
No significant global effect of PDAC or HH was detected on the fraction of centronucleated cells in gastrocnemius muscle or within the total fiber population, type I or type IIA fibers in soleus muscle (Table 7). However, within type IIBX fibers of soleus muscle alone or in combination with gastrocnemius and soleus muscles, a significant increase in centronucleated fraction with HH but not PDAC was detected.

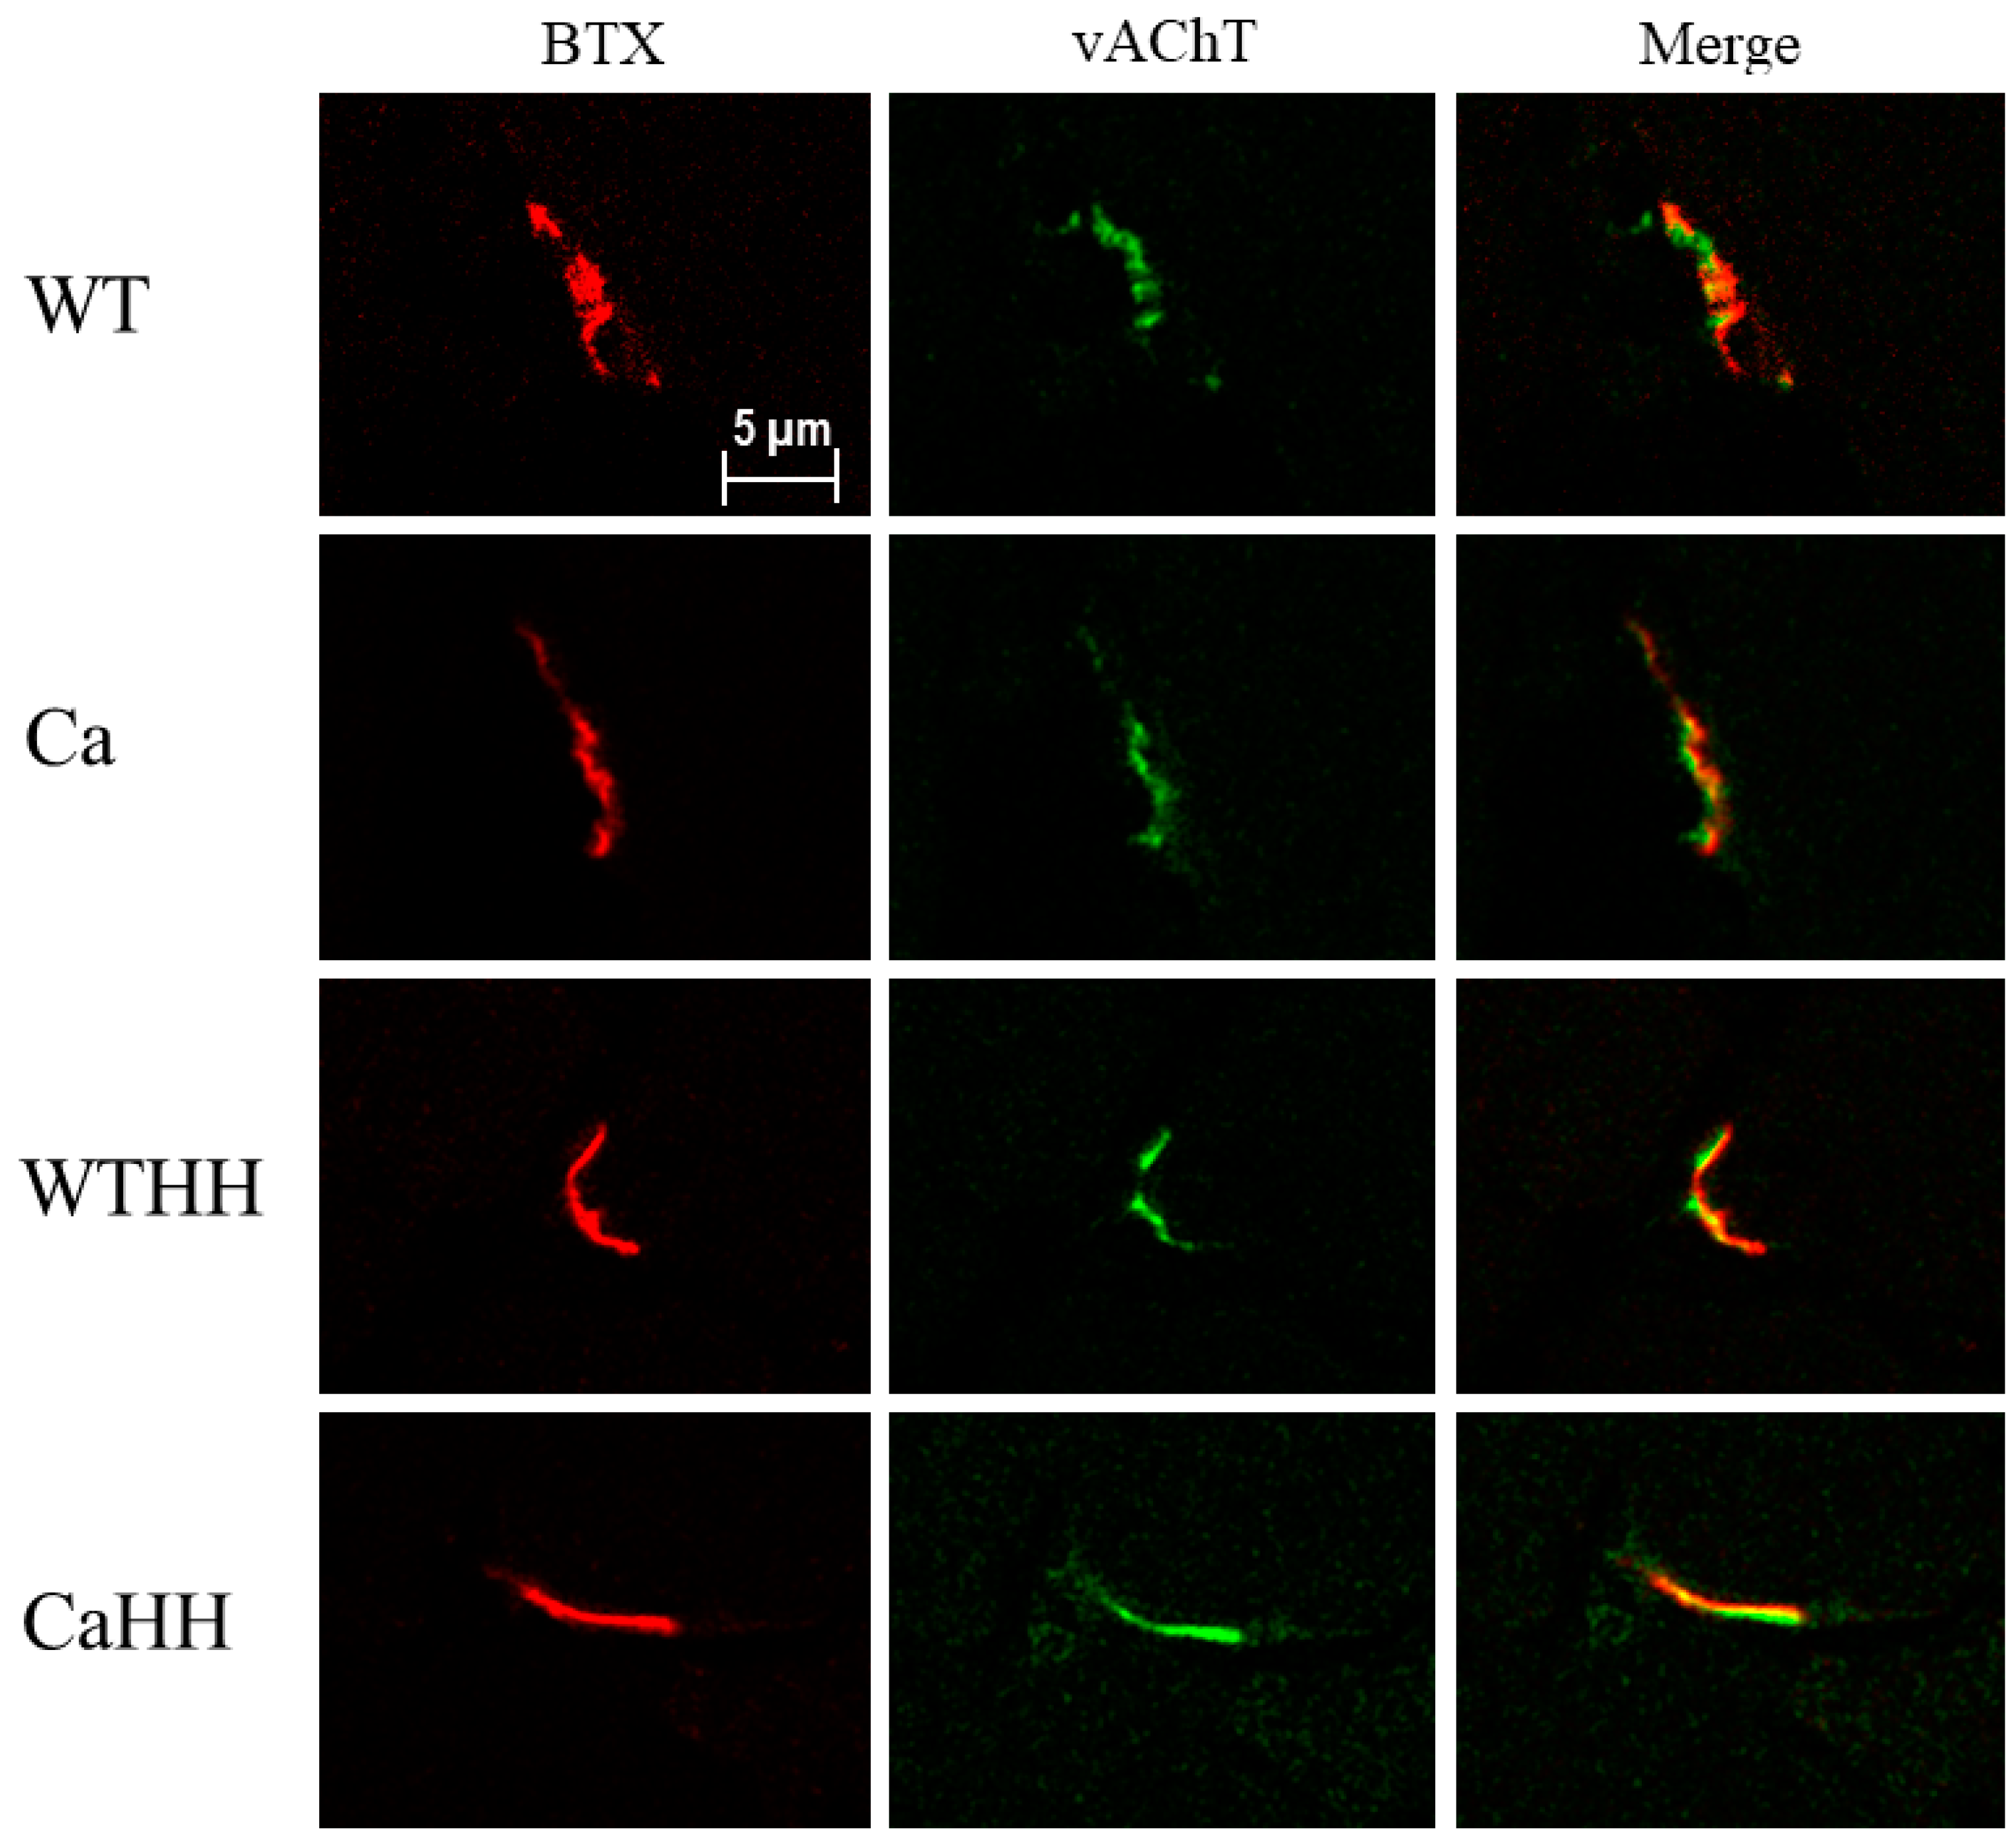
3.4. Quadriceps Muscle: Morphological NMJ Integrity

Evaluation of NMJ integrity by pre-/post-synaptic co-staining in subgroups (Table 8, Figure 8) indicated that the post-synaptic BTX+ area was significantly reduced with HH treatment, while PDAC had no impact (Ca—CaHH p < 0.05). Moreover, there was a significant interaction of HH treatment with PDAC in a way that the HH treatment decreased vAChT+ area (Ca—CaHH p < 0.05) and the absolute percentage overlap of vAChT+ with BTX+ areas (Tukey’s test: vAchT/BTX overlap [µm2] Ca—CaHH p < 0.05; vACht/BTX overlap [%] WT—Ca p < 0.05). Furthermore, significant correlations were found between rGSH/GSSG ratios in gastrocnemius muscle and NMJ vAChT/BTX overlap [%] in quadriceps muscle (r = 0.580, p = 0.015), as well as between rGSH content and NMJ BTX+ area (r = 0.512 p = 0.035) of these muscles, which both consist of type IIBX fibers.

4. Discussion

In the presently studied triple transgenic KPC mouse model, a recently reported cachexia-inducing effect of PDAC was confirmed in terms of reduced CSA of muscle fiber type IIBX in gastrocnemius and, as a global effect across all groups, of fiber types I and IIA in soleus muscle [49]. No significant pro-atrophic impact of PDAC was, however, detected in soleus muscle IIBX fibers, which represented a rather small fraction only. Our data on PDAC-related muscle wasting in these most frequently studied muscle types [4,18,31,49] are in line with the pro-cachectic effect of various other carcinoma in [19,26,27,28,29,61], which may vary widely between different types of cancer, fiber composition, and other factors [18]. Notably, changes in body weight were detected neither with PDAC nor with HH treatment. The fact that it did not reflect significant muscle wasting induced by PDAC and, surprisingly, also with HH in gastrocnemius muscle, may be due to concomitant variable changes in fat mass and increases in ascites fluid volume and/or tumor mass, all of which could not be measured.
Regarding fiber type distribution, a shift toward types I and IIBX in soleus muscle was observed solely due to a combined PDAC and HH effect. Alterations in fiber type composition with cancer cachexia may involve apoptosis, fiber transition, or impaired fiber type regeneration [18], all of which may contribute to differences and contradiction between findings on fiber composition with cancer [19,25,26,27,28,29]. It is very likely that the significant increase in capillary density, as presently observed, results from the reduction in fiber CSA in the gastrocnemius muscle, as changes in capillary-fiber contacts were absent.
Muscle IL-1β, a predictor of cachexia and higher mortality rates in patients with PDAC [62], was the only consistent parameter that was increased in both muscles under study and might have triggered acute phase reaction leading to cachexia [63]. In gastrocnemius muscle, a concomitant upregulation of Socs3 was found, that might be linked to the higher IL-1β [64,65], whereas in soleus muscle, MuRF1 was found to be increased as a protein-catabolic signal. No significant PDAC-related changes were detected in the expression of Ppargc1a, the role of which in metabolism and prognosis of cancer cachexia is still controversial [66,67,68,69].
As a presently addressed target of HH, skeletal muscle MAO-A was shown by Western blot (gastrocnemius muscle) and RT-qPCR (soleus and gastrocnemius muscles) to be expressed in both WT and PDAC mice. Thereby, a PDAC-related increase in MAO-A expression was neither detected on the RNA level nor on the protein level. However, there was a trend toward higher MAO-A protein expression with PDAC in Western blot and immunochemistry revealed significantly higher MAO-A expression in Ca compared to WT. These data reveal high variability and are only partly in line with a previous study showing a massive MAO-A upregulation along with increased H2O2 production upon glucocorticoid treatment in myocytes in vitro [32]. Even in the absence of significant changes in MAO-A expression, the present HH treatment can, however, be expected to substantially inhibit the enzyme activity of MAO-A, thereby decreasing H2O2 production as a pro-inflammatory and -cachectic signal within skeletal muscle.
Surprisingly, however, rather than reversing muscle atrophy, HH treatment led to a (further) reduced CSA of type IIBX fibers in the gastrocnemius muscle. As a serious adverse HH effect in the context of cachexia that is not described before, it occurred despite the observed significant reduction in the likely pro-cachectic IL-1β mRNA expression in gastrocnemius muscle. This protective anti-inflammatory effect may be in line with previous findings in human neurons after death following traumatic brain injury [70], or in mice serum [71,72]. Importantly, HH treatment also decreased the expression of MuRF1 and FBXO32 in soleus muscle, but was not able to diminish the PDAC-triggered muscle atrophy. Therefore, this, in theory, anti-cachectic, i.e., beneficial HH effect presently appeared to be overridden by another consequence of HH treatment. It cannot be excluded that apoptosis as suggested by BAX upregulation with HH (by interaction with PDAC) may have contributed to losses in muscle mass, as histomorphometry assesses fiber atrophy only.
Though obtained in subgroups only, our present data on NMJ integrity in the quadriceps muscle as another IIBX fiber-containing muscle suggest that NMJ may be compromised through HH, especially in PDAC mice. Of interest, IL-1β and possibly increased MAO-A activity is required for regeneration after peripheral nerve injury [73,74], while inhibition of MAO-B, not achieved by HH, may be beneficial for regeneration [75]. Therefore, anti-inflammatory effects through the presently applied HH dose may not be generally desirable in the context of cachexia treatment, though inhibition of MAO-A/B may reduce ROS production following denervation [76]. It remains to be studied as to what extent the adverse effect of HH is dose-dependent and overrides a beneficial anti-cachectic effect through downregulation of E3-ligases and IL-1β.
The assumption of compromised innervation through HH is presently supported by the finding that tGSH and rGSH availability in gastrocnemius muscle decreased significantly with HH treatment [73,76,77] and, furthermore, by the finding of increased centronucleation [78] in soleus type IIBX, or combined gastrocnemius and soleus IIBX fibers. In addition, as a source of ROS, dysfunctional mitochondria have indeed been implicated as a cause or a consequence of muscle denervation [76,79]. Increased ROS production of dysfunctional mitochondria may not necessarily be associated with detectable ultrastructural damage [18,80]. However, we presently detected an overall increase in the fraction of damaged mitochondria through HH when considering the combined data of both muscles under study, while PDAC was without any significant effect. Whether the adverse effect of HH primarily targets the NMJ or mitochondria remains open at present, however, both may lead to oxidative shifts in intracellular GSH status and proteasomal activation as a major cause of fiber atrophy. Notably, in the context of its possible adverse effects, cytotoxic effects of HH have also been described in pulmonal fibroblasts [81] and hepatocytes [82]. Possible triggers may be the ability of many β-carbolines to intercalate with DNA [83,84] and to provoke a G2 phase arrest [85,86] by the inhibition of topoisomerase I [87] or cyclin-dependent kinase [88]. More generally, it is noteworthy that HH may induce psychomotor alterations, such as reduced physical activity and anhedonia in rats, which presently cannot be excluded as a possible explanation for the HH-related muscle atrophy [89].
Importantly, the presently reported effects through HH may also, at least in part, be conveyed via HH-related inhibition of the x-chromosomal multifunctional dual-specificity tyrosine phosphorylation regulated kinases 1A (DYRK1A) and the 1B (DYRK1B/MIRK). DYRK1A is required for normal brain development and axonal transport and is expressed in adult NMJ [90], where DYRK1A inhibitors, such as HH might possibly have adverse effects, though data in this respect are lacking. However, since DYRK1A overexpression in Down’s Syndrome (DS) is strongly implicated in DS-associated oxidative stress, Alzheimer’s disease [91], and motor dysfunction [90], DYRK1A inhibitors may be beneficial in this condition, e.g., by upregulating the nuclear factor erythroid 2-like 2 (NRF2) [92]. However, DYRK1B is mainly expressed in skeletal muscle, where it plays a role in antioxidative defense [93,94] somewhat in contrast to the role of MAO-A. Therefore, HH may differentially alter the oxidative milieu through MAO-A and DYRK1B inhibition. However, since myocellular DYRK1B expression is critical for myogenesis, limited apoptosis, myocellular fusion, fiber differentiation, antioxidative defense, and autophagy (e.g., of damaged mitochondria) [94,95], its inhibition by HH may contribute to the presently observed muscle alterations, such as centronucleation, mitochondrial damage, fiber shift, and atrophy. Given that MAO-A was presently found to be upregulated in quadriceps muscle, the HH-related reversal of pro-cachectic PDAC effects (i.e., lowering IL-1β in gastrocnemius and MURF1 in soleus muscle) may be attributable to MOA-O inhibition, i.e., to reducing oxidative stress rather than to its augmentation via DYRK1B (DYRK1A) inhibition. Certainly, further studies on the relative contribution of these players to cachexia development and to therapeutic benefit or adverse events of HH are warranted.
Owing to the limited sample size, some gender imbalance between the groups, and the lack of a sham control, the present study may overall be considered as hypothesis-generating, especially with regard to soleus muscle histomorphometry in both HH-treated groups and the small subgroups explored for mitochondrial and NMJ integrity. Due to limitations in tissue/blood samples for further Western/ELISA analyses, the present results were mainly based on muscle qRT-PCR and histomorphometry, and thus unable to assess a potential contribution of systemic inflammation to the effect of PDAC or HH.

5. Conclusions

This hypothesis-generating study provides first insight into an understudied topic, i.e., MAO-A expression with cancer-related muscle wasting and the therapeutic potential of the MAO-A inhibition with HH. Using a transgenic mouse model of PDAC with confirmed fiber atrophy, we show a desirable inhibiting effect of HH on inflammation (IL-1β and Socs3) in gastrocnemius muscle and on signals of fiber atrophy via proteolysis (MuRF1 and FBX032), however, with a possible pro-apoptotic effect (BAX). Overall, this, however, did not translate into inhibition of PDAC-related muscle fiber atrophy. Rather, HH promotes fiber atrophy, at least in ‘white’ glycolytic muscle. Our preliminary data indicate that this adverse effect of HH may arise from compromised innervations, as also supported by GSH depletion, mitochondrial damage, and centronucleation. Notably, these adverse prooxidative effects impairing neuromuscular maintenance may also arise from HH-related inhibition of neuronal DYRK1A and/or DYRK1B. Whether different HH dosages may more effectively reduce inflammatory and fiber atrophy signals while avoiding neuromuscular adverse effects warrants further studies. In this context, it would be interesting to investigate the impact of other commonly used MAO inhibitors, such as Moclobemide, Rasagiline, or Selegiline in the present experimental animal model.

Author Contributions

Conceptualization, V.F., E.P.S., R.K. and W.H.; methodology, M.B., G.A.B., H.S., B.W., J.K., W.H. and S.K.P.S.; formal analysis, A.A., G.A.B., H.S., B.W., J.K. and S.K.P.S.; writing—original draft preparation, S.K.P.S., R.K. and W.H.; writing—review and editing, S.K.P.S., G.A.B., E.P.S., W.H. and R.K.; supervision, E.P.S. and W.H.; and project administration, V.F. and R.K. All authors have read and agreed to the published version of the manuscript.

Funding

This research was funded by the University Clinics of Giessen and Marburg (UKGM) according to their cooperation agreement (Project/grant number 44/2011).

Institutional Review Board Statement

The animal study protocol was approved by the Regional Commission Giessen (RP, Giessen, Hessen, Germany, MR 20/11-Nr.70/2009) and conducted according to German animal welfare law and the European legislation for protection of animals used for scientific purposes (2010/63/EU) as well as to regulations for animal experiments of the Philipps-University of Marburg.

Informed Consent Statement

Not applicable.

Data Availability Statement

The data sets used and/or analyzed during the current study are available from the corresponding author on reasonable request.

Acknowledgments

We owe a special thanks to the lab members Christa Merte-Grebe, Aninja Baier, Claudia Keppler, Elke Völck-Badouin, Irmgard Dammshäuser, and Michael Dreher for their great assistance in laboratory work.

Conflicts of Interest

The authors declare no conflict of interest.

Abbreviations

ANOVAanalysis of variance
BAXBcl2-associated X protein
Bcl2B-cell lymphoma 2
BTXα-bungarotoxin
Cauntreated 3xtransgenic mice with PDAC
CaHHHH-treated 3xtransgenic mice with PDAC
COX2cyclooxygenase 2 (syn: Prostaglandin endoperoxide synthase 2 (PTGS2))
CSAcross-sectional area (of muscle fibers in transversal cryosections)
DYRK1 A/Bdual-specificity tyrosine phosphorylation regulated kinases 1 A/B
FBXO32F-box only protein 32 (syn: MAFbx, Atrogin1)
GSSGglutathione disulfide
rGSHreduced glutathione
tGSHtotal glutathione
HHHarmine-Hydrochloride
ILinterleukin
KPCdenotes the transgenic mouse model of PDAC, that incorporates mutant
endogenous alleles of the Kras and P53 genes using Cre-Lox technology
according to Hingorani et al. [44]
MAO-A/Bmonoamino oxidase A/B
MMP9matrix metallopeptidase 9
MuRF1muscle ring finger protein 1 (syn: TRIM63)
NMJneuromuscular junction (motor endplate)
PDACpancreatic ductal adenocarcinoma
p62ubiquitin-binding protein p62 (syn: Sequestosome 1 (Sqstml1))
PAX7paired box protein 7
Ppargc1aperoxisome proliferator-activated receptor gamma coactivator 1-alpha
(syn: PGC-1α)
RER1retention of endoplasmatic reticulum 1 protein
ROSreactive oxygen species
RT-qPCRreal-time quantitative polymerase chain reaction
Socs3suppressor of cytokine signaling 3
TEMtransmission electron microscopy
TNFαtumor necrosis factor α
WTuntreated wild type mice
WTHHHH-treated wild type mice
vAChTvesicular acetylcholine transporter (syn: SLC18A3)
VEGFAvascular endothelial growth factor A

References

  1. Porporato, P.E. Understanding cachexia as a cancer metabolism syndrome. Oncogenesis 2016, 5, e200. [Google Scholar] [CrossRef] [PubMed] [Green Version]
  2. Meza-Valderrama, D.; Marco, E.; Dávalos-Yerovi, V.; Muns, M.D.; Tejero-Sánchez, M.; Duarte, E.; Sánchez-Rodríguez, D. Sarcopenia, Malnutrition, and Cachexia: Adapting Definitions and Terminology of Nutritional Disorders in Older People with Cancer. Nutrients 2021, 13, 761. [Google Scholar] [CrossRef]
  3. Fearon, K.; Strasser, F.; Anker, S.D.; Bosaeus, I.; Bruera, E.; Fainsinger, R.L.; Jatoi, A.; Loprinzi, C.; MacDonald, N.; Mantovani, G.; et al. Definition and classification of cancer cachexia: An international consensus. Lancet Oncol. 2011, 12, 489–495. [Google Scholar] [CrossRef]
  4. Johns, N.; Stephens, N.A.; Fearon, K.C. Muscle wasting in cancer. Int. J. Biochem. Cell Biol. 2013, 45, 2215–2229. [Google Scholar] [CrossRef]
  5. Al-Batran, S.E.; Hofheinz, R.D.; Reichart, A.; Pauligk, C.; Schönherr, C.; Schlag, R.; Siegler, G.; Dörfel, S.; Koenigsmann, M.; Zahn, M.O.; et al. Quality of life and outcome of patients with metastatic pancreatic cancer receiving first-line chemotherapy with nab-paclitaxel and gemcitabine: Real-life results from the prospective QOLIXANE trial of the Platform for Outcome, Quality of Life and Translational Research on Pancreatic Cancer registry. Int. J. Cancer 2021, 148, 1478–1488. [Google Scholar]
  6. Arthur, S.T.; Van Doren, B.A.; Roy, D.; Noone, J.M.; Zacherle, E.; Blanchette, C.M. Cachexia among US cancer patients. J. Med. Econ. 2016, 19, 874–880. [Google Scholar] [CrossRef]
  7. Arthur, S.T.; Noone, J.M.; Van Doren, B.A.; Roy, D.; Blanchette, C.M. One-year prevalence, comorbidities and cost of cachexia-related inpatient admissions in the USA. Drugs Context 2014, 3, 212265. [Google Scholar] [CrossRef] [PubMed] [Green Version]
  8. Baldwin, C.; Spiro, A.; Ahern, R.; Emery, P.W. Oral nutritional interventions in malnourished patients with cancer: A systematic review and meta-analysis. J. Natl. Cancer Inst. 2012, 104, 371–385. [Google Scholar] [CrossRef] [PubMed] [Green Version]
  9. Grande, A.J.; Silva, V.; Riera, R.; Medeiros, A.; Vitoriano, S.G.P.; Peccin, M.S.; Maddocks, M. Exercise for cancer cachexia in adults. Cochrane Database Syst. Rev. 2014, 11, CD010804. [Google Scholar] [CrossRef] [Green Version]
  10. Balstad, T.R.; Solheim, T.S.; Strasser, F.; Kaasa, S.; Bye, A. Dietary treatment of weight loss in patients with advanced cancer and cachexia: A systematic literature review. Crit. Rev. Oncol. Hematol. 2014, 91, 210–221. [Google Scholar] [CrossRef] [Green Version]
  11. Solheim, T.S.; Fearon, K.C.; Blum, D.; Kaasa, S. Non-steroidal anti-inflammatory treatment in cancer cachexia: A systematic literature review. Acta Oncol. 2013, 52, 6–17. [Google Scholar] [CrossRef] [Green Version]
  12. Ruiz Garcia, V.; López-Briz, E.; Carbonell Sanchis, R.; Gonzalvez Perales, J.L.; Bort-Marti, S. Megestrol acetate for treatment of anorexia-cachexia syndrome. Cochrane Database Syst. Rev. 2013, CD004310. [Google Scholar] [CrossRef] [PubMed]
  13. Strasser, F.; Luftner, D.; Possinger, K.; Ernst, G.; Ruhstaller, T.; Meissner, W.; Ko, Y.D.; Schnelle, M.; Reif, M.; Cerny, T.; et al. Comparison of orally administered cannabis extract and delta-9-tetrahydrocannabinol in treating patients with cancer-related anorexia-cachexia syndrome: A multicenter, phase III, randomized, double-blind, placebo-controlled clinical trial from the Cannabis-In-Cachexia-Study-Group. J. Clin. Oncol. 2006, 24, 3394–3400. [Google Scholar] [PubMed]
  14. Argilés, J.M.; Busquets, S.; Stemmler, B.; López-Soriano, F.J. Cancer cachexia: Understanding the molecular basis. Nat. Rev. Cancer 2014, 14, 754–762. [Google Scholar] [CrossRef]
  15. Martin, L.; Birdsell, L.; Macdonald, N.; Reiman, T.; Clandinin, M.T.; McCargar, L.J.; Murphy, R.; Ghosh, S.; Sawyer, M.B.; Baracos, V.E. Cancer cachexia in the age of obesity: Skeletal muscle depletion is a powerful prognostic factor, independent of body mass index. J. Clin. Oncol. 2013, 31, 1539–1547. [Google Scholar] [CrossRef]
  16. Prado, C.M.; Lieffers, J.R.; McCargar, L.J.; Reiman, T.; Sawyer, M.B.; Martin, L.; Baracos, V.E. Prevalence and clinical implications of sarcopenic obesity in patients with solid tumours of the respiratory and gastrointestinal tracts: A population-based study. Lancet Oncol. 2008, 9, 629–635. [Google Scholar] [CrossRef]
  17. Tan, B.H.; Birdsell, L.A.; Martin, L.; Baracos, V.E.; Fearon, K.C. Sarcopenia in an overweight or obese patient is an adverse prognostic factor in pancreatic cancer. Clin. Cancer Res. 2009, 15, 6973–6979. [Google Scholar] [CrossRef] [Green Version]
  18. Martin, A.; Freyssenet, D. Phenotypic features of cancer cachexia-related loss of skeletal muscle mass and function: Lessons from human and animal studies. J. Cachexia Sarcopenia Muscle 2021, 12, 252–273. [Google Scholar] [CrossRef] [PubMed]
  19. Roberts, B.M.; Frye, G.S.; Ahn, B.; Ferreira, L.F.; Judge, A.R. Cancer cachexia decreases specific force and accelerates fatigue in limb muscle. Biochem. Biophys. Res. Commun. 2013, 435, 488–492. [Google Scholar] [CrossRef] [Green Version]
  20. Sun, R.; Zhang, S.; Hu, W.; Lu, X.; Lou, N.; Yang, Z.; Chen, S.; Zhang, X.; Yang, H. Valproic acid attenuates skeletal muscle wasting by inhibiting C/EBPβ-regulated atrogin1 expression in cancer cachexia. Am. J. Physiol. Cell Physiol. 2016, 311, C101–C115. [Google Scholar] [CrossRef] [Green Version]
  21. Bonetto, A.; Rupert, J.E.; Barreto, R.; Zimmers, T.A. The Colon-26 Carcinoma Tumor-bearing Mouse as a Model for the Study of Cancer Cachexia. J. Vis. Exp. 2016, 30, e54893. [Google Scholar]
  22. Henderson, S.E.; Ding, L.Y.; Mo, X.; Bekaii-Saab, T.; Kulp, S.K.; Chen, C.S.; Huang, P.H. Suppression of Tumor Growth and Muscle Wasting in a Transgenic Mouse Model of Pancreatic Cancer by the Novel Histone Deacetylase Inhibitor AR-42. Neoplasia 2016, 18, 765–774. [Google Scholar] [CrossRef] [PubMed] [Green Version]
  23. Delitto, D.; Judge, S.M.; Delitto, A.E.; Nosacka, R.L.; Rocha, F.G.; DiVita, B.B.; Gerber, M.H.; George, T.J.; Behrns, K.E.; Hughes, S.J.; et al. Human pancreatic cancer xenografts recapitulate key aspects of cancer cachexia. Oncotarget 2017, 8, 1177–1189. [Google Scholar] [CrossRef] [Green Version]
  24. Ciciliot, S.; Rossi, A.C.; Dyar, K.A.; Blaauw, B.; Schiaffino, S. Muscle type and fiber type specificity in muscle wasting. Int. J. Biochem. Cell Biol. 2013, 45, 2191–2199. [Google Scholar] [CrossRef] [PubMed]
  25. Mehl, K.A.; Davis, J.M.; Berger, F.G.; Carson, J.A. Myofiber degeneration/regeneration is induced in the cachectic ApcMin/+ mouse. J. Appl. Physiol. 2005, 99, 2379–2387. [Google Scholar] [CrossRef]
  26. Roberts, B.M.; Ahn, B.; Smuder, A.J.; Al-Rajhi, M.; Gill, L.C.; Beharry, A.W.; Powers, S.K.; Fuller, D.D.; Ferreira, L.F.; Judge, A.R. Diaphragm and ventilatory dysfunction during cancer cachexia. FASEB J. 2013, 27, 2600–2610. [Google Scholar] [CrossRef] [Green Version]
  27. Bohnert, K.R.; Gallot, Y.S.; Sato, S.; Xiong, G.; Hindi, S.M.; Kumar, A. Inhibition of ER stress and unfolding protein response pathways causes skeletal muscle wasting during cancer cachexia. FASEB J. 2016, 30, 3053–3068. [Google Scholar] [CrossRef] [Green Version]
  28. Chacon-Cabrera, A.; Mateu-Jimenez, M.; Langohr, K.; Fermoselle, C.; García-Arumí, E.; Andreu, A.L.; Yelamos, J.; Barreiro, E. Role of PARP activity in lung cancer-induced cachexia: Effects on muscle oxidative stress, proteolysis, anabolic markers, and phenotype. J. Cell Physiol. 2017, 232, 3744–3761. [Google Scholar] [CrossRef] [PubMed] [Green Version]
  29. Salazar-Degracia, A.; Blanco, D.; Vilà-Ubach, M.; de Biurrun, G.; de Solórzano, C.O.; Montuenga, L.M.; Barreiro, E. Phenotypic and metabolic features of mouse diaphragm and gastrocnemius muscles in chronic lung carcinogenesis: Influence of underlying emphysema. J. Transl. Med. 2016, 14, 244. [Google Scholar] [CrossRef] [PubMed] [Green Version]
  30. Moylan, J.S.; Reid, M.B. Oxidative stress, chronic disease, and muscle wasting. Muscle Nerve 2007, 35, 411–429. [Google Scholar] [CrossRef]
  31. Tisdale, M.J. Mechanisms of cancer cachexia. Physiol. Rev. 2009, 89, 381–410. [Google Scholar] [CrossRef] [PubMed] [Green Version]
  32. Manoli, I.; Le, H.; Alesci, S.; McFann, K.K.; Su, Y.A.; Kino, T.; Chrousos, G.P.; Blackman, M.R. Monoamine oxidase-A is a major target gene for glucocorticoids in human skeletal muscle cells. FASEB J. 2005, 19, 1359–1361. [Google Scholar] [CrossRef]
  33. Bianchi, P.; Kunduzova, O.; Masini, E.; Cambon, C.; Bani, D.; Raimondi, L.; Seguelas, M.H.; Nistri, S.; Colucci, W.; Leducq, N.; et al. Oxidative stress by monoamine oxidase mediates receptor-independent cardiomyocyte apoptosis by serotonin and postischemic myocardial injury. Circulation 2005, 112, 3297–3305. [Google Scholar] [CrossRef] [PubMed] [Green Version]
  34. Pchejetski, D.; Kunduzova, O.; Dayon, A.; Calise, D.; Seguelas, M.H.; Leducq, N.; Seif, I.; Parini, A.; Cuvillier, O. Oxidative stress-dependent sphingosine kinase-1 inhibition mediates monoamine oxidase A-associated cardiac cell apoptosis. Circ. Res. 2007, 100, 41–49. [Google Scholar] [CrossRef] [PubMed] [Green Version]
  35. Umbarkar, P.; Singh, S.; Arkat, S.; Bodhankar, S.L.; Lohidasan, S.; Sitasawad, S.L. Monoamine oxidase-A is an important source of oxidative stress and promotes cardiac dysfunction, apoptosis, and fibrosis in diabetic cardiomyopathy. Free Radic. Biol. Med. 2015, 87, 263–273. [Google Scholar] [CrossRef] [Green Version]
  36. Morin, N.; Visentin, V.; Calise, D.; Marti, L.; Zorzano, A.; Testar, X.; Valet, P.; Fischer, Y.; Carpéné, C. Tyramine stimulates glucose uptake in insulin-sensitive tissues in vitro and in vivo via its oxidation by amine oxidases. J. Pharmacol. Exp. Ther. 2002, 303, 1238–1247. [Google Scholar] [CrossRef] [Green Version]
  37. Duarte, J.A.; Carvalho, F.; Fernandes, E.; Remião, F.; Bastos, M.L.; Magalhães, J.; Appell, H.J. D-amphetamine-induced hydrogen peroxide production in skeletal muscle is modulated by monoamine oxidase inhibition. Int. J. Sports Med. 2004, 25, 446–449. [Google Scholar] [CrossRef]
  38. Centers for Disease Control, Prevention. An Update on Cancer Deaths in the United States; US Department of Health and Human Services, Centers for Disease Control and Prevention, Division of Cancer Prevention and Control: Atlanta, GA, USA, 2020.
  39. Dewys, W.D.; Begg, C.; Lavin, P.T.; Band, P.R.; Bennett, J.M.; Bertino, J.R.; Cohen, M.H.; Douglass, H.O.; Engstrom, P.F.; Ezdinli, E.Z.; et al. Prognostic effect of weight loss prior to chemotherapy in cancer patients. Eastern Cooperative Oncology Group. Am. J. Med. 1980, 69, 491–497. [Google Scholar] [CrossRef]
  40. Wigmore, S.J.; Plester, C.E.; Richardson, R.A.; Fearon, K.C. Changes in nutritional status associated with unresectable pancreatic cancer. Br. J. Cancer 1997, 75, 106–109. [Google Scholar] [CrossRef] [Green Version]
  41. Bachmann, J.; Ketterer, K.; Marsch, C.; Fechtner, K.; Krakowski-Roosen, H.; Büchler, M.W.; Friess, H.; Martignoni, M.E. Pancreatic cancer related cachexia: Influence on metabolism and correlation to weight loss and pulmonary function. BMC Cancer 2009, 9, 255. [Google Scholar] [CrossRef] [Green Version]
  42. Bachmann, J.; Büchler, M.W.; Friess, H.; Martignoni, M.E. Cachexia in patients with chronic pancreatitis and pancreatic cancer: Impact on survival and outcome. Nutr. Cancer 2013, 65, 827–833. [Google Scholar] [CrossRef]
  43. Teunissen, S.C.; Wesker, W.; Kruitwagen, C.; de Haes, H.C.; Voest, E.E.; de Graeff, A. Symptom prevalence in patients with incurable cancer: A systematic review. J. Pain Symptom Manag. 2007, 34, 94–104. [Google Scholar] [CrossRef]
  44. Hingorani, S.R.; Wang, L.; Multani, A.S.; Combs, C.; Deramaudt, T.B.; Hruban, R.H.; Rustgi, A.K.; Chang, S.; Tuveson, D.A. Trp53R172H and KrasG12D cooperate to promote chromosomal instability and widely metastatic pancreatic ductal adenocarcinoma in mice. Cancer Cell 2005, 7, 469–483. [Google Scholar] [CrossRef] [Green Version]
  45. Lee, J.W.; Komar, C.A.; Bengsch, F.; Graham, K.; Beatty, G.L. Genetically Engineered Mouse Models of Pancreatic Cancer: The KPC Model (LSL-Kras(G12D/+); LSL-Trp53(R172H/+); Pdx-1-Cre), Its Variants, and Their Application in Immuno-oncology Drug Discovery. Curr. Protoc. Pharmacol. 2016, 73, 14.39.11–14.39.20. [Google Scholar] [CrossRef] [Green Version]
  46. Hasselluhn, M.C.; Klein, L.; Patzak, M.S.; Buchholz, S.M.; Ströbel, P.; Ellenrieder, V.; Maisonneuve, P.; Neesse, A. Stromal Features of the Primary Tumor Are Not Prognostic in Genetically Engineered Mice of Pancreatic Cancer. Cells 2019, 9, 58. [Google Scholar] [CrossRef] [Green Version]
  47. Fendrich, V.; Chen, N.M.; Neef, M.; Waldmann, J.; Buchholz, M.; Feldmann, G.; Slater, E.P.; Maitra, A.; Bartsch, D.K. The angiotensin-I-converting enzyme inhibitor enalapril and aspirin delay progression of pancreatic intraepithelial neoplasia and cancer formation in a genetically engineered mouse model of pancreatic cancer. Gut 2010, 59, 630–637. [Google Scholar] [CrossRef] [PubMed]
  48. Fendrich, V.; Schneider, R.; Maitra, A.; Jacobsen, I.D.; Opfermann, T.; Bartsch, D.K. Detection of precursor lesions of pancreatic adenocarcinoma in PET-CT in a genetically engineered mouse model of pancreatic cancer. Neoplasia 2011, 13, 180–186. [Google Scholar] [CrossRef] [PubMed] [Green Version]
  49. Hildebrandt, W.; Keck, J.; Schmich, S.; Bonaterra, G.A.; Wilhelm, B.; Schwarzbach, H.; Eva, A.; Bertoune, M.; Slater, E.P.; Fendrich, V.; et al. Inflammation and Wasting of Skeletal Muscles in Kras-p53-Mutant Mice with Intraepithelial Neoplasia and Pancreatic Cancer-When Does Cachexia Start? Cells 2022, 11, 1607. [Google Scholar] [CrossRef] [PubMed]
  50. Fritzsche, J. Untersuchungen über die Samen von Peganum Harmala. In Bulletin de la Classe Physico-Mathématique de l’Académie Impériale des Sciences de Saint-Pétersbourg 1847; t.5-8 (1847–1850); Russian Academy of Science: St. Petersbourg, Russia, 1847; Volume 6, pp. 49–72. [Google Scholar]
  51. Neuner, A.; Tappeiner, H. Ueber die Wirkungen der Alkaloide von Peganum Harmala, insbesondere des Harmalins. Arch. Exp. Pathol. Pharmakol. 1894, 35, 69–76. [Google Scholar] [CrossRef]
  52. Herraiz, T.; González, D.; Ancín-Azpilicueta, C.; Arán, V.J.; Guillén, H. beta-Carboline alkaloids in Peganum harmala and inhibition of human monoamine oxidase (MAO). Food Chem. Toxicol. 2010, 48, 839–845. [Google Scholar] [CrossRef] [PubMed]
  53. Alroy, J.; Goyal, V.; Skutelsky, E. Lectin histochemistry of mammalian endothelium. Histochemistry 1987, 86, 603–607. [Google Scholar] [CrossRef]
  54. Brooke, M.H.; Kaiser, K.K. Muscle fiber types: How many and what kind? Arch. Neurol. 1970, 23, 369–379. [Google Scholar] [CrossRef]
  55. Friedmann-Bette, B.; Bauer, T.; Kinscherf, R.; Vorwald, S.; Klute, K.; Bischoff, D.; Müller, H.; Weber, M.A.; Metz, J.; Kauczor, H.U.; et al. Effects of strength training with eccentric overload on muscle adaptation in male athletes. Eur. J. Appl. Physiol. 2010, 108, 821–836. [Google Scholar] [CrossRef]
  56. Bannow, L.I.; Bonaterra, G.A.; Bertoune, M.; Maus, S.; Schulz, R.; Weissmann, N.; Kraut, S.; Kinscherf, R.; Hildebrandt, W. Effect of chronic intermittent hypoxia (CIH) on neuromuscular junctions and mitochondria in slow- and fast-twitch skeletal muscles of mice-the role of iNOS. Skelet. Muscle 2022, 12, 6. [Google Scholar] [CrossRef] [PubMed]
  57. Sander, H.; Wallace, S.; Plouse, R.; Tiwari, S.; Gomes, A.V. Ponceau S waste: Ponceau S staining for total protein normalization. Anal. Biochem. 2019, 575, 44–53. [Google Scholar] [CrossRef] [PubMed]
  58. Tietze, F. Enzymic method for quantitative determination of nanogram amounts of total and oxidized glutathione: Applications to mammalian blood and other tissues. Anal. Biochem. 1969, 27, 502–522. [Google Scholar] [CrossRef]
  59. Hack, V.; Gross, A.; Kinscherf, R.; Bockstette, M.; Fiers, W.; Berke, G.; Dröge, W. Abnormal glutathione and sulfate levels after interleukin 6 treatment and in tumor-induced cachexia. FASEB J. 1996, 10, 1219–1226. [Google Scholar] [CrossRef] [PubMed]
  60. Andersen, C.L.; Jensen, J.L.; Ørntoft, T.F. Normalization of real-time quantitative reverse transcription-PCR data: A model-based variance estimation approach to identify genes suited for normalization, applied to bladder and colon cancer data sets. Cancer Res. 2004, 64, 5245–5250. [Google Scholar] [CrossRef] [PubMed] [Green Version]
  61. Aulino, P.; Berardi, E.; Cardillo, V.M.; Rizzuto, E.; Perniconi, B.; Ramina, C.; Padula, F.; Spugnini, E.P.; Baldi, A.; Faiola, F.; et al. Molecular, cellular and physiological characterization of the cancer cachexia-inducing C26 colon carcinoma in mouse. BMC Cancer 2010, 10, 363. [Google Scholar] [CrossRef]
  62. Fogelman, D.R.; Morris, J.; Xiao, L.; Hassan, M.; Vadhan, S.; Overman, M.; Javle, S.; Shroff, R.; Varadhachary, G.; Wolff, R.; et al. A predictive model of inflammatory markers and patient-reported symptoms for cachexia in newly diagnosed pancreatic cancer patients. Support. Care Cancer 2017, 25, 1809–1817. [Google Scholar] [CrossRef]
  63. Barber, M.D.; Powell, J.J.; Lynch, S.F.; Fearon, K.C.; Ross, J.A. A polymorphism of the interleukin-1 beta gene influences survival in pancreatic cancer. Br. J. Cancer 2000, 83, 1443–1447. [Google Scholar] [CrossRef] [Green Version]
  64. Song, K.S.; Kim, K.; Chung, K.C.; Seol, J.H.; Yoon, J.H. Interaction of SOCS3 with NonO attenuates IL-1beta-dependent MUC8 gene expression. Biochem. Biophys. Res. Commun. 2008, 377, 946–951. [Google Scholar] [CrossRef]
  65. Qin, H.; Holdbrooks, A.T.; Liu, Y.; Reynolds, S.L.; Yanagisawa, L.L.; Benveniste, E.N. SOCS3 deficiency promotes M1 macrophage polarization and inflammation. J. Immunol. 2012, 189, 3439–3448. [Google Scholar] [CrossRef] [Green Version]
  66. Sandri, M.; Lin, J.; Handschin, C.; Yang, W.; Arany, Z.P.; Lecker, S.H.; Goldberg, A.L.; Spiegelman, B.M. PGC-1alpha protects skeletal muscle from atrophy by suppressing FoxO3 action and atrophy-specific gene transcription. Proc. Natl. Acad. Sci. USA 2006, 103, 16260–16265. [Google Scholar] [CrossRef] [PubMed] [Green Version]
  67. Kang, C.; Li, J.L. Role of PGC-1α signaling in skeletal muscle health and disease. Ann. N. Y. Acad. Sci. 2012, 1271, 110–117. [Google Scholar] [CrossRef]
  68. Wang, X.; Pickrell, A.M.; Zimmers, T.A.; Moraes, C.T. Increase in muscle mitochondrial biogenesis does not prevent muscle loss but increased tumor size in a mouse model of acute cancer-induced cachexia. PLoS ONE 2012, 7, e33426. [Google Scholar] [CrossRef]
  69. Mastropasqua, F.; Girolimetti, G.; Shoshan, M. PGC1α: Friend or Foe in Cancer? Genes 2018, 9, 48. [Google Scholar] [CrossRef] [PubMed] [Green Version]
  70. Zhong, Z.; Tao, Y.; Yang, H. Treatment with harmine ameliorates functional impairment and neuronal death following traumatic brain injury. Mol. Med. Rep. 2015, 12, 7985–7991. [Google Scholar] [CrossRef] [Green Version]
  71. Hamsa, T.P.; Kuttan, G. Harmine inhibits tumour specific neo-vessel formation by regulating VEGF, MMP, TIMP and pro-inflammatory mediators both in vivo and in vitro. Eur. J. Pharmacol. 2010, 649, 64–73. [Google Scholar] [CrossRef] [PubMed]
  72. Liu, X.; Li, M.; Tan, S.; Wang, C.; Fan, S.; Huang, C. Harmine is an inflammatory inhibitor through the suppression of NF-κB signaling. Biochem. Biophys. Res. Commun. 2017, 489, 332–338. [Google Scholar] [CrossRef]
  73. Mietto, B.S.; Mostacada, K.; Martinez, A.M. Neurotrauma and inflammation: CNS and PNS responses. Mediat. Inflamm. 2015, 2015, 251204. [Google Scholar] [CrossRef]
  74. Villarinho, J.G.; Pinheiro, K.e.V.; Pinheiro, F.e.V.; Oliveira, S.M.; Machado, P.; Martins, M.A.; Bonacorso, H.G.; Zanatta, N.; Fachinetto, R.; Ferreira, J. The antinociceptive effect of reversible monoamine oxidase-A inhibitors in a mouse neuropathic pain model. Prog. Neuro Sychopharmacol. Biol. Psychiatry 2013, 44, 136–142. [Google Scholar] [CrossRef] [Green Version]
  75. Hussain, A.M.; Renno, W.M.; Sadek, H.L.; Kayali, N.M.; Al-Salem, A.; Rao, M.S.; Khan, K.M. Monoamine oxidase-B inhibitor protects degenerating spinal neurons, enhances nerve regeneration and functional recovery in sciatic nerve crush injury model. Neuropharmacology 2018, 128, 231–243. [Google Scholar] [CrossRef]
  76. Scalabrin, M.; Pollock, N.; Staunton, C.A.; Brooks, S.V.; McArdle, A.; Jackson, M.J.; Vasilaki, A. Redox responses in skeletal muscle following denervation. Redox Biol. 2019, 26, 101294. [Google Scholar] [CrossRef] [PubMed]
  77. Pollock, N.; Staunton, C.A.; Vasilaki, A.; McArdle, A.; Jackson, M.J. Denervated muscle fibers induce mitochondrial peroxide generation in neighboring innervated fibers: Role in muscle aging. Free Radic. Biol. Med. 2017, 112, 84–92. [Google Scholar] [CrossRef]
  78. Daou, N.; Hassani, M.; Matos, E.; De Castro, G.S.; Costa, R.G.F.; Seelaender, M.; Moresi, V.; Rocchi, M.; Adamo, S.; Li, Z.; et al. Displaced Myonuclei in Cancer Cachexia Suggest Altered Innervation. Int. J. Mol. Sci. 2020, 21, 1092. [Google Scholar] [CrossRef] [PubMed] [Green Version]
  79. Anagnostou, M.E.; Hepple, R.T. Mitochondrial Mechanisms of Neuromuscular Junction Degeneration with Aging. Cells 2020, 9, 197. [Google Scholar] [CrossRef] [PubMed] [Green Version]
  80. Rosa-Caldwell, M.E.; Benson, C.A.; Lee, D.E.; Brown, J.L.; Washington, T.A.; Greene, N.P.; Wiggs, M.P. Mitochondrial Function and Protein Turnover in the Diaphragm are Altered in LLC Tumor Model of Cancer Cachexia. Int. J. Mol. Sci. 2020, 21, 7841. [Google Scholar] [CrossRef] [PubMed]
  81. Jiménez, J.; Riverón-Negrete, L.; Abdullaev, F.; Espinosa-Aguirre, J.; Rodríguez-Arnaiz, R. Cytotoxicity of the beta-carboline alkaloids harmine and harmaline in human cell assays in vitro. Exp. Toxicol. Pathol. 2008, 60, 381–389. [Google Scholar] [CrossRef]
  82. Nakagawa, Y.; Suzuki, T.; Ishii, H.; Ogata, A.; Nakae, D. Mitochondrial dysfunction and biotransformation of β-carboline alkaloids, harmine and harmaline, on isolated rat hepatocytes. Chem. Biol. Interact. 2010, 188, 393–403. [Google Scholar] [CrossRef] [PubMed]
  83. Nafisi, S.; Bonsaii, M.; Maali, P.; Khalilzadeh, M.A.; Manouchehri, F. Beta-carboline alkaloids bind DNA. J. Photochem. Photobiol. B 2010, 100, 84–91. [Google Scholar] [CrossRef] [PubMed]
  84. Pagano, B.; Caterino, M.; Filosa, R.; Giancola, C. Binding of Harmine Derivatives to DNA: A Spectroscopic Investigation. Molecules 2017, 22, 1831. [Google Scholar] [CrossRef] [PubMed] [Green Version]
  85. Cao, M.R.; Li, Q.; Liu, Z.L.; Liu, H.H.; Wang, W.; Liao, X.L.; Pan, Y.L.; Jiang, J.W. Harmine induces apoptosis in HepG2 cells via mitochondrial signaling pathway. Hepatobiliary Pancreat. Dis. Int. 2011, 10, 599–604. [Google Scholar] [CrossRef] [PubMed]
  86. Zhang, P.; Huang, C.R.; Wang, W.; Zhang, X.K.; Chen, J.J.; Wang, J.J.; Lin, C.; Jiang, J.W. Harmine Hydrochloride Triggers G2 Phase Arrest and Apoptosis in MGC-803 Cells and SMMC-7721 Cells by Upregulating p21, Activating Caspase-8/Bid, and Downregulating ERK/Bad Pathway. Phytother. Res. 2016, 30, 31–40. [Google Scholar] [CrossRef]
  87. Sobhani, A.M.; Ebrahimi, S.A.; Mahmoudian, M. An in vitro evaluation of human DNA topoisomerase I inhibition by Peganum harmala L. seeds extract and its beta-carboline alkaloids. J. Pharm. Pharm. Sci. 2002, 5, 19–23. [Google Scholar]
  88. Song, Y.; Kesuma, D.; Wang, J.; Deng, Y.; Duan, J.; Wang, J.H.; Qi, R.Z. Specific inhibition of cyclin-dependent kinases and cell proliferation by harmine. Biochem. Biophys. Res. Commun. 2004, 317, 128–132. [Google Scholar] [CrossRef] [PubMed]
  89. Giacobbo, B.L.; Doorduin, J.; Moraga-Amaro, R.; Nazario, L.R.; Schildt, A.; Bromberg, E.; Dierckx, R.A.J.O.; de Vries, E.F.J. Chronic harmine treatment has a delayed effect on mobility in control and socially defeated rats. Psychopharmacology 2020, 237, 1595–1606. [Google Scholar] [CrossRef] [Green Version]
  90. Arque, G.; Casanovas, A.; Dierssen, M. Dyrk1A is dynamically expressed on subsets of motor neurons and in the neuromuscular junction: Possible role in Down syndrome. PLoS ONE 2013, 8, e54285. [Google Scholar] [CrossRef] [PubMed] [Green Version]
  91. Kim, H.; Lee, K.S.; Kim, A.K.; Choi, M.; Choi, K.; Kang, M.; Chi, S.W.; Lee, M.S.; Lee, J.S.; Lee, S.Y.; et al. A chemical with proven clinical safety rescues Down-syndrome-related phenotypes in through DYRK1A inhibition. Dis. Model. Mech. 2016, 9, 839–948. [Google Scholar]
  92. Habib, M.Z.; Tadros MGAbd-Alkhalek, H.A.; Mohamad, M.I.; Eid, D.M.; Hassan, F.E.; Elhelaly, H.; Faramawy, Y.E.; Aboul-Fotouh, S. Harmine prevents 3-nitropropionic acid-induced neurotoxicity in rats via enhancing NRF2-mediated signaling: Involvement of p21 and AMPK. Eur. J. Pharmacol. 2022, 927, 175046. [Google Scholar] [CrossRef]
  93. Deng, X.; Mercer, S.E.; Sun, C.Y.; Friedman, E. The normal function of the cancer kinase Mirk/dyrk1B is to reduce reactive oxygen species. Genes Cancer 2014, 5, 22–30. [Google Scholar] [CrossRef] [PubMed] [Green Version]
  94. Friedman, E. Mirk/Dyrk1B in Cancer. J. Cell. Biochem. 2007, 102, 274–279. [Google Scholar] [CrossRef] [PubMed]
  95. Bhat, N.; Narayanan, A.; Fathzadeh, M.; Shah, K.; Dianatpour, M.; Abou Ziki, M.D.; Mani, A. Dyrk1b promotes autophagy during skeletal muscle differentiation by upregulating 4e-bp1. Cell Signal. 2022, 90, 110186. [Google Scholar] [CrossRef] [PubMed]
Figure 1. Scheme of the genetic mouse cross-breeding (LSL: Lox-Stop-Lox, Kras: Kirsten Rat Sarcoma, G12D/+: Glycine/Aspartate substitution in Codon 12, Trp53: Transformation-related protein 53, R172H/+: Arginine/Histidine substitution in Codon 172, Pdx-1-Cre: Pancreatic and duodenal homeobox 1-cyclization recombination) [45] (A), and the four different groups under test, i.e., wild type mice with (WTHH) or without (WT) HH treatment as well as triple transgenic PDAC-bearing mice with (CaHH) or without (Ca) HH treatment (B).
Biomedicines 11 00912 g001
Figure 2. Examples of two serial cross-sections of soleus muscle showing lectin- (A) and corresponding ATPase-staining (B). Fibers in the lectin-staining are edged in blue and the brown capillaries are marked with crosses (A). The three distinguishable fiber types (I, IIA, IIBX) in the ATPase-staining are indicated in (B). * Symbol indicates a muscle spindle. Representative locations of the region of interest (edged by a rectangle) are indicated for the soleus and gastrocnemius muscle within the triceps surae muscle stained for ATPase (C).
Biomedicines 11 00912 g002
Figure 3. (A) Relative MAO-A expression in gastrocnemius muscle in WT and PDAC-bearing (Ca) mice with or without HH treatment as determined by Western blot with normalization for total protein abundance by Ponceau staining (see Section 2). (B) Percentage of MAO-A positive area by immunohistochemistry of gastrocnemius cryo-cross-sections in the WT and the Ca group with representative examples below. Data are mean ± SEM, x p < 0.05.
Biomedicines 11 00912 g003
Figure 4. (A) CSA of fiber type IIBX of the gastrocnemius muscle. ANOVA revealed a significant reduction in CSA triggered by PDAC (Ca) or HH treatment. (B) Corresponding minFeret of the fiber type IIBX of the gastrocnemius muscle. A significant reduction by the HH treatment can be seen. In contrast to the CSA, no PDAC effect was found. (C) Reduced CSA led to an increased capillary density triggered by the HH effect (# p < 0.05; ## p < 0.01; ### p < 0.001; ns, not significant; wild type mice (WT), n = 9; PDAC mice (Ca), n = 7; WT mice with HH treatment (WTHH), n = 11; PDAC mice with HH treatment (CaHH), n = 6). Mean values ± SD and ANOVA results are shown. (D) Representative examples of ATPase-staining for male WT, Ca, WTHH, and CaHH mice in gastrocnemius muscle regions solely containing type IIBX fibers.
Biomedicines 11 00912 g004
Figure 5. (A) Relative mRNA expression of IL-1β in the gastrocnemius muscle with a PDAC triggered increase in Ca compared to WT mice, and HH triggered decrease in CaHH compared to Ca mice. (B) Relative mRNA expression of Socs3 showed an interaction between PDAC and HH with an increase in mRNA expression in Ca compared to WT mice, and a decrease in mRNA expression in CaHH compared to Ca mice. (C) Relative mRNA expression of Ppargc1a showed the HH effect with a decrease in mRNA expression in WTHH compared to WT mice. PDAC effect (x p < 0.05); HH effect (# p < 0.05; ## p < 0.01); ns, not significant. WT, n = 9; Ca, n = 11; WTHH, n = 11; CaHH, n = 7. Mean values ± SD and ANOVA results are shown.
Biomedicines 11 00912 g005
Figure 6. (AC) CSA of the fiber types I, IIA, and IIBX of the soleus muscle. In types I and IIA, a reduction in CSA by the PDAC could be found using ANOVA. CSA of the type IIBX fibers was not altered. (DF) Corresponding minFeret of the fiber types I, IIA, and IIBX of the soleus muscle. Similar to CSA, a shortage in types I and IIA was found using ANOVA. (GI) Distribution of the three fiber types of the soleus muscle. PDAC and a PDAC–HH interaction caused a fiber shift from type IIA to types I and IIBX. PDAC effect (x p < 0.05; xx p < 0.01); HH effect (# p < 0.05); ns, not significant. n = 29, WT = 11, Ca = 8, WTHH = 6, CaHH = 4. Mean values ± SD and ANOVA results are shown. (J) Representative examples for soleus muscle fiber typing by ATPase-staining in WT, Ca, WTHH, and CaHH mice.
Biomedicines 11 00912 g006
Figure 7. Gene expressions in soleus muscle. (A) MuRF1, (B) FBXO32, (C) BAX, (D) IL-1β; WT, n = 11; Ca, n = 7; WTHH, n = 6; CaHH, n = 6; PDAC effect (x p < 0.05; xx p < 0.01); HH effect (# p < 0.05; ## p < 0.01); ns, not significant. Mean values ± SD and ANOVA results are shown.
Biomedicines 11 00912 g007
Figure 8. Representative examples of NMJ in quadriceps muscle for the WT, Ca, WTHH, and CaHH group, co-stained post-synapsis (BTX = α-Bungarotoxin) and pre-synapsis (vAChT = vesicular acetylcholine transporter) and their respective overlay.
Biomedicines 11 00912 g008
Table 1. QuantiTect primer assays used for qPCR.
Primer AssaySymbolAmplicon Length (bp)Cat. No.
Actin BetaACTB77QT01136772
BCL2 Associated X, Apoptosis RegulatorBAX76QT00102536
BCL2 Apoptosis RegulatorBCL-2104QT02392292
Caspase 3Caspase3150QT01164779
CD68 MoleculeCD6867QT00254051
F-Box Protein 32FBXO32103QT00158543
Interleukin 1 BetaIL-1β150QT01048355
Interleukin 6IL-6128QT00098875
Monoamine Oxidase AMAO-A81QT00109326
Monoamine Oxidase BMAO-B93QT00145124
Matrix Metallopeptidase 9MMP984QT00108815
MyogeninMyog115QT00112378
Paired Box Protein 7PAX7135QT00147728
PPARG Coactivator 1 AlphaPpargc1a63QT00156303
Prostaglandin-Endoperoxide Synthase 2PTGS2 (COX2)95QT00165347
Retention of Endoplasmic Reticulum protein 1 (S. cerevisiae)RER186QT00146580
Suppressor of Cytokine Signaling 3SOCS390QT00156303
Sequestosome 1Sqstm1 (P62)91QT00127855
TATA Box Binding ProteinTBP114QT00198443
Tumor Necrosis FactorTNFα112QT00104006
Tripartite Motif Containing 63 TRIM63(MuRF1)116QT00291991
Vascular Endothelial Growth
Factor A
VEGFA117QT00160769
All Primers were purchased at Qiagen N.V., Venlo, The Netherlands.
Table 2. Group characteristics of untreated and treated WT and PDAC mice.
WTCaWTHHCaHHANOVA
PDACHH Interaction
n (m/f)11(5/6)11 (7/4)11
(8/3)
7 (4/3)---
weight (g)27.88 ± 6.1627.65 ± 3.4727.17 ± 4.5224.03 ± 3.16p = 0.314p = 0.186p = 0.332
age(months)3.91 ± 0.545.42 ± 0.774.61 ± 0.114.50 ± 0.36p < 0.001p = 0.552p < 0.001
Shown are body weight, age, and total number (n) of male (m) and female (f) wild type (WT) or pancreatic ductal adenocarcinoma (Ca) mice with/without HH. Mean values ± SD and ANOVA results are shown.
Table 3. Additional RT-qPCR data of the gastrocnemius muscle.
WTCaWTHHCaHH ANOVA
PDACHHInteraction
n (m/f)9 (4/5)11 (7/4)11 (8/3)7 (4/3)---
Apoptosis/AtrophyBAX1 ± 1.570.65 ± 0.670.42 ± 0.580.73 ± 0.69p = 0.902p = 0.406p = 0.327
BCL-21 ± 0.571.06 ± 0.581.62 ± 2.191.11 ± 0.85p = 0.662p = 0.441p = 0.535
Caspase 31 ± 1.090.79 ± 0.440.69 ± 0.360.92 ± 0.82p = 0.977p = 0.661p = 0.388
MuRF11 ± 2.450.14 ± 0.160.19 ± 0.530.11 ± 0.11p = 0.252p = 0.298p = 0.371
Fbxo321 ± 0.822.36 ± 2.840.57 ± 0.310.87 ± 0.43p = 0.128p = 0.107p = 0.349
MAO-A1 ± 1.440.55 ± 0.490.20 ± 0.100.52 ± 0.54p = 0.743p = 0.113p = 0.168
MAO-B1 ± 1.520.45 ± 0.540.21 ± 0.310.33 ± 0.31p = 0.407p = 0.104p = 0.253
MMP91 ± 2.430.25 ± 0.230.17 ± 0.370.15 ± 0.18p = 0.337p = 0.252p = 0.386
InflammationCD 681 ± 2.010.68 ± 0.690.64 ± 1.531.99 ± 2.63p = 0.457p = 0.499p = 0.180
TNFα1 ± 0.991.65 ± 2.150.53 ± 0.510.51 ± 0.45p = 0.461p = 0.093p = 0.466
IL-61 ± 1.520.83 ± 0.770.30 ± 0.581.24 ± 2.29p = 0.461p = 0.689p = 0.239
COX21 ± 1.061.45 ± 2.270.60 ± 0.620.20 ± 0.36p = 0.903p = 0.105p = 0.381
Total number (n) of male (m) and female (f) wild type (WT) or pancreatic ductal adenocarcinoma (Ca) mice with/without HH treatment. Mean values ± SD and ANOVA results are shown.
Table 4. Intracellular glutathione content and redox state in gastrocnemius muscle.
WTCaWTHHCaHHANOVA
PDACHHInteraction
n (m/f)11 (6/5)11 (7/4)10 (7/3)4 (2/2)---
tGSH (pmol/g)10.40 ± 0.418.41 ± 0.815.32 ± 0.985.45 ± 1.97p = 0.342p < 0.001p = 0.281
rGSH (pmol/g)7.89 ± 0.447.07 ± 0.834.03 ± 0.943.66 ± 1.81p = 0.536p = 0.001p = 0.811
GSSG
(pmol/g)
2.51 ± 0.181.35 ± 0.191.29 ± 0.141.79 ± 0.69p = 0.189p = 0.129p = 0.002
rGSH/GSSG
(ratio)
3.31 ± 0.346.25 ± 0.923.18 ± 0.843.88 ± 1.94p = 0.062p = 0.192p = 0.241
Total number (n) of male (m) and female (f) wild type (WT) or pancreatic ductal adenocarcinoma (Ca) mice with/without HH treatment. Data given as mean values ± SD, GSH = glutathione; GSSG = glutathione disulfide. p-values by two-factorial ANOVA applied to the total study population are given on the right.
Table 5. Additional histomorphometric parameters of the soleus muscle.
WTCaWTHHCaHHANOVA
PDACHHInteraction
n (m/f)11 (5/6)8 (5/3)6 (6/0)4 (2/2)---
CSA (µm2)1351 ± 2991154 ± 861286 ± 1991037 ± 31p = 0.019p = 0.338p = 0.777
minFeret (µm)33.66 ± 4.1131.15 ± 1.4831.75 ± 2.3328.54 ± 2.33p = 0.032p = 0.092p = 0.789
capillary contacts/all fiber types (n/fiber)4.35 ± 0.814.49 ± 0.734.39 ± 0.494.02 ± 0.38p = 0.896p = 0.573p = 0.383
capillary contacts/fiber type I (n/fiber)4.50 ± 0.904.57 ± 0.814.56 ± 0.544.17 ± 0.45p = 0.791p = 0.683p = 0.483
capillary contacts/fiber type IIA (n/fiber)4.23 ± 0.794.37 ± 0.674.25 ± 0.523.83 ± 0.27p = 0.861p = 0.449p = 0.323
capillary contacts/fiber type IIBX (n/fiber)4.08 ± 1.074.26 ± 0.984.47 ± 0.623.70 ± 0.55p = 0.705p = 0.999p = 0.233
capillary density (n/mm2)1144 ± 1761265 ± 2461186 ± 3081248 ± 141p = 0.282p = 0.851p = 0.762
Total number (n) of male (m) and female (f) wild type (WT) or pancreatic ductal adenocarcinoma (Ca) mice with/without HH treatment. Fiber cross-sectional area (CSA). Mean values ± SD and ANOVA results are shown.
Table 6. RT-qPCR of the soleus muscle.
WTCaWTHHCaHHANOVA
PDACHHInteraction
n (m/f)11 (6/5)7 (5/2)6 (4/2)6 (3/3)---
Apoptosis/AtrophyBCL-21 ± 0.520.94 ± 0.530.50 ± 0.360.70 ± 0.71p = 0.836p = 0.088p = 0.564
Caspase 31 ± 0.470.92 ± 0.371.22 ± 0.580.49 ± 0.42p = 0.073p = 0.678p = 0.094
p621 ± 0.161.19 ± 0.341.05 ± 0.091.67 ± 1.10p = 0.090p = 0.262p = 0.321
MAO-A1 ± 0.210.94 ± 0.250.69 ± 0.101.00 ± 0.36p = 0.332p = 0.162p = 0.070
MAO-B1 ± 0.230.89 ± 0.130.79 ± 0.150.94 ± 0.48p = 0.949p = 0.422p = 0.245
MMP91 ± 0.610.63 ± 0.360.37 ± 0.220.50 ± 0.49p = 0.405p = 0.043p = 0.205
InflammationCD 681 ± 0.241.40 ± 0.491.59 ± 0.934.61 ± 5.41p = 0.145p = 0.086p = 0.203
TNFα1 ± 0.811.16 ± 1.091.24 ± 0.400.65 ± 0.80p = 0.661p = 0.758p = 0.270
IL-61 ± 0.341.18 ± 0.630.95 ± 0.341.43 ± 1.52p = 0.336p = 0.788p = 0.639
COX 21 ± 1.092.55 ± 2.081.77 ± 1.211.22 ± 2.72p = 0.346p = 0.797p = 0.160
Socs31 ± 1.122.32 ± 1.890.71 ± 0.280.84 ± 0.59p = 0.088p = 0.091p = 0.219
AngiogenesisVEGFA1 ± 0.241.14 ± 0.211.11 ± 0.521.13 ± 0.94p = 0.657p = 0.787p = 0.797
Myogenesis/Ppargc1a1 ± 1.021.74 ± 1.051.99 ± 1.421.54 ± 1.21p = 0.602p = 0.340p = 0.213
MyoG1 ± 0.410.92 ± 0.220.55 ± 0.161.83 ± 1.71p = 0.152p = 0.616p = 0.048
PAX71 ± 0.621.03 ± 0.591.04 ± 0.710.72 ± 0.78p = 0.662p = 0.660p = 0.526
Total number (n) of male (m) and female (f) wild type (WT) or pancreatic ductal adenocarcinoma (Ca) mice with/without HH treatment. Mean values ± SD and ANOVA results are shown.
Table 7. Fraction of centronucleated fibers in gastrocnemius and soleus muscles.
WTCaWTHHCaHHANOVA
PDACHHInteraction
Gastrocnemius muscle
n (m/f)9 (3/6)7 (4/3)11 (8/3)6 (3/3)---
% all fibers0.52 ± 0.230.71 ± 0.290.83 ± 0.272.17 ± 0.10p = 0.240p < 0.133p = 0.532
Soleus muscle
n (m/f)11 (5/6)8 (5/3)6 (6/0)4 (2/2)---
% all fibers 0.08 ± 0.080.31 ± 0.210.63 ± 0.310.75 ± 0.55p = 0.475p = 0.059p = 0.815
% I0.00 ± 0.000.51 ± 0.340.58 ± 0.360.71 ± 0.71p = 0.325p = 0.243p = 0.569
% IIA0.18 ± 0.180.16 ± 0.160.00 ± 0.000.33 ± 0.33p = 0.443p = 0.975p = 0.395
% IIBX00.0 ± 0.000.00 ± 0.002.50 ± 1.601.79 ± 1.79p = 0.679p = 0.019p = 0.679
Gastrocnemius and soleus muscle IIBX fibers
n (m/f)20 (8/12)15 (9/6)17 (14/3)10 (5/5)---
% IIBX0.23 ± 0.120.33 ± 0.161.41 ± 0.591.58 ± 0.74p = 0.760p = 0.006p = 0.938
Total number (n) of male (m) and female (f) wild type (WT) or pancreatic ductal adenocarcinoma (Ca) mice with/without HH-treatment. Data are given as mean values ± SD, p values by two-factorial ANOVA applied to the total study population are given on the right.
Table 8. Pre- and post-synaptic area and overlap of NMJ in quadriceps muscle.
WTCaWTHHCaHHANOVA
PDACHHInteraction
n (m/f)5 (3/2)4 (4/0)5 (3/2)5 (3/2)---
BTX + area (µm2)2.85 ± 0.183.06 ± 0.402.55 ± 0.142.17 ± 0.10p = 0.680p = 0.013p = 0.182
vAChT + area (µm2)3.12 ± 0.284.31 ± 0.583.65 ± 0.272.73 ± 0.09p = 0.683p = 0.124p = 0.005
vAChT/BTX overlap (µm2)0.53 ± 0.030.98 ± 0.250.68 ± 0.090.48 ± 0.03p = 0.279p = 0.127p = 0.010
vAChT/BTX overlap (%)18.61 ± 0.5730.54 ± 4.2026.40 ± 2.3421.99 ± 1.60p = 0.125p = 0.872p = 0.003
Total number (n) of male (m) and female (f) wild type (WT) or pancreatic ductal adenocarcinoma (Ca) mice with/without HH treatment. Data are given as mean values ± SD, BTX = α-Bungarotoxin, vAChT = vesicular acetylcholine transporter. p-values by two-factorial ANOVA applied to the total study population are given on the right.
Disclaimer/Publisher’s Note: The statements, opinions and data contained in all publications are solely those of the individual author(s) and contributor(s) and not of MDPI and/or the editor(s). MDPI and/or the editor(s) disclaim responsibility for any injury to people or property resulting from any ideas, methods, instructions or products referred to in the content.

