

Skin Bioimpedance Analysis to Determine Cellular Integrity by Phase Angle in Women with Fibromyalgia: A Cross-Sectional Study
 , , , , , and
Abstract
:1. Introduction
2. Methods
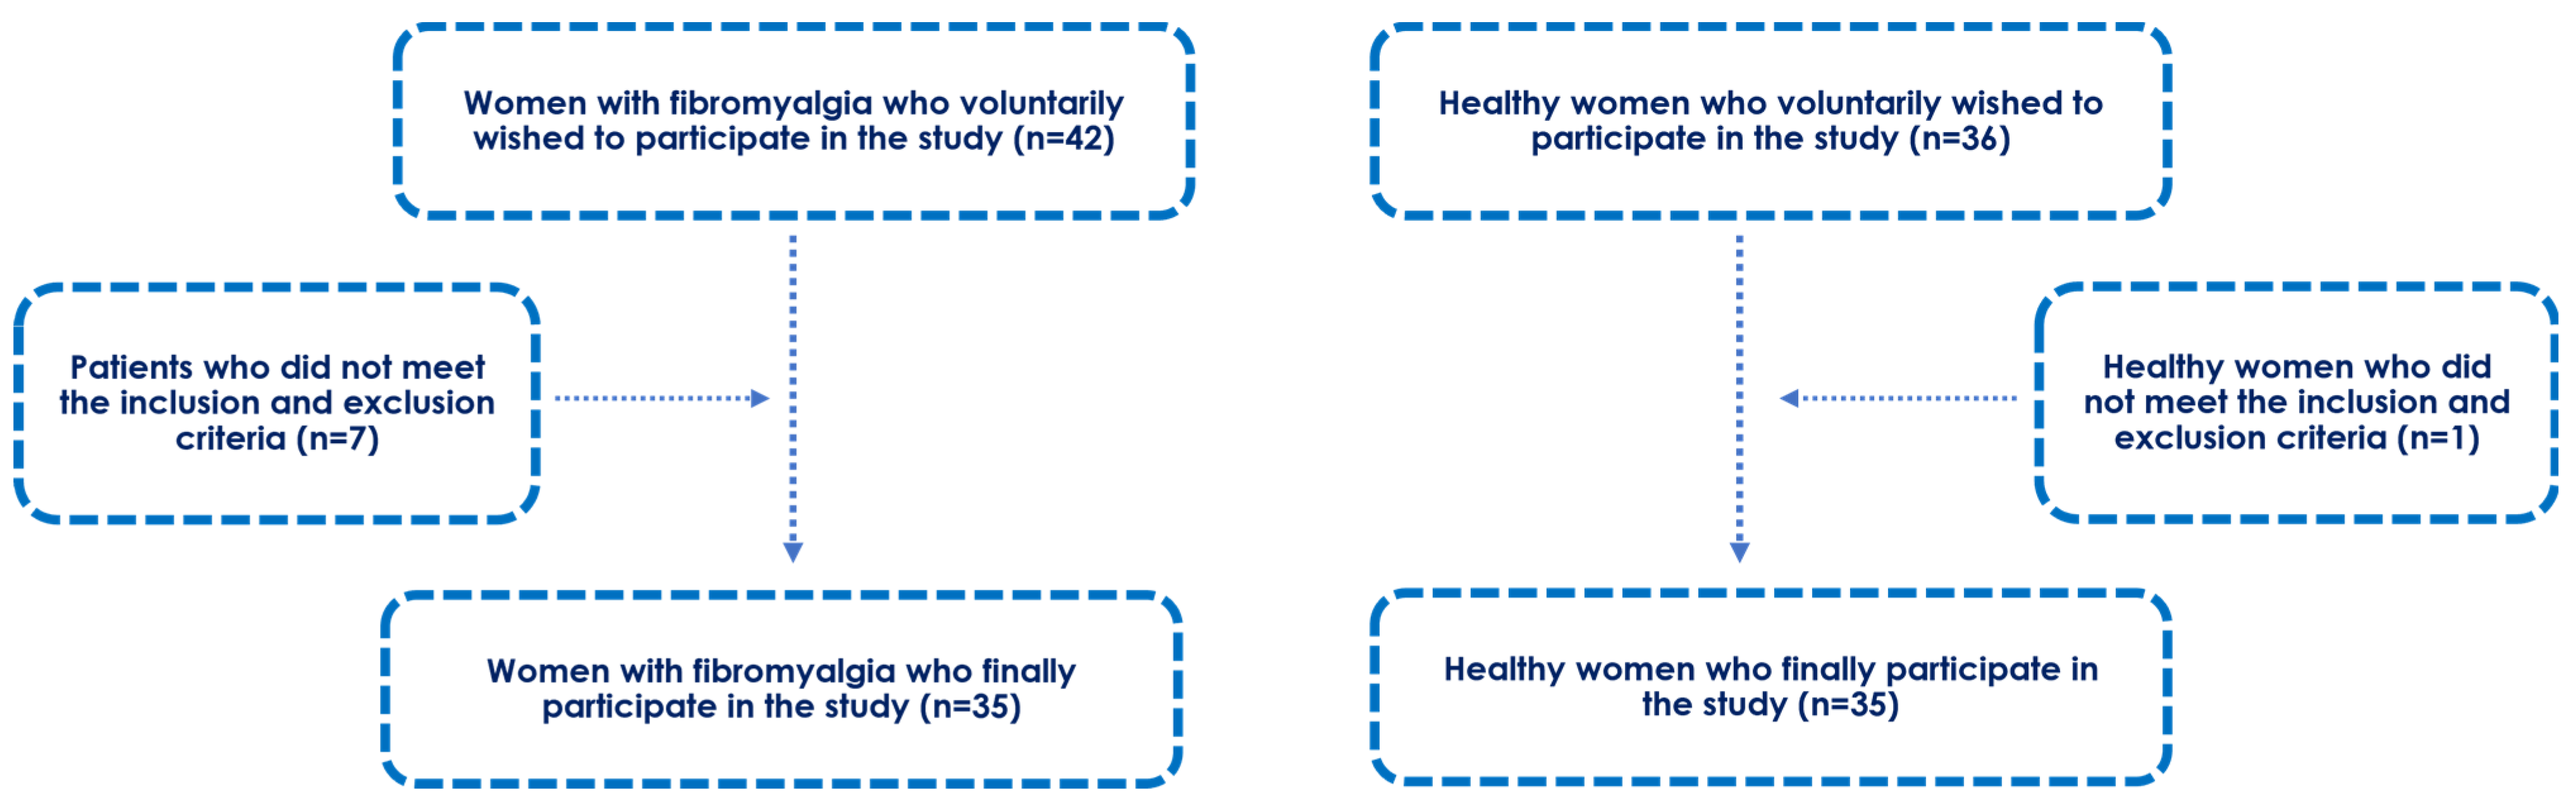
2.1. Participants
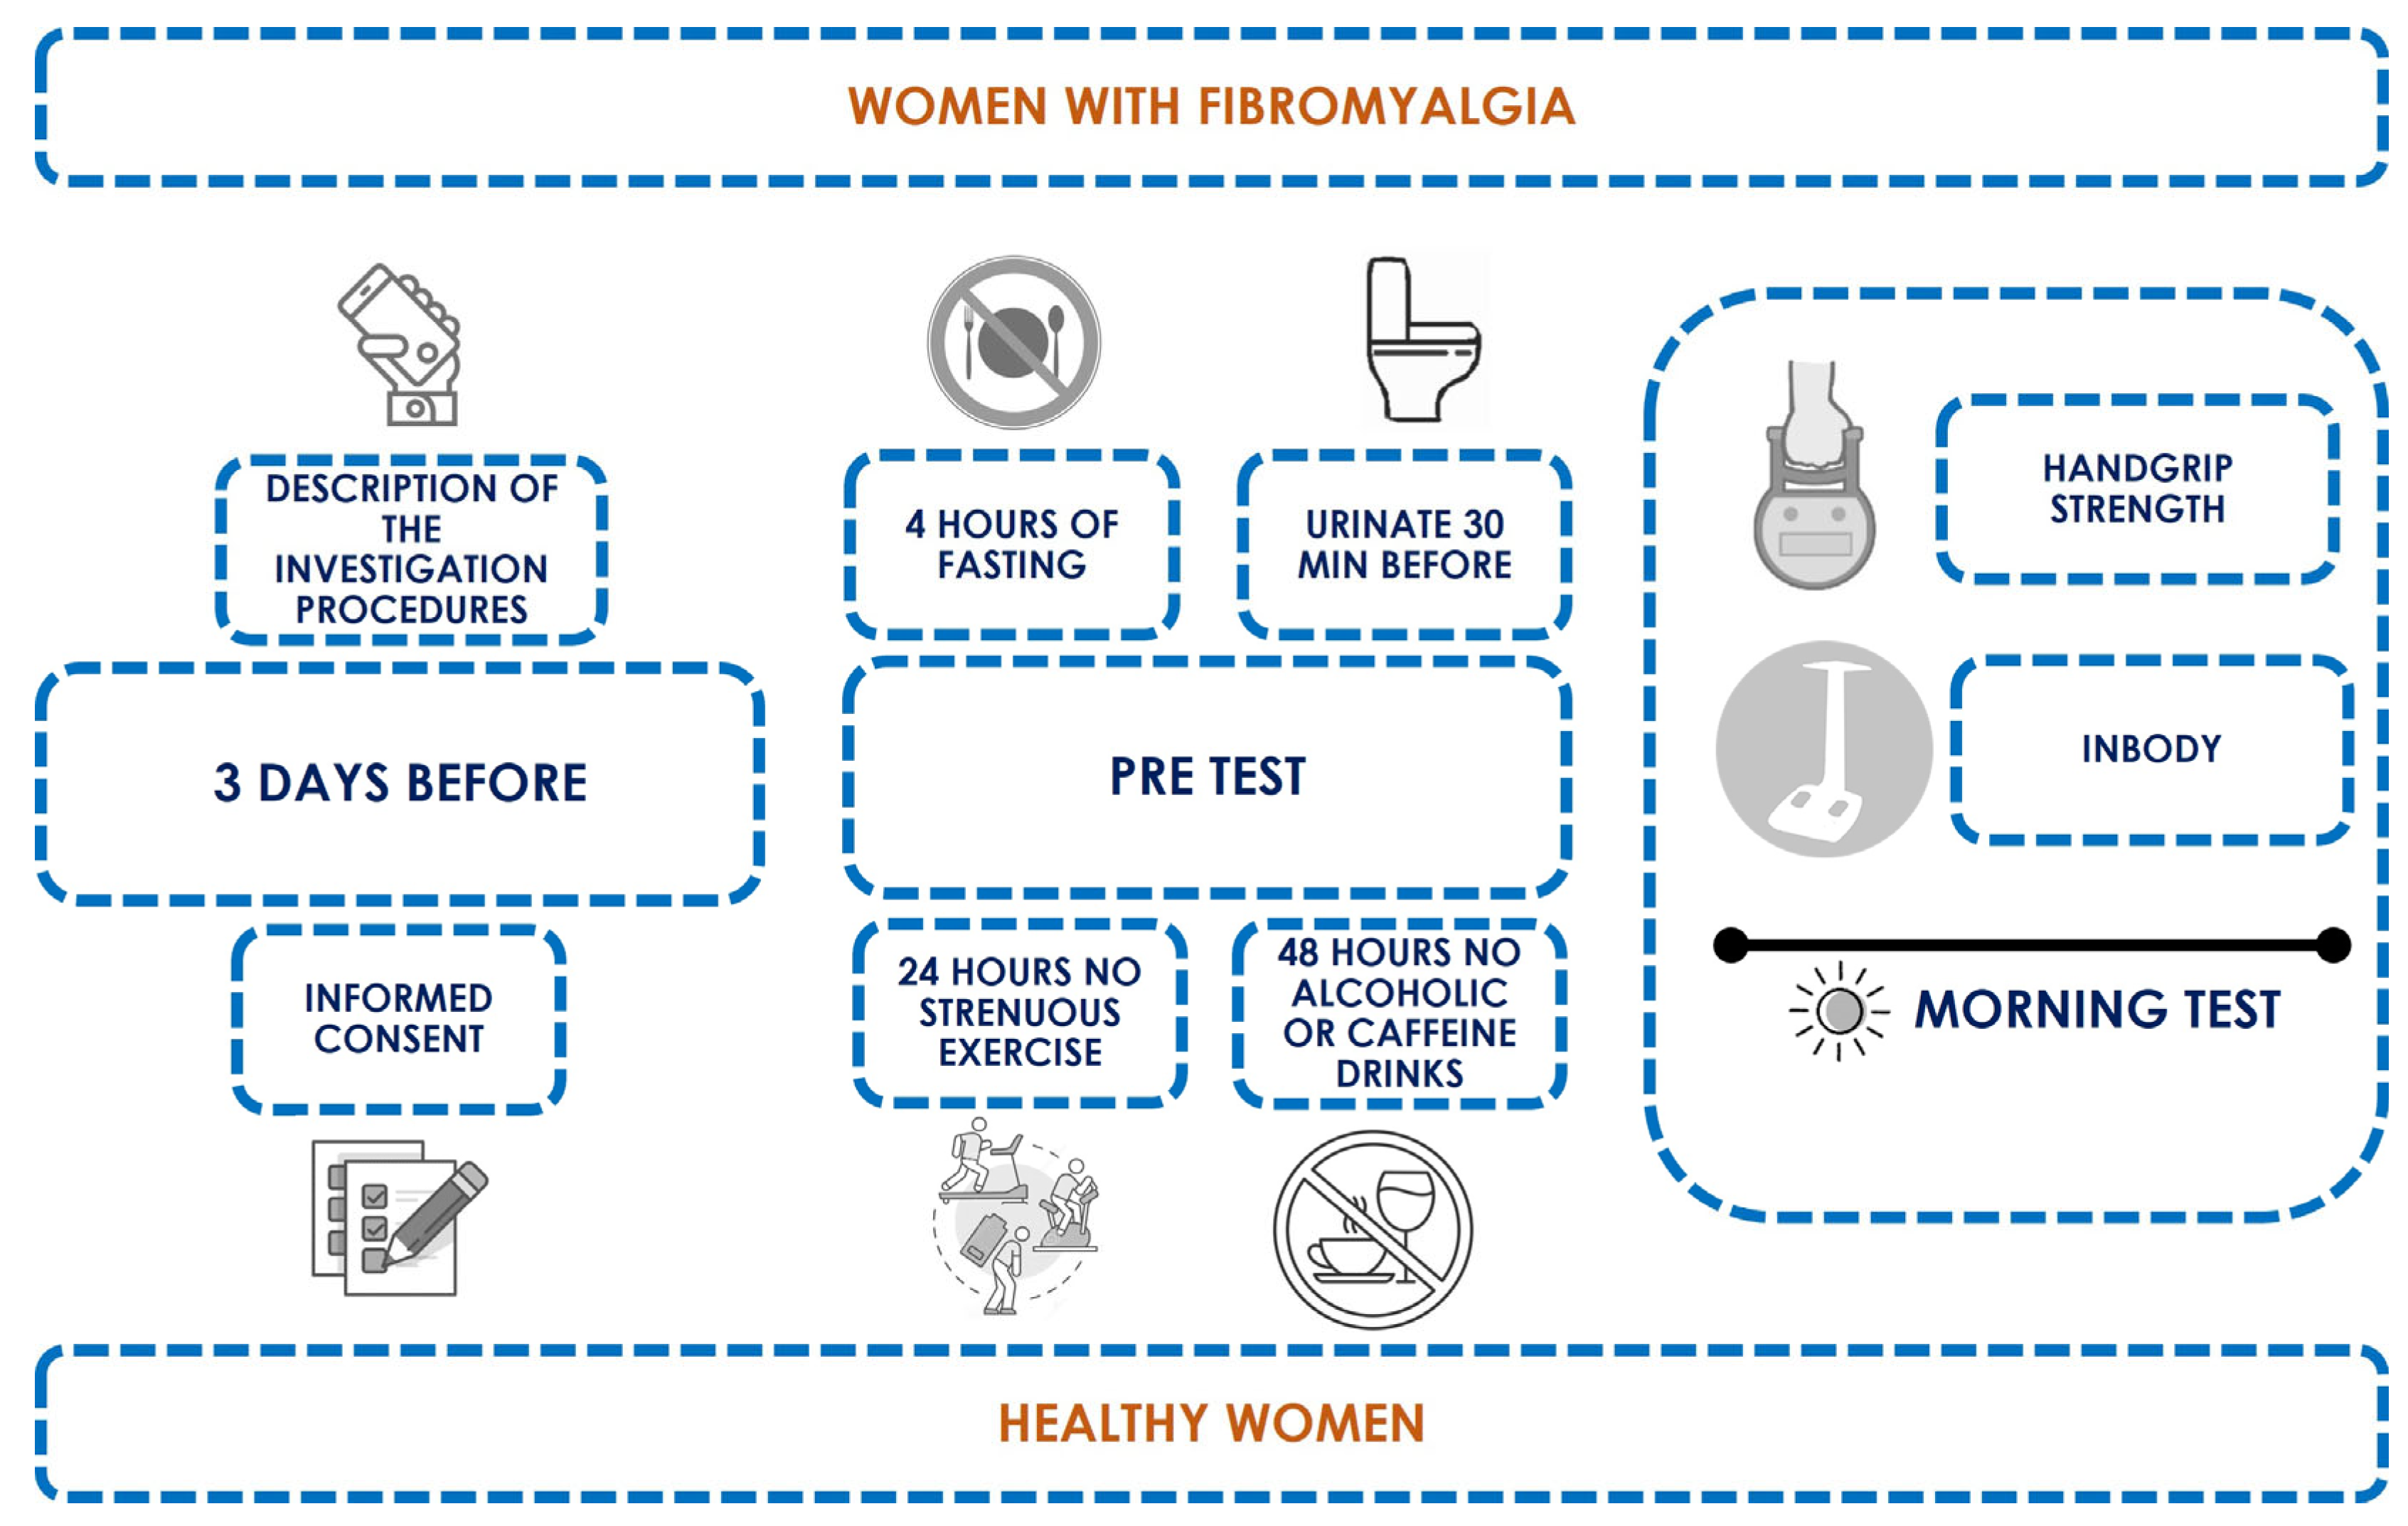
2.2. Study Design
2.3. Phase Angle (PhA) and Body Composition
2.4. Maximum Isometric Handgrip Strength
2.5. Statistical Analysis
3. Results
3.1. Descriptive Data
3.2. Fat, Water, and Muscle Mass Differences between Groups
3.3. Phase Angle Differences between Groups
3.4. Multivariate Linear Regression Model for Whole Body PhA Prediction
4. Discussion
5. Conclusions
Author Contributions
Funding
Institutional Review Board Statement
Informed Consent Statement
Data Availability Statement
Acknowledgments
Conflicts of Interest
References
- Góes, S.M.; Leite, N.; Shay, B.L.; Homann, D.; Stefanello, J.M.F.; Rodacki, A.L.F. Functional Capacity, Muscle Strength and Falls in Women with Fibromyalgia. Clin. Biomech. 2012, 27, 578–583. [Google Scholar] [CrossRef] [PubMed]
- Larsson, A.; Palstam, A.; Bjersing, J.; Löfgren, M.; Ernberg, M.; Kosek, E.; Gerdle, B.; Mannerkorpi, K. Controlled, Cross-Sectional, Multi-Center Study of Physical Capacity and Associated Factors in Women with Fibromyalgia. BMC Musculoskelet. Disord. 2018, 19, 121. [Google Scholar] [CrossRef] [PubMed]
- Gyorfi, M.; Rupp, A.; Abd-Elsayed, A. Fibromyalgia Pathophysiology. Biomedicines 2022, 10, 3070. [Google Scholar] [CrossRef] [PubMed]
- Siracusa, R.; Di Paola, R.; Cuzzocrea, S.; Impellizzeri, D. Fibromyalgia: Pathogenesis, Mechanisms, Diagnosis and Treatment Options Update. Int. J. Mol. Sci. 2021, 22, 3891. [Google Scholar] [CrossRef] [PubMed]
- Ozgocmen, S.; Ozyurt, H.; Sogut, S.; Akyol, O. Current Concepts in the Pathophysiology of Fibromyalgia: The Potential Role of Oxidative Stress and Nitric Oxide. Rheumatol. Int. 2006, 26, 585–597. [Google Scholar] [CrossRef] [PubMed]
- Pieczenik, S.R.; Neustadt, J. Mitochondrial Dysfunction and Molecular Pathways of Disease. Exp. Mol. Pathol. 2007, 83, 84–92. [Google Scholar] [CrossRef] [PubMed]
- Fernández-Araque, A.; Verde, Z.; Torres-Ortega, C.; Sainz-Gil, M.; Velasco-Gonzalez, V.; González-Bernal, J.J.; Mielgo-Ayuso, J. Effects of Antioxidants on Pain Perception in Patients with Fibromyalgia-A Systematic Review. J. Clin. Med. 2022, 11, 2462. [Google Scholar] [CrossRef]
- Biazus Soares, G.; Mahmoud, O.; Yosipovitch, G. Role of Antioxidants in Itch Treatment: Lessons Learned from Pain Management. Itch 2023, 8, e68. [Google Scholar] [CrossRef]
- Wang, Z.-Q.; Porreca, F.; Cuzzocrea, S.; Galen, K.; Lightfoot, R.; Masini, E.; Muscoli, C.; Mollace, V.; Ndengele, M.; Ischiropoulos, H.; et al. A Newly Identified Role for Superoxide in Inflammatory Pain. J. Pharmacol. Exp. Ther. 2004, 309, 869–878. [Google Scholar] [CrossRef]
- Fatima, G.; Das, S.K.; Mahdi, A.A. Some Oxidative and Antioxidative Parameters and Their Relationship with Clinical Symptoms in Women with Fibromyalgia Syndrome. Int. J. Rheum. Dis. 2017, 20, 39–45. [Google Scholar] [CrossRef]
- Karatas, G.; Gunduz, R.; Haskul, I.; Ustun, B.; Neselioglu, S.; Karatas, F.; Akyuz, M.; Erel, O. Dynamic Thiol and Disulphide Homoeostasis in Fibromyalgia. Arch. Med. Sci. 2020, 16, 597–602. [Google Scholar] [CrossRef] [PubMed]
- Assavarittirong, C.; Samborski, W.; Grygiel-Górniak, B. Oxidative Stress in Fibromyalgia: From Pathology to Treatment. Oxid. Med. Cell. Longev. 2022, 2022, 1582432. [Google Scholar] [CrossRef] [PubMed]
- Ward, L.C. Bioelectrical Impedance Analysis for Body Composition Assessment: Reflections on Accuracy, Clinical Utility, and Standardisation. Eur. J. Clin. Nutr. 2019, 73, 194–199. [Google Scholar] [CrossRef] [PubMed]
- Lukaski, H.C.; Vega Diaz, N.; Talluri, A.; Nescolarde, L. Classification of Hydration in Clinical Conditions: Indirect and Direct Approaches Using Bioimpedance. Nutrients 2019, 11, 809. [Google Scholar] [CrossRef] [PubMed]
- Sgarro, G.A.; Grilli, L.; Valenzano, A.A.; Moscatelli, F.; Monacis, D.; Toto, G.; De Maria, A.; Messina, G.; Polito, R. The Role of BIA Analysis in Osteoporosis Risk Development: Hierarchical Clustering Approach. Diagnostics 2023, 13, 2292. [Google Scholar] [CrossRef]
- da Silva, B.R.; Gonzalez, M.C.; Cereda, E.; Prado, C.M. Exploring the Potential Role of Phase Angle as a Marker of Oxidative Stress: A Narrative Review. Nutrition 2022, 93, 111493. [Google Scholar] [CrossRef]
- Marra, M.; Di Vincenzo, O.; Sammarco, R.; Morlino, D.; Scalfi, L. Bioimpedance phase angle in elite male athletes: A segmental approach. Physiol. Meas. 2021, 41, 125007. [Google Scholar] [CrossRef]
- Di Vincenzo, O.; Marra, M.; Scalfi, L. Bioelectrical Impedance Phase Angle in Sport: A Systematic Review. J. Int. Soc. Sports Nutr. 2019, 16, 1. [Google Scholar] [CrossRef]
- Garlini, L.M.; Alves, F.D.; Ceretta, L.B.; Perry, I.S.; Souza, G.C.; Clausell, N.O. Phase Angle and Mortality: A Systematic Review. Eur. J. Clin. Nutr. 2019, 73, 495–508. [Google Scholar] [CrossRef]
- Lukaski, H.C. Evolution of Bioimpedance: A Circuitous Journey from Estimation of Physiological Function to Assessment of Body Composition and a Return to Clinical Research. Eur. J. Clin. Nutr. 2013, 67, S2–S9. [Google Scholar] [CrossRef]
- Matthie, J.R. Bioimpedance Measurements of Human Body Composition: Critical Analysis and Outlook. Expert Rev. Med. Devices 2008, 5, 239–261. [Google Scholar] [CrossRef] [PubMed]
- Norman, K.; Stobäus, N.; Pirlich, M.; Bosy-Westphal, A. Bioelectrical Phase Angle and Impedance Vector Analysis—Clinical Relevance and Applicability of Impedance Parameters. Clin. Nutr. 2012, 31, 854–861. [Google Scholar] [CrossRef] [PubMed]
- Stobäus, N.; Pirlich, M.; Valentini, L.; Schulzke, J.D.; Norman, K. Determinants of Bioelectrical Phase Angle in Disease. Br. J. Nutr. 2012, 107, 1217–1220. [Google Scholar] [CrossRef] [PubMed]
- Arnold, L.M.; Bennett, R.M.; Crofford, L.J.; Dean, L.E.; Clauw, D.J.; Goldenberg, D.L.; Fitzcharles, M.-A.; Paiva, E.S.; Staud, R.; Sarzi-Puttini, P.; et al. AAPT Diagnostic Criteria for Fibromyalgia. J. Pain 2019, 20, 611–628. [Google Scholar] [CrossRef] [PubMed]
- Cohen, J. A Power Primer. Psychol. Bull. 1992, 112, 155–159. [Google Scholar] [CrossRef] [PubMed]
- von Elm, E.; Altman, D.G.; Egger, M.; Pocock, S.J.; Gøtzsche, P.C.; Vandenbroucke, J.P. The Strengthening the Reporting of Observational Studies in Epidemiology (STROBE) Statement: Guidelines for Reporting Observational Studies. Lancet 2007, 370, 1453–1457. [Google Scholar] [CrossRef] [PubMed]
- Kyle, U.G.; Bosaeus, I.; De Lorenzo, A.D.; Deurenberg, P.; Elia, M.; Gomez, J.M.; Heitmann, B.L.; Kent-Smith, L.; Melchior, J.-C.; Pirlich, M.; et al. Bioelectrical Impedance Analysis--Part I: Review of Principles and Methods. Clin. Nutr. 2004, 23, 1226–1243. [Google Scholar] [CrossRef]
- Norman, K.; Wirth, R.; Neubauer, M.; Eckardt, R.; Stobäus, N. The Bioimpedance Phase Angle Predicts Low Muscle Strength, Impaired Quality of Life, and Increased Mortality in Old Patients with Cancer. J. Am. Med. Dir. Assoc. 2015, 16, 173.e17–173.e22. [Google Scholar] [CrossRef]
- de Castro, J.A.C.; de Lima, L.R.A.; Silva, D.A.S. Accuracy of Octa-Polar Bioelectrical Impedance Analysis for the Assessment of Total and Appendicular Body Composition in Children and Adolescents with HIV: Comparison with Dual Energy X-Ray Absorptiometry and Air Displacement Plethysmography. J. Hum. Nutr. Diet. 2018, 31, 276–285. [Google Scholar] [CrossRef]
- Gatt, I.; Smith-Moore, S.; Steggles, C.; Loosemore, M. The Takei Handheld Dynamometer: An Effective Clinical Outcome Measure Tool for Hand and Wrist Function in Boxing. Hand 2018, 13, 319–324. [Google Scholar] [CrossRef]
- Kapuczinski, A.; Soyfoo, M.S.; De Breucker, S.; Margaux, J. Assessment of Sarcopenia in Patients with Fibromyalgia. Rheumatol. Int. 2022, 42, 279–284. [Google Scholar] [CrossRef] [PubMed]
- Kelley, K.; Preacher, K.J. On Effect Size. Psychol. Methods 2012, 17, 137–152. [Google Scholar] [CrossRef] [PubMed]
- Wolfe, F.; Walitt, B.; Perrot, S.; Rasker, J.J.; Haüser, W. Fibromyalgia Diagnosis and Biased Assessment: Sex, Prevalence and Bias. PLoS ONE 2018, 13, e0203755. [Google Scholar] [CrossRef]
- Mariño, C.A.; Grimaldi, M.; Sabatini, P.; Amato, P.; Pallavicino, A.; Ricciardelli, C.; D’Ursi, A.M. Fibromyalgia and Depression in Women: An 1h-NMR Metabolomic Study. Metabolites 2021, 11, 429. [Google Scholar] [CrossRef] [PubMed]
- Martínez-Lavín, M. Fibromyalgia in Women: Somatisation or Stress-Evoked, Sex-Dimorphic Neuropathic Pain? Clin. Exp. Rheumatol. 2021, 39, 422–425. [Google Scholar] [CrossRef] [PubMed]
- Wolfe, F.; Egloff, N.; Häuser, W. Widespread Pain and Low Widespread Pain Index Scores among Fibromyalgia-Positive Cases Assessed with the 2010/2011 Fibromyalgia Criteria. J. Rheumatol. 2016, 43, 1743–1748. [Google Scholar] [CrossRef] [PubMed]
- Bagis, S.; Tamer, L.; Sahin, G.; Bilgin, R.; Guler, H.; Ercan, B.; Erdogan, C. Free Radicals and Antioxidants in Primary Fibromyalgia: An Oxidative Stress Disorder? Rheumatol. Int. 2005, 25, 188–190. [Google Scholar] [CrossRef]
- Cordero, M.D.; de Miguel, M.; Carmona-López, I.; Bonal, P.; Campa, F.; Moreno-Fernández, A.M. Oxidative Stress and Mitochondrial Dysfunction in Fibromyalgia. Neuro Endocrinol. Lett. 2010, 31, 169–173. [Google Scholar]
- Eisinger, J.; Gandolfo, C.; Zakarian, H.; Ayavou, T. Reactive Oxygen Species, Antioxidant Status and Fibromyalgia. J. Musculoskelet. Pain. 1997, 5, 5–15. [Google Scholar] [CrossRef]
- Van Der Vaart, H.; Postma, D.S.; Timens, W.; Ten Hacken, N.H.T. Acute Effects of Cigarette Smoke on Inflammation and Oxidative Stress: A Review. Thorax 2004, 59, 713–721. [Google Scholar] [CrossRef]
- Zhou, X.; Zeng, W.; Rong, S.; Lv, H.; Chen, Y.; Mao, Y.; Tan, W.; Li, H. Alendronate-Modified Nanoceria with Multiantioxidant Enzyme-Mimetic Activity for Reactive Oxygen Species/Reactive Nitrogen Species Scavenging from Cigarette Smoke. ACS Appl. Mater. Interfaces 2021, 13, 47394–47406. [Google Scholar] [CrossRef] [PubMed]
- Khan, N.A.; Lawyer, G.; McDonough, S.; Wang, Q.; Kassem, N.O.; Kas-Petrus, F.; Ye, D.; Singh, K.P.; Kassem, N.O.F.; Rahman, I. Systemic Biomarkers of Inflammation, Oxidative Stress and Tissue Injury and Repair among Waterpipe, Cigarette and Dual Tobacco Smokers. Tob. Control 2019, 29, s102–s109. [Google Scholar] [CrossRef] [PubMed]
- Mons, U.; Muscat, J.E.; Modesto, J.; Richie, J.P.; Brenner, H. Effect of Smoking Reduction and Cessation on the Plasma Levels of the Oxidative Stress Biomarker Glutathione—Post-Hoc Analysis of Data from a Smoking Cessation Trial. Free Radic. Biol. Med. 2016, 91, 172–177. [Google Scholar] [CrossRef] [PubMed]
- Akamatsu, Y.; Kusakabe, T.; Arai, H.; Yamamoto, Y.; Nakao, K.; Ikeue, K.; Ishihara, Y.; Tagami, T.; Yasoda, A.; Ishii, K.; et al. Phase Angle from Bioelectrical Impedance Analysis Is a Useful Indicator of Muscle Quality. J. Cachexia Sarcopenia Muscle 2022, 13, 180–189. [Google Scholar] [CrossRef] [PubMed]
- Koca, I.; Savas, E.; Ozturk, Z.A.; Boyaci, A.; Tutoglu, A.; Alkan, S.; Yildiz, H.; Kimyon, G. The Evaluation in Terms of Sarcopenia of Patients with Fibromyalgia Syndrome. Wien. Klin. Wochenschr. 2016, 128, 816–821. [Google Scholar] [CrossRef]
- Maquet, D.; Croisier, J.-L.; Renard, C.; Crielaard, J.-M. Muscle Performance in Patients with Fibromyalgia. Jt. Bone Spine 2002, 69, 293–299. [Google Scholar] [CrossRef]
- Nørregaard, J.; Bülow, P.M.; Lykkegaard, J.J.; Mehlsen, J.; Danneskiold-Samsøoe, B. Muscle Strength, Working Capacity and Effort in Patients with Fibromyalgia. Scand. J. Rehabil. Med. 1997, 29, 97–102. [Google Scholar]
- Sener, U.; Ucok, K.; Ulasli, A.M.; Genc, A.; Karabacak, H.; Coban, N.F.; Simsek, H.; Cevik, H. Evaluation of Health-Related Physical Fitness Parameters and Association Analysis with Depression, Anxiety, and Quality of Life in Patients with Fibromyalgia. Int. J. Rheum. Dis. 2016, 19, 763–772. [Google Scholar] [CrossRef]
- Cruz-Jentoft, A.; Bahat, G.; Bauer, J.; Boirie, Y.; Bruyère, O.; Cederholm, T.; Cooper, C.; Landi, F.; Rolland, Y.; Sayer, A.; et al. Sarcopenia: Revised European Consensus on Definition and Diagnosis. Age Ageing 2019, 48, 601. [Google Scholar] [CrossRef]
- Aparicio, V.A.; Ortega, F.B.; Heredia, J.M.; Carbonell-Baeza, A.; Sjstrm, M.; Delgado-Fernandez, M. Handgrip Strength Test as a Complementary Tool in the Assessment of Fibromyalgia Severity in Women. Arch. Phys. Med. Rehabil. 2011, 92, 83–88. [Google Scholar] [CrossRef]
- Şahin, G.; Ulubaş, B.; Çalikoǧlu, M.; Erdoǧan, C. Handgrip Strength, Pulmonary Function Tests, and Pulmonary Muscle Strength in Fibromyalgia Syndrome: Is There Any Relationship? South. Med. J. 2004, 97, 25–29. [Google Scholar] [CrossRef] [PubMed]
- Okumus, M.; Gokoglu, F.; Kocaoglu, S.; Ceceli, E.; Yorgancioglu, Z.R. Muscle Performance in Patients with Fibromyalgia. Singap. Med. J. 2006, 47, 293–299. [Google Scholar]
- Mengshoel, A.M.; Forre, O.; Komnes, H.B. Muscle Strength and Aerobic Capacity in Primary Fibromyalgia. Clin. Exp. Rheumatol. 1990, 8, 475–479. [Google Scholar] [PubMed]
- Lobo, M.M.; Paiva Edos, S.; Andretta, A.; Schieferdecker, M.E. Body composition by dual-energy x-ray absorptiometry in women with fibromyalgia. Rev. Bras. Reumatol. 2014, 54, 273–278. [Google Scholar] [CrossRef] [PubMed]
- Segura-Jimenez, V.; Aparicio, V.A.; Alvarez-Gallardo, I.C.; Carbonell-Baeza, A.; Tornero-Quinones, I.; Delgado-Fernandez, M. Does Body Composition Differ between Fibromyalgia Patients and Controls? The al-Ándalus Project. Clin. Exp. Rheumatol. 2015, 33, S25–S32. [Google Scholar] [PubMed]
- Ursini, F.; Naty, S.; Grembiale, R.D. Fibromyalgia and Obesity: The Hidden Link. Rheumatol. Int. 2011, 31, 1403–1408. [Google Scholar] [CrossRef]
- Correa-Rodríguez, M.; El Mansouri-Yachou, J.; Casas-Barragán, A.; Molina, F.; Rueda-Medina, B.; Aguilar-Ferrandiz, M.E. The Association of Body Mass Index and Body Composition with Pain, Disease Activity, Fatigue, Sleep and Anxiety in Women with Fibromyalgia. Nutrients 2019, 11, 1193. [Google Scholar] [CrossRef]
- Latorre Román, P.A.; Campos e Campos, M.A.; Meza, J.A.M.; Delgado-Fernández, F.M.; Heredia-Jimenez, J. Analysis of the Physical Capacity of Women with Fibromyalgia According to the Severity Level of the Disease. Rev. Bras. Med. Esporte 2012, 18, 308–312. [Google Scholar]
- Kim, C.-H.; Luedtke, C.A.; Vincent, A.; Thompson, J.M.; Oh, T.H. Association of Body Mass Index with Symptom Severity and Quality of Life in Patients with Fibromyalgia. Arthritis Care Res. 2012, 64, 222–228. [Google Scholar] [CrossRef]
- Okifuji, A.; Donaldson, G.W.; Barck, L.; Fine, P.G. Relationship between Fibromyalgia and Obesity in Pain, Function, Mood, and Sleep. J. Pain 2010, 11, 1329–1337. [Google Scholar] [CrossRef]
- Yunus, M.B.; Arslan, S.; Aldag, J.C. Relationship between Body Mass Index and Fibromyalgia Features. Scand. J. Rheumatol. 2002, 31, 27–31. [Google Scholar] [CrossRef] [PubMed]


| Descriptive Data | Total Sample (n = 70) Mean ± SD (95% CI) | Fibromyalgia (n = 35) Mean ± SD (95% CI) | Healthy (n = 35) Mean ± SD (95% CI) | Mean Difference (95% CI) | Statistics | p-Value |
|---|---|---|---|---|---|---|
| Age (years) | 52.27 ± 6.63 (50.68–53.85) | 51.40 ± 7.53 (48.81–53.98) | 53.14 ± 5.57 (51.22–55.05) | −1.74 (−4.90–1.91) | t = −1.100 | 0.275 * |
| Height (cm) | 163.32 ± 5.99 (161.89–164.75) | 163.28 ± 7.36 (160.75–165.81) | 163.37 ± 4.33 (161.88–164.86) | 1.44 (−2.98–2.80) | t = −0.059 | 0.953 * |
| Weight (kg) | 66.54 ± 11.68 (63.75–69.32) | 69.65 ± 13.38 (65.05–74.24) | 63.43 ± 8.82 (60.39–66.46) | 6.22 (0.79–11.64) | t = 2.295 | 0.025 * |
| BMI (kg/m2) | 25.00 ± 4.56 (23.91–26.09) | 26.21 ± 5.28 (24.40–28.03) | 23.78 ± 3.37 (22.62–24.94) | 2.43 (0.31–4.55) | t = 2.295 | 0.025 * |
| Right HGS (kg) | 21.96 ± 7.53 (20.14–23.75) | 16.39 ± 5.87 (14.37–18.40) | 27.53 ± 4.09 (26.12–28.93) | −11.14 (−13.55–8.72) | t = −9.204 | <0.001 * |
| Left HGS (kg) | 21.96 ± 7.47 (20.18–23.74) | 16.31 ± 5.51 (14.41–18.20) | 27.61 ± 4.14 (26.19–29.04) | −11.30 (−13.63 –8.97) | t = −9.690 | <0.001 * |
| Outcome Measurements | Fibromyalgia (n = 35) Mean ± SD (95% CI) | Healthy (n = 35) Mean ± SD (95% CI) | Mean Difference (95% CI) | Statistics | p-Value |
|---|---|---|---|---|---|
| TBW | 31.21 ± 4.03 (29.83–32.60) | 31.84 ± 3.06 (30.78–32.79) | −0.62 (−2.22–1.08) | t = −0.728 | 0.469 * |
| ICW | 19.22 ± 2.45 (18.37–20.06) | 19.78 ± 1.90 (19.12–20.43) | −0.56 (−1.61–0.48) | t = −1.071 | 0.288 * |
| ECW | 11.99 ± 1.58 (11.45–12.54) | 12.05 ± 1.18 (11.65–12.46) | −0.06 (−0.72–0.60) | t = −0.179 | 0.858 * |
| BFM | 27.14 ± 10.21 (23.63–30.65) | 19.94 ± 7.25 (17.44–22.43) | 7.20 (2.98–11.43) | U = 349.000 | 0.002 † |
| SLM | 40.03 ± 5.17 (38.25–41.80) | 40.90 ± 3.93 (39.55–42.25) | −0.87 (−3.06–1.31) | t = −0.796 | 0.429 * |
| FFM | 42.50 ± 5.48 (40.62–44.38) | 43.49 ± 4.20 (42.04–44.93) | −0.98 (−3.31–1.34) | t = −0.844 | 0.401 * |
| SMM | 23.06 ± 3.21 (21.96–24.17) | 23.81 ± 2.47 (22.95–24.66) | −0.74 (−2.11–0.62) | t = −1.082 | 0.283 * |
| PBF | 37.80 ± 8.32 (34.93–40.66) | 30.63 ± 7.77 (27.96–33.30) | 7.16 (−3.32–11.00) | t = −3.720 | 0.001 * |
| FFM of Right Arm | 2.14 ± 0.39 (2.00–2.28) | 2.17 ± 0.31 (2.06–2.28) | −0.02 (−0.20–0.14) | t = −0.338 | 0.736 * |
| FFM of Left Arm | 2.12 ± 0.42 (1.97–2.26) | 2.12 ± 0.31 (2.01–2.22) | −0.002 (−0.17–0.17) | t = −0.032 | 0.974 * |
| FFM of Trunk | 19.30 ± 2.58 (18.41–20.19) | 19.35 ± 1.85 (18.71–19.99) | −0.04 (−1.12–1.02) | t = −0.090 | 0.928 * |
| FFM of Right Leg | 6.62 ± 1.06 (6.25–6.98) | 6.64 ± 0.71 (6.39–6.88) | −0.02 (−0.45–0.41) | t = −0.092 | 0.927 * |
| FFM of Left Leg | 6.61 ± 1.05 (6.25–6.97) | 6.61 ± 0.68 (6.37–6.84) | 0.0002 (−0.42–0.42) | t = 00.001 | 0.999 * |
| VFA | 136.76 ± 55.31 (117.76–155.76) | 91.65 ± 42.04 (77.21–106.09) | 45.11 (21.67–68.54) | U = 322.000 | 0.001 † |
| BCM | 27.52 ± 3.53 (26.31–28.74) | 28.34 ± 2.72 (27.40–29.28) | −0.81 (−2.32–0.68) | t = −1.082 | 0.283 * |
| Outcome Measurements | Fibromyalgia (n = 35) Mean ± SD (95% CI) | Healthy (n = 35) Mean ± SD (95% CI) | Mean Difference (95% CI) | Statistics | p-Value | Effect Size (Cohen d) |
|---|---|---|---|---|---|---|
| 50 kHz-RA Phase Angle | 4.42 ± 0.51 (4.25–4.60) | 4.97 ± 0.48 (4.80–5.13) | −0.54 (−0.78–0.30) | t = −4.550 | <0.001 * | d = 1.11 |
| 50 kHz-LA Phase Angle | 4.23 ± 0.48 (4.07–4.40) | 4.78 ± 0.50 (4.61–4.96) | −0.55 (−0.78–0.31) | t = −4.661 | <0.001 * | d = 1.12 |
| 250 kHz-TR Phase Angle | 5.62 ± 0.77 (5.35–5.89) | 6.78 ± 0.84 (6.49–7.07) | −1.16 (−1.55–0.77) | t = −5.985 | <0.001 * | d = 1.43 |
| 50 kHz-RL Phase Angle | 5.28 ± 0.56 (5.08–5.47) | 5.81 ± 0.60 (5.60–6.01) | −0.53 (−0.80–0.25) | t = −3.815 | <0.001 * | d = 0.91 |
| 50 kHz-LL Phase Angle | 5.07 ± 0.51 (4.89–5.25) | 5.69 ± 0.58 (5.49–5.89) | −0.61 (−0.87–0.35) | t = −4.689 | <0.001 * | d = 1.13 |
| 50 kHz-Whole Body Phase Angle | 4.81 ± 0.47 (4.65–4.98) | 5.39 ± 0.49 (5.22–5.56) | −0.57 (−0.80–0.34) | t = −4.941 | <0.001 * | d = 1.20 |
Disclaimer/Publisher’s Note: The statements, opinions and data contained in all publications are solely those of the individual author(s) and contributor(s) and not of MDPI and/or the editor(s). MDPI and/or the editor(s) disclaim responsibility for any injury to people or property resulting from any ideas, methods, instructions or products referred to in the content. |
© 2023 by the authors. Licensee MDPI, Basel, Switzerland. This article is an open access article distributed under the terms and conditions of the Creative Commons Attribution (CC BY) license (https://creativecommons.org/licenses/by/4.0/).
Share and Cite
Vicente-Campos, D.; Sánchez-Jorge, S.; Martí, L.; Buffet, J.; Mendoza-Laiz, N.; Rodriguez-Sanz, D.; Becerro-de-Bengoa-Vallejo, R.; Chicarro, J.L.; Calvo-Lobo, C. Skin Bioimpedance Analysis to Determine Cellular Integrity by Phase Angle in Women with Fibromyalgia: A Cross-Sectional Study. Biomedicines 2023, 11, 3321. https://doi.org/10.3390/biomedicines11123321
Vicente-Campos D, Sánchez-Jorge S, Martí L, Buffet J, Mendoza-Laiz N, Rodriguez-Sanz D, Becerro-de-Bengoa-Vallejo R, Chicarro JL, Calvo-Lobo C. Skin Bioimpedance Analysis to Determine Cellular Integrity by Phase Angle in Women with Fibromyalgia: A Cross-Sectional Study. Biomedicines. 2023; 11(12):3321. https://doi.org/10.3390/biomedicines11123321
Chicago/Turabian StyleVicente-Campos, Davinia, Sandra Sánchez-Jorge, Luis Martí, Jorge Buffet, Nuria Mendoza-Laiz, David Rodriguez-Sanz, Ricardo Becerro-de-Bengoa-Vallejo, J. L. Chicarro, and César Calvo-Lobo. 2023. "Skin Bioimpedance Analysis to Determine Cellular Integrity by Phase Angle in Women with Fibromyalgia: A Cross-Sectional Study" Biomedicines 11, no. 12: 3321. https://doi.org/10.3390/biomedicines11123321