Article

Novel Nitrate Ion-Selective Microsensor Fabricated by Means of Direct Ink Writing

1
Department of Chemistry, Faculty of Science, Edifici C-Nord, Universitat Autònoma de Barcelona, Carrer dels Til·lers, 08193 Bellaterra, Spain
2
GENOCOV Research Group, Universitat Autònoma de Barcelona, 08193 Bellaterra, Spain
3
Instituto de Microelectrónica de Barcelona, IMB-CNM (CSIC), Esfera UAB, Campus Universitat Autònoma de Barcelona, 08193 Bellaterra, Spain
4
Centro de Investigación Biomédica en Red de Bioingeniería, Biomateriales y Nanomedicina (CIBER-BBN), 28029 Madrid, Spain
*
Author to whom correspondence should be addressed.
Chemosensors 2023, 11(3), 174; https://doi.org/10.3390/chemosensors11030174
Submission received: 2 February 2023 / Revised: 28 February 2023 / Accepted: 1 March 2023 / Published: 4 March 2023
(This article belongs to the Special Issue Chemosensors for Ion Detection)

Abstract

:
In this work, the stability, electrical conductivity, and versatility of graphite-based inks were taken advantage of to fabricate a nitrate potentiometric sensor. One other key property that was exploited for the design of an ion-selective electrode was the hydrophobicity of graphite. This prevented the formation of a water layer between the solid contact and the polymeric selective membrane. Moreover, given the use of printing technologies for electrode fabrication, it was possible to easily miniaturize the sensors and achieve lower fabrication costs. In this article, a printed sensor, composed of a graphite working electrode and a Ag/AgCl reference electrode, is presented and thoroughly characterized. The working electrode was modified with a well-known PVC-ionophore membrane, and the reference electrode was protected with a PVB-NaCl saturated membrane. It showed almost-Nernstian sensitivity of −(55.4 ± 0.7) mV/dec to NO3, stability of up to 25 days of operation, limit of detection of 0.204 ± 0.009 mM, and repeatability of 99.02 % (N = 3). Coupled with its high selectivity compared with other anions, this low-cost, mass-producible sensor is a great alternative for environmental and industrial applications.

1. Introduction

Since the discovery of the advantages of nitrate ion (NO3)-derived species for plant growth, their heavy industrial production and application in agriculture have resulted in severe contamination problems. The acidification and eutrophication of consumption water are among the gravest consequences [1,2,3]. In response to these growing concerns, governments all over the world have imposed laws restricting the use of NO3-contaminated water [4]. Thus, analytical tools to keep all kinds of water sources in check are urgently required.
One of the first-known methods for nitrate ion detection is UV measurements. This can be coupled with chromatography techniques to achieve high selectivity and low limits of detection [5]. However, these require ample sample pre-treatment, and bulky and expensive equipment, as well as trained personnel, and are not a good choice for on-site analysis. To avoid these limitations, sensors are a preferable approach. Optical sensors, such the ones developed by Nightingale et al. [6] or Wang et al. [7], which have high selectivity, or that in the work by Yasin et al. [8], which presents high repeatability and enhanced sensitivity, are better alternatives in terms of implementation. In fact, the Griess–Ilosvay method has been at the basis of NO3 detection using optical assays. However, the high time of response, the requirement of sample treatment, the necessity of previously reducing nitrate ions to nitrite ions, and the limited range of these proposed devices are still inconveniences that must be overcome.
Otherwise, electrochemical sensors are a viable alternative as versatile, fast, and transportable analytical tools [9]. Despite their small size and complexity, these analytical tools are very much capable of achieving low limits of detection [10], as well as short response time (in the order of seconds), stability in wide ranges of pH, and good and tunable selectivity [11]. Several endeavors have specifically tackled the improvement of NO3 potentiometric sensors using new materials, such as the work by Patella et al. [12], who used copper nanowires to produce a highly sensitive amperometric sensor with low limits of detection but high interference of chloride, or Bommiredy et al. [13], who presented the modification of graphite (Gr) with bimetallic copper–silver nanostructures into an amperometric NO3 sensor with wide linear range and fast response. However, NO3 is a particularly difficult analyte for voltamperometric methods, as it requires large overpotentials and sample treatment. Potentiometric sensors, on the other hand, are a much preferable alternative. For years, these sensors have been built using polymeric liquid membranes that are mainly selective towards the target analyte, also known as ion-selective electrodes (ISEs). Currently, they are the most researched method for continuous, on-site nitrate ion analysis [14]. The modified membranes cause a difference in concentration inside–outside them, which results in a difference in potential. Nowadays, there is a high interest in the use of hydrophobic materials to prevent the formation of a water layer between the membrane and the solid contact. This has been detected as one of the main causes of potential drift [15]. The following works tackled this problem: Chen et al. [16], who used a poly(pyrrole) membrane doped with NO3- placed over an electrochemically reduced graphene oxide surface to achieve an optimal measure in soil samples; Fan et al. [17], who doped a poly(vinyl chloride) (PVC)-ionophore membrane with poly(tetrafluoroethylene) (PTFE) particles to improve substrate–membrane adhesion, which was similar to how Liu et al. [18] employed thiol-functionalized reduced graphene oxide to produce more robust K+ and NO3 ISEs; Hassan et al. [19], who instead employed multi-walled carbon nanotubes with the objective of improving the selectivity and reliability of the sensor. Their works made use of the advancement of carbon materials as inorganic hydrophobic layers to ensure a better solid–membrane contact that reduced noise and signal drift while improving selectivity and robustness.
It is important to consider, when dealing with complex samples, the possible presence of NO2. As far as interferents are concerned, NO2 is a very particular case. Due to its instability, it naturally oxidizes into NO3 over time. However, given the chemical semblance between NO2 and NO3, it can cause interference if it is not allowed to decay. Hence, the most secure way to deal with it is to previously perform rapid detection of NO2 and then compensate the NO3 measurement [20]. To achieve this, several studies, such as that by Protity Saha et al., using gold nanomaterials [21], or the more recent one by Angelo Ferlazzo et al., innovating with carbon nanomaterials [22], have worked on the design of amperometric sensors for the direct and fast detection of NO2. Coupling one of these designs into a future integrated platform would be sensible to avoid interference. Nevertheless, as this anion was not present in this work, it remains a feature for the future.
Another key point in the improvement of ISEs and their applicability is the means of fabrication. The previously presented works require too much hand-made fabrication to be robust or reproducible. In this area, printing technologies have exponentially grown in recent years [23,24,25,26] for the mass production of highly reproducible, cheap, and versatile devices. Little work has been conducted on combining these two fields yet, with the advancements by Jiang et al. [27] as a first concept for a solid-state ISE produced using inkjet printing being the only work we found. Despite having produced an almost-Nernstian sensor, the reported stability and selectivity are factors that could be improved upon.
Yet, robustness and signal repeatability are parameters of high importance that rarely come up in the design of new sensors. This is because those depend as much on the sensor as on the reference electrode coupled to it. All cited works use external commercial electrodes to test their novel sensors (Table 1), but on the field and in real-case applications, this is severely limiting. As such, the improvement and incorporation of stable reference electrodes in a single sensing platform represent a field that lacks depth and innovation but is almost as important as the sensor itself.
In this article, we aimed at combining the use of printing technologies, in particular, direct ink writing (DIW), with the innovations of carbon materials to fabricate a stable, reproducible, and selective sensor. The use of this new printing technology makes the specific tuning of the sensor possible, from size and shape to the used materials and substrates. For this purpose, the sensor integrates a working electrode (WE) made of graphite and modified with a poly (vinyl chloride)-based membrane containing a NO3 ionophore and a Ag/AgCl reference electrode (RE) protected with a NaCl saturated poly (vinyl butyral) membrane in an integrated sensing platform. This approach has not been tested in any of the above-mentioned works, which always relied on the use of external commercial reference electrodes. This limits the applicability and versatility of the designs and increases costs. Thus, in this work, the main aim was to prove that new technologies are one step closer to producing sensors that can compete with other hand-made designs. Furthermore, the lack of expensive materials reinforces the idea that mass-produced devices are capable of operating under field conditions. On the other hand, it also leaves the door open for the further tuning of sensors, leading to enhanced analytical properties, with the usage of new materials. The sensor was thoroughly characterized in terms of its electroanalytical response, stability over time, pH, and selectivity against competing anions. Finally, the sensor was used to measure the nitrate ion concentration of a sulfate-reducing test reactor to prove its operativity under real-sample conditions.

2. Materials and Methods

2.1. Reagents and Chemicals

All chemicals were commercially available and were used as received. For the construction of the graphite integrated electrodes, screen-printing silver microparticle ink (DuPont 5029; Dupont, Wilmington, DE, USA) for the conductive tracks, graphite ink (C2030519P4; Gwent Electronic Materials, Pontypool, UK) for the WE, and commercial Ag/AgCl paste (DuPont 5874; Dupont, Wilmington, DE, USA) for the RE were utilized. Dielectric ink (LOCTITE EDAG PP 455 BC; Henkel Ibérica, Barcelona, Spain) was included for track passivation. All inks were printed on a 125 µm thick polyethylene terephthalate (PET) sheet (Q65HA; DuPont Teijin Films, Wilmington, DE, USA).
Sodium nitrate (≥99%; NaNO3), sodium phosphate (96%; Na3PO4), sodium bicarbonate (≥99%; NaHCO3), and sodium chloride (≥99.5%; NaCl) were all purchased from Sigma Aldrich. All solutions were prepared with deionized water with a Milli-Q system (Millipore, Billerica, MA, USA).

2.2. PVC-ISM and PVB-NaClsaturated Membrane Preparation

For the modification of the bare graphite WE into an ion-selective electrode, a membrane was drop-casted onto them. The ion-selective membrane (ISM) was prepared by dissolving ionophore (6%) tridodecylmethylammonium nitrate (T12) (≥99.0% selectophore; [CH3(CH2)11]3N(NO3)CH3), plasticizer (65%) tris(2-ethylhexyl)phosphate (TEHP) (≥99.0% selectophore; [CH3(CH2)3CH(C2H5)CH2O]3P(O)), and (29%) poly (vinyl chloride) (PVC) in tetrahydrofuran (THF) (≥99.9% anhydrous; C4H8O). For the RE, a protective membrane was prepared by dissolving 10% wt. poly (vinyl butyral) (PVB) and saturated sodium chloride (NaCl; Scharlab, Barcelona, Spain) in methanol (all, unless specified otherwise, purchased from Sigma-Aldrich, Madrid, Spain).

2.3. Instrumentation

A pressure-driven digital material depositor (DMD100; Kellenn Technologies, FR) was used to print the electrodes. The printed devices were morphologically characterized by means of a digital microscope (AM4815ZTL; DinoLite, NE). Electrochemical performance was tested using a single-channel Autolab potentiostat/galvanostat (PGSTAT204; Metrohm Autolab BV, NE). An ionic chromatographer (Dionex Integrion; Thermo Scientific, SP) was used as the reference method for contrast-spiked and real samples.

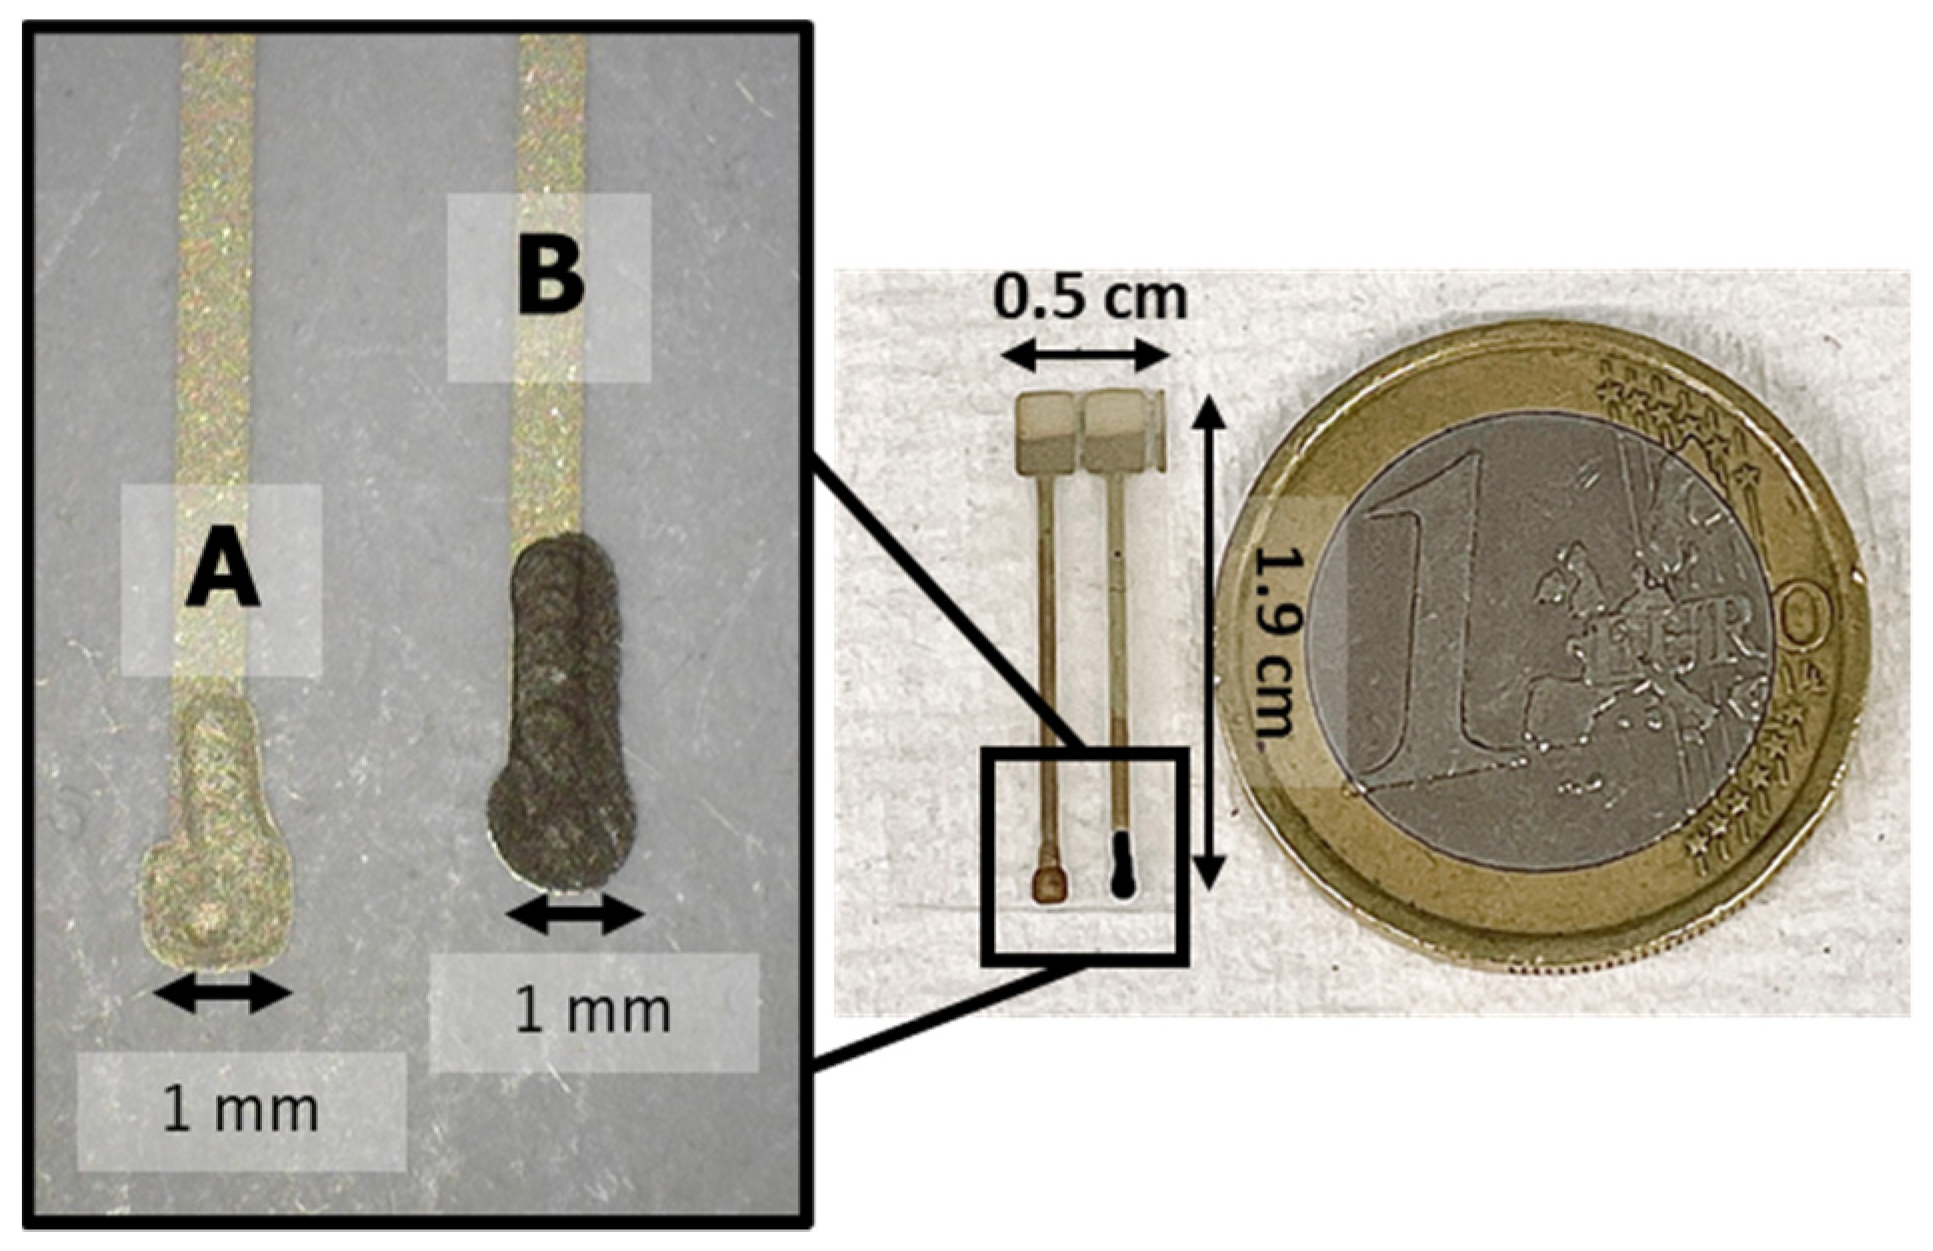
2.4. Electrode Fabrication

All printing was carried out in a standard laboratory under ambient conditions. Electrodes were fabricated by printing several materials on a PET substrate (Figure 1). Given that PET films had already been pre-treated for improved hydrophilicity, no additional procedures were required for good ink adhesion.
First, a single Ag layer was deposited, using printing pressure (PP) of 80 kPA and travelling pressure (TP) of 10 kPA at printing speed (PS) of 100 mm/min to produce the tracks and pads of the WE and RE. Those inks were then dried at 40 °C for 10 min. Afterwards, a layer of Gr ink was deposited to form a 1 mm diameter disc for the WE. This was conducted using PP of 80 kPa, TP of 20 kPA, and PS of 80 mm/min. It was then dried at 40 °C for 10 min. Next, the Ag/AgCl mixture was deposited to form the RE using PP of 65 kPa, TP of 10 kPa, and PS of 80 mm/min. All inks were then sintered at 150 °C for 1 h or until the resistance became lower than 100 Ω. Finally, commercial ink was used to cover the tracks with an impermeable dielectric polymer. Thanks to this, the silver tracks of the electrodes were protected from corrosion, which could lead to high-resistance tracks and faulty measurements. One layer of the LOCTITE dielectric was printed with PP of 30 kPA, TP of 0 kPa, and PS of 225 mm/min. It was cured under UV light for 30 s.

2.5. Membrane Deposition

The PVC-ISM solution was drop-casted onto the graphite disc and the PVB-NaCl saturated membrane over the Ag/AgCl square. Drops of 1 µL in volume were used due to the size of the electrodes; for the WE, 20 drops were required, while only 1 drop was needed for the RE. The solutions were left to dry at room temperature, with no further treatment applied.

2.6. Electrode Characterization

The fabrication and modification of the electrodes was studied using optical microscopy. Millimetric images allow the printed parts, deposited membranes, and any variations produced by the long-term use of the devices to be observed.
The electroanalytical performance was studied with an Autolab potentiostat/galvanostat using chronopotentiometry (CP), under constant stirring whilst measuring. All calibrations were performed under batch conditions, with subsequent additions of different stocks at known NO3 concentration. Concentration at the sensor surface and intensity current can be related with Nernst–Nikolskii formula (Equation (1)).
E M = K 2.303 R T | z i | F · log ( a i , s o l . ) T = 298   K E M = K 0.059 | z i | · log ( a i , s o l . )
where zi is the analyte net charge and ai,sol is the analyte activity. Measured under convection conditions, EM vs. ai,sol results in a linear correlation, and with ionic strength (I) fixed at I ≈ 0.1 (0.03 M NaNO3), ai,sol = Ci. Additionally,, a test to verify the temperature dependance of the sensor described in the Nernst–Nikolskii equation was performed. This was carried out by first performing three short calibrations at three different temperatures to quantify the shift in sensitivity. In addition, we fixed a 0.1 M NO3 concentration and measured the potential variation as the temperature of the solution changed. The temperatures were fixed using a cooling/heating water bath.

2.7. Interference Study

To perform such measurements, a calibration without an interferent was performed as described in previous characterizations. Next, the same procedure was repeated with the same sensor, but by doping the initial solution with a certain concentration of the selected interferent. This is known as the fixed interference method [28]. In the case of SO42−, the ionic strength was fixed using 0.1 M CH3COO, and its effect was later compensated mathematically, taking into consideration the previously calculated Kpot.

2.8. Sample Analysis

Two types of samples were analyzed. The first kind of samples were spiked samples: Milli-Q water, tap water, and bottled water. They had an increasingly more complex matrix to test the feasibility of performing real-sample analysis. To do so, 25 mL of each was prepared by adding 0.03 M SO42− and measured as done with regular calibrations. Later, they were spiked at ~100 mM NO3, and the measurements were repeated.
The second kind was a sample extracted from the output of a sulfate-reducing bioreactor. As sulfate was used as the ionic strength fixing anion, this was concluded to be a suitable sample.

3. Results

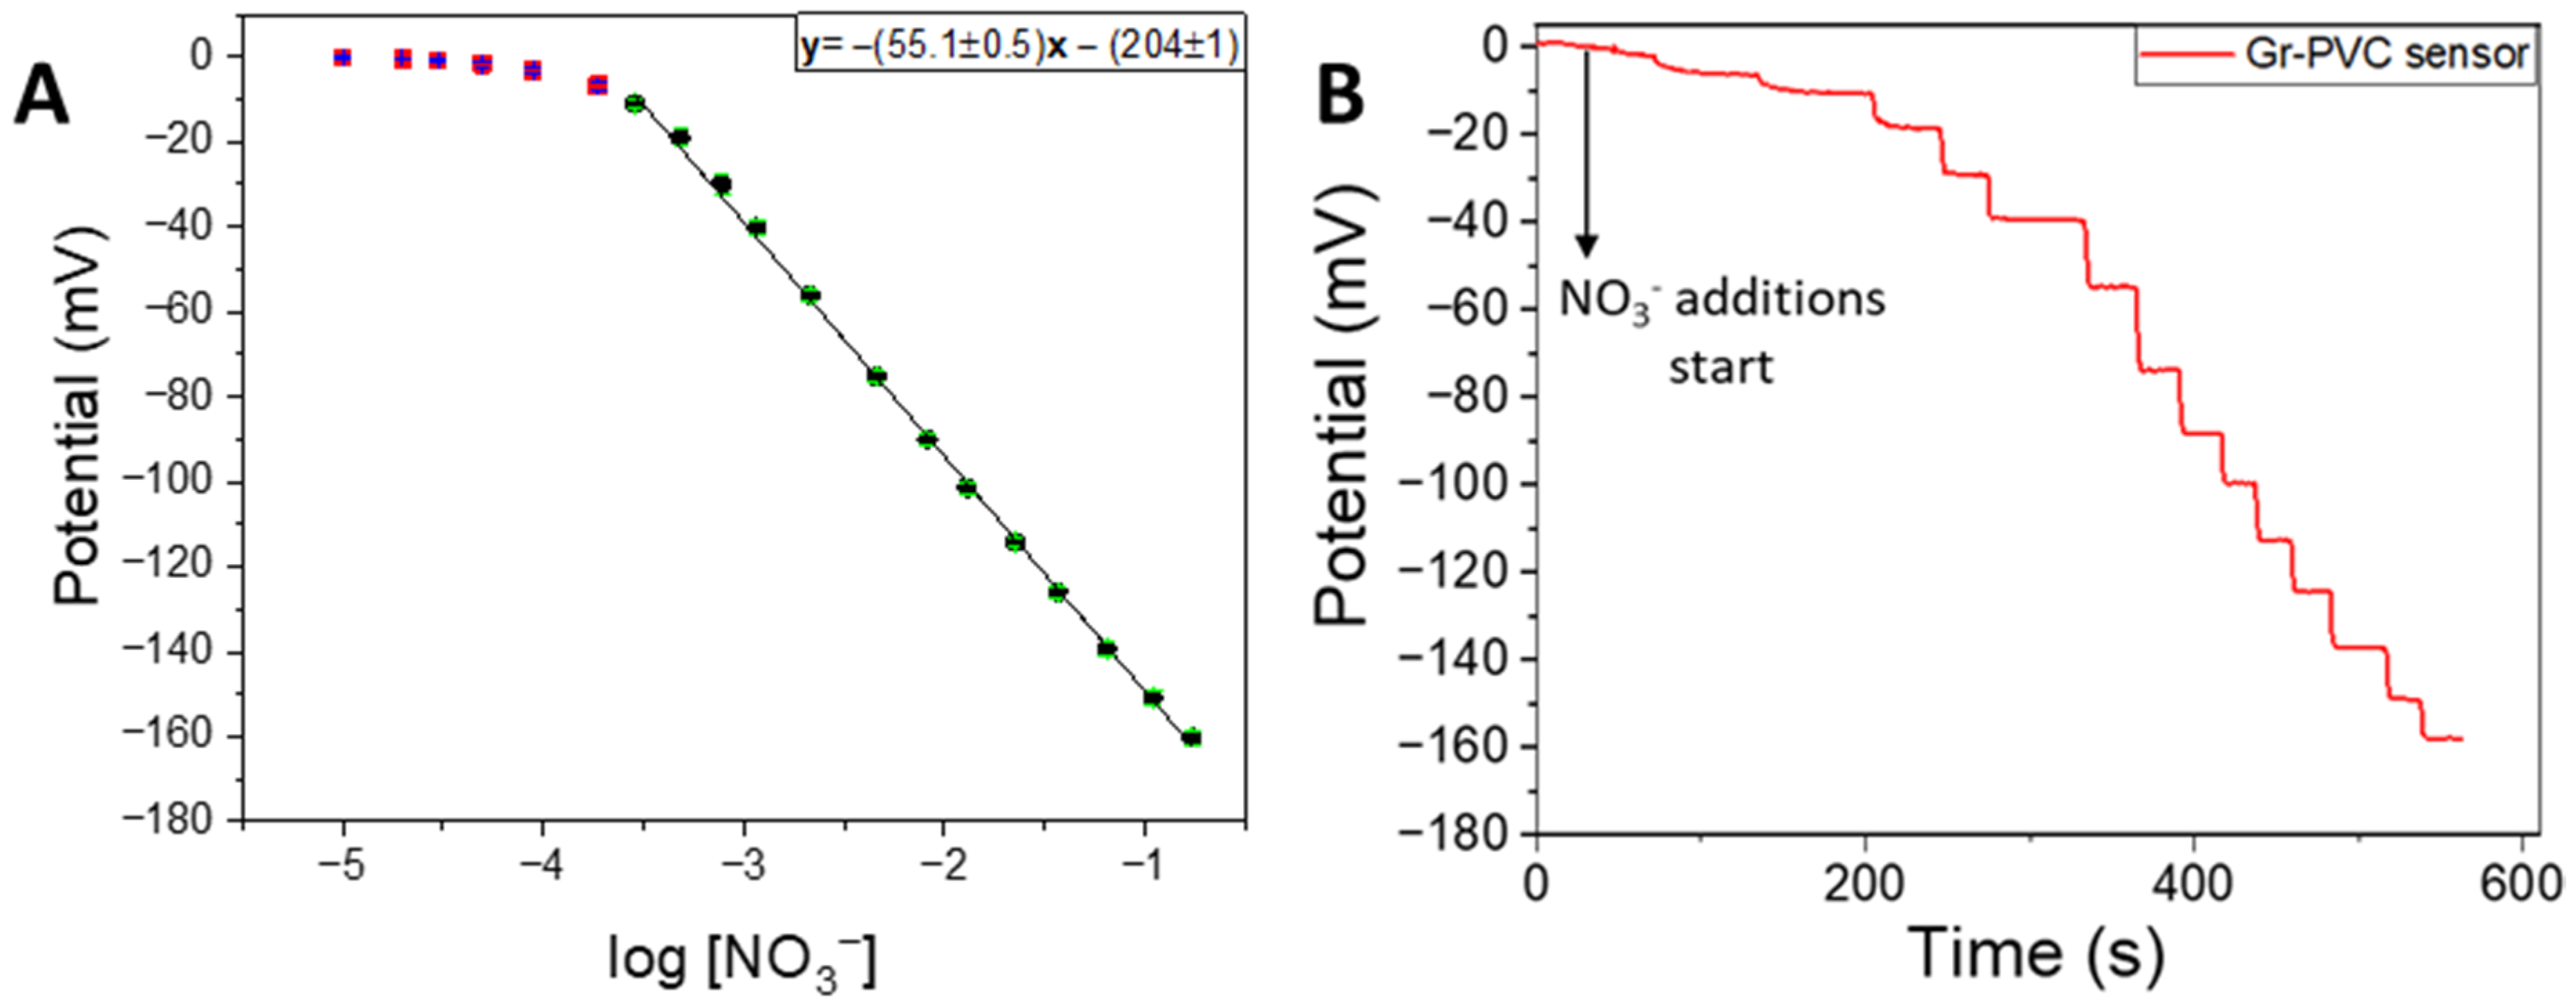
3.1. Electroanalytical Performance Evaluation

To assess the analytical performance of the printed sensor integrating the WE and RE, a wide range of NO3 concentrations were measured (1.00·10−5–0.171 M). As small volumes of NO3 stock solution were added, the change in potential was recorded over time (Figure S1). Comparing several replicates (N = 20), the linear range remained consistent at 2.87·10−4–0.171 M with sensitivity of (55.1 ± 0.5) mV/dec to NO3 for a single sensor (Figure 2).

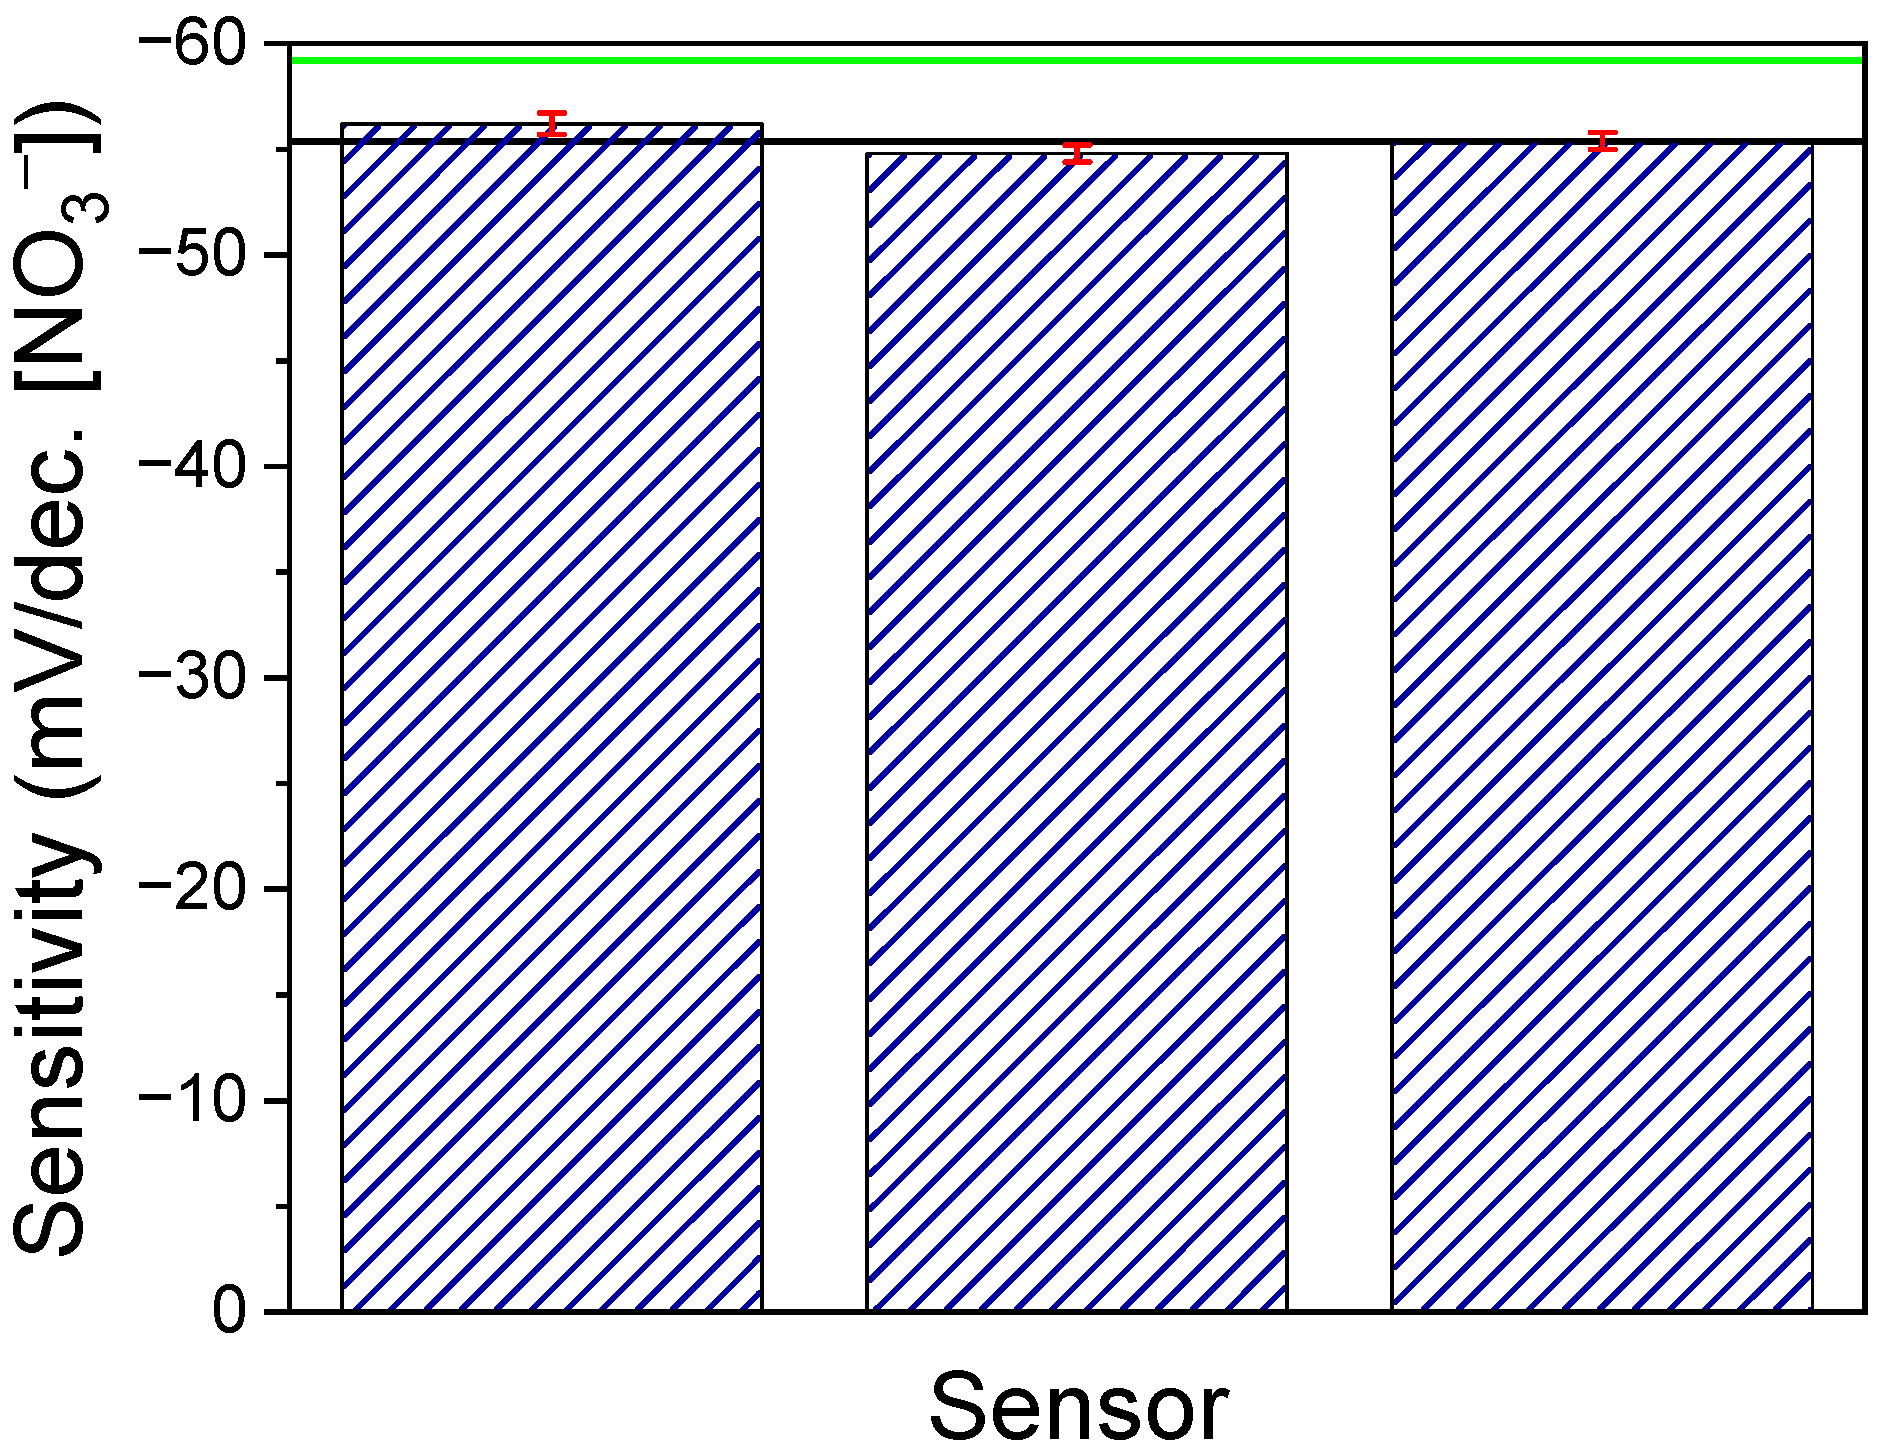
3.2. Response Variation among Sensors

To ensure that the fabrication process was reproducible, three different electrodes were compared. All were printed and later modified at the same time. The different electrodes were calibrated, each one in triplicate, on the same day, and their sensitivity was compared. An RSD of 1.27% and no statistical differences in sensitivity (Figure 3) were observed. The sensors could be mass-produced with a high degree of reproducibility. Moreover, with average sensitivity of −(55.4 ± 0.7) mV/dec to NO3, an almost-Nernstian response was achieved by all the fabricated sensors.

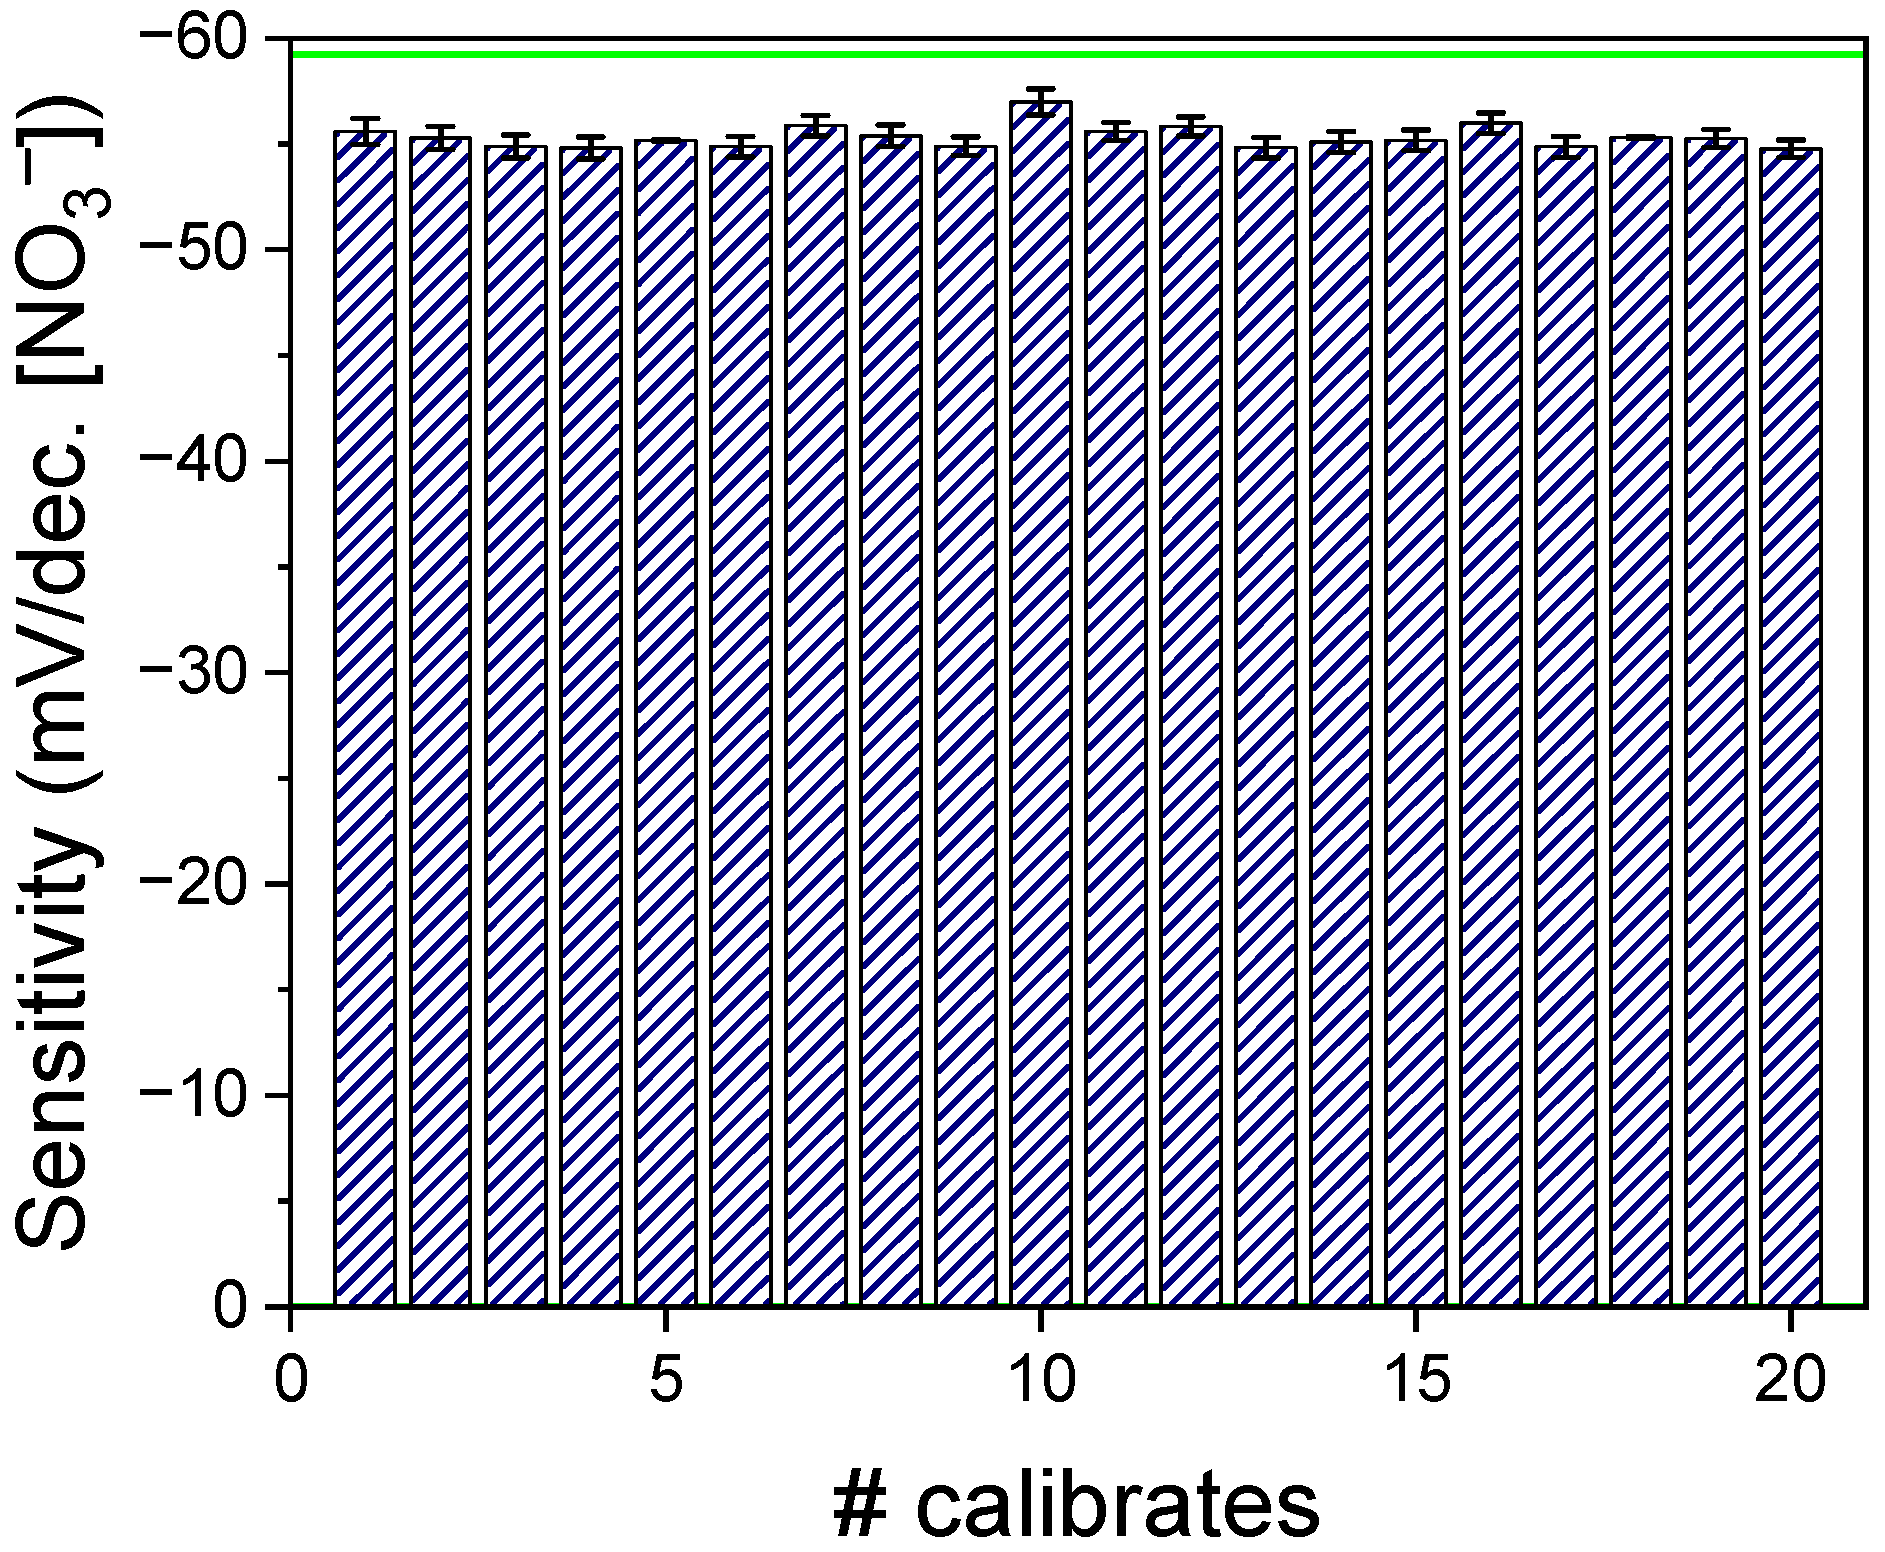
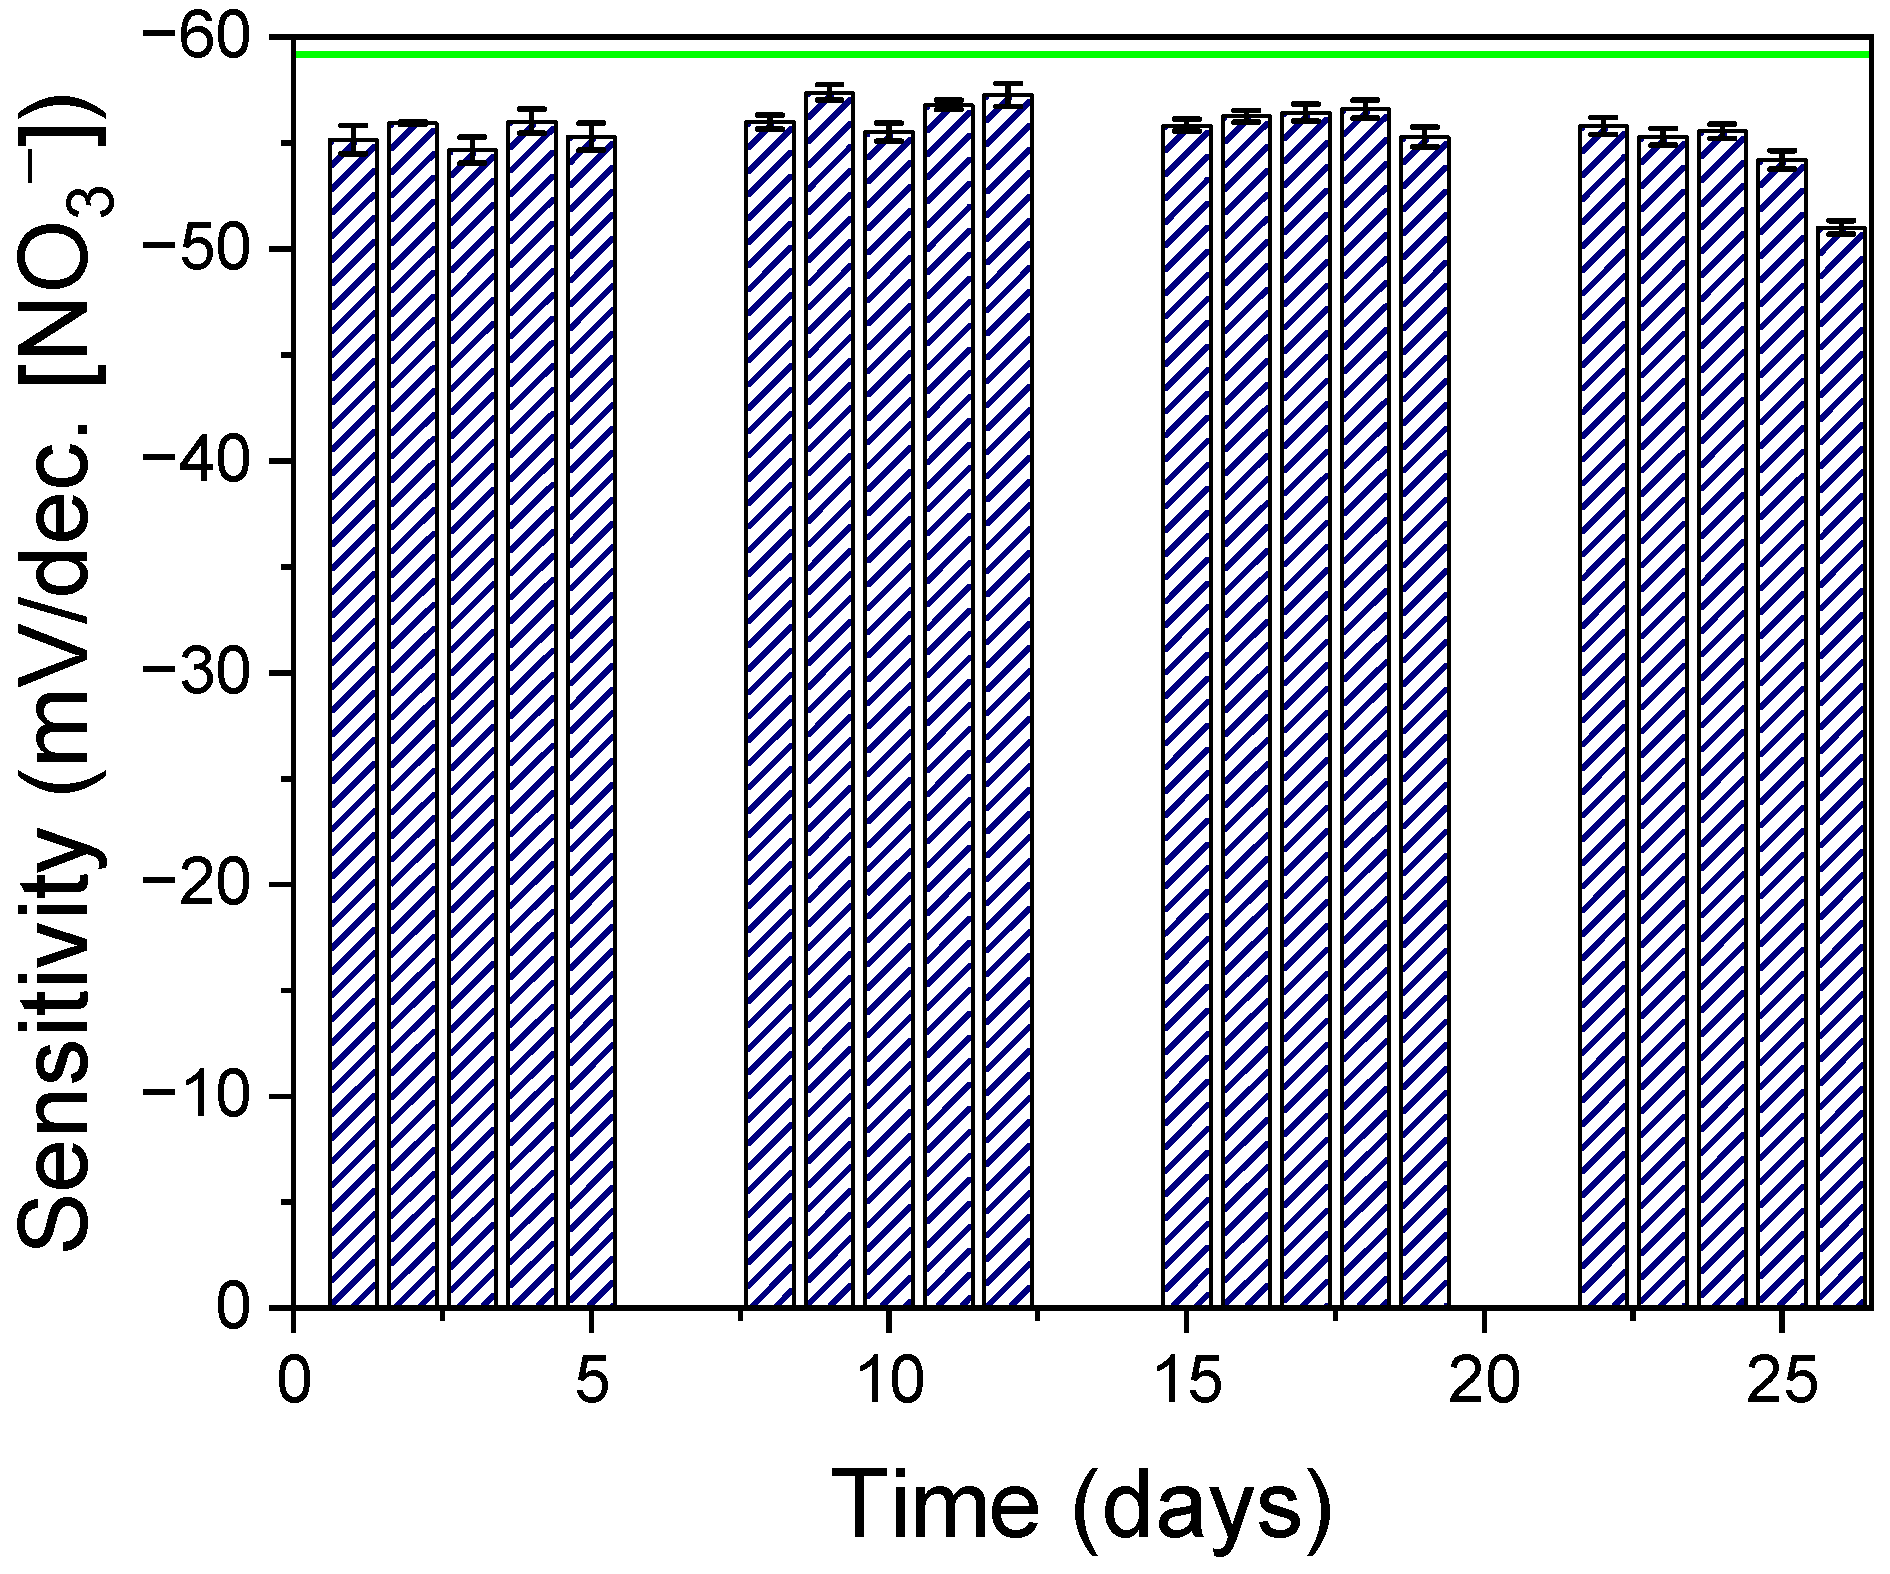
3.3. Stability of the Sensor

By performing multiple calibrations over different periods of time, the continuous performance of the sensor was studied. First, many calibrations recorded during a single day aimed to test the number of measurements during continuous use that the sensor could perform. Considered as short-term stability, the sensor proved to be capable of achieving up to 20 calibrations (1200 measurements) with no changes in the linear range and an RSD of 0.98% in sensitivity (Figure 4) repeatability.
Moreover, with calibrations performed along multiple days, each day in triplicate, the long-term stability of the sensor was studied (Figure 5). The sensor was kept in a low NO3 concentration solution (10−4 M) between measurements to maintain the membrane hydrated and conditioned.
The 25th calibration had lower sensitivity than the previous ones. A decrease in the linear range was also noted. Using Grubbs test, this calibration could be discarded as an outlier (Table S1). Thus, the sensor operated with no statistical variations for 24 days, with equal sensitivity and linear range (up to 1440 measures). Moreover, it kept a consistent limit of detection of 0.204 ± 0.009 mM with an RSD of 4.3%, a linear range of 2.87·10−4–0.171 M, and a sensitivity average of −55.9 ± 0.8 mV/dec to NO3 with an RSD of 1.47%. Thus, the sensor was not only capable of operating for many measurements but also to do so for a prolonged and continuous range of time whilst maintaining excellent stability.

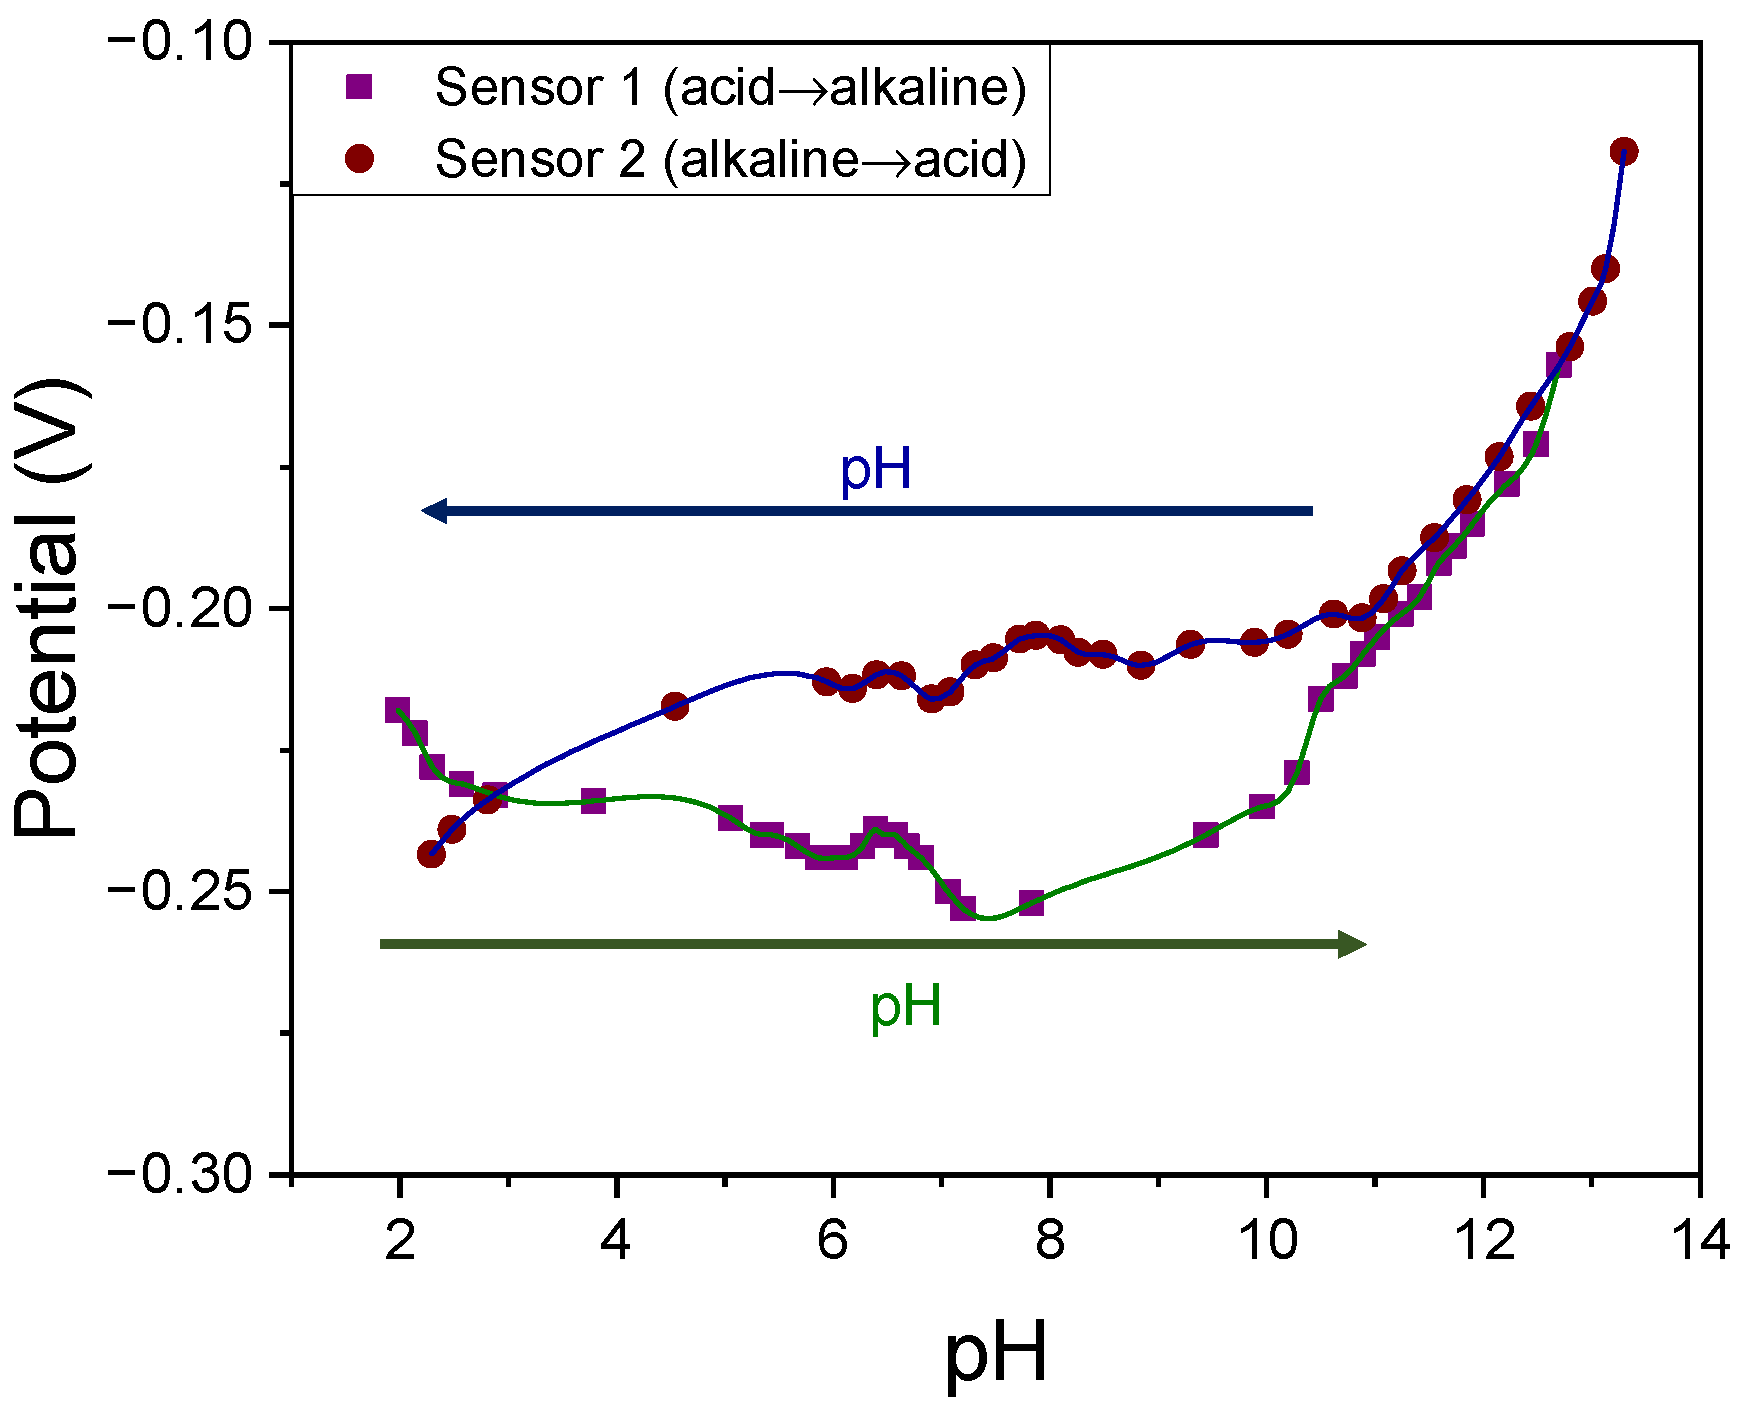
3.4. Robustness against pH

Despite the analyte having no dependence on the medium pH, it is still important to test the limits at which the sensor can operate. To do so, measurements at a constant concentration of 31.6 mM NO3 were performed at different pH values. As can be seen in Figure 6, two different sensors were tested, one starting with highly acid pH and the other with highly alkaline pH. Both showed good stability in a pH range from 4.0 to 11.0, with RSD values of 4.92% and 5.36%, respectively. These variations in signal can be partially explained by the presence of a commercial pH sensor, as the use of both potentiometric sensors in the same solution slightly altered their measurements. The commercial sensor was used to double-check the value of pH at each point. However, the signal, at high pH, started deviating much more. As explained by Moya et al. [29], the printed RE on which the sensor is based presents a change in its moieties at pH higher than 11.0, which changes its response. As such, the sensor presents high robustness against pH so far as the RE electrode is stable (4.0–11.0 pH range).

3.5. Change in Response with Temperature

The change in sensitivity was small, about 6 mV/dec, between 5 and 40 °C (Figure S2). The small variation was verified by measuring between 50 and 5 °C at 0.1 M NO3, where the measured potential changed by around 15 mV. This change in potential corresponds to a decrease of 2–3 mM, which, at 0.1 M, means a deviation of 2–3%.

3.6. Study of Interferents

To finalize the electroanalytical characterization, the effect of interferents on the sensor response was tested. While the ionophore employed has high selectivity towards NO3, other anions are also well known to produce a response in this sensor. Cl, NO2, CH3COO, SO42−, and HCO3 are the anions that have some effect on T-12 ionophore-based sensors. A well-known method to quantify and later compensate for the effect of interferents on the potentiometric selectivity coefficients is the fixed interferent method; the potentiometric selectivity coefficients are calculated using Equation (2) [28].
K i , j = ( a i ) e ( a j ) e Z i Z j
where Ki,j is the potentiometric selectivity coefficient for interferent j when measuring analyte i, Zi and Zj are the charges of the respective ions, (ai)e represents the LOD in the presence of the interferent ion, and (aj)e is the used concentration of interferent.
In the calibrations performed to determine the potentiometric selectivity coefficients, a calibration free of interferent was first performed, followed by another one in a medium that contained small concentrations of the studied interferent (Figure S1).
In the comparison of sensitivity, using the t of Student’s test for comparing two methods, there were no statistical differences in the methods with and without interferents, respectively. Regarding the LOD, a slight increase was observed when interferents were at play, changing from 0.24 mM to 0.36 mM in 8.5 mM Cl and to 0.28 mM in 4.9 mM of HCO3. The respective potentiometric selectivity coefficient (Kpot), calculated for each interferent using Equation (2), can be found in Table 2. Since these constants were calculated as a ratio of the LOD, the closest they were to 1, the lower the effect of that anion was. As such, it is clear that out of the different tested interferents, Cl and NO2 had the largest effect.
Finally, the sensors were calibrated back without interferents to ensure the reversibility of their measurements. No change in the original LOD was perceived, proving that interferent anions have no long-term effects on the sensor response.

3.7. Real-Sample Study

The final assessment of the applicability of the sensor was studied with measurements using different media of increasing complexity. We started with spiked synthetic samples of Milli-Q water, bottled water (Viladrau, Spain; batch 43943444), and sink water (Bellaterra, Barcelona, Spain; 20 June 2022), to which NO3 was added from a prepared stock solution. Additionally, a real sample from sulfate-reducing reactor medium was measured as extracted. The sample was ceded by Departament d’Enginyeria Química, Biològica i Ambiental of Universitat Autònoma de Barcelona. We requested to use some medium from one of their reactors, and we were provided with some enriched water that they were currently using to test a reactor designed to reduce sulfate into sulfide. The medium was extracted from the output of the reactor and tested in the lab following the same procedure with all other spiked samples. As the analytical reference method, ionic chromatography (IC) was employed, measuring the concentration of NO3 (for comparison with the sensor) but also Cl and HCO3 in the tap water and reactor medium samples, to compensate for the effect on the sensor measurements using the previously calculated Kpot (Table 3).
While the recovery rate was over 100% in most samples, the largest relative error was around 5%. Moreover, only in the reactor medium sample, the presence of interference caused a meaningful change in the measured concentration. This can be explained by the analyte having a lower concentration (by a factor of 10) than its main interferent. However, mathematically compensating the measurements yielded a very good recovery ratio, proving that the sensor can indeed be used in real samples.

4. Discussion

After thorough characterization, it was shown that using graphite as a solid contact allows optimal liquid membrane ISEs to be fabricated. Whilst the PVC-ionophore membrane provides an almost-Nernstian response (Figure 2) of − (55.4 ± 0.7) mV/dec to NO3, combined with Gr and coupled to the Ag/AgCl-PVBsaturated RE, this analytical behavior was enhanced. It resulted in sensors that are highly stable (Figure 4 and Figure 5), as they could perform around 1440 measurements, whether it be in a single day or spread out over almost an entire month; they are robust (Figure 6), given the wide range of pH (4.0–11.0) in which they can operate; and they are selective (Table 2), thanks to their small Kpot for Cl ( 7.32 · 10 2 ), NO2 (8.1·10−2), CH3COO (3·10−2), SO42− (9.1·10−3), and HCO3 ( 3.35 · 10 2 ). While the objective of selectivity is to avoid sample treatment as much as possible, to reduce the time and cost of measurements, some of the interferents are easily disposed of. HCO3 can be erased by acidifying the sample, as it decomposes into CO2, whilst CH3COO is unlikely to be found in any relevant concentration in environmental samples. Additionally, NO2 is unstable and over time turns into NO3. In several contexts, this means that the interferent disappears by itself. Only in samples where NO2 is regularly produced or there is an explicit interest in separating nitrogen species, this interferent becomes relevant. As such, Cl stands to be the most likely species to cause any trouble in real-sample measurements, given that the coefficient for SO42− is much smaller.
Moreover, the use of printing technologies allows very reproducible batches of sensors to be manufactured (Figure 3), with an RSD in sensitivity of 1.27%, in addition to reducing the cost and time of fabrication. Finally, in accordance with the Spanish “Ministerio de la Presidencia, Relaciones con las Cortes y Memoria Democrática” [4], human consumption water is acceptable if the nitrate concentration is below 50 ppm (0.81 mM). Since this value is higher than the sensor LOD (0.2 mM), it is capable of performing the analysis of environmental samples for the detection of contaminated water.
Therefore, microsensors can be utilized in a wide range of nitrate ion concentrations and environments. This has been further proven by analyzing several samples of different matrix compositions. Even when operating close to its LOD and with an interferent concentration five times higher than the analyte (Table 2), the sensor, after mathematical compensation for the interferent, only yielded a 7% error when compared with ionic chromatography. In spiked samples, the error was at a maximum of 6%. These results were further verified by performing a Student’s t-test (two-tailed, 95% reliance). The tabulated t was 3.182, which was larger than all the experimental values. Consequently, there were no statistical differences between the samples measured with our sensor and with the reference method of IC.

5. Conclusions

In this work, a miniaturized, fully integrated, printed NO3 sensor is presented and thoroughly characterized. This sensing platform includes both the WE and RE needed for a full ISE compact system. It has great stability, both during intense continuous usage and long-term usage; high reproducibility between devices; and an almost-Nernstian response. With a wide linear range and, compared with other potentiometric sensors, a small limit of detection, in addition to its good selectivity and applicability in real samples, the reported sensor can operate as a reliable analytical tool for on-site measurements and pollutant tracking. Moreover, with future improvements, the sensor could be a great springboard for further developments in ISEs and potentiometric sensors.

Supplementary Materials

The following supporting information can be downloaded at: https://www.mdpi.com/article/10.3390/chemosensors11030174/s1, Figure S1: Calibrations performed with NO3 sensor in the presence and absence of the most likely interferents. (A) Interference study of chloride ions, where the green line belongs to a calibration without Cl and the red line to one with 8.5 mM Cl. (B) Interference study of bicarbonate ions, where the green line belongs to a calibration without HCO3 and the red line to one with 4.9 mM of HCO3. (C) Interference study of nitrite ions, where the green line belongs to a calibration without NO2 and the red line to one with 1.56 mM of NO2. (D) Interference study of acetate ions, where the green line belongs to a calibration without CH3COO and the red line to one with 1 mM of CH3COO. (E) Interference study of sulfate ions, where the green line belongs to a calibration without SO42− and the red line to one with 1 mM of SO42−, Figure S2: Studies of sensor behavior at different temperatures. (A) Change in sensitivity at three different temperatures. (B) Variation in the measured potential with 0.1 M NO3 as the temperature changed.

Author Contributions

Funding acquisition, M.B.; investigation, F.P. and A.V.; project administration, M.B.; supervision, G.G. and M.B.; writing—original draft, F.P., G.G. and M.B.; writing—review and editing, F.P., A.V., G.G. and M.B. All authors have read and agreed to the published version of the manuscript.

Funding

The authors acknowledge grant PID2021-126253OB-C21 funded by MCIN/AEI/10.13039/501100011033 and by “ERDF A way of making Europe”, by the “European Union” for the financial support provided to perform this research. Finally, Fusion360 and Cura provided their software for free.

Institutional Review Board Statement

Not applicable.

Informed Consent Statement

Not applicable.

Data Availability Statement

The data presented in this study are available upon request from the corresponding author. The data are not publicly available because the repository that is used to keep the data is a private one provided by the university.

Acknowledgments

The authors thank Oriol Serra for his help in the experiments for the study of pH robustness.

Conflicts of Interest

The authors declare no conflict of interest.

References

  1. Smolders, A.J.P.; Lucassen, E.C.H.E.T.; Bobbink, R.; Roelofs, J.G.M.; Lamers, L.P.M. How nitrate leaching from agricultural lands provokes phosphate eutrophication in groundwater fed wetlands: The sulphur bridge. Biogeochemistry 2009, 98, 1–7. [Google Scholar] [CrossRef] [Green Version]
  2. Romanelli, A.; Soto, D.X.; Matiatos, I.; Martínez, D.E.; Esquius, S. A biological and nitrate isotopic assessment framework to understand eutrophication in aquatic ecosystems. Sci. Total. Environ. 2020, 715, 136909. [Google Scholar] [CrossRef] [PubMed]
  3. Dillon, P.; Molot, L. The role of ammonium and nitrate retention in the acidification of lakes and forested catchments. Biogeochemistry 1990, 11, 23–43. [Google Scholar] [CrossRef]
  4. Real Decreto 47/2022, de 18 de enero, sobre protección de las aguas contra la contaminación difusa producida por los nitratos procedentes de fuentes agrarias. Available online: https://www.boe.es/eli/es/rd/2022/01/18/47 (accessed on 1 February 2023).
  5. Moshoeshoe, M.N.; Obuseng, V. Simultaneous Determination of Nitrate, Nitrite and Phosphate in Environmental Samples by High Performance Liquid Chromatography with UV Detection. South Afr. J. Chem. 2018, 71, 79–85. [Google Scholar] [CrossRef] [Green Version]
  6. Nightingale, A.M.; Hassan, S.-U.; Warren, B.M.; Makris, K.; Evans, G.W.H.; Papadopoulou, E.; Coleman, S.; Niu, X. A Droplet Microfluidic-Based Sensor for Simultaneous in Situ Monitoring of Nitrate and Nitrite in Natural Waters. Environ. Sci. Technol. 2019, 53, 9677–9685. [Google Scholar] [CrossRef]
  7. Wang, H.; Yuan, B.; Yin, T.; Qin, W. Alternative coulometric signal readout based on a solid-contact ion-selective electrode for detection of nitrate. Anal. Chim. Acta 2020, 1129, 136–142. [Google Scholar] [CrossRef]
  8. Yasin, M.; Irawati, N.; Harun, S.W.; Ahmad, F.; Khasanah, M. Sodium Nitrate (NaNO3) Sensor Based on Graphene Coated Microfiber. Meas. J. Int. Meas. Confed. 2019, 146, 208–214. [Google Scholar] [CrossRef]
  9. Isildak, O.; Yildiz, I.; Erenler, R.; Dag, B.; Isildak, I. Hg(II) Ion-Selective Electrodes with PVC Membranes Based on Bis-1,5-dimethyl-2-phenyl-1,2-dihydro-3H-pyrazol-3-one. Bull. Chem. Soc. Jpn. 2022, 95, 353–358. [Google Scholar] [CrossRef]
  10. Isildak, I.; Attar, A.; Demir, E.; Kemer, B.; Aboul-Enein, H.Y. A Novel all Solid-State Contact PVC-Membrane Beryllium-Selective Electrode Based on 4-Hydroxybenzo-15-Crown-5 Ether Ionophore. Curr. Anal. Chem. 2018, 14, 43–48. [Google Scholar] [CrossRef]
  11. Demir, E.; Kemer, B.; Bekircan, O.; Aboul-Enein, H. A Novel Iron(III)-Selective Membrane Potentiometric Sensor Based on 5-Chloro-3-[4-(trifluoromethoxy) phenylimino] Indolin-2-one. Curr. Anal. Chem. 2014, 11, 29–35. [Google Scholar] [CrossRef]
  12. Patella, B.; Russo, R.R.; Aiello, G.; Sunseri, C.; Inguanta, R.; Parade, D. Copper Nanowire Array as Highly Selective Electrochemical Sensor of Nitrate Ions in Water. Talanta 2021, 221, 121643. [Google Scholar] [CrossRef] [PubMed]
  13. Bommireddy, N.; Palathedath, S.K. Templated Bimetallic Copper-Silver Nanostructures on Pencil Graphite for Amperometric Detection of Nitrate for Aquatic Monitoring. J. Electroanal. Chem. 2020, 856, 113660. [Google Scholar] [CrossRef]
  14. Mahmud, M.A.P.; Ejeian, F.; Azadi, S.; Myers, M.; Pejcic, B.; Abbassi, R.; Razmjou, A.; Asadnia, M. Recent Progress in Sensing Nitrate, Nitrite, Phosphate, and Ammonium in Aquatic Environment; Elsevier Ltd.: Amsterdam, The Netherlands, 2020; Volume 259. [Google Scholar] [CrossRef]
  15. Veder, J.-P.; De Marco, R.; Clarke, G.; Chester, R.; Nelson, A.; Prince, K.; Pretsch, E.; Bakker, E. Elimination of Undesirable Water Layers in Solid-Contact Polymeric Ion-Selective Electrodes. Anal. Chem. 2008, 80, 6731–6740. [Google Scholar] [CrossRef] [PubMed] [Green Version]
  16. Chen, M.; Zhang, M.; Wang, X.; Yang, Q.; Wang, M.; Liu, G.; Yao, L. An All-Solid-State Nitrate Ion-Selective Electrode Nutrient Monitoring. Sensors 2020, 20, 2270. [Google Scholar] [CrossRef] [PubMed] [Green Version]
  17. Fan, Y.; Huang, Y.; Linthicum, W.; Liu, F.; Beringhs, A.O.; Dang, Y.; Xu, Z.; Chang, S.-Y.; Ling, J.; Huey, B.D.; et al. Toward Long-Term Accurate and Continuous Monitoring of Nitrate in Wastewater Using Poly(tetrafluoroethylene) (PTFE)–Solid-State Ion-Selective Electrodes (S-ISEs). ACS Sens. 2020, 5, 3182–3193. [Google Scholar] [CrossRef]
  18. Liu, Y.; Liu, Y.; Meng, Z.; Qin, Y.; Jiang, D.; Xi, K.; Wang, P. Thiol-Functionalized Reduced Graphene Oxide as Self-Assembled Ion-to- Electron Transducer for Durable Solid-Contact Ion-Selective Electrodes. Talanta 2020, 208, 120374. [Google Scholar] [CrossRef]
  19. Hassan, S.S.M.; Eldin, A.G.; Amr, A.E.-G.E.; Al-Omar, M.A.; Kamel, A.H.; Khalifa, N.M. Improved Solid-Contact Nitrate Ion Selective Electrodes Based on Multi-Walled Carbon Nanotubes (MWCNTs) as an Ion-to-Electron Transducer. Sensors 2019, 19, 3891. [Google Scholar] [CrossRef] [Green Version]
  20. Li, G.; Xia, Y.; Tian, Y.; Wu, Y.; Liu, J.; He, Q.; Chen, D. Review—Recent Developments on Graphene-Based Electrochemical Sensors toward Nitrite. J. Electrochem. Soc. 2019, 166, B881–B895. [Google Scholar] [CrossRef]
  21. Saha, P.; Akter, R.; Shah, S.S.; Mahfoz, W.; Aziz, M.A.; Ahammad, A.J.S. Gold Nanomaterials and their Composites as Electrochemical Sensing Platforms for Nitrite Detection. Chem. Asian J. 2022, 17, e202200823. [Google Scholar] [CrossRef]
  22. Ferlazzo, A.; Bressi, V.; Espro, C.; Iannazzo, D.; Piperopoulos, E.; Neri, G. Electrochemical determination of nitrites and sulfites by using waste-derived nanobiochar. J. Electroanal. Chem. 2023, 928, 117071. [Google Scholar] [CrossRef]
  23. Gross, B.; Lockwood, S.Y.; Spence, D.M. Recent Advances in Analytical Chemistry by 3D Printing. Anal. Chem. 2017, 89, 57–70. [Google Scholar] [CrossRef]
  24. Li, Q.; Zhang, J.; Li, Q.; Li, G.; Tian, X.; Luo, Z. Review of Printed Electrodes for Flexible Devices. Front. Mater. 2019, 5, 77. [Google Scholar] [CrossRef] [Green Version]
  25. Bao, C.; Kim, W.S. Perspective of Printed Solid-State Ion Sensors toward High Sensitivity and Selectivity. Adv. Eng. Mater. 2020, 22, 2000116. [Google Scholar] [CrossRef]
  26. Palenzuela, C.L.M.; Pumera, M. (Bio)Analytical Chemistry Enabled by 3D Printing: Sensors and Biosensors. Trends Anal. Chem. 2018, 103, 110–118. [Google Scholar] [CrossRef]
  27. Jiang, H.; Yu, W.; Waimin, J.F.; Glassmaker, N.; Raghunathan, N.; Jiang, X.; Ziaie, B.; Rahimi, R. Inkjet-Printed Solid-State Potentiometric Nitrate Ion Selective Electrodes for Agricultural Application. Proc. IEEE Sensors 2019, 2019, 19–22. [Google Scholar] [CrossRef]
  28. Umezawa, Y.; Umezawa, K.; Tohda, K.; Amemiya, S. Potentiometric Selectivity Coefficients of Ion-Selective Electrodes. Int. Union Pure Appl. Chem. 2000, 72, 1851–2082. [Google Scholar] [CrossRef]
  29. Moya, A.; Pol, R.; Martínez-Cuadrado, A.; Villa, R.; Gabriel, G.; Baeza, M. Stable Full-Inkjet-Printed Solid-State Ag/AgCl Reference Electrode. Anal. Chem. 2019, 91, 15539–15546. [Google Scholar] [CrossRef]
Figure 1. Photograph of the full size of the platform compared with EUR 1 coin and close-up of (A) Ag/AgCl electrode and (B) Gr electrode.
Chemosensors 11 00174 g001
Figure 2. Electroanalytical characterization of the sensor towards NO3 ions through calibration procedure. (A) Representation of the potential as a function of log NO3 concentration. The red squares are out of the linear range (sub-Nernstian response zone), and the other data points are fitted linearly to obtain the sensor sensitivity (Nernstian response zone). (B) Graph of potential against time as NO3 stock addition, visible as potential steps, was performed.
Chemosensors 11 00174 g002
Figure 3. Study of reproducibility of fabrication of sensors (N = 3) by comparing their sensitivity. The green line represents the Nernstian theoretical value (−59.2 mV/dec to NO3 at 25 °C).
Chemosensors 11 00174 g003
Figure 4. Stability study of the sensor. Sensitivity of 20 consecutive calibrations (380 measurements) measured in a single day. The green line represents the Nernstian theoretical value (−59.2 mV/dec to NO3 at 25 °C).
Chemosensors 11 00174 g004
Figure 5. Reproducibility study. Characterization of the response of the sensor measured in triplicate during different days and weeks. The green line represents the Nernstian theoretical value (−59.2 mV/dec to NO3 at 25 °C).
Chemosensors 11 00174 g005
Figure 6. Study of the effect of pH on response. Chronopotentiometry measurements of NO3 ions at different pH. A first sensor started with low acidic pH, which steadily increased (green line), and another sensor started with alkaline pH, which decreased towards acid (blue line).
Chemosensors 11 00174 g006
Table 1. Comparison between several reported sensors in the bibliography and the one presented in this work.
SensorSensitivity (mV/dec.)LOD * (mM)StabilityLinear Range (mM)SamplesIntegrated REReference
PPy(NO3) 1−506.3·10−365 days0.001–10Real (soil)No[13]
PTFE-PVC 2−580.220 days0.016–1RealNo[14]
TRGO-PVC 3−60.0 ± 0.54·10−314 days0.004–100No samplesNo[15]
MWCNTs-PVC 4−55.1 ± 2.128·10−6Not reported0.00008–10RealNo[16]
Ag-PVC−52 ± 1.8Not reportedNot reported1–100Real (soil)No[21]
Gr-PVC−55.1 ± 0.70.225 days0.3–170Spiked, realYesThis work
* Limit of detection (LOD). 1 Polypyrrole (PPy). 2 Poly(tetrafluoroethylene) (PTFE). 3 A (TRGO). 4 Multiwalled carbon nanotubes (MWCNTs).
Table 2. Quantification of the interfering effect of different anions on the response of the NO3 sensor. The compositions on which each study was performed are included.
InterferentConcentration (mM)Kpot
Cl8.57.3·10−2
HCO34.93.35·10−2
CH3COO13·10−2
NO21.568.1·10−2
SO42−19.1·10−3
Table 3. Sensor validation comparing the results of different spiked and real samples measured with the integrated RE and NO3 sensor platform (N = 3) and IC. Cl and HCO3 concentrations are included to compensate using the potentiometric coefficients.
SamplePrinted Sensor [NO3] (mM)IC [NO3] (mM)[Cl] (mM)[HCO3] (mM)Recovery %t-Test
(N = 3)
Milli-Q water97 ± 191 ± 4------1062.52
Bottled water102 ± 697 ± 40.171.861061.2
Tap water97 ± 292 ± 32.352.031052.4
Reactor medium0.53 ± 0.010.58 ± 0.035.26---932.73
Disclaimer/Publisher’s Note: The statements, opinions and data contained in all publications are solely those of the individual author(s) and contributor(s) and not of MDPI and/or the editor(s). MDPI and/or the editor(s) disclaim responsibility for any injury to people or property resulting from any ideas, methods, instructions or products referred to in the content.

