Article

Pyrene-Based Fluorescent Probe for “Off-on-Off” Sequential Detection of Cu2+ and CN with HeLa Cells Imaging

by
Muthaiah Shellaiah
1,†,
Parthiban Venkatesan
1,†,
Natesan Thirumalaivasan
2,*,
Shu-Pao Wu
1,* and
Kien-Wen Sun
1,*
1
Department of Applied Chemistry, National Yang Ming Chiao Tung University, Hsinchu 300, Taiwan
2
Department of Periodontics, Saveetha Dental College and Hospitals, Saveetha Institute of Medical and Technical Sciences (SIMATS), Chennai 600077, India
*
Authors to whom correspondence should be addressed.
These authors contributed equally to this work.
Chemosensors 2023, 11(2), 115; https://doi.org/10.3390/chemosensors11020115
Submission received: 19 December 2022 / Revised: 31 January 2023 / Accepted: 1 February 2023 / Published: 4 February 2023
(This article belongs to the Special Issue Chemosensors for Ion Detection)

Abstract

:
The novel pyrene-appended Schiff base probe L with aggregation-induced emissions (AIE) relevant to an increase in water fractions (0–90%) is synthesized and applied in sequentially detecting Cu2+ and CN. The pyrene-based probe L firstly induces the excimer formation in the presence of Cu2+. However, the process can be reversed by sequentially adding CN, which is demonstrated using the fluorescence “Off-On-Off” response in semi-aqueous media ethanol water (v/v = 7/3) under physiological pH (5 mM HEPES, pH 7.0). The Job’s plot, mass analysis, 1H NMR titrations, and density functional theory (DFT) interrogations confirm the 2:1 stoichiometry of excimer complex L–Cu2+-L*, preferential binding atoms, and CN tuned complex reversibility. Based on the photoluminescence (PL) titration, the association constant of L to Cu2+ is determined as 4.95 × 10⁶ M−1. From standard deviation and linear fittings, the detection limits (LODs) of Cu2+ and CN are estimated as 219 nM and 580 nM, respectively. The practicality of Cu2+ and CN detection is demonstrated using a TLC plate and a blended polymer membrane through which significant color changes under a UV lamp can be monitored. Moreover, utility of the designed probe L towards biological application with low toxicity is demonstrated by detecting Cu2+ and CN inside HeLa cells. The responses of the probe to Cu(II) ions were also verified using living HeLa cells imaging.

1. Introduction

Recognition and optical signaling systems for important cations and anions have been actively studied in recent years due to their fundamental roles in a wide range of environmental and biological processes [1,2]. In this regard, chemosensors for detecting heavy ions as well as transition metal ions (Cu2+, Pb2+, Cd2+, Zn2+, and Hg2+) have great importance. Among all metal ions, Cu2+ is considered the third most abundant transition metal ion existing in the human body [3]. Copper is well known as a required catalytic cofactor in nearly 20 enzymes. Moreover, the normal concentration level of copper into the blood serum is 15.7–23.3 µM [4,5]. However, copper concentrations exceeding or below the specific value can lead to severe renal problems as well as neurodegenerative diseases, such as, Alzheimer’s, Parkinson’s, and Huntington’s disease [6,7,8,9,10,11]. In earlier reports, most of the copper detection probes suffer from the interferences of other cations [12,13]. To tackle this challenging task, many pyrene-appended, Schiff-based chemosensors have been developed for the selective detection of metal ions. Most of the reports demonstrated a fluorescence turn-off response due to the paramagnetic nature of Cu2+. However, sometimes the turn-off response is not reliable due to the signals from backgrounds [14,15,16,17]. Therefore, designing a highly selective and sensitive fluorescence turn-on probe for the copper ion has become a great and challenging task.
On the other hand, the cyanide-containing salts are extremely toxic for all biological systems as well as ecological systems [18]. At the same time, the cyanide is versatile for many industrial processes, such as electroplating, plastic manufacturing, tanning, nylon, acrylic polymer synthesis, and metallurgy [19,20]. Therefore, industrial wastewater containing cyanides plays a major role in the exposure of the cyanides to living systems, and thereby causes serious problems to the human body including the visual, cardiac, and metabolic systems. However, the binding of cyanide ions to cytochrome c oxidase is caused by blocking the adenosine triphosphate (ATP) [21,22]. Hence, great interest has been developed towards the selective detection of cyanide ions using simple, convenient, and biocompatible fluorophores [23]. To date, a number of cyanide sensors utilizing copper-cyanide affinity have been developed based on a variety of sensing approaches. Some of them utilize a cyanide ion-based hydrogen bond interaction, while others add the cyanide as a nucleophile into the bond formation, such as C–C, C–B, and C–S, and finally into the designed sensor [24,25]. However, cyanide ion detection utilizing copper-cyanide affinity toward the formation of the ternary complex still remains a challenging task.
To tackle the aforementioned challenge, we explored the formation of a ternary complex of the designed probe L, Cu2+, and CN by synthesizing a novel pyrene sensor probe based on a pyrene fluorophore platform, which has good spectroscopic properties, a high quantum yield, and can produce excimer emissions (P-P*) by adding specific analytes. In addition to the excimer emissions, the aggregation-induced emissions (AIE) were also observed with an increasing amount of water. However, the incorporation of pyridine not only improved the water solubility but also acted as a receptor for complexing metal ions due to the presence of the electronegative nitrogen atom [26,27,28,29,30]. Herein, probe L without the addition of the occurrence of the chelation-enhanced fluorescence emission (CHEF) and simultaneous excimer formation into L in the presence of Cu2+ were investigated with great detail. Interestingly, fluorescence modulation was observed when the cyanide ions reacted with the pyrene excimer L–Cu2+ complex via the formation of a nonfluorescent ternary complex in a semi-aqueous medium. Moreover, the sensing strategy was utilized on a TLC plate and a blended polymer membrane through which significant emission color changes were monitored. Cell viability and bioimaging by using the L probe proved that they can be of practical utility in biomedical applications. Figure 1 displays the schematic of L-based emission changes, excimer complex formation, and reversibility during the sequential detection of Cu2+ and CN.

2. Materials and Methods

2.1. Instrumentation

The Bruker DRX-300 and the Agilent Unity INOVA-500 NMR spectrometers were used to record the corresponding NMR spectra. The UV–Vis absorption spectra were measured using an Agilent 8453 spectrometer where the sample was held in a quartz cuvette with a pathlength of 1 cm. A Hitachi F-7000 fluorescence spectrophotometer was used to record the fluorescent spectrum in which the sample was held in a quartz cuvette with a pathlength of 1 cm. All the absorption and emission experiments were conducted at room temperature. In addition, the Leica TCS SP5 X AOBS and Leica TCS SP5 II Confocal Fluorescence Microscope were used to record the fluorescent images.

2.2. Preparation of Metal Ion and Anion Solutions for UV-vis and Fluorescence Studies

Probe L was dissolved in EtOH: H2O (7:3 v/v) at 1 × 10⁻⁵ M concentration. The solution of Co2+, Mn2+, Pb2+, Cu2+, Zn2+, Fe2+, Ni2+, Ba2+, Sn2+, Cu+, Ca2+, Ag+, Li+, K+, Fe3+, Cr3+, and Cs+ metal cations were dissolved in water medium at a concentration of 1 × 10⁻⁴ M from their chloride salts. Ag2+, Hg2+, and Mg2+ were prepared from AgNO3, Hg(OAc)2, and MgSO4, respectively, in water medium at a concentration of 1 × 10⁻⁴ M. The solution of F, Cl, Br, I, OH, SCN HPO42−, and H2PO4 anions were dissolved in water at a concentration of 1 × 10⁻⁴ M from their tetra butyl ammonium salts. Note that the CN anion solution was prepared in water at a concentration of 1 × 10⁻⁴ M from potassium cyanide.

2.3. Quantum Yield (QY) Calculation

To calculate the quantum yield of probe L, the anthracene (Φ = 0.27) was used as the reference using the following formula:
Φsample = Φstd (Isample/Istd) (Astd/Asample) (ηsamplestd)2,
where Φstd stands for the quantum yield of the reference sample (anthracene), Isample/Istd represents the intensity ratio of the sample (L) and standard (anthracene), Astd/Asample is the absorbance ratio of sample and standard, and ηsamplestd is the ratio of refractive indices.

2.4. NMR Titrations

10 mmol (1 equiv.) of probe L in DMSO-d6 were titrated with 5 mmol (0.5 equiv.) of Cu2+ and 20 mmol (0.5 equiv.) of CN in D2O.

2.5. Synthesis of Probe L

Scheme 1 illustrates the preparation of probe L. The extraction of 1-nitro-pyrene from pyrene was followed by a reduction with stannous chloride to give 1-aminopyrene. A catalytic amount of acetic acid was added to dissolve the 1-aminopyrene (110 mg, 25 mmol) and 2-Pyridinecarboxaldehyde (55 mg, 25 mmol) in ethanol. The reacted mixture was refluxed and continuously stirred at 60 °C for seven hours. Formation of the final product was observed using TLC. The solid crude product was filtered and dried with ether followed by recrystallization (twice) in absolute ethanol to yield the pure compound. Yield: 63%. 1H NMR (300 MHz, DMSO-d6): 8.920 (d, 1H, J = 6.6 Hz), 8.80 (d, 1H, J = 4.5 Hz), 8.68 (d,1H, J = 6.0 Hz), 8.64 (d,1H, J = 6.0 Hz), 8.48–8.04 (m, 10H), 7.62–7.58 (m, 1H);13C NMR (75 MHz, DMSO-d6): 161.87, 154.82, 150.30, 144.13, 137.68, 131.47, 131.30, 127.86, 127.77, 127.02, 126.27, 126.27, 125.84, 125.84, 125.63, 124.85, 124.43, 123.29, 122.11, 116.24 MS (ESI): m/z = 306 ([M+H]+).

2.6. Cytotoxicity Assay

The methylthiazole tetrazolium (MTT) experiment verified the cytotoxicity and biocompatibility of probe L. HeLa cell lines were grown on 96-well cell culture plates and the probe L was added at varied concentrations (0, 20, 40, 60, 80, and 100 µM). Firstly, these cells were grown at 37 °C and 5% CO2 for 24 h followed by incubation for 4 h at 37 °C in 5% CO2 with 10 mL MTT at a concentration of 5 mg/mL. When the MTT solution was removed, a yellow precipitate known as formazan can be observed. An total of 200 L DMSO and 25 µL Sorensen’s glycine buffer (0.1 M glycine and 0.1 M NaCl) were used to dissolve the yellow precipitate. The absorbance of each well was determined at 570 nm using a Multiskan GO microplate reader.
Cell viability (%) = mean of absorbance value of treatment group/mean of absorbance value of control group.

2.7. Living Cell Culture and Confocal Laser Scanning Microscopy Imaging of Probe L

HeLa cells were cultured in an incubator containing 5% carbon dioxide in DMEM medium supplemented with 10% (v/v) fetal bovine serum and 100 mg/mL of penicillin and streptomycin. The cells were treated for 30 min at 37 °C with 10 µM of probe L diluted in DMSO. When 5 µM of Cu2+ was given to the indicated cells, strong blue fluorescence with gradually increasing intensity can be observed after thirty minutes. Before observation, the culture media was eliminated, and the treated cells were rinsed with 0.1 M PBS (2 mL). To acquire the fluorescence photo images of cells, a German Leica TCS SP5 X AOBS Confocal Fluorescence Microscope and a 63-oil-immersion objective lens were utilized. The cells were excited using UV light below 410 nm, and their emission was detected at 440 nm.

2.8. Theoretical Calculations [31,32,33]

DFT studies were conducted by using B3LYP with basis sets of ligand L (6-31 G) and the metal complex L-Cu2+-L* (LanL2DZ) in the gas phase using the (# S9M016834774271W-1271N) Gaussian 09 software package.

3. Results and Discussion

3.1. Synthesis

The chemosensor probe L was synthesized by the one-pot reaction of the 1-Aminopyrene and 2-Pyridinecarboxaldehyde to form a Schiff base as seen in Scheme 1. The probe L was characterized by 1H NMR, 13C NMR as shown in Figures S1–S3 (Supporting Information; SI).

3.2. Effect of Solvents and Aggregation-Induced Emissions (AIEs) from Schiff Bases

The Schiff base receptor L was synthesized with an excellent yield using a simple synthetic step and the molecular structure was well characterized and authenticated using various spectroscopic techniques. By incorporating pyrene into L, the fluorophore displayed a change in excimer–monomer emission intensity due to the formation of the self-assembled pyrene conjugate via the intermolecular π-π stacking while interacting with a particular analyte of choice. The designed probe was fully conjugated and displayed good solubility in solvents of less polar to highly polar, such as CH3CN, DMSO, DCM, EtOH, and MeOH, with no excimer emission (Figure S4a, Supplementary Information). The controlled experiments revealed a more significant excimer emission from L with divalent copper metal ion in protic solvents, such as EtOH and MeOH, than that of aprotic solvents, such as CH3CN, DMSO, and DCM. However, EtOH was found to stimulate the formation of self-assembled pyrene conjugates, which led to a selective excimer emission in the presence of Cu2+ as shown in Figure S4b (Supplementary Information). However, most of the biologically and environmentally significant analytes are present in water. Therefore, we are more interested in finding out the appropriate water percentage in our experimental conditions so as to make the method applicable for detecting various analytes in semi-aqueous conditions. However, the self-assembled conjugates via the intermolecular π-π stacking in the presence of water have been well established and demonstrated by several research groups [26]. Therefore, we firstly estimated the interference of water towards assembly and then to produce AIEs from our probe using an increased percentage of water. To conduct the experiment, 10 samples with L (10 µM) in EtOH and different amounts of water from 0 to 90% were prepared and excited at a wavelength of λex = 380 nm to examine changes in fluorescence intensity. The results reveal a fluorescence enhancement with spectral shifting after a time delay of 22 h, as shown in Figure 2a. However, the emission maximum is quite high (by 21-fold) in 80% of water and is well detectable under UV light, thereby indicating the formation of self-assembled pyrene conjugates, as displayed in Figure 2b. On the other hand, the fluorescence was significantly suppressed under extreme conditions, such as above 80% of water, due to the formation of larger aggregates of the pyrene monomer. Moreover, the immediate response of water towards AIEs was found to be negligible by up to 30% in the EtOH solvent. Therefore, later experiments were conducted in a solvent system with 30% of water in EtOH to get significant emissions from L in the presence of analytes of choice.

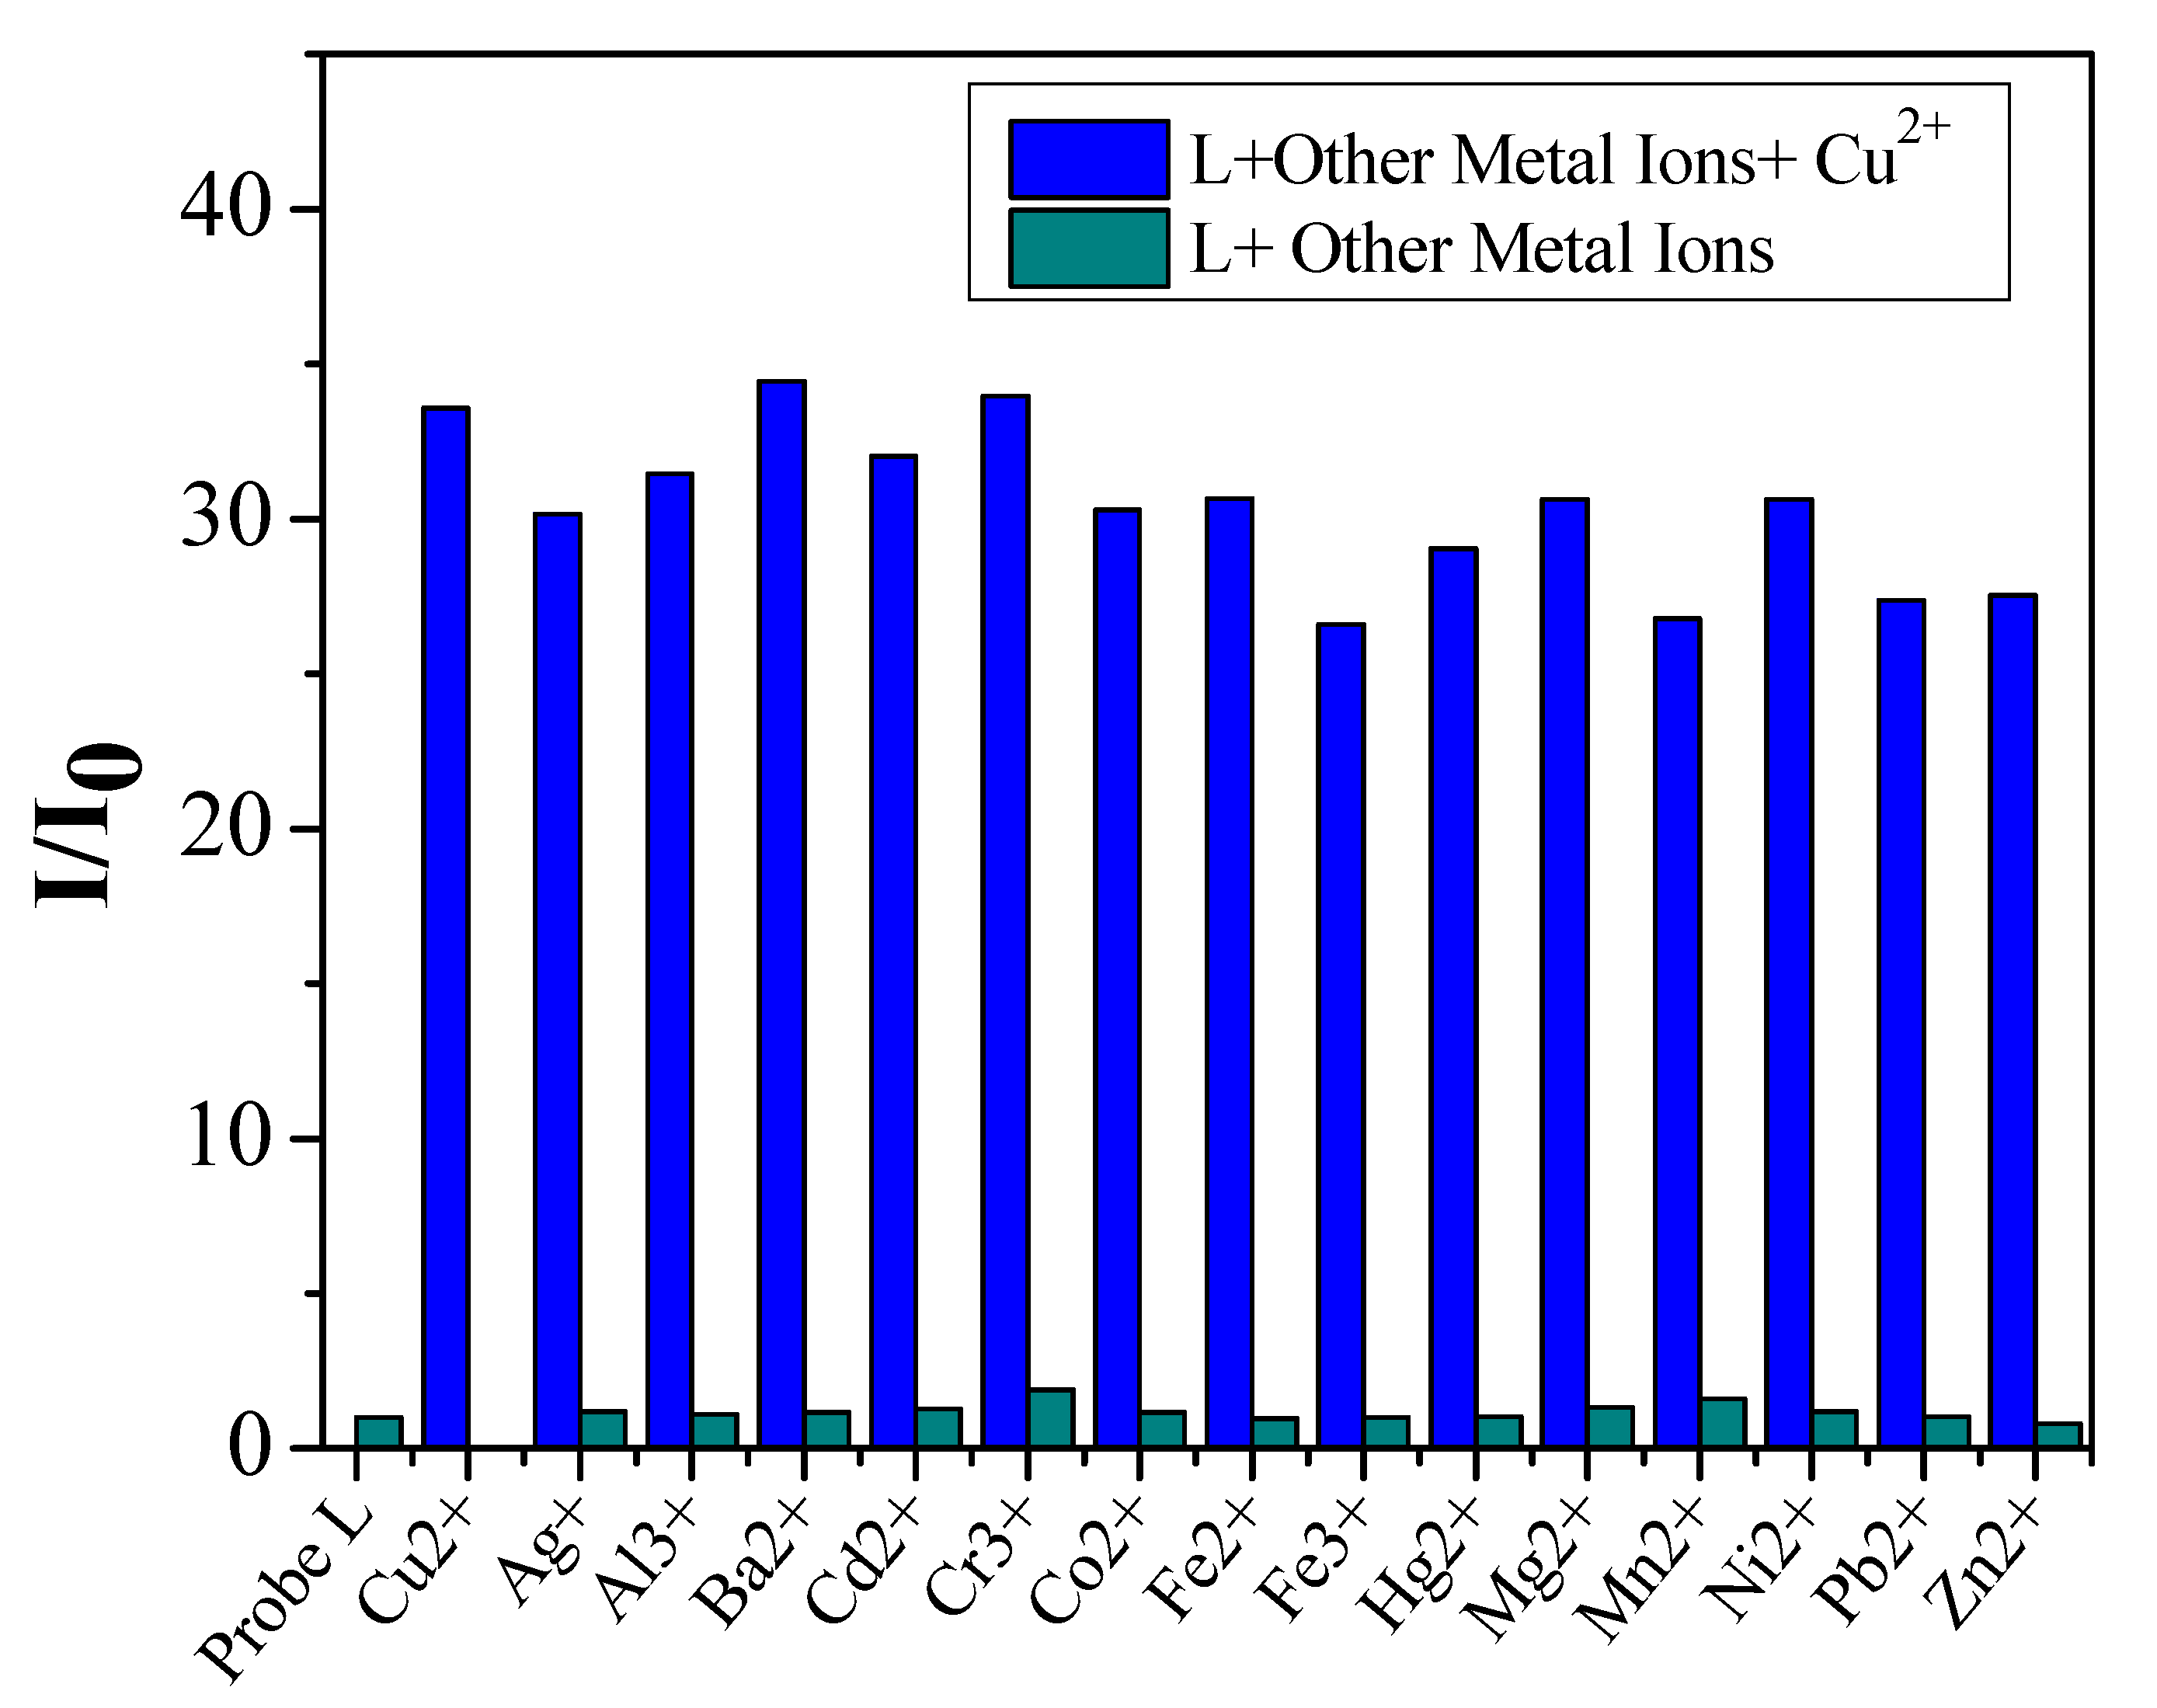
3.3. Selectivity Analysis of Probe L by Metal Ions

In the beginning, the designed probe L showed very weak fluoresce in the ethanol-water (v/v = 7/3, 5 mM HEPES, pH 7.0) under physiological conditions. This may be due to the following two reasons: (1) enhanced efficient electron transfer into the pyrene ring through the conjugation due to the presence of heteroatom N in the conjugation of the pyrene ring; (2) predominant non-fluorescent monomeric formation of pyrene under our experimental conditions. Thereby, investigations were conducted to interrupt the PET (photoinduced electron transfer) and to obtain a significant excimer emission so that the high fluorescence from L can be detected with the naked eye under a UV lamp. This can make the sensing method easier for practical utility. Heteroatom ‘N’ is a well-known receptor of metal cations. Therefore, we assume that this may facilitate the binding with metal ions via strong metal chelating interactions resulting in a metallosupramolecular assembly. Various alkali and transition metal ions were chosen to study selectivity, changes in optical properties, and possible metal chelation-driven excimer emissions of L. The preliminary investigations were based on the changes in the fluorescence emissions of L in the presence of various metal ions because it was easier to monitor the excimer emission intensity changes. The chelation ability of receptor L (10 µM) in the ethanol–water (v/v = 7/3, 5 mM HEPES, pH 7.0) solution was monitored using a series of 15 µM alkali and transition metal ions (Mg2+, Co2+, Mn2+, Pb2+, Ag2+, Hg2+, Cu2+, Zn2+, Fe2+, Ni2+, Ba2+, Sn2+, Cu+, Ca2+, Ag+, Li+, K+, Cs+,Fe3+, and Cr3+). The corresponding fluorescence intensity changes were recorded as shown in Figure 3a,b.
When adding the Cu2+ metal ion into the L solution, a strong excimer emission band centered at 438 nm was observed. However, many alkali and transition metal ions were found unable to induce any spectral changes from L. Such a strong fluorescence from L in the presence of Cu2+ can be attributed to the chelation-enhanced fluorescence (CHEF), which disrupts the photo-induced electron transfer (PET) from heteroatom ‘N’ to pyrene ring as well as the formation of fluorescent metallosupramolecular assemblies in a semi-aqueous condition of ethanol–water (v/v = 7/3, 5 mM HEPES, pH 7.0) at a physiological condition. Changes in quantum yields of L in the absence and presence of Cu2+ were found to be Φ = 0.0009 and Φ = 0.811, respectively. Such a huge difference in the quantum yield values clearly indicates that the excimer emission in blue color and a lighting up probe for Cu2+ in a molar ratio of 1:0.5 can be well visualized by the naked eye under a UV lamp. The high selectivity of L towards Cu2+ over other potentially competitive analytes was also examined via single and competitive metal experiments as described in the following.
For the single metal sensing system (green bars) towards L, Cu2+ results in a more significant emission enhancement than that of other metal ions, even at a higher concentration of 15 µM as shown in Figure 4. Similarly, in a dual-metal system (blue bars), the fluorescence changes of L (10 µM) in the ethanol–water solution (v/v = 7/3, 5 mM HEPES, pH 7.0) were carried out by treating 5 µM of Cu2+ ion with 15 µM of other competitive metal ions such as, Ag+, Al3+, Ba2+, Cd2+, Cr3+, Co2+, Fe2+, Fe3+, Hg2+, Mg2+, Mn2+, Ni2+, Pb2+, and Zn2+ (note: highly competing species were considered for the interference study). As shown in Figure 4, significant fluorescence emissions at 438 nm can be observed and the majority of them shows interference. In the presence of Zn2+, Mn2+, Fe3+, Pb2+ and Hg2+, the turn on emission intensity of L + Cu2+ was slightly decreased, but still showed a strong enough fluorescence towards Cu2+. The above results indicate that L is a promising candidate for the selective detection of Cu2+ in the presence of various competing metal ions. Therefore, L may be considered as a highly selective fluorescent probe for Cu2+.
The changes in UV spectra titration of L (10 µM) in the ethanol–water solution (v/v = 7/3, 5 mM HEPES, pH 7.0) with various equivalents of Cu2+ are shown in Figure 5a. The free L exhibits a maximum absorbance at 380 nm. When adding Cu2+, the absorbance band decreased in intensity and was accompanied by a new absorbance band that appeared at 348 nm. Intensity of this newly emerged absorbance band gradually increased with the increasing Cu2+ concentration. Because the large molar extinction coefficient (17,440 M−1 cm−1 at 380 nm) is due to the dd transitions of copper, it is therefore categorized as a ligand-based transition. The elaborated fluorogenic signaling behavior of the fluorescence titration curve displayed a smooth and steady fluorescence enhancement at 438 nm with the increasing Cu2+ concentration. However, after adding 5 µM of Cu2+, the fluorescence emission intensity of L saturates at a maximum value with an enhancement factor of 34-fold, as shown in Figure 5b. Note that the fluorescence and absorbance changes are attributed to the metal complex formation. In the early stages, the probe L may possess the inner filter effect (IFE)/photoelectron transfer (PET) with no emissions produced due to the electrons’ transfer from a donor to an accepter of pyrene moiety. However, the complex formation induces the “Turn-On” response in the presence of Cu2+ by prohibiting the PET, not the IFE, as according to earlier reports [26,33]. Moreover, adding more equivalents of copper slightly suppressed the maximum fluorescence intensity of L, which expressed L in the metal binding ratio. Stoichiometry of L to metal (1:0.5) was further confirmed by plotting the emission intensity at 438 nm as a function of the mole fraction (Xm) of the metal ion to generate a Job’s plot, as shown in Figure S5 (Supplementary Information). Association constant (Ka) of L with Cu2+ was determined to be (4.95 × 10⁶ M−1) (R = 0.99416), which was obtained by plotting α2/(1 − α) vs. 1/[Cu2+], where the symbol α represents [F − F0]/[F1 − F0], F0 is the initial fluorescence intensity of L without Cu2+, F defines the variation of fluorescence intensity of L in the presence of Cu2+, and F1 stands for the maximum fluorescence intensity of L in the presence of Cu2+. Furthermore, linear behavior was observed between the maximum emission intensity from the L and Cu2+ concentrations. Therefore, the designed probe L can be used to probe Cu2+ quantitatively in a semi-aqueous condition, even in a competitive environment with various metal ions.
The calculated limit of detection (LOD from 3/slope) of the probe L for Cu2+ was 219 nM (Y = 4.59245 x + 0.62582, R2 = 0.98667), which is a reasonable value for detecting Cu2+ with a concentration level of micromolar and meets the required detection limit for the contamination level defined by the World Health Organization for drinking water. Figure S6 (Supplementary Information) shows that probe L can effectively detect a trace amount of Cu2+ in contaminated water.

3.4. Changes in Excimer Emission of L–Cu2+ with Anions

On the other end of the spectrum, we are also interested in whether the excimer emissions from L in the presence of Cu2+ could be quenched with certain anionic analytes as the L–Cu2+ complex was considered to be one of the best and the most important system for detecting various anionic analytes in earlier reports [34,35,36,37,38]. Therefore, we studied the fluorescence quenching ability of L–Cu2+ (10 µM) by incorporating various anions, such as the F, Cl, Br, I, OH, SCN HPO42− H2PO4, and CN ions under similar experimental conditions, as in earlier experiments. When adding 15 µM of CN ion into L–Cu2+ (10 µM) in ethanol–water (v/v = 7/3, 5 mM HEPES, pH 7.0) solution, a significant quenching of excimer emissions at 438 nm was observed, as shown in Figure 6, whereas other potential anions are unable to affect the emissions of L–Cu2+. In order to authenticate the high selectivity of the L–Cu2+ complex toward the target analyte CN, a sensing experiment was conducted in a competitive environment of other anions. As shown in Figure S7 (Supplementary Information), the results reveal almost no interference occurred to the sensing capability of the CN ion via the L–Cu2+ complex system. Therefore, it demonstrates that the fluorometric probe L–Cu2+ is highly selective towards the CN ion in a competitive environment of other anions. The observed fluorescence quenching of L–Cu2+ can be attributed to the disruption of excimer due to the CN binding with L. Thereby, the designed probe L in the template L–Cu2+ form can be utilized to probe CN ions quantitatively in a competitive environment of various anions. The intensity of blue emissions can be gradually reduced with increasing CN. This allowed us to detect CN by measuring the fluorescence intensity changes.
We used titration curves of L + Cu2+ as a function of CN concentrations (0–15 µM) to evaluate how the fluoresce was affected by CN. The results display a progressive decrease in fluorescence at 438 nm (Figure 7). The data reveal that the lowest intensity was reached after adding 15 µM of CN. As shown in Figure S8 (Supplementary Information), the limit of detection (LOD from 3/slope) is 580 nM (Y = 0.15516 x + 0.97013, R2 = 0.98667) based on the standard deviation and linear fitting plots of I/I0 as a function of [CN].

3.5. 1H NMR, Mass and DFT Investigations on Complex Formation

To confirm and examine the bindings of Cu2+ and CN into L, we performed 1H NMR titration for L in the DMSO-d6 solvent in the absence and presence of Cu2+ and CN. When continuously adding Cu2+ (0–5 µM) into the L solution, the Ha (8.81 ppm) and Hb (8.94 ppm) protons are gradually upfield shifted and become broader, whereas the Hc (7.62 ppm) proton is slightly downfield shifted and shows a broad pattern. Therefore, such prominent shifting in the proton peaks clearly indicates the involvement of the heteroatom (N) towards chelation with the metal ion in forming excimer between pyrene monomers, as shown in Figure S9 (Supplementary Information). Similarly, the EI Mass data also demonstrate the products of L with Cu2+ (see Figure S10, Supplementary Information), wherein the m/z at 759.1 and 380.1 correspond to L + Cu2+ + 5OH–2H+ and L + 4H2O + 2H+, respectively. Be noted that the mass values clarify the L–Cu2+–L* excimer formation as well. When gradually adding the cyanide ion (from 0 to 15 µM) into the L–Cu2+ solution (DMSO-d6), the Ha and Hb protons shift back to their original values (as in the case of L in the absence of Cu2+) with a sharp intensity profile, whereas the Hc protons also shift back to the original spectral pattern with a similar value and sharp intensity, as shown in Figure S11 (Supplementary Information). Therefore, the significant changes that occurred in the NMR spectral pattern clearly indicate feasible interactions of L with Cu2+ and CN. To verify the probe’s reversibility in L–Cu2++CN, a mass spectral investigation was conducted, in which m/z peaks at 348.2 and 227.1 corresponding to L + H2O + Na+ + 1 and Cu(CN)2.7H2O + 4H+, respectively, and was visualized (see Figure S12, Supplementary Information), thereby confirming the probe’s reversibility.
To support the L–Cu2+–L* excimer complex, DFT calculations were performed by using Gaussian 09 software. The optimized structure of L and the L–Cu2+–L* excimer complex are shown in Figure 8a,b. The HOMO, LUMO, and band gap of L are estimated as −5.30 eV, −2.21 eV, and 3.09 eV, respectively. In contrast, the HOMO, LUMO, and band gap of L–Cu2+–L* excimer are found as −10.43 eV, −7.91 eV, and 2.51 eV, respectively, as displayed in Figure 8c. In fact, the electronic cloud in L located above pyrene unit shifts to the complex center in L–Cu2+–L*, which gives the fluorescent “Turn-On” response. Thereby, the 2:1 excimer complex is firmly validated.
Based on PL, UV-vis, NMR, and DFT interrogations, facile detection of Cu2+ and CN is well demonstrated. The formation L–Cu2+ template was found to facilitate the interaction with CN to generate a ternary complex system without any displacement mechanism, thereby making the system work as a dual sensor for detecting both cation and anions in a semi-aqueous medium ethanol–water solution (v/v = 7/3, 5 mM HEPES, pH 7.0).

3.6. pH Effect

We investigated the pH stability of this probe for convenient environments and biological application. The experiments were carried out with and without adding Cu2+ in the ethanol–water solution (v/v = 7/3, 5 mM buffer). As shown in Figure 9, there is no obvious fluorescence intensity change of L over a wide pH span from 1 to 12, which indicates that the L sensor probe is rather stable over a wide PH range. However, the nitrogen donor binds to Cu2+ after coordination of L with Cu2+. The PET process from the lone electron pairs of nitrogen donor to the fluorophore is completely blocked, which triggers strong fluorescence enhancements over a wide range of pH (4–12). It suggests that the L sensor probe is compatible with biological applications. The fluorescence cannot be observed due to the protonation of the nitrogen donor at pH < 4, which inhibits the formation of the excimer–copper complex.

3.7. Probing the Interaction on TLC Plate and Polymer Membrane

3.7.1. Emission Color Modulation on a TLC Plate

The Cu2+ and CN detection systems reported in earlier works were mostly solution-based. However, detections conducted on a solid-based platform can be more convenient and viable for analysis with less trouble [38,39,40,41,42,43,44,45,46,47,48]. To make application of L more practical, we prepared a thin film of L on a silica coated glass plate TLC by dripping L (dissolved in CH3CN solution) onto the plate. The films produced a very weak blue fluorescence under UV lamp illumination. The blue fluorescence was greatly enhanced in a short time after dipping the TLC plate in a diluted aqueous Cu2+ solution containing a Cu2+ concentration of 1 × 10⁻⁴ M. When the above TLC plate with bright fluorescence is dipped into a CN solution, the fluorescence is immediately quenched, as displayed in Figure 10a–c. Hence, detecting of CN using the above L–Cu2+ system and method becomes simple, rapid, and practical.

3.7.2. Emission Color Modulation on a Polymer Membrane

The film and membrane forming capabilities of L allow us to conduct membrane-based Cu2+ and CN detection in aqueous medium. The membrane-based technique is based on adsorption and can be adopted for removing contaminants in water [37]. Therefore, as a proof-of-concept, we demonstrated the detection of Cu2+ and CN using a membrane film prepared by doping 2% of L in a polystyrene (PS) solution dissolved in THF followed by casting the solution over a glass slide. After the membrane was completely dried, it was cut into a rectangular shape and placed on a glass plate. The membrane formed showed extremely weak fluorescence under a UV lamp (Figure 11a). When the membrane is dipped into a diluted aqueous Cu2+ solution with a concentration of 1 × 10⁻⁴ M, a bright fluorescence is visualized under UV lamp illumination, as shown in Figure 11b. When the PS + L–Cu2+ membrane was added to the CN- solution (1 × 10⁻⁴ M), significant blue fluorescence disappeared, as seen in Figure 11c.
By using this technique, we are able to detect Cu2+ and CN through the fluorescence switch “off-on-off” process at a concentration as low as 1 × 10⁻⁴ M. The above designed experiments confirm the feasibility of using inexpensive and handy solid-state materials to monitor and determine major potable water pollutants, such as Cu2+ and CN, in very low quantities.

3.8. Bio Image of Living Cells

Finally, imaging experiments were conducted towards the potential application of fluorescence probe L and L–Cu2+ for cell imaging of Cu2+ and CN in live cell. Firstly, the cytotoxicity of fluorescence probe L towards HeLa cells was examined. In Figure S13 (Supplementary Information), the cellular viability is greater than 80% after a 24 h incubation period. This result suggests that L exhibits less cytotoxicity towards HeLa cells (<50 µM). HeLa cells incubated with L (10 µM) for 10 min show no detectable fluorescence as expected, as shown in Figure 12a. However, a strong blue fluorescence is observed in the intracellular area of HeLa cells after treatment with Cu2+ (5 µM), as shown in Figure 12b. An overlay of fluorescence and a bright filed image further confirms that the fluorescence signal is only located in the intracellular area (Figure 12b). Moreover, when adding CN (15 µM) into the L–Cu2+ complex, the fluorescence (blue emission) is significantly quenched in a very short time, as shown in Figure 12c.
The above results indicate that L has good membrane permeability and it is highly sensitive in detecting Cu2+ in living cells. Note that bio image studies also demonstrated that L could act as a dual sensor for both Cu2+ and CN with an “off-on-off” fluorescence response. Table 1 summarizes and compares the sensor developed in this work with the most popular copper and cyanide sensors currently available [38,39,40,41,42,43,44,45,46,47,48]. Even though the molecular structure of the sensor reported in this study is relatively simple, its performance in sensitivity, however, is remarkable.

4. Conclusions

In conclusion, the pyrene-appended Schiff base probe L was designed and synthesized through facile synthetic steps. Generation of AIE with increasing water fraction was well visualized and characterized. Spectroscopic and theoretical investigations supported the excimer complex, the probe’s reversibility tuned fluorescence “off-on-off” response, and the sequential detection of Cu2+ and CN. The nanomolar level of LODs in detecting Cu2+ and CN (219 nM and 580 nM) authenticated the probe’s efficacy toward practicality. Furthermore, the detection method for Cu2+ and CN was successfully adopted on a TLC plate and on a blended polymer membrane by monitoring the emission changes under UV illumination, thereby demonstrating an easy approach toward the detection of cation and anion using a dual detection methodology. The sensor probe L could also be utilized for detecting Cu2+ and CN in living cells via the fluorescence “off-on-off” states with minimum cellular toxicity. Therefore, this study has pushed the limits of the designed methods toward a more practical use for meeting the present social demand.

Supplementary Materials

The following supporting information can be downloaded at: https://www.mdpi.com/article/10.3390/chemosensors11020115/s1, Figures S1–S13: The 1H, 13C-NMR and EI-mass data of Probe L, PL spectral changes of L with Cu2+, Job’s plots, LODs of Cu2+ and CN, 1H-NMR titrations of L with Cu2+, L + Cu2+ with CN, EI-mass spectrum of L + Cu2+ and L + Cu2+ + CN and Cell viability are delivered.

Author Contributions

Conceptualization, methodology, resources, data curation, formal analysis and investigation M.S.; Conceptualization, cell imaging, data curation, formal analysis and investigation P.V.; data curation, formal analysis, investigation writing—original draft, project coordination and administration N.T.; Supervision for cell imaging, data curation, formal analysis and investigation. project coordination and administration S.-P.W.; writing—review and editing, K.-W.S.; supervision, K.-W.S.; project administration, K.-W.S.; funding acquisition, K.-W.S. All authors have read and agreed to the published version of the manuscript.

Funding

This research was funded by the Ministry of Science and Technology of Taiwan under the contract Nos. MOST 110-2112-M-A49-029; MOST 110-2811-M-A49-543; MOST 111-2112-M-A49-031 and MOST 111-2811-M-A49-528.

Institutional Review Board Statement

Not applicable.

Informed Consent Statement

Not applicable.

Data Availability Statement

Data are contained within the article.

Conflicts of Interest

The authors declare no conflict of interest.

References

  1. Xu, C.; Chen, G.; Zhao, Y.; Liu, P.; Duan, X.; Gu, L.; Fu, Y.; Yuan, G.; Zheng, N. Interfacing with silica boosts the catalysis of copper. Nat. Commun. 2018, 9, 3367. [Google Scholar] [CrossRef]
  2. Yang, Y.; Zhao, Q.; Feng, W.; Li, F. Luminescent Chemodosimeters for Bioimaging. Chem. Rev. 2013, 113, 192–270. [Google Scholar] [CrossRef]
  3. Li, X.; Pan, L.; Yang, F.; Yang, L. Blue Carbon Dot-Based Portable Smartphone Platform for Visualization of Copper (II). ACS Appl. Nano Mater. 2022, 5, 9252–9259. [Google Scholar] [CrossRef]
  4. Kizilgun, M.; Takci, S.; Erkekoglu, P.; Asci, A.; Balci, A.; Yigit, S.; Gumusel, B.K. Copper, zinc and iron levels in premature infants following red blood cell transfusion. J. Trace Elem. Med. Biol. 2016, 38, 126–130. [Google Scholar] [CrossRef] [PubMed]
  5. Sparling, T.M.; Deeney, M.; Cheng, B.; Han, X.; Lier, C.; Lin, Z.; Offner, C.; Santoso, M.V.; Pfeiffer, E.; Emerson, J.A.; et al. Systematic evidence and gap map of research linking food security and nutrition to mental health. Nat. Commun. 2022, 13, 4608. [Google Scholar] [CrossRef]
  6. Viles, J.H. Metal ions and amyloid fiber formation in neurodegenerative diseases. Copper, zinc and iron in Alzheimer’s, Parkinson’s and prion diseases. Coord. Chem. Rev. 2012, 256, 2271–2284. [Google Scholar] [CrossRef]
  7. Cacciatore, I.; Turkez, H.; Rienzo, A.D.; Ciulla, M.; Mardinoglu, A.; Stefano, A.D. Boron-based hybrids as novel scaffolds for the development of drugs with neuroprotective properties. RSC Med. Chem. 2021, 12, 1944–1949. [Google Scholar] [CrossRef]
  8. Scheiber, I.F.; Mercer, J.F.B.; Dringen, R. Metabolism and functions of copper in brain. Prog. Neurobiol. 2014, 116, 33–57. [Google Scholar]
  9. Ahuja, A.; Dev, K.; Tanwar, R.S.; Selwal, K.K.; Tyagi, P.K. Copper mediated neurological disorder: Visions into amyotrophic lateral sclerosis, Alzheimer and Menkes disease. J. Trace Elem. Med. Biol. 2015, 29, 11–23. [Google Scholar] [CrossRef] [PubMed]
  10. Haddad, M.R.; Macri, C.J.; Holmes, C.S.; Goldstein, D.S.; Jacobson, B.E.; Centeno, J.A.; Popek, E.J.; Gahl, W.A.; Kaler, S.G. In utero copper treatment for Menkes disease associated with a severe ATP7A mutation. Mol. Genet. Metab. 2012, 107, 222–228. [Google Scholar] [CrossRef]
  11. Ugarte, M.; Osborne, N.N.; Brown, L.A.; Bishop, P.N. Iron, zinc, and copper in retinal physiology and disease. Surv. Ophthalmol. 2013, 58, 585–609. [Google Scholar] [CrossRef] [PubMed]
  12. Lee, S.Y.; Bok, K.H.; Kim, J.A.; Kim, S.Y.; Kim, C. Simultaneous detection of Cu2+ and Cr3+ by a simple Schiff-base colorimetric chemosensor bearing NBD (7-nitrobenzo-2-oxa-1,3-diazolyl) and julolidine moieties. Tetrahedron 2016, 72, 5563–5570. [Google Scholar] [CrossRef]
  13. Wang, P.; Xue, S.; Zhou, D.; Guo, Z.; Wang, Q.; Guo, B.; Yang, X.; Wu, J. Peptide-based colorimetric and fluorescent dual-functional probe for sequential detection of copper(Ⅱ) and cyanide ions and its application in real water samples, test strips and living cells. Spectrochim. Acta A Mol. Biomol. Spectrosc. 2022, 276, 121222. [Google Scholar] [CrossRef] [PubMed]
  14. Mayurachayakul, P.; Chantarasriwong, O.; Yotapan, N.; Kamkaew, A.; Mingvanish, W.; Srisuwannaket, C.; Sukwattanasinitt, M.; Niamnont, N. Novel selective “on–off” fluorescence sensor based on julolidine hydrazone-Al3+ complex for Cu2+ ion: DFT study. Spectrochim. Acta A Mol. Biomol. Spectrosc. 2022, 279, 21382. [Google Scholar]
  15. Nantapon, T.; Naweephattana, P.; Surawatanawong, P.; Saetear, P.; Chantarojsiri, T.; Ruangsupapichat, N. Amino-coumarin-based colorimetric and fluorescent chemosensors capable of discriminating Co2+, Ni2+, and Cu2+ ions in solution and potential utilization as a paper-based device. Spectrochim. Acta A Mol. Biomol. Spectrosc. 2022, 282, 121662. [Google Scholar] [CrossRef]
  16. Yang, W.; Chen, X.; Su, H.; Fang, W.; Zhang, Y. The fluorescence regulation mechanism of the paramagnetic metal in a biological HNO sensor. Chem. Commun. 2015, 51, 9616. [Google Scholar] [CrossRef]
  17. Su, H.; Chen, X.; Fang, W. ON–OFF Mechanism of a Fluorescent Sensor for the Detection of Zn(II), Cd(II), and Cu(II)Transition Metal Ions. Anal. Chem. 2014, 86, 891–899. [Google Scholar] [CrossRef]
  18. Xu, Z.; Chen, X.; Kim, H.N.; Yoon, J. Sensors for the optical detection of cyanide ion. Chem. Soc. Rev. 2010, 39, 127–137. [Google Scholar] [CrossRef]
  19. Chen, Z.Z.; Li, R.Y.; Zhang, W.Z.; Zhang, Y.; Dong, W.K. A new salamo-based colorimetric and fluorescent turn-on sensor with aggregation-induced emission for the rapid and highly sensitive detection of cyanide in real samples. New J. Chem. 2020, 44, 21038–21048. [Google Scholar] [CrossRef]
  20. Wu, L.; Liu, Y.; Wu, X.; Li, Y.; Du, J.; Qi, S.; Yang, Q.; Xu, H.; Li, Y. A novel Near-Infrared fluorescent probe for Zn2+ and CN double detection based on dicyanoisfluorone derivatives with highly sensitive and selective, and its application in Bioimaging. Spectrochim. Acta A Mol. Biomol. Spectrosc. 2022, 267, 120621. [Google Scholar] [CrossRef]
  21. Behymer, M.M.; Mo, H.; Fujii, N.; Suresh, V.; Chan, A.; Lee, J.; Nath, A.K.; Saha, K.; Mahon, S.B.; Brenner, M.; et al. Identification of Platinum (II) Sulfide Complexes Suitable as Intramuscular Cyanide Countermeasures. Chem. Res. Toxicol. 2022, 35, 1983–1996. [Google Scholar] [CrossRef]
  22. Sun, Y.; Liu, Y.; Chen, M.; Guo, W. A novel fluorescent and chromogenic probe for cyanide detection in water based on the nucleophilic addition of cyanide to imine group. Talanta 2009, 80, 996–1000. [Google Scholar] [CrossRef]
  23. Song, Y.F.; Wu, W.N.; Zhao, X.L.; Wang, Y.; Fan, Y.C.; Dong, X.Y.; Xu, Z.H. A simple colorimetric and fluorometric probe for rapid detection of CN with large emission shift. Spectrochim. Acta A Mol. Biomol. Spectrosc. 2022, 280, 121540. [Google Scholar] [CrossRef] [PubMed]
  24. Xu, Y.; Chen, H.; Guan, R.; Cao, D.; Wu, Q.; Yu, X. Synthesis and cyanide anion recognition of a new displacement fluorescence chemosensor based on two-branched aurone. Fibers Polym. 2016, 17, 181–185. [Google Scholar] [CrossRef]
  25. Robbins, T.F.; Qian, H.; Su, X.; Hughes, R.P.; Aprahamian, I. Cyanide Detection Using a Triazolopyridinium Salt. Org. Lett. 2013, 15, 2386–2389. [Google Scholar] [CrossRef] [PubMed]
  26. Shellaiah, M.; Chen, Y.T.; Thirumalaivasan, N.; Aazaad, B.; Awasthi, K.; Sun, K.W.; Wu, S.P.; Lin, M.C.; Ohta, N. Pyrene-Based AIEE Active Nanoprobe for Zn2+ and Tyrosine Detection Demonstrated by DFT, Bioimaging, and Organic Thin-Film Transistor. ACS Appl. Mater. Interfaces 2021, 13, 28610–28626. [Google Scholar] [CrossRef] [PubMed]
  27. Venkatesan, P.; Wu, S.P. A turn-on fluorescent pyrene-based chemosensor for Cu(ii) with live cell application. Rsc Adv. 2015, 5, 42591–42596. [Google Scholar]
  28. Balamurugan, G.; Venkatesan, P.; Wu, S.P.; Velmathi, S. Novel ratiometric turn-on fluorescent probe for selective sensing of cyanide ions, effect of substitution and bio-imaging studies. Rsc Adv. 2016, 6, 24229–24235. [Google Scholar] [CrossRef]
  29. Kowser, Z.; Jin, C.C.; Jiang, X.; Rahman, S.; Georghiou, P.E.; Ni, X.L.; Zeng, X.; Redshaw, C.; Yamato, T. Fluorescent turn-on sensors based on pyrene-containing Schiff base derivatives for Cu2+ recognition: Spectroscopic and DFT computational studies. Tetrahedron 2016, 72, 4575–4581. [Google Scholar] [CrossRef]
  30. Wei, L.F.; Chen, C.Y.; Lai, C.K.; Thirumalaivasan, N.; Wu, S.P. A nano-molar fluorescent turn-on probe for copper (II) detection in living cells. Methods 2019, 168, 18–23. [Google Scholar] [CrossRef]
  31. Becke, A.D. Density-Functional Exchange-Energy Approximation with Correct Asymptotic Behavior. Phys. Rev. A 1988, 38, 3098–3100. [Google Scholar] [CrossRef]
  32. Lee, C.; Yang, W.; Parr, R.G. Development of the Colle-Salvetti Correlation-Energy Formula into a Functional of the Electron Density. Phys. Rev. B 1988, 37, 785–789. [Google Scholar] [CrossRef]
  33. Shellaiah, M.; Thirumalaivasan, N.; Aazaad, B.; Awasthi, K.; Sun, K.W.; Wu, S.P.; Lin, M.C.; Ohta, N. An AIEE Active Anthracene-Based Nanoprobe for Zn2+ and Tyrosine Detection Validated by Bioimaging Studies. Chemosensors 2022, 10, 381. [Google Scholar] [CrossRef]
  34. Mahata, S.; Dey, S.; Mandal, B.B.; Manivannan, V. 3-(2-Hydroxyphenyl)imidazo[5, 1-a] isoquinoline as Cu(II) sensor, its Cu(II) complex for selective detection of CN ion and biological compatibility. J. Photochem. Photobiol. A 2022, 427, 113795. [Google Scholar] [CrossRef]
  35. Long, C.; Hu, J.H.; Fu, Q.Q.; Ni, P.W. A new colorimetric and fluorescent probe based on Rhodamine B hydrazone derivatives for cyanide and Cu2+ in aqueous media and its application in real life. Spectrochim. Acta A 2019, 219, 297–306. [Google Scholar] [CrossRef]
  36. Zulfajri, M.; Dhandabani, G.K.; Chen, H.F.; Wang, J.J.; Huang, G.G. A Simple Visible Recognition Method for Copper Ions Using Dibenzo[b,j][1,10]Phenanthroline Scaffold as a Colorimetric Sensor. Chemosensors 2021, 9, 7. [Google Scholar] [CrossRef]
  37. Saikia, G.; Dwivedi, A.K.; Iyer, P.K. Development of solution, film and membrane based fluorescent sensor for the detection of fluoride anions from water. Anal. Methods 2012, 4, 3180. [Google Scholar] [CrossRef]
  38. Silpcharu, K.; Soonthonhut, S.; Sukwattanasinitt, M.; Rashatasakhon, P. Fluorescent Sensor for Copper (II) and Cyanide Ions via the Complexation−Decomplexation Mechanism with Di(bissulfonamido)spirobifluorene. ACS Omega 2021, 6, 16696–16703. [Google Scholar] [CrossRef]
  39. Mohammadi, A.; Ghasemi, Z. A simple pyrimidine based colorimetric and fluorescent chemosensor for sequential detection of copper (II) and cyanide ions and its application in real samples. Spectrochim. Acta A Mol. 2020, 228, 117730. [Google Scholar] [CrossRef] [PubMed]
  40. Wu, C.; Wang, J.; Shen, J.; Zhang, C.; Wu, Z.; Zhou, H. A colorimetric quinoline-based chemosensor for sequential detection of copper ion and cyanide anions. Tetrahedron 2017, 73, 5715–5719. [Google Scholar] [CrossRef]
  41. Mohammadi, A.; Kianfar, M. A simple colorimetric chemosensor with highly performance for detection of cyanide and copper ions and its practical application in real samples. J. Photochem. Photobiol. A Chem. 2018, 367, 22–31. [Google Scholar] [CrossRef]
  42. You, G.R.; Park, G.J.; Lee, J.J.; Kim, C. A colorimetric sensor for the sequential detection of Cu2+ and CN in fully aqueous media: Practical performance of Cu2+. Dalton Trans. 2015, 44, 9120–9129. [Google Scholar] [CrossRef] [PubMed]
  43. Chandra, R.; Ghorai, A.; Patra, G.K. colorimetric and fluorescent ‘on–off-on’ sensor for sequential detection of copper (II) and cyanide ions in aqueous solution. Sens. Actuators B Chem. 2018, 255, 701–711. [Google Scholar] [CrossRef]
  44. Jo, T.G.; Na, Y.J.; Lee, J.J.; Lee, M.M.; Lee, S.Y.; Kim, C. A multifunctional colorimetric chemosensor for cyanide and copper (II) ions. Sens. Actuators B Chem. 2015, 211, 498–506. [Google Scholar] [CrossRef]
  45. Kang, J.H.; Lee, S.Y.; Ahn, H.M.; Kim, C. Sequential detection of copper (II) and cyanide by a simple colorimetric chemosensor. Inorg. Chem. Commun. 2016, 74, 62–65. [Google Scholar] [CrossRef]
  46. Kaushik, R.; Ghosh, A.; Singh, A.; Gupta, P.; Mittal, A.; Jose, D.A. Selective detection of cyanide in water and biological samples by an off-the-shelf compound. ACS Sens. 2016, 10, 1265–1271. [Google Scholar] [CrossRef]
  47. Park, G.J.; Hwang, I.H.; Song, E.J.; Kim, H.; Kim, C. A colorimetric and fluorescent sensor for sequential detection of copper ion and cyanide. Tetrahedron 2014, 70, 2822–2828. [Google Scholar] [CrossRef]
  48. Ho, F.C.; Huang, Y.J.; Weng, C.C.; Wu, C.H.; Li, Y.K.; Wu, J.I.; Lin, H.C. Efficient FRET Approaches toward Copper (II) and Cyanide Detections via Host–Guest Interactions of Photo-Switchable [2] Pseudo-Rotaxane Polymers Containing Naphthalimide and Merocyanine Moieties. ACS Appl. Mater. Interfaces 2020, 47, 53257–53273. [Google Scholar] [CrossRef]
Figure 1. Schematic of L-based emission changes, excimer complex formation, and reversibility during the sequential detection of Cu2+ and CN.
Chemosensors 11 00115 g001
Scheme 1. Synthetic route of probe L.
Chemosensors 11 00115 sch001
Figure 2. (a) PL spectra of compound L (10 µM) in EtOH with increasing water ratios (0–90%) at λex = 380 nm with excitation slit = 5 nm and emission slit = 5 nm. [Note: fluorescence spectra were recorded after 22 h]. (b) Plot of relative fluorescence intensity (I/I0) of compound L at 433 nm as a function of the composition of EtOH–water mixture of L; inset: fluorescence photograph of L in EtOH with 0% and 80% of water under 365 nm UV illumination from a hand-held UV lamp after 22 h.
Chemosensors 11 00115 g002
Figure 3. (a) Fluorescence changes of L (10 µM) in ethanol–water (v/v = 7/3, 5 mM HEPES, pH 7.0) in the presence of Cu2+ (5 µM) with various metal ions (15 µM) at λex = 380 nm with excitation slit = 5 nm and emission slit = 5 nm. (b) Fluorescence emission photographs of L (10 µM) with various metal ions (15 µM) in ethanol–water (v/v = 7/3, 5 mM HEPES, pH 7.0).
Chemosensors 11 00115 g003
Figure 4. Relative fluorescence intensity of L (10 µM) in ethanol–water (v/v = 7/3, 5 mM HEPES, pH 7.0) to various competitive metal ions. (Green bars) and relative fluorescence of L in the presence of 15 µM of potential competitive metal ions after subsequently adding 5 µM Cu2+. (Blue bars) (at λex = 380 nm with excitation slit = 5 nm and emission slit = 5 nm).
Chemosensors 11 00115 g004
Figure 5. (a) UV–vis spectra changes of L (10 µM) with increasing Cu2+ concentration (0–5 µM) in ethanol–water (v/v = 7/3, 5 mM HEPES, pH 7.0). (b) Fluorescence titration spectra of L (10 µM) with increasing Cu2+ (0–5 µM) concentration in ethanol–water (v/v = 7/3, 5 mM HEPES, pH 7.0) (at λex = 380 with excitation slit = 5 nm and emission slit = 5 nm).
Chemosensors 11 00115 g005
Figure 6. Fluorescence spectra changes of L–Cu2+ complex (10 µM) to various anions (15 µM) in ethanol–water (v/v = 7/3, 5 mM HEPES, pH 7.0) (at λex = 380 nm with excitation slit = 5 nm and emission slit = 5 nm).
Chemosensors 11 00115 g006
Figure 7. Fluorescence titration spectra of L–Cu2+ complex (10 µM) with increasing CN concentration (0–15 µM) in ethanol–water (v/v = 7/3, 5 mM HEPES, pH 7.0) (at λex = 380nm with excitation slit = 5 nm and emission slit = 5 nm).
Chemosensors 11 00115 g007
Figure 8. DFT optimized structures of (a) L and (b) L–Cu2+–L* excimer complex (black carbon; grey hydrogen; blue nitrogen and magneta Cu2+) (c) HOMO, LUMO, and band gap of L and L–Cu2+–L* excimer complex.
Chemosensors 11 00115 g008
Figure 9. Fluorescence response (438 nm) of free probe L (10 μM) after adding Cu2+ in ethanol–water (v/v = 7/3, 5 mM HEPES, pH 7.0) solutions as a function of pH values. (at λex = 380nm with excitation slit = 5 nm and emission slit = 5 nm).
Chemosensors 11 00115 g009
Figure 10. Fluorescence photographs of the same test strip under following conditions: (a) before immersion, (b) shortly after immersion in an aqueous solution containing CuCl2, (c) test strip in (b) is treated in a KCN containing aqueous solution.
Chemosensors 11 00115 g010
Figure 11. (a) PS + 2% L-membrane under UV light in water; (b) PS + L- membrane in aqueous solution containing 1 × 10⁻⁴ M of Cu2+ under UV light; (c) PS + L- Cu2+ in CN containing aqueous solution with a concentration of 1 × 10⁻⁴ M.
Chemosensors 11 00115 g011
Figure 12. Confocal fluorescence images of HeLa cells (left) bright filed, (center) emission filed, (right) overlay. (a) HeLa cells incubated with 10 µM of L for 10 min; (b) HeLa cells incubated 10 µM of L in the presence of Cu2+ (5 µM); (c) after adding CN (15 µM). Excitation wavelength is at 410 nm.
Chemosensors 11 00115 g012
Table 1. Comparative summary on reported probes for sequential detection of Cu2+ and CN with current work.
Derivative ProbesMethod of DetectionAnalytesLODApplicationsRef.
SpirobifluoreneFluorescentCu2+ and CN98.2 nM and 390 nMNA[38]
Pyrimidine-basedColorimetricCu2+ and CN2.40 × 10−7 M and 0.320 µMTest strips[39]
Quinoline-basedColorimetricCu2+ and CN5.0 × 10−5 M and 4.3 µMTest strips[40]
Azo-basedColorimetricCu2+ and CN2.39 × 10−6 M and 2.7 × 10⁻⁸ MTest strips[41]
Quinoline-basedColorimetricCu2+ and CN0.9 μM and 210 μMNA[42]
Benzil dihydrazone derivativeFluorescentCu2+ and CN7.3 × 10−10 M and 1.5 × 10⁻⁷ MNA[43]
Quinoline derivativeColorimetricCu2+ and CN7.3 μM and
20 μM
Test strips[44]
4-(diethylamino)-2-hydroxybenzaldehydeColorimetricCu2+ and CN0.88 μM and 27.21 μMNA[45]
Chromen-basedFluorescentCu2+ and CN120 nM and 5.77 µMCell imaging[46]
Naphthalene derivativeColorimetric and FluorescentCu2+ and CN1.4 × 10−5 M and 5.7 × 10⁻⁸ MNA[47]
Naphthalimide derivativeFluorescentCu2+ and CN0.53 μM and 1.34 μMCell imaging[48]
Pyrene-appended Schiff base LFluorescentCu2+ and CN219 nM and 580 nMTest strips,
cell imaging, polymer membrane
sensing applications
Present work
NA = Not available.
Disclaimer/Publisher’s Note: The statements, opinions and data contained in all publications are solely those of the individual author(s) and contributor(s) and not of MDPI and/or the editor(s). MDPI and/or the editor(s) disclaim responsibility for any injury to people or property resulting from any ideas, methods, instructions or products referred to in the content.

