1. Introduction
The lack of physical activity is increasing, which diminishes individual and organizational health. Healthy lifestyle is one of the most important factors in the prevention of premature deaths, chronic diseases, productivity loss, obesity, and other economic and social aspects [
1]. Common mental disorders such as depression, anxiety, and stress-related disorders have high consequences around the world, which may lead to premature death, cardiovascular diseases, or cancer [
2]. In addition, an appropriate working environment plays an important role in recovery, adaptation, and returning to work after various diseases such as COVID-19 [
3] or stroke [
4], or with disabilities such as hearing loss [
5]. The workplace is one of the most important factors to promote physical activity [
6]. However, there is a lack of qualitative evidence exploring workability and its connection to nervous, muscular, and cardiovascular systems of the human body.
In the literature, various studies have focused on a particular job or professions. Research such as [
7,
8] analyze job satisfaction and stress among doctors or dentists. Considering more dangerous industries, such as workers in the construction field, the non-traditional hazards are analyzed as a large impact on health and injuries [
9]. These and similar papers describe how working conditions affect health and productivity. Meanwhile, other scientists are more interested in patients with specific pathologies or symptoms. In [
10], the outpatients of a hemodialysis center are considered. The program focuses on decreasing dietary sodium and increasing habitual physical activity. Glucose monitoring at the workplace could also be a good tool for exerting positive effects on compliance as well as functioning at work [
11]. Other scientific fields are related to elderly people and their work efficiency or retirement plans [
12]. These and similar research provide general information and insights. However, most of them use only survey data that may not be applicable to other research groups.
In general, workability can be defined as the individual‘s ability to fulfill the demands of the labor market [
13]. The main characteristics that define workability are professional competence, motivation, work requirements, work environment, health, occupational virtues, and attitudes [
14]. This research focuses on mental and physical health factors and proposes a new framework in measuring individual work abilities.
The structure of this paper is as follows:
Section 2 highlights the recent literature on work ability and physiological activity in workplaces evaluation techniques. Experimental design, together with the data description and proposed methods are presented in
Section 3.
Section 4 consists of the data analysis and transformation using membership functions, the Random Forest algorithm, and its implementation to the health feature classification process. Finally, the discussion and conclusions for this paper are presented in
Section 5.
2. Related Work
A World Health Organization Heath and Work Performance Questionnaire (HPQ) was designed as a self-report instrument to estimate the relationship between workplace environment and health problems [
15]. The main focus was on reduced job performance, sickness absence, and work-related accidents/injuries. The reported results show that HPQ generates meaningful measures of work performance and absenteeism. Even though the HPQ may be used to detect and monitor the overall effects of allergies, migraine, etc., it cannot tell what aspects of performance are affected (e.g., motor skills, concentration, memory, etc.).
The literature studies related to workability may be divided into two main categories that focus on Mental Health Problems (MHP) and Physical Health (PH) or disabilities. In [
16] the study had a qualitative design based on a phenomenographic approach. The study revealed that a structured interview may identify two main categories: experiences of employees with MHP and strategies to handle the effects of MHP in the workplace. However, the study included only 12 participants, which made it hard to draw overall conclusions. Additionally, the interviews could be more time consuming to make them applicable to a higher number of participants. A higher number of participants were included in [
17], where work ability perception and cognitive performance were considered. The results showed that work-directed interventions must be applied to work ability perception to improve mental health conditions.
Previous studies also indicated a relationship between corrective exercises and neck/shoulder pain, sick leave, posture, muscular activity, and workplace pain in office workers [
18]. The findings revealed significant changes in the eight-week corrective exercise program and confirmed that the supervised intervention could be more effective than the un-supervised intervention. Team sport activities in the workplace may also be a good health promoting method that influences physical activity behavior and cognitive skills [
6].
There have been some exploratory studies on electrocardiographic (ECG) and electroencephalographic (EEG) signals and workload analysis to alert to possible human errors and accidents [
19]. Another study [
20] combined questionnaires (general heath and international physical activity, occupational physical activity), human physical characteristics (such as body mass index, diastolic and systolic blood pressure, waist circumference), television, and other factors to analyze workplace activity. These and similar studies provide strong evidence that the workplace is a prime area where interventions to reduce sitting time and increase physical activity should be introduced.
Various healthcare systems that consist of different sensors, such as electrodes and location-based and motion sensors, always involve imperfection and uncertainty that may cause wrong inference on the environment. The uncertainty needs to be minimized for better representation of the knowledge of the patient. To avoid fluctuation in variable values, the multi-grade fuzzy approach was selected. Fuzzy logic is a good tool when data encompass great complexity and takes the inadequate information into consideration to overcome imprecise inputs [
21]. Multi-grade fuzzy logic has been used in different healthcare fields and contexts. For example, in [
22] a pilot study of healthcare service quality was analyzed using a questionnaire of twenty-three criteria. Others use fuzzy-logic techniques together with neural networks. For example, [
23] predicted the deterioration of reaction state when people have neurological movement disorders and [
24] assessed nutrition-related factors to determine the likelihood of geriatric patient health risks associated with specific syndromes.
In this paper, a novel framework is presented for the work ability evaluation process, where fuzzy logic expert system and machine learning techniques are combined. The presented membership functions are designed for the data transformation, where different thresholds depend on health conditions. All transformed feature values are classified using the Random Forest algorithm, and recommendations are proposed. To make sure that all physiologic features are evaluated, the cardiovascular, muscular, and neural systems were analyzed.
3. Materials and Methods
In this paper, the proposed technique divides the initial dataset into three main categories, , and , which correspond to a good health state (), moderate health condition (), or health condition with drawbacks (). A novel framework consists of three main steps:
Data transformation. Expert system evaluation using thresholds of each feature (membership functions). The data are converted into scores (from 1 to 5). The final grade of the physiological state for every person is the sum of scores of all features.
Three-class data split. The final grades of each person are divided into three classes corresponding to the first and third quartiles. The
class contains 25% of the data that is below the middle number between the minimum value and the median (also known as the lower quartile, Q1). The
class corresponds to the third quartile (also known as the upper quartile, Q3), which is the middle value between the median and the maximum value [
25]. The
and
classes represent a poor health condition that need to be improved. Meanwhile,
contains the rest of the data and represents the appropriate health state.
Random Forest optimization. Using the RF model, the main features are extracted and classified according to the initial classes: , , and .
3.1. Data Gathering and Statistics
The designed system consists of a testing environment that includes sensors (Polar belt V10), smart device (mobile phone or tablet), and a specialist client device. The data are gathered using Polar belt V10 and a mobile application that could be installed on the smartphone or tablet. When all tests are finished, the data are sent to the cloud-based system where specialists can see the results and statistics of all participants and make additional evaluation if needed. After the evaluation process, each person receives feedback about their health condition and recommendations on how to improve it. All this information is visible in their smart device.
For the period 2019–2021, there were five events where 98 recruited workers were tested: 57 female, 41 male, age 38.02 ± 11.77 years, height 173.94 ± 9.76 cm, weight 75.75 ± 14.72 kg. In addition, they were asked to fill the SF 36, Baecke physical activity and pain questionnaires and indicate the type of work they did. From all workers, 61 percent indicated that they did sports, including walking, running, tennis, yoga, etc. In indication of type of work (scale from 1 to 5), average of sedentary work was 4.41, standing work was 2.59, working with weights was 1.49, and a job where it was necessary to walk was 3.01. Finally, workers indicated 2.64 (scale from 1 to 5) that after the working day they were physically tired.
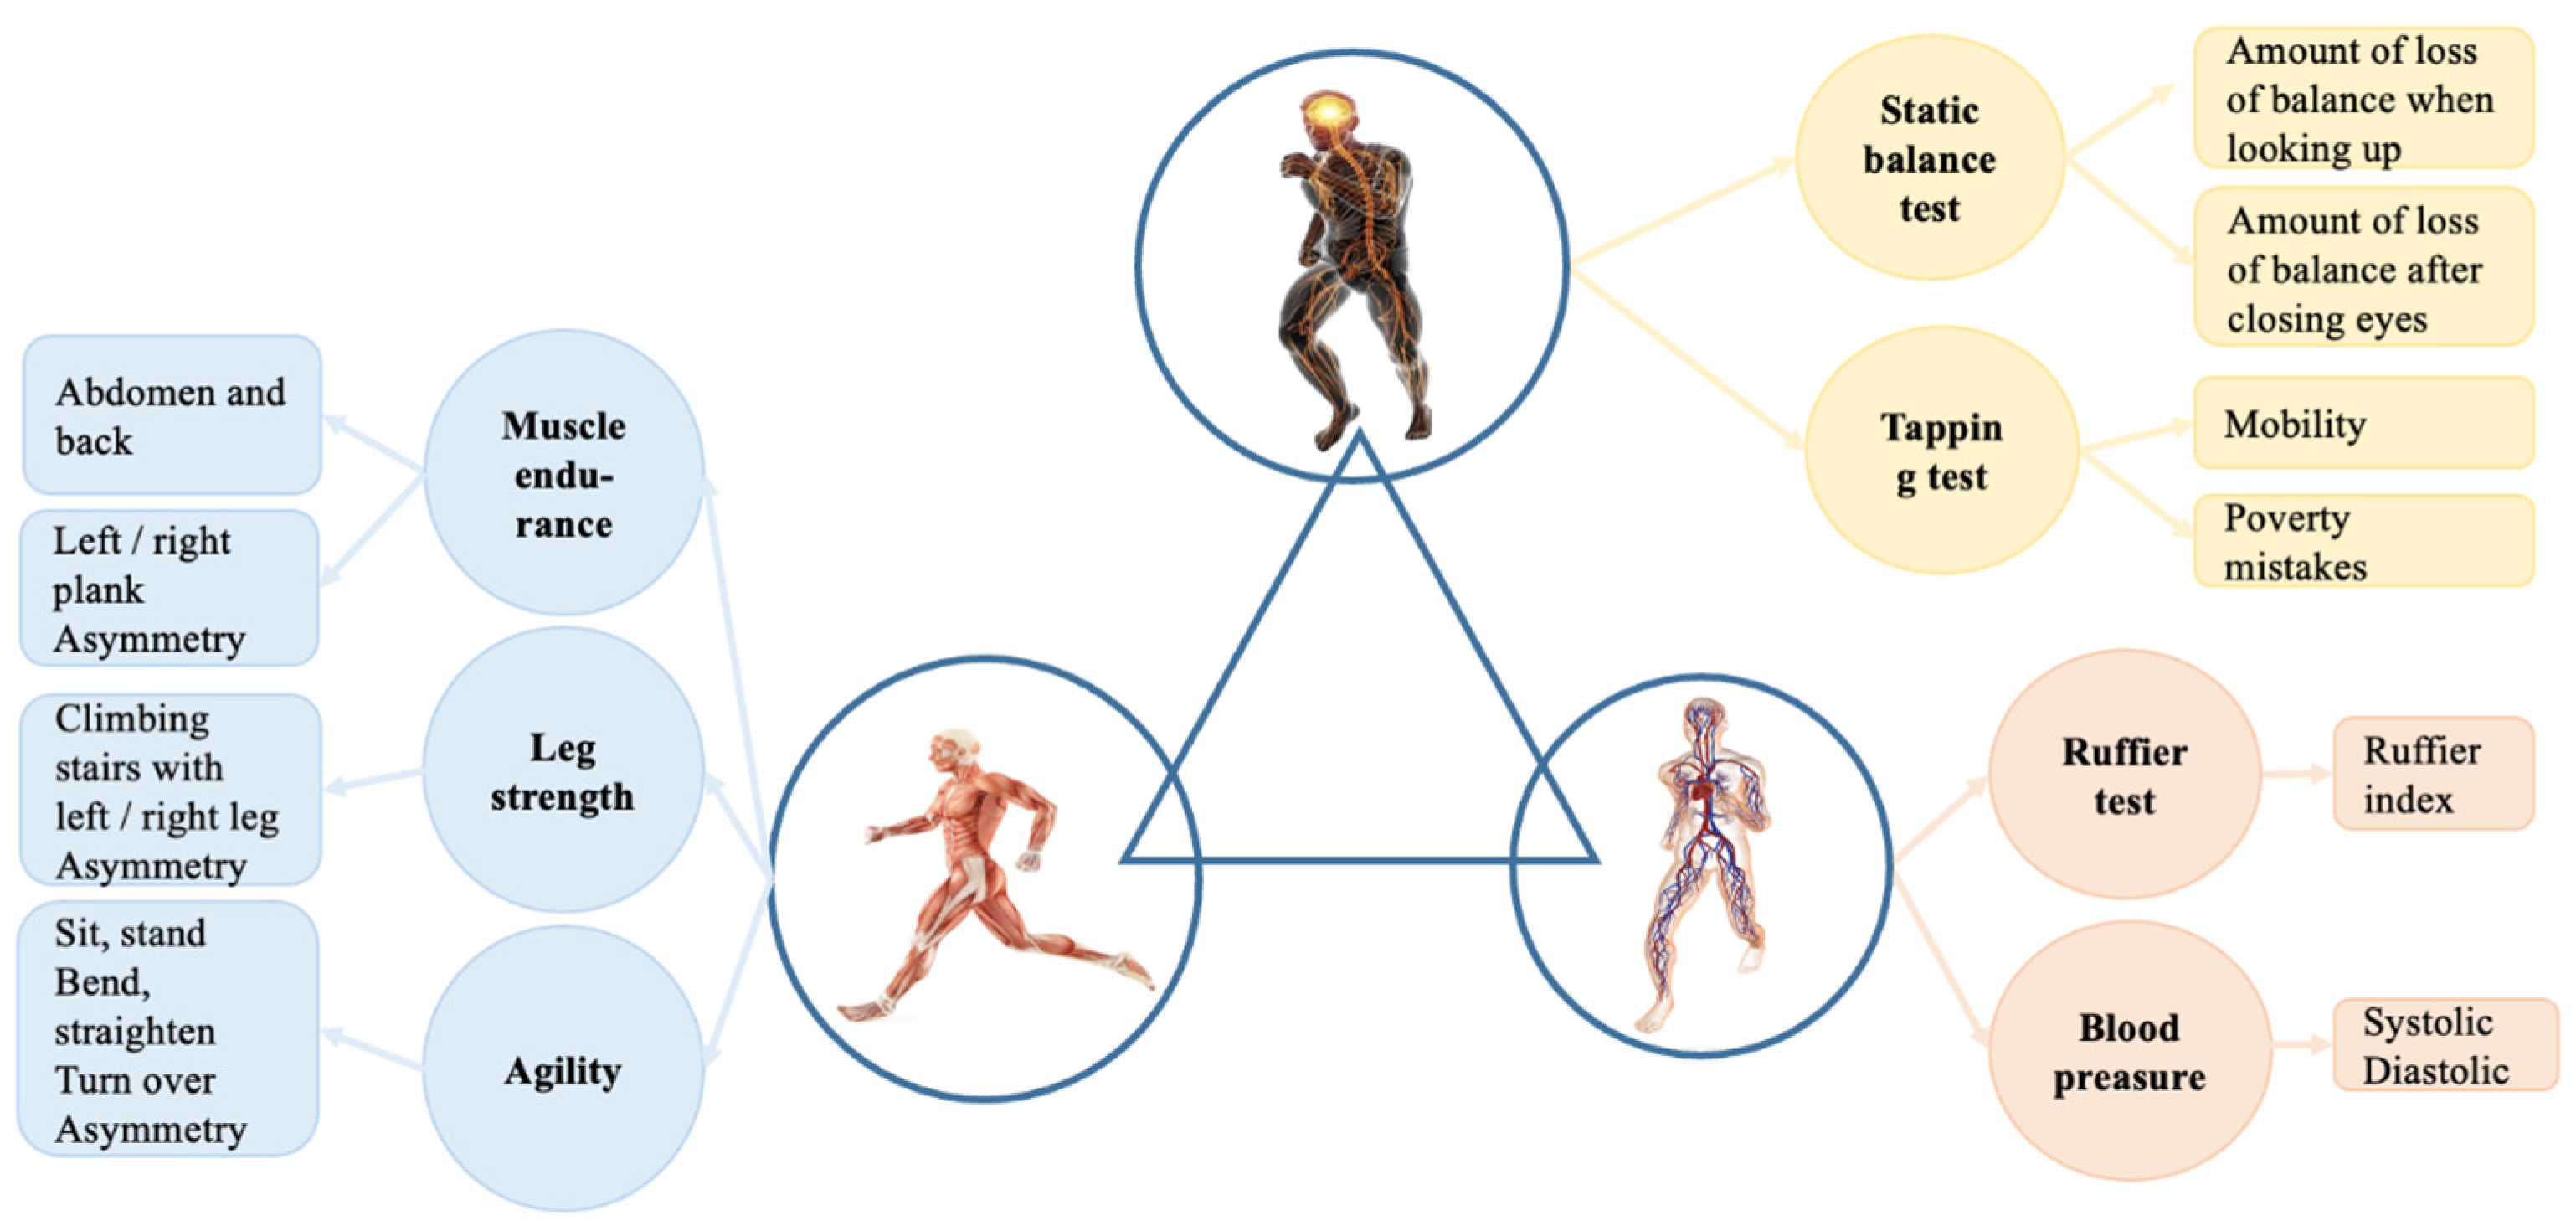
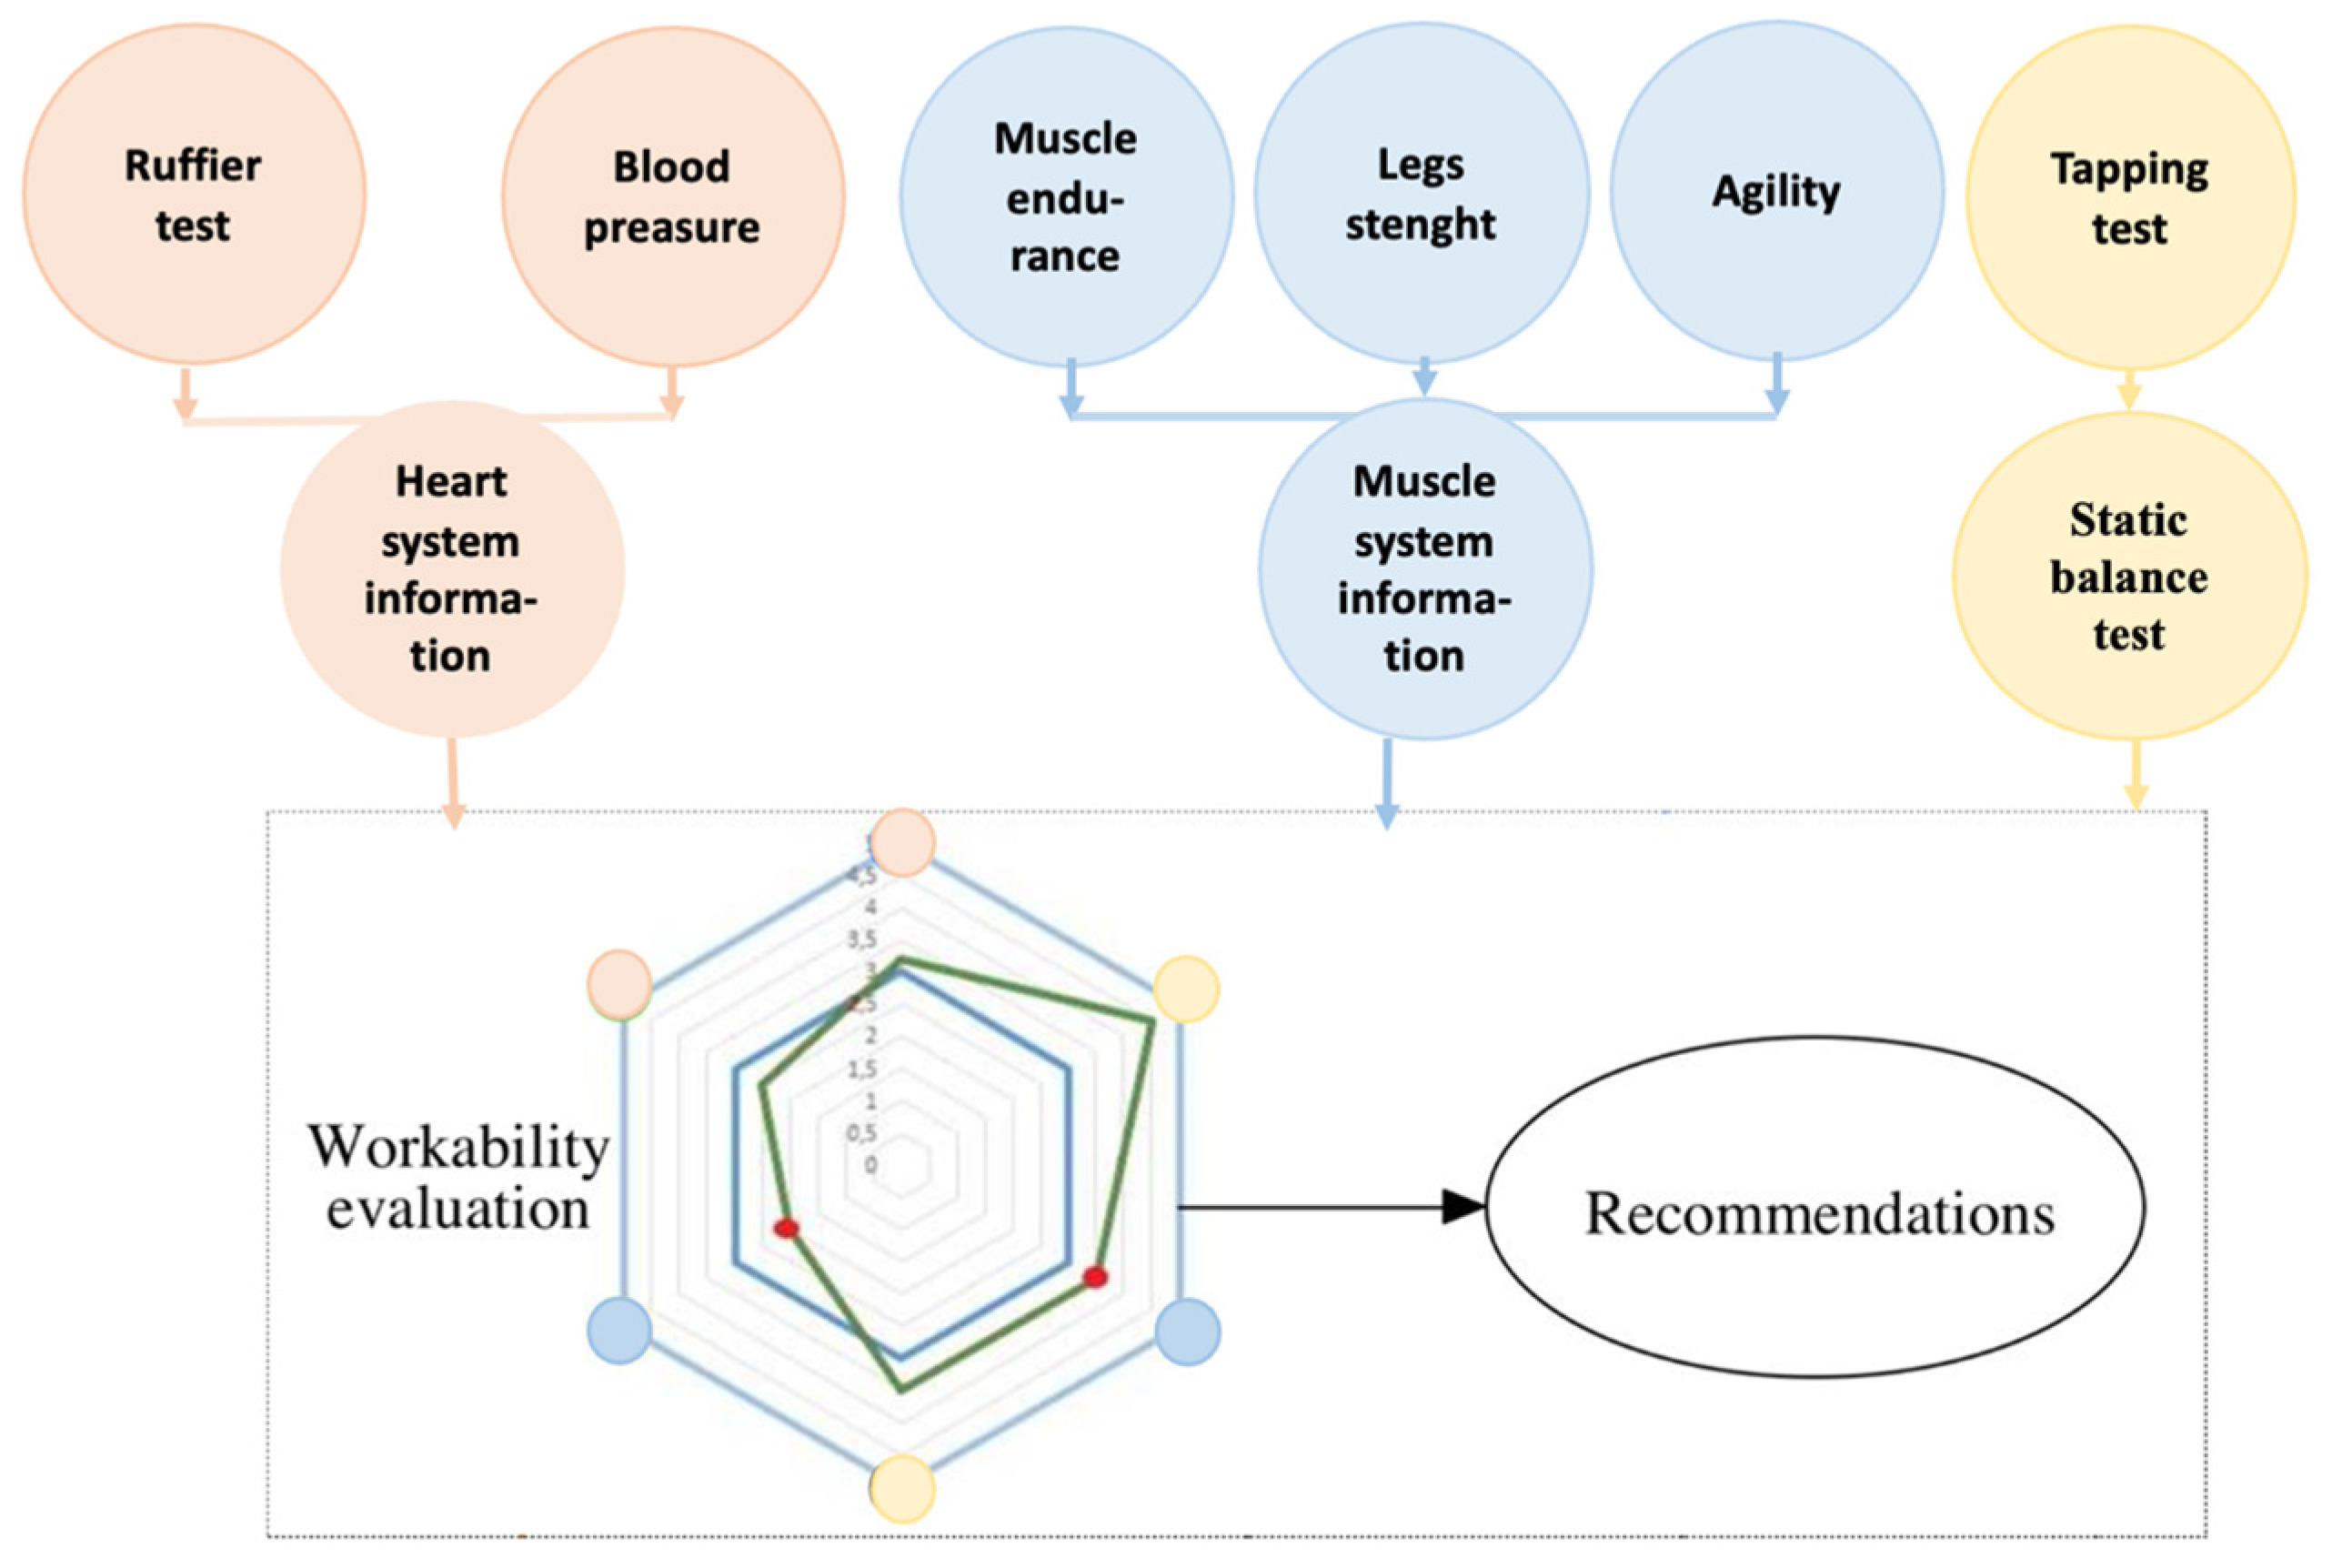
Tests and measurements were divided into three groups according to the complex systems [
26,
27] approach, where the human body consists of three main parts: cardiovascular, muscular, and nervous systems. By this theory, tests and exercises were split into three parts, as shown in
Figure 1. In the muscular system, muscle endurance, leg strength, and agility are evaluated. The nervous system evaluation process consists of static balance and tapping tests. Finally, in the cardiovascular system, the Ruffier test [
28] and blood pressure measurements are considered.
The statistics of different parameters are presented in
Table 1, where average values and standard deviations are shown. Different features have various metrics that lead to high differences in scale: some values barely reach value 1 (such as static balance test with left or right leg while eyes are open), and others gain high values (like in the back endurance test). To overcome the scaling issue in the health evaluation process, all feature values were transformed using the membership functions of the proposed expert system
3.2. Fuzzy Logic
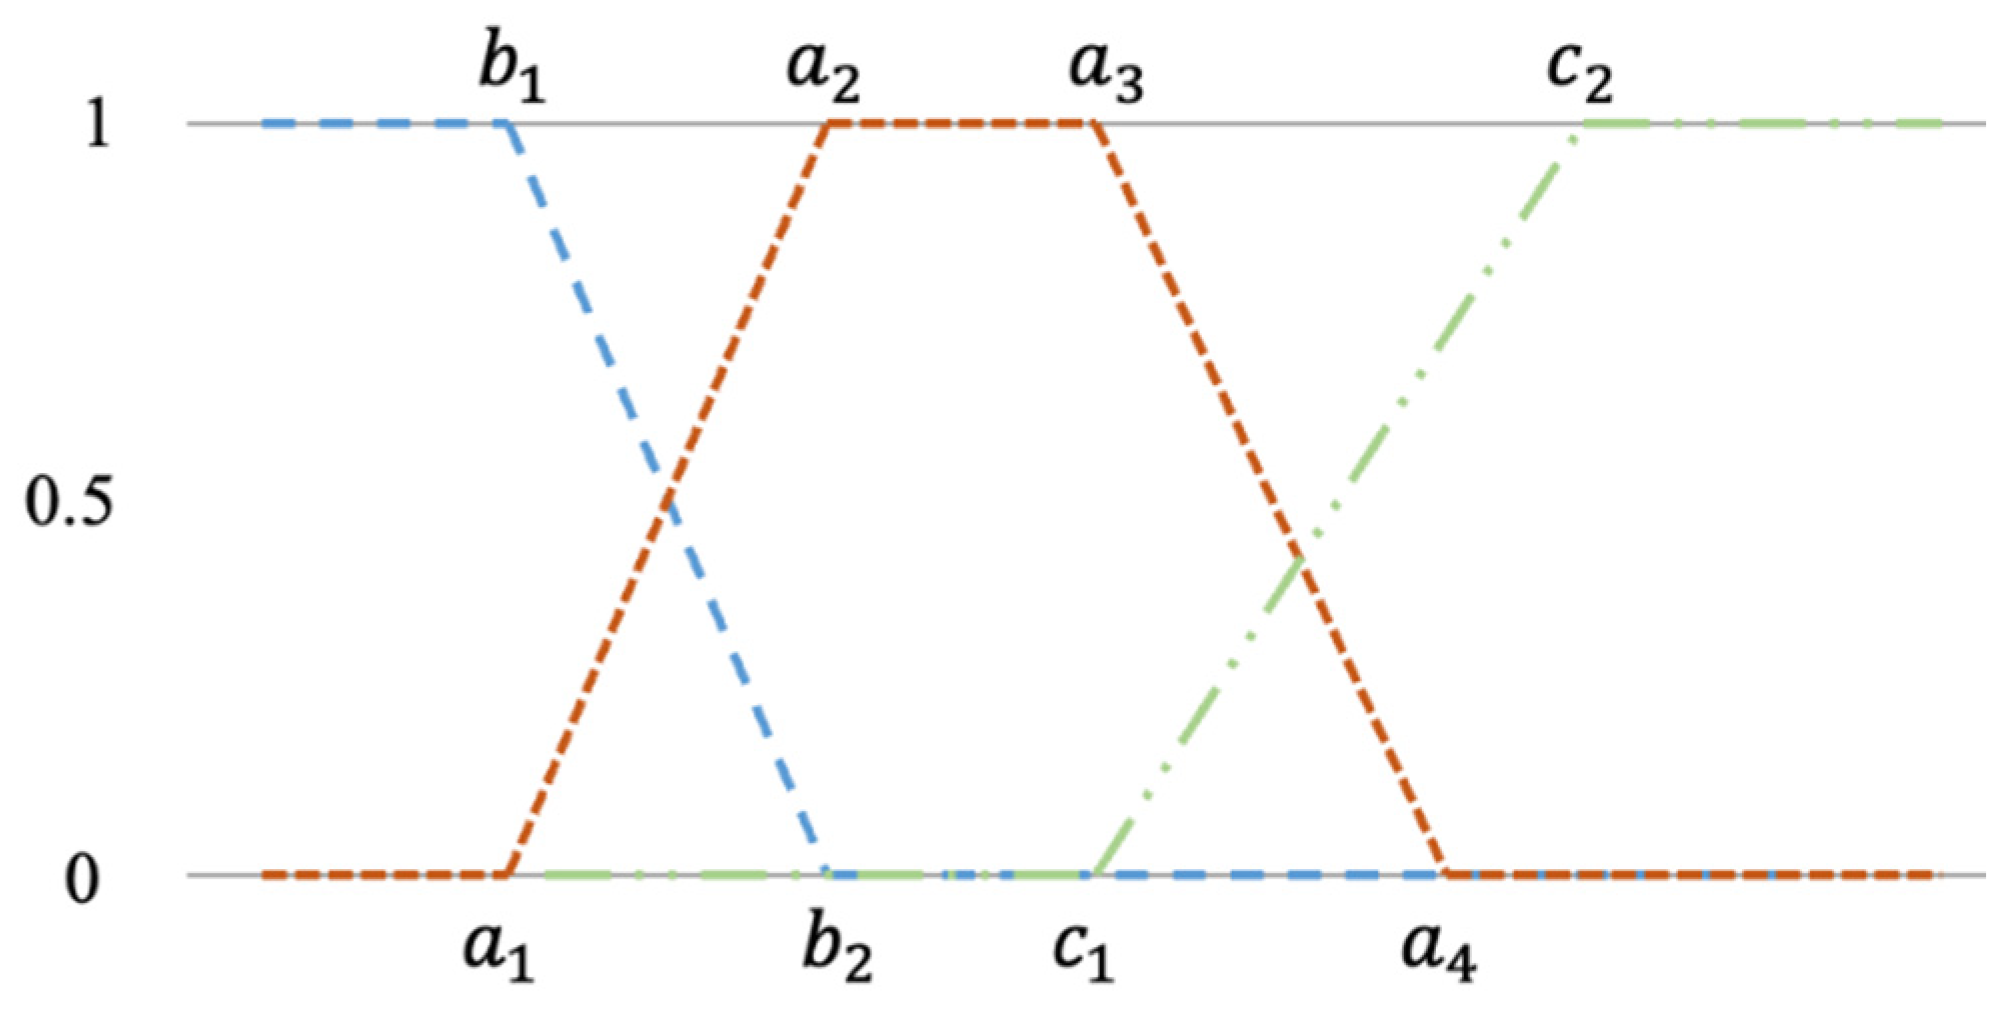
Fuzzy logic is a class of logic operations where the truth values of variables may be any real number between 0 and 1 [
22]. Triangle or trapezium membership functions are convenient for the consensus and group-based decisions regarding fuzzy set definition [
21]. In this paper, multi-level trapezium membership functions are defined for both inputs and outputs. The trapezium membership function is used to compute fuzzy membership values of the sensor data (1) and consists of five linear functions:
where
or
or
are the membership value for each input,
x. The side membership functions are represented in (2) and (3) formulas as a left and right curve, respectively. Both curves consist of three linear functions. The graphical representation of all possible membership functions is shown in
Figure 2. It should be noted that each feature has both side membership functions (left and right) and one or three trapezium functions.
3.3. Machine Learning Approach Using Random Forest Algorithm
In this paper, the proposed framework consists of the data transformation using membership functions. All physiological data were scaled from 1 to 5 according to different thresholds that were defined by the expert system. In the next iteration, the data are divided into three categories that represent good, moderate, or poor health condition. All scores were summed, and the final grade was estimated. Total values that are lower Q1 (lower quartile) or higher than Q3 (upper quartile) are considered as bad or good health conditions with class names
and
, respectively. Other data that fall between whose two quartiles are marked as class
and represent a moderate health condition that might be easily improved by following proposed recommendations. Meanwhile, if the score appears in class
, most likely a person has several health issues and needs to contact a doctor. This type of recommendation should also appear in the designed expert system. The formula for the proposed data transformation technique is shown below:
where
min and
max are the minimum and maximum values of
x;
;
, and
n is the total number of
x values. It should be noted that value 0 represents values of the
class, 1 represents
class values, and 2 indicates the
class. When data transformation is applied, the machine learning model is constructed for the health evaluation process to classify gathered data.
The Random Forest (RF) algorithm is a machine learning technique that consists of an ensemble of randomized classification or regression trees. It generates many decision trees to improve the performance of the final prediction model [
29]. Each decision tree corresponds to a set of limits that are hierarchically organized and randomly applied from a root node [
30]. One of the most important advantages of using RF classifiers is that this algorithm can model non-linear relationships, and the model may include numerous random decision trees to improve accuracy.
If only two classes are considered in the classification task, the confusion matrix consists of four categories: True Positive (TP) (refers to the number of predictions where the classifier correctly predicts the positive class), True Negative (TN) (refers to the number of predictions where the classifier correctly predicts the negative class), False Positive (FP) (refers to the number of predictions where the classifier incorrectly predicts the negative class as positive), and False Negative (FN) (refers to the number of predictions where the classifier incorrectly predicts the positive class as negative).
In the multi-class classification problem, there are no positive or negative classes, and all classes together with their labels are considered to be equal. In this case TP, TN, FP, and FN should be found for each individual class [
31]. In this paper, the three-class problem is discussed, where the confusion matrix can be described as shown in
Table 2, where
,
, and
refer to the number of predictions where the classifier correctly predicts classes
,
, and
respectively. In addition,
, where
and
, corresponds to the faulty predicted
i-th class as the class
j.
Using metrics that are presented in
Table 2, for each class
i, the true positive rate (
), the false positive rate (
), and the false negative rate (
) are defined as follows:
where r is the number of classes. In the multi-class classification task, the precision and recall values are averaged [
32]. The micro-averaged precision (
and micro-averaged recall (
values are defined below:
Furthermore, the micro-averaged
score (
) is defined as the harmonic mean of these quantities:
It should be noted that
,
, and
are all equal to the sum of the diagonal elements of the confusion matrix. Because of this, the micro scale metrics are not very informative. In [
33], the alternative multi-class precision and recall definition is proposed. Macro-averaged precision
and macro-averaged recall (
) are defined as follows:
Finally, the macro-
score is defined as the harmonic mean of
and
quantities:
Overall accuracy in the multi-class classification problem can be defined as follows [
31]:
4. Results
4.1. Proposed Fuzzy System
An expert system is part of a computer program that allows the solving of a particular problem by using the knowledge of experts in a specific domain and computational decision procedures. In this article, the described expert system for functional state evaluation is split into three components. In the first part, variables that correspond to cardiovascular system decision rules are described with three input groups: blood pressure and Ruffier index. Parameters for the mental fatigue evaluation expert system values are presented in
Table 3. The second component contains parameters of muscular system evaluation. It consists of thirteen input groups. Parameter values for the muscular system evaluation in the expert system are presented in
Table 4. The third component contains parameters of the nervous system. It consists of five input groups. Parameter values for the nervous system evaluation in the expert system are presented in
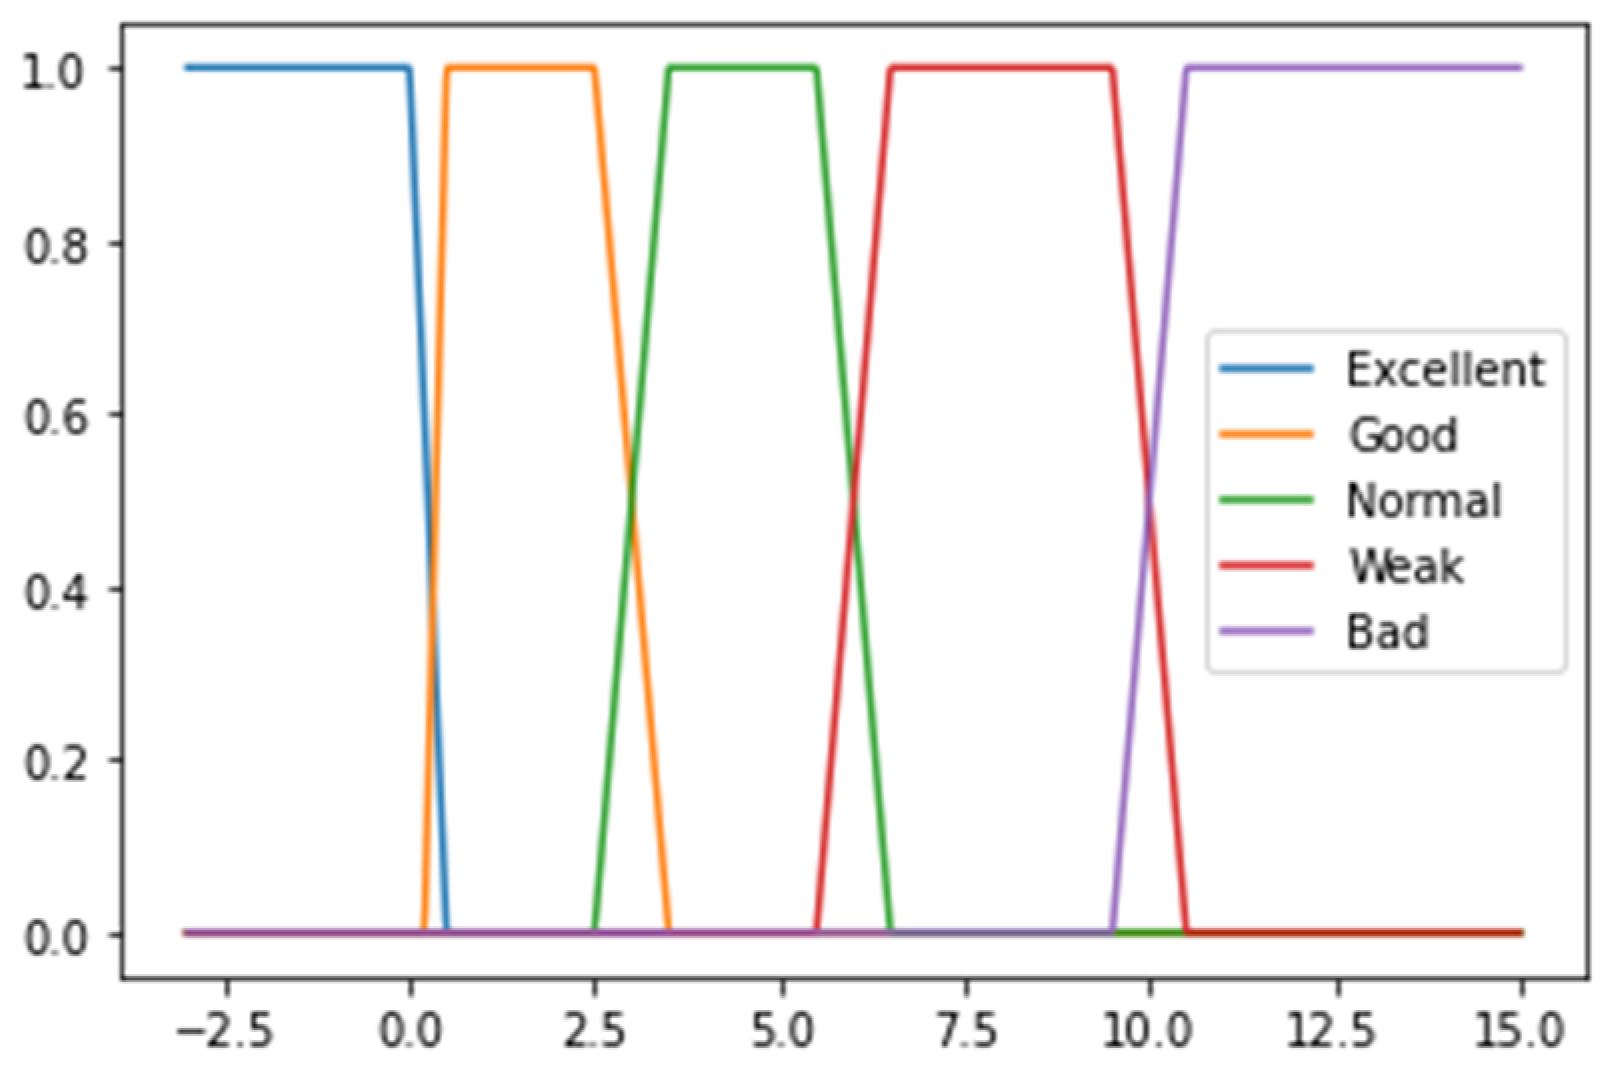
Table 5. All fuzzy logic parts are in the same expert decision logic base, depending on possible values (3 or 5), which is composed of logical rules synthesized from the expertise of professionals in work medicine, sports medicine, and rehabilitation. The expert system was prepared based on recommendation from researchers of Lithuanian Sports University and Lithuanian Health Sciences. The components of different systems apply different membership functions with three or five indicators, which are the outcome of previous research and can be expressed as transparent and human-readable logic. The decision output is produced by using a first order weighted average inference engine, which is experimentally validated in Python programming language. In some cases, such as systolic and diastolic blood pressure (see
Table 3), the upper and lower values gain a lower score than the middle ones due possible health issues when blood pressure is too high or too low. These threshold values are used to construct the membership functions (see an example in
Figure 3).
For the decision-making algorithm, the data are split into categories using five thresholds. Each threshold refers to health evaluation by giving a corresponding score. If the feature value falls into a low value threshold, the score of this part is 1. Low-average value, average value, and high-average value thresholds gain scores of 2, 3, and 4, respectively. Finally, values that fall in the high value threshold are worth 5 points and indicate the perfect value of each feature. Due to the possible data variability, values that are close to the threshold are defined using linear curves with positive or negative slopes (see an example in
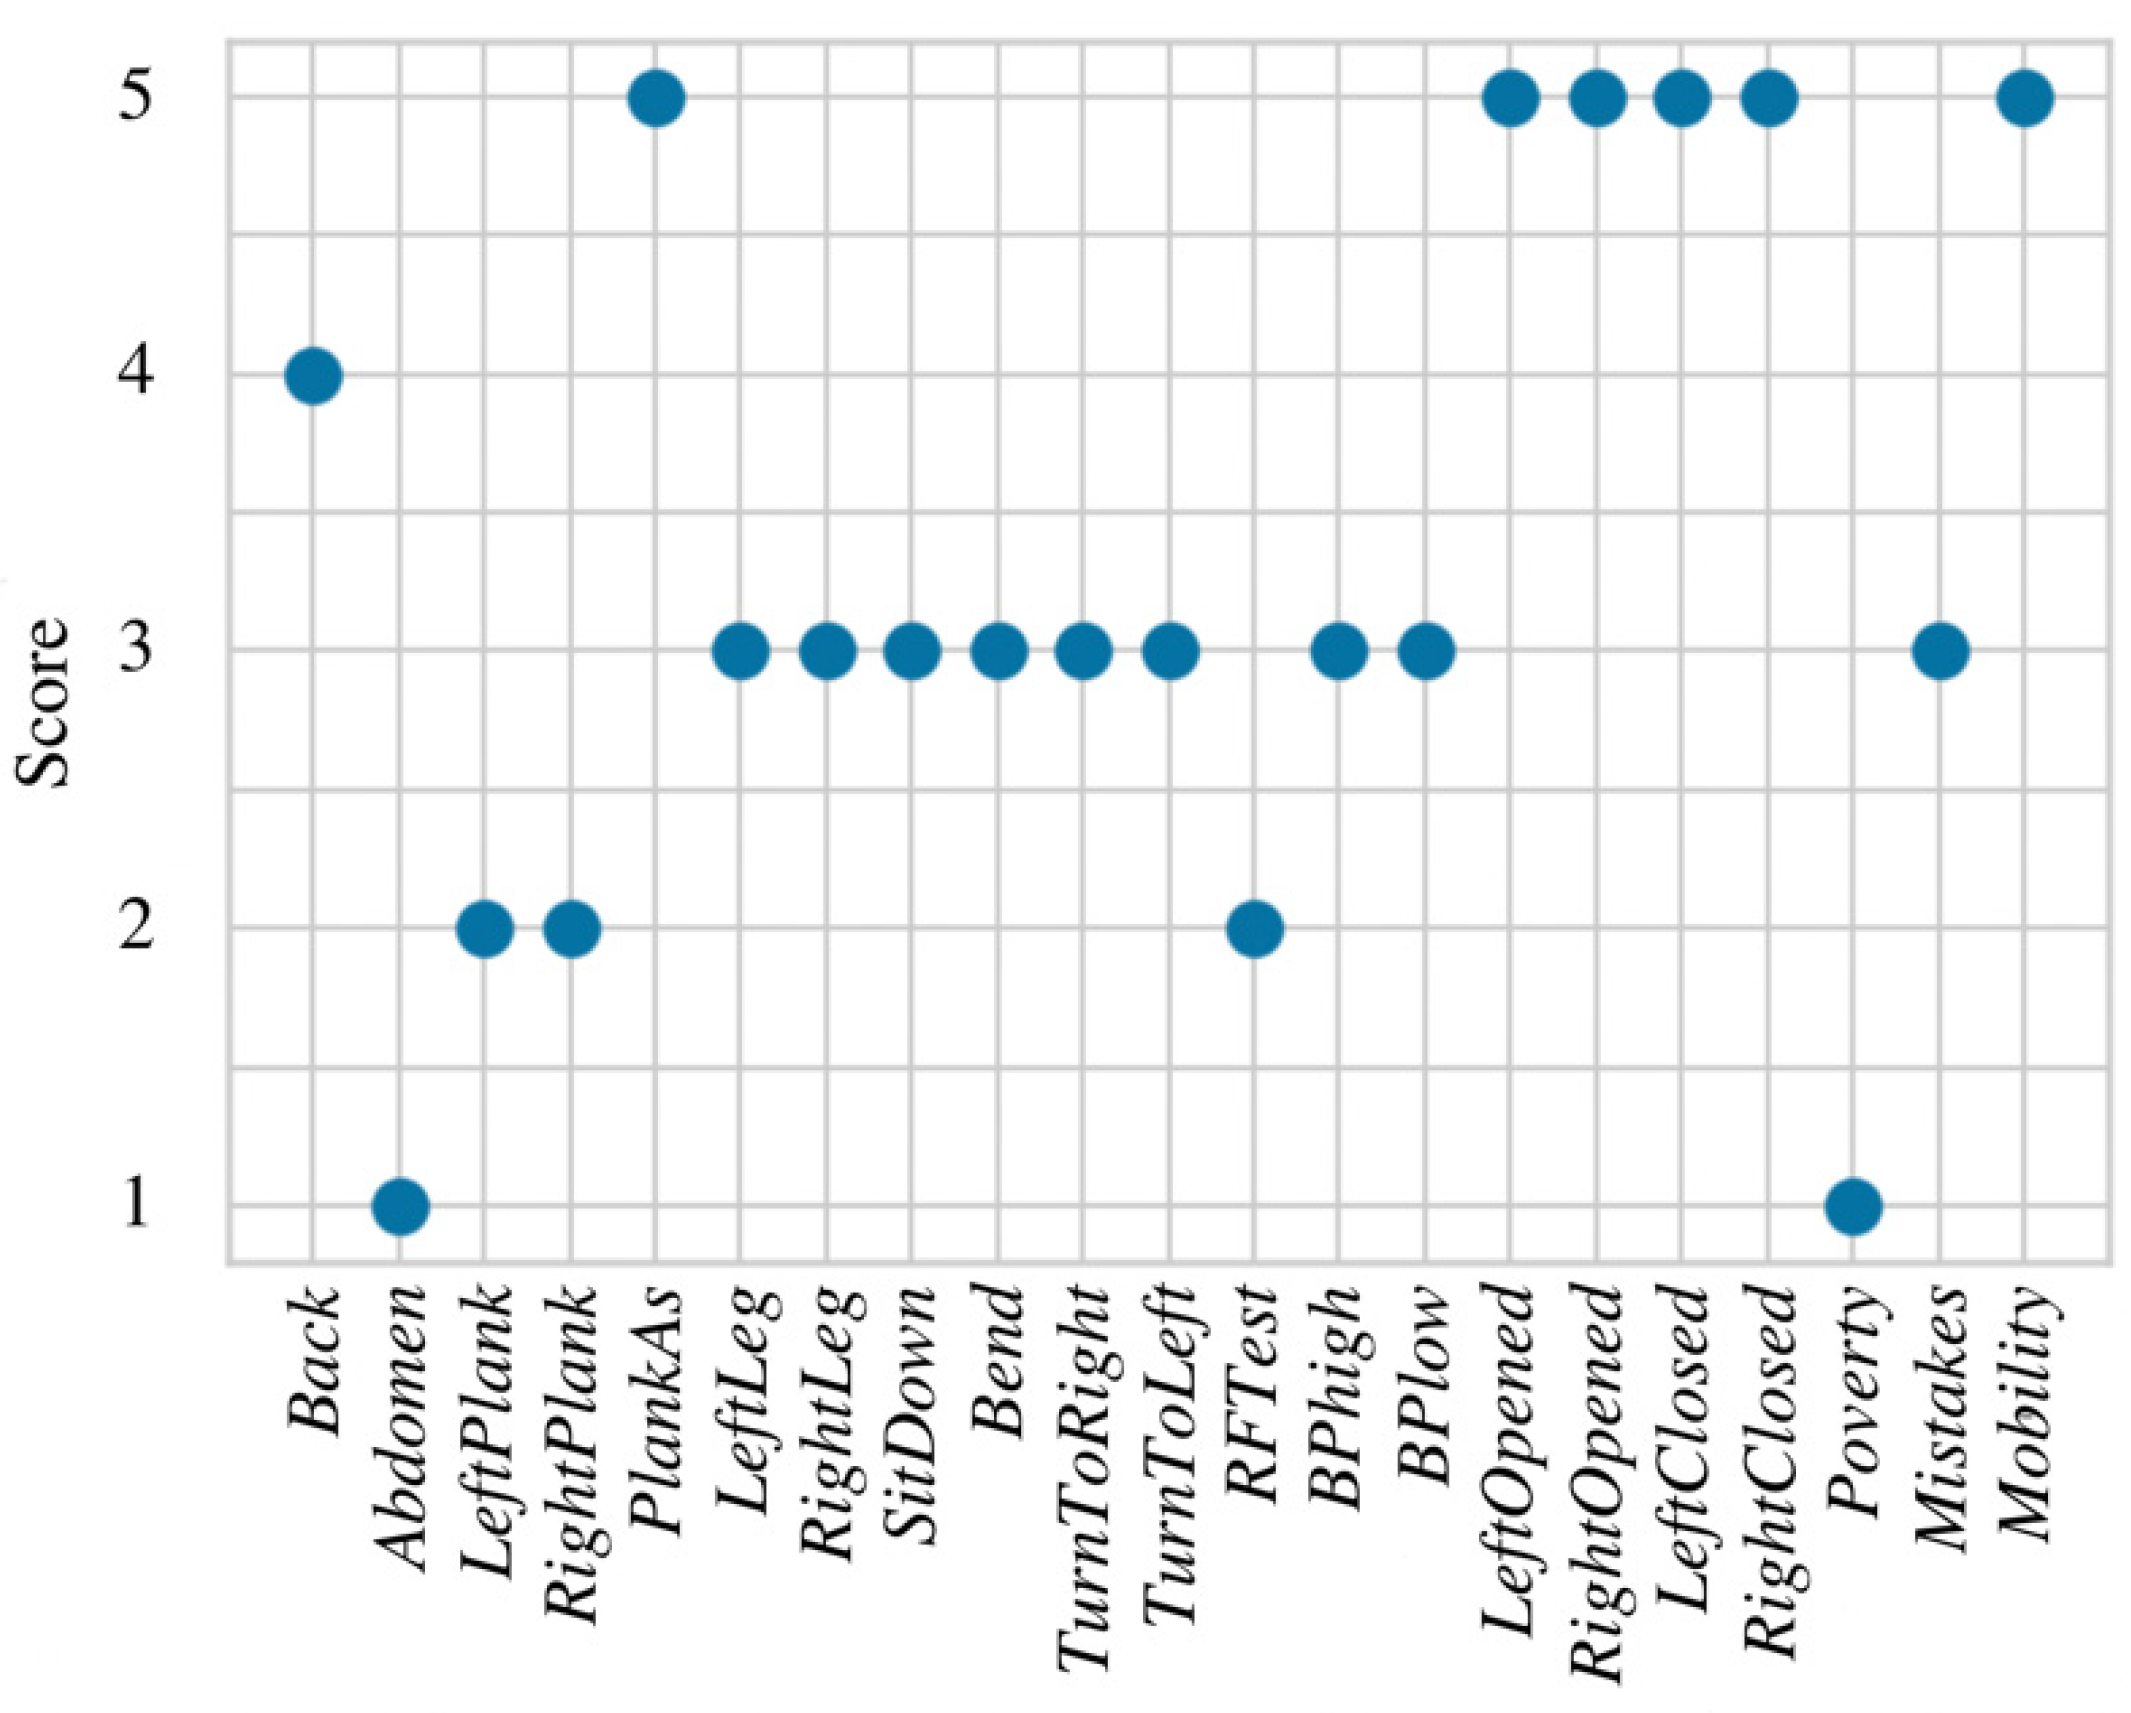
Figure 3). Gaps between thresholds are not defined in advance and depend on the standard deviation of the feature in each threshold. For example, if the threshold value is 25 and data with values above the threshold have standard deviation equal to 8, then a curve with a negative slope will be drawn between values 21 and 29. An example of data transformation using membership functions is shown in
Figure 4, where the total score (sum of all transformed values) is 69.
4.2. Expert System Optimization Using Random Forest Method
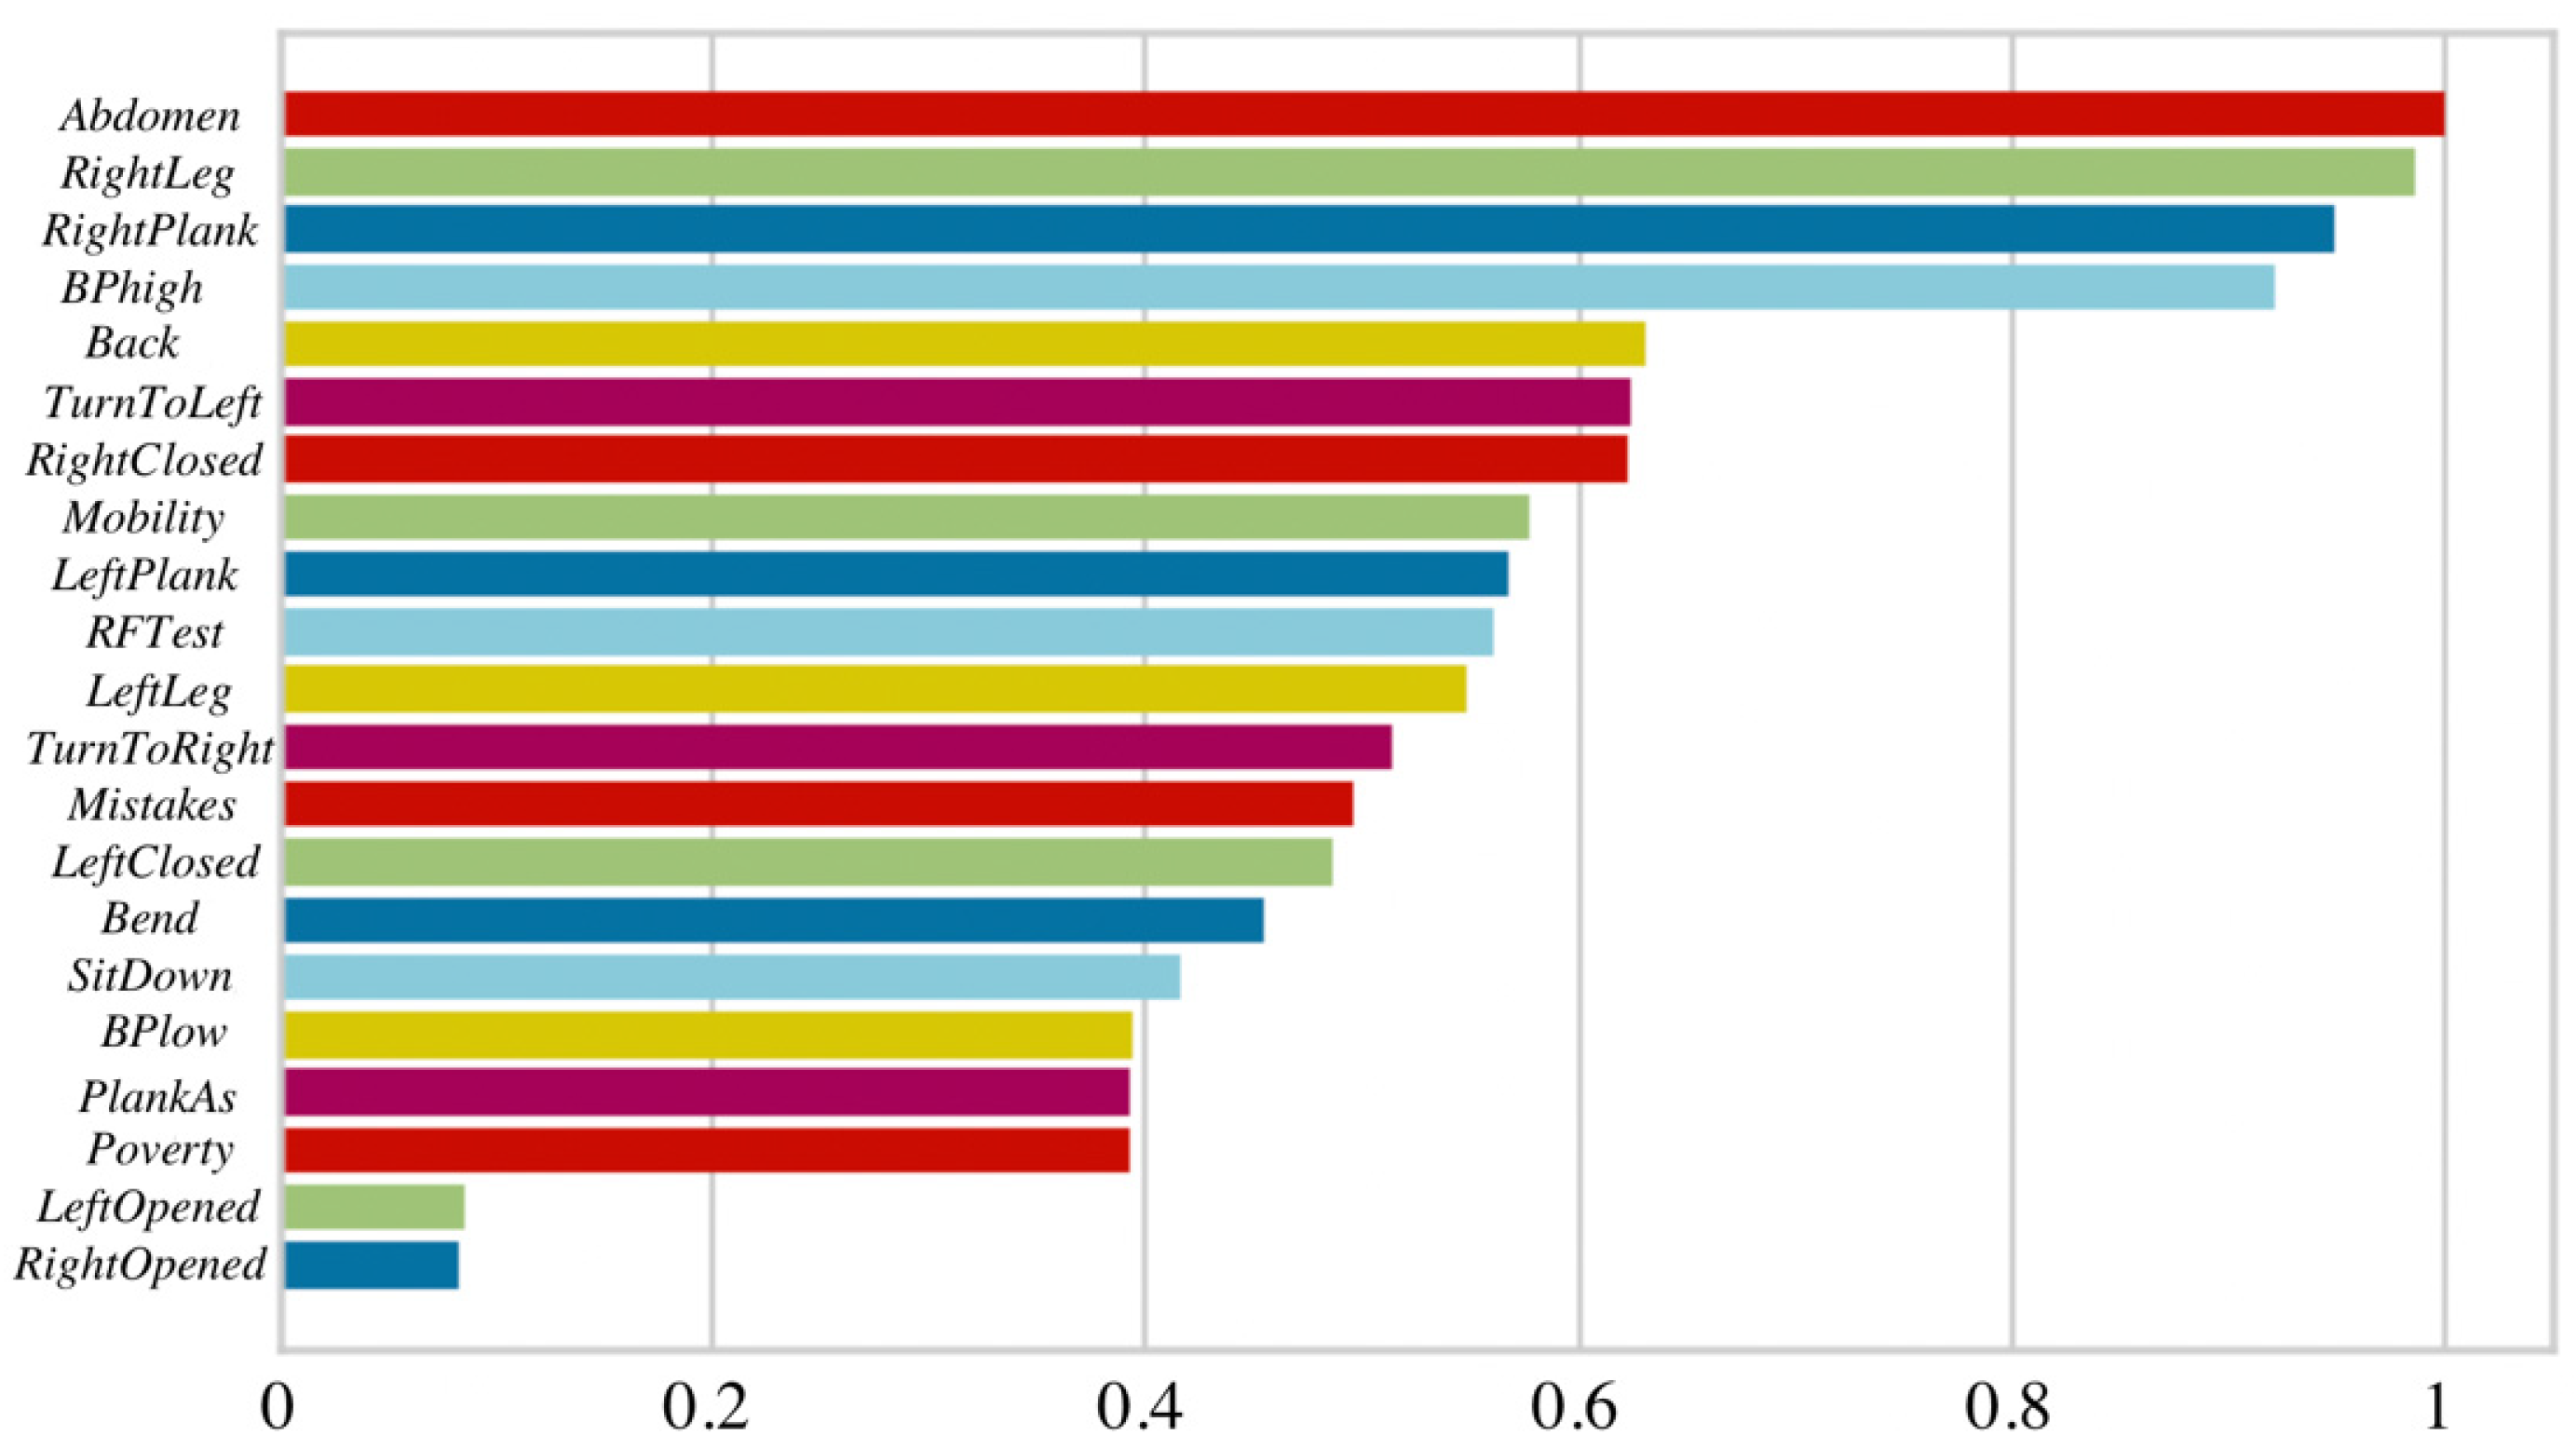
At the beginning of this research, the Random Forest model was constructed and applied to all 21 features at once. The importance of each feature was estimated using entropy [
34], where values below 0.05 are considered as not statistically significant and could be removed from the model. According to the obtained results, only variables that belong to the muscular system are considered as important in the RF model (see
Figure 5) and cardiovascular, together with neural systems, are not included. This may lead to incorrect health evaluation due to lack of features from other human body systems that are essential in the work ability evaluation process.
In 50 iterations, the average values of overall accuracy, micro and macro precision, recall, and F-1 scores were estimated. The data were split into training and testing datasets by 70% and 30%, respectively. To make sure that the model did not overfit the training data, 5-fold cross-validation was applied to all of the RF models presented in this paper. The results from
Table 6 show that the testing accuracies of RF models may vary from 60% to 67% if all features are considered. This led to the conclusion that three systems (cardiovascular, muscular, and nervous) should be evaluated separately, and three new RF models were constructed. Due to the data split, model testing accuracies increased (see
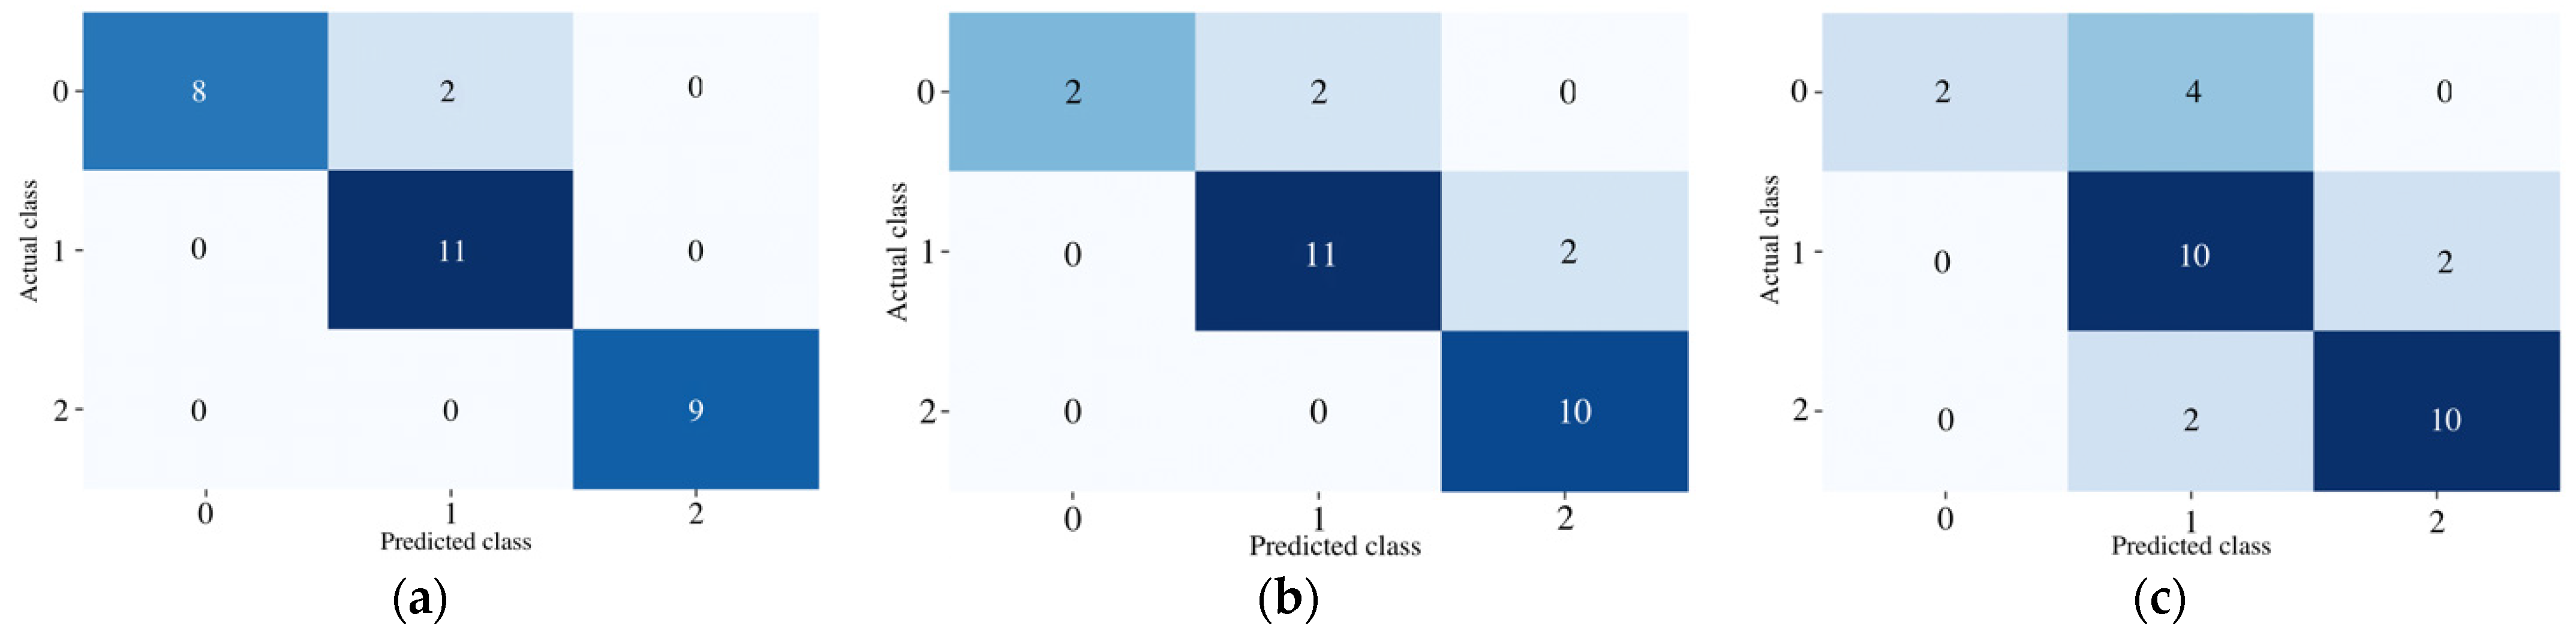
Table 6), and the RF model of cardiovascular system even reached 93%. However, health issues of nervous systems are more difficult to detect (reaching only 73% testing accuracy). This might be caused by the low number of features that represent this system or imprecise data split into good, moderate, and poor health conditions. According to these results, three separate models appear to be a better work ability evaluation technique. Examples of testing data classification results into three classes are presented in
Figure 6, where the confusion matrices of each system are shown. Furthermore, it can be noticed that muscular and neural systems have a relatively low number of values in class
, which may also result in bad classification accuracies of those models.
The proposed work ability evaluation systems were constructed from separate RF health evaluation models. The final recommendations were generated according to classification results of cardiovascular, muscular, and neural systems. The schematic block of the proposed expert system is shown in
Figure 7. The red circles represent the cardiovascular system, blue represents the muscular system, and yellow the neural system. All summed feature values were scaled and put into the hexagon web. Red dots indicate the asymmetry between left and right sides in muscle endurance side plank, static balance, or legs strength tests.
4.3. Designed Mobile App Application and Example of Recommendations
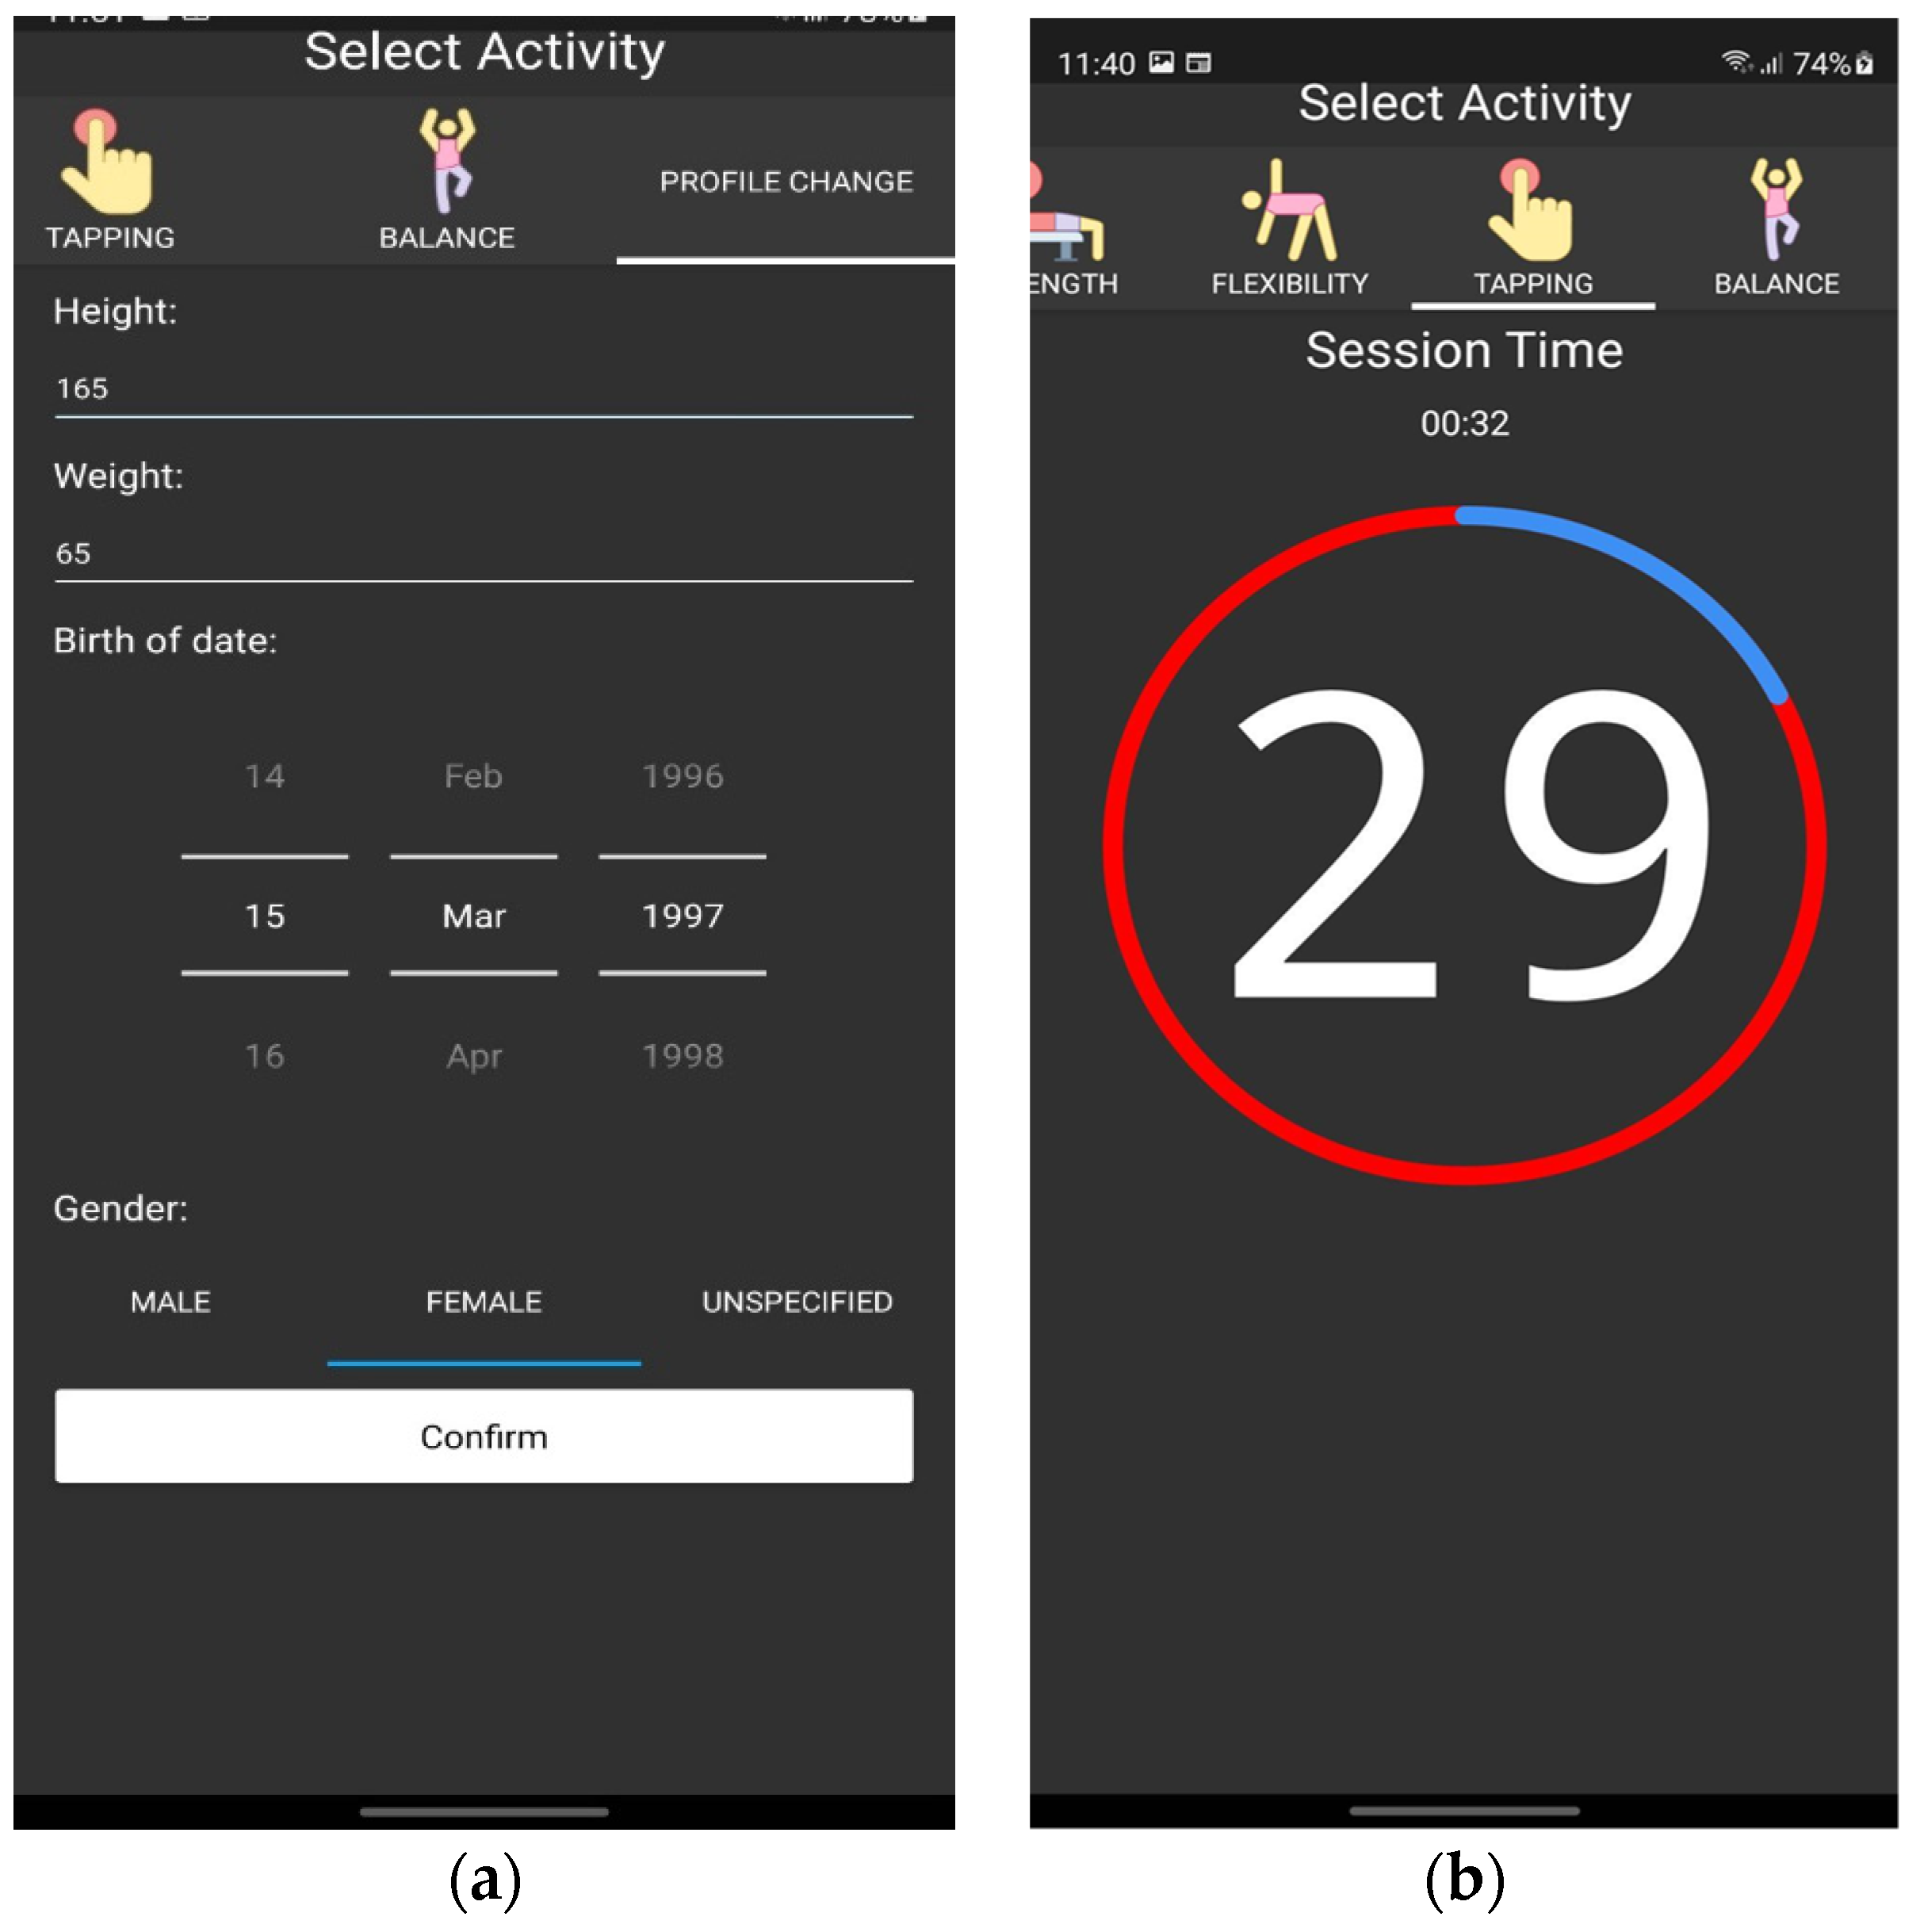
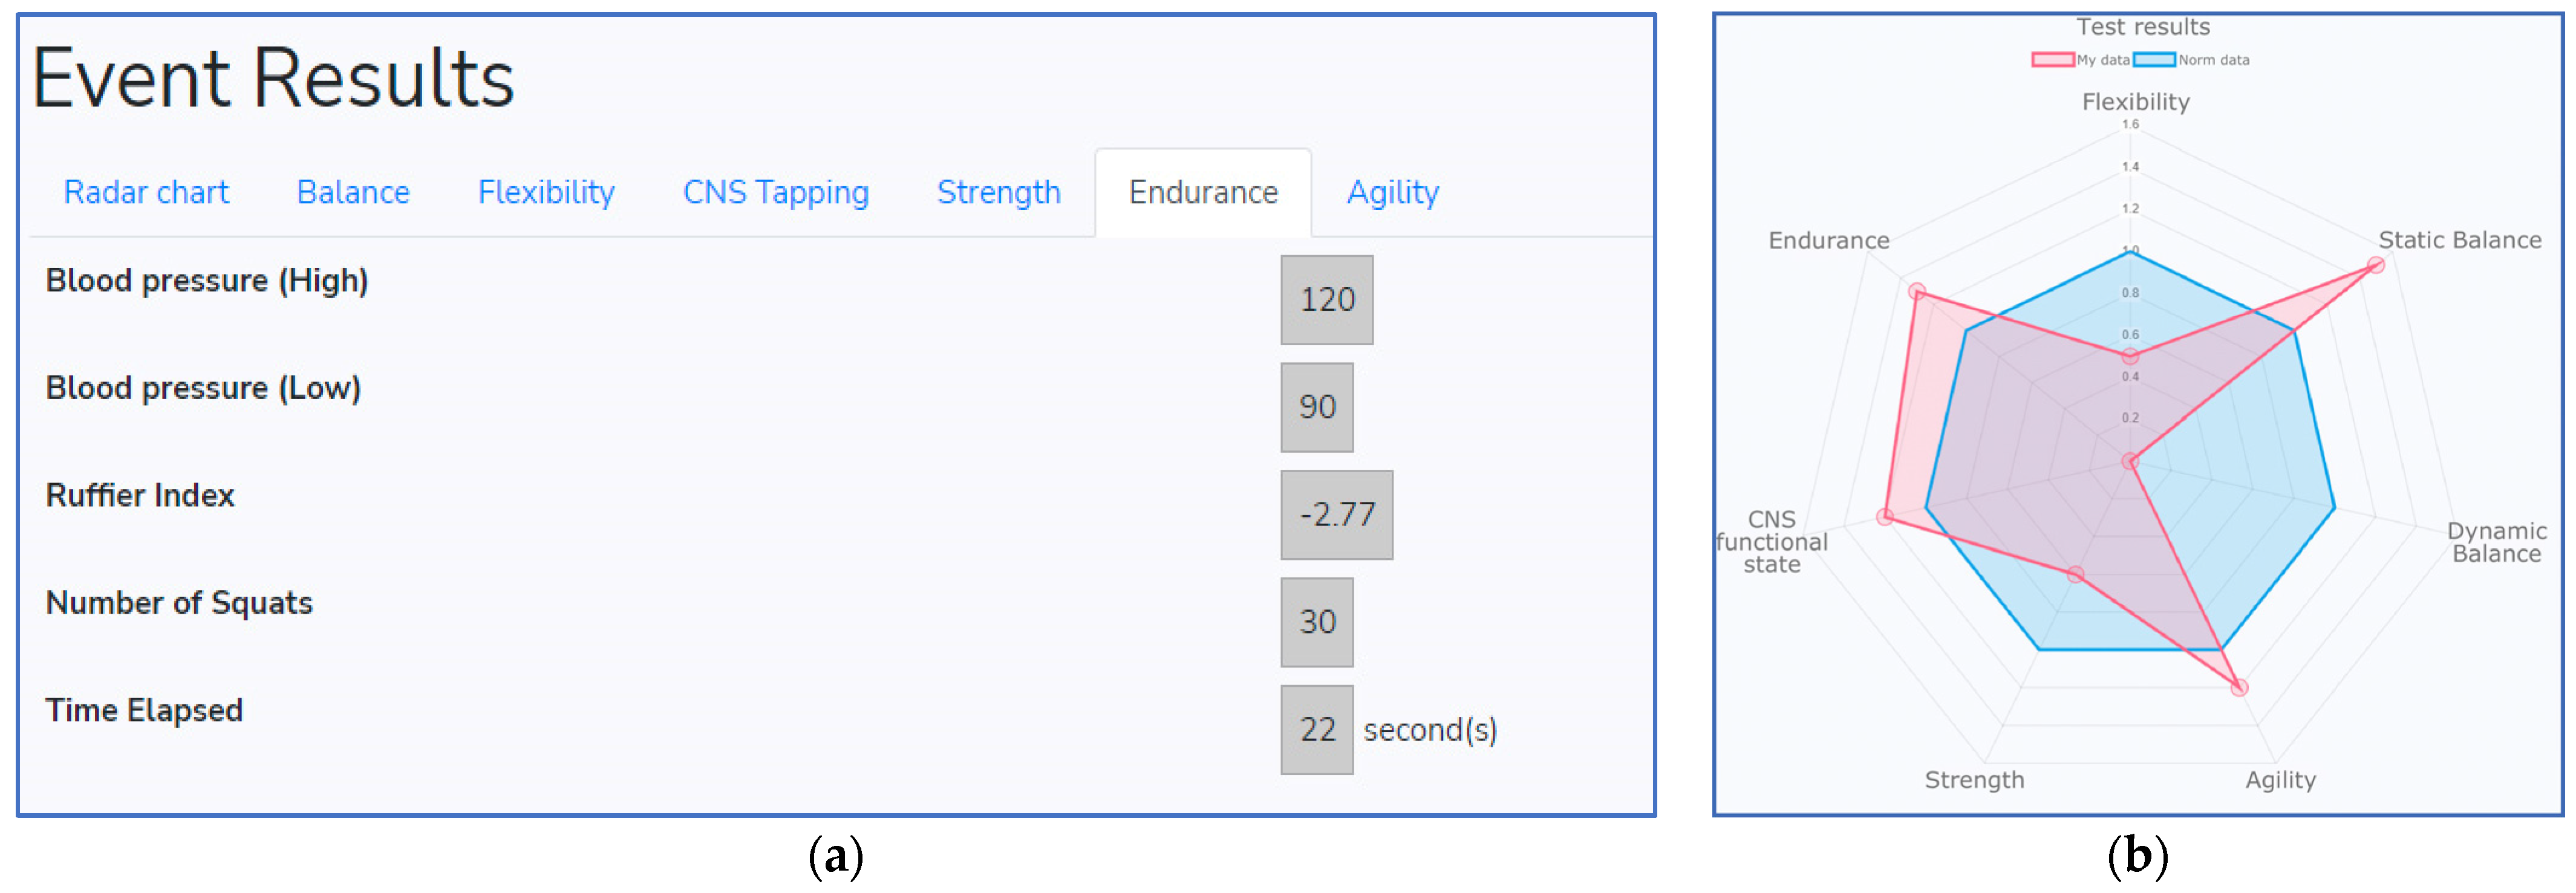
The created mobile application consists of the registration form and activity tests (examples are shown in
Figure 8). This application has a user-friendly interface and can be installed on a smartphone or tablet. All exercises are listed at the top of the program and are performed one after another. The time and score of every session are visible for the user. After profile information is filled out and all exercises are completed, the data are sent to the specialist client device and all the results, together with basic statistics, are visible for the healthcare specialist (examples are visible in
Figure 9). Visual representation is shown in the hexagon web, where blue color corresponds to normal health condition and red color depicts individual health evaluation results (see
Figure 9b). The same web is visible for the user in the mobile application.
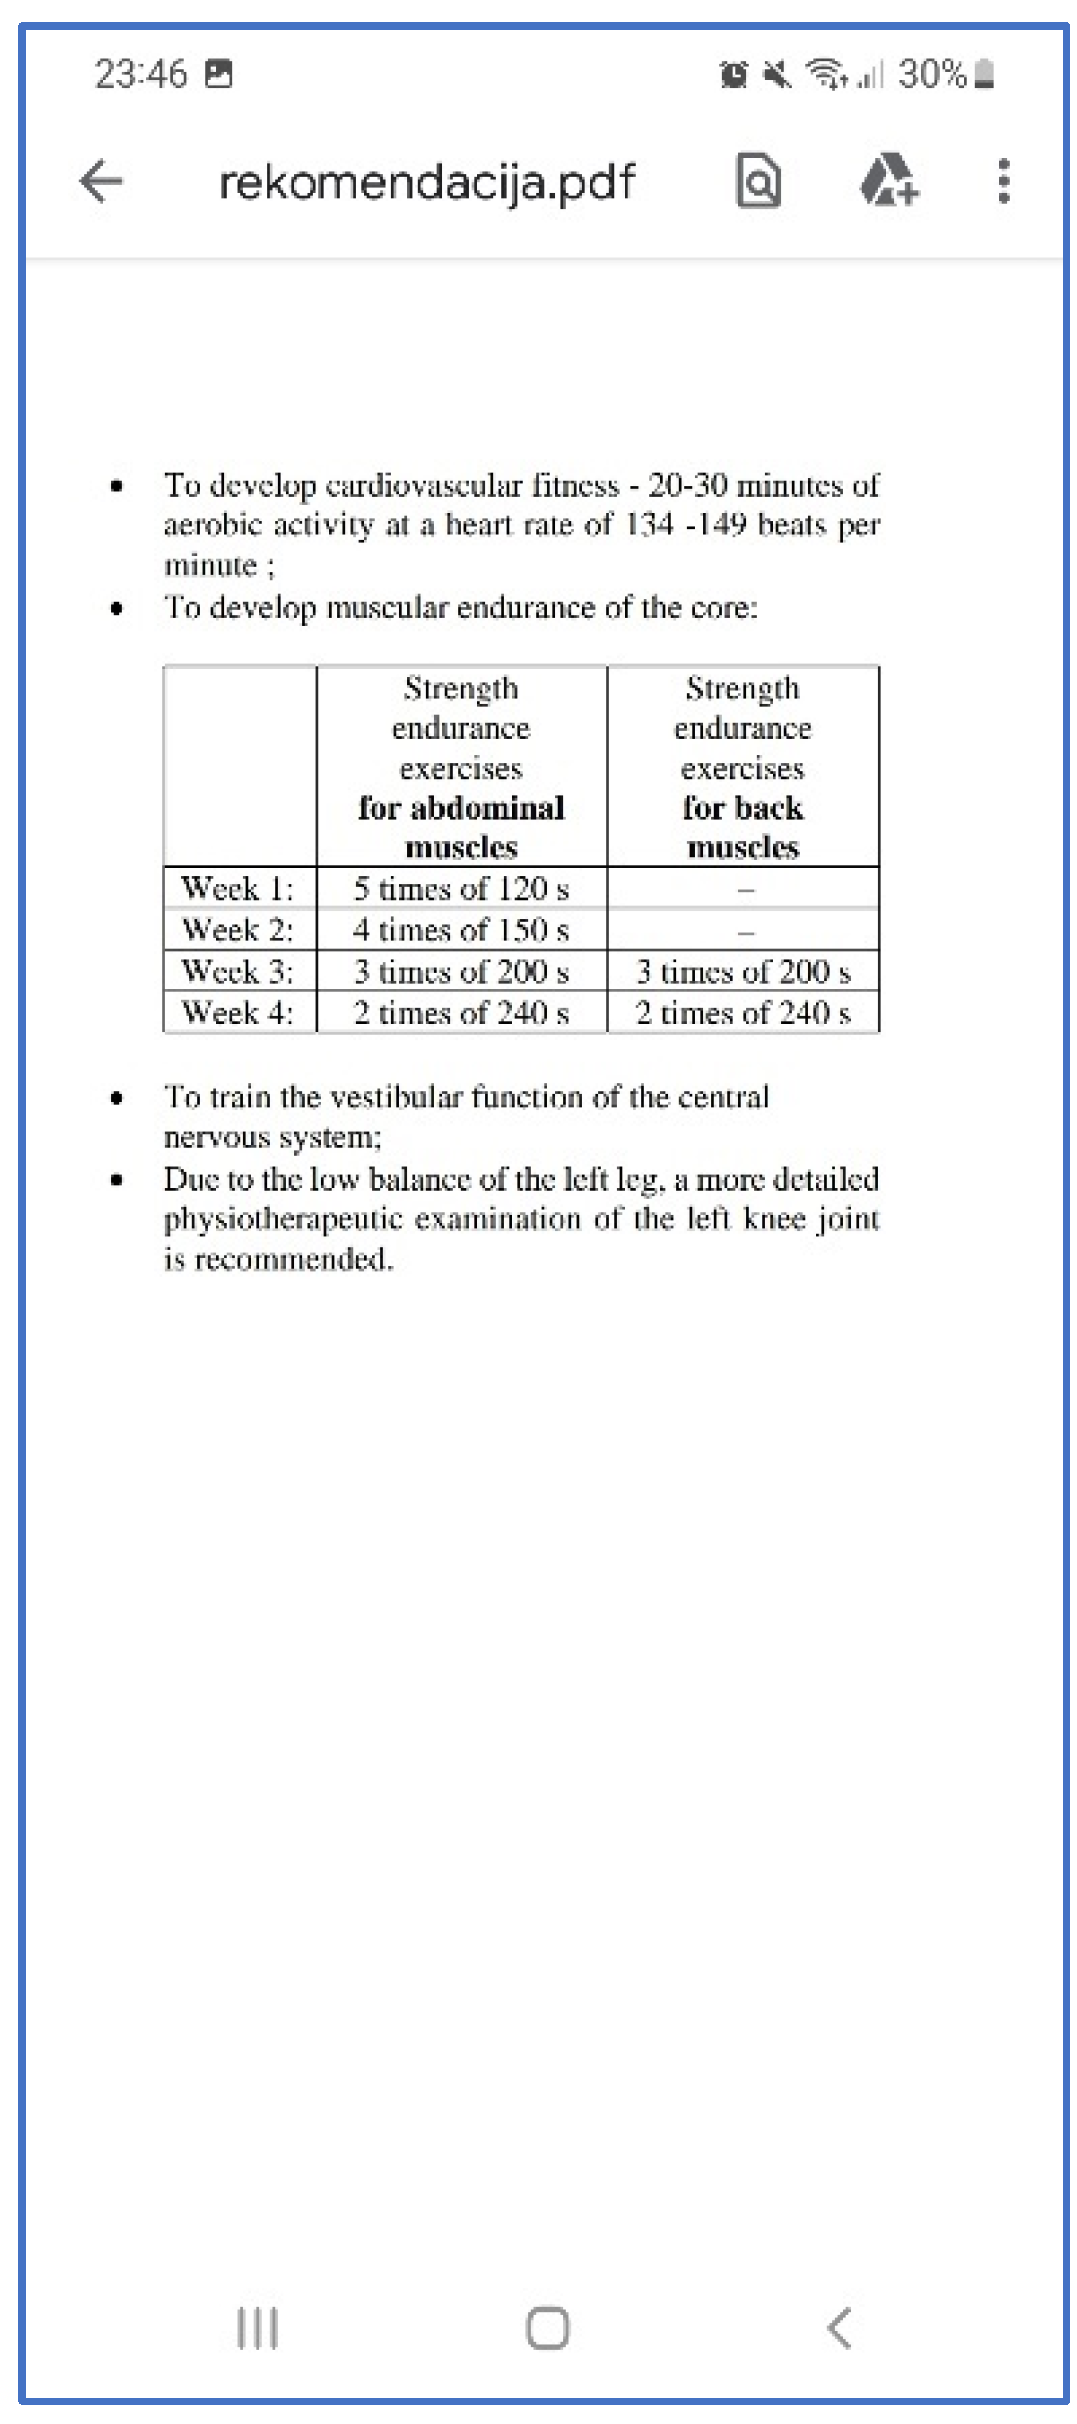
An example of listed recommendations to improve work ability is presented in
Figure 10. This information is provided in a Portable Document Folder (PDF) format in the client and specialist devices. The training plan is prepared for the 4 week period, and the same tests should be repeated in that time. Furthermore, if there are possible serious health indications, the program suggests contacting the doctor for further investigation to avoid accidents in the workplace.
5. Discussion
Previous studies have indicated what affects work ability in general. The research in Finland revealed that employees at ages 30–64 years are mostly affected by health and work environment-related causes [
35,
36]. Thirty-three percent of work ability is affected by physiological requirements, mental tension, and support. It was noticed that to improve work ability, employers should focus on employees’ health, and interventions should occur even at younger ages [
37]. Other studies indicated that common health behavior in recent years was influenced by COVID-19 due to lockdown and social distancing, which caused changes in physical activity [
38]. According to these and similar research it could be noticed that physical and mental health are the most important factors in work ability evaluation systems. The same conclusions were obtained in [
39], where suggestions were proposed considering that physical exercises via online channels could help to maintain people’s physical activity while they either had to or preferred to stay at home. However, previous studies are mostly focused on individual interviews, various questionnaires that contained conceptual information about individual health state and might change according to question formulation, specialist competence, and other aspects [
6,
15,
16,
17,
18]. In this paper, the work ability was mostly related to the employee’s physiological state, which consists of three separate systems: cardiovascular, muscular, and neural. Each state consists of several exercises or tests that need to be performed one after another.
In the literature, work ability is mainly related to muscular, cardiovascular, or mental disorders [
40]. Even though the human body consists of many other systems, such as the urinary system, endocrine system, etc., studies related to work ability evaluation mainly focus on muscular, cardiovascular, or mental systems. An investigation of the muscular system is often performed to evaluate how disorders might negatively affect abilities to perform daily activities, self-care, and work [
41]. Previous research has also shown how stress may seriously affect the autonomic nervous system as well as impacting cognitive performance [
42]. The causes of stress might be irregular or long working hour shifts, which are often associated with physiological sleep rhythms alterations [
43]. Finally, cardiovascular diseases are commonly related to long working hours and overworking [
44]. Even though human working abilities might depend on various factors, this paper also focuses on muscular, cardiovascular, and neural human body systems because they can be easily evaluated with no invasive procedures, additional devices, or long-lasting experiments. The obtained results indicate that the proposed work ability evaluation process may become a good tool for the prevention of possible accidents at work, chronic fatigue, or other health problems.
6. Conclusions
The data of this study were gathered from five separate events in Lithuania from 2019 to 2021, where 98 workers (57 female, 41 male, age 38.02 ± 11.77 years, high 173.94 ± 9.76 cm, weight 75.75 ± 14.72 kg) were tested and evaluated. The Baecke physical activity and pain questionnaires were given to all participants, and 61% indicated that they did sports, including walking, running, tennis, yoga, etc. In addition, workers indicated 2.64 (scale from 1 to 5) that after a working day they were physically tired.
In the proposed physiological activity evaluation process, 21 features were selected and analyzed. The realized data transformation technique uses fuzzy logic and different membership functions with three or five thresholds, according to the analyzed physiological feature. The transformed datasets were then classified into three stages that corresponded to good, moderate, and poor health condition using machine learning techniques. Each part was considered as a separate cardiovascular, muscular, or neural system where features were classified using Random Forest algorithms.
It was noticed that the physiological state evaluation process does not necessarily require a huge number of exercises or tests to make sure that necessary recommendations are provided. In the proposed expert system for the cardiovascular system classifier, only three features were included, and 93% accuracy was reached. The results indicate that the proposed work ability evaluation process may become a good tool for the prevention of possible accidents at work, chronic fatigue, or other health problems. Furthermore, the proposed classifiers may help to create a semi-automated recommendation for employees and reduce workload for the medical specialists.
7. Limitations
Even though 98 workers were recruited in this study, the number of participants should be expanded to reach higher classification accuracies. In addition, in some studies [
38,
39] gender, age, and type of work (physical or mental) differences were considered, and statistically significant differences were obtained. Further analysis should also consider these factors, and separate data subsets could be compared.
Furthermore, the proposed framework consists of data transformation and data split into three categories (classes , , and ) that are based on the first and third quartiles. However, these metrics may not be the most efficient ones, especially when the data are not distributed equally. Other metrics and data split proportions should be considered in future research.
Finally, the RF model constructed for the neural system is not accurate enough, and only 73% testing accuracy was reached. According to these results, the expert system should be modified by including additional exercises or replacing existing ones. However, this requires further investigation and higher datasets. It is also worth mentioning that working abilities might be affected by other factors that are not evaluated in this research because these do not belong to cardiovascular, muscular, or neural human body systems.
Author Contributions
Conceptualization, E.B. and L.B.; methodology, E.B. and A.Ž.; software, E.B.; validation, E.B., L.B. and A.Ž.; formal analysis, L.B.; investigation, E.B.; resources, L.B. and A.Ž.; data curation, A.Ž.; writing—original draft preparation, E.B.; writing—review and editing, E.B. and L.B; visualization, E.B. and A.Ž.; supervision, L.B. All authors have read and agreed to the published version of the manuscript.
Funding
This research received no external funding.
Institutional Review Board Statement
The study was conducted in accordance with the Declaration of Helsinki and approved by the Lithuanian Bioethics Committee (2020 No. L-20-1/2).
Informed Consent Statement
Informed consent was obtained from all subjects involved in the study.
Data Availability Statement
Not applicable.
Conflicts of Interest
The authors declare no conflict of interest.
Abbreviations
| Abbreviation | Definition |
| ACC | Overall accuracy in the multi-class classification problem |
| BP | Blood pressure |
| CNS | Central nervous system |
| ECG | Electrocardiogram |
| EEG | Electroencephalogram |
| FN | False Negative |
| FP | False Positive |
| HPQ | Work Performance Questionnaire |
| macro- score |
| Macro-averaged precision |
| Macro-averaged recall |
| MHP | Mental Health Problems |
| Micro-averaged score |
| Micro-averaged precision |
| Micro-averaged recall |
| PH | Physical Health |
| Q1 | Lower quartile |
| Q3 | Upper quartile |
| RF | Random Forest |
| TN | True Negative |
| TP | True Positive |
References
- Grimani, A.; Aboagye, E.; Kwak, L. The effectiveness of workplace nutrition and physical activity interventions in improving productivity, work performance and workability: A systematic review. BMC Public Health 2019, 19, 1676. [Google Scholar] [CrossRef] [Green Version]
- Axén, I.; Björk, E.; Vaez, M.; Lundin, A.; Bergström, G. Interventions for common mental disorders in the occupational health service: A systematic review with a narrative synthesis. Int. Arch. Occup. Environ. Health 2020, 93, 823–838. [Google Scholar] [CrossRef] [PubMed] [Green Version]
- Lunt, J.; Hemming, S.; Elander, J.; Baraniak, A.; Burton, K.; Ellington, D. Experiences of workers with post-COVID-19 symptoms can signpost suitable workplace accommodations. Int. J. Work. Health Manag. 2022, 15, 359–374. [Google Scholar] [CrossRef]
- Lindgren, I.; Pessax-Rasmussen, H.; Gard, G.; Brogardh, C. Perceived work situation and work ability among persons who are working one year after stroke. J. Rehabil. Med. 2022, 54, 918. [Google Scholar] [CrossRef]
- Svinndal, E.V.; Solheim, J.; Rise, M.B.; Jensen, C. Hearing loss and work participation: A cross-sectional study in Norway. Int. J. Audiol. 2018, 57, 646–656. [Google Scholar] [CrossRef] [PubMed] [Green Version]
- Brinkley, A.; Freeman, J.; Mcdermott, H.; Munir, F. What are the Facilitators and Obstacles to Participation in Workplace Team Sport? A Qualitative Study. AIMS Public Health 2017, 4, 94–126. [Google Scholar] [CrossRef] [Green Version]
- Berthelsen, H.; Owen, M.; Westerlund, H. Does workplace social capital predict care quality through job satisfaction and stress at the clinic? A prospective study. BMC Public Health 2021, 21, 1320. [Google Scholar] [CrossRef]
- Van Nhat, T.L.; Minh-Huy, D.; Jae-Gon, K.; Dae Woo, L. Dentist Job Satisfaction: A Systematic Review and Meta-analysis. Int. Dent. J. 2021, 71, 369–377. [Google Scholar] [CrossRef]
- Evanoff, B.A.; Rohlman, D.S.; Strickland, J.R.; Kelly, K.M.; Dale, A.M. Influence of work organization and work environment on health outcomes of construction apprentices. Am. J. Ind. Med. 2020, 63, 269–276. [Google Scholar] [CrossRef]
- Harris, A.P.Y.; Evans, N.P.; Perez, L.; Burrows, B.; Derk, G.R.; Chiu, C.; Wilund, K.R. Working on Wellness: Impact of a Pilot Workplace Wellness Program in a Hemodialysis Center. Nephrol. Nurs. J. 2021, 48, 49–56. [Google Scholar] [CrossRef]
- Scharf, J.; Nguyen, X.Q.; Vu-eickmann, P.; Krichbaum, M.; Loerbroks, A. Perceived Usefulness of Continuous Glucose Monitoring Devices at the Workplace: Secondary Analysis of Data From a Qualitative Study. J. Diabetes Sci. Technol. 2019, 13, 242–247. [Google Scholar] [CrossRef] [Green Version]
- Garefelt, J.; Gershagen, S.; Kecklund, G.; Westerlund, H.; Platts, L.G. How does cessation of work affect sleep? Prospective analyses of sleep duration, timing and efficiency from the Swedish Retirement Study. J. Sleep Res. 2021, 30, e13157. [Google Scholar] [CrossRef] [PubMed]
- Vester, S.; Hermann, T.; Diderichsen, F.; Bue, J. A one-item workability measure mediates work demands, individual resources and health in the prediction of sickness absence. Int. Arch. Occup. Env. Health 2013, 86, 755–766. [Google Scholar] [CrossRef]
- Pausch, K.; Blanke, K.; Niederberger, V.; Egli, S.; Rufer, M.; Olbrich, S.; Müller, M. Fit for Work and Life—An eight-week program for improvement of functionality and quality of life. Neuropsychiatrie 2022, 36, 104–115. [Google Scholar] [CrossRef]
- Kessler, R.C.; Barber, C.; Beck, A.; Berglund, P. The World Health Organization Health and Work Performance Questionnaire (HPQ). J. Occup. Environ. Med. 2003, 45, 156–174. [Google Scholar] [CrossRef] [PubMed] [Green Version]
- Jansson, I.; Gunnarsson, A.B. Employers ’ views of the impact of mental health problems on the ability to work. Work 2018, 59, 585–598. [Google Scholar] [CrossRef] [Green Version]
- Muschalla, B. Work-anxiety rather than cognitive performance contributes to work ability decisions in patients with mental disorders. J. Occup. Environ. Med. 2018, 60, 1042–1048. [Google Scholar] [CrossRef] [Green Version]
- Yaghoubitajani, Z.; Gheitasi, M.; Bayattork, M.; Andersen, L.L. Corrective exercises administered online vs at the workplace for pain and function in the office workers with upper crossed syndrome: Randomized controlled trial. Int. Arch. Occup. Environ. Health 2022, 95, 1703–1718. [Google Scholar] [CrossRef]
- Ma, Y.; Liu, Q.; Yang, L. Exploring seafarers’ workload recognition model with EEG, ECG and task scenarios complexity: A bridge simulation study. Mar. Sci. Eng. 2022, 10, 1438. [Google Scholar] [CrossRef]
- Kazi, A.; Haslam, C.; Duncan, M.; Clemes, S. Sedentary behaviour and health at work: An investigation of industrial sector, job role, gender and geographical differences. Ergonomics 2019, 62, 21–30. [Google Scholar] [CrossRef]
- Almutairi, A.M.; Salonitis, K.; Al-Ashaab, A. Assessing the leanness of a supply chain using multi-grade fuzzy logic: A health-care case study. Int. J. Lean Six Sigma 2019, 10, 81–105. [Google Scholar] [CrossRef] [Green Version]
- Khan, M.S.; Mansour, M.A.A.; Khadar, S.D.A.; Mallick, Z. Evaluating Healthcare Performance Using Fussy Logic. S. Afr. J. Ind. Eng. 2020, 31, 133–143. [Google Scholar] [CrossRef]
- Lauraitis, A.; Maskeliūnas, R.; Damaševičius, R. Research Article ANN and Fuzzy Logic Based Model to Evaluate Huntington Disease Symptoms. J. Healthc. Eng. 2018, 2018, 4581272. [Google Scholar] [CrossRef] [PubMed] [Green Version]
- Petrauskas, V.; Jasinevicius, R.; Damuleviciene, G.; Liutkevicius, A.; Kazanavicius, V.; Bitinaite-paskeviciene, R. Explainable Artificial Intelligence-Based Decision Support System for Assessing the Nutrition-Related Geriatric Syndromes. Appl. Sci. 2021, 11, 11763. [Google Scholar] [CrossRef]
- Karaman, M.M.; Jiaxuan, Z.; Xie, K.L.; Zhu, W.; Zhou, X.J. Quartile histogram assessment of glioma malignancy using high b -value diffusion MRI with a continuous-time random-walk model. NMR Biomed. 2021, 34, e4485. [Google Scholar] [CrossRef] [PubMed]
- Davids, K.; Hristovski, R.; Araujo, D.; Serre, N.B.; Button, C.; Passos, P. Routledge Research in Sport and Exercise Science; Routledge: Abington, MA, USA, 2014; ISBN 9780415809702. [Google Scholar]
- Shalizi, C.R. Methods and techniques of complex systems science: An overview. In Complex Systems Science in Biomedicine; Springer: Boston, MA, USA, 2003; pp. 33–114. [Google Scholar]
- Zanevskyy, I.; Janiszewska, R.; Zanevska, L. Validity of Ruffier Test in Evaluation of Resistance to the Physical Effort. J. Test. Eval. 2017, 45, 2193–2199. [Google Scholar] [CrossRef]
- Gordon, J.B.; Sanei, H.; Pedersen, P.K. Predicting hydrogen and oxygen indices (HI, OI) from conventional well logs using a Random Forest machine learning algorithm. Int. J. Coal Geol. 2022, 249, 103903. [Google Scholar] [CrossRef]
- Keykhay-hosseinpoor, M.; Kohsary, A.; Hossein-Morshedy, A.; Porwal, A. A machine learning-based approach to exploration targeting of porphyry Cu-Au deposits in the Dehsalm district, eastern Iran. Ore Geol. Rev. 2020, 116, 103234. [Google Scholar] [CrossRef]
- Milosevic, M.; Jovanovic, Z.; Jankovic, D. A comparison of methods for three-class mammograms classification. Technol. Health Care 2017, 25, 657–670. [Google Scholar] [CrossRef]
- Takahashi, K.; Yamamoto, K.; Kuchiba, A.; Koyama, T. Confidence interval for micro-averaged F1 and macro-averaged F1 scores. Appl. Intell. 2022, 52, 4961–4972. [Google Scholar] [CrossRef]
- Berger, A.; Guda, S. Threshold optimization for F measure of macro-averaged precision and recall. Pattern Recognit. 2020, 102, 107250. [Google Scholar] [CrossRef]
- Gao, K.; Wang, Y.; Ma, L. Belief Entropy Tree and Random Forest: Learning from Data with Continuous Attributes and Evidential Labels. Entropy 2022, 24, 605. [Google Scholar] [CrossRef] [PubMed]
- Ilmarinen, J. From Work Ability Research to Implementation. Environ. Res. Public Health 2019, 16, 2882. [Google Scholar] [CrossRef] [Green Version]
- Wagenaar, A.F.; Kompier, M.A.J.; Houtman, I.L.D.; van den Bossche, S.N.J.; Taris, T.W. Who gets fired, who gets re-hired: The role of workers ’ contract, age, health, work ability, performance, work satisfaction and employee investments. Int. Arch. Occup. Env. Health 2015, 88, 321–334. [Google Scholar] [CrossRef]
- Söderbacka, T.; Nyholm, L.; Fagerström, L. Workplace interventions that support older employees’ health and work ability—A scoping review. BMC Health Serv. Res. 2020, 20, 472. [Google Scholar] [CrossRef] [PubMed]
- Castañeda-babarro, A.; Arbillaga-etxarri, A.; Gutierrez-Santamaria, B.; Coca, A. Physical Activity Change during COVID-19 Confinement. Environ. Res. Public Health 2020, 17, 6878. [Google Scholar] [CrossRef]
- Rodr, A.; Mañas, A.; Labayen, I.; Gonz, M.; Espin, A.; Aznar, S.; Serrano-s, A.; Vera-garcia, F.J.; Gonz, D.; Ara, I.; et al. Impact of COVID-19 Confinement on Physical Activity and Sedentary Behaviour in Spanish University Students: Role of Gender. Environ. Res. Public Health 2021, 18, 369. [Google Scholar] [CrossRef]
- Reeuwijk, K.G.; Robroek, S.J.W.; Hakkaart, L.; Burdorf, A. How Work Impairments and Reduced Work Ability are Associated with Health Care Use in Workers with Musculoskeletal Disorders, Cardiovascular Disorders or Mental Disorders. J. Occup. Rehabil. 2014, 24, 631–639. [Google Scholar] [CrossRef] [Green Version]
- Fifolato, T.M.; Correa, H.; Nardim, B.; Lopes, E.R.; Suzuki, K.A.K.; Silva, N.C.; Serenza, F.; Fonseca, M.C.R. Association between muscle strength, upper extremity fatigue resistance, work ability and upper extremity dysfunction in a sample of workers at a tertiary hospital. BMC Musculoskelet. Disord. 2021, 22, 508. [Google Scholar] [CrossRef]
- Garbarino, S.; Magnavita, N.; Barbic, F.; Stålberg, E.V.; Lanteri, P. Editorial: Occupational Neuroscience: Nervous System’s Health at the Workplace. Front. Hum. Neurosci. 2022, 16, 27. [Google Scholar] [CrossRef]
- Magnavita, N.; Garbarino, S. Sleep, Health and Wellness at Work: A Scoping Review. Environ. Res. Public Health 2017, 14, 1347. [Google Scholar] [CrossRef] [PubMed] [Green Version]
- Lin, R.; Chien, L.; Kawachi, I. Nonlinear associations between working hours and overwork-related cerebrovascular and cardiovascular diseases (CCVD). Sci. Rep. 2018, 8, 9694. [Google Scholar] [CrossRef] [PubMed]
| Disclaimer/Publisher’s Note: The statements, opinions and data contained in all publications are solely those of the individual author(s) and contributor(s) and not of MDPI and/or the editor(s). MDPI and/or the editor(s) disclaim responsibility for any injury to people or property resulting from any ideas, methods, instructions or products referred to in the content. |
© 2023 by the authors. Licensee MDPI, Basel, Switzerland. This article is an open access article distributed under the terms and conditions of the Creative Commons Attribution (CC BY) license (https://creativecommons.org/licenses/by/4.0/).


