Article

Bubble Sliding Characteristics and Dynamics of R134a during Subcooled Boiling Flow in a Narrow Gap

1
College of Food Science and Technology, Shanghai Ocean University, Shanghai 201306, China
2
Shanghai Professional Technology Service Platform on Cold Chain Equipment Performance and Energy Saving Evaluation, Shanghai 201306, China
3
National Experimental Teaching Demonstration Center for Food Science and Engineering, Shanghai Ocean University, Shanghai 201306, China
4
Quality Supervision, Inspection and Testing Center for Cold Storage and Refrigeration Equipment, Ministry of Agriculture, Shanghai 201306, China
*
Authors to whom correspondence should be addressed.
Mathematics 2023, 11(9), 2197; https://doi.org/10.3390/math11092197
Submission received: 9 April 2023 / Revised: 29 April 2023 / Accepted: 3 May 2023 / Published: 6 May 2023
(This article belongs to the Special Issue Mathematical Modeling and Numerical Analysis for Applied Sciences)

Abstract

:
The numerical method was used to study bubble sliding characteristics and dynamics of R134a during subcooled flow boiling in a narrow gap. In the numerical method, the volume of fraction (VOF) model, level set method, Lee phase change model and the SST kω turbulent model were adopted for the construction of the subcooled flow boiling model. In order to explore bubble sliding dynamics during subcooled flow boiling, the bubble sliding model was introduced. The bubble velocity, bubble departure diameter, sliding distance and bubble sliding dynamics were investigated at 0.2 to 5 m/s inlet velocities. The simulation results showed that the bubble velocity at the flow direction was the most important contribution to bubble velocity. Additionally, the bubble velocity of 12 bubbles mostly oscillated with time during the sliding process at 0.2 to 0.6 m/s inlet velocities, while the bubble velocity increased during the sliding process due to the bubble having had a certain inertia at 2 to 5 m/s inlet velocities. It was also found that the average bubble velocity in flow direction accounted for about 80% of the mainstream velocities at 0.2 to 5 m/s. In the investigation of bubble sliding distance and departure diameter, it was concluded that the ratio of the maximum sliding distance to the minimum sliding distance was close to two at inlet velocities of 0.3 to 5 m/s. Moreover, with increasing inlet velocity, the average sliding distance increased significantly. The average bubble departure diameter obviously increased from 0.2 to 0.5 m/s inlet velocity and greatly reduced after 0.6 m/s. Finally, the investigations of the bubble sliding dynamics showed that the surface tension dominated the bubble sliding process at 0.2 to 0.6 m/s inlet velocities. However, the drag force dominated the bubble sliding process at 2 to 5 m/s inlet velocities.

1. Introduction

Subcooled boiling as an efficient heat transfer method has been applied in many fields; for example, commercial refrigeration, the electronics industry, nuclear power and the aerospace industry [1,2,3,4,5]. During subcooled flow boiling, the bubble with non-zero velocity typically slides along the heating wall until departure and annihilation. The bubble behaviors, including sliding, departure and annihilation, change the flow flied and temperature flied, which enhances heat transfer in subcooled flow boiling. Among these bubble behaviors, the bubble sliding process involves many complex changes, and it is of great importance to understand bubble sliding and effectively the control sliding process for heat transfer enhancement.
Researchers have paid more attention to conducting a lot of research on characteristics of bubble sliding in subcooled flow boiling. Cai et al. [6] found that supercooling was an important factor in determining bubble detachment through experiments, as when the fluid saturation or the supercooling of the fluid can be neglected, the bubbles cannot leave the surface close to the wall and they will accumulate to a certain volume and slide upward. Furthermore, when the subcooling of the coolant reaches 2 K, the bubble separation phenomenon is observed for the first time. It is known that a certain degree of subcooling is a prerequisite for the bubble to leave the wall. Yuan et al. [7] experimentally investigated the bubble sliding process during subcooled flow boiling in a rectangular channel with a gap of 2.5 mm, and the investigation was conducted with velocities of 0.137 to 0.328 m/s and heat fluxes of 77.69 to 147.32 kW/m2. The results showed that both bubble sliding distance and bubble velocity increased with the increasing of mainstream velocity. The bubble sliding distance was affected by bubble nucleation because of the interaction among sliding bubbles. Liu et al. [8] experimentally studied the bubble characteristics in subcooled flow boiling, and it was found that the bubble sliding velocity was equal to the average inlet velocity at a heat flux of 0.3 MW/m2, subcooling of 30 K and mass flux of 800 kg/m2. The bubble slid long distances without obvious change of size and shape in low heat fluxes of 150 kW/m2, and the sliding velocity accounted for 78% of mean inlet velocity. In contrast, the bubble grew rapidly at nucleation sites in a high heat flux of 300 kW/m2; after that, the bubble size increased significantly during the sliding process and it was explained that the sliding bubble absorbed only nucleated bubbles. Additionally, the bubble sliding velocity was approximately equal to the mainstream velocity. Cao et al. [9] experimentally studied the bubble behavior in subcooled flow boiling under different velocities from 0.1 to 0.8 m/s. At low subcooling, the bubble behavior was quite similar at different velocities, and the bubble departed the heating wall with a maximum size after sliding. In the investigation of the bubble sliding characteristics, two methods, an experimental method and a numerical method, were used. The results of the experimental method are real and credible for the study of subcooled boiling, but the internal data cannot be measured well. More physical quantities can be obtained directly by a simulation method under the condition of completing model validity. Owoeye [10] investigated the effect of bulk velocity on bubble sliding velocity in subcooled flow boiling by employing a simulation method. The relative bubble sliding velocity decreased with the bulk velocity, especially at high bulk velocity. Meanwhile, the oscillation of bubble sliding velocity increased at high velocity. Wei et al. [11] investigated the bubble behaviors in subcooled flow boiling based on a VOF model; it was found that, under the condition of additional inertial forces, the mass flow rate fluctuated significantly. Obviously, the simulation research of subcooled flow boiling has superiority in aspects of data acquisition and volume; for example, the velocity and temperature. Although some progress has been made in bubble sliding during subcooled flow boiling, the bubble sliding details are still not perfect and a lot of work needs to be carried out.
The bubble sliding dynamics is another important direction of subcooled boiling research, and several bubble sliding dynamics models have been established and improved, whereas the bubble sliding model is still under further examination. Klausner et al. [12] proposed the bubble growth model for subcooled flow boiling. In this model, the bubble slides along the heating wall when the force balance breaks in the flow direction. The bubble departed from the heating wall when the force balance was broken in the radial direction. Sugrue and Buongiorno [13] proposed that surface tension and buoyancy dominated bubble sliding process on the basis of Klausner et al. [12] and Yun et al. [14] models, while the shear lift force and surface tension dominated when the bubble departed from the heating wall. Zhou et al. [15] experimentally investigated the bubble growth in horizontal subcooled flow boiling, then proposed a modified bubble growth model. The buoyancy was not considered in the bubble sliding direction. Yu et al. [16] studied the behavior of sliding bubbles in vertical upward subcooled boiling flow through visualization experiments and established a new force balance model based on differential equations of motion to predict the motion of sliding bubbles. It was found that the added mass effect and flow resistance drive the bubble to move rapidly in the early stage, while the buoyancy drives the bubble to move slowly in the later stage. Wang et al. [17] used forced convection boiling experiments to study the growth and sliding of a single bubble during heating and found that bubble behavior is very different from upward or vertical boiling due to gravitational effects. The velocity of the bubble is close to the velocity of the surrounding liquid, and the bubble expansion velocity increases with the mass flux. Ren et al. [18] developed the bubble growth model, and bubble departure after sliding was discussed. Researchers have no consistent theory for bubble sliding models, since bubble sliding is not clearly studied.
Refrigerant R134a has a relatively low global warming potential value, which is widely used in commercial refrigeration [19]. It is necessary to study the performance of R134a, and some studies have focused on the bubble behavior of R134a. Jeon et al. [20] numerically investigated the bubble condensation of R134a in a tube based on a VOF model. Da Riva and Del Col [21] used R134a to study the condensation of bubble, and the SST k- ω model was adopted for high velocity scenarios. Chen et al. [22] studied the bubble behavior of R134a inside horizontal gaps in subcooled flow boiling, and the bubble boiling was observed. At present, the bubble condensation characteristics of R134a have been extensively studied, while bubble characteristics are rarely studied due to the complexity of boiling, let alone bubble sliding characteristics and bubble sliding dynamics.
As reviewed above, the bubble sliding characteristics and dynamics of R134a during subcooled flow boiling flow are not reported and clearly understood; thus, the bubble sliding characteristics and bubble sliding dynamics of R134a have been investigated to better understand the bubble sliding for heat transfer enhancement in this paper. In addition, the gap structure is used as a fluid channel because of the sufficient heat transfer in small spaces and its application in refrigeration systems and nuclear fields [3,23]. The study’s purpose is to investigate the bubble velocity, bubble departure diameter, sliding distance and bubble sliding dynamics under the conditions of 0.2 to 0.8 m/s inlet velocities. Therefore, the simulation method was more suitable due to bubble velocity and sliding distance being more easily obtainable, while the experimental method would have been more difficult to do. Further, the VOF model and level set method are used for the tracking of the bubble. The VOF model is widely used in interface tracking, and the level set method, which as a new interface tracking algorithm, can optimize the interface. In addition, the Lee phase change model was used to control the formation of bubbles, as well as the SSK k ω turbulence model. The SSK k ω turbulence model takes into account the effect of velocity on bubble motion. The details of models have been discussed extensively in the authors’ prior work [24].

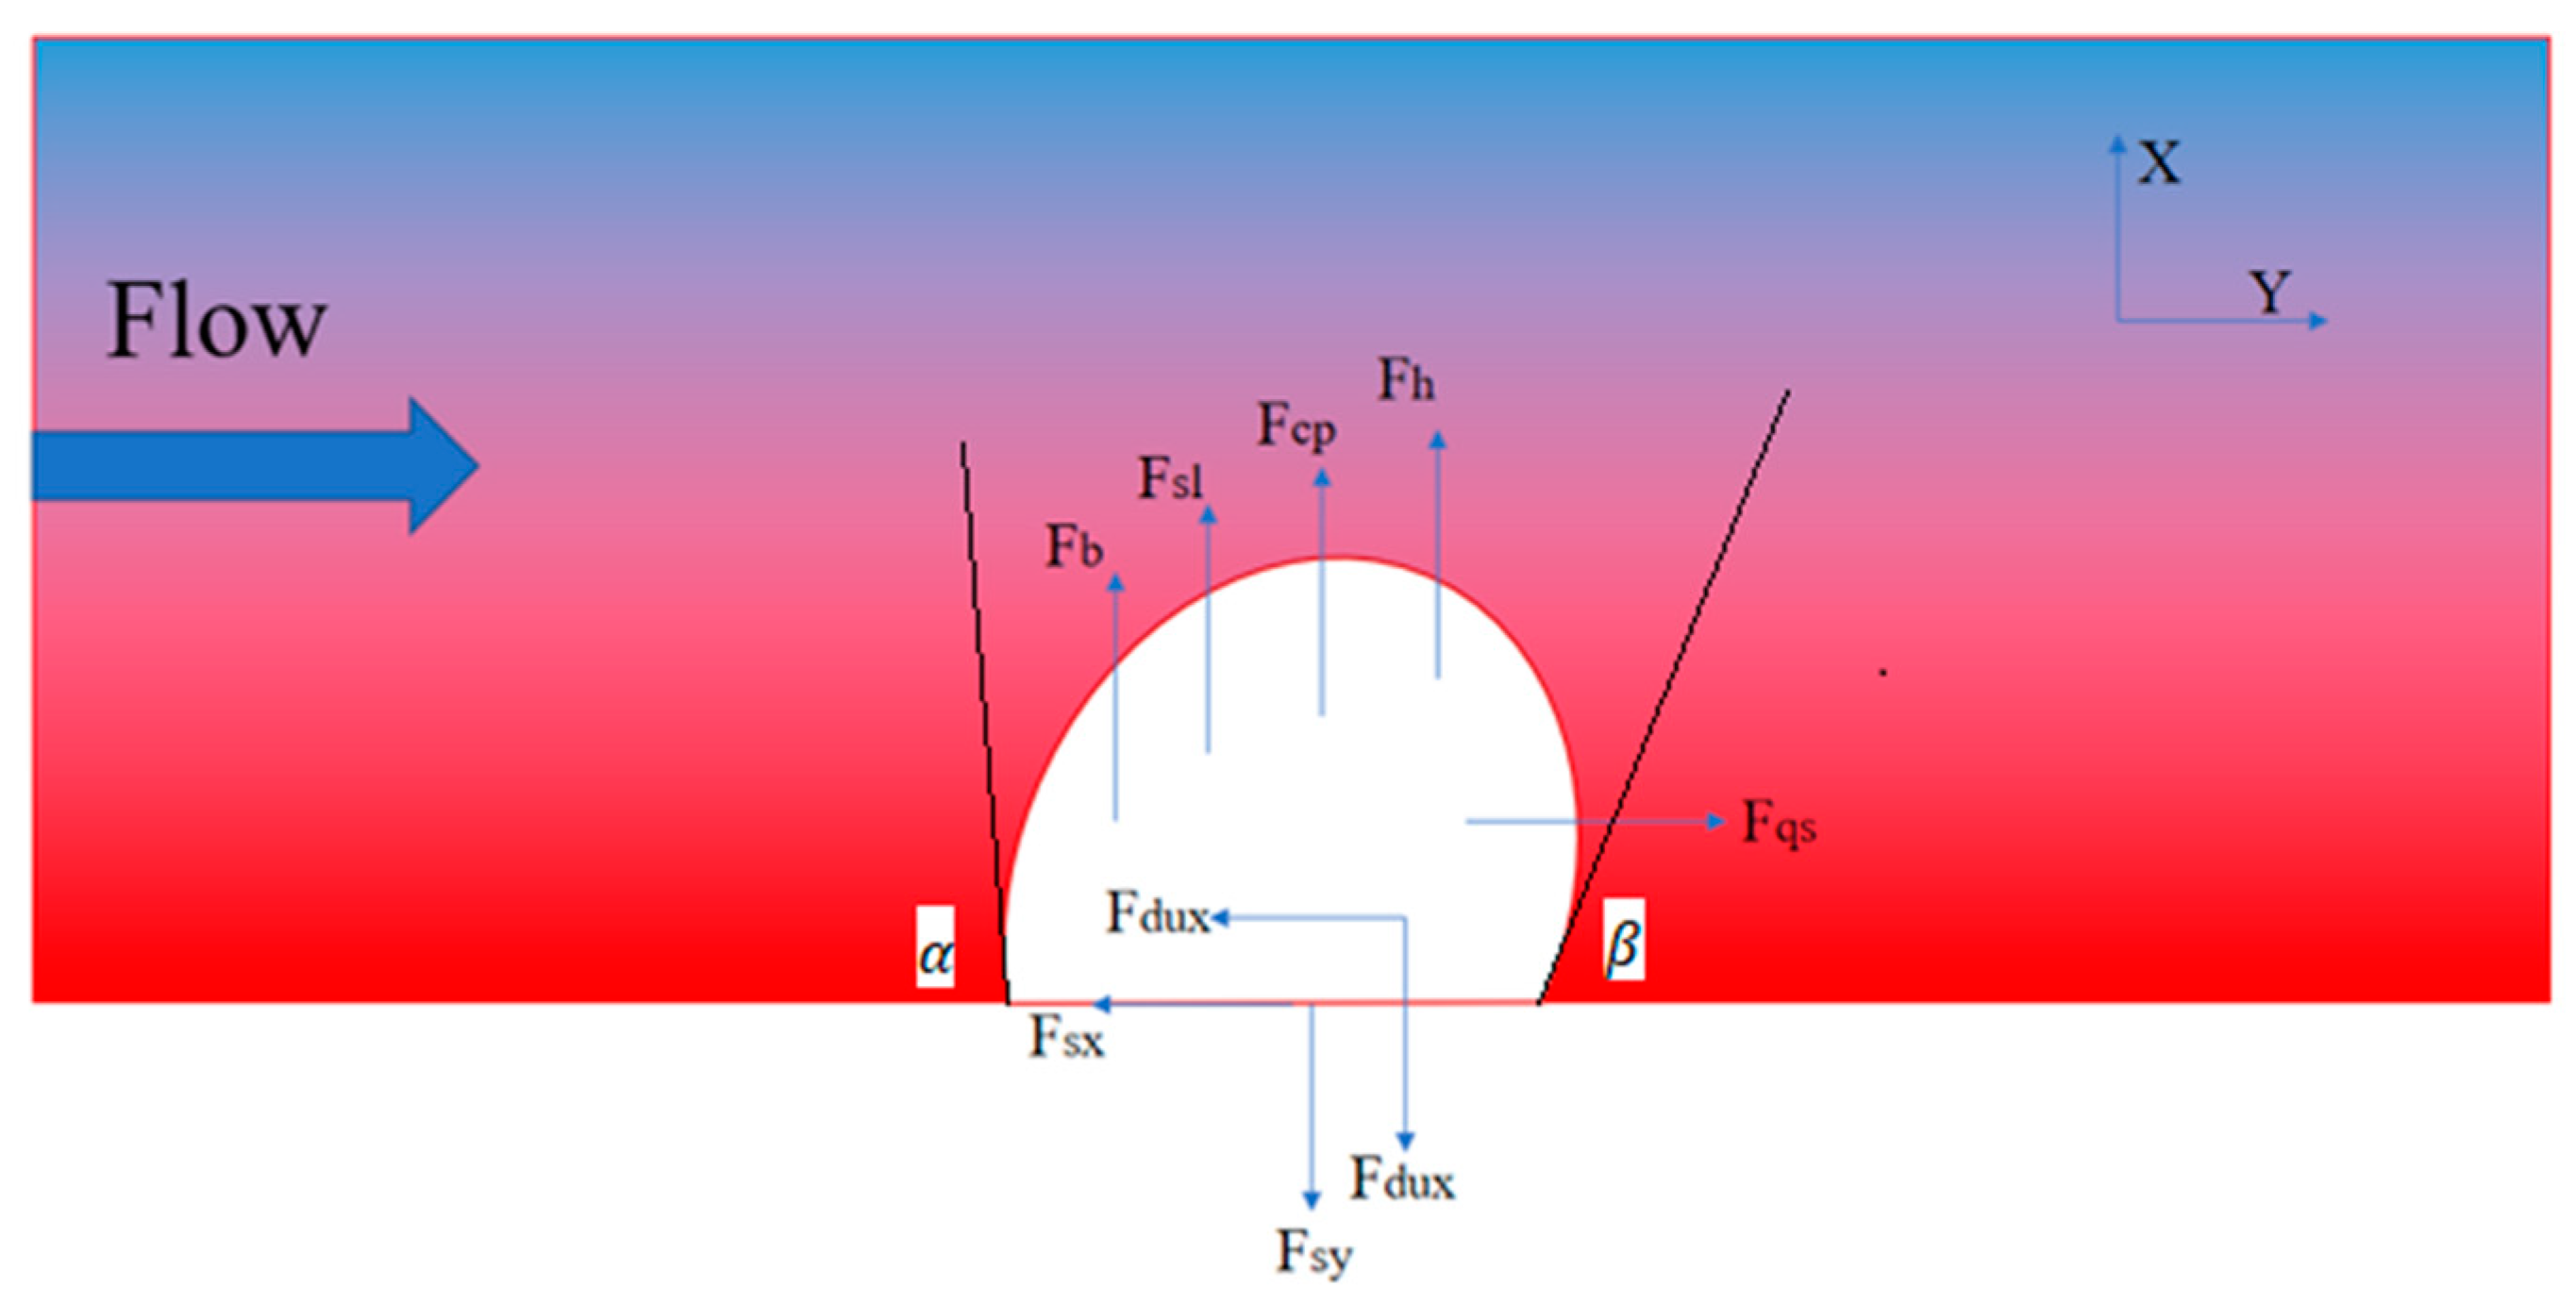
2. The Bubble Sliding Model

Klausner et al. [12] built the stationary bubble growth model by using a force balance approach, which could predict the bubble size, particularly when the bubble departed from the nucleation sites. Yoo et al. [25] developed the bubble growth model for all directions of the channel. The forces acting on the bubble is shown in Figure 1, including surface tension Fs, shear lift force Fsl, hydrodynamic pressure force Fhp, contact pressure force Fcp, growth force Fdu, quasi-steady drag force Fqs and buoyancy force Fb. These forces are divided into flow direction and are perpendicular to the flow direction in a horizontal tube; the sum of forces equations is given as follows:
F x = F s x + F d u + F q s
F y = F s y + F y + F b + F s l + F h p + F c p
Ren et al. [18] developed the bubble growth model based on work by Klausner et al. [12], which focused on the construction of the bubble sliding model after the bubble left the nucleation site. The force balance model of bubble departure from the heating wall after sliding was proposed as:
F x = F q s
F y = F s l + F d u y
The onset of sliding is defined by the horizontal force balance breaks, and the bubble departs from the heating wall when the radial force balance breaks. According to the above analysis equations, the bubble sliding model is built on the basis of the model of Klausner et al. [12]; the sum of forces equations is given as follows:
F x = F s x + F d u + F q s F x > 0
F y = F s y + F y + F b + F s l + F h p + F c p F x = 0   or   F x < 0
In research on the bubble sliding of R134a, the surface tension was considered in the numerical model, as well as the shear lift force and quasi-steady drag force. The shear lift force and quasi-steady drag force have significant effect on the bubble sliding process, because shear lift force and quasi-steady drag force are related to the velocity and affect the motion of the bubble. Considering the gravity and the effect of bubble growth, the buoyancy force cannot be ignored. In addition, the pressure and shape change are not discussed, so the contact pressure, hydrodynamic pressure and growth force are not investigated in this paper. Therefore, the surface tension and shear lift force, quasi-steady drag force and buoyancy force are investigated to research the details of bubble sliding dynamics. Referring to the research of Klausner et al. [12], Table 1 gives the expression of the above force.
Considering that the bubbles not regular spheres, the departure diameter is calculated by equivalent departure diameter [26], and the equation is:
D = ( A B ) 1 2
where A and B are the bubble width and height.

3. Numerical Methods
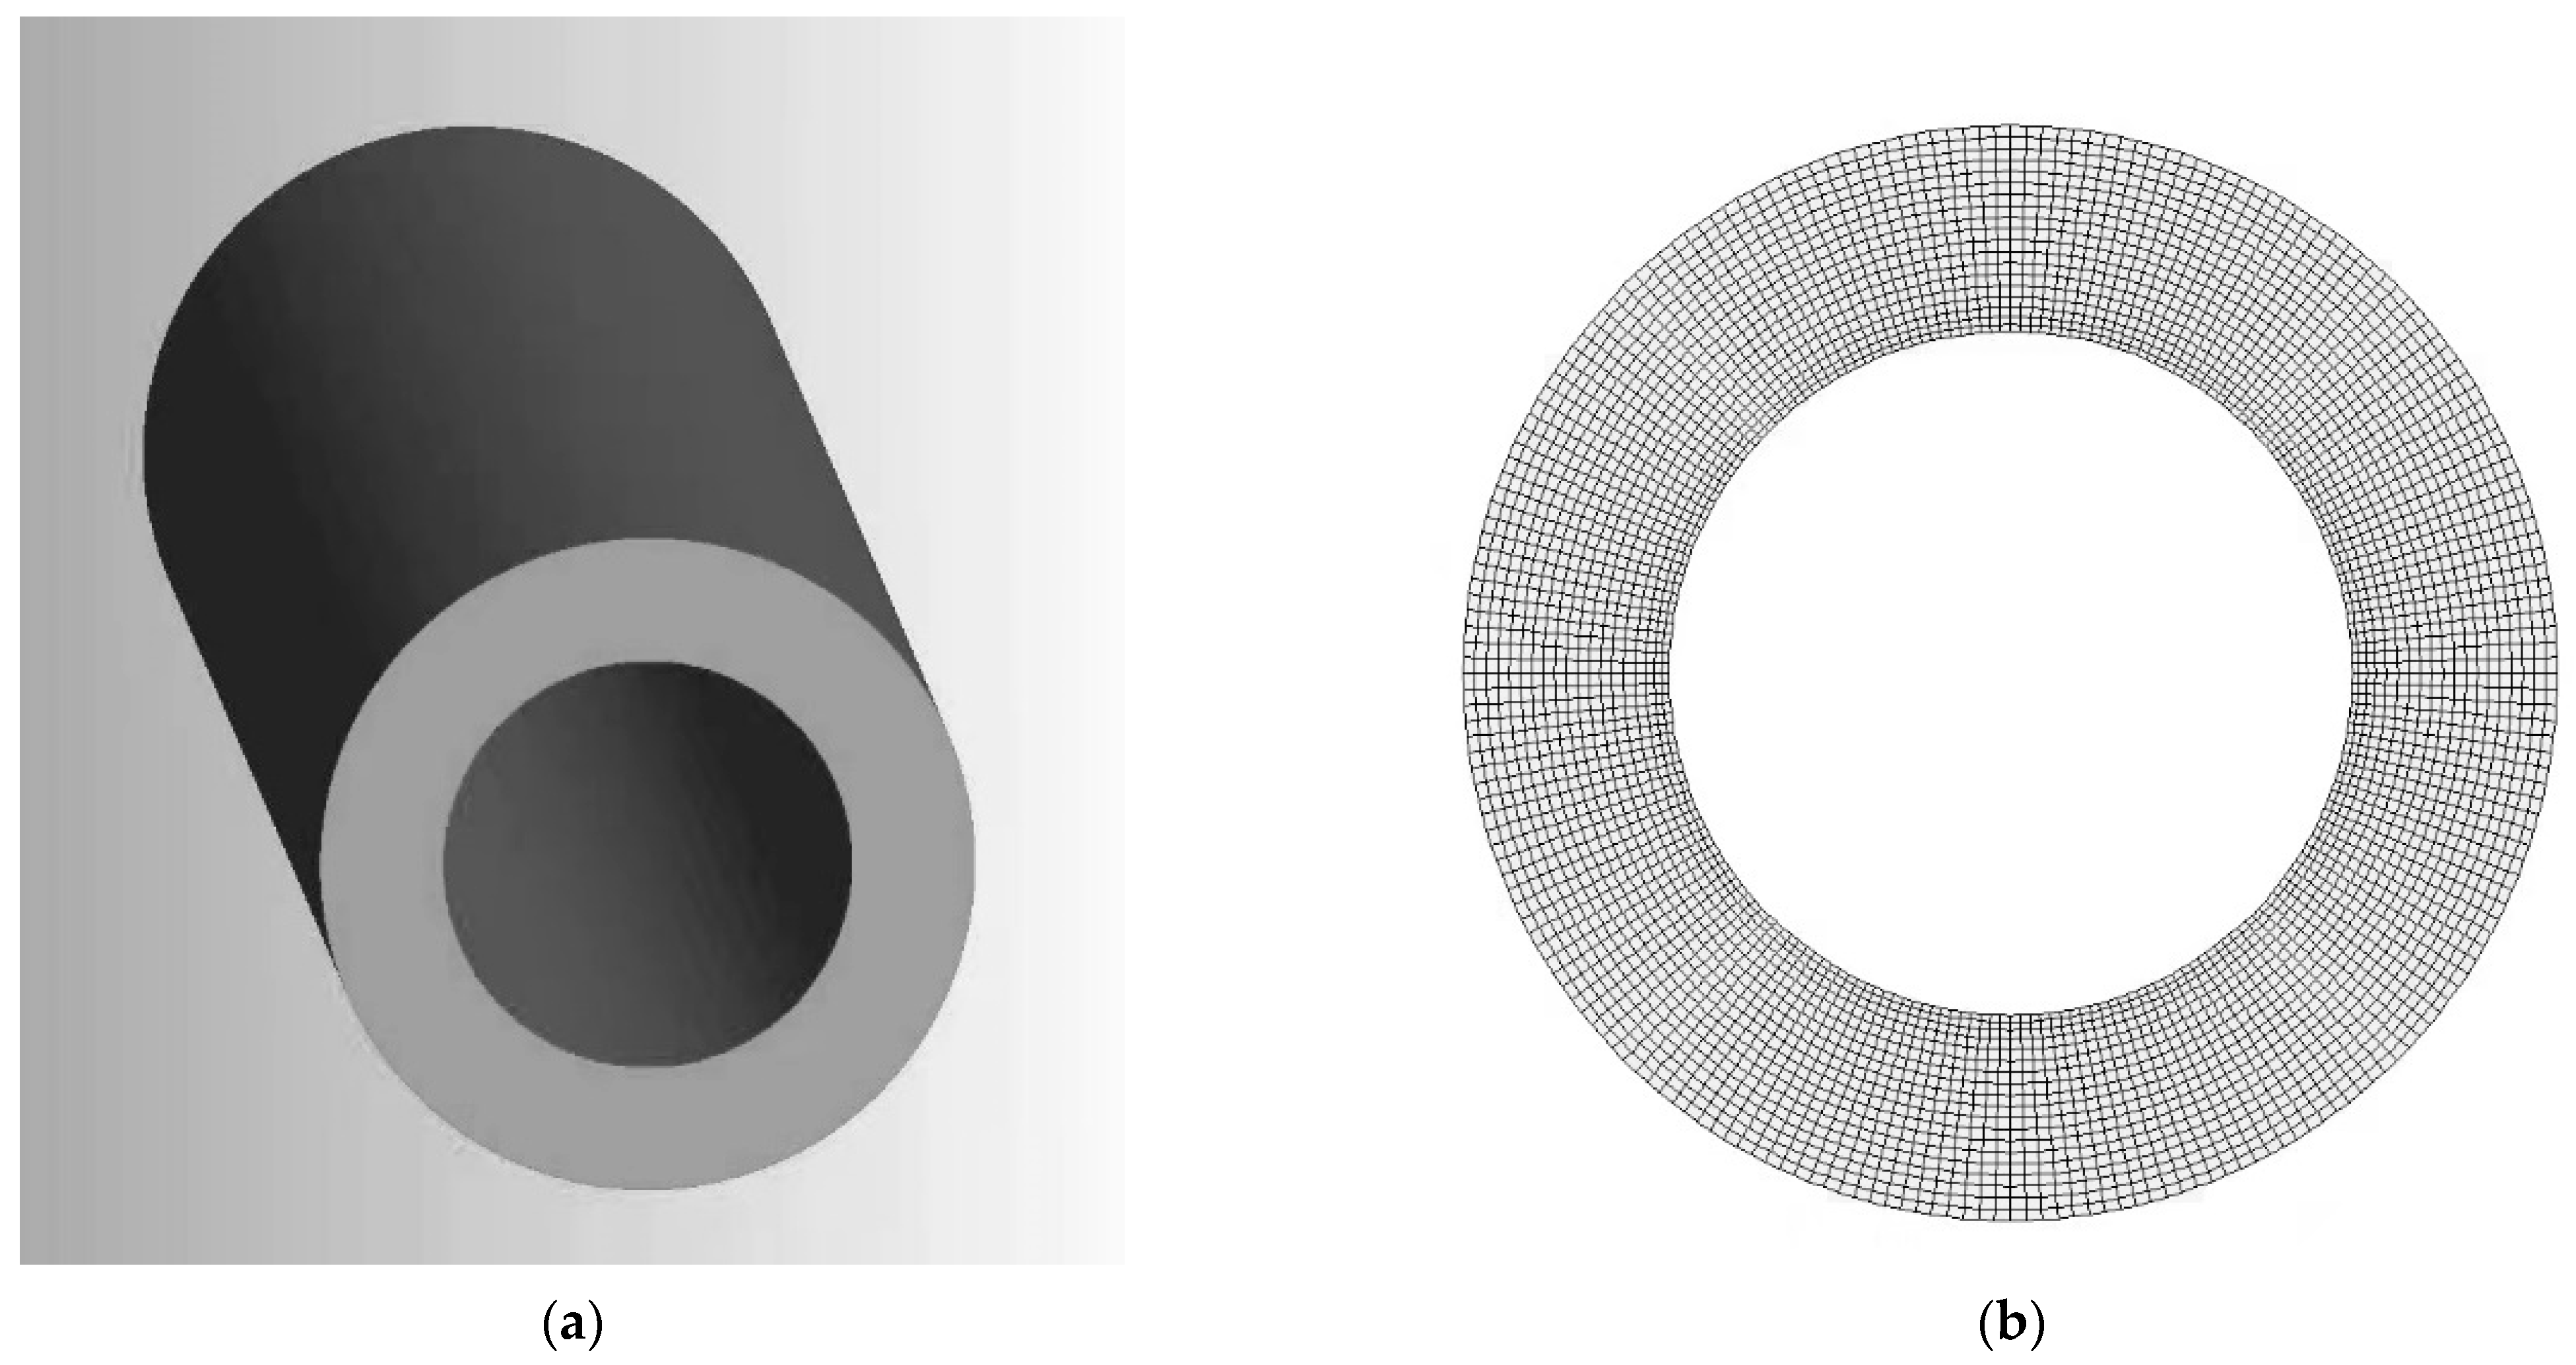
3.1. Mesh

The O-grid mesh was generated for the simulation by using the software ICEM. Figure 2a,b present the geometric model and inlet mesh. The geometric model was specifically a simplified three-dimensional horizontal tube, the part boundary condition was set in ICEM and the detail is shown in Table 2. The simulation adopted the O-grid mesh to ensure the stability of the simulation [27]. Moreover, the boundary layer mesh was refined and the height of the first layer mesh was selected as 0.1 mm according to the bubble departure diameter of R134a as shown in Figure 2b. Finally, considering the saving of computing resources, the total number of hexahedral meshes generated was 3,073,896.

3.2. Governing Equations

The numerical simulation was performed using the VOF model, level set method and Lee phase change model. Further, the SST k ω turbulent model was selected due to the turbulence near the wall. Based on the above model construction, the bubble will be observed in subcooled flow boiling. The governing equations are given as the following.
The continuity equation with the VOF [11,28] model:
α v t + · ( u α v ) = m l v ρ v
α l t + · ( u α l ) = m v l ρ l
α l + α v = 1
where u and ρ are the fluid velocity and density, respectively, subscript v and l stand for vapor and liquid phase, mlv stands for mass source from liquid phase to vapor phase, mvl stands for mass source from vapor phase to liquid phase, α represents the volume fraction and the phase is controlled by volume fraction where α = 1 is for liquid phase, α = 0 is for vapor phase and 0 < α < 1 is for vapor–liquid interface.
The momentum equation is shared by two phases with the VOF [11,28] model:
ρ u t + · ( ρ u u ) = p + · [ ( μ + ρ ν t ) ( u + u T ) ] + ρ g + σ ρ κ l α l 0.5 ( ρ l + ρ v )
where p, g, σ , μ, ρ , ν t and κ are the pressure, acceleration of gravity, coefficient of surface tension, mixture viscosity, mixture density, turbulent kinematic viscosity and surface curvature, respectively.
The energy equation is shared by two phases with the VOF [11,28] model:
( ρ c p T ) t + ( u ( ρ c p T + p ) ) = ( ( λ + ρ c p ν t P r t ) T ) + S E
where T, cp and SE are temperature, mixture specific heat capacity and the energy source term, respectively. Meanwhile, λ and P r t represent mixture conductivity and the turbulent Prandtl number.
In Equations (11) and (12), surface curvature κ l , mixture density ρ , mixture viscosity μ, mixture specific heat capacity cp and mixture conductivity λ are as follows [24]:
κ l = α α
ρ = α l ρ l + α v ρ v
μ = α l μ l + α v μ v
c p = α l c p l + α v c p v
λ = α l λ l + α v λ v
The control equation with the level set method [29]:
ϕ t + · ( u ϕ ) = 0
where ϕ is symbolic distance function and the zero iso-surface of ϕ is used to track the vapor–liquid interface.
The definition of symbolic distance function ϕ [29]:
ϕ ( x , t ) =   d ( x , x Ω     ϕ ( x , t ) = 0 ) 0 d ( x , x Ω     ϕ ( x , t ) = 0 ) x R x = x Ω ϕ ( x , t ) = 0 x R
The momentum equation with the level set method [30,31]:
ρ ( ϕ ) u t + ρ ( ϕ ) · ( u u ) = p + μ ( ϕ ) · [ ( u + u T ) ] + ρ ( ϕ ) g + σ κ l e v e l δ ( ϕ ) ϕ
where ρ ( ϕ ) and u ( ϕ ) are density smoothed and viscosity smoothed, respectively, and κ l e v e l stands for curvature and δ ( ϕ ) stands for averages of the Heaviside function.
The heaviside function smoothed H ( ϕ ) [24]:
H ( ϕ ) = 0   1 2 1   1 + ϕ ε + 1 π sin ( π ϕ ε )   if   φ < - ε   if   φ ε   if   φ > ε
where ε is thickness of interface.
In Equation (20), ρ ( ϕ ), u ( ϕ ) , δ ( ϕ ) and κ l e v e l are calculated as follows [24,30,31]:
ρ ( ϕ ) = ρ v + ( ρ l ρ v ) H ( ϕ )
μ ( ϕ ) = μ v + ( μ l μ v ) H ( ϕ )
κ l e v e l = ϕ ϕ
δ ( ϕ ) = d H ( ϕ ) d ϕ
The phase change model with the Lee model [32]:
m l v = η α l ρ l T T s a t T s a t ( i f   T > T s a t )
m v l = η α v ρ v T s a t T T s a t ( i f   T < T s a t )
S E = h m
where η is phase change mass transfer coefficient, Tsat stands for saturation temperature and h stands for latent heat.
The transport equation with the SST k ω model [33]:
ρ k t + ( ρ k u ) = [ ( ν + ν t σ k ) k ] + G k Y k
ρ ω t + ( ρ ω u ) = [ ( ν + ν t σ ω ) ω ] + G ω Y ω + D ω
where k and ω stand for turbulent kinetic energy and turbulent vortex frequency, respectively, σ ω and σ κ stand for reciprocal of effective turbulent Prandtl number of turbulent vortex frequency and turbulent kinetic energy, respectively, and Gk, Gω, Yk, Yω and Dω stand for generation term of turbulent kinetic energy caused by time-average velocity gradient, generation term of turbulent vortex frequency, dissipation term of turbulent kinetic energy, dissipation term of turbulent vortex frequency and cross diffusion term. The specific definition of the above content references the following equations.
In Equations (11), (12), (29) and (30), the turbulent kinematic viscosity ν t is given as follows [33]:
ν t = ρ k 2 ω 1 max [ 1 a * , S F 2 a 1 ω ]
where a 1 = 0.31, a* = 1, S is the strain rate and F 2 refers to [33].
The cell of first layer uses 4 < y + < 20 to ensure that the region is near the heating wall within the buffer region [10]. The equation of y + is given as follows:
y + = y u τ ν
where u τ , y and ν stand for shear velocity, boundary layer length and kinematic viscosity, respectively.

3.3. Simulation Settings

All of the simulation settings were completed in the software Fluent, including materials, boundary conditions and algorithms. The R134-liquid and R134-vapor were named in the materials setting, then the thermophysical properties density, viscosity, specific heat capacity and thermal conductivity were obtained from the software REFPROP 8.0. The specific heat capacity was set by using a piecewise-linear function for the specific heat capacity which varies with temperature in the simulation; other thermophysical properties were set to constant.
The mesh generated by ICEM only set simple boundary conditions. For research purposes, the boundary conditions could be set more completely in Fluent. The inlet velocity, (0.2 to 5 m/s) was used as a parameter to obtain mass flux (0.0305–0.762 kg/s) for the mass flow inlet condition, and the subcooling of 3 K was used as parameter to obtain the inlet temperature 285.15 K when the saturated temperature was 288.15 K. In the simulation, the outlet temperature was assumed to be 287.15 K (if the value conformed to the physical meaning). The inlet and outlet pressures were set to 4.82 atm and 4.85 atm, respectively. The outlet pressure was greater than the inlet pressure due to the effect of bubbles. The closer the set pressure is to the actual pressure, the fewer steps it will take to iterate and the faster the calculation will be. According to the research methods, the inner wall was import as 300 kW/m2 and the outer wall was adiabatic. Therefore, the inner wall and outer wall possessed the heat flux 300 kW/m2 and 0 kW/m2 based on the wall boundary condition, and no-sliding was adopted for the shear condition. In addition, the smooth tube was achieved by a roughness of 0 mm and a roughness constant of 0.5 at a contact angle of 17° with the wall. The specific flow rate and flow rate changes are shown in Table 3. The thermophysical parameters of R134a in this study are shown in Table 4.
The discretization and solution of control equations were completed by algorithm settings. The algorithms including PISO for pressure-velocity couple, Green–Gauss node-based for spatial discretization and PRESTO! for pressure. The above algorithm had the advantages of being stable, advanced and accurate. It was enough to use the first-order upwind scheme to interpolate the transient formulation k ω equations, while the second-order upwind scheme was used to ensure the accuracy of other equations. In addition, setting of the bubble was generated under the action of surface tension in the console. Finally, finished calculation settings included saving the data file every 10 s for time steps, 5e−5 s for time steps and 2000 s for the number of time steps. After testing, a simulation case took 24 h to complete, occupying 229 GB of memory. The simulation used 5 TB of memory and 48 threads of computer processing power.

4. Results and Discussion

The numerical method was applied to research bubble sliding in subcooled flow boiling. After a series of simulations, the bubble sliding process was tracked and the data of the bubble sliding process were collected. Further, the bubble velocity, bubble departure diameter, sliding distance and dynamics of multiple bubbles were studied during the sliding process in subcooled flow boiling. The simulation was at varying inlet velocities of 0.2 to 5 m/s, and the inlet subcooling and heat flux remained constant at Tsub = 3 K and q = 0.3 MW/m2, respectively.

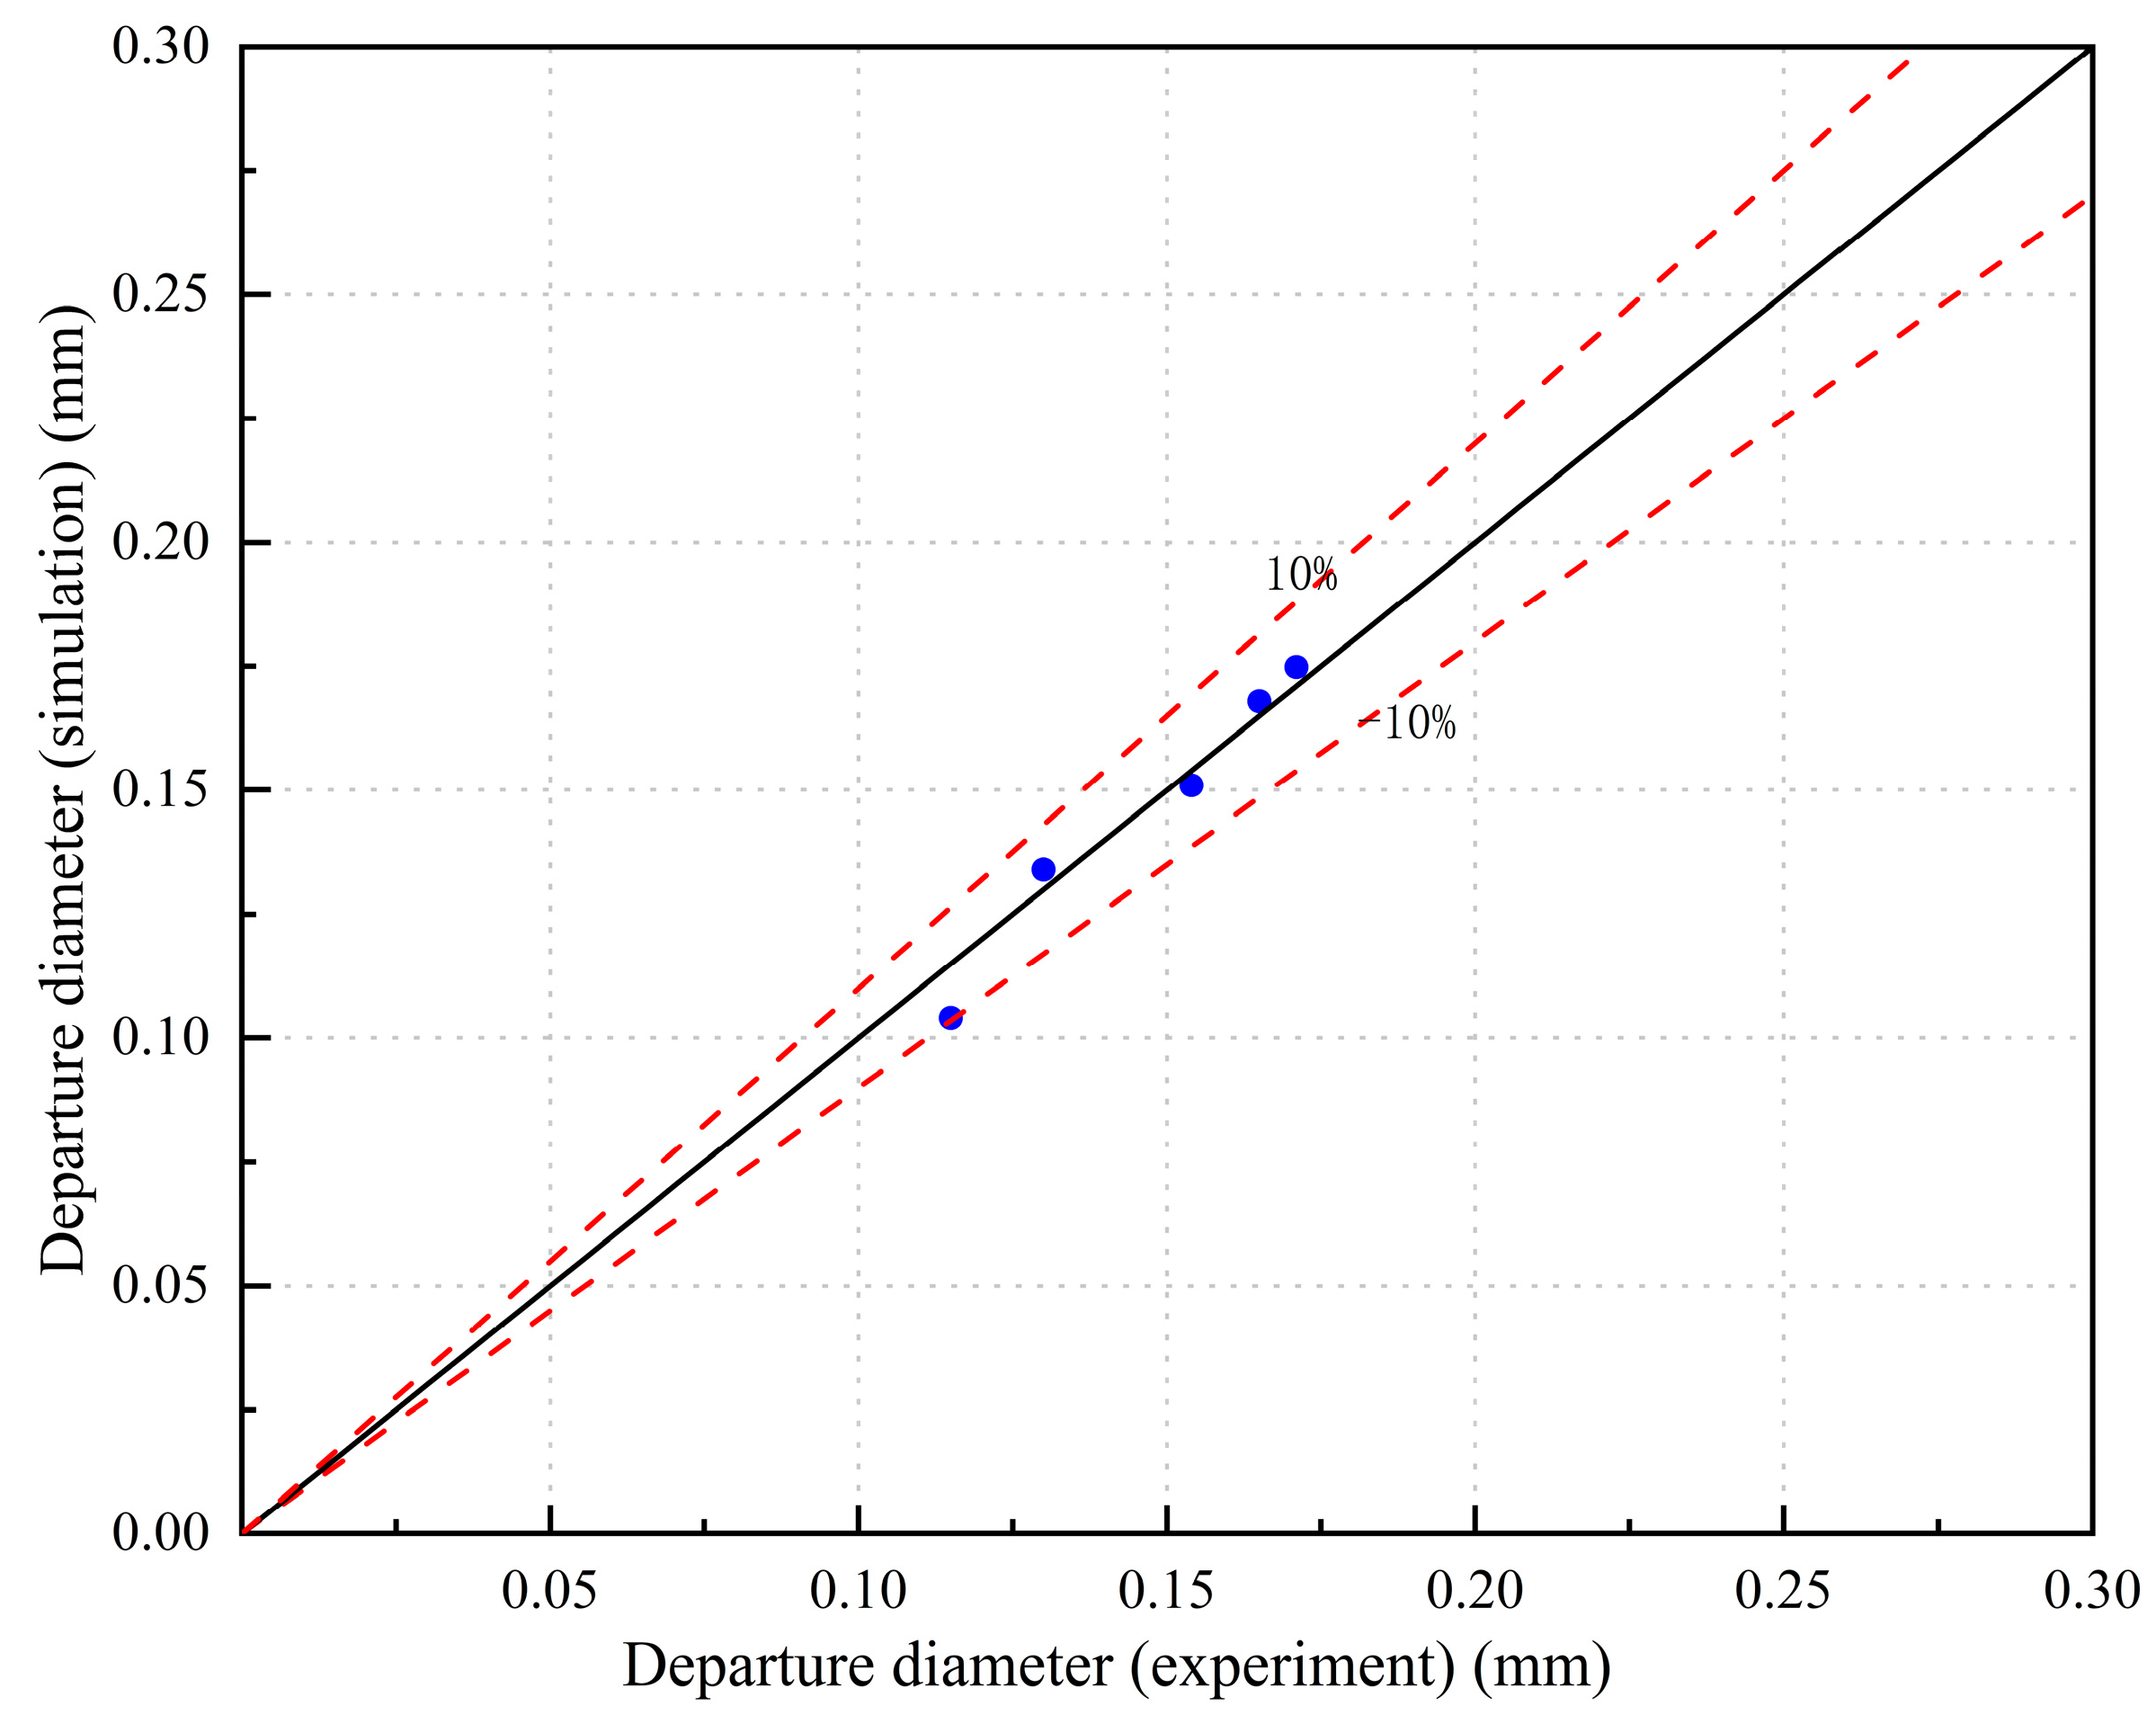
4.1. Validation of Numerical Model

The numerical model was verified by an experiment of Chen et al. [28] in a study on bubble sliding characteristics and dynamics of R134a during the subcooled flow boiling flow in a narrow gap. Figure 2 shows the comparison of departure diameter between simulation and experimental approaches under the conditions of 0.4 m/s inlet velocity, 3 K inlet subcooling (a saturated temperature of 288.15 K), 1 mm gap and R134a fluid. After simulation, the corresponding bubble departure diameters at different heat fluxes were obtained. From Figure 3, the deviation between the experimental and simulation approaches can be seen as within 10%; it was indicated that the simulation results had concordance with the experimental results. Consequently, the numerical model was valid for this study.
It is worth mentioning that y + is in the range of 4 to 16 (i.e., it belongs to the buffer region) in the simulation, which met the conditions of the SST k ω model. In the SST k ω model, the viscous and Reynold stresses were significant in the buffer region, so it follows that the bubble growth environment was more realistically simulated.

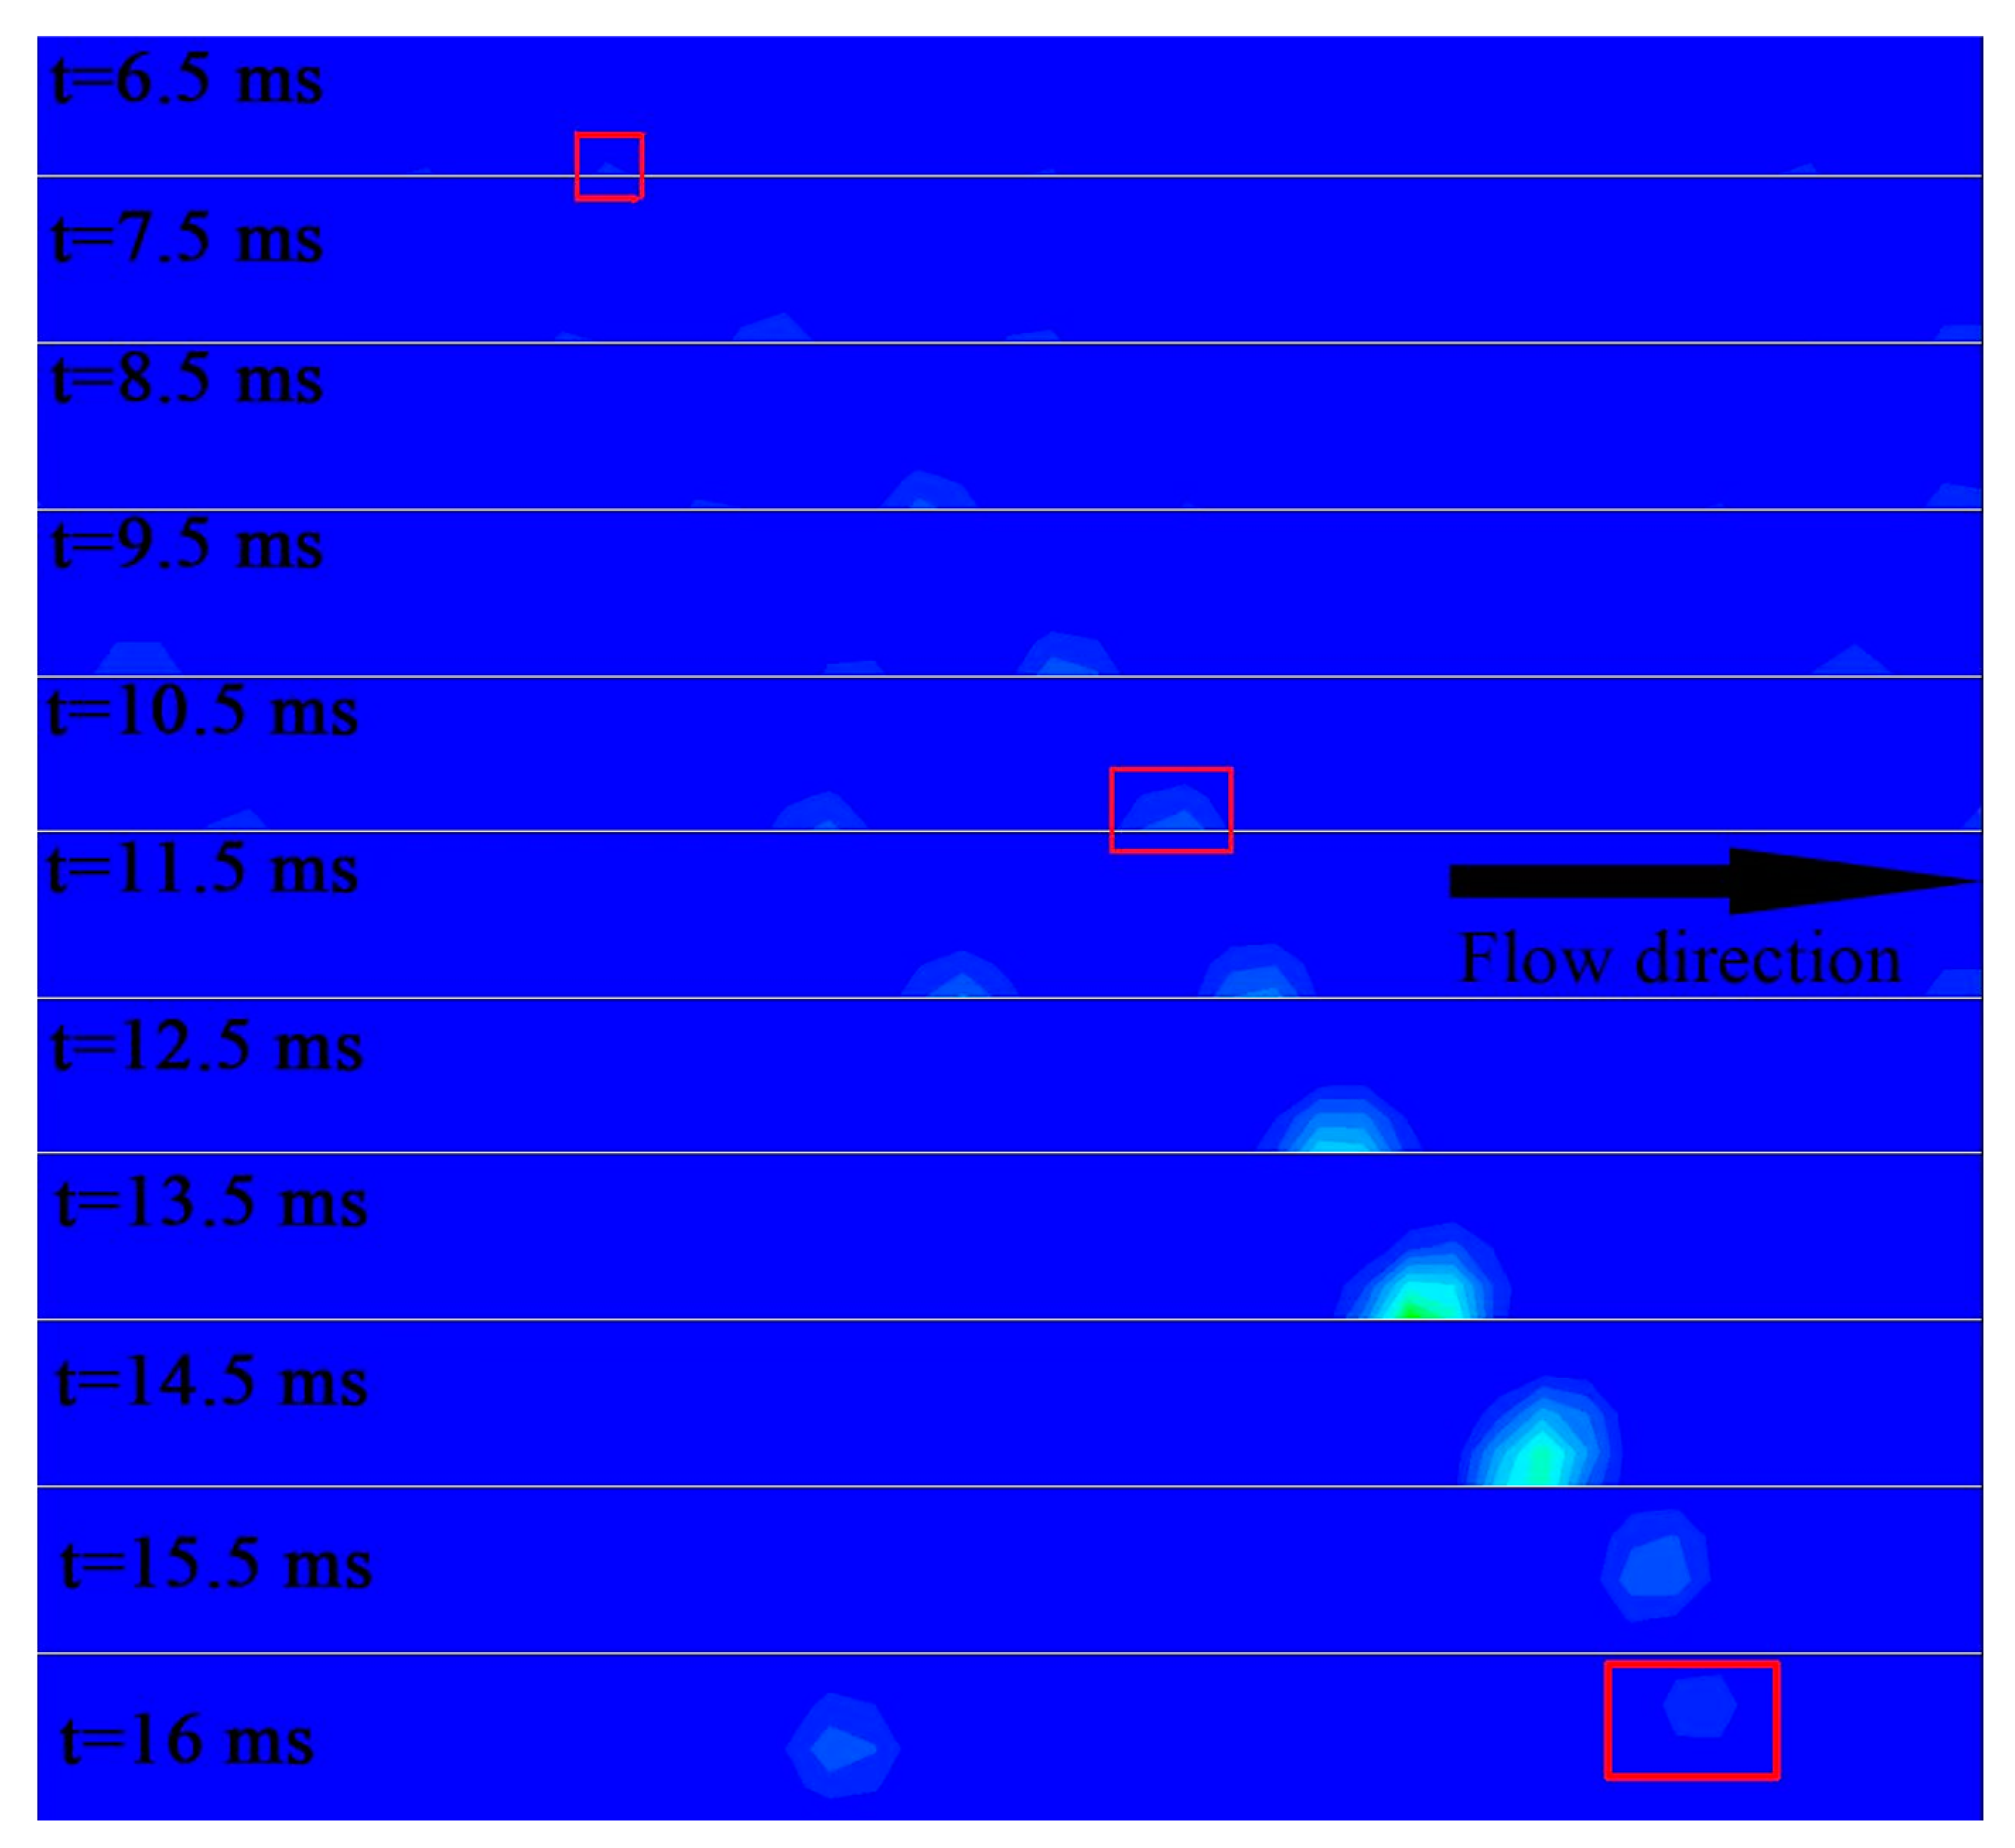
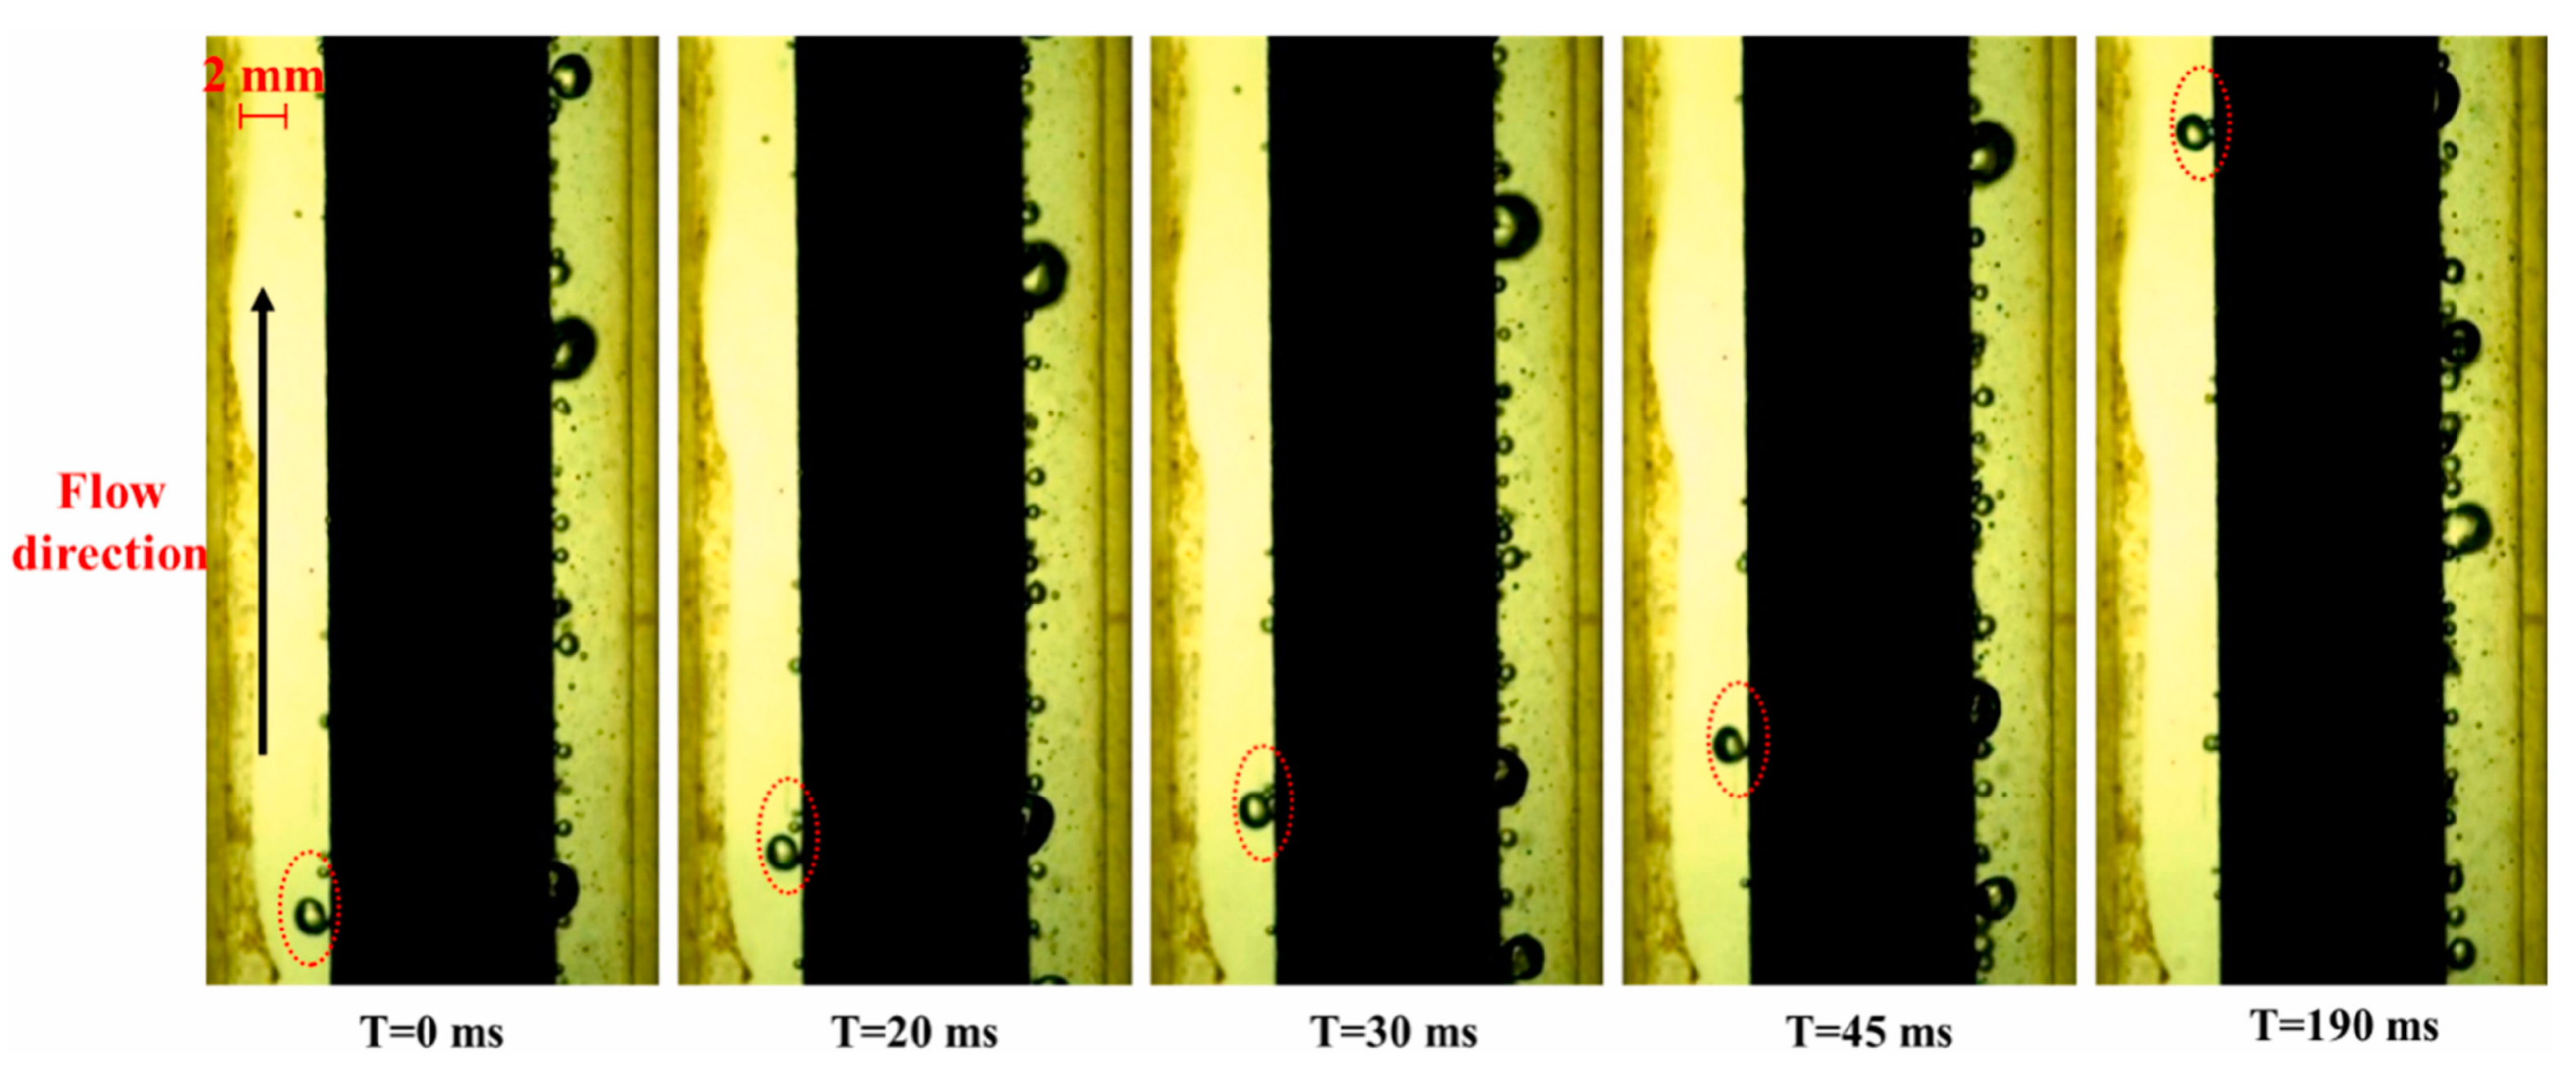
4.2. Observation of Bubble Behavior

In this section, the subcooled flow boiling process of R134a was simulated under the conditions of 300 kW/m2 heat flux, 3 K subcooling and 0.3 m/s inlet velocity. The bubble behavior in the subcooled flow boiling process was observed, as shown in the Figure 4. The bubble undergoes nucleation, sliding growth, departure and annihilation, which is consistent with the bubble behavior observed in the experimental study of subcooled flow boiling by Liu et al. [8] in Figure 5. The bubble nucleates at 6.5 ms, which can be explained as the superheated temperature field and flow field make the bubble overcome the surface tension to start partial nucleation. The bubble slides within 6.5 ms to 14.5 ms. It can be clearly found that the bubble size increases with time and the bubble shape is flat, which indicate that the bubble grows faster along the axial direction than the radial direction due to the superheated environment on both sides of the bubble and the heat provided by the bottom of the bubble. In addition, the bubble sliding is the action of various forces, including surface tension, shear force, buoyancy and drag force. The surface tension hinders the growth of the bubble. The shear force affects the radial bubble motion. The drag force deforms the bubble during the top movement of the bubble, while the buoyancy makes the bubble have a tendency to leave the wall. The shear force, buoyancy and drag force are related to the bubble velocity; therefore, the bubble velocity can effectively characterize the bubble sliding process. The average bubble velocity is 0.25 m/s throughout the entire sliding process, and the bubble sliding distance is 1.76 mm during 8 ms, which indicates that the bubble sliding process is related to the velocity. At the same time, it is inferred that bubble sliding is the main process in subcooled flow boiling. The bubble departs from the heating wall at 14.5 ms and it can be found that the neck formed by the bubble breaks away. As the gas is continuously filled, the buoyancy acting on the bubble increases continuously, and finally the main body of the bubble breaks away from the heating wall. It is found that the bubble departs and produces a part of the gas, which is considered to be a consequence of the boiling induced by the bubble departure in the experimental study. The bubble annihilation occurs at 15.5 ms. After the bubble departs from the wall, it begins to contact with the cold fluid zone above, and the gas inside the bubble begins to condense continuously. Finally, the bubble continues to shrink and eventually annihilate.

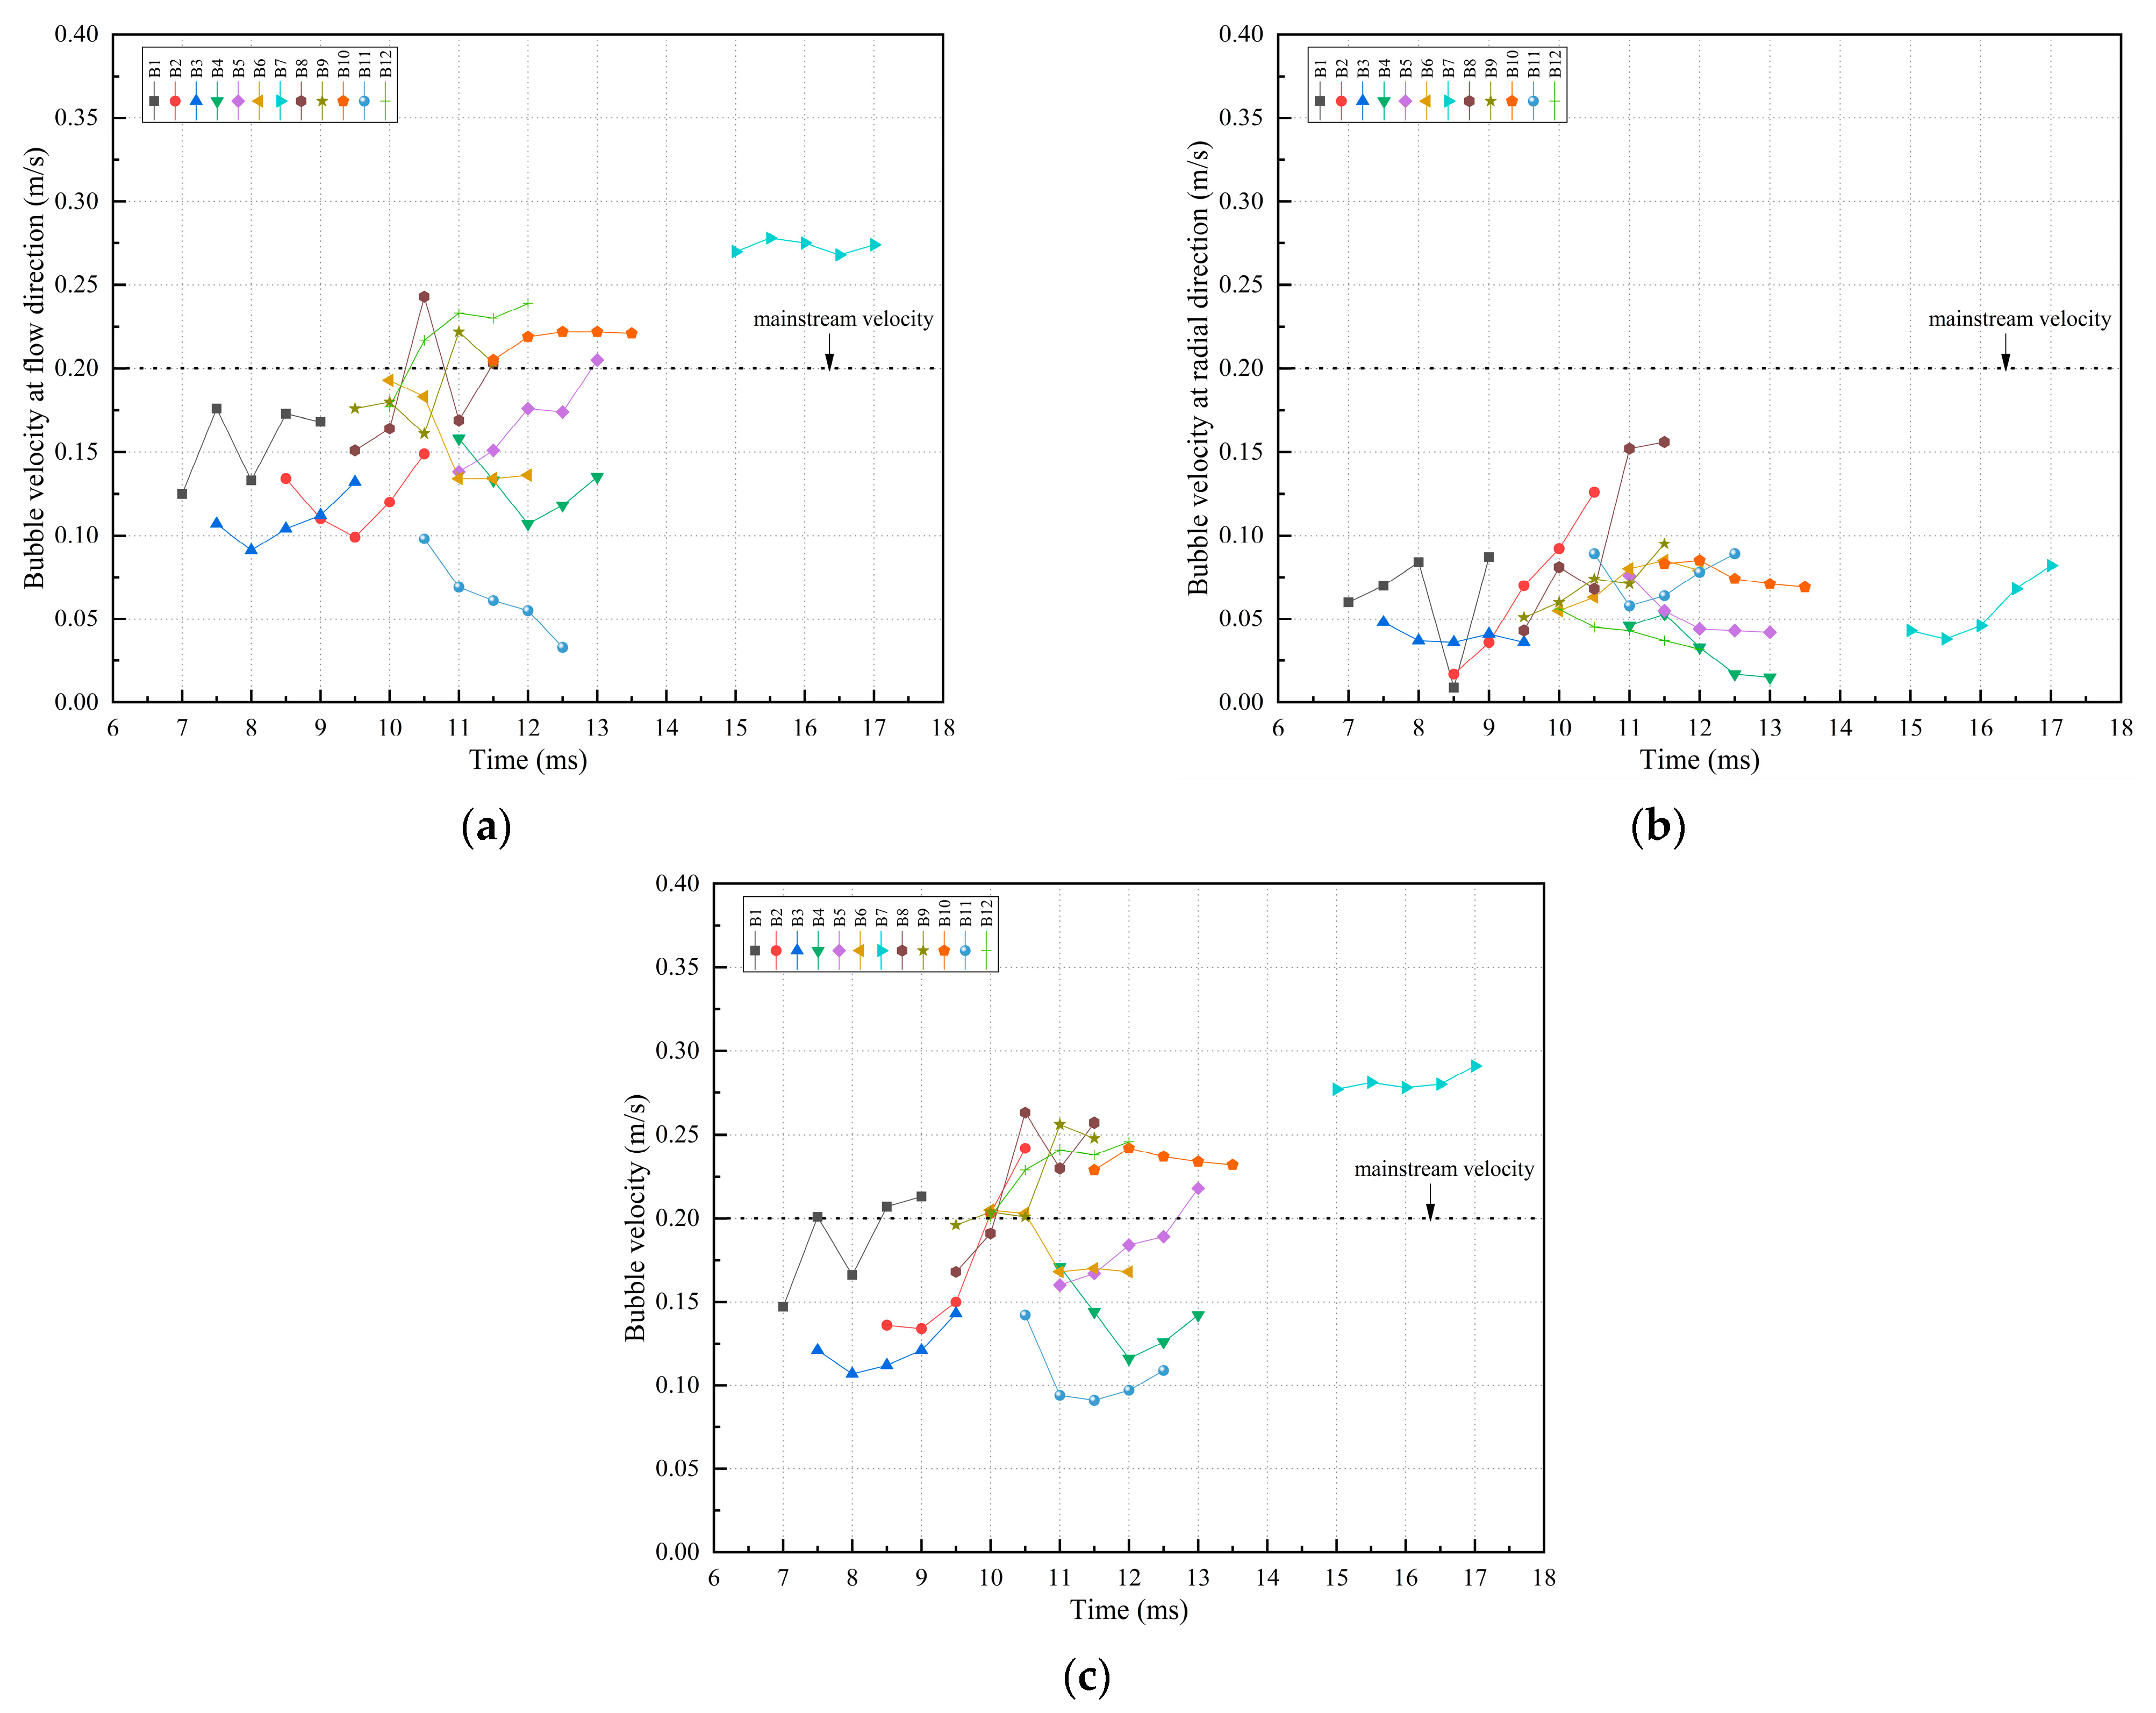
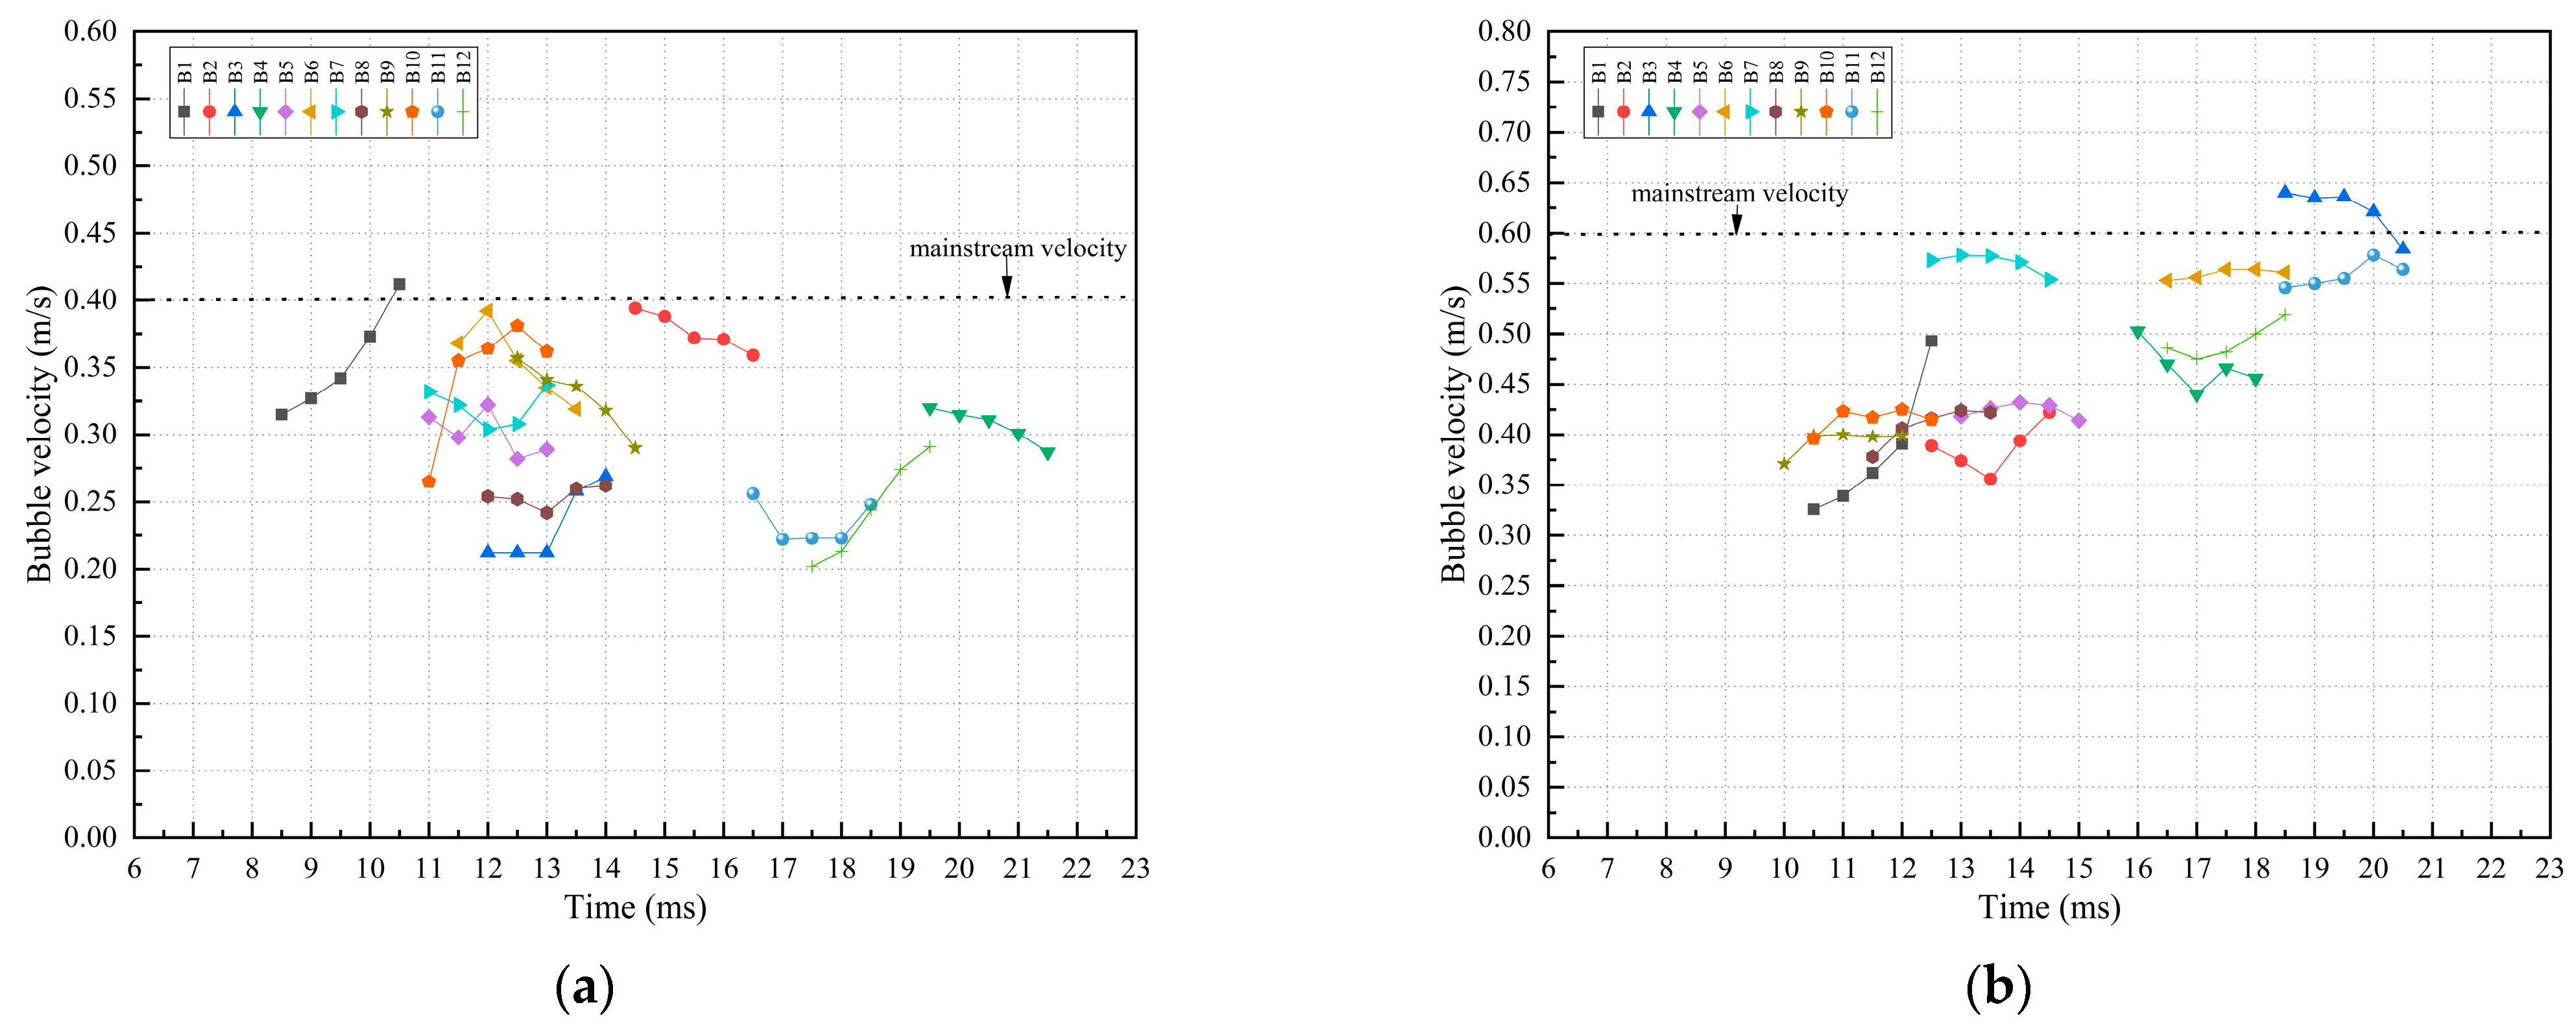
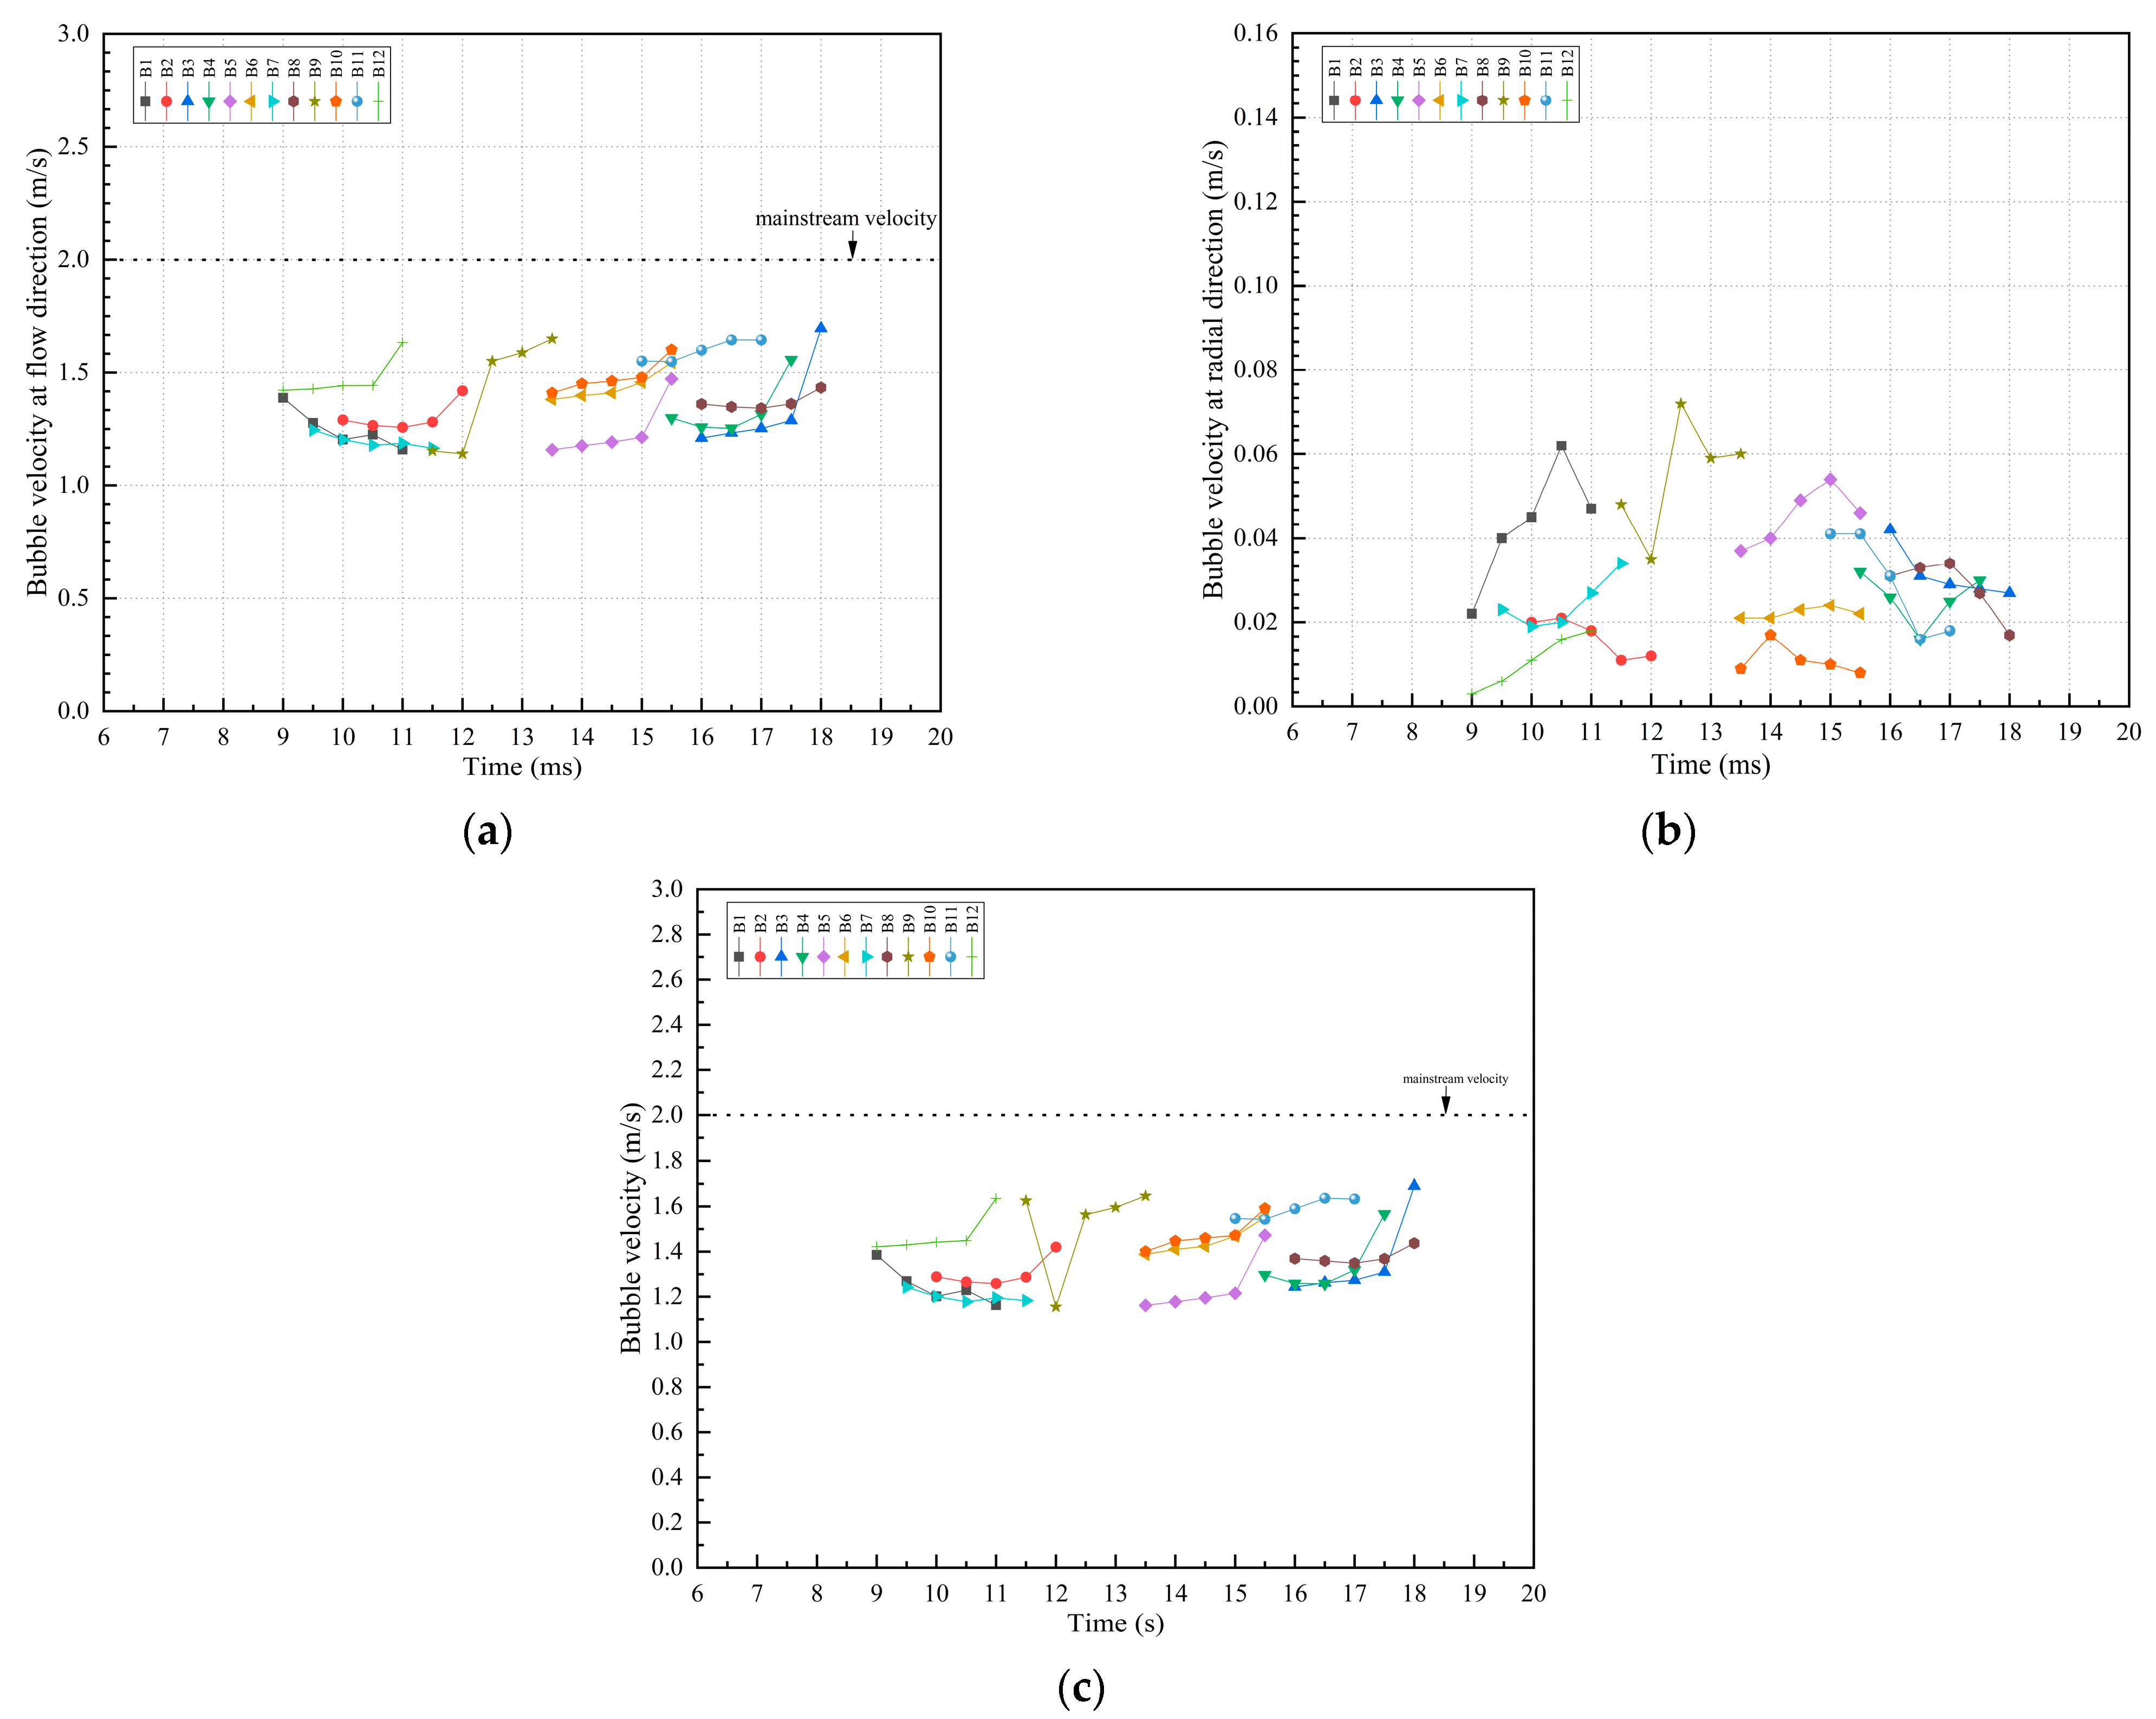
4.3. Analysis of Bubble Velocity

This section investigated the bubble velocities of 12 bubbles during bubble sliding under the conditions of low inlet velocities of 0.2 m/s, 0.4 m/s and 0.6 m/s and high inlet velocities of 2 m/s, 4 m/s and 5 m/s. In addition, the directional velocities of 0.2 m/s and 2 m/s of 12 bubbles were also investigated. Finally, the average bubble velocity was explored. The bubble velocity measured is the bubble centroid velocity in the simulation. Figure 6a,b present variations of directional bubble velocities of 12 bubbles in flow direction and radial direction, respectively, with time during the sliding process at heat flux of 0.3 MW/m2, inlet velocity of 0.2 m/s and inlet subcooling of 3 K. Additionally, the bubble velocities (i.e., the sum of velocity in all directions) of 12 bubbles are shown in Figure 6c. It is observed in Figure 6c that the bubble velocity was in the range of 0.1 to 0.3 m/s when under the 0.2 m/s inlet condition. The mainstream velocity measured in subcooled boiling is the same as the inlet velocity; this means that the maximum bubble velocity is 150% of the mainstream velocity and that the minimum bubble velocity is 50% of the mainstream velocity. The bubble velocity in the flow direction mostly varies from 0.1 to 0.3 m/s, but the bubble velocity at radial direction is mostly below 0.1 m/s. Apparently, the bubble velocity in the flow direction is the most important contribution to bubble velocity. The velocity in the radial direction is small but has a non-negligible effect. Intuitively, the velocity in the flow direction promotes the sliding of the bubble, and the velocity in the radial direction has a certain effect on the departure of the bubble. Meanwhile, the bubble velocities of the 12 bubbles mostly oscillated with time during the sliding process, and there were some bubbles’ velocities increasing or decreasing with time. Both bubble velocity in the radial direction and in the flow direction had the same trend. On the one hand, it is explained that the turbulence caused by the bubble motion enhances the momentum transfer and energy transfer in the flow direction and radial direction, and this turbulence is random. On the other hand, the temperature and velocity field of a bubble during sliding are constantly changing due to the growth of other bubbles. Furthermore, when the inlet velocity increases up to 0.4 m/s and 0.6 m/s, as shown in Figure 7, the bubble velocity varies from 50% to 106.25% of the mainstream velocity under the 0.4 m/s inlet condition and 50% to 108.33% of the mainstream velocity under the 0.6 m/s inlet condition. Compared with the 0.2 m/s inlet condition, the maximum bubble velocity acquired from the mainstream decreases under the conditions at 0.4 m/s and 0.6 m/s. It is also concluded that bubble velocity of 12 bubbles mostly oscillated with time during the sliding process at the low inlet velocity of 0.2 to 0.6 m/s inlet velocity.
As shown in Figure 8, when the inlet velocity increased to 2 m/s, the bubble velocities of the 12 bubbles were in the range of 1.1~1.7 m/s; that is, they obtained 55–85% of the mainstream velocity. This is attributed to the fact that the bubble velocity and bubble velocity in the flow direction changes smoothly and the amplitude decreases during the sliding process. The bubble velocity is large under the condition of 2 m/s inlet velocity, resulting in greater inertia of the bubble, so the bubble amplitude is small. In contrast, whether at low velocity or high velocity, the radial velocity oscillates with time. It was also discovered in Figure 8a,c that, as the bubble slid along the heating, the bubble velocity and velocity in the flow direction mostly increased. Since the initial velocity of the bubble was less than 2 m/s, there was room to increase during the sliding process, and as the bubble has a certain inertia, the velocity increased during the sliding process. Figure 9a presents the variation of the bubble velocities of the 12 bubbles under the condition of 4 m/s inlet velocity. Moreover, the variation of bubble velocities of 12 bubbles under the condition of inlet velocity of 5 m/s is shown in Figure 9b. The 12 bubbles acquired 62.5–87.5% of the mainstream velocity of 4 m/s in Figure 9a, and the value can be seen as 65–90% in Figure 9b. The data indicate that the bubble velocity acquired from mainstream velocity increases with the increasing mainstream velocity from 2 to 5 m/s. From examining Figure 8 and Figure 9, it is also inferred that the initial bubble velocity determines the bubble sliding process due to the bubble velocity increases during sliding, such as the change of sliding distance and departure diameter.
The above discusses the change in the velocity of multiple bubbles during sliding in subcooled flow boiling, and the average bubble velocity was introduced to explore the bubble sliding process. Figure 10 presents the variation of the average bubble velocity in the flow direction and the average in the radial direction with mainstream velocity. As demonstrated in Figure 10, when the mainstream velocity increased from 0.2 to 5 m/s, the average bubble velocity in the flow direction had a significant increasing trend. The average bubble velocity in the radial direction was opposite to the average bubble velocity in the flow direction. It can be inferred that from the radial velocity alone, the bubble is more difficult to depart from the heating wall when the mainstream velocity is higher, because the effect of the flow velocity is much greater than that of the radial velocity. From the simulation results, very few bubbles departed from the entire region. In addition, as shown in Figure 11, it can be found that the most average bubble velocity in the flow direction accounts for about 80% of the mainstream velocity. In the experimental research of Liu et al. [8], it was also found that the bubble velocity was approximately 78% of the mainstream velocity, which is close to the 80% of the above result. However, the working fluid is the deionized water in this experimental study.

4.4. Analysis of Bubble Sliding Distance and Departure Diameter

This section investigated quantities related to bubble growth, including bubble sliding distance and bubble departure diameter. The bubble sliding process is accompanied by heat transfer, resulting in the increasing or decreasing of bubble size. Therefore, bubble sliding distance shows the heat transfer intensity of a bubble on the heating wall. Moreover, the bubble will depart after a certain distance of sliding growth, and the departed bubble will enter the mainstream to condense or flow along the wall to absorb the departure of the wall bubbles and eventually condense. Bubble departure determines not only the magnitude of heat transfer in the sliding stage but also the magnitude of heat transfer after departure. Based on the above analysis, the bubble sliding distance and bubble departure diameter of the 12 bubbles were investigated, as illustrated in Figure 12. The fact from Figure 12a is that the maximum bubble sliding distance reached to about 0.65 mm under the condition of 0.2 m/s inlet velocity and the minimum bubble sliding distance reached to about 0.1 mm. Most of bubble sliding distance was in 0.3~0.5 mm range. This indicates that the bubble has a sliding heat transfer of 0.3 to 0.4 mm. Figure 12b displays the departure diameter at the inlet velocity of 0.2 m/s, and the heat transfer dimension after the bubble departure is known by the bubble departure diameter. The bubble departure diameter was in the range of 0.25 to 0.35 mm when the inlet velocity was up to 0.4 m/s. This means that the bubble had a heat transfer of 0.25 to 0.35 mm after departure. It can be seen that the ratio of the maximum sliding distance to the minimum sliding distance was close to two at velocities from 0.3 to 5 m/s, as is illustrated in Figure 13, and the ratio of the low velocity is higher than the high velocity. It is most noteworthy that at 0.2 m/s, this ratio was much larger than that at other speeds; this is because the flow field where the bubbles were located had a large difference at 0.2 m/s, and some bubbles acquired a larger velocity while others acquired a smaller velocity. Consequently, the bubble can slide a large distance, but it will slide a short distance before departure, so therefore its maximum sliding distance to the minimum sliding distance ratio is large. The ratio reveals that the upper and lower limits of bubble sliding transfer heat at a certain velocity.
Figure 14 exhibits the variation of the average sliding distance and the average bubble departure diameter with inlet velocities of 0.2 to 5 m/s. From Figure 14, with the increasing of the mainstream velocity, the average sliding distance had a significant linear increasing trend, while the average bubble departure diameter increased as the most obvious trend from 0.2 to 0.5 m/s and greatly reduced after 0.6 m/s. It was also found that the bubble departure diameter was about at 0.35 m with the increasing of sliding distance in the high inlet velocities of 2 to 5 m/s. When 0.6 m/s was the critical point, the bubble departure diameter decreased as the inlet velocity was greater than 0.6 m/s, which was due to a significant increase in the sliding distance of the bubble. It can be inferred that the sliding distance is so long that the growth and cooling of the bubble sliding process are stable, and the bubble growth is obvious before the critical point of 0.6 m/s. From the perspective of heat transfer evaluation of high and low velocity, it can be concluded that sliding heat transfer of bubbles at high velocity is much larger than that at low velocity; heat transfer after departure at high velocity is comparable to that at low velocity. Further, it can be inferred that heat transfer performance is outstanding during high velocity. However, considering that fewer bubbles were departing at high velocity, the heat transfer performance was reduced.

4.5. Analysis of Bubble Sliding Dynamics

In this section, the bubble sliding dynamics was explored in subcooled flow boiling. It has been agreed that the bubble sliding and departure are driven by multiple forces, mainly including surface tension, shear lift force, quasi-steady drag force and buoyancy. Surface tension is resistance during bubble sliding. Furthermore, other forces are opposite to surface tension. Figure 15 displays the variation of forces on bubble B1 and bubble velocity with time during the sliding process with heat flux of 0.3 MW/m2, inlet velocity of 0.2 m/s and inlet subcooling of 3 K. The surface tension is the largest of the four forces during sliding, the lower level is equivalent to the buoyancy and drag force, and the shear lift is the smallest. Moreover, the surface tension, shear lift force and quasi-steady drag force fluctuate during sliding, which might be caused by the fluctuation of bubble velocity. The buoyancy rises steadily, and the reason for that is plainly that the bubble size increases. The above investigations are illustrated in Figure 16. As shown in Figure 16, the variation of surface tension force (a), shear lift force (b), quasi-steady drag force (c) and buoyancy force (d) acted on the 12 bubbles with time during the sliding process with heat flux of 0.3 MW/m2, inlet velocity of 0.2 m/s and inlet subcooling of 3 K. The order of magnitudes of surface tension are between 1 × 10⁻⁷ and 1 × 10⁻⁴, 1 × 10⁻¹¹ and 1 × 10⁻⁸ for shear lift force, 1 × 10⁻⁸ and 1 × 10⁻⁶ for quasi-steady drag force and 1 × 10⁻⁸ and 1 × 10⁻⁷ for buoyancy. Therefore, surface tension dominates the bubble sliding process, followed by buoyancy and drag force.
Compared with 0.2 m/s, at 2 m/s inlet velocity, the forces acting on the bubble changed smoothly and the dominant force changed as confirmed in Figure 17. It was found that the buoyancy was not dependent on the bubble velocity; the other forces were dependent on the bubble velocity. Meanwhile, the drag force played a dominate role in all of the forces. Therefore, it is speculated that the drag force promotes the bubble sliding at high velocity, and promotes bubble sliding for a long distance. Furthermore, Figure 18 exbibits variation of surface tension force (a), shear lift force (b), quasi-steady drag force (c) and buoyancy force (d) acting on the 12 bubbles with time during the sliding process with heat flux of 0.3 MW/m2, inlet velocity of 2 m/s and inlet subcooling of 3 K. Obviously, except for the surface tension, other forces did not oscillate during the sliding process. Forces on bubbles at high velocity were revealed: the order of magnitudes of surface tension are between 1 × 10⁻⁷ and 1 × 10⁻⁵, 1 × 10⁻⁹ and 1 × 10⁻⁷ for shear lift force, 1 × 10⁻⁶ and 1 × 10⁻⁵ for quasi-steady drag force and 1 × 10⁻⁸ and 1 × 10⁻⁷ for buoyancy. It was discovered that the order of magnitudes of surface tension, shear lift force and quasi-steady drag force increase with the increasing of the inlet velocity from 0.2 m/s to 5 m/s. Furthermore, the drag force dominates the bubble sliding process, followed by buoyancy and surface tension. In the research of Ren et al. [18], the surface tension was in the range of 8 × 10⁻⁷ to 1.6 × 10⁻⁶, which was close to the simulated surface tension of the bubble. The main cause is that the surface tension coefficient of R134a is close to that of water.

5. Conclusions

The bubble velocity, bubble sliding distance, bubble departure diameter and bubble sliding dynamics at the inlet velocities of 0.2 to 5 m/s were examined by using the numerical simulation method. There are differences in bubble velocity, bubble sliding distance, bubble departure diameter and bubble sliding dynamics between low inlet velocities of 0.2 to 0.6 m/s and high inlet velocities of 2 to 5 m/s. The conclusions are as follows.
(1)
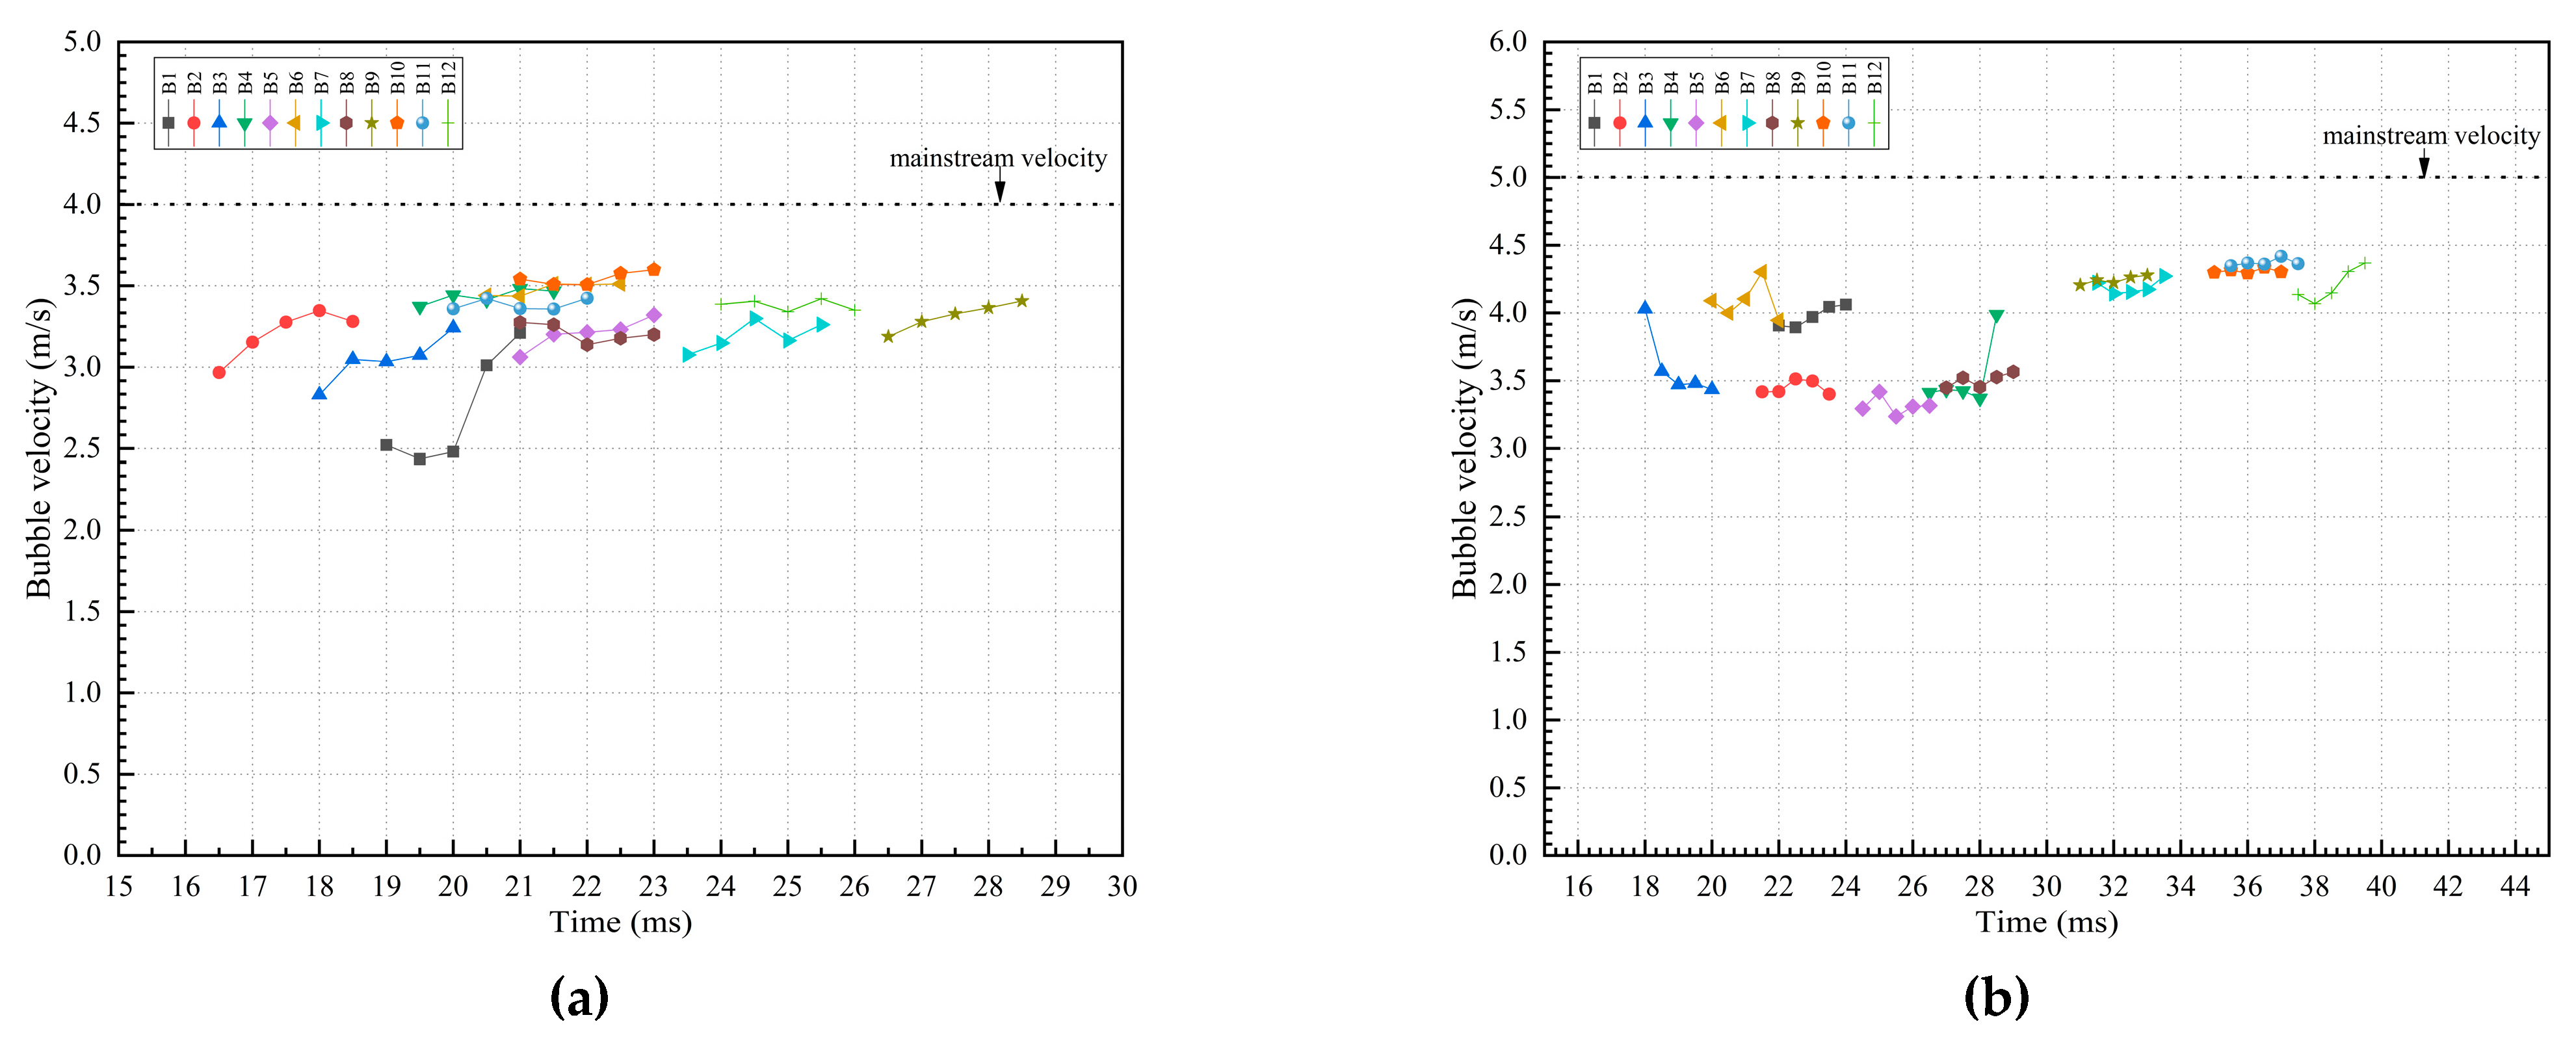
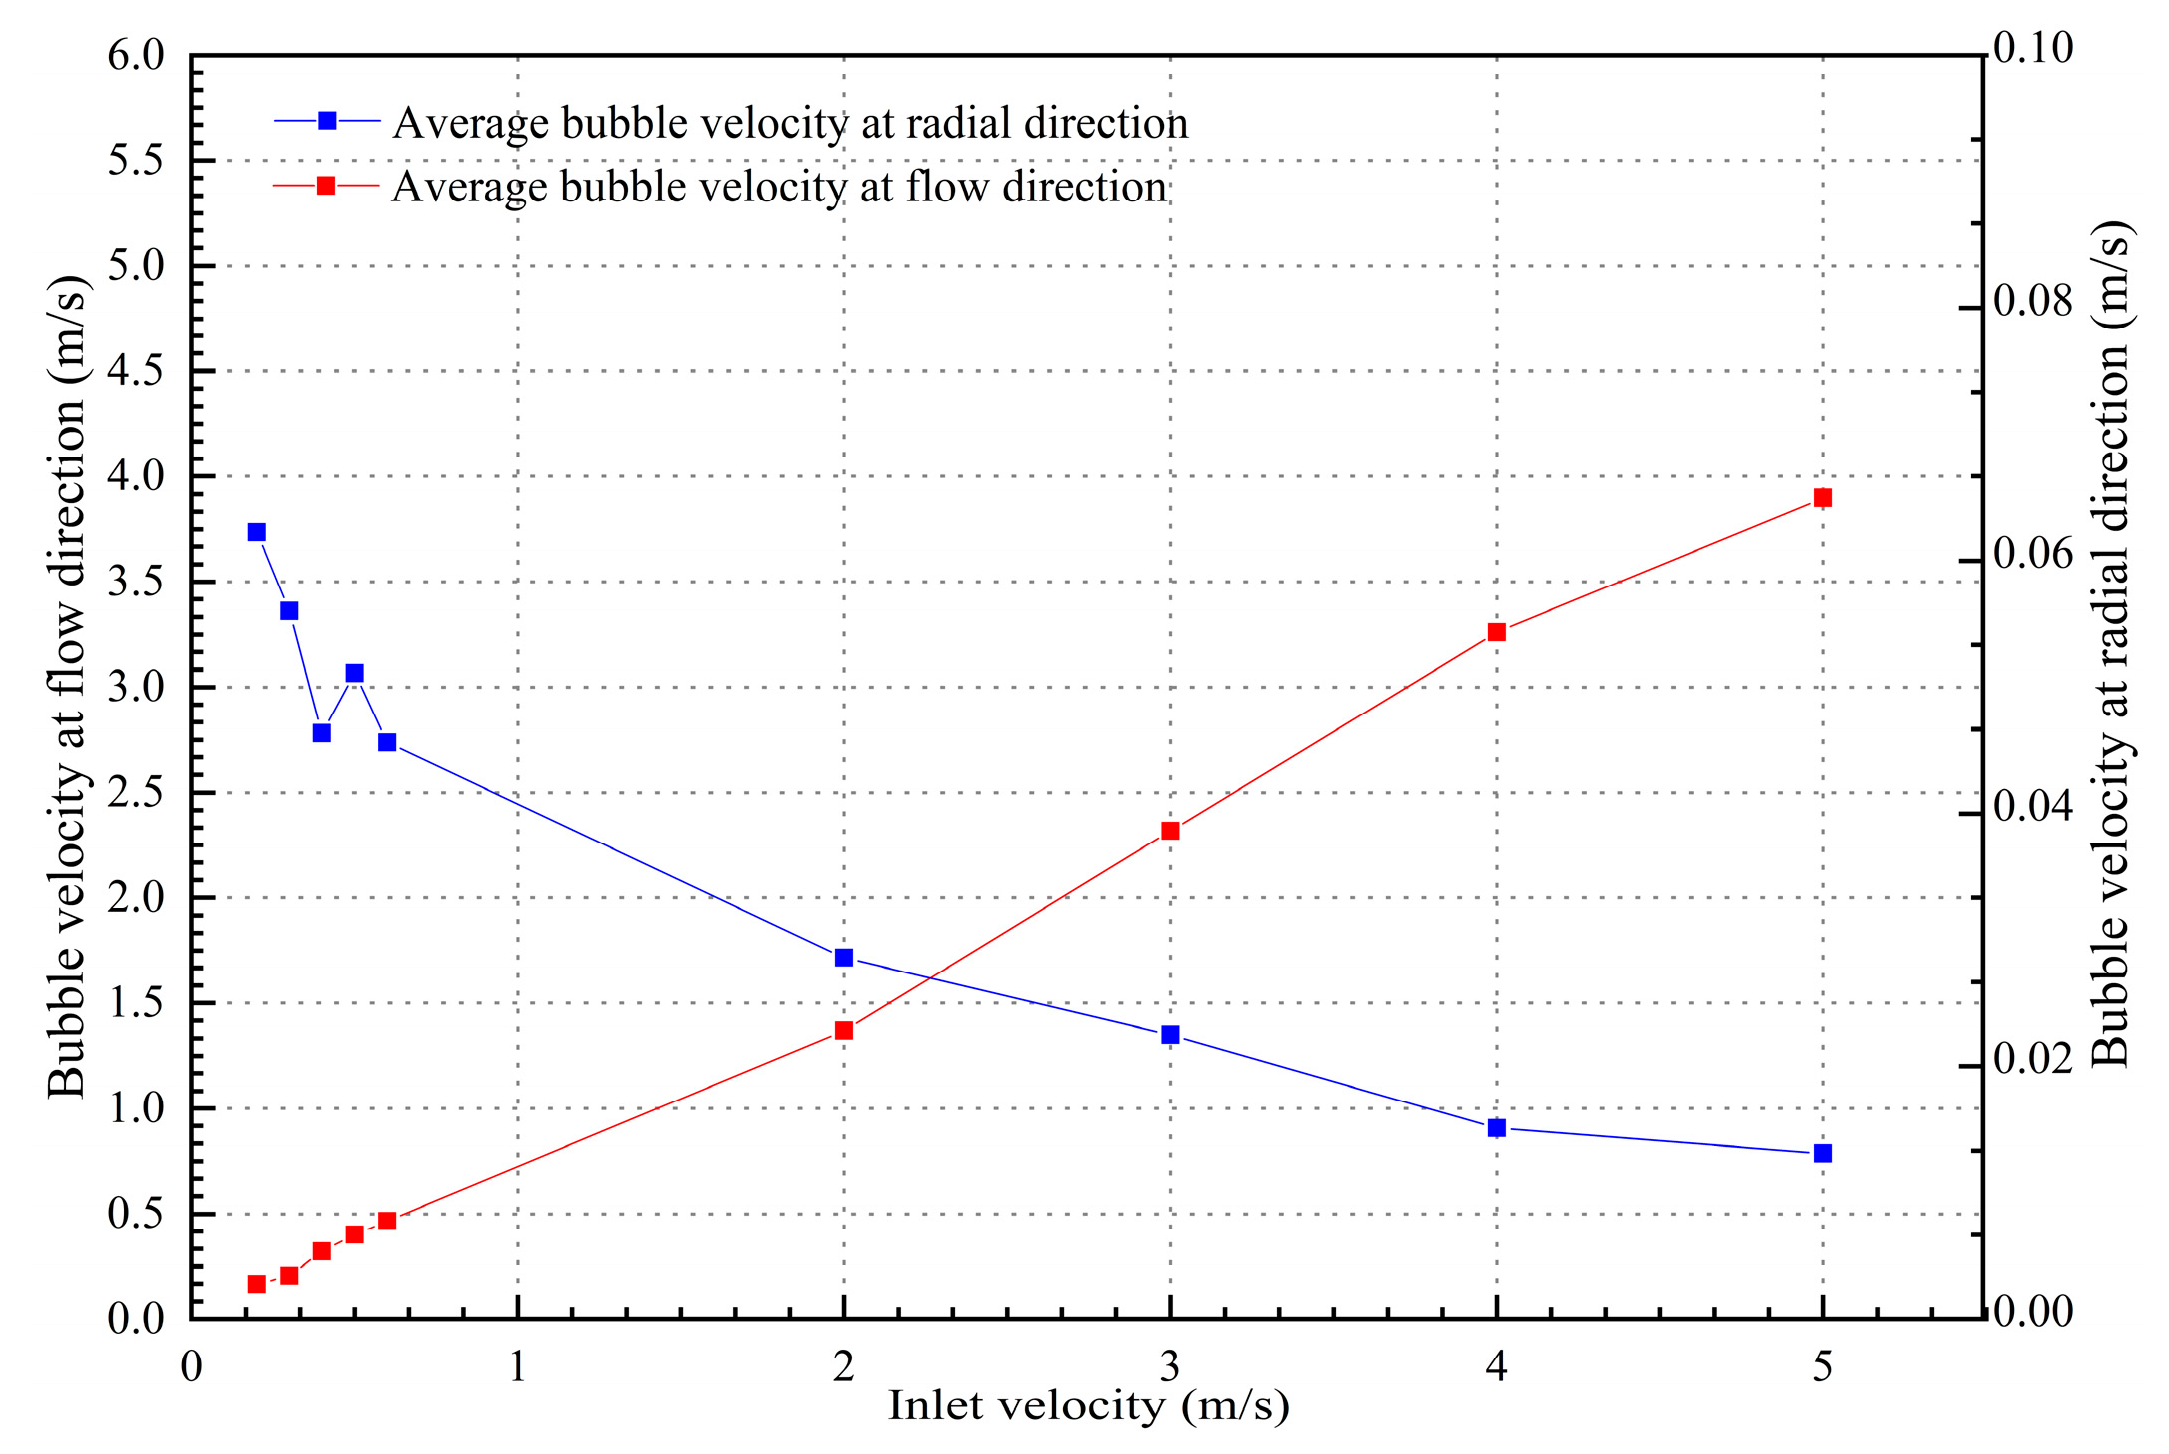
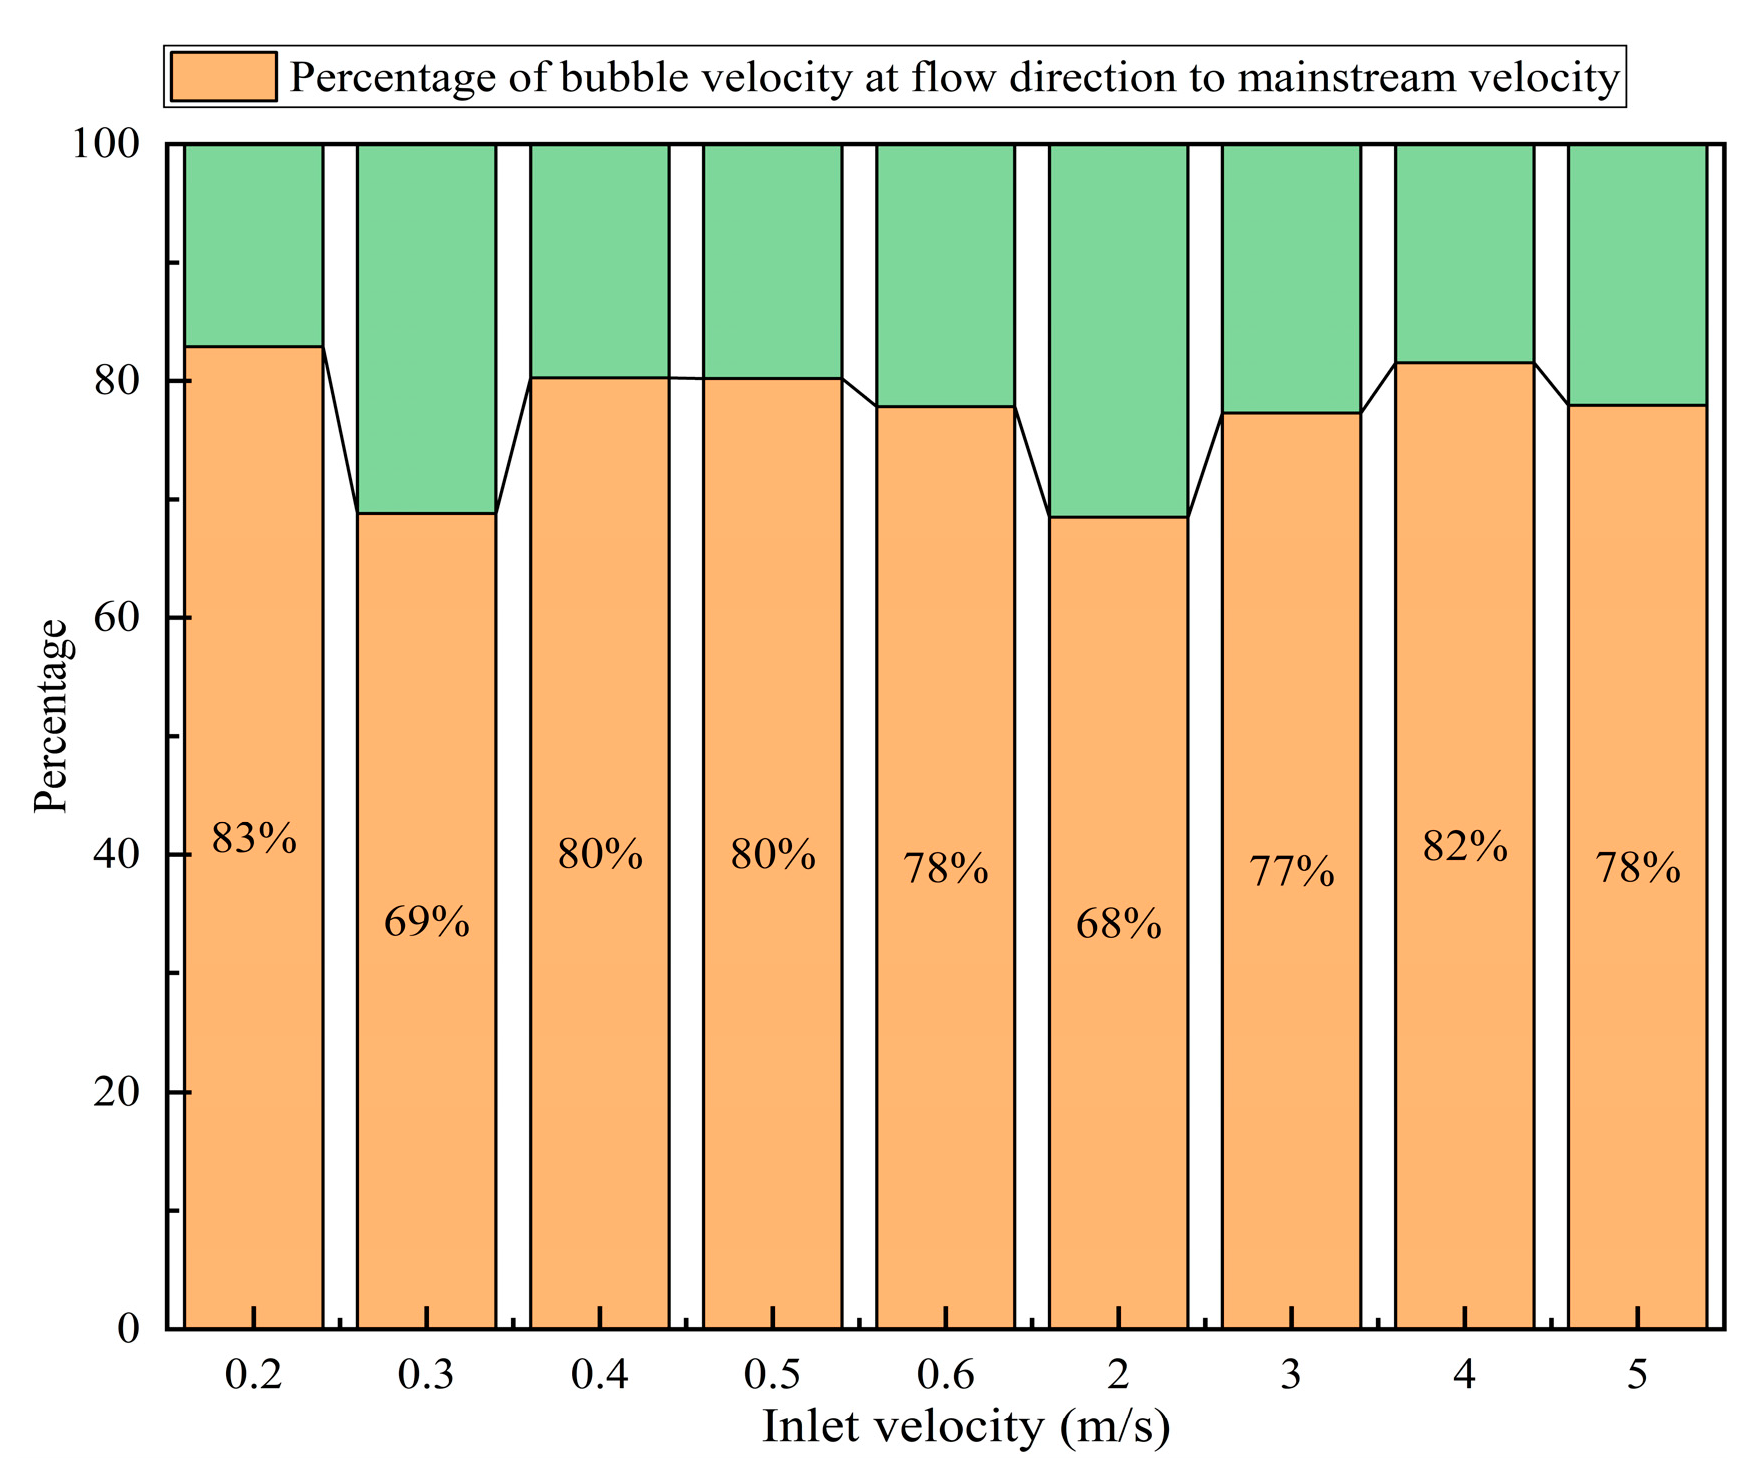
The bubble velocity in the flow direction was the most important contribution to bubble velocity from 0.2 to 5 m/s inlet velocities. Moreover, the bubble velocities of the 12 bubbles mostly oscillated with time during the sliding process at 0.2 to 0.6 m/s inlet velocities, while bubble velocity increased during the sliding process due to the bubbles having a certain inertia at 2 to 5 m/s inlet velocities. Furthermore, the average bubble velocity in the flow direction had a significant decrease from 0.2 to 5 m/s inlet velocity, but the average bubble velocity in the radial direction was opposite than the average bubble velocity in the flow direction. The average bubble velocity in the flow direction accounts for about 80% of the mainstream velocity.
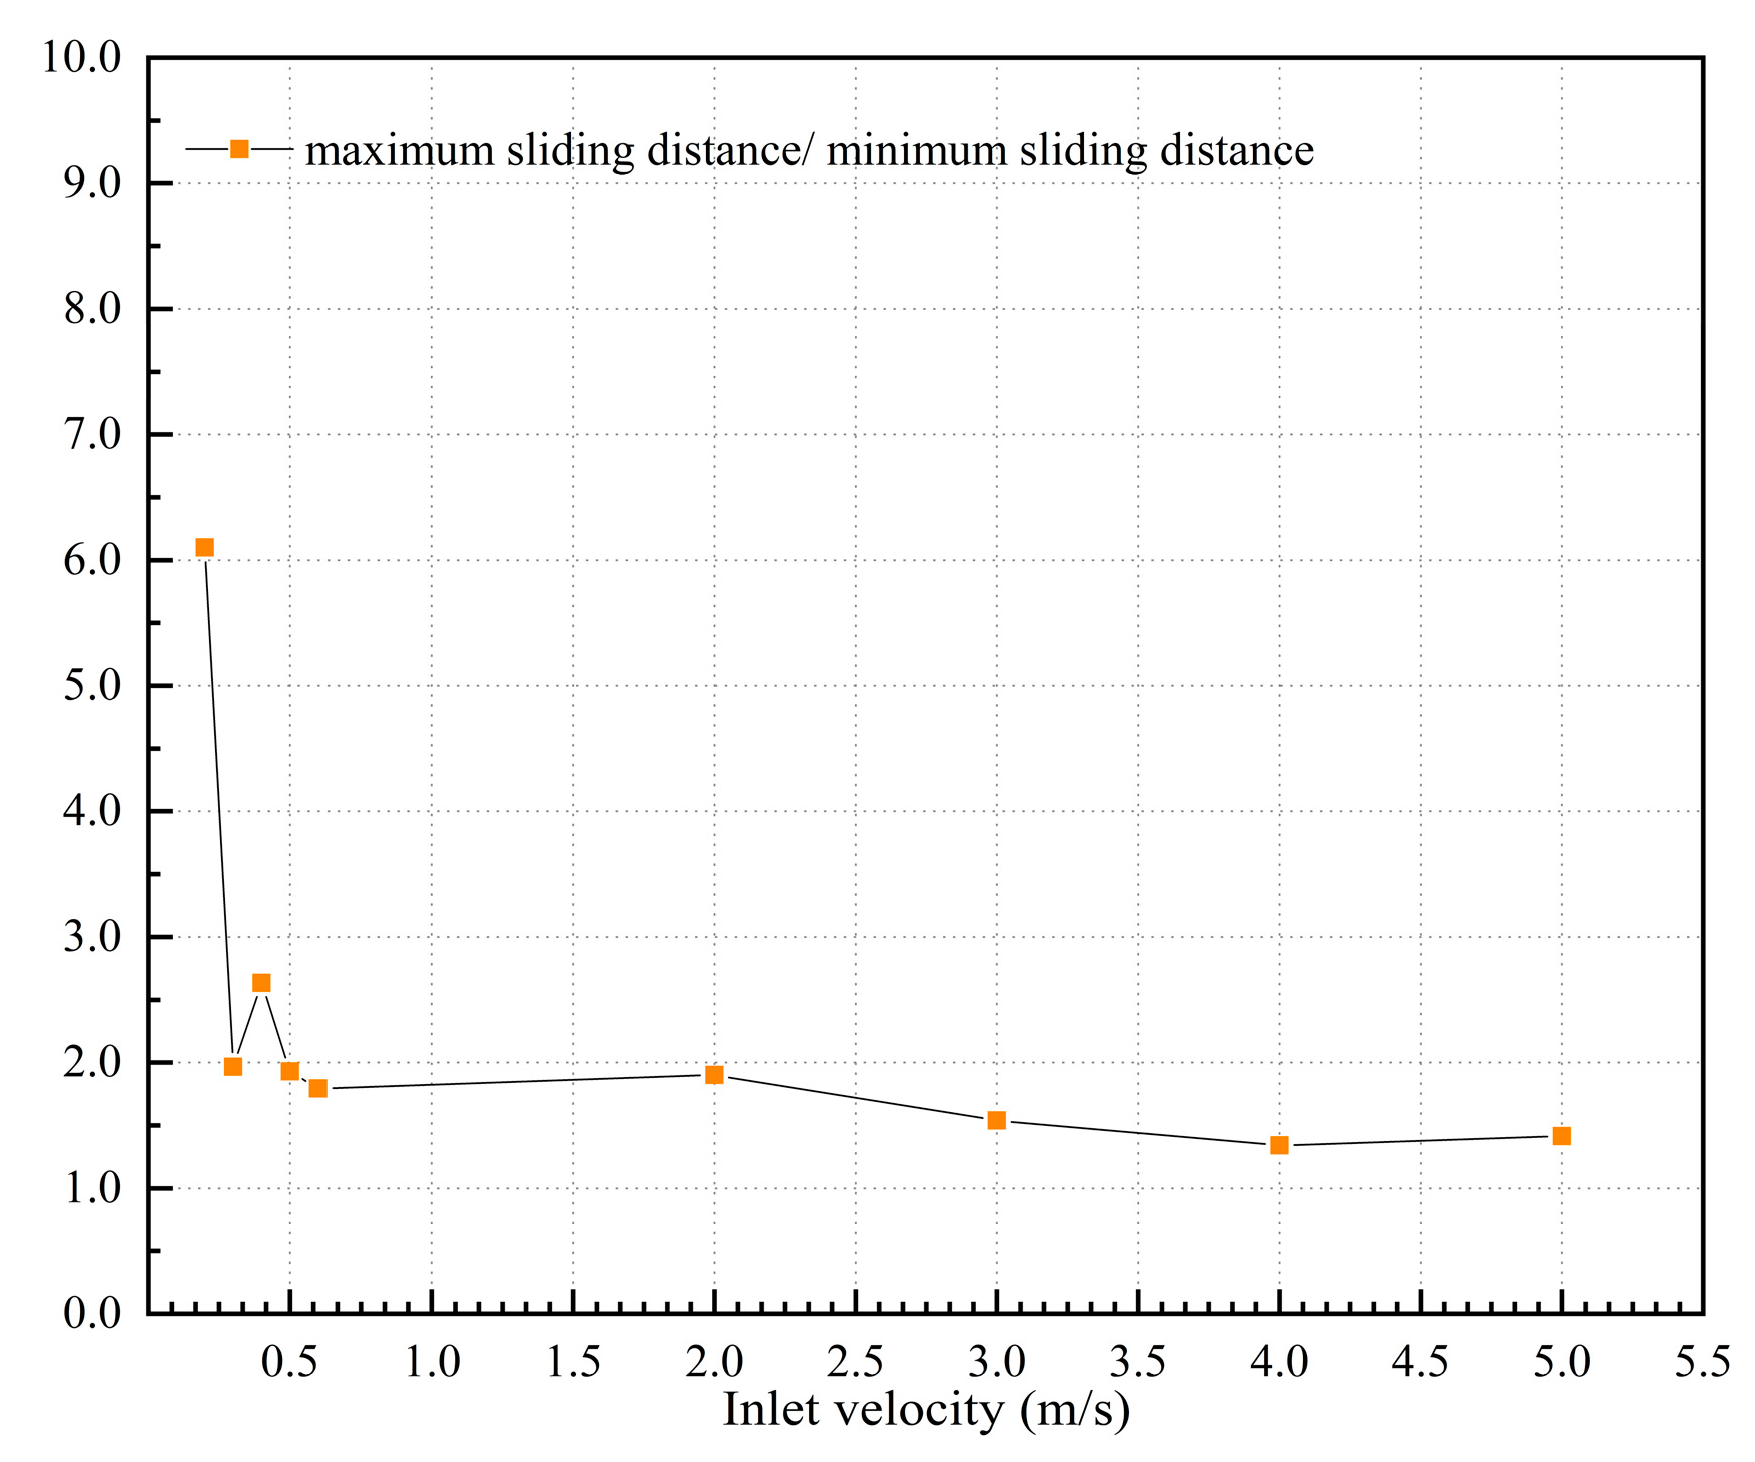
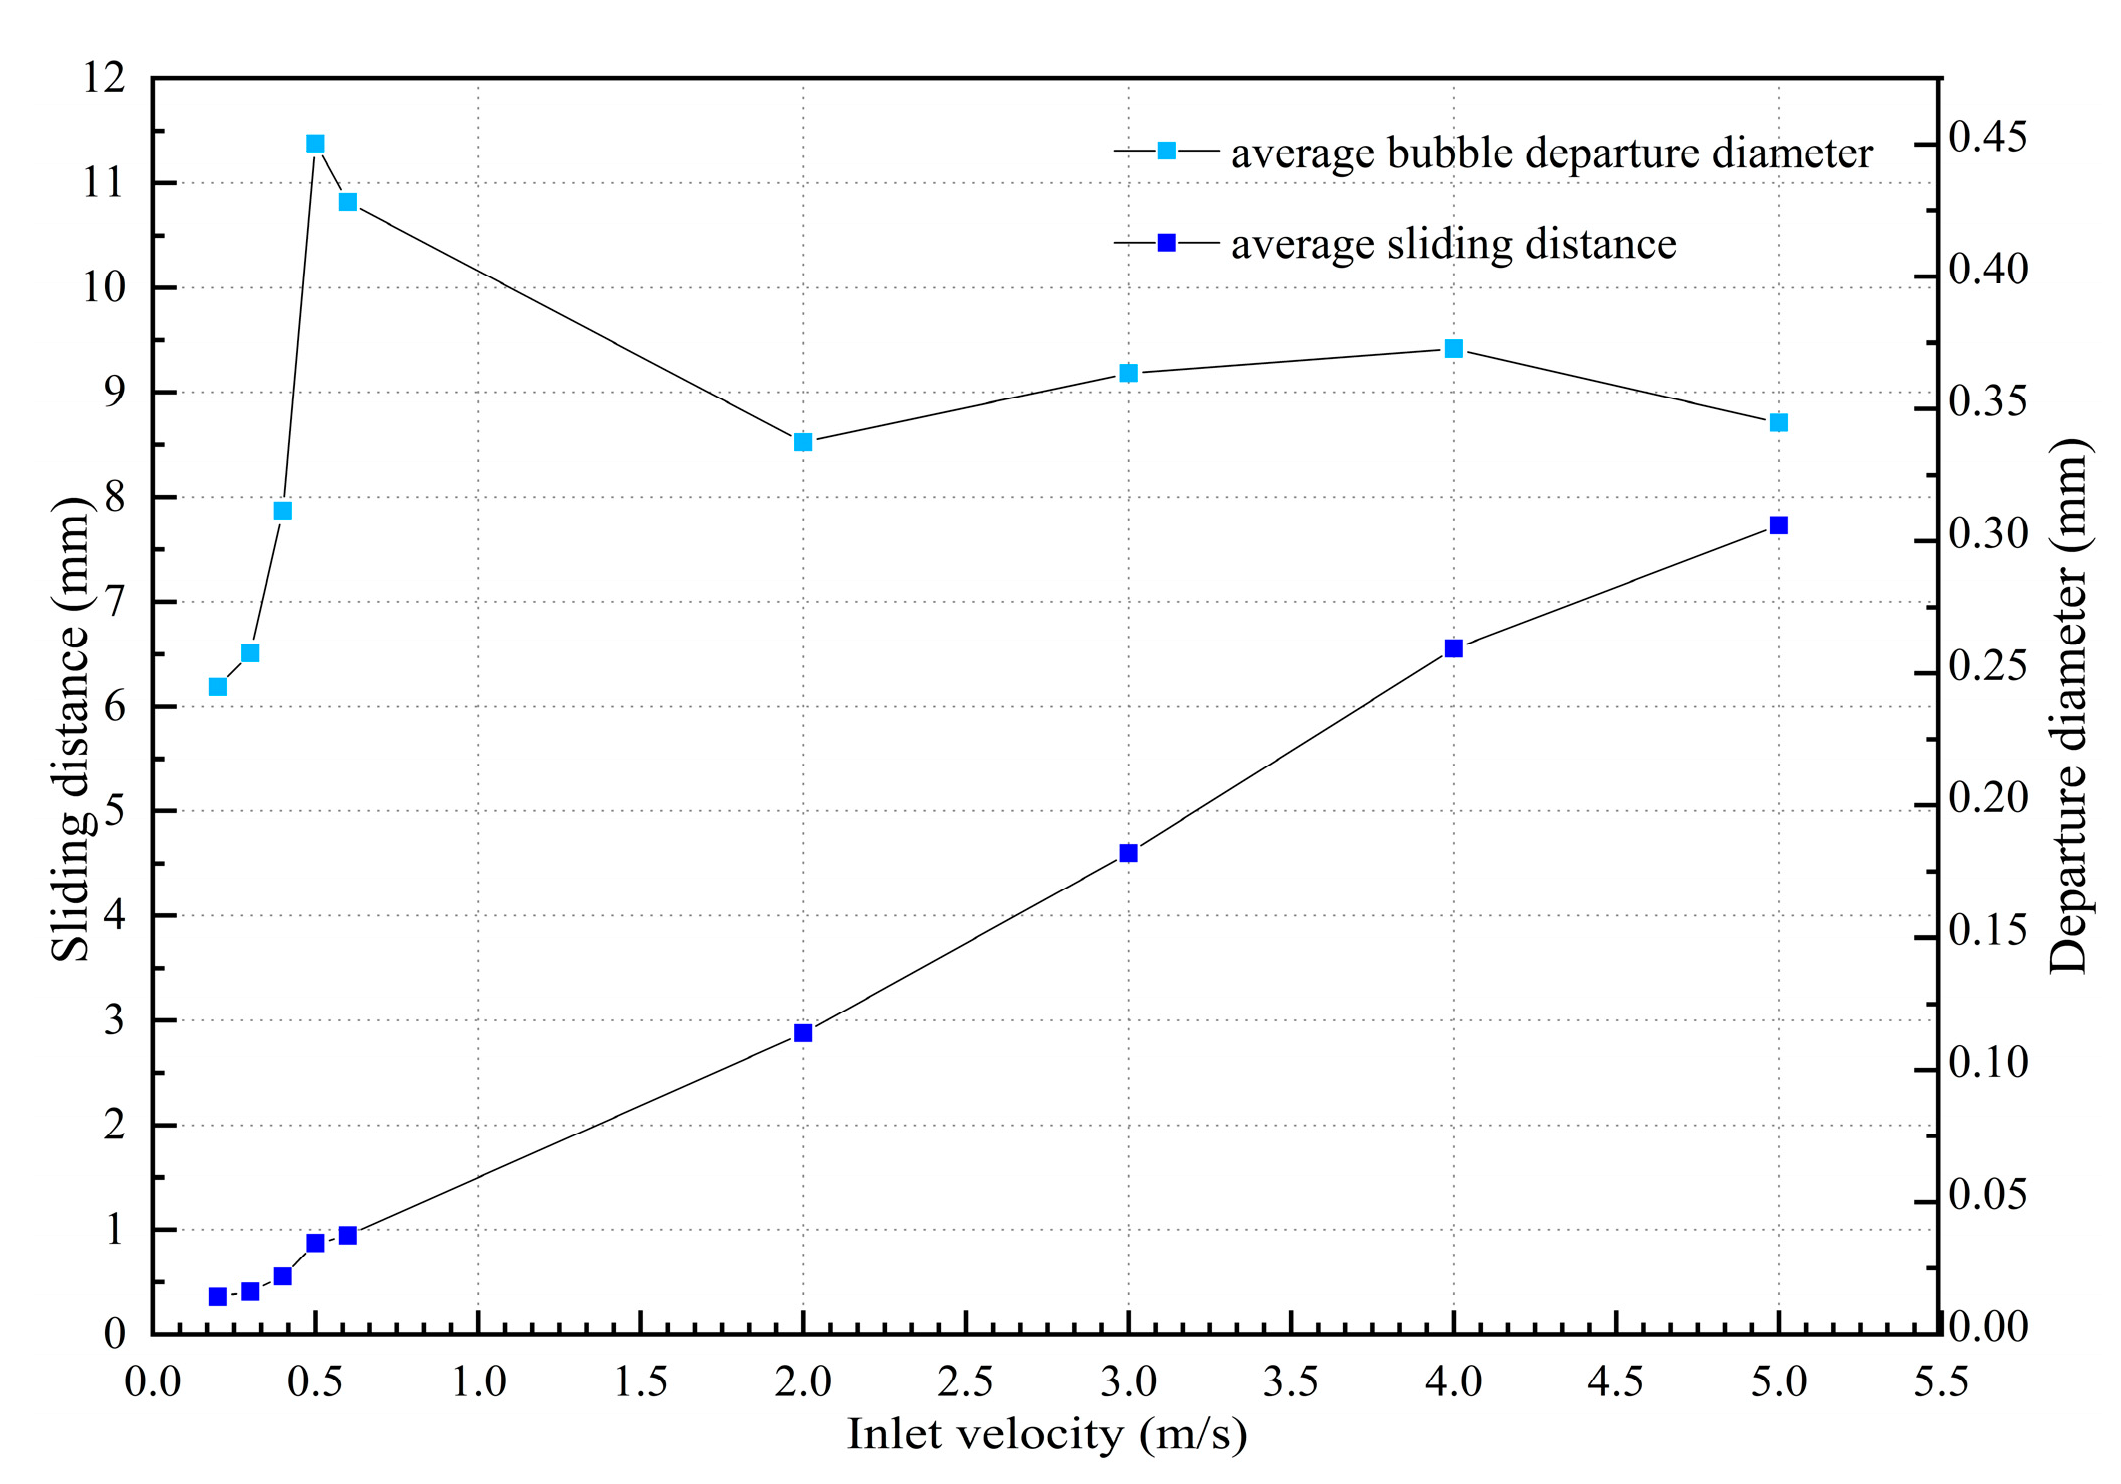
(2)
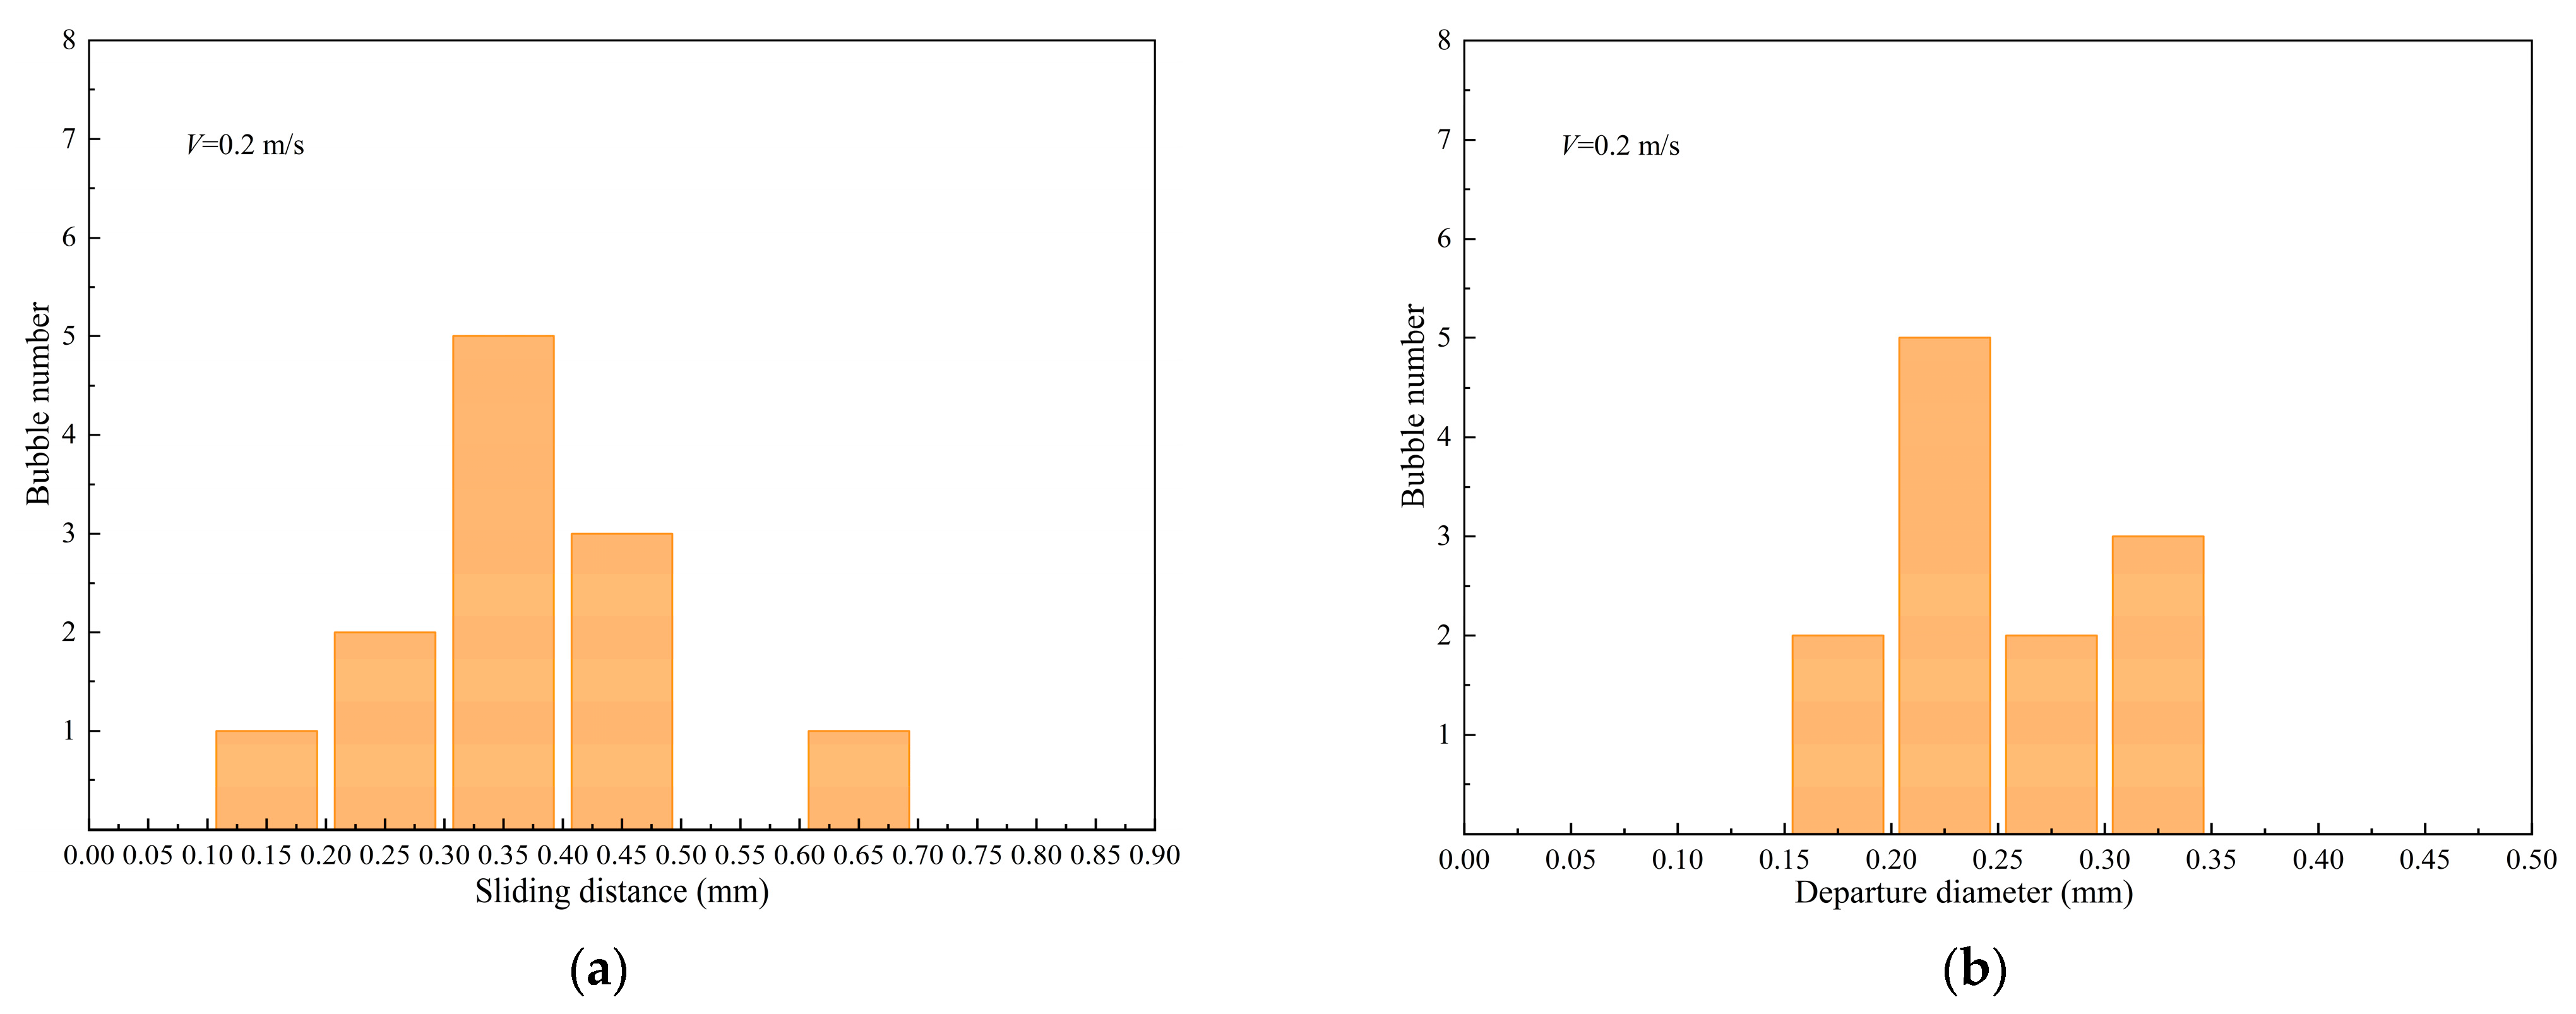
The ratio of the maximum sliding distance to the minimum sliding distance was close to two at inlet velocities of 0.3 to 5 m/s. In addition, with the increase in inlet velocity from 0.2 to 5 m/s, the average sliding distance increased significantly. The average bubble departure diameter increased obviously from 0.2 to 0.5 m/s and greatly reduced after 0.6 m/s inlet velocity. The bubble departure diameter was about at 0.35 m with an enormous increase of the sliding distance in high inlet velocities of 2 to 5 m/s. The bubble departure diameter decreased when the inlet velocity was greater than 0.6 m/s, which was caused by a significant increasing in the sliding distance of the bubble.
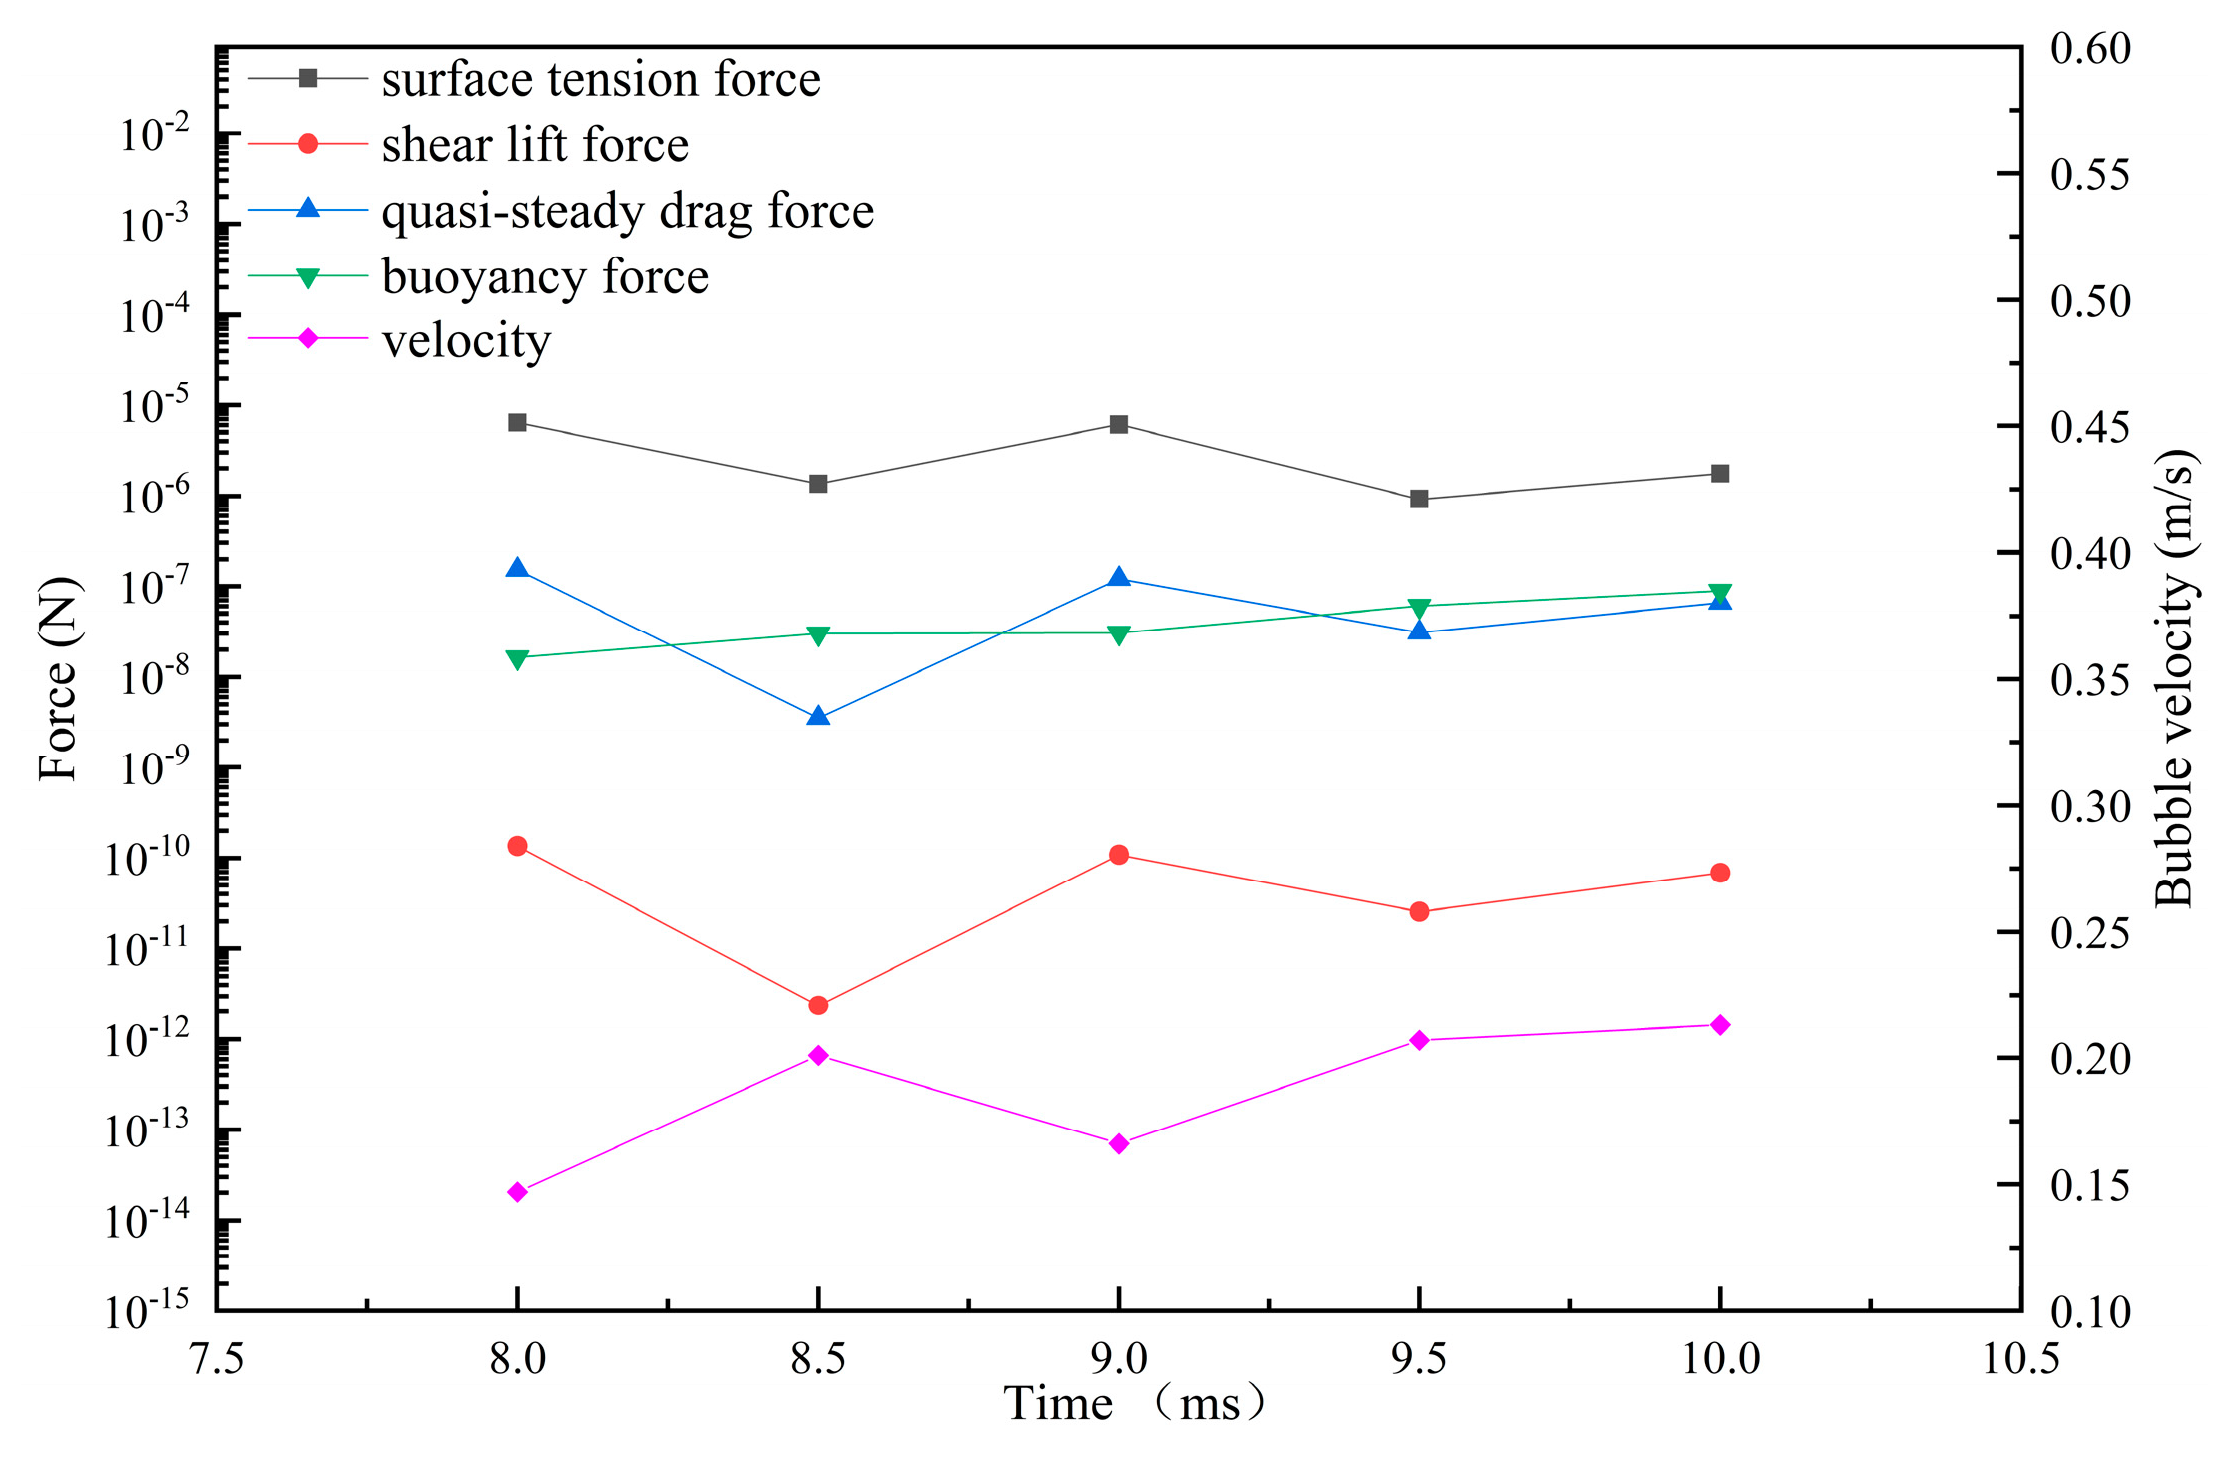
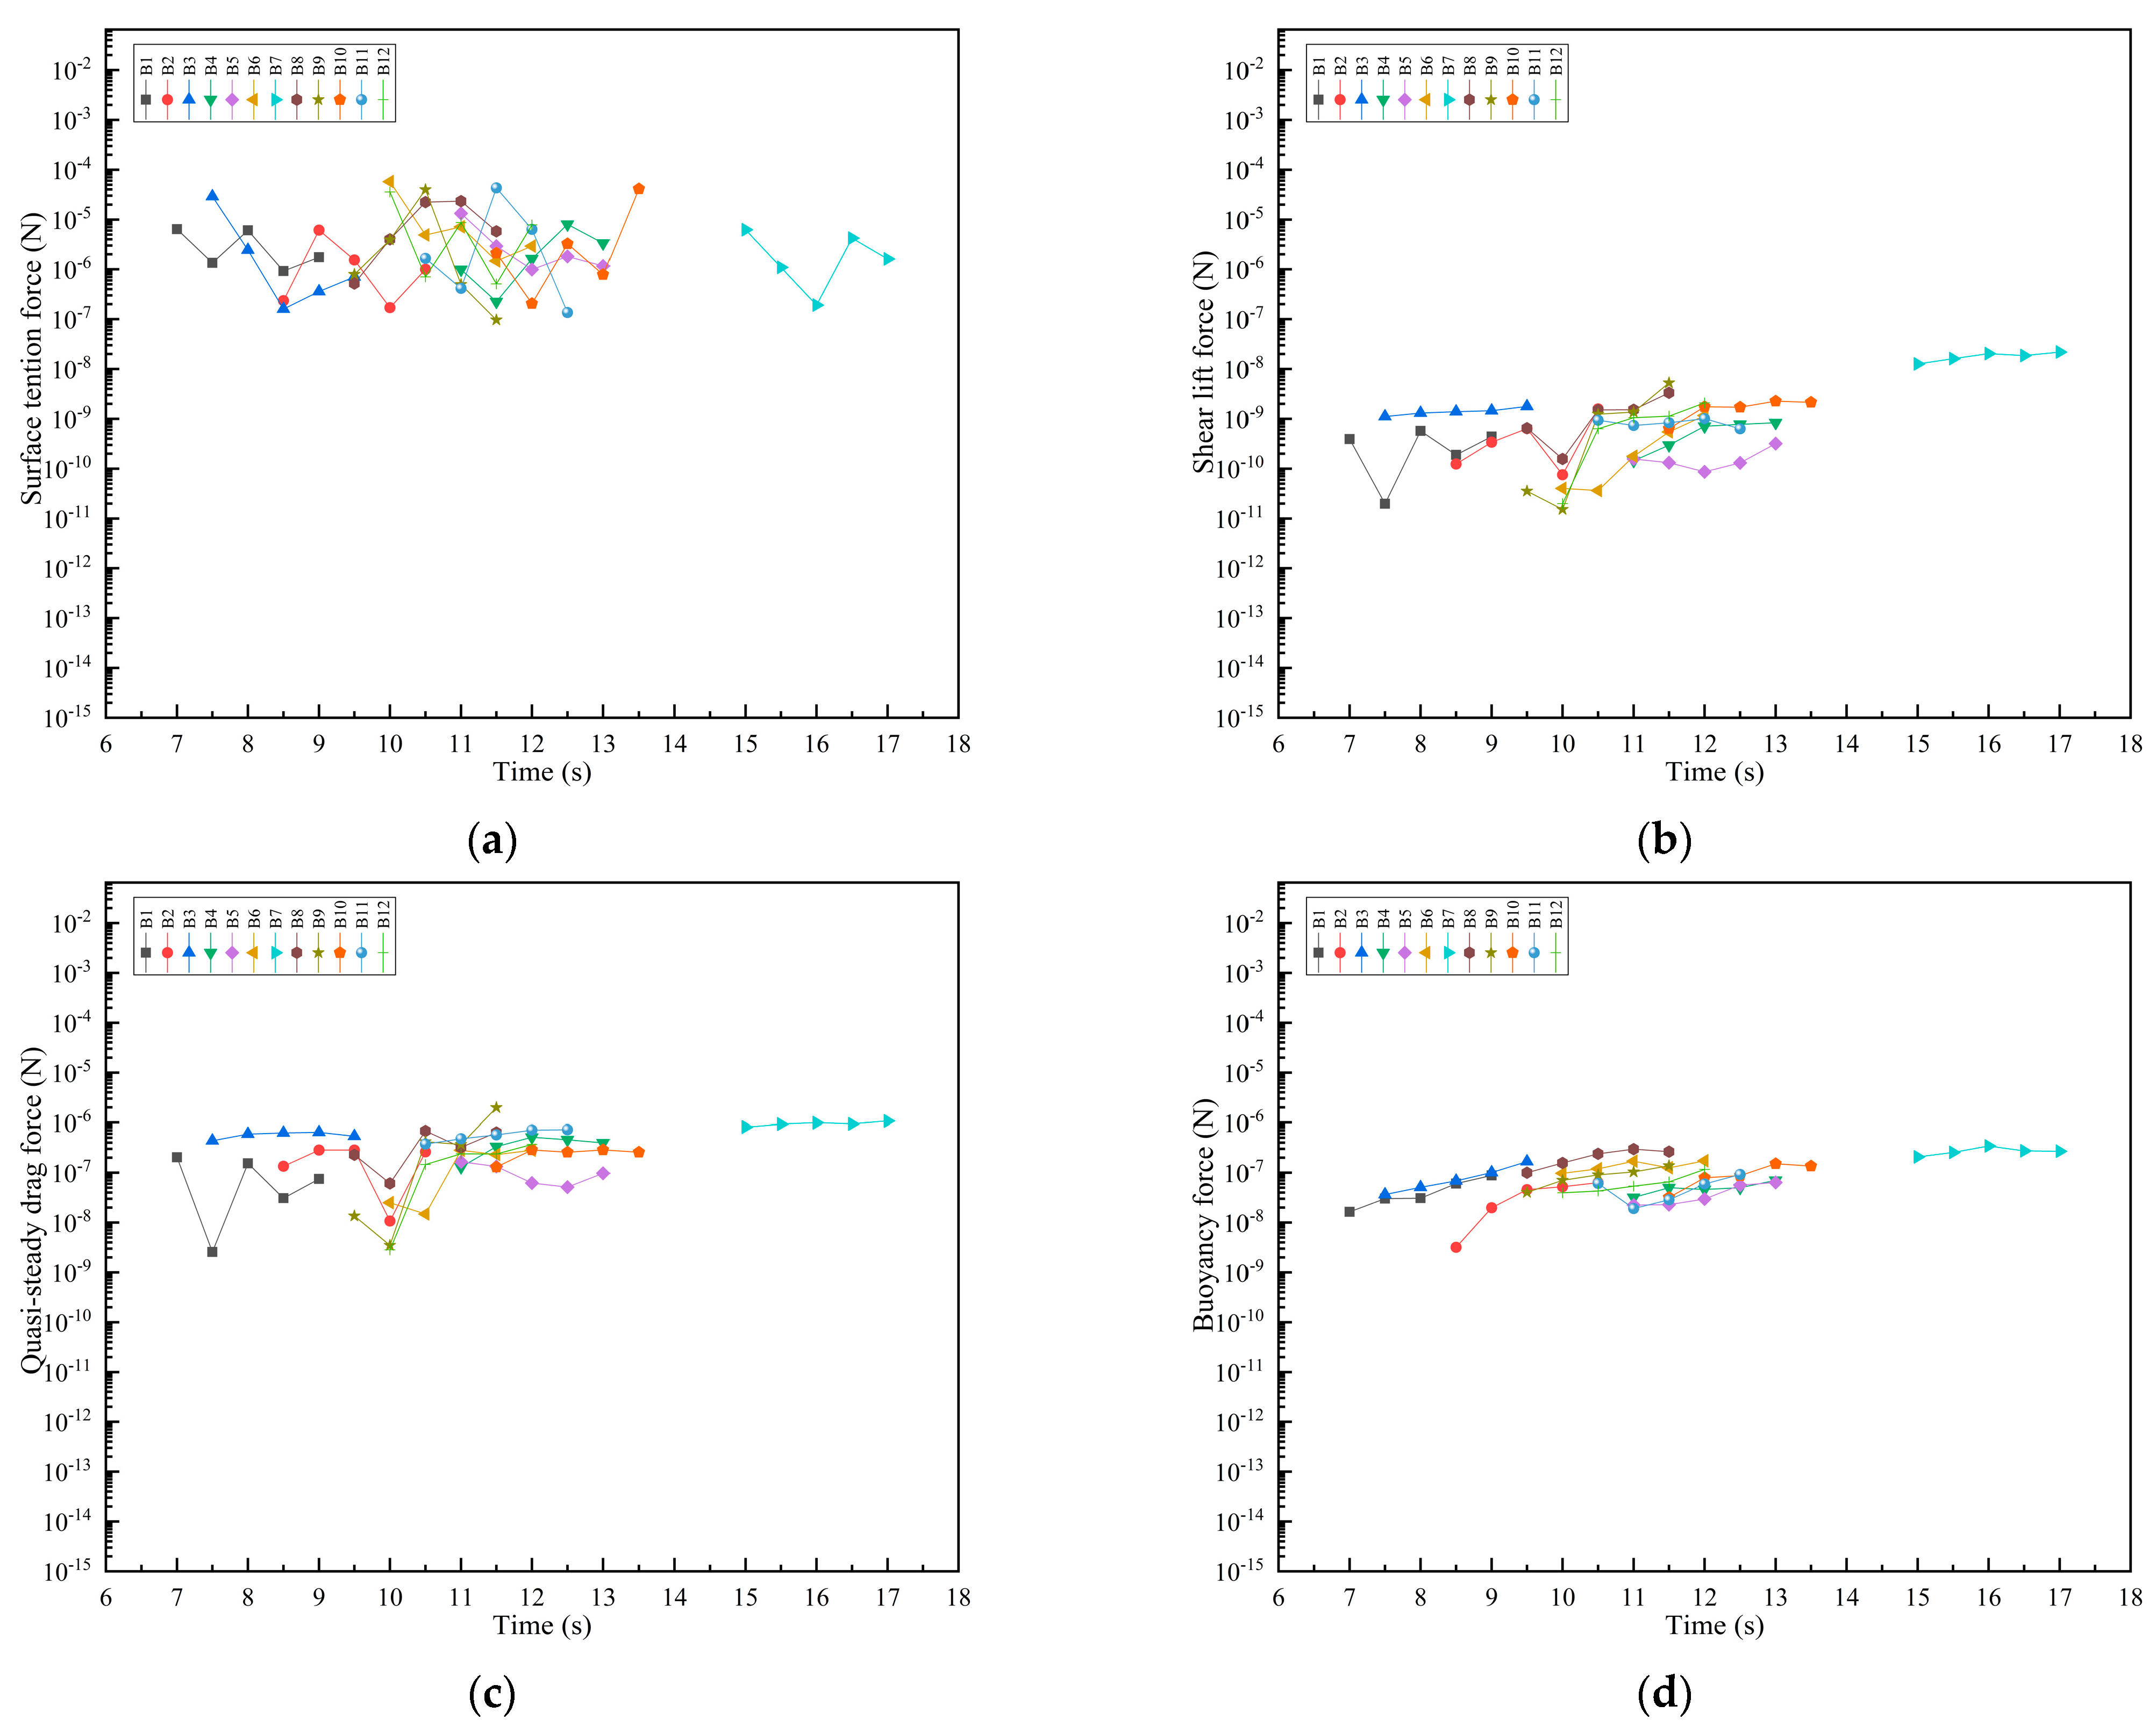
(3)
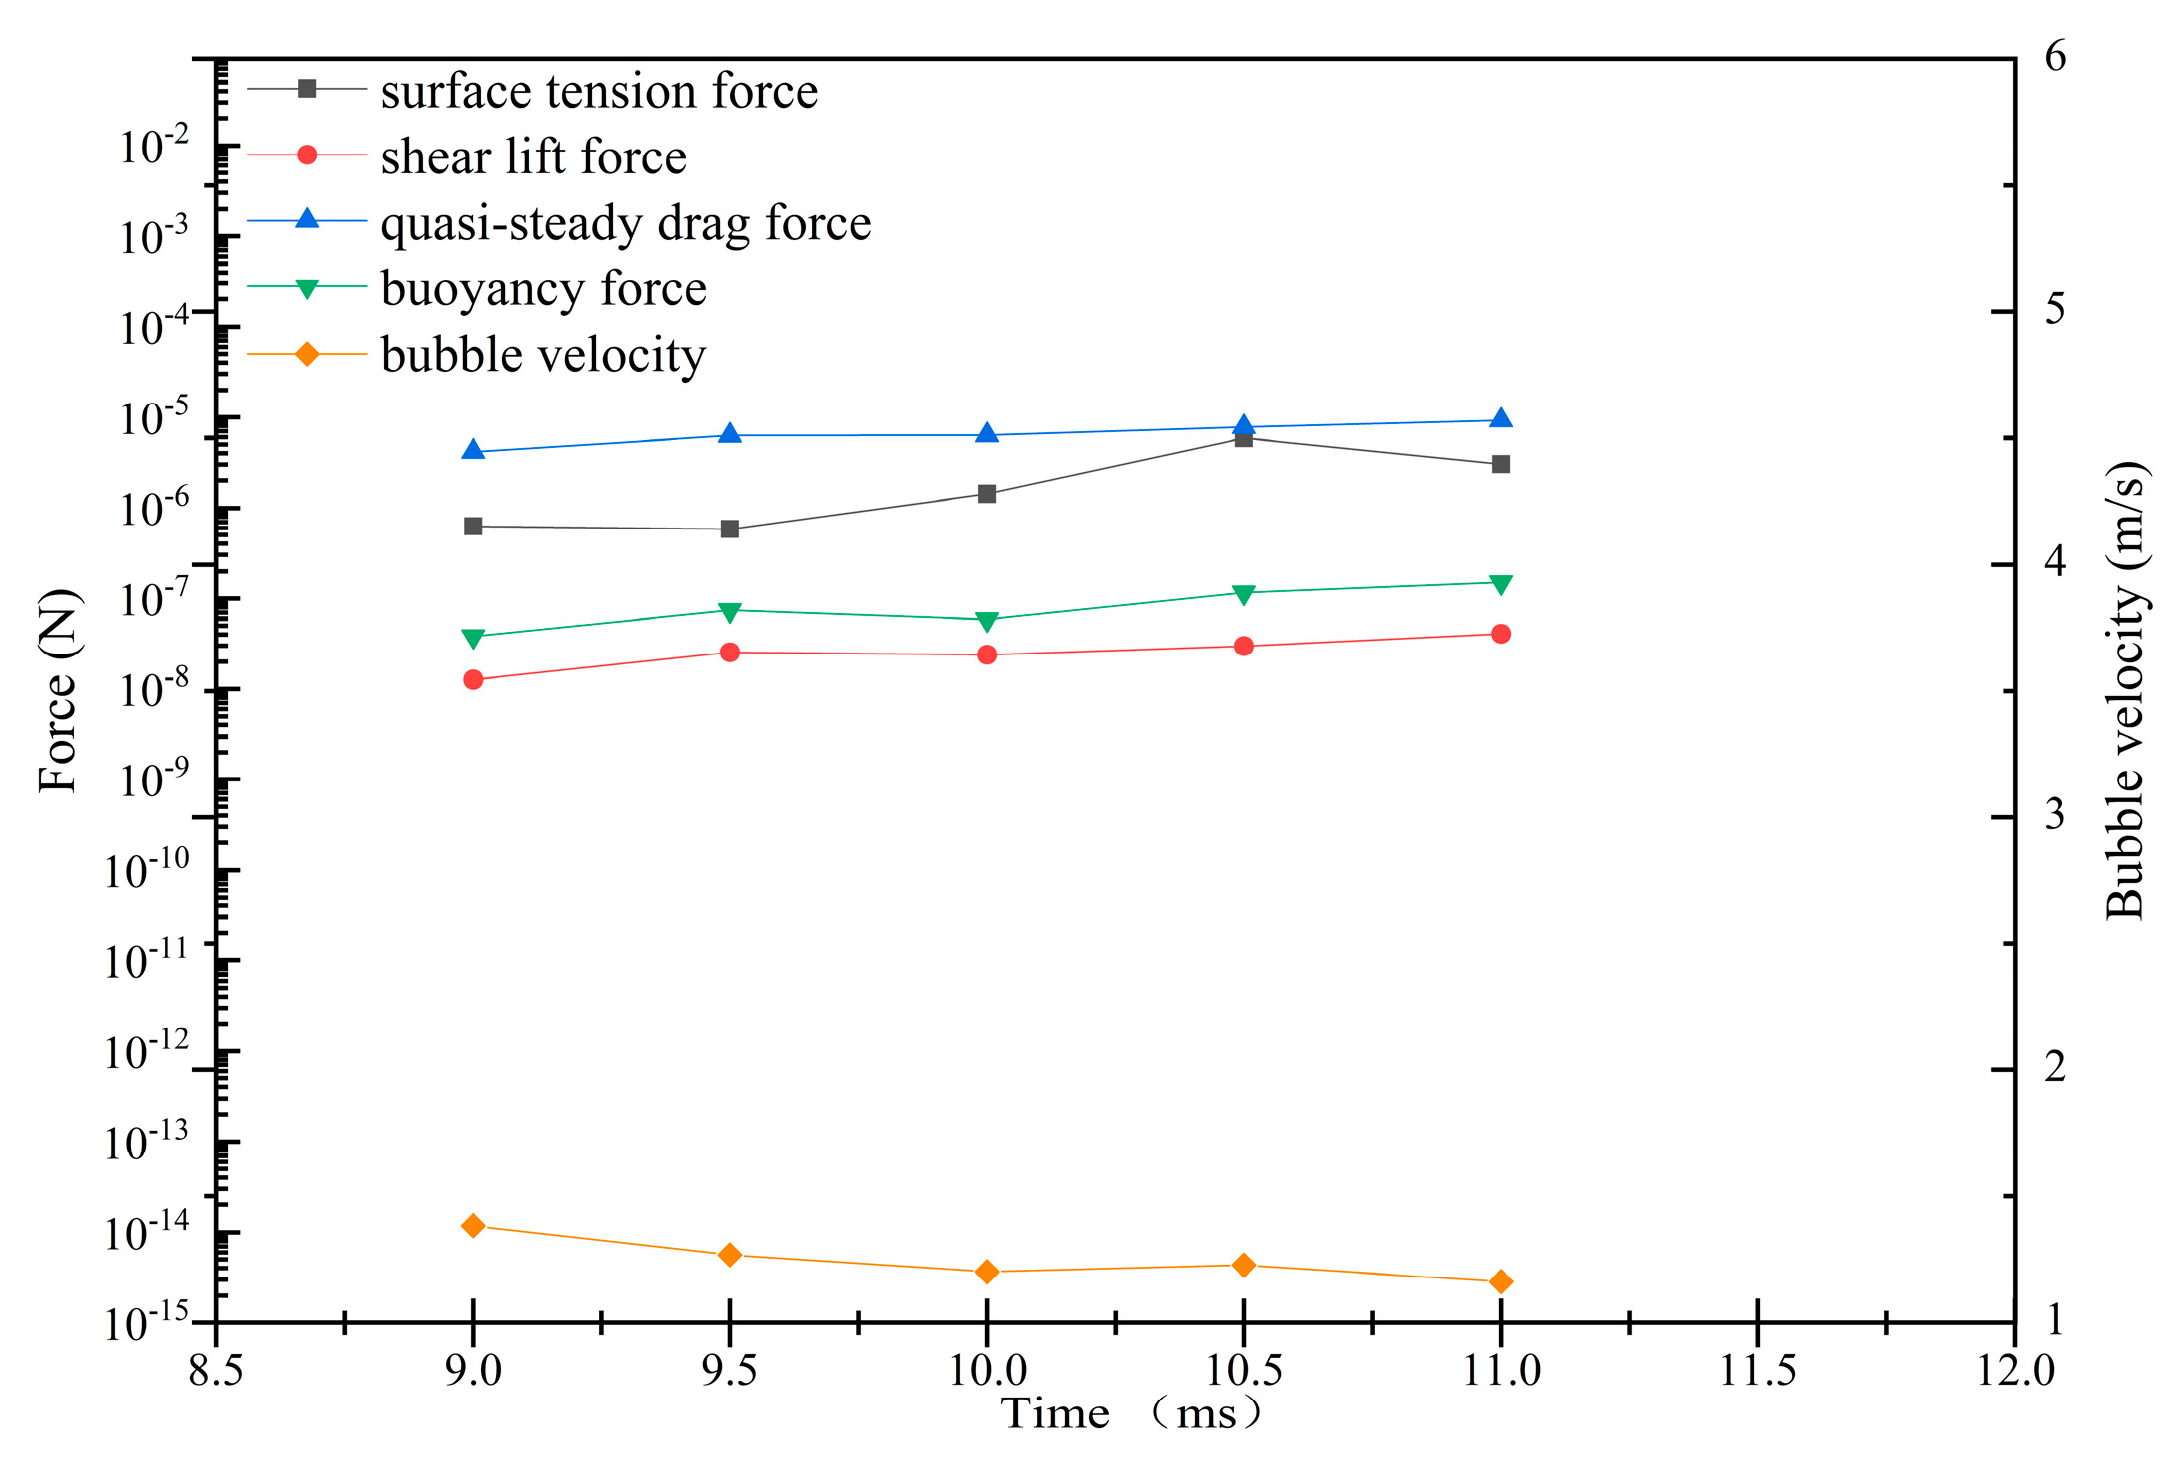
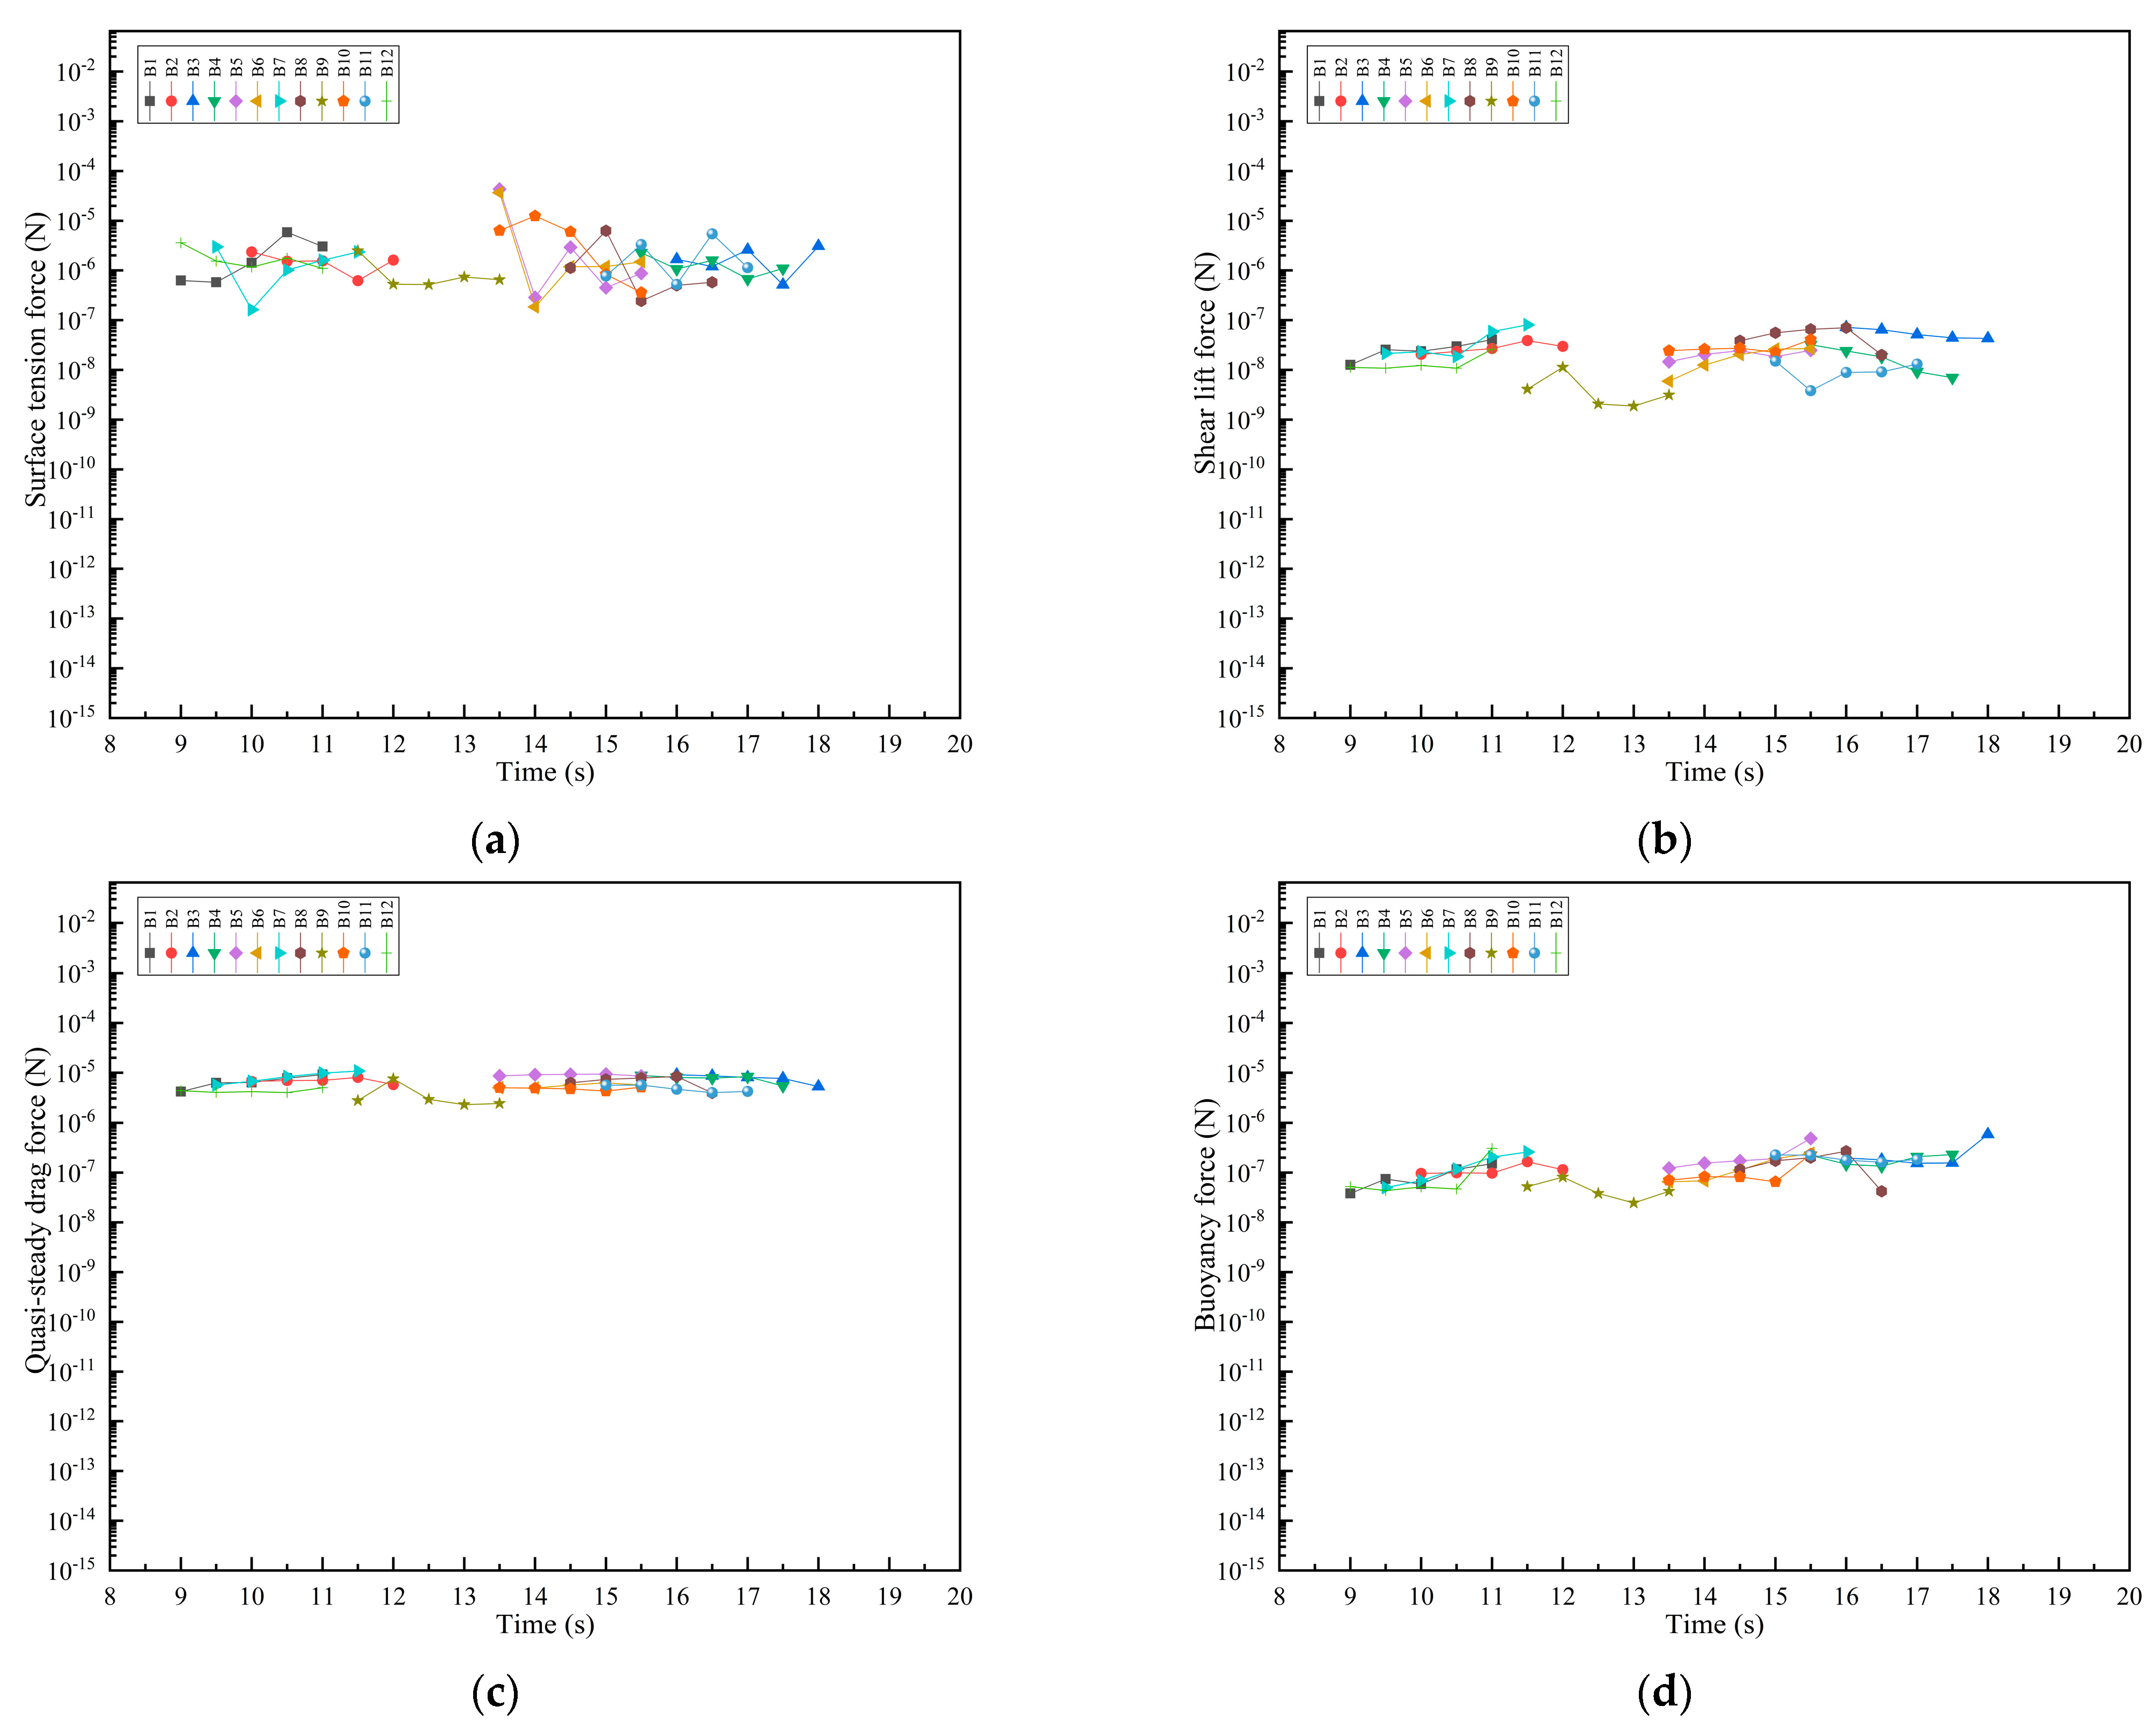
At 0.2 to 0.6 m/s inlet velocities, the surface tension, shear lift force and quasi-steady drag force fluctuate during sliding, which might be caused by the fluctuation of the bubble velocity. While at 2 to 5 m/s inlet velocities, except for surface tension, other forces did not oscillate during the sliding process. At 0.2 to 5 m/s inlet velocities, the buoyancy was not related to the bubble velocity; other forces are bubble velocity-related. The order of magnitudes of surface tension, shear lift force and quasi-steady drag force increased with the increasing of inlet velocity from 0.2 m/s to 5 m/s inlet velocity.
(4)
At 0.2 to 0.6 m/s inlet velocities, the order of force acting on the bubble during sliding was surface tension > buoyancy and quasi-steady drag force > shear lift force. The surface tension dominated the bubble sliding process at 0.2 to 0.6 m/s inlet velocities. However, the quasi-steady drag force dominated the bubble sliding process at 2 to 5 m/s inlet velocities. The investigation of the bubble sliding dynamics is of great importance to effectively control the sliding process and heat transfer enhancement.
(5)
In this paper, the sliding heat transfer and departure heat transfer of bubbles at low (0.2 to 0.6 m/s) and high (2 to 5 m/s) inlet velocities were discussed and evaluated. In the future, the heat transfer performance of bubbles at high and low velocity will be quantitatively analyzed.

Author Contributions

Conceptualization, B.Y. and B.W.; methodology, B.Y.; software, B.Y., F.W. and M.D.; validation, B.Y. and B.W.; formal analysis, B.W.; investigation, B.Y.; resources, J.W. and J.X.; data curation, B.W.; writing—original draft preparation, B.Y.; writing—review and editing, B.Y. and J.W.; supervision, J.X.; project administration, J.X.; funding acquisition, J.X. All authors have read and agreed to the published version of the manuscript.

Funding

This research was funded by the National Key R&D Program of China, grant number 2019YFD0901604; Science and Technology Innovation Action Plan of the Shanghai Science and Technology Commission, grant number 19DZ1207503; and the Public Service Platform Project of the Shanghai Science and Technology Commission, grant number 20DZ2292200.

Institutional Review Board Statement

Not applicable.

Informed Consent Statement

Not applicable.

Data Availability Statement

The research data of this paper can be obtained from the corresponding author “Wang Jinfeng” or “Xie Jing” through reasonable request.

Acknowledgments

The support of Shanghai Ocean University, China, is gratefully acknowledged.

Conflicts of Interest

The authors declare no conflict of interest.

Abbreviation

NomenclatureGreek Symbols
Abubble width [m]δaverages of Heaviside function
Bbubble height [m]εthickness of interface [m]
cp mixture specific heat capacity [J/kgK]ηmass transfer coefficient [s−1]
D bubble diameter [m]κsurface curvature [1/m]
dhydraulic diameter [m]λmixture conductivity [W/mK]
F force per unit volume of fluid [N/m3]μdynamic viscosity [Ns/m2]
Gmass flux [kg/·s]νkinematic viscosity [m2/s]
gacceleration of gravity [m/s2]ρdensity [kg/m3]
hlatent heat [J/kg]σcoefficient of surface tension [N/m]
JαJacob number = cpΔTsub/(ρvh)ϕsymbolic distance function
kturbulent kinetic energy [m2/s2]ωturbulent vortex frequency
mmass source [kg/(m3·s)]Subscripts
ppressure of interface [N/m2]aveaverage
PrPrandtl number = cpμ/λbbubble
qheat flux [W/m2]ddepart
ReReynolds number = ρud/μeff effective
SE energy source term [W/m3]lliquid
T mixture temperature [K]level level set
ΔTsubsubcooling temperature [K]ppressure
t time [s]satsaturation
u velocity [m/s]subsubcooling
uτshear velocity [m/s]t turbulent
y+turbulence length-scalevvapor
yboundary layer length [m]volvolume
αvolume of fraction

References

  1. İşkan, Ü.; Direk, M. Evaluation of the effects of entrainment ratios on the performance parameters of a refrigeration machine having dual evaporator ejector system with R134a and R456A. Therm. Sci. Eng. Prog. 2022, 33, 101345. [Google Scholar] [CrossRef]
  2. Hashemi-Tilehnoee, M.; del Barrio, E.P. Magneto laminar mixed convection and entropy generation analyses of an impinging slot jet of Al2O3-water and Novec-649. Therm. Sci. Eng. Prog. 2022, 36, 101524. [Google Scholar] [CrossRef]
  3. Pipathattakul, M.; Mahian, O.; Dalkilic, A.S.; Wongwises, S. Effects of the gap size on the flow pattern maps in a mini-gap annular channel. Exp. Therm. Fluid Sci. 2014, 57, 420–424. [Google Scholar] [CrossRef]
  4. Li, Y.; Jin, T.; Wu, S.; Wei, J.H.; Xia, J.; Karayiannis, T.G. Heat transfer performance of slush nitrogen in a horizontal circular pipe. Therm. Sci. Eng. Prog. 2018, 8, 66–77. [Google Scholar] [CrossRef]
  5. Julia, J.E.; Hibiki, T. Flow regime transition criteria for two-phase flow in a vertical annulus. Int. J. Heat Fluid Flow 2011, 32, 993–1004. [Google Scholar] [CrossRef]
  6. Cai, J.; Gong, Z.; Tan, B. Experimental and theoretical investigation of bubble dynamics on vertical surfaces with different wettability for pool boiling. Int. J. Therm. Sci. 2023, 184, 107966. [Google Scholar] [CrossRef]
  7. Yuan, D.W.; Pan, L.M.; Wei, J.H.; Chen, D. Bubble sliding process on subcooling flow boiling in vertical rectangular narrow channel. In Proceedings of the 18th International Conference on Nuclear Engineering 2010, Xi’an, China, 17–21 May 2010; pp. 1037–1047. [Google Scholar]
  8. Liu, W.; Liu, H.; Chen, D.; Qin, J.; Yan, P.; Liu, H. Visual experimental study on bubble characteristics near the heating wall in subcooled flow boiling. Prog. Nucl. Energy 2021, 140, 103898. [Google Scholar] [CrossRef]
  9. Cao, Y.; Kawara, Z.; Yokomine, T.; Kunugi, T. Visualization study on bubble dynamical behavior in subcooled flow boiling under various subcooling degree and flowrates. Int. J. Heat Mass Transf. 2016, 93, 839–852. [Google Scholar] [CrossRef]
  10. Owoeye, E.J. Bubble Transport in Subcooled Flow Boiling; University of Florida: Gainesville, FL, USA, 2015. [Google Scholar]
  11. Wei, J.H.; Pan, L.M.; Chen, D.; Zhang, H.; Xu, J.; Huang, Y. Numerical simulation of bubble behaviors in subcooled flow boiling under swing motion. Nucl. Eng. Des. 2011, 241, 2898–2908. [Google Scholar] [CrossRef]
  12. Klausner, J.F.; Mei, R.; Bernhard, D.M.; Zeng, L.Z. Vapor bubble departure in forced convection boiling. Int. J. Heat Mass Transf. 1993, 36, 651–662. [Google Scholar] [CrossRef]
  13. Sugrue, R.; Buongiorno, J. A modified force-balance model for prediction of bubble departure diameter in subcooled flow boiling. Nucl. Eng. Des. 2016, 305, 717–722. [Google Scholar] [CrossRef]
  14. Yun, B.; Splawski, A.; Lo, S.; Song, C. Prediction of a subcooled boiling flow with advanced two-phase flow models. Nucl. Eng. Des. 2012, 253, 351–359. [Google Scholar] [CrossRef]
  15. Zhou, P.; Huang, R.; Huang, S.; Zhang, Y.; Rao, X. Experimental investigation on bubble contact diameter and bubble departure diameter in horizontal subcooled flow boiling. Int. J. Heat Mass Transf. 2020, 149, 119105. [Google Scholar] [CrossRef]
  16. Yu, S.; Peng, C.; Zhang, Z.; Cheng, N. Experimental investigation and model prediction of sliding bubble dynamics in vertical subcooled boiling flow. Int. J. Heat Mass Transf. 2023, 200, 123520. [Google Scholar] [CrossRef]
  17. Wang, K.; Hong, Z.; Liang, H.; Junya, I.; Cheng, S.; Okamoto, K. Experimental investigation on the characteristics of bubble growth and slide on a downward-facing heater surface in flow boiling. Int. J. Therm. Sci. 2023, 184, 108008. [Google Scholar] [CrossRef]
  18. Ren, T.T.; Zhu, Z.Q.; Zhang, R.; Shi, J.W.; Yan, C.Q. Development of force balance model for prediction of bubble departure diameter and lift-off diameter in subcooled flow boiling. Int. J. Heat Mass Transf. 2020, 161, 120245. [Google Scholar] [CrossRef]
  19. Meng, Z.F.; Zhang, H.; Lei, M.J.; Qin, Y.B.; Qiu, J.Y. Performance of low GWP R1234yf/R134a mixture as a replacement for R134a in automotive air conditioning systems. Int. J. Heat Mass Transf. 2018, 116, 362–370. [Google Scholar] [CrossRef]
  20. Jeon, S.; Kim, S.; Park, G. Numerical study of condensing bubble in subcooled boiling flow using volume of fluid model. Chem. Eng. Sci. 2011, 66, 5899–5909. [Google Scholar] [CrossRef]
  21. Da Riva, E.; Del Col, D. Numerical simulation of laminar liquid film condensation in a horizontal circular minichannel. J. Heat Transf. 2012, 134, 051019. [Google Scholar] [CrossRef]
  22. Chen, C.; Li, K.; Lin, T.; Li, W.; Yan, W. Study on heat transfer and bubble behavior inside horizontal annuli: Experimental comparison of R-134a, R-407C, and R-410A subcooled flow boiling. Case Stud. Therm. Eng. 2021, 24, 100875. [Google Scholar] [CrossRef]
  23. Lie, Y.M.; Lin, T.F. Subcooled flow boiling heat transfer and associated bubble characteristics of R-134a in a narrow annular duct. Int. J. Heat Mass Transf. 2006, 49, 2077–2089. [Google Scholar] [CrossRef]
  24. Wang, J.; Wang, B.; Xie, J.; Lei, K.; Yu, B.; Sun, Y. Numerical simulation research of bubble characteristics and bubble departure diameter in subcooled flow boiling. Mathematics 2022, 10, 4103. [Google Scholar] [CrossRef]
  25. Yoo, J.; Perez, C.E.E.; Hassan, Y.A. Force balance model predictions of sliding bubbles velocity in vertical subcooled boiling flow. Int. J. Heat Mass Transf. 2021, 175, 121368. [Google Scholar] [CrossRef]
  26. Chi-Yeh, H.; Griffith, P. The mechanism of heat transfer in nucleate pool boiling—Part I: Bubble initiaton, growth and departure. Int. J. Heat Mass Transf. 1965, 8, 887–904. [Google Scholar] [CrossRef]
  27. Shao, Y.; Deng, S.; Lu, P.; Zhao, D.; Zhao, L.; Su, W.; Ma, M. A numerical study on heat transfer of R410A during flow boiling. Energy Procedia 2019, 158, 5414–5420. [Google Scholar] [CrossRef]
  28. Hirt, C.W.; Nichols, B.D. Volume of fluid (VOF) method for the dynamics of free boundaries. J. Comput. Phys. 1981, 39, 201–225. [Google Scholar] [CrossRef]
  29. Osher, S.; Sethian, J.A. Fronts propagating with curvature-dependent speed: Algorithms based on Hamilton-Jacobi formulations. J. Comput. Phys. 1988, 79, 12–49. [Google Scholar] [CrossRef]
  30. Wang, Y.; Cai, J. Numerical investigation on bubble evolution during nucleate boiling using diffuse interface method. Int. J. Heat Mass Transf. 2017, 112, 28–38. [Google Scholar] [CrossRef]
  31. Weigand, B.; Ferguson, J.R.; Crawford, M.E. An extended kays and crawford turbulent Prandtl number model. Int. J. Heat Mass Transf. 1997, 40, 4191–4196. [Google Scholar] [CrossRef]
  32. Lee, W.H. A pressure iteration scheme for two-phase flow modeling. In Computational Methods for Two-Phase Flow and Particle Transport; World Scientific: Singapore, 2022. [Google Scholar]
  33. Wilcox, D.C. Multiscale model for turbulent flows. In Proceedings of the 24th AIAA Aerospace Sciences Meeting, Reno, NV, USA, 6–9 January 1986; p. 1311. [Google Scholar]
Figure 1. Diagram of Force on the Bubble.
Mathematics 11 02197 g001
Figure 2. Geometric model (a) and inlet mesh (b).
Mathematics 11 02197 g002
Figure 3. Comparison of departure diameter between simulation and experimental.
Mathematics 11 02197 g003
Figure 4. The bubble behavior in the subcooled flow boiling process.
Mathematics 11 02197 g004
Figure 5. Experimental pictures of Liu et al. [8].
Mathematics 11 02197 g005
Figure 6. Variation of the bubble velocities of 12 bubbles in the flow direction (a), the bubble velocities of 12 bubbles in the radial direction (b) and the bubble velocities of 12 bubbles with time during the sliding process (c) with heat flux of 0.3 MW/m2, inlet velocity of 0.2 m/s, inlet subcooling of 3 K.
Mathematics 11 02197 g006
Figure 7. Variation of the bubble velocities of 12 bubbles with time during the sliding process with heat flux of 0.3 MW/m2, inlet velocity of 0.4 m/s (a) and inlet velocity of 0.6 m/s (b), inlet subcooling of 3 K.
Mathematics 11 02197 g007
Figure 8. Variation of the bubble velocities in the flow direction of 12 bubbles (a), the bubble velocities in the radial direction of 12 bubbles (b) and the bubble velocities of 12 bubbles with time during the sliding process (c) with heat flux of 0.3 MW/m2, inlet velocity of 2 m/s, inlet subcooling of 3 K.
Mathematics 11 02197 g008
Figure 9. Variation of the bubble velocities of 12 bubbles with time during the sliding process with heat flux of 0.3 MW/m2, inlet velocity of 4 m/s (a) and inlet velocity of 5 m/s (b), inlet subcooling of 3 K.
Mathematics 11 02197 g009
Figure 10. Variation of the average bubble velocity in the flow direction and the average bubble velocity in the radial direction with inlet velocity.
Mathematics 11 02197 g010
Figure 11. Percentage of bubble velocity obtained from the mainstream.
Mathematics 11 02197 g011
Figure 12. Bubble sliding distance (a) and departure diameter (b) with heat flux of 0.3 MW/m2, inlet velocity of 0.2 m/s, inlet subcooling of 3 K.
Mathematics 11 02197 g012
Figure 13. Variation of the ratio of the maximum sliding distance to the minimum sliding distance with the inlet velocity.
Mathematics 11 02197 g013
Figure 14. Variation of the average sliding distance and the average bubble departure diameter with inlet velocity.
Mathematics 11 02197 g014
Figure 15. Variation of forces on bubble B1 and bubble velocity with time during the sliding process with heat flux of 0.3 MW/m2, inlet velocity of 0.2 m/s, inlet subcooling of 3 K.
Mathematics 11 02197 g015
Figure 16. Variation of surface tension force (a), shear lift force (b), quasi-steady drag force (c) and buoyancy force (d) acting on 12 bubbles with time during the sliding process with heat flux of 0.3 MW/m2, inlet velocity of 0.2 m/s, inlet subcooling of 3 K.
Mathematics 11 02197 g016
Figure 17. Variation of forces on bubble B1 with time during the sliding process with heat flux of 0.3 MW/m2, inlet velocity of 2 m/s, inlet subcooling of 3 K.
Mathematics 11 02197 g017
Figure 18. Variation of surface tension force (a), shear lift force (b), quasi-steady drag force (c) and buoyancy force (d) acting on 12 bubbles with time during the sliding process with heat flux of 0.3 MW/m2, inlet velocity of 2 m/s, inlet subcooling of 3 K.
Mathematics 11 02197 g018
Table 1. The expression of forces.
ForceX Flow DirectionY Radial Direction
Fs F s x = 1.25 d w σ π ( α - β ) π 2 ( α - β ) 2 ( s i n α + s i n β ) F s y = d w σ π α - β ( c o s β c o s α )
d w = 0.2 D b
Fsl- F s l = 1 8 C L ρ l π D b 2 u r 2
C L = 3.887 G s 0.5 ( R e b , r 2 + 0.014 G s 2 ) 0.25
G s = d u b u l k d y D b 2 u r
Fqs F q s = 3 π 2 3 + ( ( 12 R e b , r ) 0.65 + 0.796 0.65 ) 1 0.65 ρ l ν l u r D b R e b , r = D b u r ν l -
Fb- F b = 4 3 π r 3 ( ρ l ρ v ) g
where α angle and β angle are the angles between the tangential line along the bubble boundary and the wall surface at the contact point between the left and right sides of the bubble and the wall surface, respectively, as shown in Figure 1. In addition, D b is the bubble diameter and u r is the relative sliding velocity of the bubble defined as u r = u b u b u l k , u b is the bubble velocity and u b u l k is the velocity of the main fluid region, C L is the shear lift coefficient and G s is the dimensionless shear rate on the bulk flow.
Table 2. Structural dimensions and part boundary condition.
ComponentDimensions (mm)ComponentBoundary Condition
inlet diameter10inletmass flow inlet
outlet diameter16outletPressure outlet
length100inner wallwall
gap3outer wallwall
gapfluid
Table 3. Inlet velocity and mass flow value.
Inlet Flowrate
(m/s)
Mass Flux
(kg/s)
0.20.0305
0.30.0457
0.40.0609
0.50.0762
0.60.0914
20.3047
30.4570
40.6094
50.7617
Table 4. Thermophysical parameters of R134a.
Temperature
(K)
Pressure
(atm)
Liquid Density
(kg/m3)
Vapor Density
(kg/m3)
Liquid
Cp
(kJ/kg·K)
Vapor
Cp
(kJ/kg·K)
Heat
of
Vapor
(kJ/kg)
Liquid Thermal Conductivity
(W/m·K)
Vapor
Thermal
Conductivity
(W/m·K)
Surface Tension
(N/m)
285.154.37221254.021.5841.37680.95588189.100.0867470.0125840.0097684
286.154.51781250.522.2901.38010.96119188.270.0863120.0126760.0096325
287.154.66701246.923.0151.38350.96659187.430.0858780.0127690.0094969
288.154.81991243.423.7581.38690.97206186.590.0854440.0128620.0093617
Disclaimer/Publisher’s Note: The statements, opinions and data contained in all publications are solely those of the individual author(s) and contributor(s) and not of MDPI and/or the editor(s). MDPI and/or the editor(s) disclaim responsibility for any injury to people or property resulting from any ideas, methods, instructions or products referred to in the content.

