Article

Multiple Myeloma Cell Simulation Using an Agent-Based Framework Coupled with a Continuous Fluid Model

by
Pau Urdeitx
1,2,3,
Sandra Clara-Trujillo
4,5,
Jose Luis Gomez Ribelles
4,5 and
Mohamed H. Doweidar
1,2,3,*
1
Mechanical Engineering Department, School of Engineering and Architecture (EINA), University of Zaragoza, 50018 Zaragoza, Spain
2
Aragon Institute of Engineering Research (I3A), University of Zaragoza, 50018 Zaragoza, Spain
3
Biomedical Research Networking Center in Bioengineering, Biomaterials and Nanomedicine (CIBER-BBN), 50018 Zaragoza, Spain
4
Centre for Biomaterials and Tissue Engineering (CBIT), Universitat Politecnica de Valencia, 46022 Valencia, Spain
5
Biomedical Research Networking Center in Bioengineering, Biomaterials and Nanomedicine (CIBER-BBN), 46022 Valencia, Spain
*
Author to whom correspondence should be addressed.
Mathematics 2023, 11(8), 1824; https://doi.org/10.3390/math11081824
Submission received: 27 February 2023 / Revised: 5 April 2023 / Accepted: 6 April 2023 / Published: 12 April 2023
(This article belongs to the Special Issue Numerical Simulation in Biomechanics and Biomedical Engineering-II)

Abstract

:
Bone marrow mechanical conditions play a key role in multiple myeloma cancer. The complex mechanical and chemical conditions, as well as the interactions with other resident cells, hinder the development of effective treatments. Agent-based computational models, capable of defining the specific conditions for every single cell, can be a useful tool to identify the specific tumor microenvironment. In this sense, we have developed a novel hybrid 3D agent-based model with coupled fluid and particle dynamics to study multiple myeloma cells’ growth. The model, which considers cell–cell interactions, cell maturation, and cell proliferation, has been implemented by employing user-defined functions in the commercial software Fluent. To validate and calibrate the model, cell sedimentation velocity and cell proliferation rates have been compared with in vitro results, as well as with another previously in-house developed model. The results show that cell proliferation increased as cell–cell, and cell–extracellular matrix interactions increased, as a result of the reduction n maturation time. Cells in contact form cell aggregates, increasing cell–cell interactions and thus cell proliferation. Saturation in cell proliferation was observed when cell aggregates increased in size and the lack of space inhibited internal cells’ proliferation. Compared with the previous model, a huge reduction in computational costs was obtained, allowing for an increase in the number of simulated cells.

1. Introduction

Multiple myeloma (MM) is a heterogeneous cancer in the bone marrow, in which malignant cells grow from the resident plasma cells. These malignant cells can spread via the circulatory system and peripheral soft tissues [1]. MM is currently the second-most common hematological cancer in the world, being the cause of 15–20% blood cancers, and is incurable in most cases [2,3]. MM’s mortality rate is remarkably high, with less than 10% of patients achieving complete remission [1,2,4]. Appropriate diagnostic techniques can be key to establish patient-specific therapies, such as autologous hematopoietic stem cell transplantation—that may improve survival [1]. As this is a heterogeneous tumor, with multiple conditions related to malignant cells, high rates of drug resistance are common [1]. Likewise, the interaction of myeloma cells with the extracellular matrix (ECM) and other resident cells can also increase the risk of metastasis [4,5,6]. Indeed, the mechanical properties of the ECM have a high impact on both cell motility and the multiple myeloma cell (MMC) proliferation rate [4,5,6]. Feng et al. (2010) reported an increase in MMC stiffness, associated with the activation of focal adhesion kinases (FAKs) in hydrogel matrices as the collagen concentration increased [6]. In turn, this increased stiffness resulted in an increase in cell motility and tumor growth. A similar phenomenon was also observed when MMCs interacted with different cells in their microenvironment, such as mesenchymal stem cells (MSC), which increased tumor growth [5,6,7]. As such, the mechanical properties of the cellular environment, the ECM’s stiffness and cell–cell interactions, for instance, seemed to play a key role in tumor development, thereby affecting treatment efficacy and metastasis risk [5,8].
A better understanding of this heterogeneous tumor should lead to the development of new and more efficient treatments and better diagnostic techniques. In this regard, microfluidic chips and hydrogel matrices are widely used to study the cell response to different stimuli produced by the culture medium’s mechanical properties and mechanical interactions with other cells in the tumor environment [9,10]. However, given the complex nature of the bone marrow microenvironment, adjusting in vitro culture conditions to mimic in vivo conditions is not always straightforward [11,12]. In this sense, computational models can play a key role in conducting preliminary studies of these conditions, thereby allowing lower costs, as well as saving time [13,14]. In this context, there are two broad categories of computational models: 1—Continuous computational models, which are widely used to analyze the cell culture conditions—such as fluid dynamics, nutrients, chemical species’ concentrations [15,16,17]—and cells’ distribution in the medium [18,19,20], but which cannot analyze cell–cell and cell–ECM interactions, are critical for understanding MMC behavior; 2—Single-agent models, which can provide detailed information about each single cell considered—including their response to the cell-specific mechanical, chemical, electrical, and thermal stimuli received from their surrounding microenvironment [21,22,23,24,25,26,27,28,29,30]—but these are limited to small cell populations and require a detailed characterization of the cell environment.
Herein, we present a novel computational multiphase model designed for the advanced analysis of cell–cell, and cell–ECM interactions during MM tumor evolution. This model defines cells using the discrete particle model (DPM) in a fluidic environment, in which fluid and particle dynamics are coupled, thereby combining the concepts of the previously mentioned models (continuous and single-agent models) to enhance the performance of single-agent models while maintaining the advantages of continuous models. The cell processes are implemented via user-defined functions (UDF), taking into account fluid dynamics and cell-specific conditions.
This approach offers a valuable tool to support in vitro experiments by providing detailed information about the specific MMC environment and opening novel perspectives on the cell–ECM and cell–cell interactions.

2. Methods

The present computational model was developed to analyze the interactions between MMCs and their ECM. It couples particle dynamics with fluid dynamics, considering cell–cell interactions by analyzing the cells using the discrete element method (DPM-DEM), implemented in Fluent (Ansys [31]) (ANS). The results were compared with those of a model developed previously in-house, using the commercial software Abaqus (ABQ) [32], which was adapted and calibrated with appropriate parameters to simulate MMCs [33,34]. Cell processes in both models were modulated by the specific cell conditions and implemented via UDFs. Both models were used to analyze the progression and development of MM tumor aggregation.

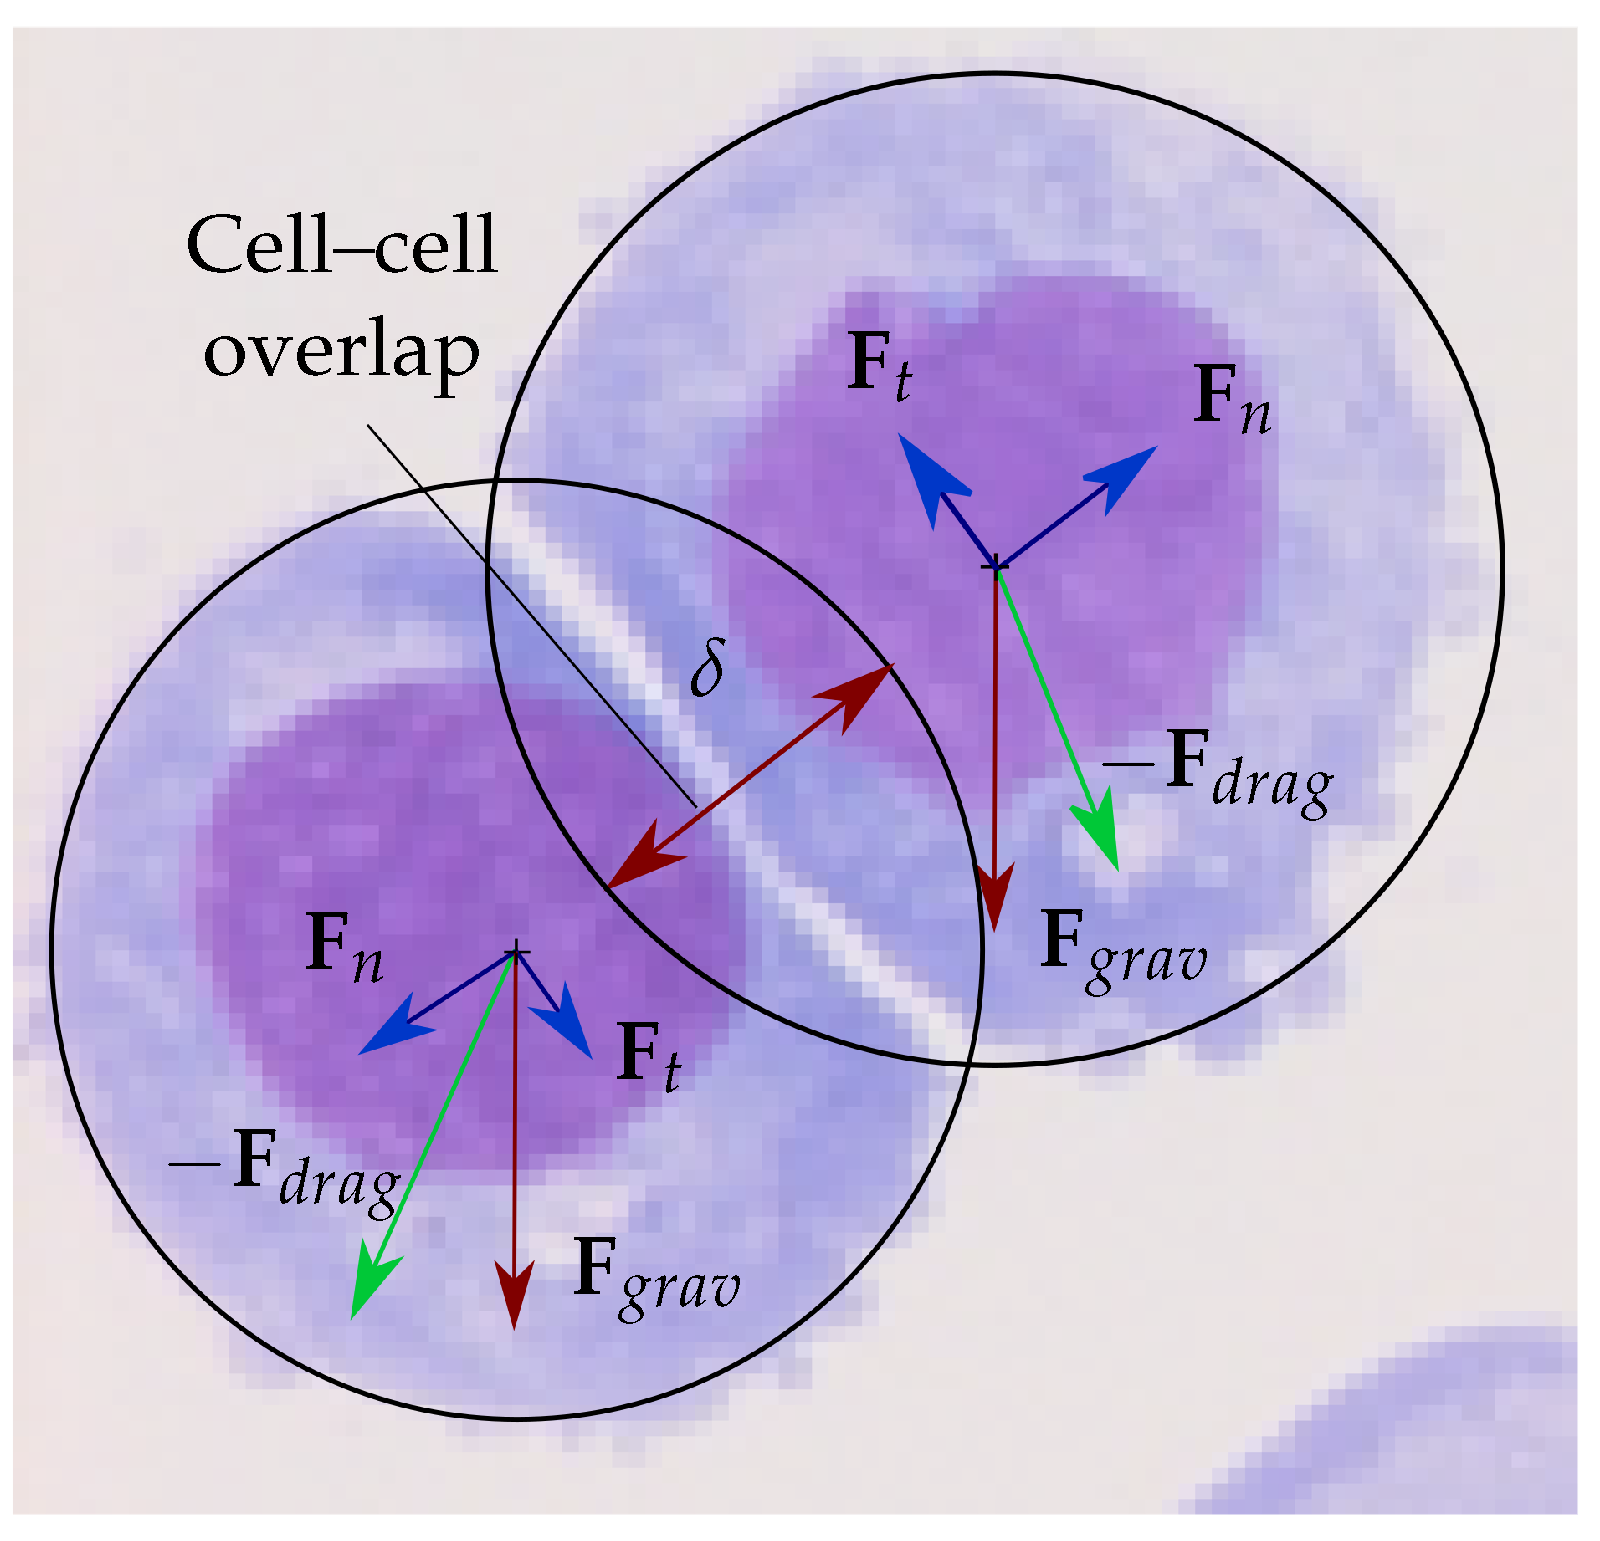
2.1. Multiphase Coupled Fluid-Particle Model (ANS)

In this article, we present a hybrid computational model, which combines the formulation of two classical methods: continuous and discrete methods. Indeed, due to the mathematical incompatibility of both models, each one calculates the corresponding phase in parallel, and the bidirectional interactive coupling of the methods is achieved through the intercommunication of the properties and conditions of each phase. Fluid dynamics are included in the cell through the inclusion of velocity, density, and viscosity values of the fluid in the motion equation of the cell. Besides, the perturbation of the continuous phase, due to the motion of the cells, is included as an external contribution to the momentum balance equation. Therefore, although both models are calculated in parallel, consistency and stability are guaranteed through common variables such as cell and fluid velocities.
In the discrete phase, our objective was to determine the cell velocity, v c , at every time step, t. In such a case, cell motion was transferred as a moment applied to the particle corresponding to the drag forces applied during the cell–ECM interaction. Other contributions, such as the gravity or collision forces, were also taken into account, with the trajectory of the discrete phase being obtained using the force balance acting on the cell as [31]:
m d v c d t = F d r a g + F r + F g r a v + F i j ,
where m is the cell mass, and F d r a g , F r , and F g r a v are the corresponding contributions of the drag force, domain motion, and gravity, respectively. As the considered experiments have been developed in static conditions, in this paper, there is no contribution of F r component. Besides, the contribution of the gravity forces is defined by considering differences in the cell and media mass density as:
F g r a v = m g ( ρ c ρ f ) ρ c ,
where g is the gravity acceleration, ρ c is the cell mass density, and ρ f is the fluid mass density.
Other forces acting on the cell, such as cell–cell, and cell–wall collision forces, are referred to as F i j .
The drag force on cells, as calculated using the cell constant spherical shape, is proportional to the difference between the cell and fluid velocity, as follows:
F d r a g = 1 2 C D ρ f A c v f v c ( v f v c ) ,
where C D is the drag coefficient, A c is the cell cross-section, and v f is the fluid velocity.
In the event of overlap, cell–cell and cell–wall collision forces were taken into account using the discrete element method (DEM) (Figure 1). These collision forces were described by defining the stiffness of the contributing parts (cell–cell or cell–wall) and the overlap distance, δ i j , which was calculated as follows [31]:
δ i j = x i x j ( r i + r j ) ,
where x i and x j are the positions of the participating cells, while r i and r j are their radii. The cell–cell contact direction, e i j , can be defined as:
e i j = ( x i x j ) x i x j .
The Hertzian–Dashpot Collision Law was then used to establish the collision normal force, F n ,:
F n = ( K H δ i j 3 / 2 + γ ( v i j e i j ) ) e i j ,
where γ is the damping coefficient, and v i j represents the relative velocity of the collision, defined as v i j = v j v i . Finally, K H is the stiffness coefficient of the collision, which was calculated using the stiffness of the participating cells, as:
K H = 4 3 E i E j E j ( 1 ν i 2 ) + E i ( 1 ν j 2 ) r i r j r i + r j ,
where E i ,   E j and ν i , ν j are the stiffness and the Poisson coefficient of the cells involved, respectively.
The tangential force, F t , in the contact area described by the friction coefficient, μ , is defined as:
F t = F n μ .
The contribution of the collision force, F i j , to cell motion (Equation (1)) was then calculated for each cell using tangential and normal forces as follows:
F i j = i ! = j n F n i j + F t i j .
For its part, in the continuous phase, the objective is to determine the fluid velocity, v f , taking into account its active interaction with the cells. In such a case, the momentum exchange between the continuous and discrete phases, F e x , is the change in the particle’s momentum as it goes through each control volume at each flow time, Δ t . During the momentum balance, this momentum exchange is regarded as a momentum source in the continuous phase and is defined as [31]:
F e x = 18 μ C D R e ρ c ( 2 r i ) 2 24 ( v c v f ) m ˙ c Δ t ,
where μ is the fluid viscosity, R e is the relative Reynolds number, ρ c is the cell density, and m ˙ c is the mass flow rate of the discrete phase.
Thus, the general equation for the momentum conservation of the continuous phase results in [31]:
t ( ρ f v f ) + ( ρ f v f v f ) = p + τ + ρ f g + F e x ,
where ∇ is the divergence operator, p is the static pressure, g is the gravitational acceleration, and τ is the contribution of the stress tensor given by:
τ = μ ( v f + v f T ) 2 3 v f I ,
where I is the unit tensor.
Cells evaluate and respond to the specific mechanical conditions to which they are subjected during cellular processes, such as proliferation and differentiation [35,36]. Thus, we defined the cell-cycle progression as the maturation index (MI), which is a time-dependent process, as:
MI = t c t m a t t c < t m a t , 1 t c t m a t ,
where t c is the cell-cycle progression time, and t m a t is the time needed for the cell to undergo cellular processes, such as proliferation and differentiation [30]. In addition, the maturation time is dependent on the mechanical conditions of the cell. In this model, due to the consideration of the fluidic environment, the mechanical conditions perceived by the cell were defined in terms of the number of cell–cell ( N c ) and cell–wall ( N w ) contacts at each time step increment as:
t m a t = t n 1 + γ w N w + γ c N c ,
where γ w and γ c are the proportional time factors for the cell–wall and cell–cell interactions, respectively, and t n is the natural maturation time, which is the time needed by the cell to complete the cell cycle without stimulus. As a cell progresses through the cell cycle, it becomes ready to divide into two new cells, thereby implying that the cell expands in size before proliferating. Thus, we assumed that the cell radius increases proportionally to the state of maturation as follows:
r i = r 0 ( 1 + MI 2 ) ,
where r i is the cell radius for each ith cell at each time step, and r 0 is the nominal cell radius obtained from the literature [37].

2.2. Design of In Vitro Experiments and Data Collection

Experimental data from MMC lines were used to validate the model. The MMC line RPMI8226 was cultured in vitro in multi-well plates. RPMI8226 was purchased from the American Type Culture Collection (ATCC, Rockville, MD, USA) and cultured in RPMI1640 medium supplemented with 10 % fetal bovine serum (FBS), 2 mM L-glutamine and 100 μ g/mL penicillin, and 100 μ g/mL streptomycin. Cells were cultured at 37 °C under a 5% CO2 atmosphere in a Galaxy S incubator (Eppendorf New Brunswick, Hamburg, Germany). A total of 100,000 cells were seeded in 500 μ L of medium in p24 multi-well plates. Every 24 h, 50% of the volume of culture medium was renewed. After 24, 72, and 96 h of culture, cell proliferation was determined using the colorimetric MTS assay, according to the manufacturer’s instructions, pipetting the supernatant onto a 96-well plate and reading at 490 nm (Victor 3 microplate reader, Perkin Elmer, Waltham, MA, USA). The results obtained are presented in [38].

2.3. Model Assumptions

In order to reduce the computational costs of the model, we made some assumptions. Thus, the cell geometry is considered to be spherical with no changes in its morphology [14,22]. We also considered a reduced, but significant, portion of the whole in vitro experiment to reduce the number of cells simulated. Cell properties were obtained, when possible, for the RPMI-8226 cell line to adequately compare results with the in vitro experiments (Table 1). In general, these properties were considered homogeneous for all participating cells, although slight discrepancies are possible due to the non-homogeneous nature of MM tumors [9]. Finally, neither oxygen nor nutrient consumption were considered.

3. Results

We proposed two experiments to validate the in silico model. In the first experiment, we compared cell sedimentation velocity to validate the mechanical model as well as the ECM and cell interactions considering a few cells in a large-scale ECM. The duration of the experiment was adapted to the time required for cell sedimentation. In the second experiment, we compared cell proliferation in a reduced slice of the ECM, starting with the same cell concentration as described in Section 2.2, considering four days of cell–cell and cell–ECM interactions. In this experiment, we increased the number of cells and the geometry to study tumor aggregates’ growth.

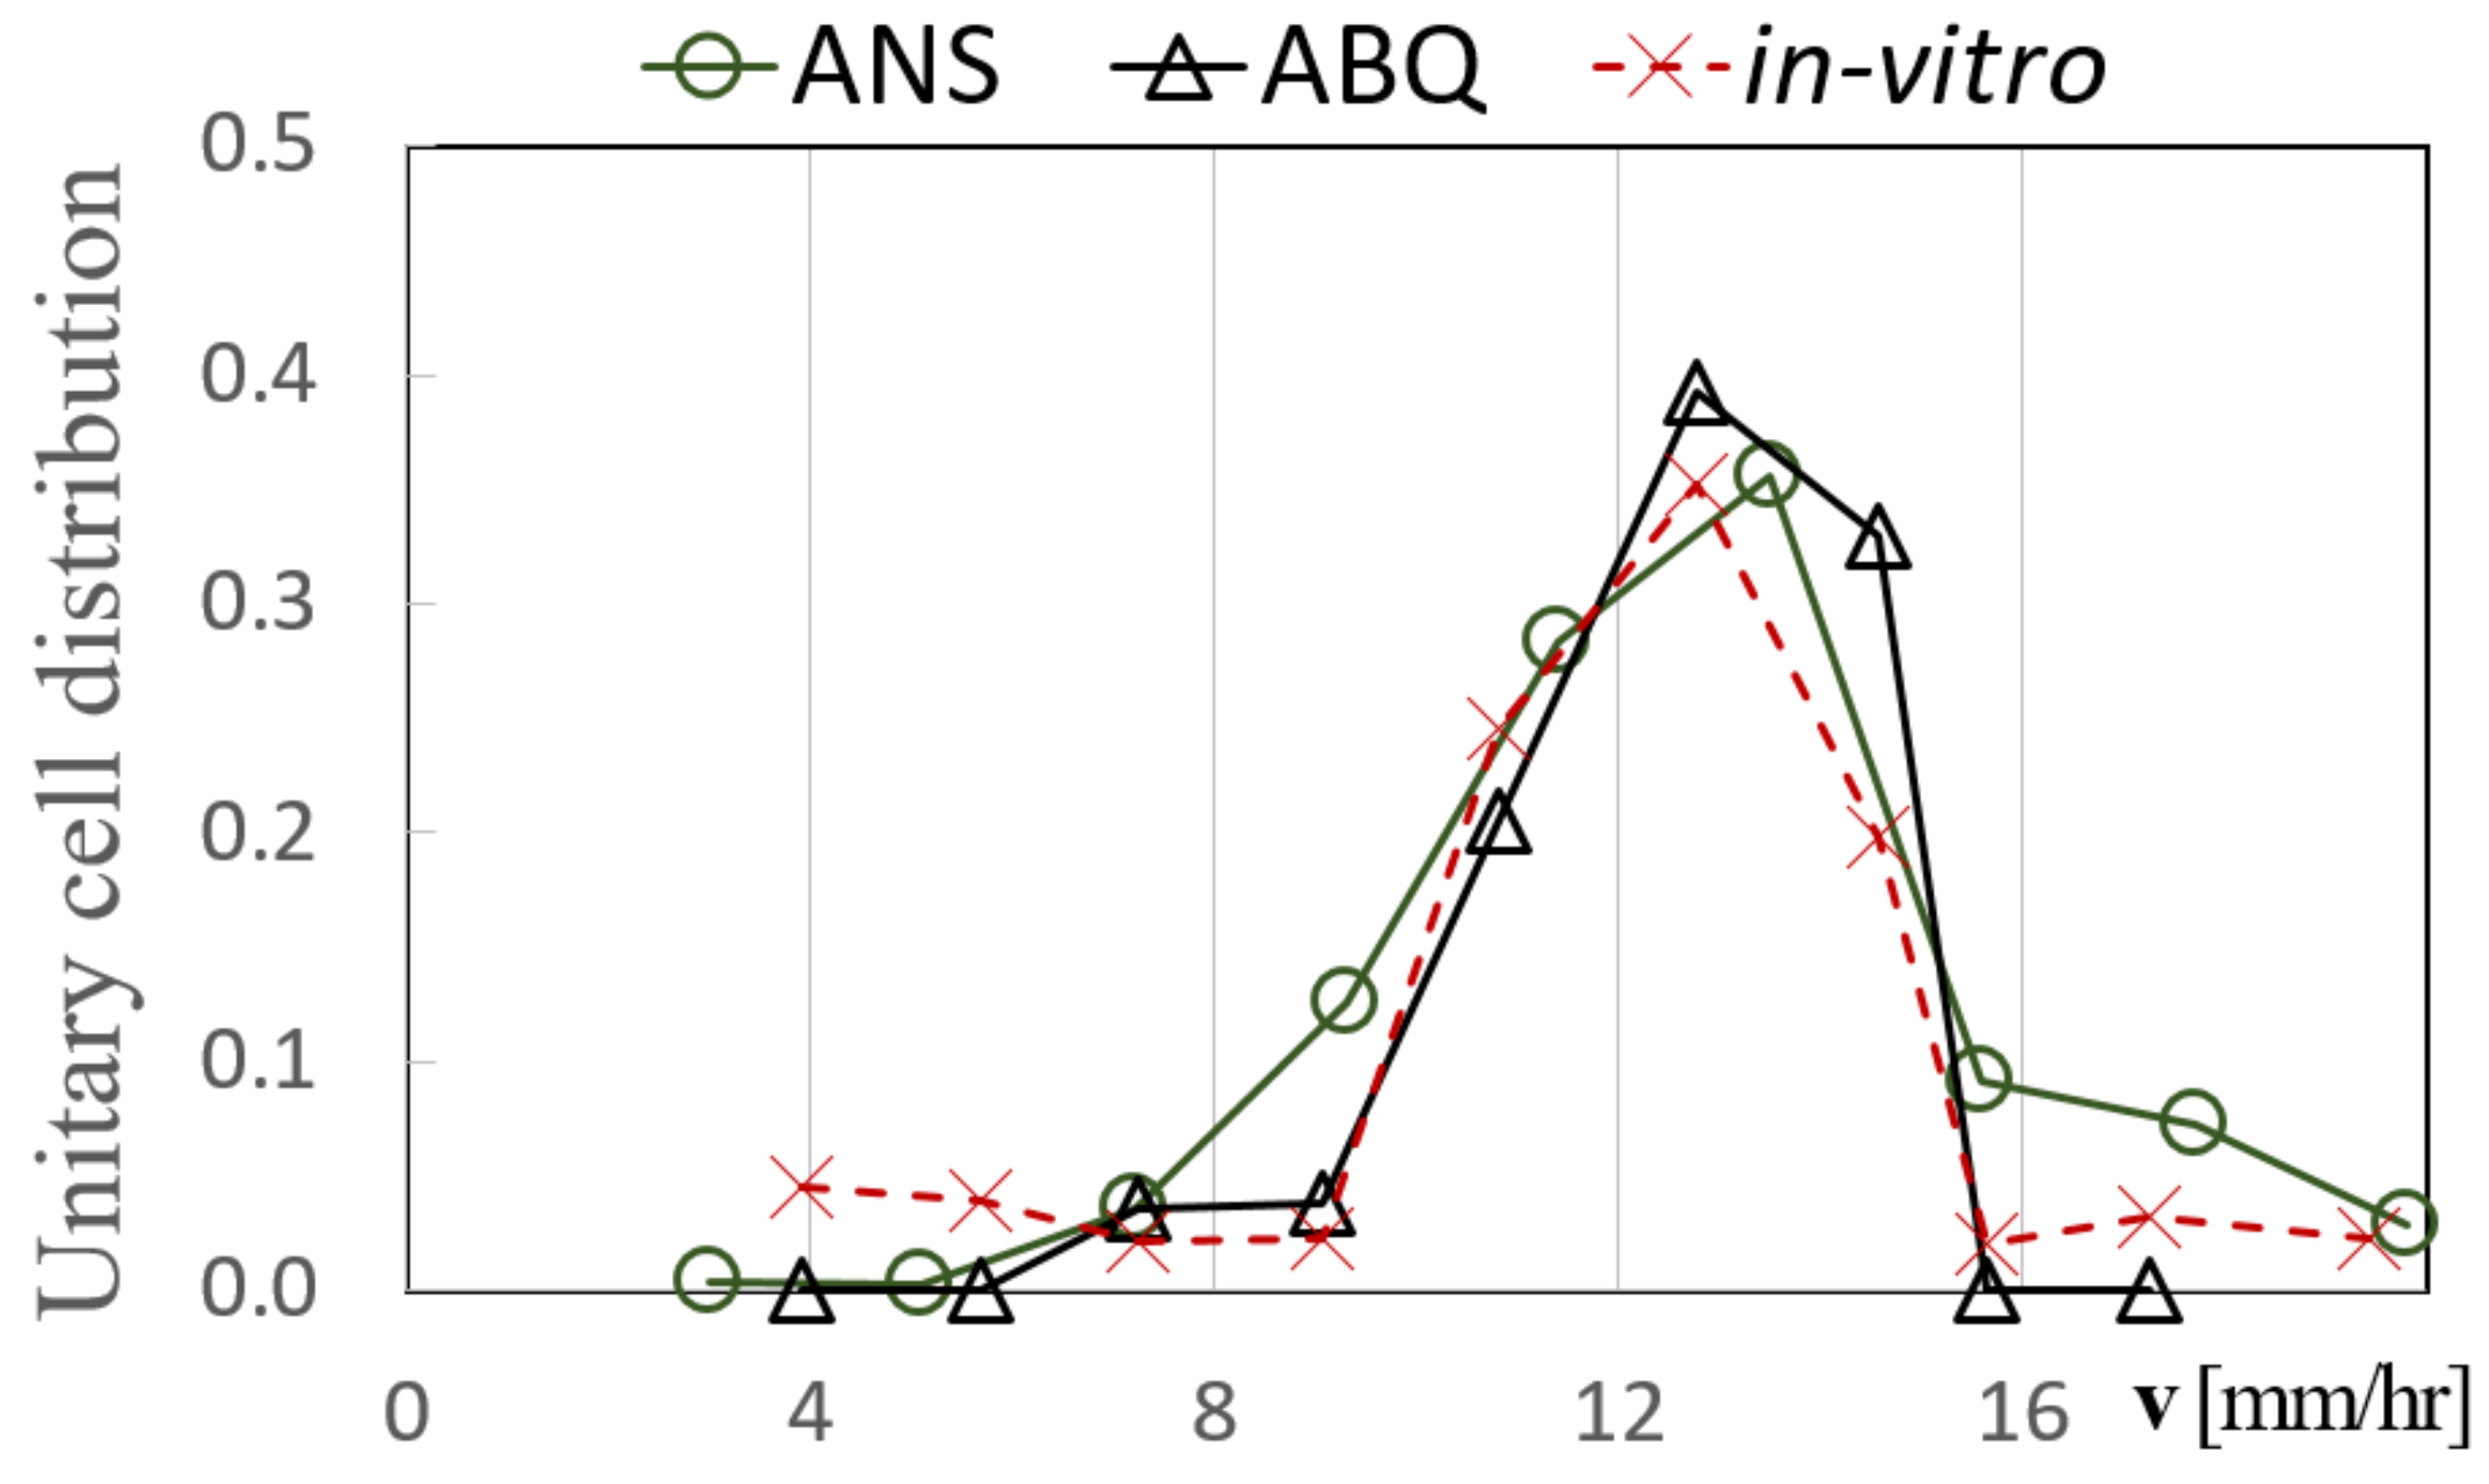
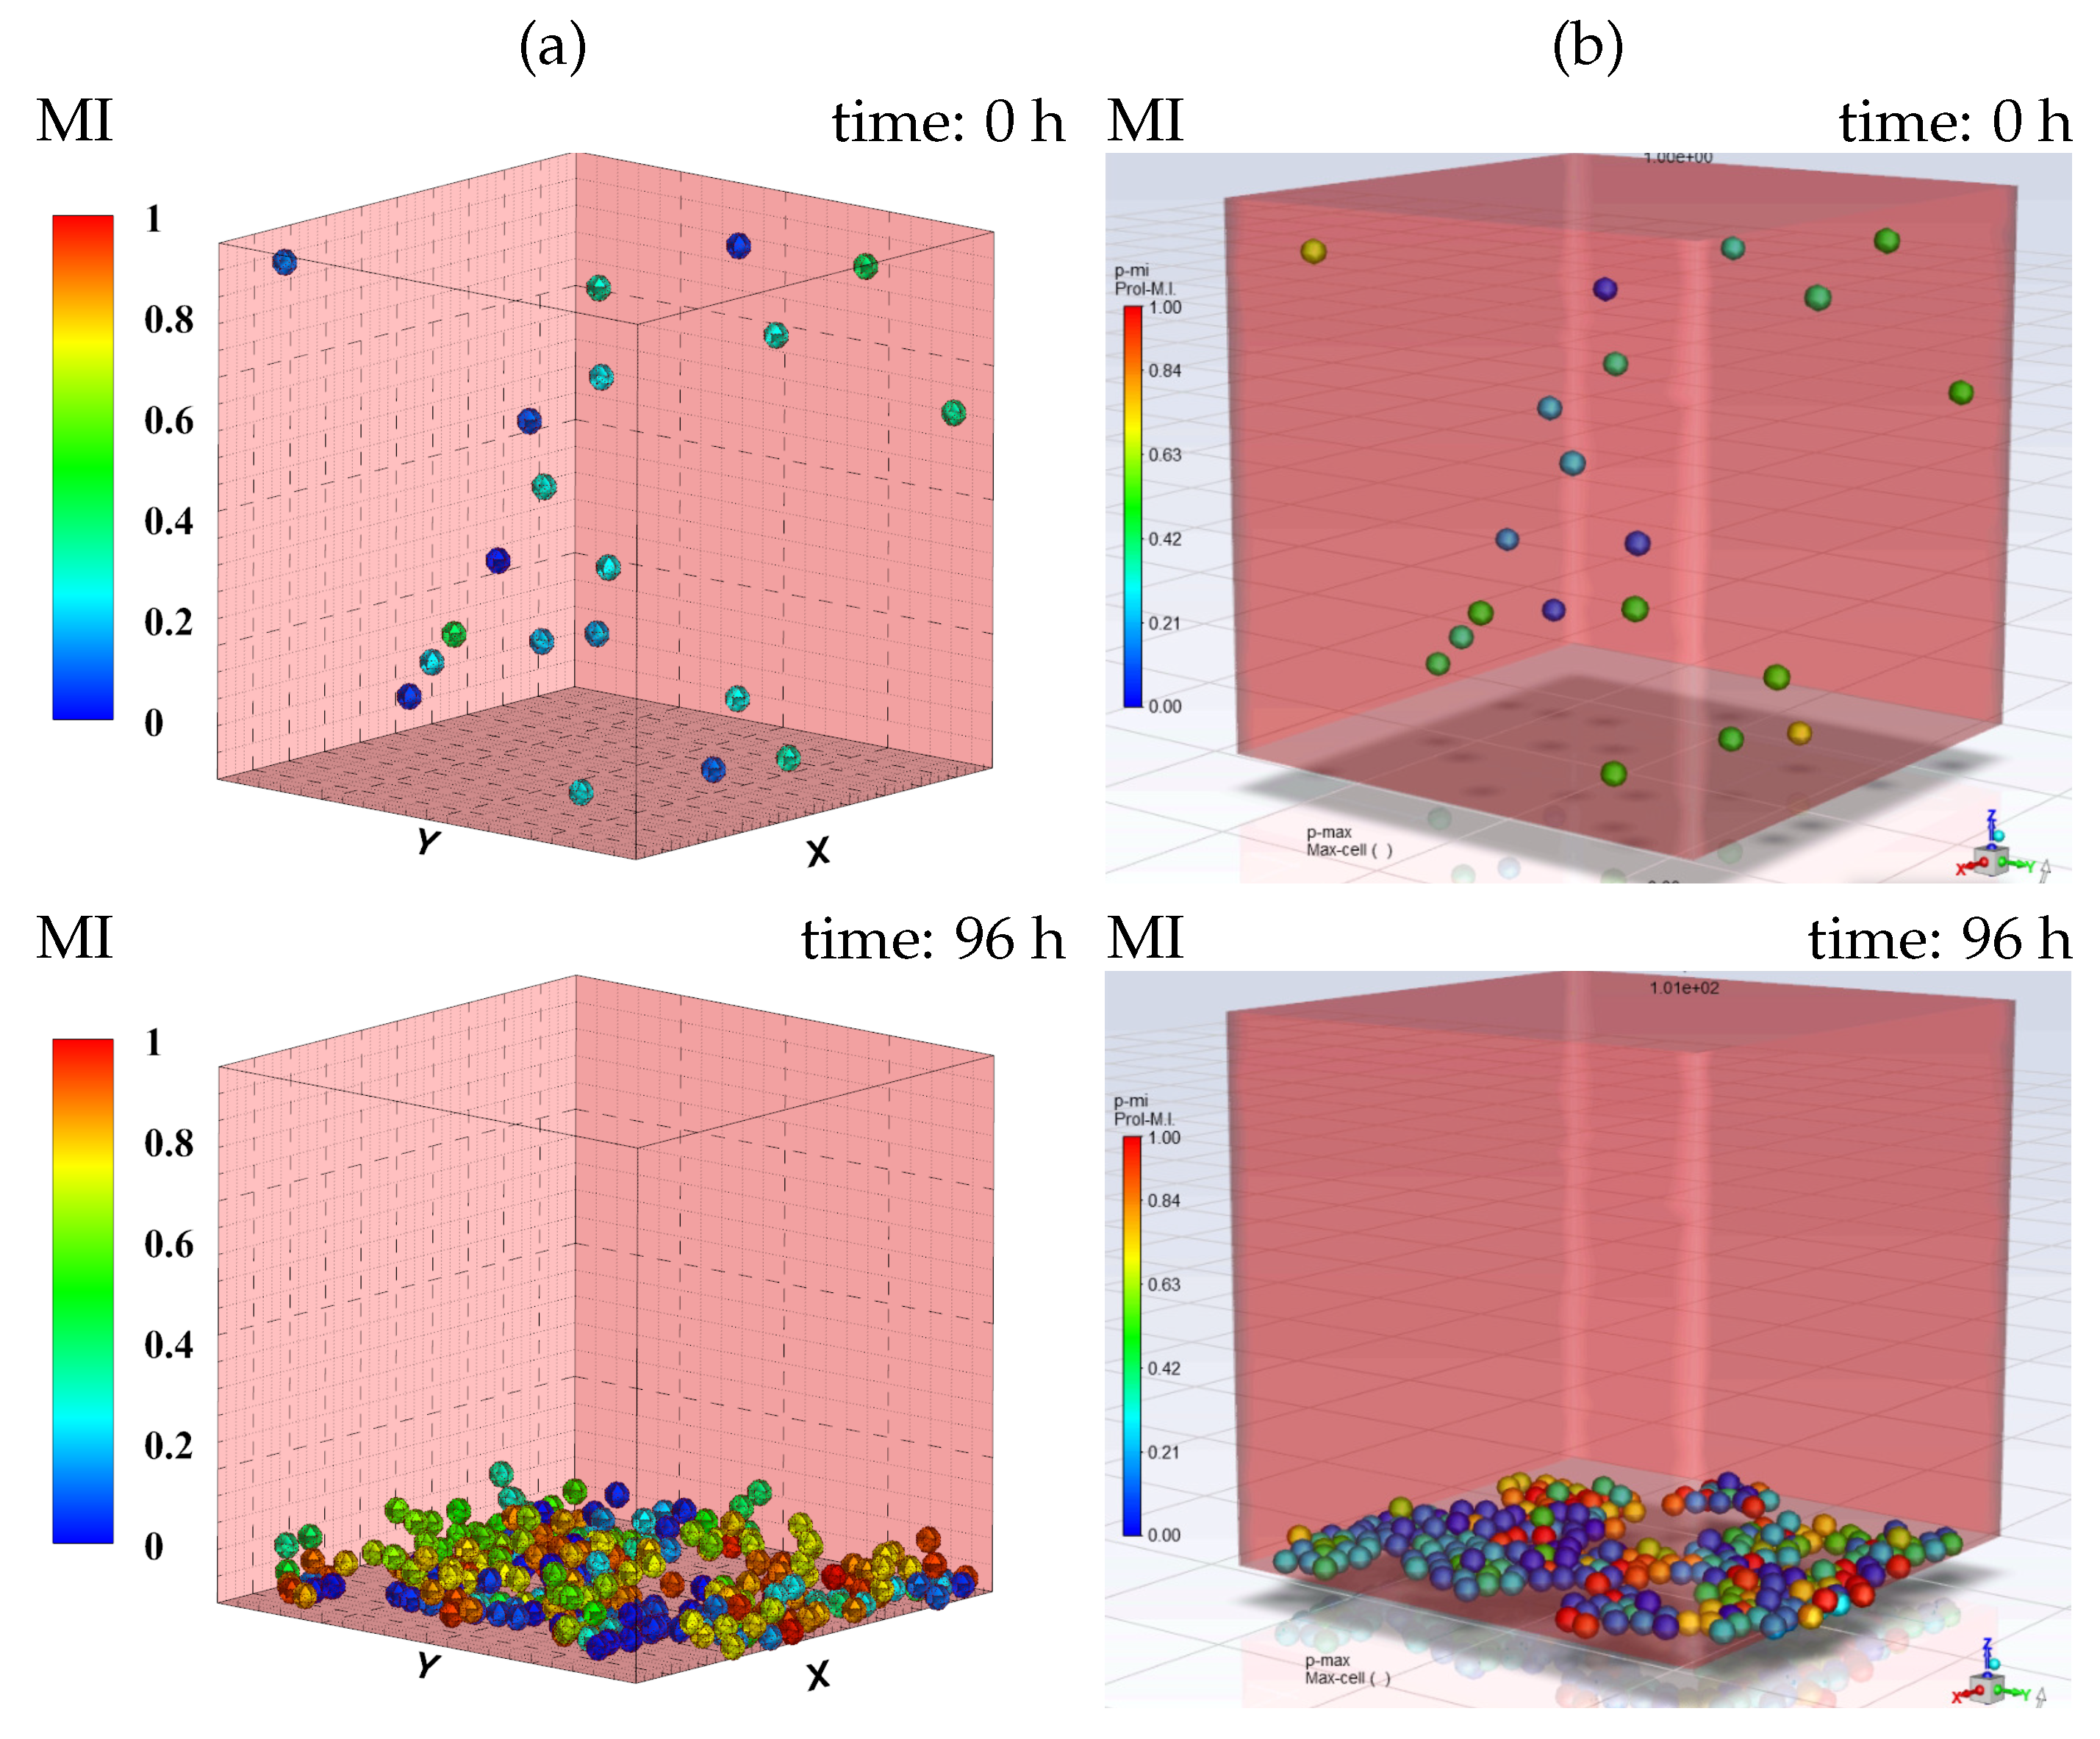
3.1. Cell Sedimentation

The velocity of cell sedimentation was compared to that of in vitro models found in the literature [44]. We compared the evolution of cell sedimentation velocity using a reference portion of the ECM with a base of 30 × 30 μ m and a height of 4.5 mm. The results were compared using the mean values from five cases with different initial cell distributions. In all cases, cells were seeded in the ECM with a random distribution, with an equivalent initial cell concentration in the in vitro experiment used as a reference (5 × 10 5 cells/mL) [44]. The time step increment was decoupled for cell position tracking ( 0.1 s) and fluid time step (5 s), and the cell sedimentation velocity was obtained for all cells over a simulation time of 15 min.
The mean cell sedimentation velocity for both computational models was around 13 mm/h (Figure 2), which is consistent with the experimental results [44]. The obtained curves with both models have been compared with the reference data, through the value of the mean square error (MSE), obtaining values of 0.0026, and 0.0029 for the ABQ and ANS models, respectively. As the objective of the case was the calibration and validation of the models, it is possible to conclude that both models give a valid approximation. In addition, the difference between them is not significant. Higher velocities were obtained using the ANS model, which considered the inertial effects of cells, as well as the changes in cell diameter, which is related to the cell maturation state. The ABQ model was unable to reproduce the maximum velocity (16 mm/h), and the cell distribution velocity observed was more homogeneous.

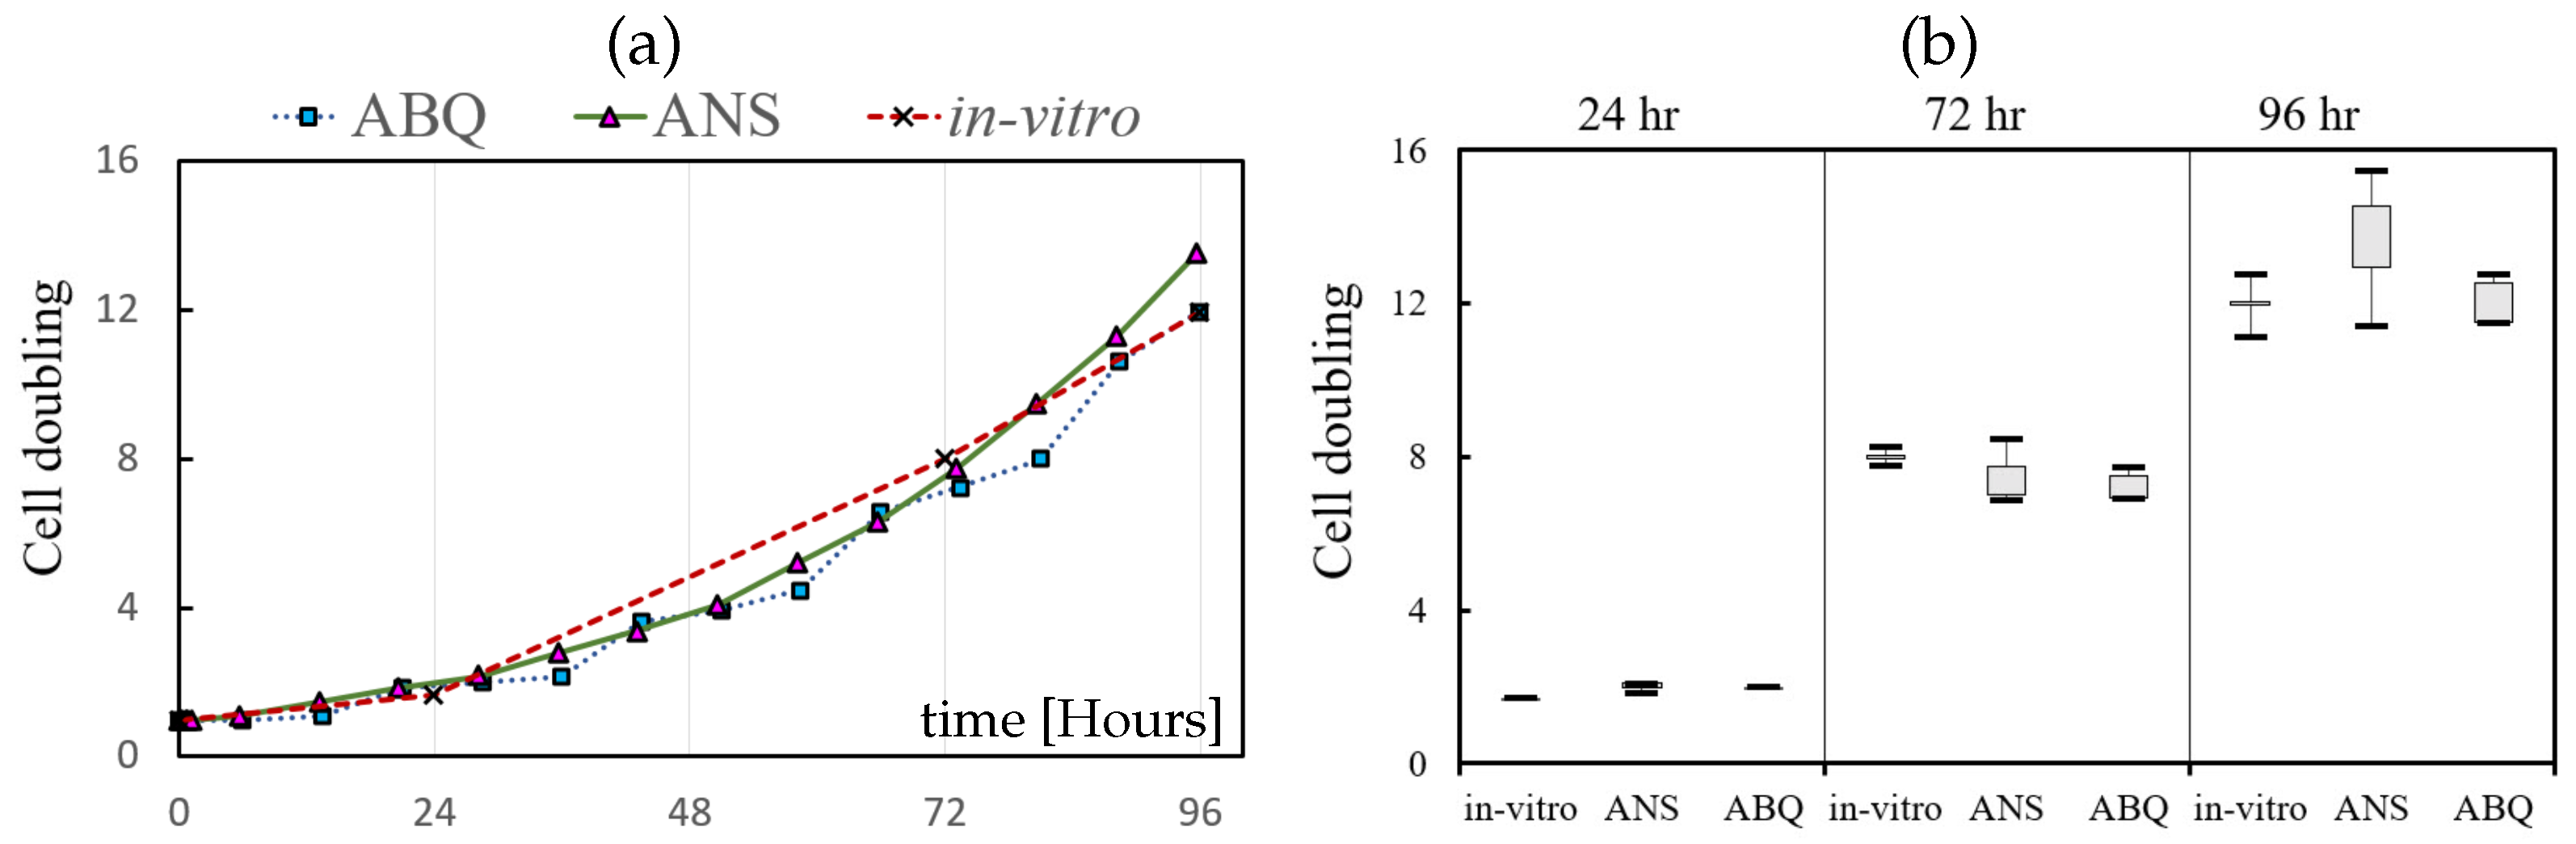
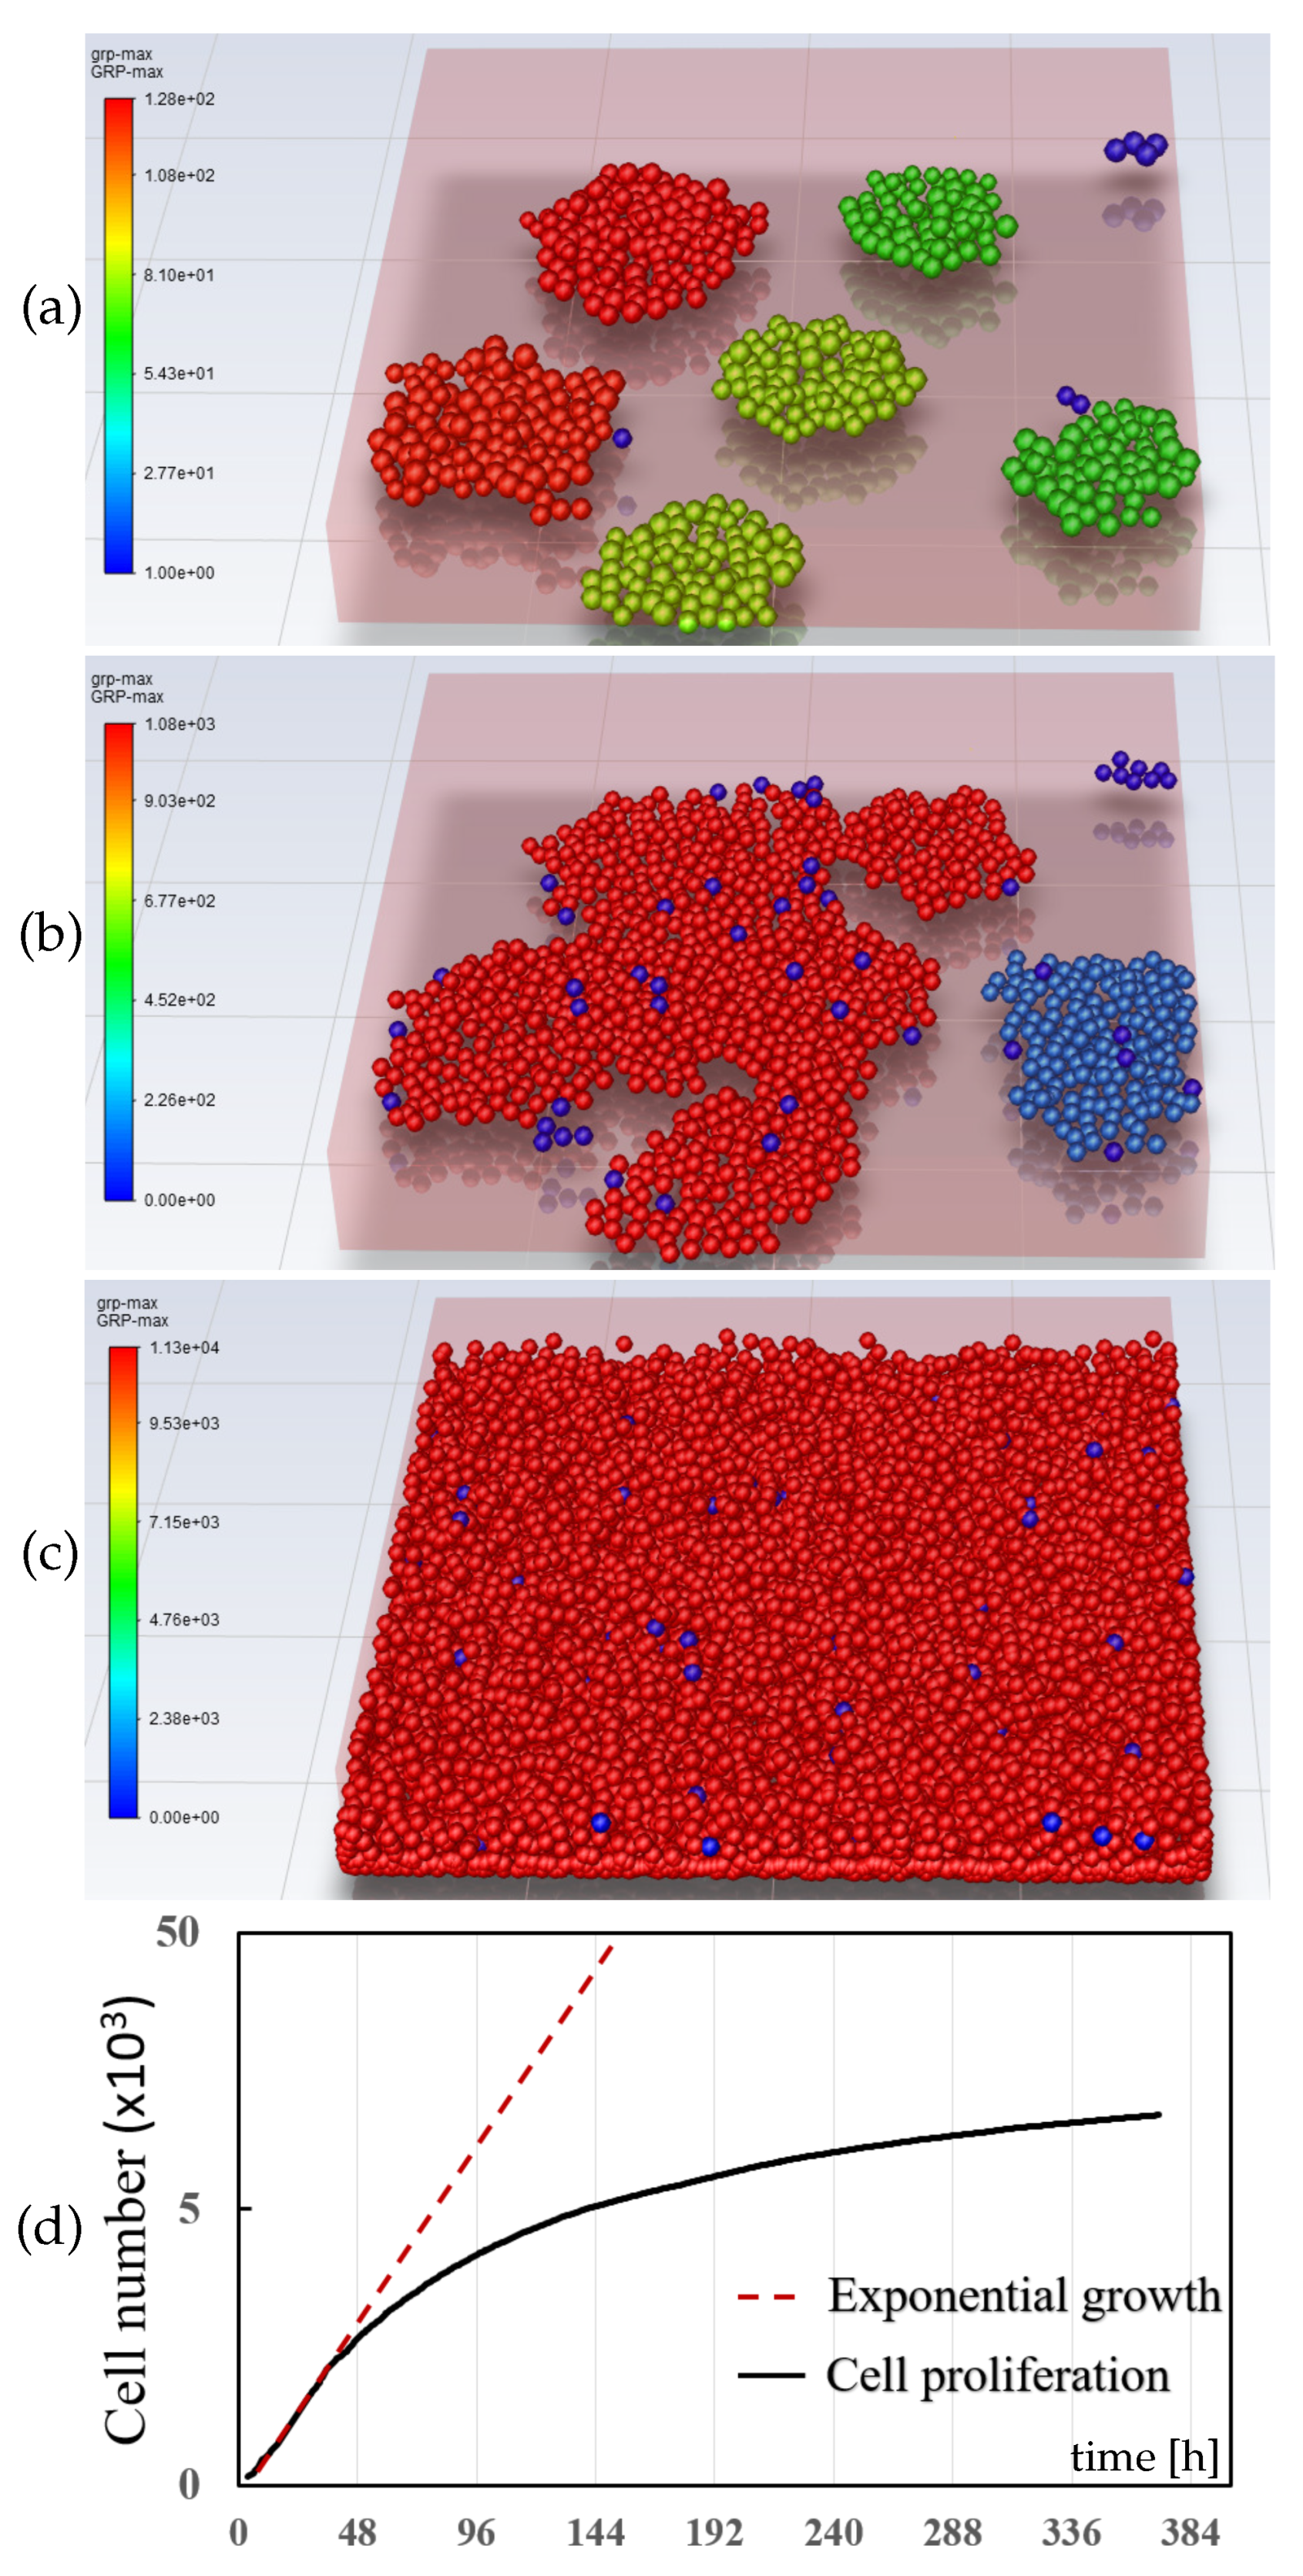
3.2. Cell Proliferation

Cell proliferation was compared to the experimental data detailed in Section 2.2 [38]. Similarly to the first case (cell sedimentation) the results were compared with five different initial cell distributions. Based on the initial cell concentration described in Section 2.2, 20 MMCs were randomly seeded in an ECM of 200 × 200 × 200 μ m, with their initial state of maturation being randomly assigned. Due to differences in the timescale of the various events, different time step increments were considered for the fluid domain ( 0.5 h), cell position tracking (1 s), and cell processes (0.5 h), for a total time of 96 h.
The cell distribution and initial state of maturation were randomly assigned for both computational models (Figure 3 top). After 10–30 h, depending on the initial state of maturation considered in each case, a few cells proliferated. The proliferated cells were randomly scattered around the mother cells. After four days of simulation, several cell distributions were observed in all cases (Figure 3 bottom), although the final number of cells was always comparable (240–260 cells). The results of cell proliferation were normalized with respect to the initial cell number and compared with the in vitro experiments (Figure 4a). In general, cell proliferation was consistent with the experimental data, and the ANS model exhibited greater homogeneity in terms of cell proliferation. An increase in the variability of cell proliferation was observed at later times, with a higher number of cells and higher variability in terms of the specific conditions of each cell (Figure 4b).

3.3. Tumor Aggregation Growth

After calibration and validation of the initial model, the formation of tumor aggregates, due to the proliferation of individual cells, was studied in a long-term case. Cells were initially distributed into groups to form cell aggregates in an ECM of 400 × 400 × 50 μ m , then were simulated for 360 h.
The number of cells in each cluster increased due to cell proliferation and, after 30 h, all clusters were considered to be tumor aggregates (minimum of 30 cells). Given the increase in the number of cell–cell contacts (∼6.1% per hour), the internal cells in these aggregates showed the highest increase in maturation rate (∼30.3%). However, once the cell was completely surrounded, cell proliferation was inhibited due to the lack of space (Figure 5). After 60 h, tumor aggregates started to merge with each other, and by the end of the simulation, all cells had joined together to form a single cluster. The cell proliferation rate was higher in the first 48 h, when exponential cell growth was observed, and then progressively reduced as more cells became completely surrounded (Figure 5d).

4. Discussion

The results obtained for the two models studied are qualitatively consistent with the in vitro results found in the literature [9,10,38,44,46,47]. In general, when compared to the results for the ABQ model, the ANS model appeared to be better. Thus, in the first experiment, we observed a wider range of cell sedimentation velocities for the ANS model when compared to the ABQ model. This disparity was caused by two major factors: firstly, the ANS model considers inertial contributions in the force balance, although the effect may be very small due to the model’s scale; secondly, in the ANS model, the cell diameter was considered to be proportional to the state of maturation, which results in an increase in both the cell weight and cross-section and, consequently, in the drag coefficient, which, in turn, may cause higher variability in the distribution of cell velocities, as well as higher maximum values. As such, the ANS model appears to be more realistic with regard to the non-homogeneity of cellular properties.
The ABQ model was able to reproduce the mechanical environment more precisely by considering the internal cell deformations, and cell-active forces that lead to cell–cell adhesion (Figure 3a) [48,49]. Thus, cells in the ABQ model tended to stay attached, while cells in the ANS model tended to form layers at the bottom. The results of cell proliferation for both models were consistent with the in vitro results (Figure 4). The presence of newly proliferated cells and the formation of new cell–cell contacts accelerated cell maturation. Due to the reduced number of MMCs simulated, we observed abrupt initial stages of proliferation, which became more homogeneous as the number of cells increased and the cells responded to their specific conditions. This increase in homogeneity was higher for the ANS model, with a continuous progression in cell proliferation after 48 h, (∼9.9% per hour). In the ABQ model, a complete smoothing of the curve was not achieved (Figure 4), due to the limited ability of the model to reproduce cell mechanical conditions in fluidic environments. As the main factor that modulates maturation in the ABQ model was related to the ECM stiffness and internal cell deformations, the results did not fit well in fluidic environment simulations. The ANS model appears to be more suitable for defining the cellular microenvironment of a liquid medium, as it can capture a wide range of conditions for each individual cell.
The growth of MMCs, which form tumor aggregates, increased as cell–cell and cell–ECM interactions increased. However, in vitro, once the cell aggregate reached a certain size, the increase in proliferation rate was reversed, thus indicating that cell proliferation can be inhibited by a variety of factors. Likewise, in the numerical models, the lack of available space to generate new cells caused a saturation effect, thus preventing internal cells from proliferating further. This lack of space was exacerbated in in vitro and in vivo experiments by the cells’ difficulty in accessing necessary resources, such as O 2 , nutrients, and growth factors. At this point, the growth of the aggregate requires the development of new blood vessels to allow the internal cells to be supplied with the necessary resources.
From a computational point of view, higher computational costs were observed with the ABQ model, which was discretized using elements with a size proportional to that of the cell (3 μ m), since the definition of the cells was based on the nodes of the mesh. As a reference, for the second experiment, a mesh of 343,000 trilinear hexahedral elements was generated. The time cost for the first and second experiments was approximately 30 and 60 h, respectively, in a computing cluster with four cores and 16 GB of RAM. The ANS model, in turn, can be discretized with a much larger mesh size (10 μ m), and use of the decoupled cell-tracking time allowed us to significantly reduce computational costs. In this case, the required time cost was approximately 5 h on a personal computer with an i5-650 processor and 16 GB of random-access memory (RAM). We also observed a significant limitation in the maximum number of cells for the ABQ model, which increased the memory requirement exponentially. Thus, it was not possible to simulate the third experiment in the ABQ model due to the computational costs.
As a result, there are several advantages to using the ANS model rather than the ABQ model, including the ability to define, more accurately, the conditions of the experiments conducted. In this sense, when mechanical conditions are the most important factor in cell behavior and a precise description of cellular forces is required, the ABQ model appears to be more appropriate, as it provides a more comprehensive control of the mechanical conditions of the cell microenvironment. However, when these conditions were less important (for example, in fluidic environments) and a large number of cells (and, thus, a large control volume) was required, the coupled fluid-particle model appears to be the best choice.

5. Conclusions

We have presented a new computational model to study MMC behavior and tumor growth. The model was compared to a previous in-house ABQ computational model [29], as wel as with the experimental results obtained by the authors and from the literature [9,10,38,44,46,47]. The results obtained are qualitatively consistent with the literature. The obtained results show that the initial cell concentration has a clear effect on MMC growth, with cell proliferation increasing as the numbers of cell–cell and cell–ECM interactions increase. As such, we observed faster cell maturation for cells with more cell–cell and cell–ECM interactions (reduction in maturation time of up to 69.7%), while cell proliferation was inhibited when a lack of space was observed.
From a computational viewpoint, the ANS model offers several advantages when compared with the model developed previously. Better results for the MMC sedimentation velocity and tumor growth were obtained due to the more representative definition of the fluidic environment and the consideration of a non-homogeneous cell volume. Compared with the ABQ model, we observed reduced computational costs for adequately simulating cells and the cell microenvironment. The maximum number of cells in the ABQ model was limited and proportional to the number of discretized elements in the ECM. In this case, increasing the ECM implied increasing the number of elements, which dramatically increased computational costs. As the ANS model simulation time step seems to be the main responsible of these computational costs, using a decoupled calculation time step for the cells and fluid reduced them. Thus, the model developed herein has significant advantages compared to the previous model in computation, as it results in a significant reduction (84–91%) in computational costs, which allows a more realistic simulation. Although not considered in this model, additional advantages can be added to the ANS model, such as the consideration of nutrient diffusion and consumption, non-stationary fluid flow and pressure gradients, or the presence of blood vessels in an in vivo analysis.

Supplementary Materials

The following supporting information can be downloaded at: https://www.mdpi.com/article/10.3390/math11081824/s1, Video S1: Video_Fig_3(a); Video S2: Video_Fig_3(b); Video S3: Video_Fig_5.

Author Contributions

Conceptualization, P.U. and M.H.D.; methodology, P.U. and M.H.D.; in vitro analysis, S.C.-T. and J.L.G.R., software, P.U. and M.H.D.; validation, P.U., S.C.-T., J.L.G.R. and M.H.D.; formal analysis, P.U. and M.H.D.; investigation, P.U. and M.H.D.; resources, J.L.G.R. and M.H.D.; data curation, P.U., S.C.-T., J.L.G.R. and M.H.D.; writing—original draft preparation, P.U. and S.C.-T.; writing—review and editing, J.L.G.R. and M.H.D.; visualization, P.U.; supervision, J.L.G.R. and M.H.D.; project administration, J.L.G.R. and M.H.D.; funding acquisition, J.L.G.R. and M.H.D. All authors have read and agreed to the published version of the manuscript.

Funding

This research was funded by the Spanish State Research Agency (AEI/10.13039/501100011033) through the projects PID2019-106099RB-C44 and C41, and the Government of Aragon (DGA-T24 20R). This work was also supported by the Spanish Ministry of Science, Innovation and Universities through Grant N- FPU17/05810 awarded to Sandra Clara-Trujillo.

Data Availability Statement

All the data and results are included within the manuscript.

Acknowledgments

The authors would like to thank the anonymous reviewers for their thorough reading and professional comments that helped improve the manuscript.

Conflicts of Interest

The authors declare no conflict of interest.

References

  1. Kumar, S.K.; Rajkumar, V.; Kyle, R.A.; van Duin, M.; Sonneveld, P.; Mateos, M.V.; Gay, F.; Anderson, K.C. Multiple myeloma. Nat. Rev. Dis. Prim. 2017, 3, 17046. [Google Scholar] [CrossRef] [PubMed]
  2. Perez-Amill, L.; Suñe, G.; Antoñana-Vildosola, A.; Castella, M.; Najjar, A.; Bonet, J.; Fernández-Fuentes, N.; Inogés, S.; López, A.; Bueno, C.; et al. Preclinical development of a humanized chimeric antigen receptor against B cell maturation antigen for multiple myeloma. Haematologica 2020, 106, 173–184. [Google Scholar] [CrossRef] [Green Version]
  3. Sun, J.; Muz, B.; Alhallak, K.; Markovic, M.; Gurley, S.; Wang, Z.; Guenthner, N.; Wasden, K.; Fiala, M.; King, J.; et al. Targeting CD47 as a Novel Immunotherapy for Multiple Myeloma. Cancers 2020, 12, 305. [Google Scholar] [CrossRef] [PubMed] [Green Version]
  4. Qiang, Y.W.; Walsh, K.; Yao, L.; Kedei, N.; Blumberg, P.M.; Rubin, J.S.; Shaughnessy, J.; Rudikoff, S. Wnts induce migration and invasion of myeloma plasma cells. Blood 2005, 106, 1786–1793. [Google Scholar] [CrossRef] [PubMed] [Green Version]
  5. Wu, D.; Guo, X.; Su, J.; Chen, R.; Berenzon, D.; Guthold, M.; Bonin, K.; Zhao, W.; Zhou, X. CD138-negative myeloma cells regulate mechanical properties of bone marrow stromal cells through SDF-1/CXCR4/AKT signaling pathway. Biochim. Biophys. Acta-Mol. Cell Res. 2015, 1853, 338–347. [Google Scholar] [CrossRef] [Green Version]
  6. Feng, Y.; Ofek, G.; Choi, D.S.; Wen, J.; Hu, J.; Zhao, H.; Zu, Y.; Athanasiou, K.A.; Chang, C.C. Unique biomechanical interactions between myeloma cells and bone marrow stroma cells. Prog. Biophys. Mol. Biol. 2010, 103, 148–156. [Google Scholar] [CrossRef]
  7. Clara-Trujillo, S.; Ferrer, G.G.; Ribelles, J.L.G. In Vitro Modeling of Non-Solid Tumors: How Far Can Tissue Engineering Go? Int. J. Mol. Sci. 2020, 21, 5747. [Google Scholar] [CrossRef]
  8. Podar, K.; Tai, Y.T.; Lin, B.K.; Narsimhan, R.P.; Sattler, M.; Kijima, T.; Salgia, R.; Gupta, D.; Chauhan, D.; Anderson, K.C. Vascular Endothelial Growth Factor-induced Migration of Multiple Myeloma Cells Is Associated with β1 Integrin- and Phosphatidylinositol 3-Kinase-dependent PKCα Activation. J. Biol. Chem. 2002, 277, 7875–7881. [Google Scholar] [CrossRef] [Green Version]
  9. Zlei, M.; Egert, S.; Wider, D.; Ihorst, G.; Wäsch, R.; Engelhardt, M. Characterization of in vitro growth of multiple myeloma cells. Exp. Hematol. 2007, 35, 1550–1561. [Google Scholar] [CrossRef]
  10. Jin, J.; Wang, T.; Wang, Y.; Chen, S.; Li, Z.; Li, X.; Zhang, J.; Wang, J. SRC3 expressed in BMSCs promotes growth and migration of multiple myeloma cells by regulating the expression of Cx43. Int. J. Oncol. 2017, 51, 1694–1704. [Google Scholar] [CrossRef] [Green Version]
  11. Huh, D.; Hamilton, G.A.; Ingber, D.E. From 3D cell culture to organs-on-chips. Trends Cell Biol. 2011, 21, 745–754. [Google Scholar] [CrossRef] [PubMed] [Green Version]
  12. Bhatia, S.N.; Ingber, D.E. Microfluidic organs-on-chips. Nat. Biotechnol. 2014, 32, 760–772. [Google Scholar] [CrossRef]
  13. Mogilner, A. Mathematics of cell motility: Have we got its number? J. Math. Biol. 2009, 58, 105–134. [Google Scholar] [CrossRef] [PubMed] [Green Version]
  14. Rodriguez, M.L.; McGarry, P.J.; Sniadecki, N.J. Review on cell mechanics: Experimental and modeling approaches. Appl. Mech. Rev. 2013, 65, 060801. [Google Scholar] [CrossRef] [Green Version]
  15. Ayensa-Jiménez, J.; Pérez-Aliacar, M.; Randelovic, T.; Oliván, S.; Fernández, L.; Sanz-Herrera, J.A.; Ochoa, I.; Doweidar, M.H.; Doblaré, M. Mathematical formulation and parametric analysis of in vitro cell models in microfluidic devices: Application to different stages of glioblastoma evolution. Sci. Rep. 2020, 10, 21193. [Google Scholar] [CrossRef]
  16. Cioffi, M.; Küffer, J.; Ströbel, S.; Dubini, G.; Martin, I.; Wendt, D. Computational evaluation of oxygen and shear stress distributions in 3D perfusion culture systems: Macro-scale and micro-structured models. J. Biomech. 2008, 41, 2918–2925. [Google Scholar] [CrossRef]
  17. Soleimani, S.; Shamsi, M.; Ghazani, M.A.; Modarres, H.P.; Valente, K.P.; Saghafian, M.; Ashani, M.M.; Akbari, M.; Sanati-Nezhad, A. Translational models of tumor angiogenesis: A nexus of in silico and in vitro models. Biotechnol. Adv. 2018, 36, 880–893. [Google Scholar] [CrossRef]
  18. Carlier, A.; Skvortsov, G.A.; Hafezi, F.; Ferraris, E.; Patterson, J.; Koc, B.; Van Oosterwyck, H. Computational model-informed design and bioprinting of cell-patterned constructs for bone tissue engineering. Biofabrication 2016, 8, 025009. [Google Scholar] [CrossRef]
  19. Kang, K.T.; Park, J.H.; Kim, H.J.; Lee, H.Y.H.M.; Lee, K.I.; Jung, H.H.; Lee, H.Y.H.M.; Jang, J.W. Study of Tissue Differentiation of Mesenchymal Stem Cells by Mechanical Stimuli and an Algorithm for Bone Fracture Healing. Tissue Eng. Regen. Med. 2011, 8, 359–370. [Google Scholar]
  20. Fouliard, S.; Benhamida, S.; Lenuzza, N.; Xavier, F. Modeling and simulation of cell populations interaction. Math. Comput. Model. 2009, 49, 2104–2108. [Google Scholar] [CrossRef]
  21. Bissell, M.J.; Rizki, A.; Mian, I.S. Tissue architecture: The ultimate regulator of breast epithelial function. Curr. Opin. Cell Biol. 2003, 15, 753. [Google Scholar] [CrossRef] [PubMed] [Green Version]
  22. te Boekhorst, V.; Preziosi, L.; Friedl, P. Plasticity of Cell Migration In Vivo and In Silico. Annu. Rev. Cell Dev. Biol. 2016, 32, 491–526. [Google Scholar] [CrossRef] [PubMed]
  23. Kim, M.C.; Silberberg, Y.R.; Abeyaratne, R.; Kamm, R.D.; Asada, H.H. Computational modeling of three-dimensional ECM-rigidity sensing to guide directed cell migration. Proc. Natl. Acad. Sci. USA 2018, 115, E390–E399. [Google Scholar] [CrossRef] [Green Version]
  24. Mousavi, S.J.; Doweidar, M.H. Encapsulated piezoelectric nanoparticle–hydrogel smart material to remotely regulate cell differentiation and proliferation: A finite element model. Comput. Mech. 2019, 63, 471–489. [Google Scholar] [CrossRef]
  25. Farsad, M.; Vernerey, F.J. An XFEM-based numerical strategy to model mechanical interactions between biological cells and a deformable substrate. Int. J. Numer. Methods Eng. 2012, 92, 238–267. [Google Scholar] [CrossRef]
  26. Katti, D.R.; Katti, K.S. Cancer cell mechanics with altered cytoskeletal behavior and substrate effects: A 3D finite element modeling study. J. Mech. Behav. Biomed. Mater. 2017, 76, 125–134. [Google Scholar] [CrossRef] [PubMed]
  27. Urdeitx, P.; Farzaneh, S.; Mousavi, S.J.; Doweidar, M.H. Role of oxygen concentration in the osteoblasts behavior: A finite element model. J. Mech. Med. Biol. 2020, 20, 1950064. [Google Scholar] [CrossRef]
  28. Malekian, N.; Habibi, J.; Zangooei, M.H.; Aghakhani, H. Integrating evolutionary game theory into an agent-based model of ductal carcinoma in situ: Role of gap junctions in cancer progression. Comput. Methods Programs Biomed. 2016, 136, 107–117. [Google Scholar] [CrossRef] [PubMed]
  29. Urdeitx, P.; Doweidar, M.H. Mechanical stimulation of cell microenvironment for cardiac muscle tissue regeneration: A 3D in-silico model. Comput. Mech. 2020, 66, 1003–1023. [Google Scholar] [CrossRef]
  30. Urdeitx, P.; Doweidar, M.H. A Computational Model for Cardiomyocytes Mechano-Electric Stimulation to Enhance Cardiac Tissue Regeneration. Mathematics 2020, 8, 1875. [Google Scholar] [CrossRef]
  31. ANSYS Inc. Fluent Theory Guide, 15th ed.; ANSYS, Inc.: Canonsburg, PA, USA, 2013; pp. 724–746. [Google Scholar]
  32. Abaqus (ABQ). Abaqus 6.14; Dassault Systemes: Vélizy-Villacoublay, France, 2014. [Google Scholar]
  33. Urdeitx, P.; Doweidar, M.H. Enhanced Piezoelectric Fibered Extracellular Matrix to Promote Cardiomyocyte Maturation and Tissue Formation: A 3D Computational Model. Biology 2021, 10, 135. [Google Scholar] [CrossRef] [PubMed]
  34. Urdeitx, P.; Mousavi, S.J.; Avril, S.; Doweidar, M.H. Computational modeling of multiple myeloma interactions with resident bone marrow cells. Comput. Biol. Med. 2023, 153, 106458. [Google Scholar] [CrossRef] [PubMed]
  35. Wu, Q.Q.; Chen, Q. Mechanoregulation of chondrocyte proliferation, maturation, and hypertrophy: Ion-channel dependent transduction of matrix deformation signals. Exp. Cell Res. 2000, 256, 383–391. [Google Scholar] [CrossRef] [PubMed]
  36. Cheng, G.; Tse, J.; Jain, R.K.; Munn, L.L. Micro-environmental mechanical stress controls tumor spheroid size and morphology by suppressing proliferation and inducing apoptosis in cancer cells. PLoS ONE 2009, 4, e4632. [Google Scholar] [CrossRef] [Green Version]
  37. Isobe, T.; Ikeda, Y.; Ohta, H. Comparison of sizes and shapes of tumor cells in plasma cell leukemia and plasma cell myeloma. Blood 1979, 53, 1028–1030. [Google Scholar] [CrossRef] [Green Version]
  38. Clara-Trujillo, S.; Tolosa, L.; Cordón, L.; Sempere, A.; Ferrer, G.G.; Luis, J.; Ribelles, G.; Ribelles, J.L.G. Novel microgel culture system as semi-solid three-dimensional in vitro model for the study of multiple myeloma proliferation and drug resistance. Biomater. Adv. 2022, 135, 212749. [Google Scholar] [CrossRef]
  39. Bam, R.; Ling, W.; Khan, S.; Pennisi, A.; Venkateshaiah, S.U.; Li, X.; van Rhee, F.; Usmani, S.; Barlogie, B.; Shaughnessy, J.; et al. Role of Bruton’s tyrosine kinase in myeloma cell migration and induction of bone disease. Am. J. Hematol. 2013, 88, 463–471. [Google Scholar] [CrossRef] [Green Version]
  40. Zipursky, A.; Bow, E.; Seshadri, R.; Brown, E. Leukocyte density and volume in normal subjects and in patients with acute lymphoblastic leukemia. Blood 1976, 48, 361–371. [Google Scholar] [CrossRef] [Green Version]
  41. Aranda-Lara, L.; Torres-García, E.; Oros-Pantoja, R. Biological Tissue Modeling with Agar Gel Phantom for Radiation Dosimetry of 99mTc. Open J. Radiol. 2014, 4, 44–52. [Google Scholar] [CrossRef] [Green Version]
  42. Thompson, B.R.; Horozov, T.S.; Stoyanov, S.D.; Paunov, V.N. An ultra melt-resistant hydrogel from food grade carbohydrates. RSC Adv. 2017, 7, 45535–45544. [Google Scholar] [CrossRef] [Green Version]
  43. WATASE, M.; ARAKAWA, K. Rheological Properties of Hydrogels of Agar-agar. Nippon Kagaku Zassi 1971, 92, 37–42. [Google Scholar] [CrossRef] [Green Version]
  44. Hamburger, A.; Salmon, S.E. Primary Bioassay of Human Myeloma Stem Cells. J. Clin. Investig. 1977, 60, 846–854. [Google Scholar] [CrossRef] [PubMed]
  45. Cowley, G.S.; Weir, B.A.; Vazquez, F.; Tamayo, P.; Scott, J.A.; Rusin, S.; East-Seletsky, A.; Ali, L.D.; Gerath, W.F.; Pantel, S.E.; et al. Parallel genome-scale loss of function screens in 216 cancer cell lines for the identification of context-specific genetic dependencies. Sci. Data 2014, 1, 140035. [Google Scholar] [CrossRef] [PubMed] [Green Version]
  46. Lambert, K.E.; Huang, H.; Mythreye, K.; Blobe, G.C. The type III transforming growth factor-β receptor inhibits proliferation, migration, and adhesion in human myeloma cells. Mol. Biol. Cell 2011, 22, 1463–1472. [Google Scholar] [CrossRef] [PubMed]
  47. Peacock, C.D.; Wang, Q.; Gesell, G.S.; Corcoran-Schwartz, I.M.; Jones, E.; Kim, J.; Devereux, W.L.; Rhodes, J.T.; Huff, C.A.; Beachy, P.A.; et al. Hedgehog signaling maintains a tumor stem cell compartment in multiple myeloma. Proc. Natl. Acad. Sci. USA 2007, 104, 4048–4053. [Google Scholar] [CrossRef] [Green Version]
  48. Mousavi, S.J.; Doblaré, M.; Doweidar, M.H. Computational modelling of multi-cell migration in a multi-signalling substrate. Phys. Biol. 2014, 11, 026002. [Google Scholar] [CrossRef]
  49. Mousavi, S.J.; Doweidar, M.H. Numerical modeling of cell differentiation and proliferation in force-induced substrates via encapsulated magnetic nanoparticles. Comput. Methods Programs Biomed. 2016, 130, 106–117. [Google Scholar] [CrossRef] [Green Version]
Figure 1. Forces acting on the cell. The cell–cell overlap distance and cell stiffness were considered when computing contact forces. Drag forces were determined using the momentum exchange between the cell and the fluidic ECM.
Mathematics 11 01824 g001
Figure 2. Distribution of mean cell sedimentation velocity per unit cell. The results obtained were compared to the in vitro results (red). The results of the ANS model showed a wider cell sedimentation velocity due to variational inertial forces and a non-homogeneous cell diameter (MSE = 0.0029), while the ABQ model revealed a lower distribution of the cell velocity due to the more homogeneous conditions considered (MSE = 0.0026).
Mathematics 11 01824 g002
Figure 3. MI during 96 h of simulation using the ABQ (a) and ANS (b) models. MMCs were seeded in a random initial distribution, and at a random initial state of maturation (top). After 96 h of cell-in-culture simulation, MMC aggregates started to form (bottom) (see also Supplementary Material Videos S1 and S2).
Mathematics 11 01824 g003
Figure 4. Cell doubling. (a) Comparison of the mean values after 96 h in a cells-in-culture simulation using the ANS and ABQ models, with results of the in vitro model (Section 2.2). (b) Dispersion of the results due to the random nature of the experiment.
Mathematics 11 01824 g004
Figure 5. Tumor aggregate growth. (a) Initially, cells were randomly distributed into groups of 20–30 cells. (b) After 48 h, cell groups merged, and the inner cells of the aggregates lost their ability to proliferate. (c) Surface cells continued to proliferate up until 360 h of simulation. (d) Cell growth for 360 h of simulation (log scale) (see also Supplementary Material Video S3).
Mathematics 11 01824 g005
Table 1. Mechanical parameters considered in the model.
ParameterDescriptionValueRefs.
r 0 Nominal cell radius 5 ± 1 μ m[37]
ρ c Cell mass density1077 kg/m3[39,40]
ρ f ECM mass density940 kg/m3[41]
ν f ECM viscosity 0.05 Pa s[42,43]
ECell stiffness 0.4 ± 0.2 kPa[5,6]
E E C M ECM stiffness 0.3 ± 0.1 kPa[42]
μ Friction coefficient for cell contacts 0.9 [6,44]
t n Natural maturation time without stimulus60 h[45]
γ w Proportional time factor for cell–wall contacts1.60
γ c Proportional time factor for cell–cell contacts0.14
Disclaimer/Publisher’s Note: The statements, opinions and data contained in all publications are solely those of the individual author(s) and contributor(s) and not of MDPI and/or the editor(s). MDPI and/or the editor(s) disclaim responsibility for any injury to people or property resulting from any ideas, methods, instructions or products referred to in the content.

