1. Introduction
Adult acquired flatfoot deformity (AAFD) is a pathology that causes a progressive flattening of the foot arch, which has been traditionally related to a tibialis posterior tendon (TPT) dysfunction. However, some clinical studies found that a failure/rupture of the plantar fascia (PF) or the calcaneonavicular ligament (also spring ligament (SL)) could also generate the arch collapse and the forefoot abduction [
1,
2,
3,
4,
5]. Treatment options depend on the injury stage. In the first stages, AAFD treatments are related to reinforcing the TPT [
6]. Nevertheless, sometimes the foot deformation reappears over time, forcing surgeons to use more aggressive techniques, intervening directly over the foot’s bone structure. If the foot deformity is still flexible (stages IIa and IIb), the most habitual procedure is medializing calcaneal osteotomy (MCO) [
7,
8], which allows both the progressive foot arch flattening and the foot pronation caused by the flatfoot deformity to be corrected [
4,
6,
9]. This procedure provokes a supination momentum in the foot to compensate the pronation [
1,
10]. In this way, the foot’s structural correction is achieved by MCO and its results are normally satisfactory. Nevertheless, some clinical studies have shown that this procedure generates long-term side-effects related to stress distribution changes in forefoot and metatarsals [
11,
12,
13], which could increase the risk of bone fractures, as has been reported with Evans’ osteotomy [
14].
In a recent study published by our research group using a previous version of our foot model, we showed that MCO can reduce foot pronation on its own [
9]. However, changes in the biomechanical stress caused in bones and the main soft tissues that support the arch remained unstudied. Even in the literature, these stress changes have not been sufficiently studied, because of the difficulty of measuring tissue stresses in cadavers. Some cadaver-based models have been used to study the structural correction of the foot, evaluating changes in both the plantar footprint using force platforms, and foot arch falling using radiographic (Rx) images. For example, Patrick et al. [
15] measured the subtalar joint pressure produced by MCO using a cadaveric model suffering with flatfoot. They introduced a pressure sensor in the posterior facet joint, obtaining some, but limited, information about the effects of MCO on hindfoot joint pressures. As can be noted, these kinds of studies require high economic investment in measurement equipment, as well as meticulous control over the tested tissues to guarantee their biomechanical characteristics [
16].
An alternative now accepted by clinicians and biomechanical researchers for evaluating the complex biomechanics of the human foot is finite element modelling (FEM) [
17,
18,
19]. There are many models that study foot biomechanics and the effects produced by some surgical techniques. However, none of them have been used to study the stress effects of MCO on foot tissues. This kind of model specifically evaluates foot structure deformation and plantar pressure measurement [
13,
19]. Thus, these models greatly simplify the tissue anatomy and do not take into account important aspects such as the biomechanical difference between cortical and trabecular bones (which is very important when tissue stresses are evaluated [
20], nor the geometry of some soft tissues such as the plantar fascia, the spring ligament, ligaments, or tendons, which are habitually modelled as bar elements. Thus, previously reported models cannot measure and locate the stresses around the foot anatomy.
The objective of this research was to investigate the biomechanical effects in terms of stress concentrations and displacements that an MCO provokes in both foot bones and the main foot arch stabilizers (TPT, PF and SL), using an enhanced version of the model used in [
9]. This analysis was performed by simulating different pathological scenarios related to AAFD development.
2. Materials and Methods
This study was based on the foot model (segmentation and tissue properties) proposed by Cifuentes-De la Portilla et al [
3], which has been used for the flatfoot evaluation of some other surgical procedures [
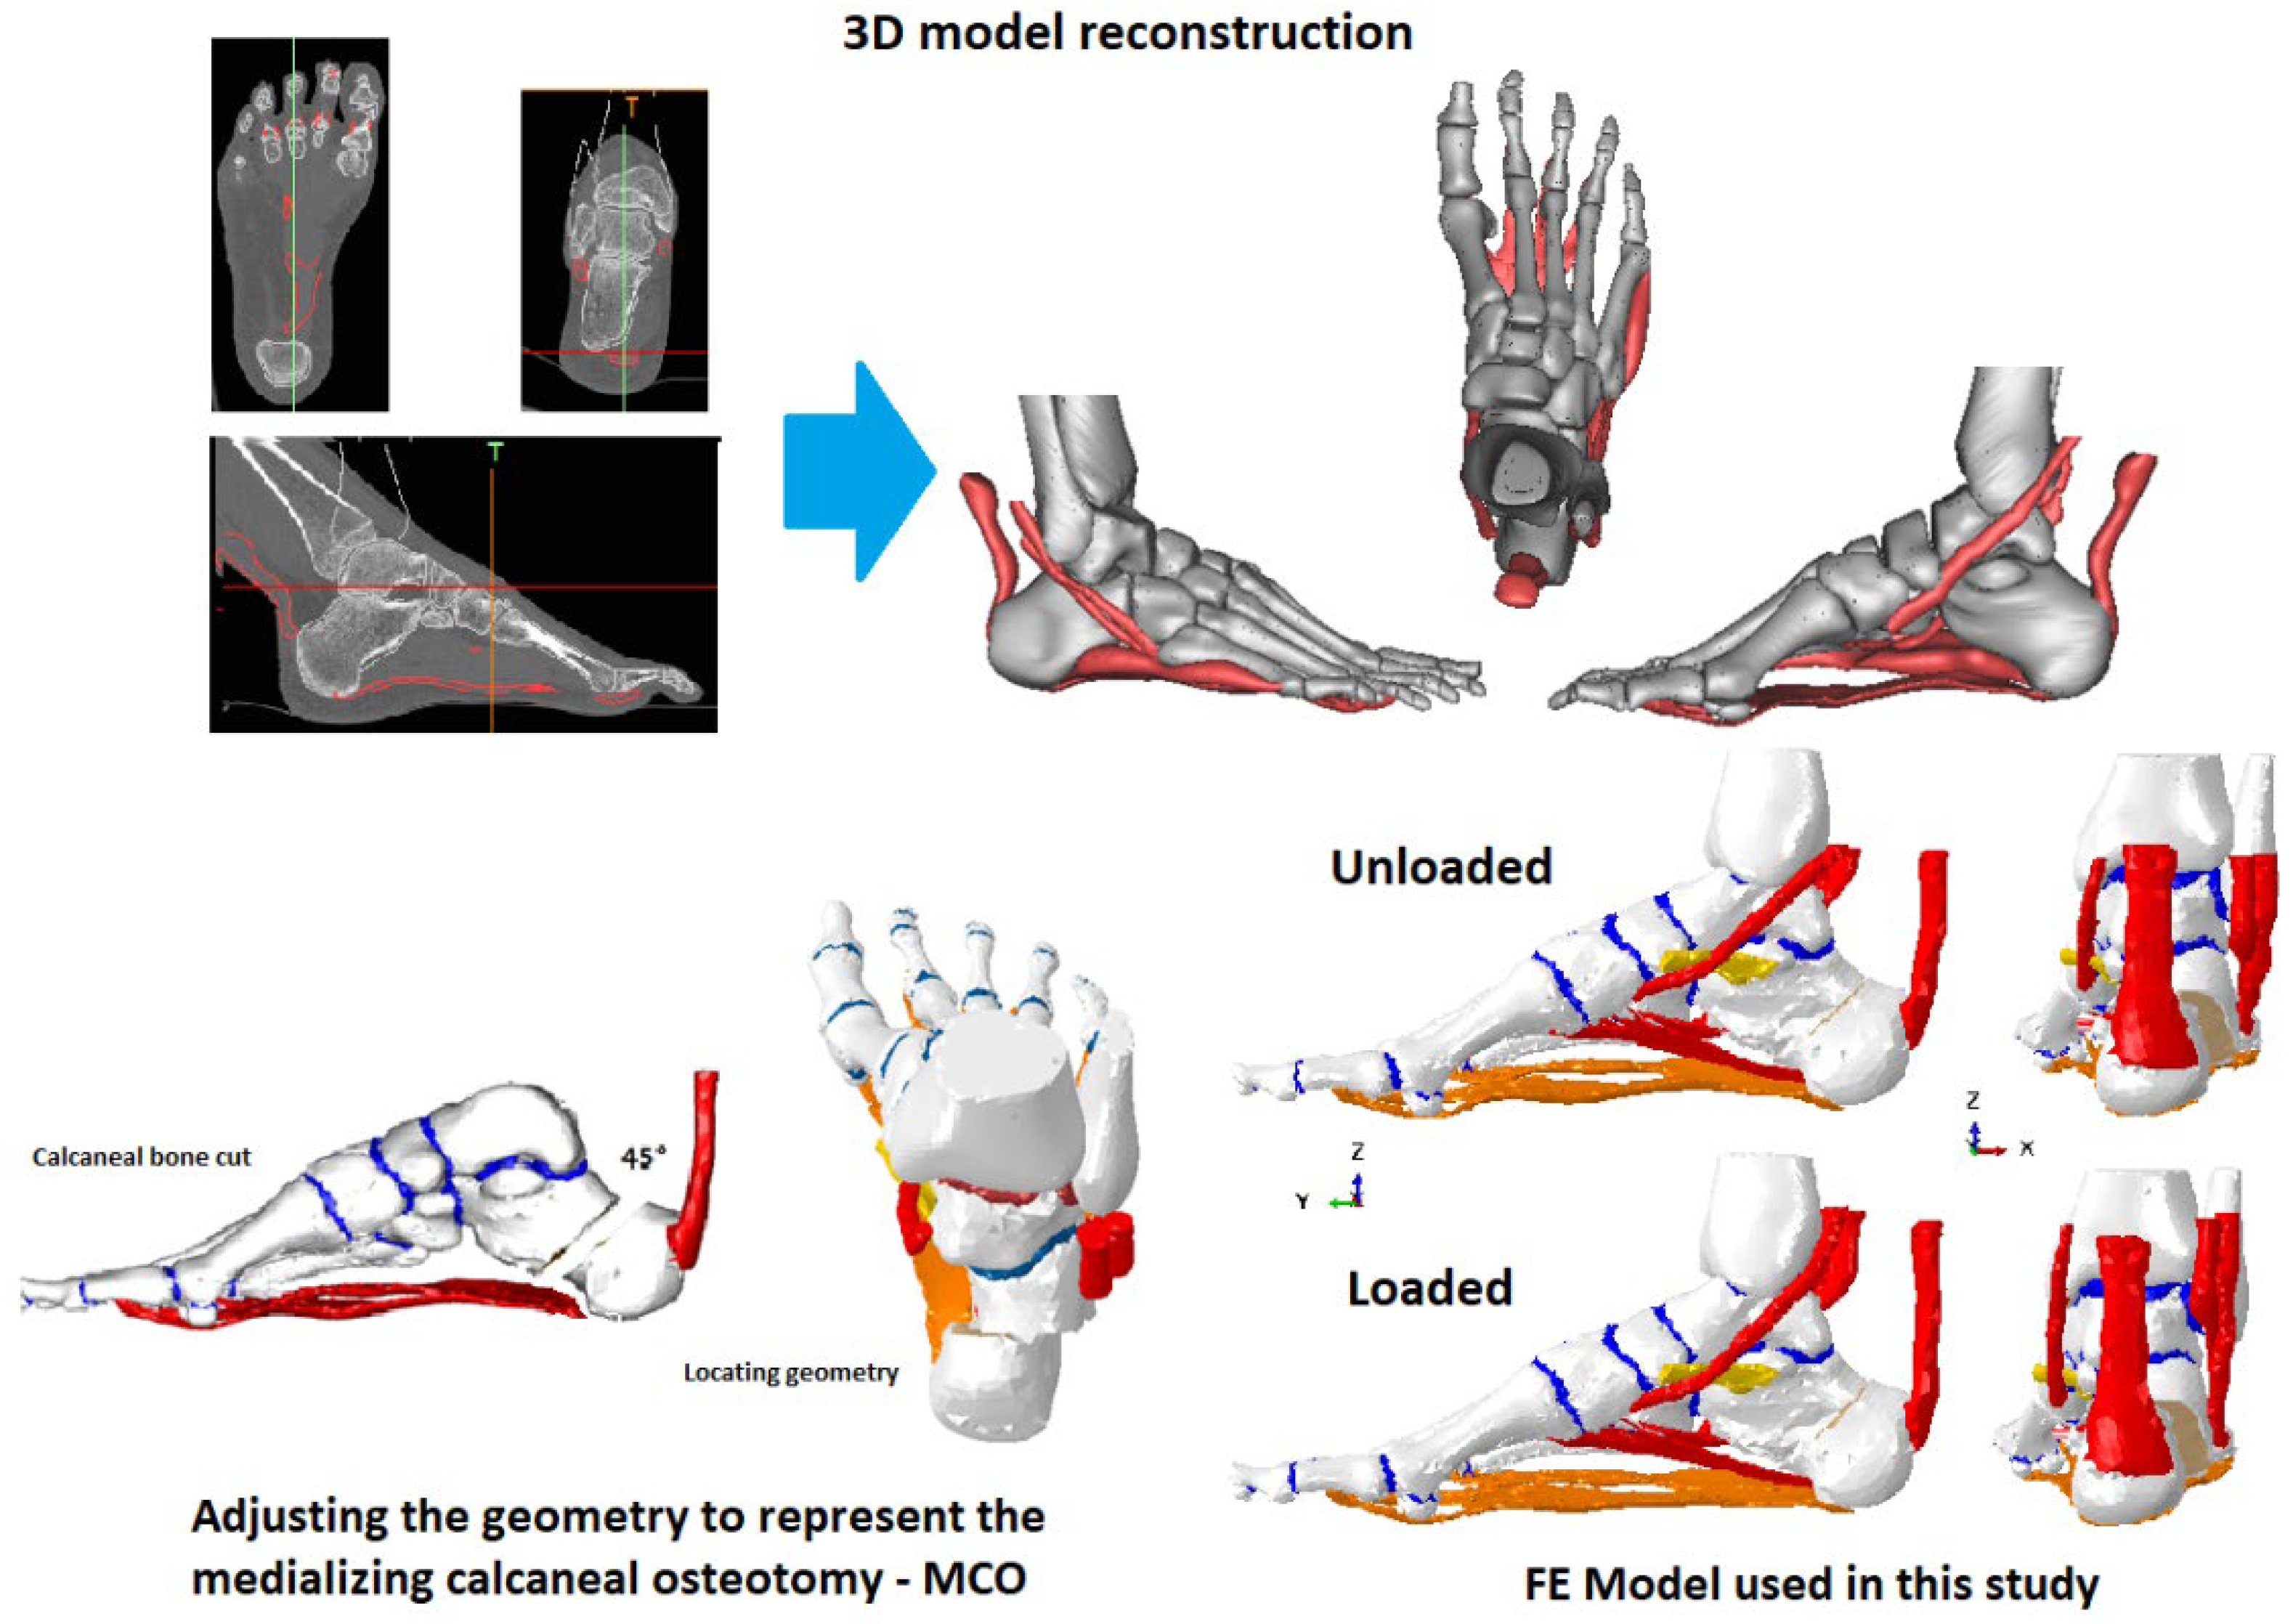
21]. However, for this study, the entire model was reconstructed to simulate the MCO procedure, maintaining both tissue characteristics and loading conditions but including both the tibia and fibula bones to better represent the anatomical tendons’ trajectories. The model used reconstructed a healthy human unloaded foot, based on CT images (radiographs of 0.6 mm/slide) acquired from the right foot of a 49-year-old man (weight = 75 Kg, height = 1.70 m).
2.1. FE Foot Model and Modifications
Tissue segmentation and 3D reconstruction (bones, PF, TPT, Achilles’ tendon, Peroneus Longus tendon (PLT) and Peroneus Brevis tendon (PBT)) were performed using MIMICS V. 10 (Materialize, Leuven, Belgium). The spring ligament (SL) and both plantar ligaments (short plantar ligament and long plantar ligament) were added following atlas images, following the surgeons’ guidance due to the difficulty of segmenting these from the CT images. The tibia and fibula were reoriented with tools available in MIMICS from the scan position to correspond to the orientation during the stance phase of gait. The previous finite element model [
9] was enhanced by adding the TPT, Achilles’ tendon, PLT, and PBT.
To simulate the MCO, calcaneus bone was modified, performing a 45-degrees transversal cut and translating the segment medially by 10-mm (See
Figure 1) [
15,
22]. This modification was performed following the guidance of a specialist in foot surgeries. Elements allowing internal fixation, such as plates, screws, and bone graft, were not simulated because a complete joint fusion was supposed. The complete FE model is shown in
Figure 1. allowing internal fixation, such as plates, screws, and bone graft, were not simulated because a complete joint fusion was supposed. The complete FE model is shown in
Figure 1.
2.2. Meshing
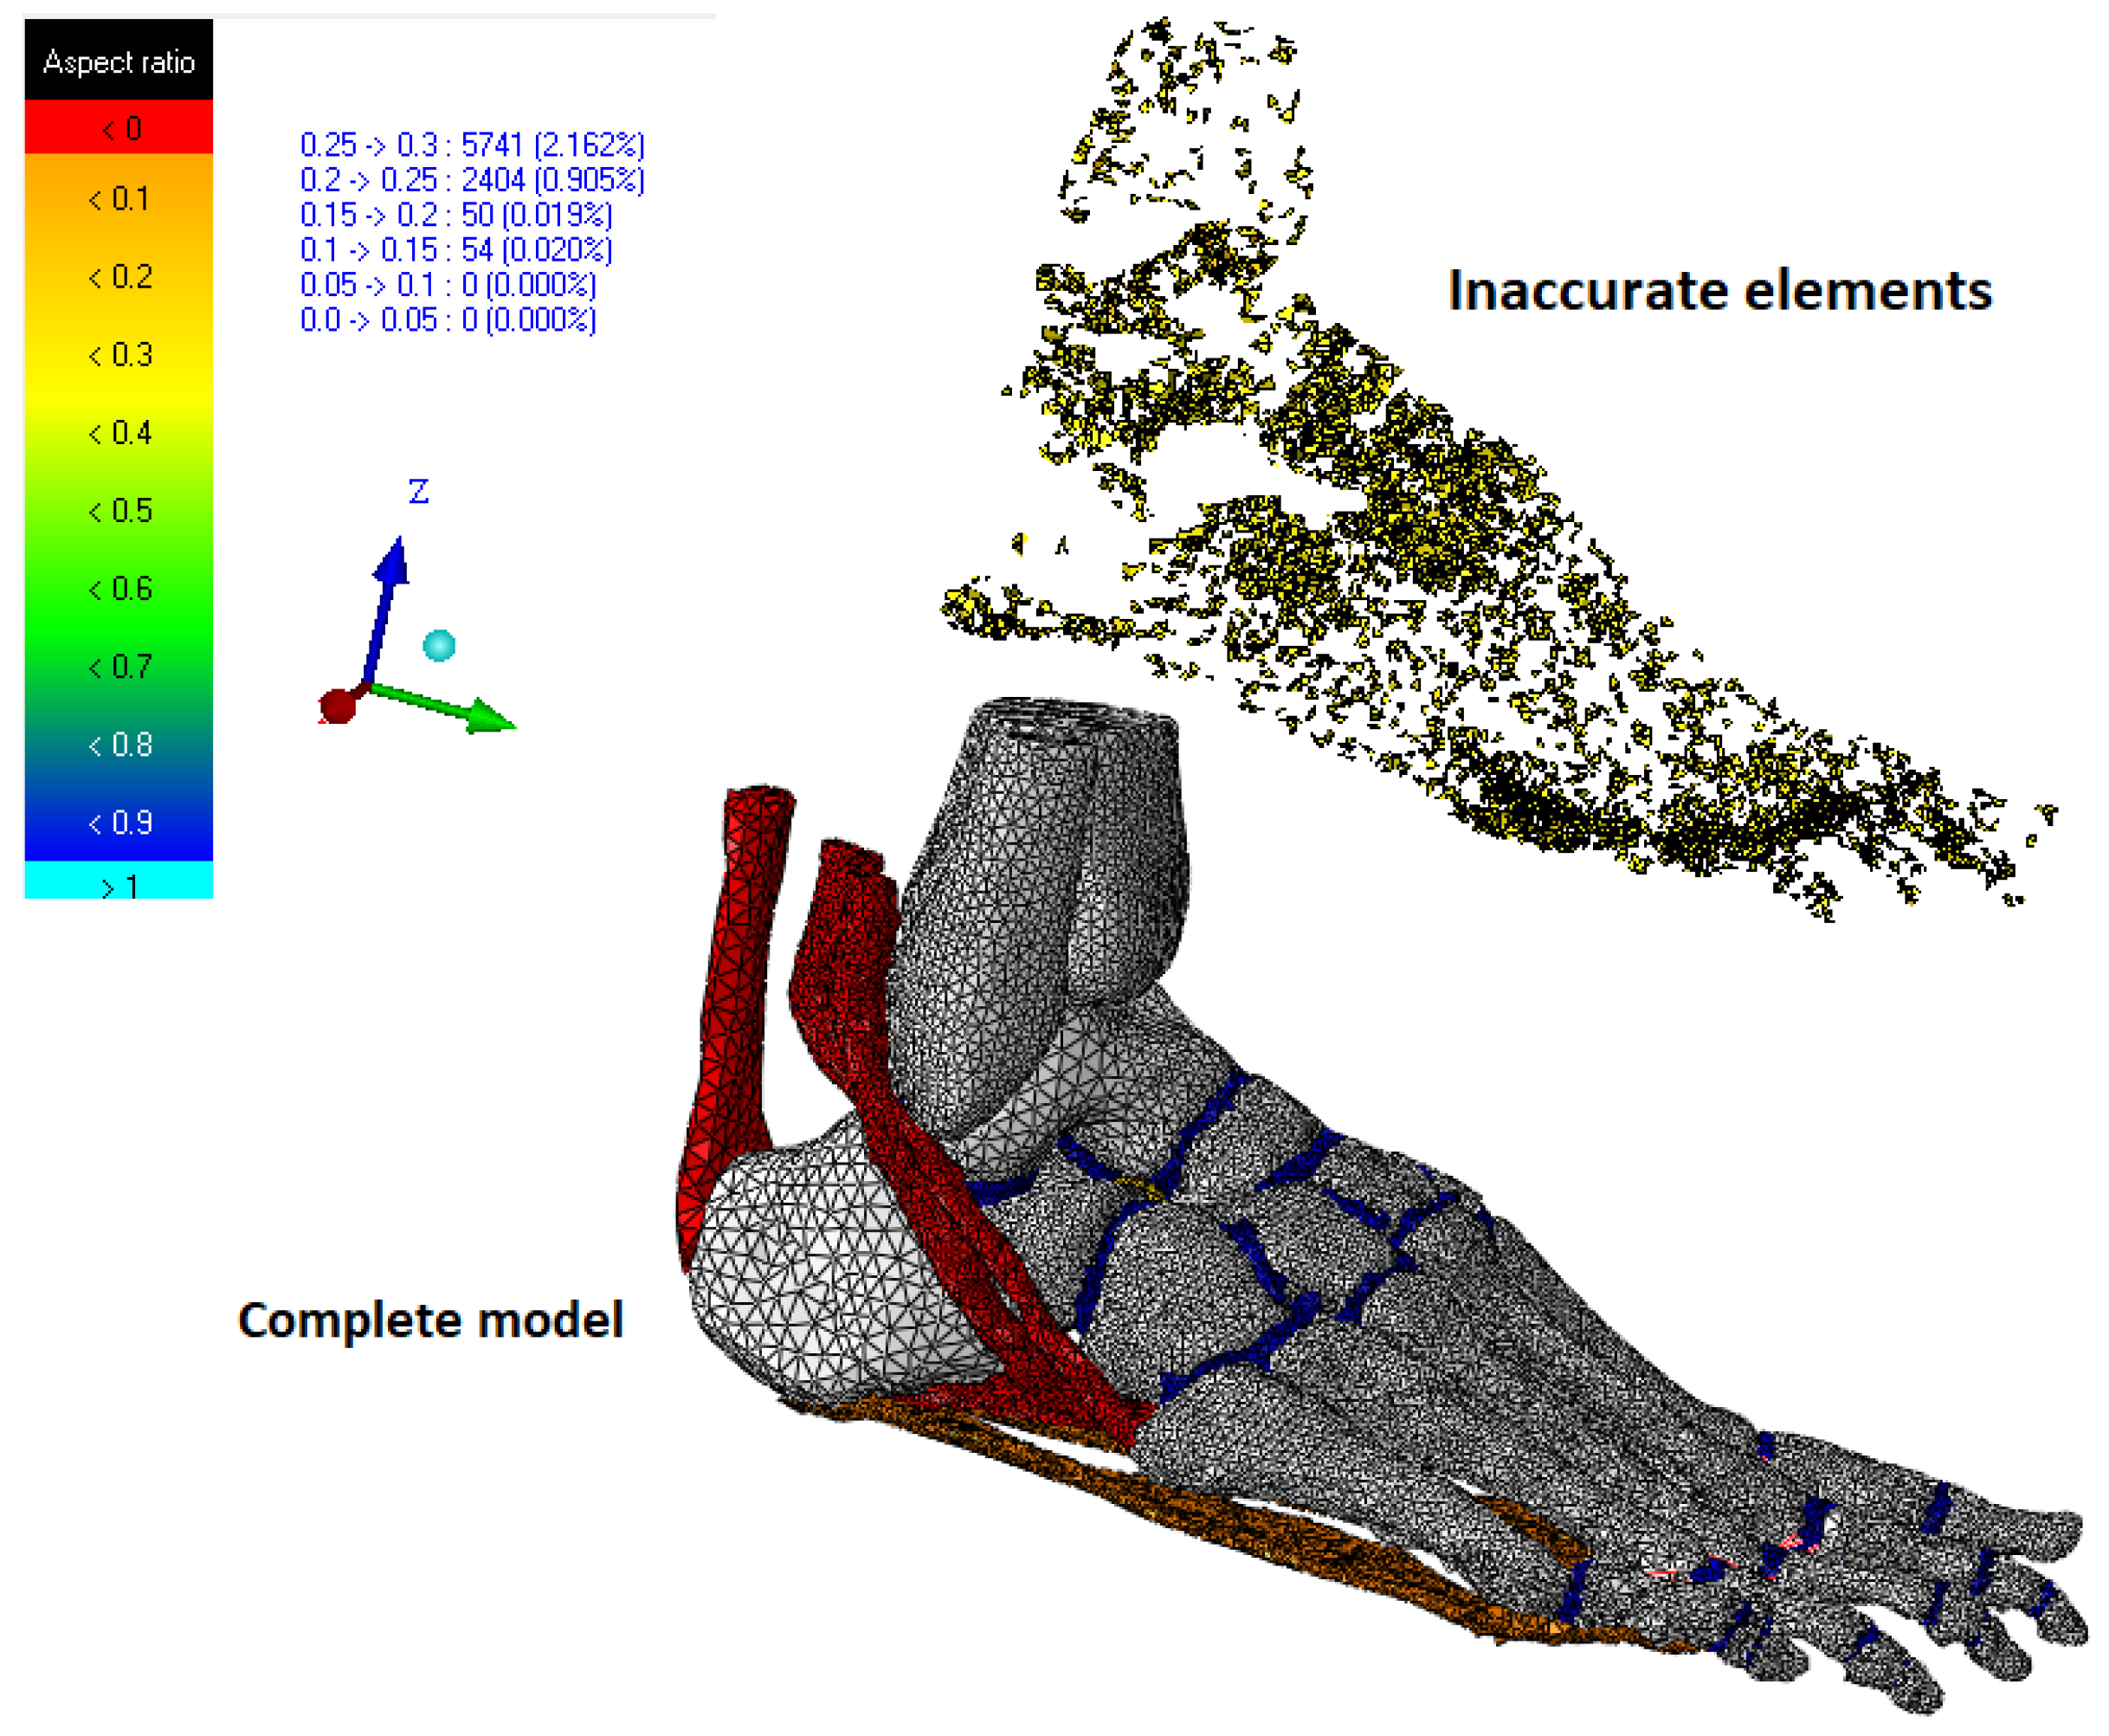
The model’s meshing was developed by means of the software ANSYS V.15 (Canonsburg, PA, USA). In summary, the model include 28 cortical bone pieces, 24 trabecular bone pieces, 26 cartilage segments, 4 tendons, 3 ligaments, and the plantar fascia. A trial–error approach was used to optimize the mesh size of each segment [
17]. These authors suggested that the number of inaccurate elements must be less than 5% in all the measured parameters. All simulations and post-processing were developed in Abaqus/CAE 6.14 (Dassault Systèmes, Vélizy-Villacoublay, France) using the available nonlinear geometry solver.
Some of the conditions considered in order to achieve a reasonable mesh size without compromising the calculation time included having a minimum mesh size sufficiently small to fit into the tightest segments, a mesh accuracy of more than 99% of the elements being better than 0.2 mesh quality (Jacobians) and checking that the poor elements were located away from the region of greatest interest (hindfoot bones, metatarsals, PF, and SL) (see
Figure 2). The convergence analysis was performed for 265,547 linear tetrahedral elements (C3D4). All parameters exhibited good mesh quality ratios (see
Table 1).
2.3. Tissue Properties
Two kinds of behavior were considered in this finite element model: linear elastic behavior and hyper-elastic behavior.
Tissues with elastic linear behavior were the cortical bone, trabecular bone, ligaments, and plantar fascia.
Tissues with hyper-elastic behavior were tendons and cartilages.
The numerical values for each of these tissues were as follows:
The material properties (Young’s modulus (E) and Poisson’s ratio (v)) of the cortical bone, trabecular bone, ligaments, and plantar fascia were assigned in accordance with published data: cortical bone (E = 17,000 MPa, v = 0.3), trabecular bone (E = 700 Mpa, v = 0.3), ligaments (E = 250 Mpa, v = 0.28), and plantar fascia (E = 240 MPa, v = 0.28) [
16,
20,
23].
Tendons and cartilages were modelled as hyper-elastic materials (Ogden model), using the parameters taken from specialized articles [
24]. The strain energy density function
U is:
where the initial shear modulus
µ = 4.4 MPa (cartilage)/33.16 MPa (tendons), the strain hardening exponent
α = 2 (cartilage)/24.89 (tendons), and the compressibility parameter
D = 0.45 (cartilage)/0.0001207 (tendons) [
16,
24,
25]. The plantar fascia and spring ligament failures were simulated, applying the isotropic hardening theory that generates a progressive reduction of the tissue’s stiffness, resulting in a very flexible material. The initial parameters were a Young’s modulus of 240 and a Poisson ratio of 0.3. This strategy allowed us to improve the convergence of the model. Tibialis posterior tendon failure was simulated by removing the traction force of this tendon. Additionally, we considered that this characterization could be more realistic than simply changing the properties of the tissues because it approximates the viscoelastic behavior of these tissues, where stiffness depends on the loading application. The model used for this study maintains the differences of the bone characterization (cortical and trabecular) presented in Cifuentes-De la Portilla, C. et al. [
3], where the internal parts of all the foot bones were modeled as trabecular. However, fibula and tibia bones were entirely simulated as cortical because a stress evaluation was not performed on these parts.
2.4. Loading and Boundary Conditions
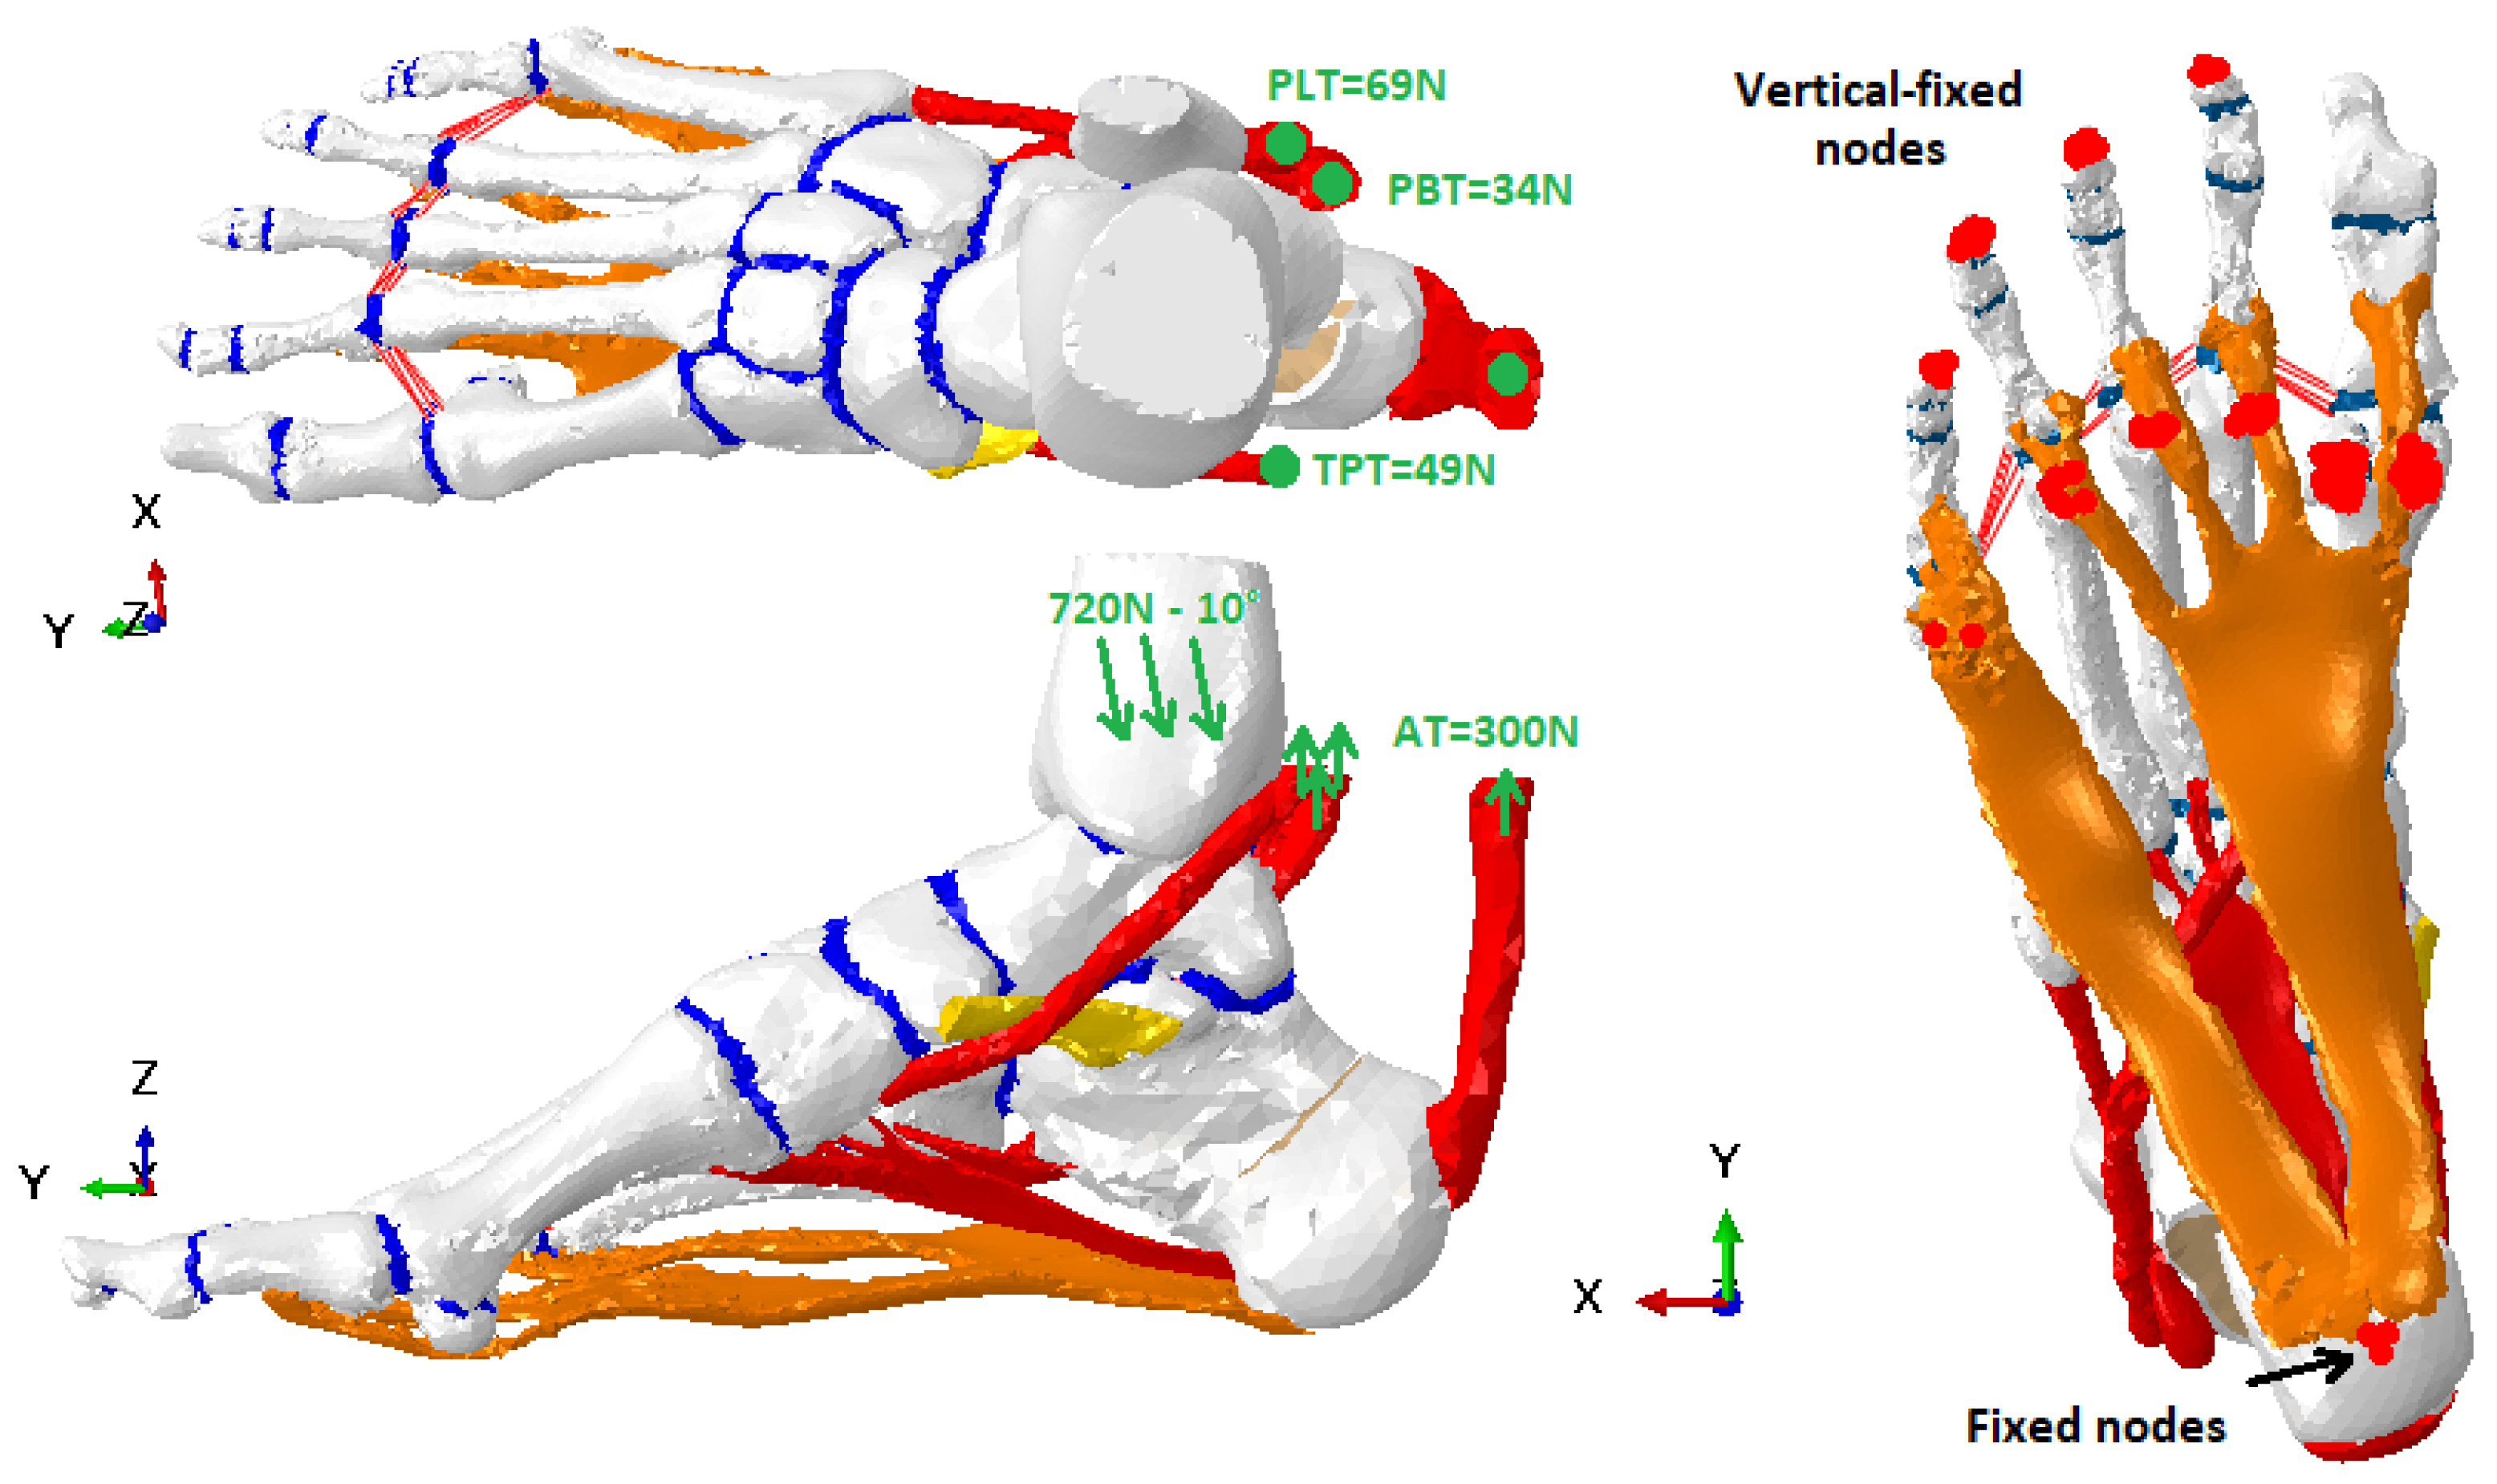
The FE model was reconstructed from CT images of an unloaded foot. First of all, a standing load position was created (midstance phase) that was used as a reference case to compare against all the pathological cases. In
Figure 3, load and boundary conditions are shown. The value of 720 N for the load corresponds to the full weight of an adult of about 70 Kg leaning on one foot. This condition represents a traditional scenario of an AAFD diagnosis assessment. Both loading conditions and boundaries were kept unaltered for all the MCO simulations.
The direction of the load exhibits an inclination of 10 degrees (descending vertical). This load was distributed over the tibia–talus joint (90%) and fibula–talus (10%) [
26]. The tendon traction forces were included as reported by Arangio et al. [
27]. To simulate the contact with the floor and to avoid the foot structure displacement under loading tests, some nodes located at the lower part of the calcaneus were fixed, while the Z-axis displacement (vertical) of the lower nodes of the first and fifth metatarsals was constrained to 0, using boundary tools available in Abaqus. The nodes remained unaltered for all the simulations performed. To avoid the tendon geometries crossing through the bones, we used the contact surfaces method, using the surfaces of the bones and tendons in contact during simulations.
2.5. About the Model Validation
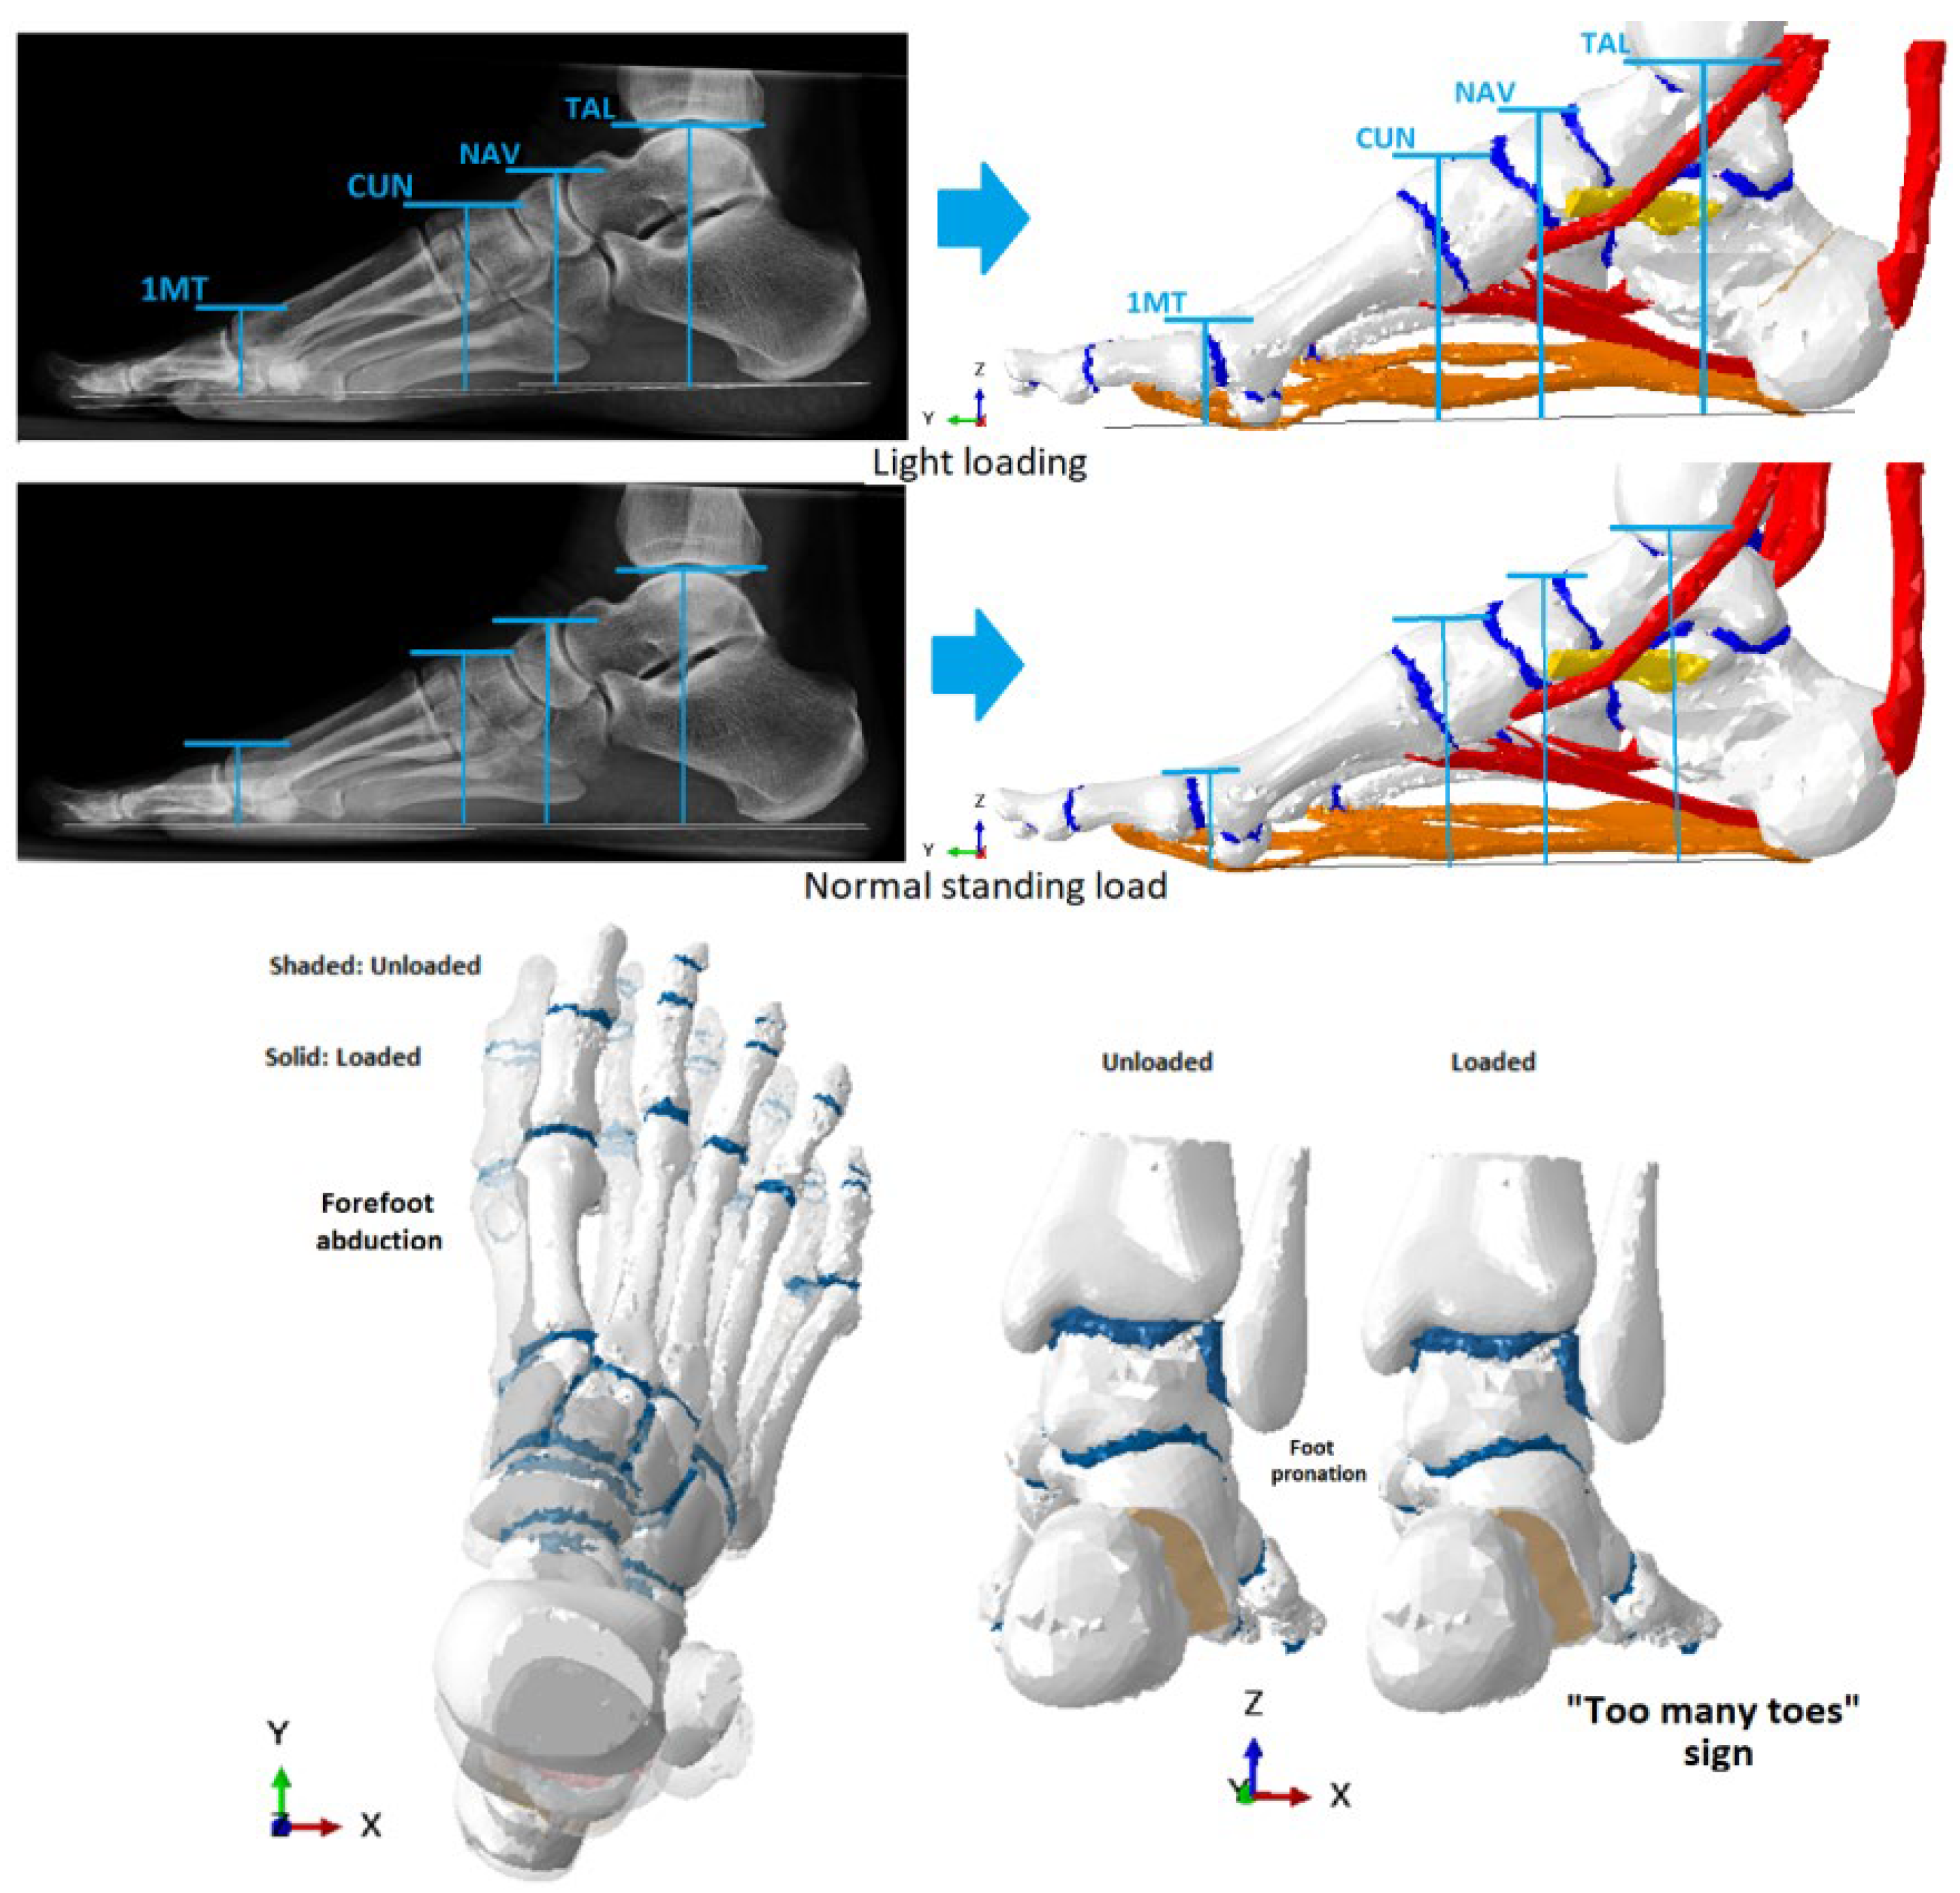
This study used a model that has been previously validated for other studies related to AAFD [
9]. They followed the recommendations of Tao et al. [
5], measuring the vertical displacements of some anatomical points: the highest point of the talus (TAL) and of the navicular (NAV), the midpoint of the first cuneiform (CUN), and the highest point of the first metatarsal head (1MT), in two different loading conditions: light loading (minimal contact with the ground) and normal stance loading, using lateral Rx images (sagittal plane) (see
Figure 4). The light loading condition was the position before starting simulations.
2.6. Model Analysis and Evaluation Criteria
To quantify the structural deformation of the foot and to evaluate biomechanical stress changes generated by MCO in foot tissues, we simulated the weakness/failure of the plantar fascia (PF), spring ligament (SL) and the tibialis posterior tendon (TPT) in isolation, but also combining these three elements. The weakness/failure was simulated by applying the isotropic hardening theory. This method was implemented using the function “Parameter” in Abaqus, which allows modification of the stiffness of a material, reducing the Young’s modulus from its initial value until obtaining a stiffness reduction by about 86%. The stresses in hindfoot bones, forefoot bones, and in all the soft tissues included in the model were calculated.
For measuring stress on tissues, the maximum principal stress (S. Max) was used. This magnitude is closely related to the tensile stress that is generated in foot tissues [
28]. Structural deformation was quantified measuring the vertical displacement of the entire structure (in millimeters).
4. Discussion
There are many treatment options for AAFD used by surgeons depending on the disease stage. For cases with a flexible deformity (IIa–IIb), tendon reinforcements are insufficient, requiring intervention in the bone structure. One of the most widely used options is medializing calcaneal osteotomy (MCO). Recently, Zanolli et al. and Patrick et al. [
15,
29] published experimental studies focused on comparing the foot’s structural correction achieved with MCO with some other strategies such as Z-osteotomy or lateral column lengthening. Other authors have evaluated the outcomes of MCO and both its effect on the Achilles tendon and its contribution to correcting signs of AAFD [
11]. Although the structural correction of the foot that can be achieved with MCO is widely known, some clinical studies have shown that MCO generates some long-term consequences such as stress distribution changes in the forefoot and probable risk of stress fractures, as has been reported with Evans’ osteotomy [
11,
12,
14]. These findings may be very relevant for the surgeon’s decision-making process [
30]. However, the biomechanical side-effects generated by MCO in both foot bones and the main soft tissues that support the plantar arch have not been analyzed sufficiently, mainly because of the difficulty of measuring tissue stress in cadaveric models [
5,
9].
Traditionally, the performance of an isolated arthrodesis of the cuneometatarsal joint for the treatment of flat feet in adults has been associated with a high rate of malunion. This fact has displaced the technique towards more aggressive ones, such as triple arthrodesis. However, associating an OCM reduces the pronator moment during gait and thus potentially allows it to act only on the cuneometatarsal joint. Selective arthrodesis of this joint would result in a clear clinical benefit.
In view of the above, a computational foot model was used to evaluate the changes on the biomechanics in foot tissue stresses when performing an MCO. This research alternative is used nowadays in clinical biomechanics studies. Thus, some examples such as these can be found in the literature. Smith et al. [
31] designed a computational model to evaluate the structural effect of the Evans osteotomy. Wang et al. [
13] proposed an FE study to evaluate different variables in MCO application, such as the angle and the medializing displacement distance. Normally, all these studies simplify the anatomy of the soft tissues and the biomechanical properties of bones. These simplifications penalize their use for analyzing the stress changes generated by MCO.
The proposed model can be reproduced, on the one hand, for loaded foot deformities and, on the other hand, for the main signs of AAFD such as foot pronation and the “too many toes” sign [
4] (please see
Figure 4 (bottom)). It is important to remark on two items: this model differentiates trabecular bone and cortical bone and this model contains the main soft tissues related to AAFD development. These make it possible to localize stress concentrations and evaluate stresses on both hard and soft tissues [
3].
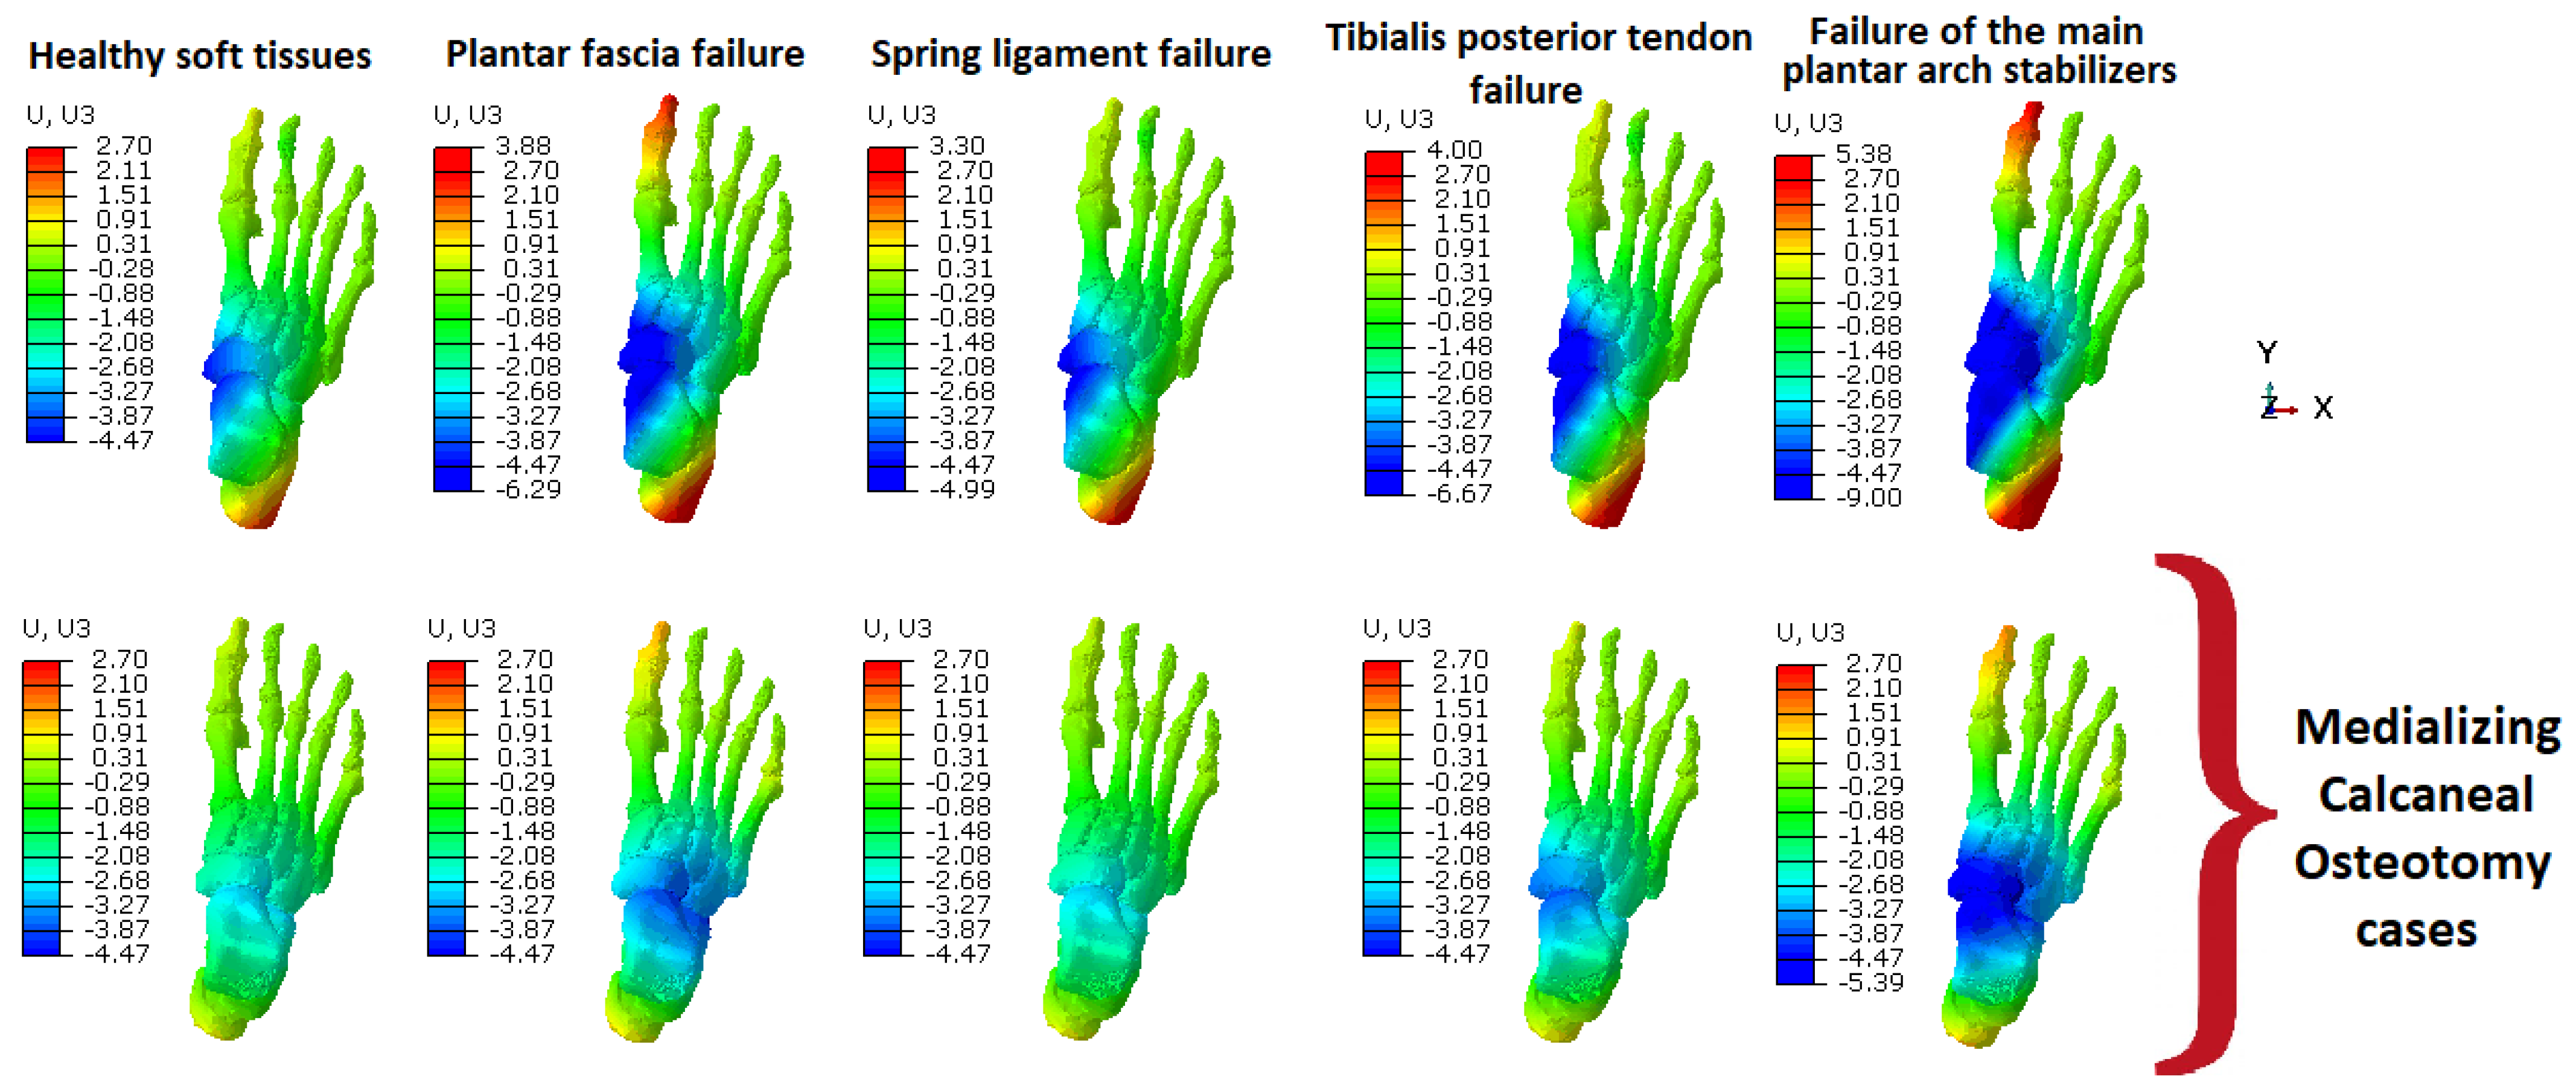
The results show that MCO effectively reduces the pronation of the hindfoot typically observed in patients with AAFD (see intense blue color around both astragalus and navicular bones). As can be seen in
Figure 5, in most of the cases simulated with MCO, foot pronation was not generated. Moreover, these results indicate a good compensation of the MCO when the spring ligament fails. This is due to the supination momentum caused by the MCO over the foot structure. Nevertheless, if all the main soft tissues support the plantar arch failure, the MCO by itself cannot stop foot pronation. This means that, when performing an MCO, surgeons should add another strategy, such as artrodeses or tendon reinforcement, for example.
Additionally, the results suggest that MCO compensates very well for the spring ligament failure. The supination momentum that MCO causes in the foot structure can explain these results. However, it is noticeable that, when all the main soft tissues that support the plantar arch fail, MCO cannot prevent foot pronation on its own. This means that MCO should be applied in combination with other strategies, such as tendon reinforcement or arthrodeses.
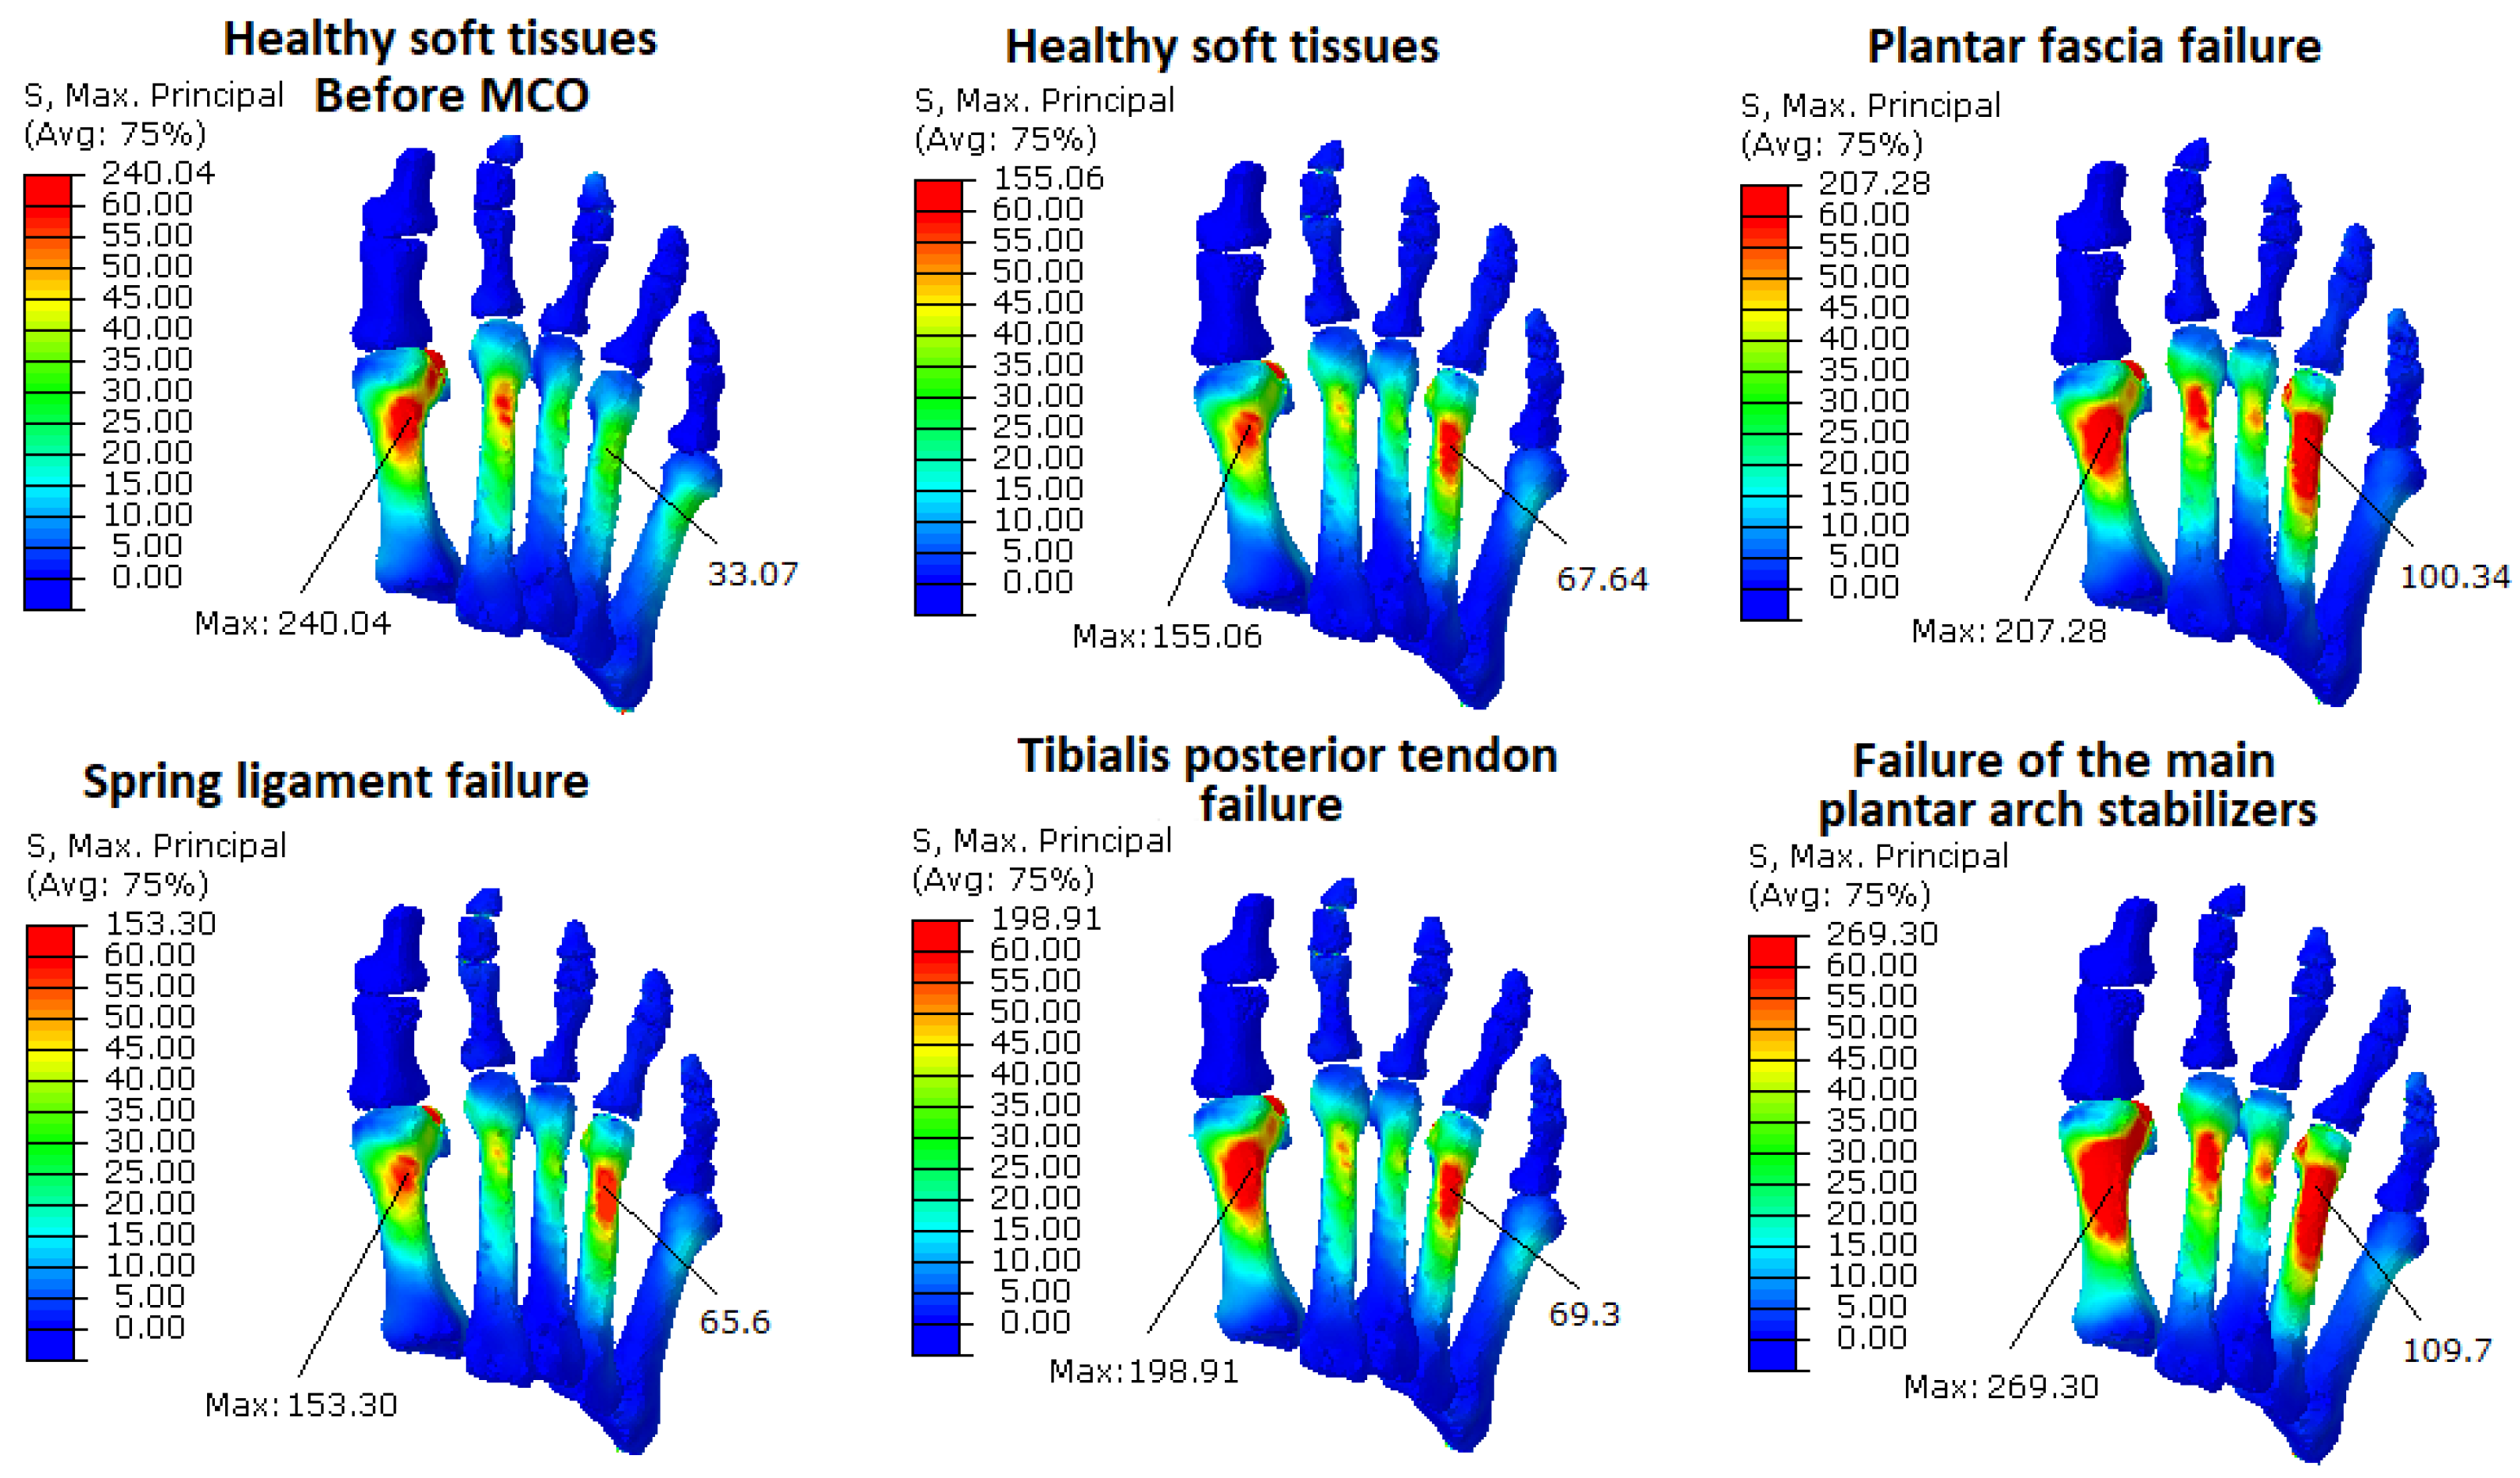
The results of the stress analysis on forefoot bones show that MCO reduces the bone stresses by approximately 35%, considering the healthy case as a reference and comparing the maximum stress values obtained from both healthy cases (without tissue weakness) before and after MCO (see
Table 3 and
Figure 6). However, when the foot arch stabilizers fail, our simulations found a stress increase in all the metatarsals, mainly in the first, second, and fourth. This increase is much more important if the plantar fascia or the tibialis posterior tendon fail, increasing the stress by approximately 34% and 28% respectively, compared to the maximum stress values obtained from MCO with healthy soft tissues (see
Table 3). When the main arch stabilizers fail, the stress increases by 74%. This increase in the stress values and in its redistribution could explain the pain in the toes reported in patients treated with MCO [
30] and the findings of Iaquinto [
12], who concluded that corrective osteotomies shifted loads from the medial forefoot to the lateral forefoot, with greater impact for combination lateral column lengthening and MCO procedures. The stress on the third and fifth metatarsals increases less than the others, probably because of some differences in the tissue insertion on the phalanges. Despite these differences, it is important to note how the metatarsal stresses change in different scenarios.
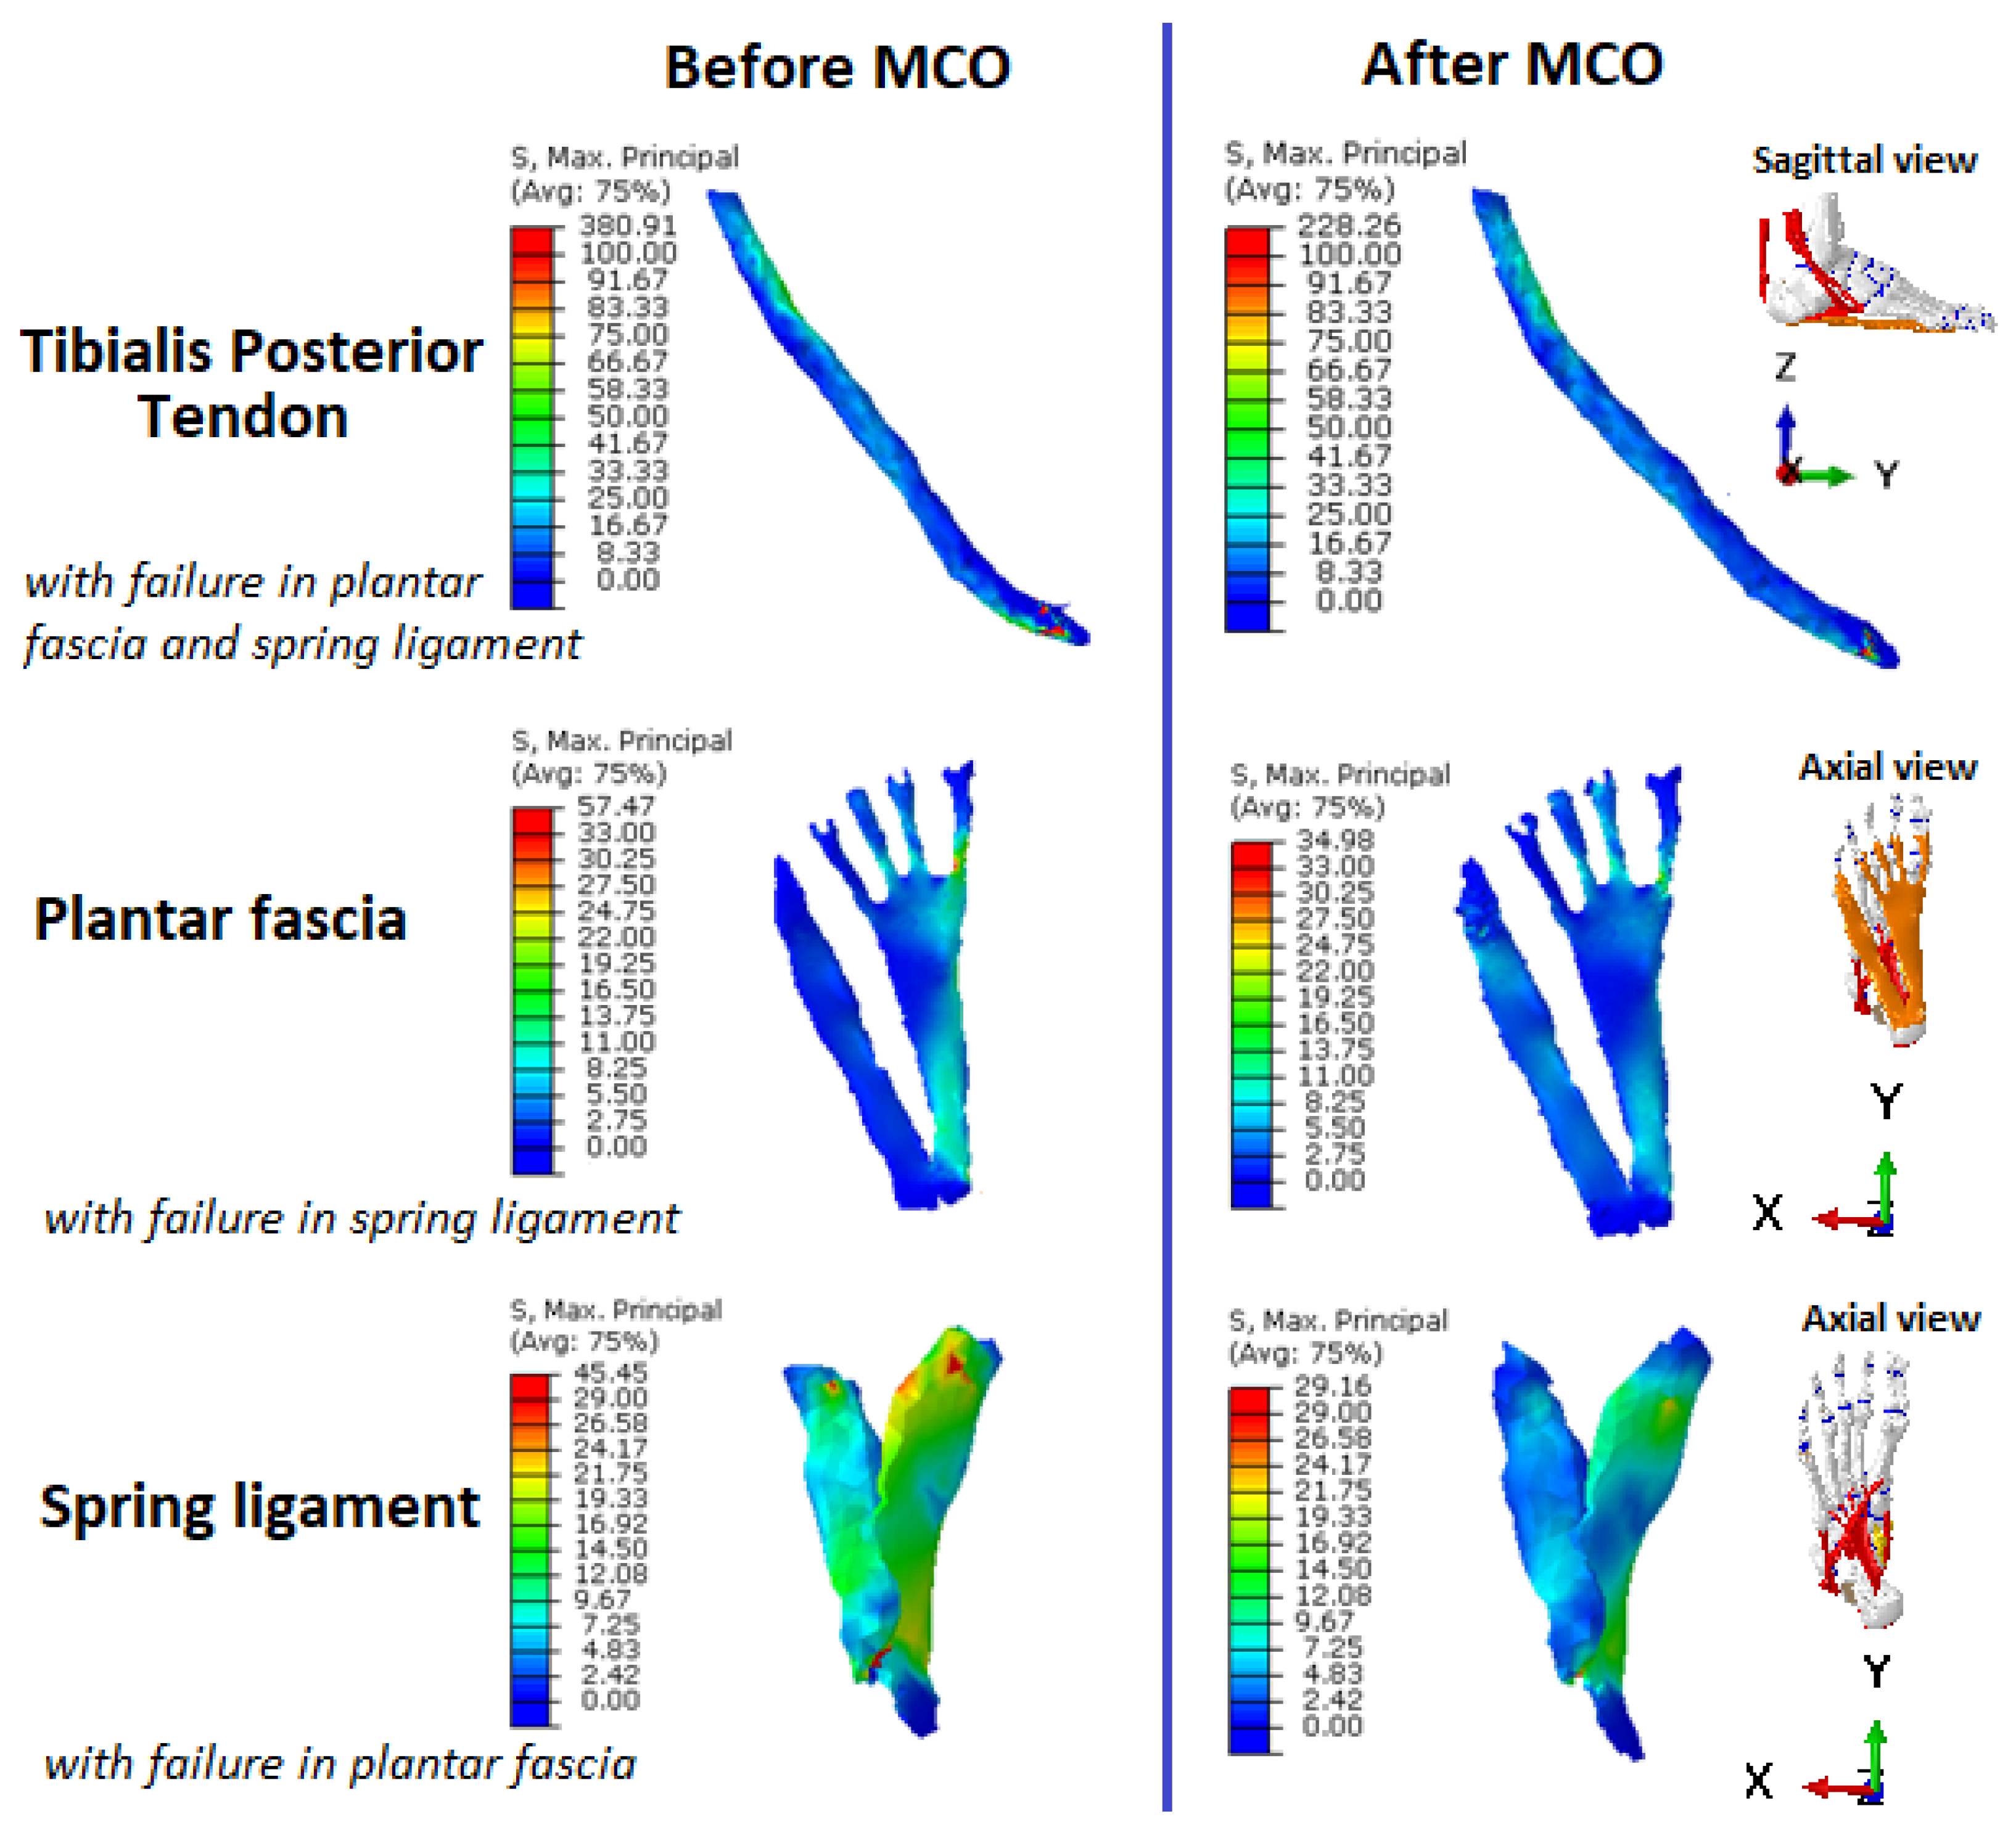
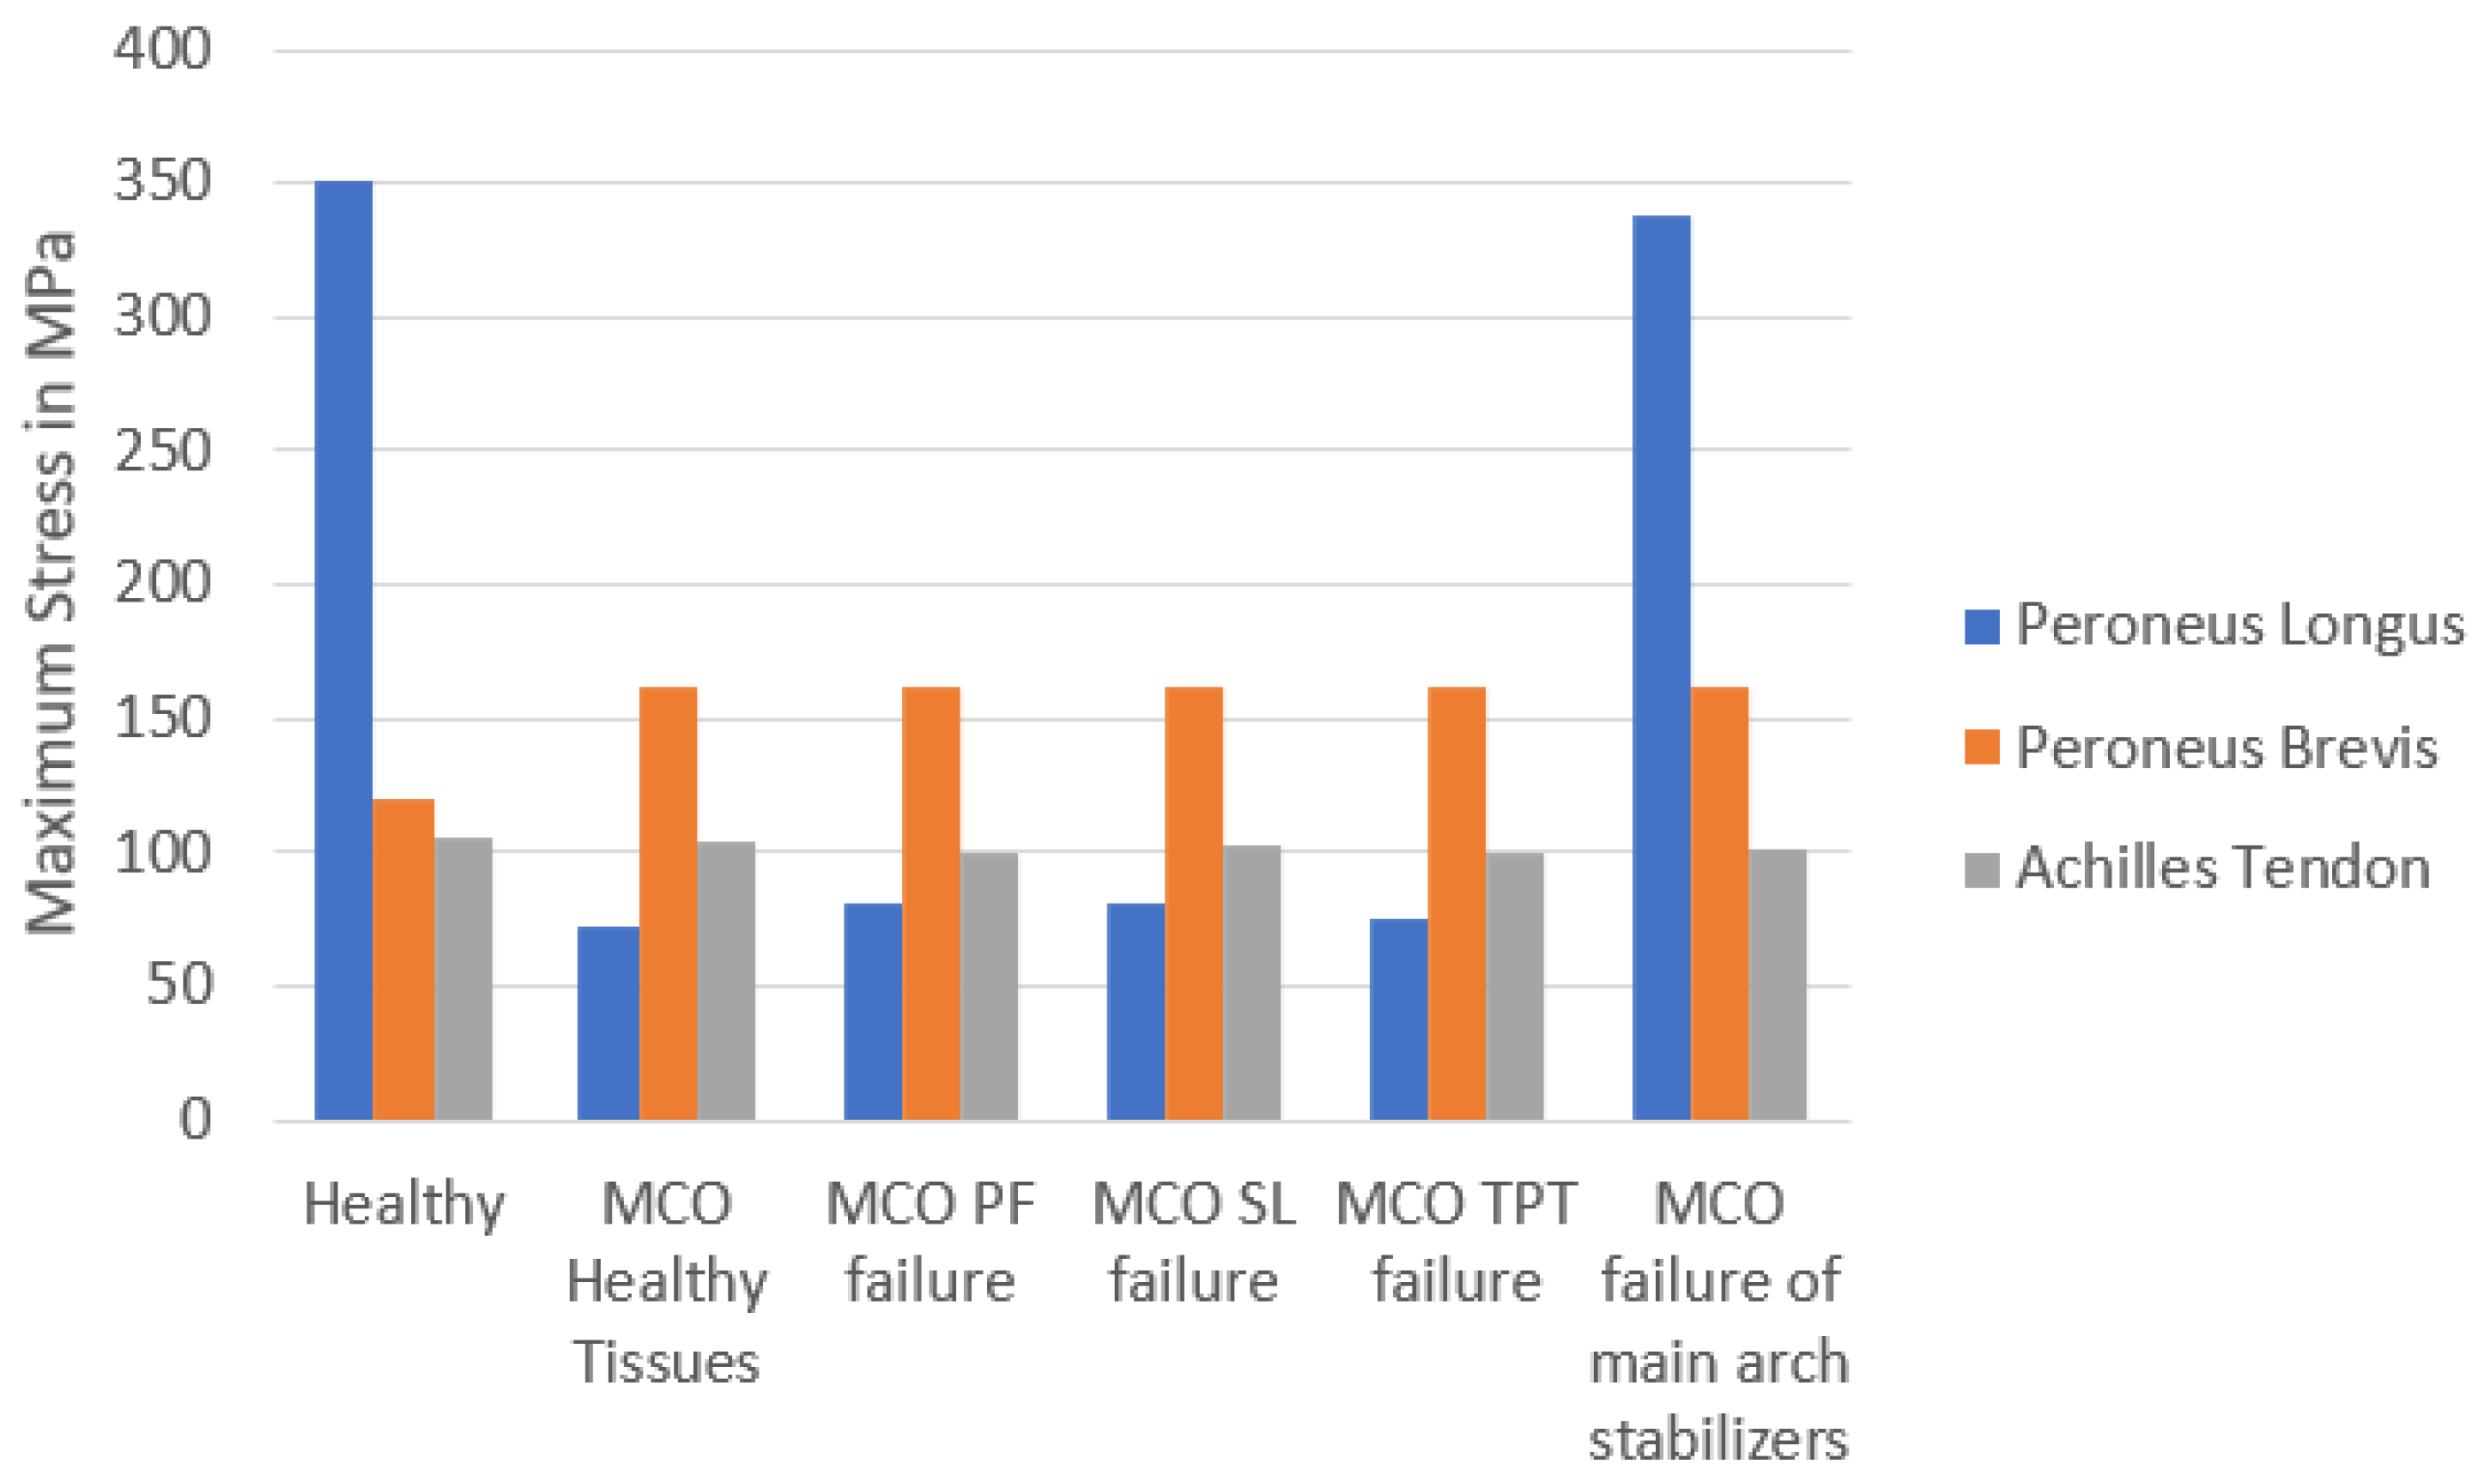
The results of the soft tissue analysis show that MCO noticeably reduces the stress in the main foot arch stabilizers, especially when the plantar fascia (mainly) or tibialis posterior tendons fail (
Figure 8). Additionally, the stress reduction generated in the peroneus longus tendon is considerable, except in the case simulated with failure of all the main foot arch stabilizers (
Figure 9). This result is consistent with the structural analysis, which shows that MCO cannot correct foot pronation when these tissues fail. As expected, no significant stress changes were found in the Achilles’ tendon. These results are close to those obtained by Hadfield et al. [
11] and Kongsgaard et al. [
32] in their study performed using cadaver models.
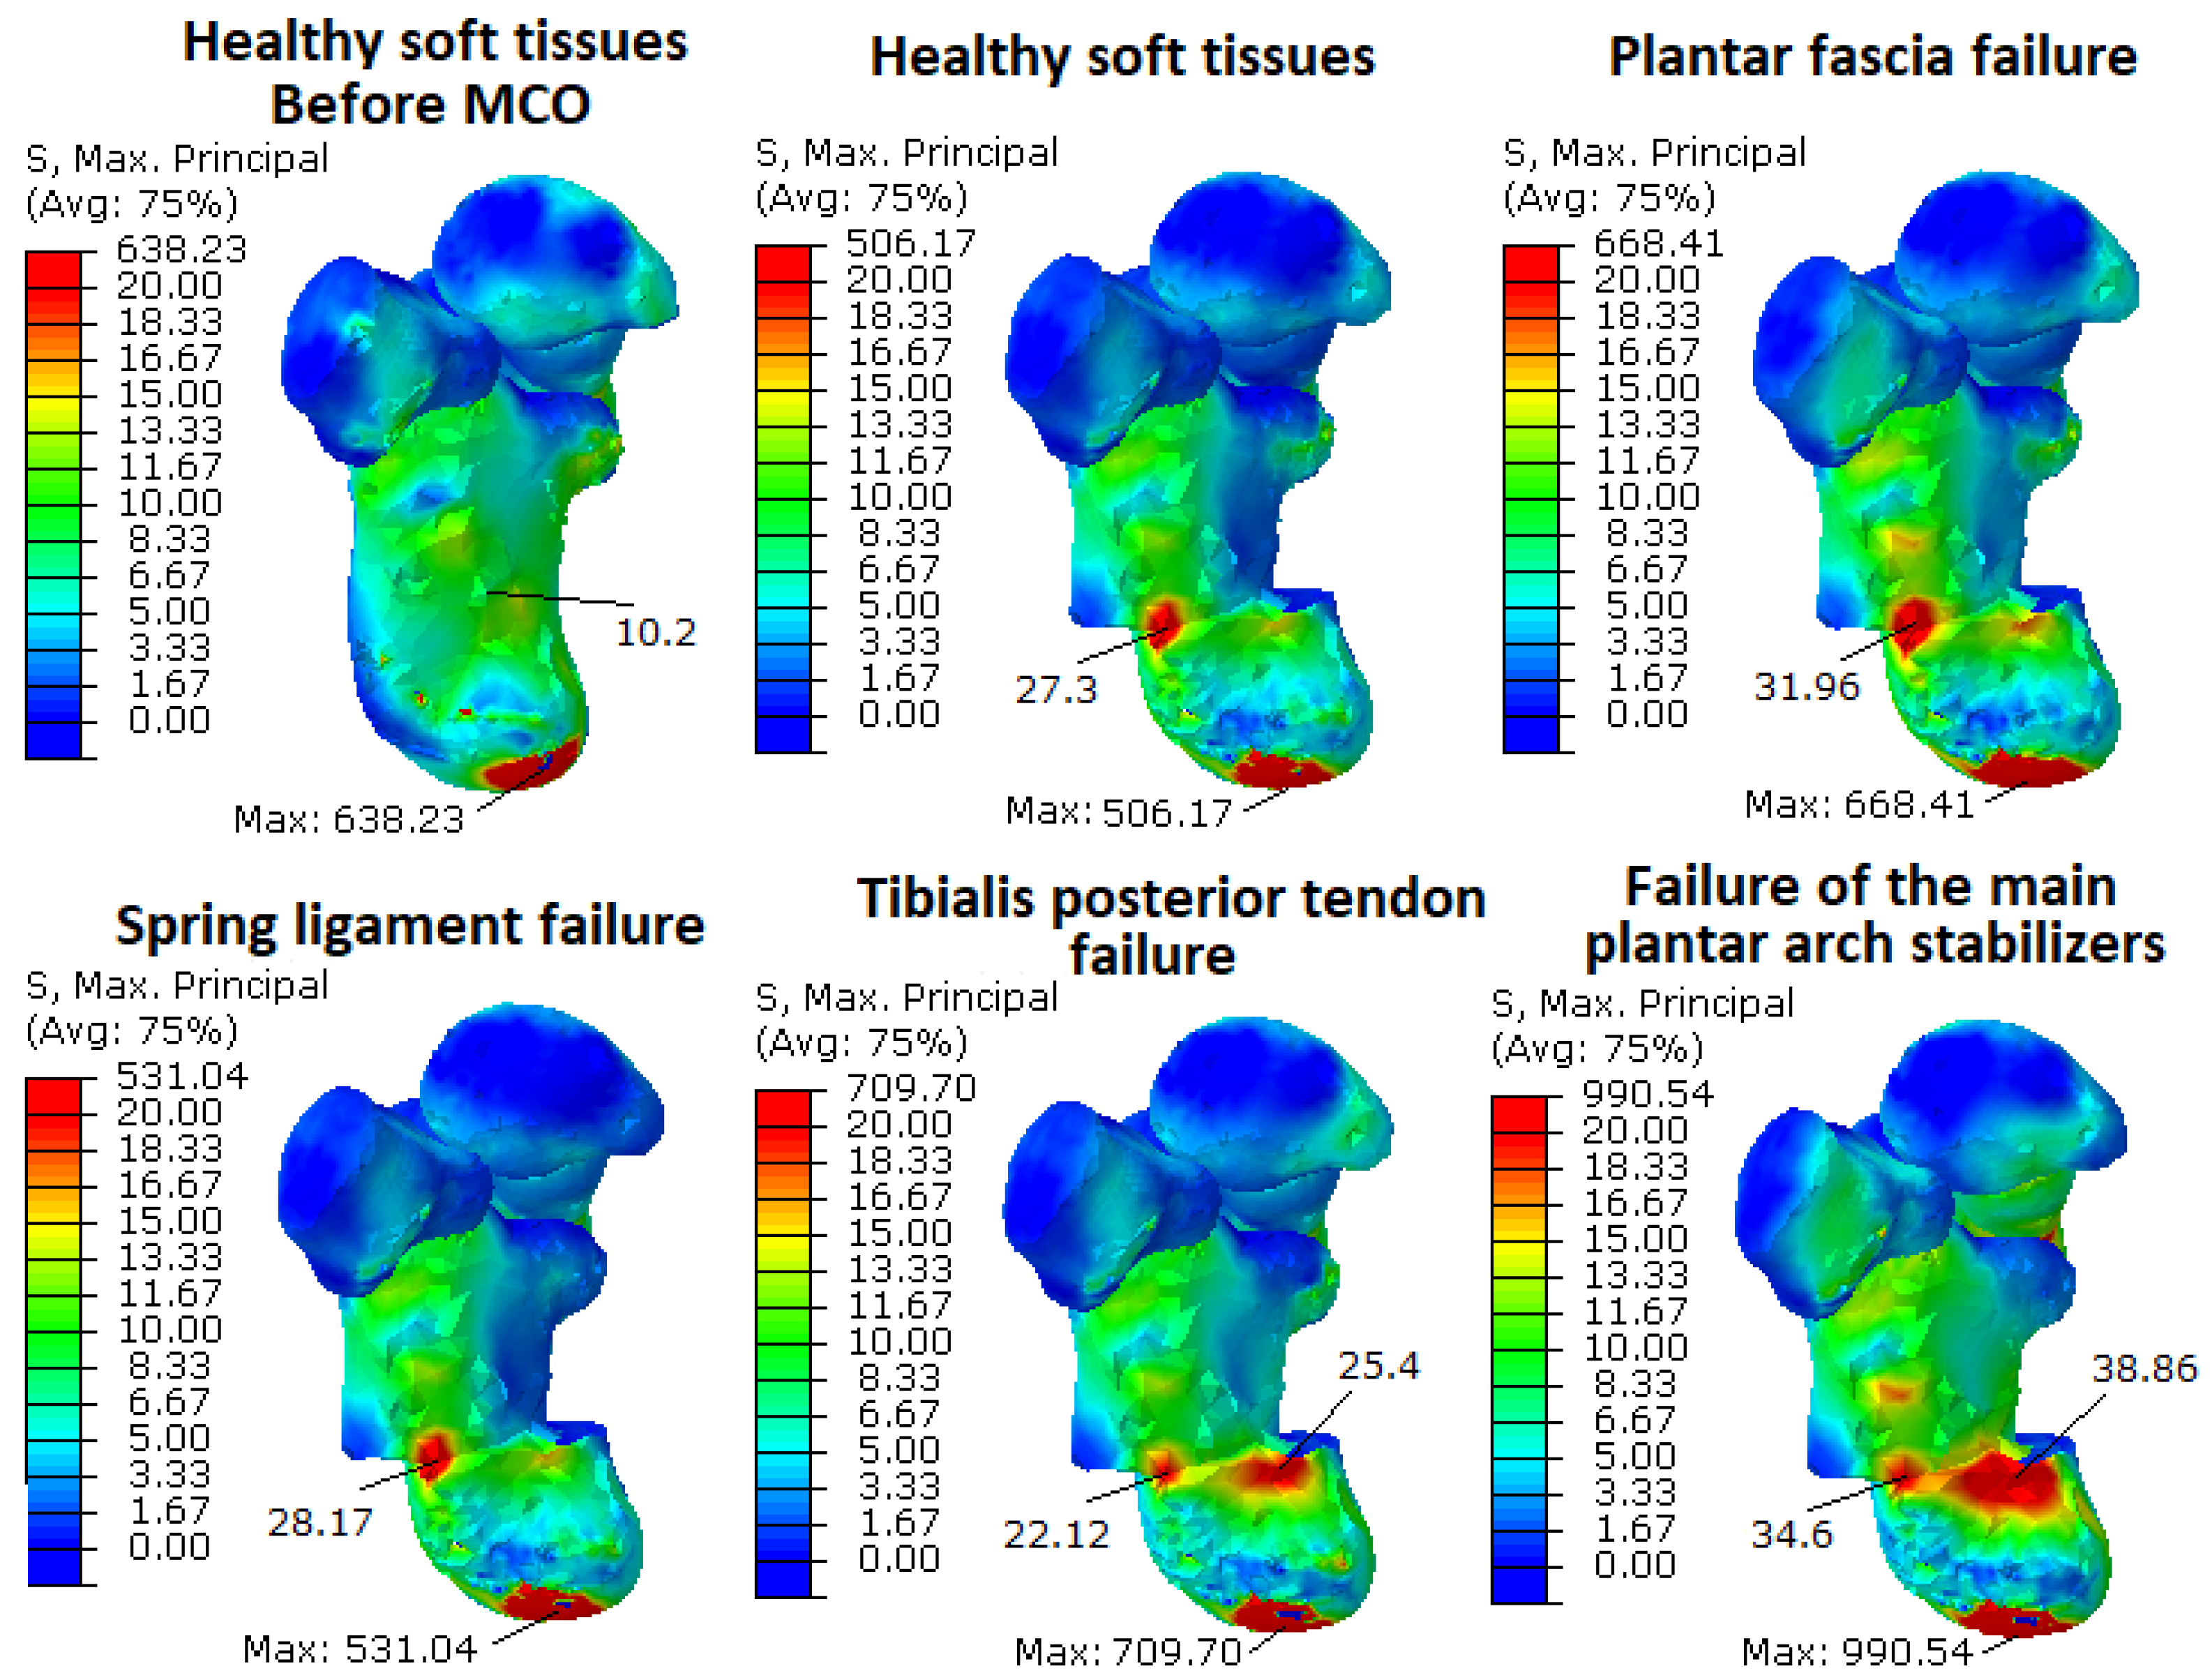
Finally, if some of the stabilizers of the main arch fail, such as the plantar fascia or tibialis posterior tendon, an important stress concentration around the osteotomy region appears (
Table 3 and
Figure 7). As is shown in
Table 3, the maximum stress in these cases increased by 32% and 40%, respectively. When the foot arch stabilizers fail, the maximum stress concentration increases by about 95% (from 507 to 990 MPa). In this work, fixation methods were not evaluated since complete bone healing is assumed after calcaneal translation.
A limitation of this study is that the analysis was based on a static simulation. Thus, patients’ variability in tissues and loading was not considered, because one case study was simulated. However, the relations and differences (in percentages) obtained could be useful for evaluating the MCO effects in all the scenarios simulated. Our results cannot be generalized because only one anatomy was investigated, but the relative differences obtained could help with the study of MCO effects on the foot structure. Additionally, our model does not include the plantar pad, the flexor hallux longus, or flexor digitorum longus tendons. However, clinical studies have shown that these tissues have a minor role in AAFD development and in the foot arch support, compared to the tissues included in the model used [
27,
33]. Additionally, our model does not include any artificial restriction for the tibialis posterior tendon motion, so the pathway generated after traction forces may not be anatomically correct. Additionally, we used an isotropic characterization for plantar fascia and ligament tissues, which could lead to non-real calculations of stress in the tissues. It is necessary to perform a parametric study to show how sensitive the model predictions are to the material properties chosen. Moreover, our study was based on small displacements and deformations, so a linear elastic behavior for these tissues does not greatly falsify the results. This model also does not allow for error predictions, since statistics or deviations on the model characteristics are not included. One way to be able to make error predictions could be using probabilistic finite elements. Finally, it is important to remark that the values of biomechanical stress found cannot be assumed to be true stress values for all people (because of inter-subject variability). Nevertheless, we can analyze the relative differences generated in each case. The smaller increase in the third and fifth metatarsal stresses could be caused by differences in tissue insertion in the phalanges.


