Article

Connectedness between Pakistan’s Stock Markets with Global Factors: An Application of Quantile VAR Network Model

1
Department of Business Administration, Sukkur IBA University, Sukkur 65200, Pakistan
2
College of Business Administration, Al Yamamah University, Riyadh 11512, Saudi Arabia
3
Department of Finance, College of Business Administration, King Saud University, Riyadh 11587, Saudi Arabia
4
Health Administration Department, College of Business Administration, King Saud University, Riyadh 11587, Saudi Arabia
5
Faculty of Management and Economics, Ruhr University Bochum (RUB), 44801 Bochum, Germany
*
Author to whom correspondence should be addressed.
Mathematics 2023, 11(19), 4177; https://doi.org/10.3390/math11194177
Submission received: 9 July 2023 / Revised: 24 September 2023 / Accepted: 25 September 2023 / Published: 6 October 2023

Abstract

:
This study aims to provide important insights regarding the integrated structure of global factors and Pakistan’s leading sector-level indices by estimating the dynamic network and pairwise connectedness of the global crude oil index, MSCI index, European economic policy uncertainty index, and important sector-level indices of Pakistan based on QVAR using daily frequency over the period of 20 years from 2002 to 2022. The findings demonstrate high interconnectedness among global factors indices and Pakistan’s leading sector-level indices. The results of net directional connectivity showed that the EPEUI, WTI, and MSCI indices are the “net receivers” of volatility spillover. At the same time, the financial and energy sectors are the “net transmitter” of shocks. Connectedness is high amid financial upheavals. The research findings provide crucial insights for policymakers, businesses, portfolio managers, and investors.

1. Introduction

The vital strategic aim of every investor and portfolio analyst is to attain greater diversification, and this necessitates an understanding of the price co-movement, interconnectedness, and spillover insights among distinct financial and commodity markets. Market interconnectivity prevails as a consequence of financial globalization and standard mechanism of financial transactions that, in turn, has stimulated and spurred substantial collective shocks to diverse economies, resulting in volatility spillovers [1], interconnectivity [2,3,4,5], or spillover effects based on fundamentals [6] to achieve a greater level of diversity, portfolio managers and investors turned to alternative investment types, like commodities. In well-diversified portfolios, commodity assets’ composition has altered dramatically lately. Besides commodity financialization, the flow of investment has witnessed extraordinary development, resulting in severe price volatility, renewing the interest of scholars in their dynamic patterns. Like financial assets and other markets, there is a strong common trend in price movement and interconnection across sectors in commodity markets. Preceding research studies have revealed adequate empirical evidence of co-movement in commodity prices, e.g., [7,8], and effects of volatility spillovers, such as [9], found asymmetric relationships among commodity markets under distinct economic conditions. The recent pandemic, the most disastrous occurrence confronting the global financial sector, has produced a recession, the risk of which has shown to be unexpectedly high. It poses a significant threat to global economic progress by boosting global systematic risk, and consequently, economic policy uncertainty reaches a historical height globally. On one side, external shocks primarily affect the stability of in-house supply and demand of commodities via commodity trade networks and the foreign exchange markets. At the other extreme, advanced economies continue to implement unrestricted expansionary monetary policy, which depreciated the currency and left rational investors apprehensive regarding market expectations, resulting in significant changes in commodity prices settled in a commodity currency. A significant difficulty now is determining how to reduce the direct and substantial harmful effects of spillover triggered by imported inflation. Crude oil prices in the international markets have changed due to global economic trends and geopolitical forces [10,11,12]. These global crude oil market price variations are transferred to other asset markets as global economic integration accelerates. The current study will contribute to the available literature in the following directions:
  • Studying the interconnectedness among global factors and main sector-level indices might offer developing countries like Pakistan valuable insights into the varying impacts of global factors on their stock market across different sectors. This study will provide valuable insights to policymakers and investors for their future actions.
  • The prior literature has concentrated on related concerns at the aggregate and specific level or related to certain markets, particularly oil, energy, and non-energy commodities [13]. Limited studies, however, examine the nature of spillover effects at the sector level in Pakistan [14,15]. However, none of them have evaluated this association regarding connectedness among markets.
  • There has been no research on quantile connectedness based on extreme events to determine how the global crude oil WTI index, MSCI index, European economic policy uncertainty, and significant sector-level specific indices of Pakistan are connected in a network and pairs. Evaluating tail risk behavior can help investors avoid the devastating impacts of left tail events’ shocks while achieving financial investment objectives [16]. As a result, this study will be unique in examining such interrelationships among these variables and various sector-level indices.

1.1. Statement of Problem

The impact of fluctuations in global oil prices and exchange rates on financial and commodity sectors is a recent major concern for emerging and developing economies. Pakistan is not an exception, and being a developing and net-oil-importing country, it is vulnerable to fluctuations in crude oil prices and the dollar’s rate in the international market. Ref. [17] found that exchange rate fluctuations and changes in oil prices are vital factors influencing Pakistan’s inflation rate. After the pandemic and increased tension between Russia and Ukraine, more supply-side issues are arising related to oil prices that can directly or indirectly influence the prices of different sectors in oil-importing countries [18]. Oil prices are considered a strong determinant of the exchange rate in Pakistan [19]. With the supply-side concerns and increased demand, there is a visible surge in crude oil imports, which necessitates more need for foreign currency for crude oil purchases. These crude oil price shocks can also adversely impact other sectors’ indices [20].
The uncertainty in economic policies in advanced economies impacts the international monetary policy transmission mechanism and is critical in international capital flow [20,21]. It has caught the attention of many scholars, and the current literature on the impact of economic policy uncertainty (EPU) on various other financial and macroeconomic indicators is increasing. Recent empirical research, for example, demonstrates that local and global EPU influence negatively on G7 countries’ stock returns. In contrast, it is positively related to the probability of crashes in the stock market [22,23]. Also, EPU has been found to favorably affect bitcoin returns because it can be used as a hedging tactic [24]. Moreover, current studies revealed that high uncertainty in economic policy can lead to the depreciation of a domestic currency [25] and a reduction in net flows of FDI [26]. There have been frequent changes in economic policies worldwide since the well-known market crashes and post-pandemic overhaul, leading to uncertainty in certain policies. Commodity markets are not the exception. They also involve policy intervention [27]. As a result, it would be quite practical to understand the association of economic policy uncertainty with financial assets and commodity markets.
For the development and sustainability of every country, crude oil is a critical strategic resource. As a less developed country, Pakistan can have more disruptive short-term and long-term effects of shocks due to fluctuations in crude oil price, stock indices, and EPU on most of its sector-level indices.
Thus, it is important to examine the impact of global factors on Pakistan’s top sector level indices. Further it is relevant to comprehend the interconnectedness across Pakistan’s significant sector-level indices during different economic conditions. Despite the significance of this subject, the extant literature is limited on this theme. Notably, there is little evidence in studies covering multiple global factors and Pakistan’s stock market. This motivates us to investigate the connectedness between Pakistan’s multiple stock market indices with global factors. Unlike the copula study on Pakistani stocks and stock sectors [28], the impact of geopolitical- and oil-related factors on Pakistan’s financial landscape [29,30], our research explores the larger range of global factors that can influence Pakistan’s leading sector level indices. In light of this, the purpose of this study is to identify the connectedness of the key global factors and important sector-level indices of Pakistan based on Quantile VAR. We add to the body of literature in a number of ways.
First, we study the connectedness of the global crude oil index, MSCI index, European economic policy uncertainty index, and important sector-level indices of Pakistan based on the Quantile VAR Network Model. Second, we examine the varying degrees of connectedness at different quantiles, presenting a more distinct view of the relationship between Pakistan’s stock market and purported global factors. Third, we establish the net transmitters and/or net receivers of the shock pattern over a wide range of quantiles with the aid of sensitiveness to the quantile investigation.
By employing this innovative application, our study adds depth to the existing body of research. In doing so, we provide valuable insights for policymakers, investors, and financial analysts, enabling them to make more informed decisions in an increasingly interconnected global financial environment. Thus, our study complements and extends the existing literature, contributing to a more comprehensive understanding of the intricacies of Pakistan’s stock markets in the context of global factors.

1.2. Objectives of Study

(1)
To determine the simultaneous influence and network connectedness among global crude oil price shocks, exchange rate fluctuations, and economic policy uncertainty and indices of different sectors in Pakistan.
(2)
To examine net pairwise directional connectedness among variables and sector level indices

1.3. Research Questions

(1)
Whether the global WTI crude oil price index, MSCI index, European economic policy uncertainty (EPEUI), and significant sector-level indices of Pakistan have total network connectedness.
(2)
How much pairwise connectedness does the WTI crude oil index, MSCI Index, and EPEUI have with individual significant sector-level indices of Pakistan?

2. Literature and Theoretical Underpinnings

Commodity securitization has resulted in an unprecedented rise in commodity investment flows, resulting in significant price volatility and reigniting our attention to the structure of their dynamics. Like other asset markets, commodity prices have a significant, consistent trend in their behavior and cross-sector associations. From a theoretical stance, the “General Equilibrium” theory of the global business cycle initially proposed by the French economist Leon Walras (1874a, b), [31] and well applied by [8] comprehensively explains the phenomena. The theory proposes numerous approaches for recovering a fundamental explanation of shared components of prices of commodities. The model’s projected factor structure in commodity prices divides exogenous variables or influences into different kinds. The first category of shocks affects in a way that directly shifts the curves of supply and demand, thereby influencing prices of commodities despite the absence of equilibrium changes in aggregate income. However, these forces do influence the effects of General Equilibrium on the aggregate level of income and thus pose additional indirect effects on the prices of commodities. They may bear several similar shocks to commodity input costs, such as labor or energy, as well as fundamental shocks to productivity and demand factors, like variations in the requirement for commodities to produce end consumer’s finished products. The second type of shock indirectly affects the prices of commodities via their influence on output at the aggregate level. The indirect impacts can manifest themselves in two ways. The first is the traditional demand channel. The second type of channel is a supply-side channel. Both mechanisms provide positive co-movement in commodity prices. The major empirical finding of [8] was that most of the historical fluctuations in prices of commodities linked with the indirect factor, namely, wide-ranging variations in prices of commodities can be related largely to a usual reaction of collective non-commodity shocks instead of straight shocks to the commodity sector.
In his book “The Economics of Interdependence”, Richard N. Cooper (1968) discussed the economic interdependence of countries in terms of the “sensitivity” of economic events occurring in one country to its trading partner. It is related to the increasing relative importance of international transactions such as trade, travel, labor mobility, overseas investment by firms, and the flow of financial capital, which have micro- and macroeconomic impacts. Another renowned author [3] has explained economic interdependence as “vulnerability”, i.e., the costs imposed by external events and adjustments should have been made to avoid them. In the present study, concerning this theory, we want to see the interdependence structure of the global crude oil WTI index, exchange rate, and European economic policy uncertainty and sector-level specific indices of Pakistan in a network and pair in light of the above-mentioned theoretical standpoint.

2.1. Global WTI Crude Oil Index and Sector Level Indices

Crude prices have substantially increased after a significant economic recovery following the shutdowns, reaching about $100 per barrel on global markets. Demand for oil increases along with the economic recovery. Moreover, the supply-side issues are continuously exacerbated by the increased global tension in the Middle East and worsened issues between Russia and Ukraine. It leads to increased inflationary pressure and concerns about economic stability, especially in developing countries still recovering after the pandemic [18]. Petroleum products are crucial in almost every other sector as they can be found in many products, including personal safety equipment, plastics, pesticides, pharmaceuticals, garments, solar panels, and fuel in the transportation sector. Oil prices are quoted in US dollars; consequently, the USD exchange rate may affect the prices of other commodities and oil-related items. Financial economists, particularly motivated by the greater sensitivity of emergent economies to the fluctuations of oil prices, have conducted various studies to find the association of oil price links in the context of emerging markets. The research of commodity price links was pioneered by [7]. It shows a persistent general tendency to price a big group of unrelated raw commodities in the market. Since then, the attributes of commodity price co-movements remain a hot area in empirical studies [8,32,33,34,35,36]. The available literature analyzes the correlation among oil prices, exchange rate fluctuations, and performance of stock market indices in the context of Pakistan to examine the long-run and short-run positive and negative shocks [15], volatility spillover effect [37], or their inter-relationship pre- and post-COVID-19 effects [14] but none of the study has evaluated their relationship to see the interdependence structure and shock transmission in a network. Ref. [38] employed a multifractal detrended fluctuation cross-correlation analysis and found the significant effect of multifractality among the WTI crude oil index and the energy sector stock indices is the strongest, accompanying the strong multifractality among the WTI crude oil index and the financial indices, indicating a significant relationship among financial and energy sector level indices. Crude oil, a crucial trade commodity, is important for almost every sector; we developed a hypothesis to examine its pairwise connectedness with commodity sector indices of Pakistan.
H1. 
WTI Crude oil index has pairwise connectedness with one or more commodity sector-level indices of Pakistan.

2.2. MSCI Index and Sector Level Indices

A substantial body of work exists on the association among economic uncertainty, macroeconomic fundamentals, and energy-related markets. [39] estimated the effect on energy prices caused by financial, energy, and EPU variations. The author discovered an inverse relationship between variations in the EPU and energy stock returns. The critical insight behind this is that a sudden rise in EPU would contribute to increased macroeconomic volatility and affect investors’ investment decisions. Additionally, it changes the firm’s fundamental values, inhibiting investors’ sentiments and causing substantial instability in the stock market. EPU scholars have found a close association between oil prices and returns of stock market indices. Ref. [40], using VAR-DCC GARCH, found that during the periods of demand-side shocks, oil price volatility was found to have a positive impact on the stock returns except in consumer discretionary, financial, and energy sectors, whereas during supply-side shocks, the latter two sectors display an unfavorable impact due to fluctuations in oil prices. The literature supports the notion that global oil prices and economic uncertainty affect stock returns of different sectors. For the current research, we used the MSCI index, which captures nearly 85% of the free float-adjusted market capitalization of 23 countries around the globe. In order to see the pairwise connectivity of the MSCI index with commodity sectors’ indices (i.e., energy, financial, and material) of Pakistan, the current study developed the following hypothesis.
H2. 
MSCI index has pairwise connectedness with one or more commodity sector-level indices of Pakistan.

2.3. Economic Policy Uncertainty (EPU) and Sector-Level Indices

The influence of policy uncertainty on global economic activity has caught more attention from researchers and investors since the 2008 global financial crisis and following the economic downturn. Similarly, the current pandemic breakout produced economic recession globally because of the severe shutdowns, climate changes, and policy uncertainties around all commercial and business sectors. Ref. [41] evaluated the network connectedness of economic policy uncertainty among the seven selected nations and discovered a strong association between the EPU of the US and the other seven nations. Using the Bayesian VAR approach, ref. [42] examined the effect of policy uncertainty on professional forecasters’ inflation expectations and discovered that the inflation rates are sensitive to policy uncertainty in both the short and long run. Economic uncertainty significantly impacts macroeconomic volatility, and financial system [43,44,45], and the crude oil market [46]. Despite many studies on the crude oil market and commodity market uncertainty and its implications, the available literature has no harmony in results. For example, considering the influence of shocks of EPU on oil price volatility, most scholars found empirical evidence for a growing influence [47,48]. In contrast, others argued that crude oil prices have not been much influenced by the shocks of EPU [46]. Most of the available literature has extended the evaluation to the interplay among the economic policy uncertainty. For instance, [49] utilized the Granger causality approach for both linear and non-linear features, finding strong associations and connectivity among currency market, oil prices, and EPU following the global financial crisis. Furthermore, the time-varying nature and relationship between EPU and the commodity market can anticipate instability in commodity returns [50]. The current study has developed the following hypothesis to examine its time-varying nature and pairwise connectivity with commodity sectors’ indices of Pakistan.
H3. 
European Economic Policy Uncertainty has pairwise connectedness with one or more sector-level indices of Pakistan.

2.4. Global Factors and Commodity Prices

The rich literature on the connections among crude oil prices, policy uncertainties, and the foreign exchange markets is available. All of them have provided unique results after employing a range of approaches for diverse economies. Fundamentally, the connection between oil and exchange rates can anticipate and influence other macroeconomic or financial series [51,52]. The study of [53] confirmed that the nature of connectivity among oil prices and currency fluctuations has non-linear causality and varies with time. Ref. [47] analyzed the spillover based on time and frequency domain among commodity contract currencies and oil prices, and examined how EPU influenced this interconnectivity. The study claimed an inextricable link between financial markets and oil prices: a net emitter of shocks toward currencies throughout all frequency regimes. Meanwhile, the literature has evolved on the significance of global factors in forecasting prices in commodity markets and volatility shocks across commodity and financial markets. However, in commodity markets, investors are concerned about price volatility and its interaction with macroeconomic issues such as supply, demand, and economic policy. Macroeconomic uncertainty can have far-reaching consequences even if it originates within a single country. Existing approaches would not adequately capture these spillover effects unless the uncertainty was measured globally [54]. Most studies have focused on correspondence of policy uncertainty in response to financial market instability via its influence on investor expectations and multilateral trade enterprises [55,56,57]. At the same time, other studies utilized Transition-VAR and Wavelet coherence techniques. They investigated the impact of global policy uncertainty on fundamental factors, for instance, growth at risk, volatility on the industry level, investor’s mood, credit score, etc. [58,59]. This implies that EPU possesses a significant influence not only on financial assets but also on global commodities and materials [47,60,61,62]. Most of the available literature has evaluated these variables’ impact separately with commodity price volatility based on time-invariant models. In order to examine the interconnectedness among the global crude oil index USD exchange rate and Economic Policy Uncertainty and selected commodity sectors of Pakistan in a network, this study will test the following hypothesis.
H4. 
Global crude oil index, MSCI index, European economic policy uncertainty, and sector-level indices have network connectedness.

3. Research Methodology

3.1. Empirical Methodology

The structure of financial networks is critical for understanding the transmission of risk. A negative idiosyncratic shock to one element of the financial system poses a hazard to systemic stability if it can propagate to other system sections via interconnections. Measuring the extent and strength of financial market links is crucial for risk management methods and informing governmental policy responses to systemic crises. To investigate the interdependence structure among the WTI crude oil index, Morgan Stanley capital international index (MSCI), European economic policy uncertainty index (EPEUI), and significant industry-specific indices (i.e., energy, financial, and material) of Pakistan, this study wants to investigate issues of interconnectedness and how information flows in financial and commodity markets, by examining both static as well as dynamic connectedness standpoints, based on the Quantile Vector Autoregressive model given by [63]. In contrast to the conventional VAR approach, which only estimates the average connectivity of the endogenous variables, QVAR captures its connection at any given quantile. The dynamic features of the system vary over quantiles. The aim is to forecast the tail behavior of the economy when hit by severe financial and real shocks based on the decomposition of variances of QVAR to outdo connectedness estimations based on the mean to capture the nature of association under extreme happenings.

3.2. Quantile VAR (QVAR) Connectedness Approach

We used the quantile-connectedness approach projected by [63] to investigate the quantile propagation mechanism among given variables. To compute all connectivity measures, we first estimate a Quantile VAR (p), which is as follows:
Y t = μ θ + j = 1 p   Φ j θ Y t j + u t θ
Y t and Y t j are K × 1 dimensional vectors of endogenous variables based on the first differences of significant sector-level indices. θ indicates the quantile of global factors and ranges between 0 to 1 [0, 1]. P reflects the length of lag of the quantile VAR model. At the same time, μ θ denotes the conditional mean vector with k × 1 dimension. Φ j θ indicates quantile VAR matrix of coefficients with k × k dimensions. Here, u t θ denotes the error vector with k × 1 dimension and contains a k × k variance–covariance matrix of   . .   θ . In order to convert QVAR (p) into the QVMA infinity World theorem has been applied:
Y t = μ θ + j = 1 p   Φ j θ Y t j + u t θ = μ θ + i = 0   Ψ i θ u t i  
Then, the h-step forward “Generalized Forecast Error Variance Decomposition (GFEVD)” projected by [64,65] was considered to show the influence of a fluctuation or shocks in the j-variable on the i-variable. It can be formulated as:
ψ i j g h = . .   θ i i 1 h = 0 h 1   ( e i Ψ h θ . .   θ e j ) 2 h = 0 h 1   e i Ψ h θ . .   τ Ψ h θ e i
ψ ˜ i j g h = ψ ˜ i j g h j = 1 k   ϕ i j g h
Here, e i represents a zero-vector with a one-value on the ith position. This standardization results can be represented in the following equalities:
(1)
j = 1 k   ψ ˜ i j g h = 1
(2)
i , j = 1 k   ψ ˜ i j g h = k
The total directional connectivity labeled as “TO” others is computed to obtain information about the complete effect of i-variables on all other j-variables:
C i j g h = j = 1 ,   i j k   ψ ˜ j i g h
Additionally, the complete directional connectedness from all the j-variables to the i-variable is mentioned below, indicating shocks received by the i-variable from other variables (i.e., mentioned as “from” connectedness).
C i j g h = j = 1 ,   i j k   ψ ˜ i j g h
Consequently, the “NET” directional connectedness, which may be determined by subtracting “to” and “from”, mentioned as:
C i g h = C i j g h C i j g h  
( C i g h < 0) represents final negative connectedness and shows that the i-variable is a receiver of volatility spillover influenced by other network variables. The final positive one ( C i g h > 0) designates that the i-variable works as a transmitter, influencing the entire variables in a network. The complete connectivity metric is modified total connectedness index (TCI) [66], which spans between (0, 1);
T C I   h = i , j = 1 ,   i j k   ψ ˜ i j g h k 1
The “total-connectedness-index” is usually more often utilized as the proxy of systematic risk, and higher values of the TCI are interpreted as the higher connectedness in the network.

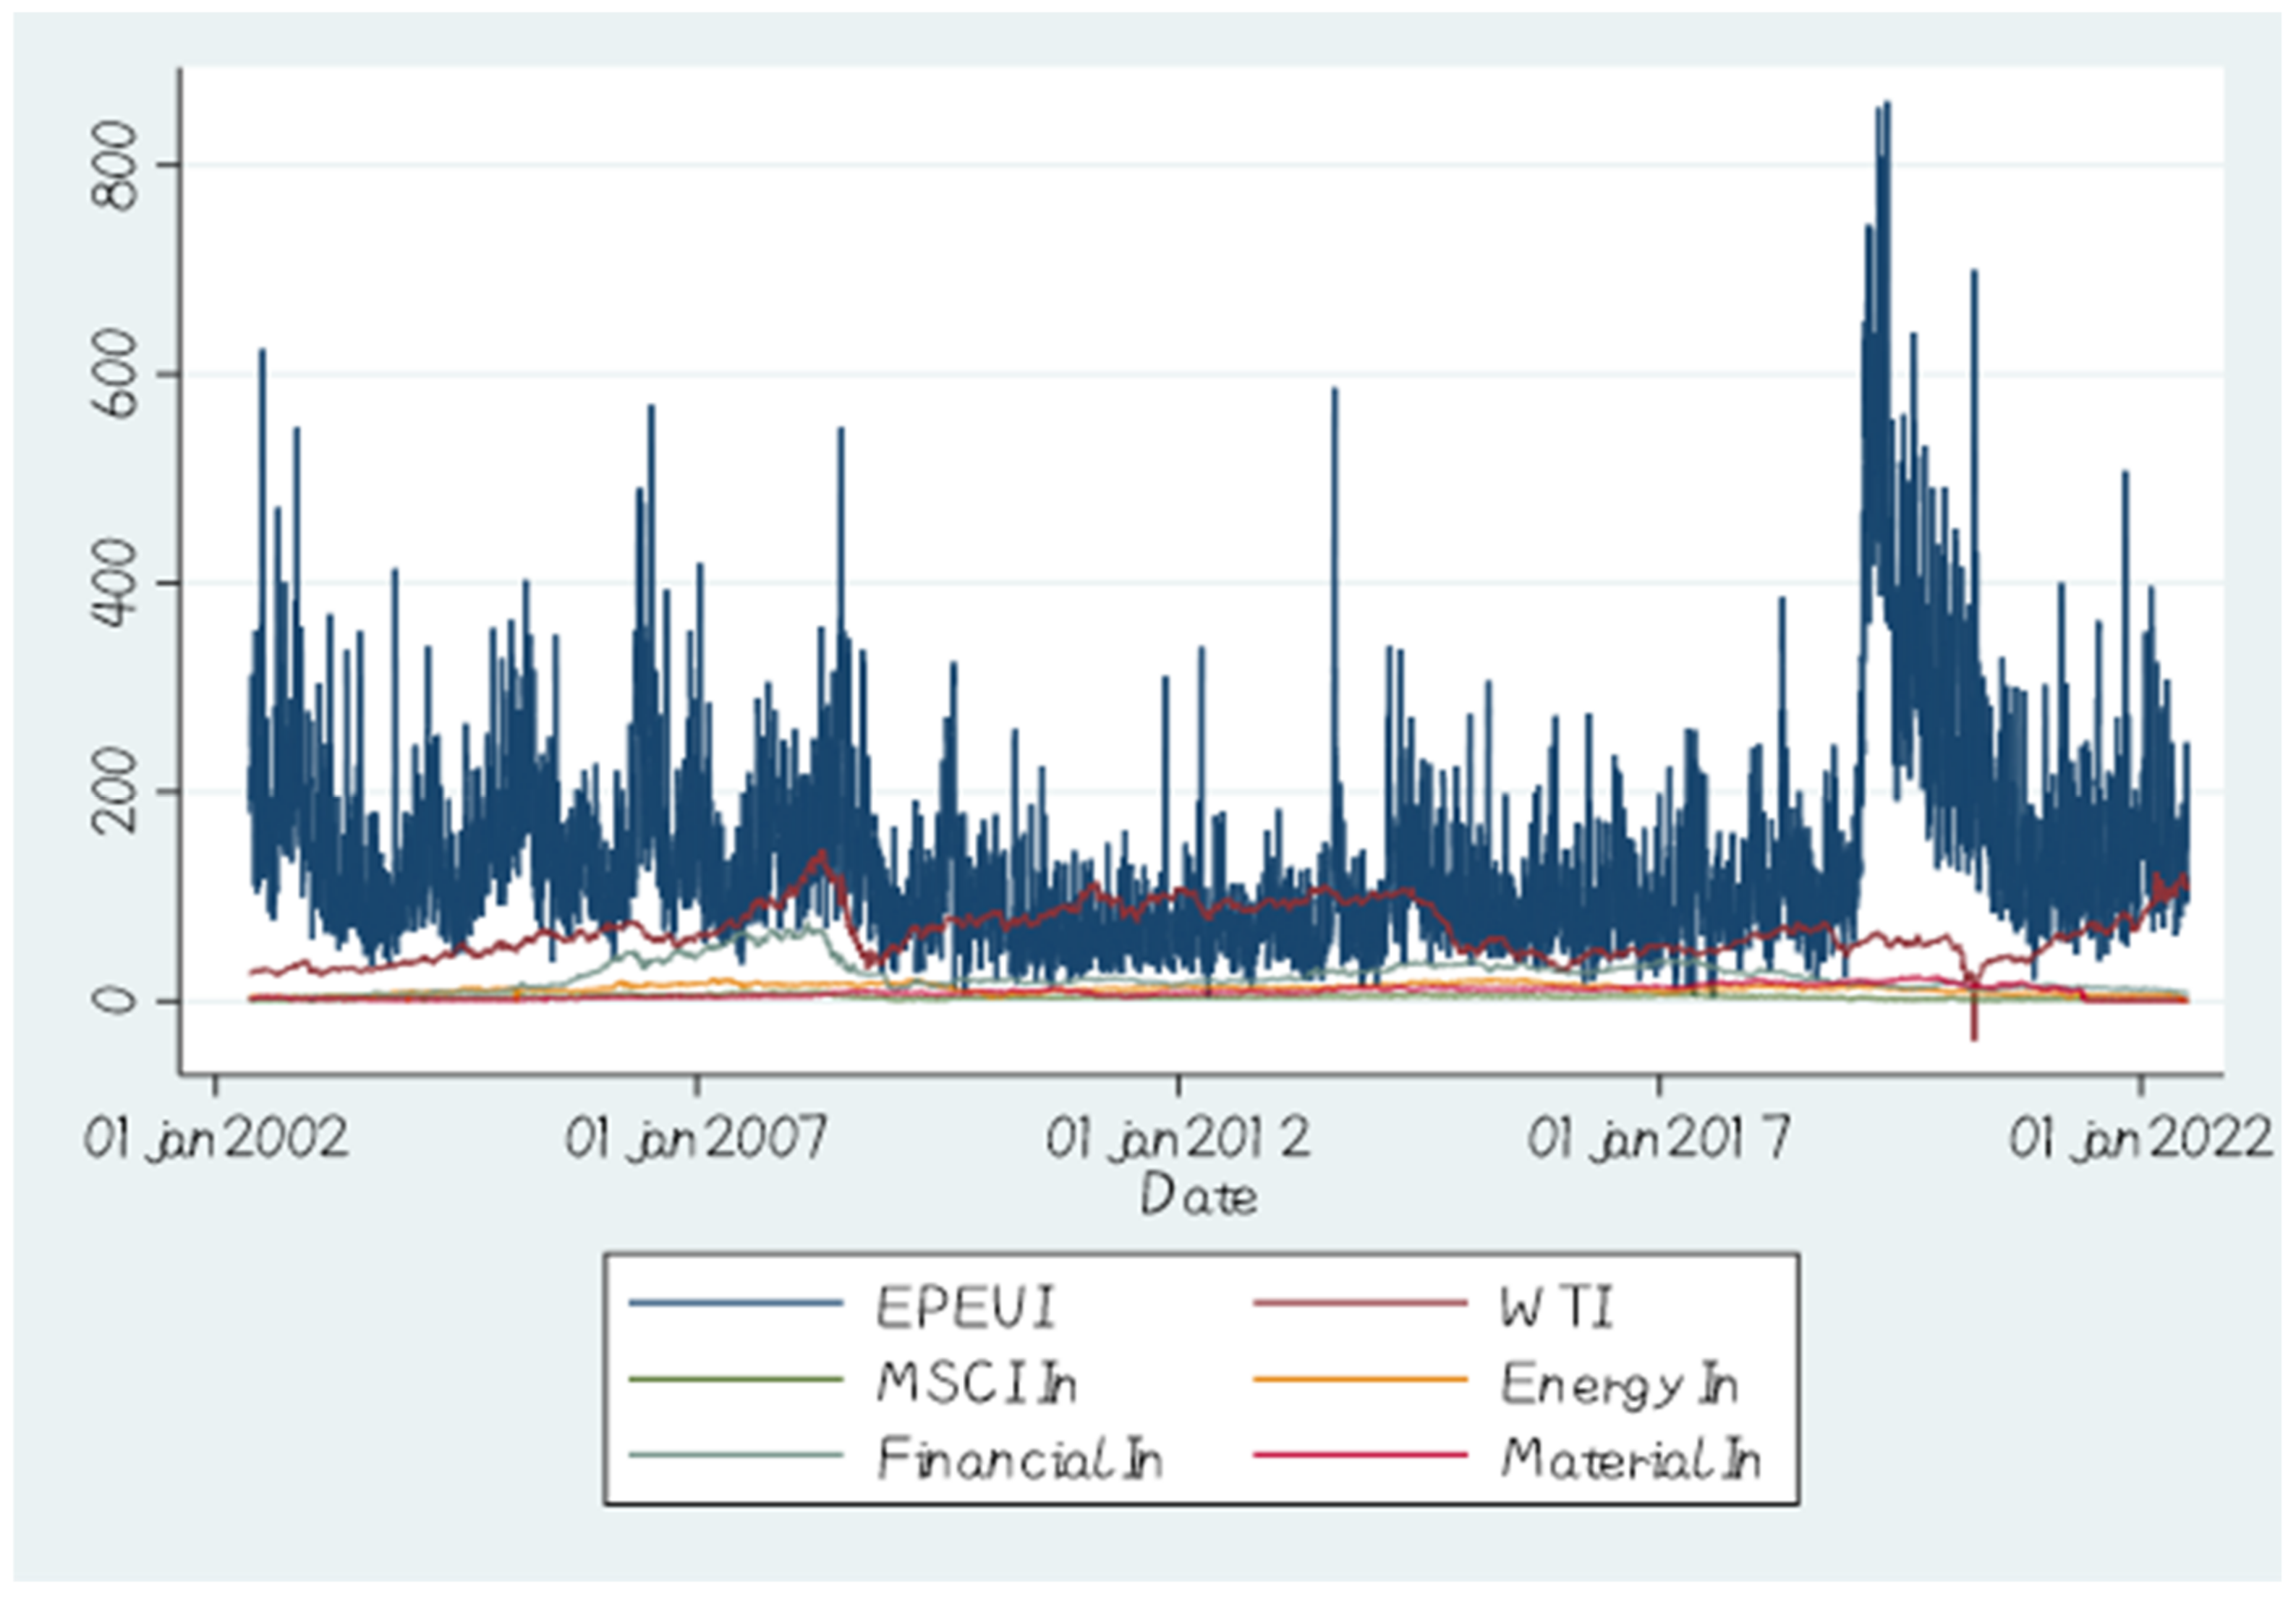
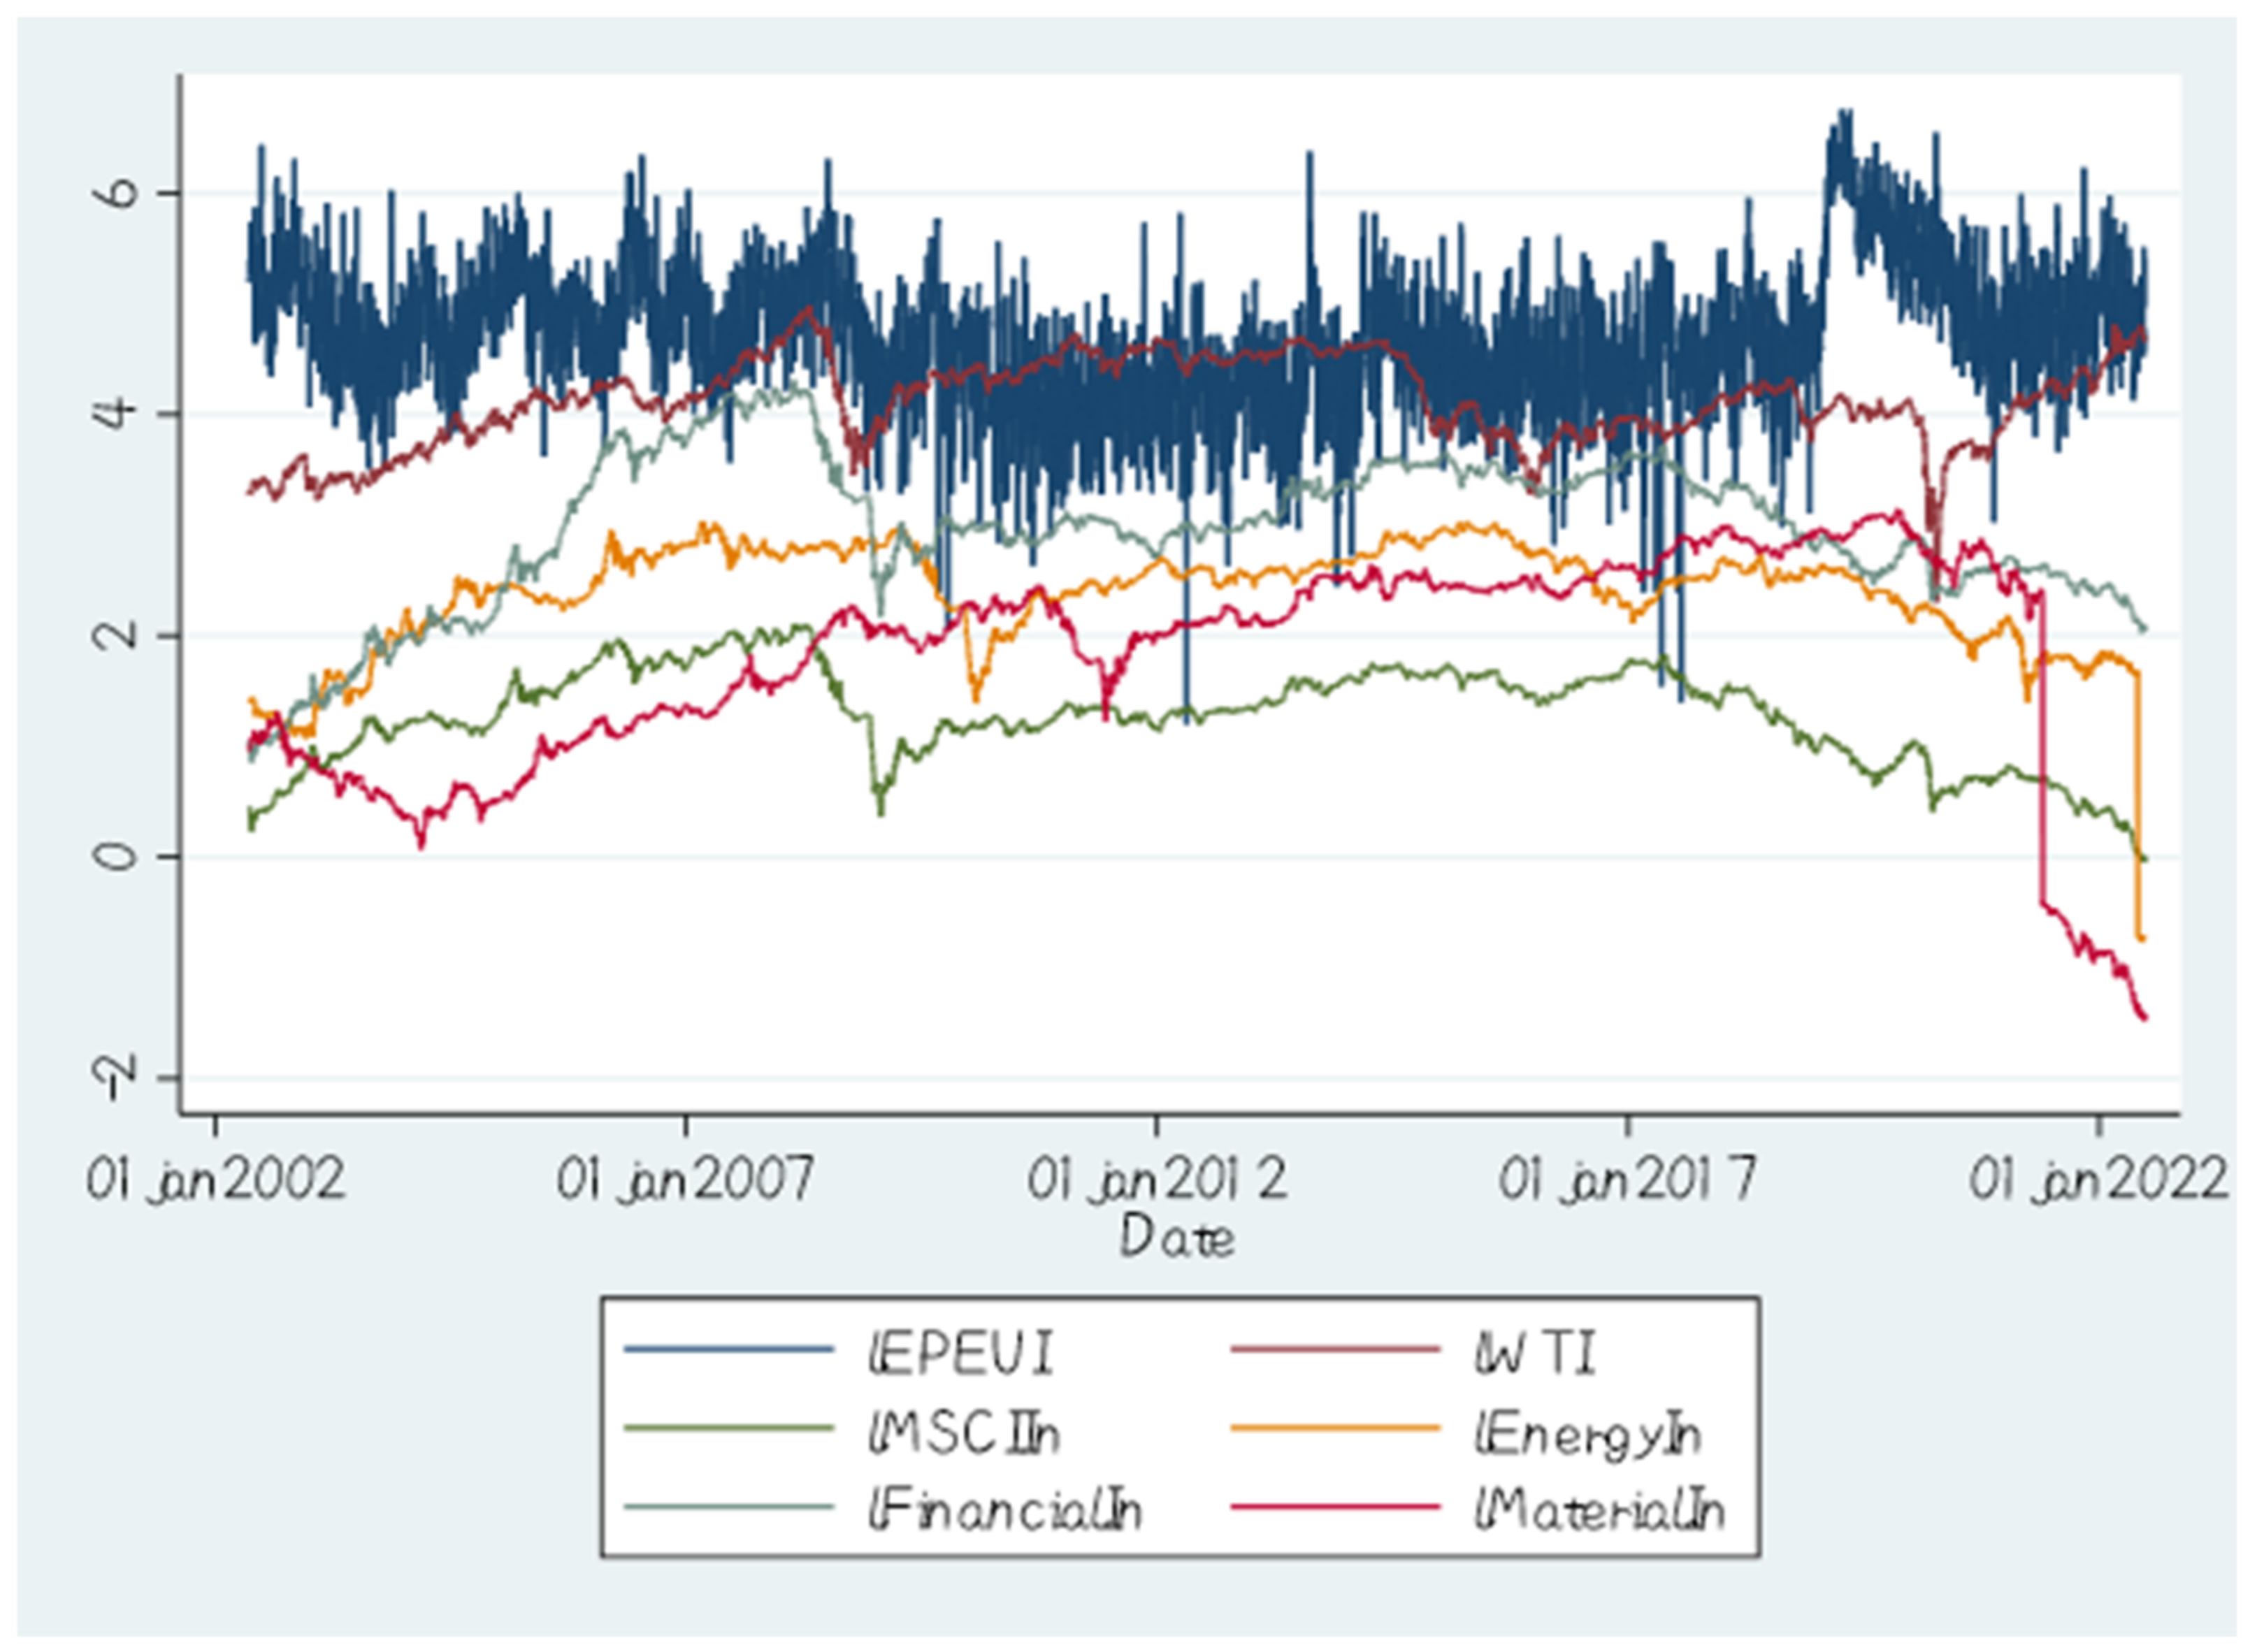
4. Data and Preliminary Statistics

To examine overall volatility spillover and connectedness among global factors and significant sector-level indices of Pakistan, the current study employs the global crude oil WTI (West Texas Intermediate) index, European economic policy uncertainty composite index (EPEUI), Morgan Stanley capital international index which comprises all securities including ESG and Climate of 23 countries, and significant industry-specific indices (i.e., energy, financial, and material) indices of Pakistan. Daily closing prices of indices over 20 years, from 2002 to 2022, have been used to estimate the QVAR results. The data have been collected from multiple databases. Figure 1 depicts the time-series plots of return of selected indices; the spikes in the graph reflect the same pattern as prices during 2002 and 2022 due to financial stress caused by black swan events [67,68,69]. In this study, sector-level returns are estimated by log differences in the daily indexes of prices. As seen in the given image, commodity price dynamics follow a highly parallel pattern throughout the sectors, demonstrating a great degree of co-movement in important industries. Figure 2 depicts the fluctuations of global and sector-level return indexes across the sectors over the study period. During the sample period, Pakistan’s significant sectors saw multiple dramatic fluctuations. Most indexes declined precipitously from July 2008, reaching their historical low in January 2009. Following the global financial crisis, the commodity market began to recover and rise until 2011. The pattern of price fluctuation can also be witnessed during the recent COVID-19 pandemic, then start declining again following the climate change policy effects from 2021 and onwards.
Through Table 1, the summary statistics of global indices returns and the returns of significant sector-level indices of Pakistan over the study period are covered. The Elliot–Rothenberg–Stock [70] test was applied to check the stationarity in time series data for unit root testing. The outcome demonstrates that the data of the return series is stationary at a 1% significance level. The JB is the Jarque–Bera [71] is used to check the normality of data; results are significant at a 1% level. Mean returns are positive for indices. The MSCI index, energy, and material sector indices seem riskier than others.

5. Findings and Discussion

The overall dynamic connectedness is demonstrated in Figure 3, which reveals that total dynamic connectedness among indices is higher along the dark and concentrated areas of the figure. Connectedness is quite strong for significant sector-level indices, and changes in global factors show favorable changes below the 20% quantile and negative ones beyond the quantile of 40%. It can be interpreted as there is a symmetric effect in these extremes. Moreover, 50% of the quantile contributes towards the overall average connectivity during this period. It assumes significant particular intervals, i.e., before 2008 and near the end of the dataset. Because connectivity is extremely dependent on events, this suggests a fairly cyclical pattern of closeness across time. These results justify our H4 where there is a connectivity among variables.

5.1. The Net Total Directional Connectedness

The net total directional connectedness among global and local indices is presented in Figure 4. The direction of spikes below zero on these graphs indicates that the indices are net shock receivers, while the above zero values reflect the indices that are net transmitters of the shocks in a network. In results for European economic policy uncertainty show the cyclical pattern that means EPEUI, amid the financial crisis period from 2008 to 2010 and around 2020, is the “net receiver” of the volatility shocks. It shows, in general, EPEUI effects negatively during financial turmoil. The results are consistent with previous studies [41,55,72]. However, the WTI Crude oil index shifted from “net-receiver” during 2008, 2014, and 2019 to “net-transmitter” after 2019 and near end tail over the sample period. However, the MSCI index reflects the stable pattern throughout the sample period as the “net- receiver” of the shocks. In addition, the material sector reflects mixed results and is loosely connected in a network with other indices. The energy sector is shifting from a “net receiver” from 2007 to 2011 to a “net transmitter” in 2012, 2013, and the end tail of the period. It shows that the nature of the energy sector is relatively event dependent. Additionally, the financial sector indices are persistently “net-transmitter” of the volatility shocks in a network throughout the sample period.

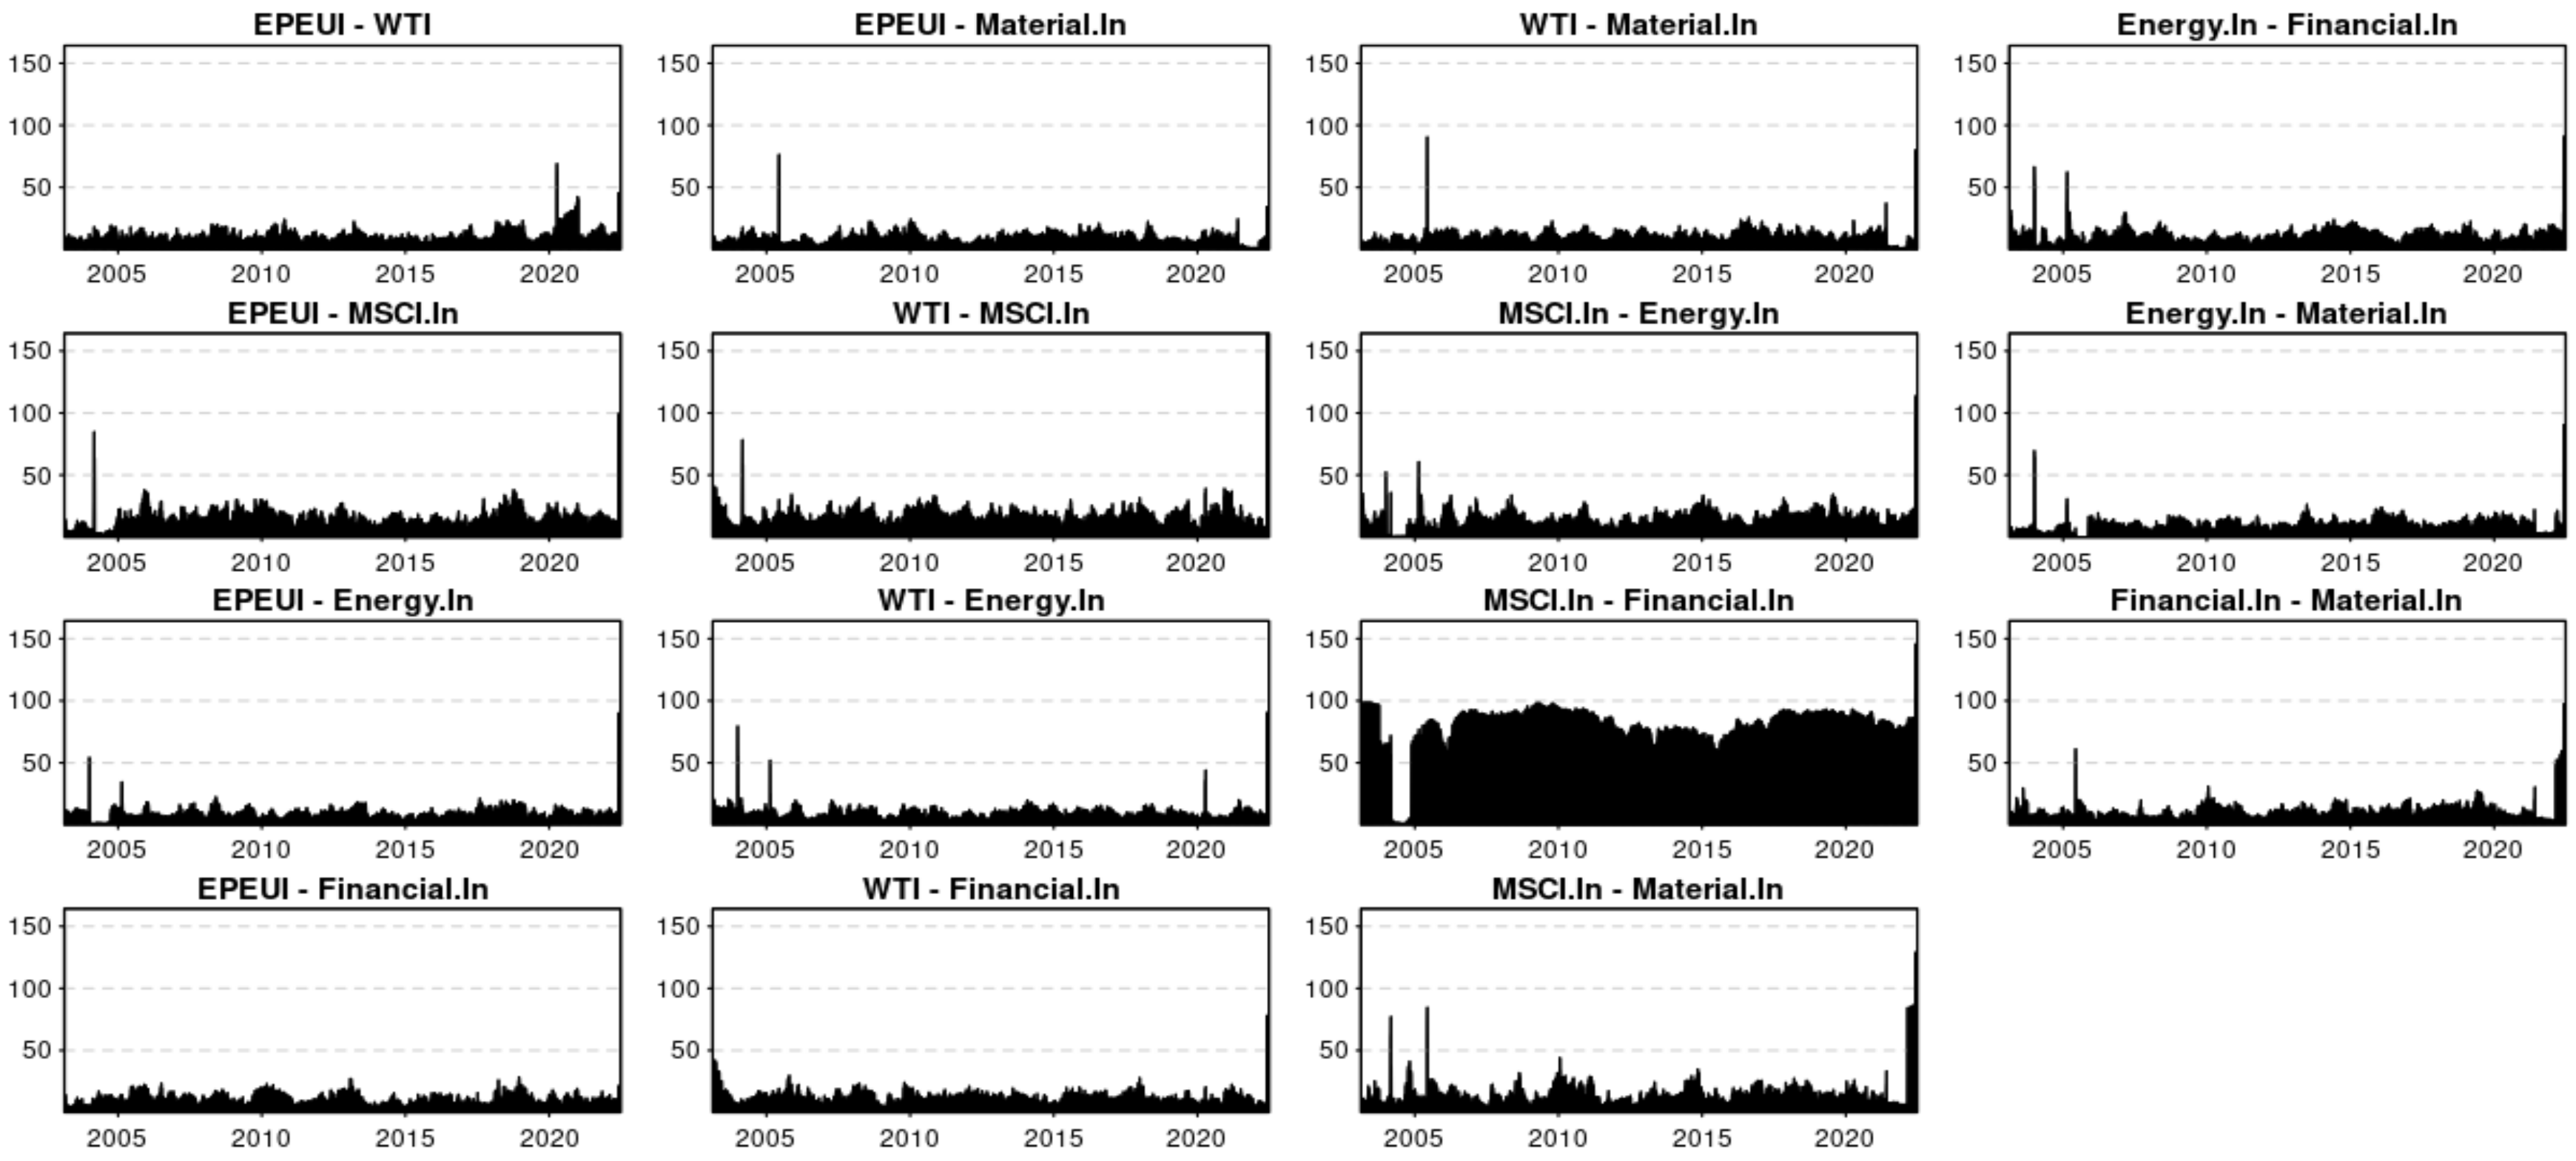
5.2. Dynamic Pairwise Directional Connectedness

Figure 5 presents the dynamic pairwise connectedness of selected indices of Pakistan with global factors. The research investigated pairwise directional connection to investigate more precise influences of indices and connectedness towards each other in a network. The graphical demonstration revealed that EPEUI is the net receiver in a network and is closely connected to the MSCIIn, WTI, and financial sector indices. However, MSCIIn is closely connected with the financial and energy sectors in a network and shows a close connection with material beyond the year 2020 at the end of the tail. The energy sector is a net transmitter among local indices, whereas shifting its role to a net receiver among global indices takes the most spillover transmission from MSCIIn and EPEUI.

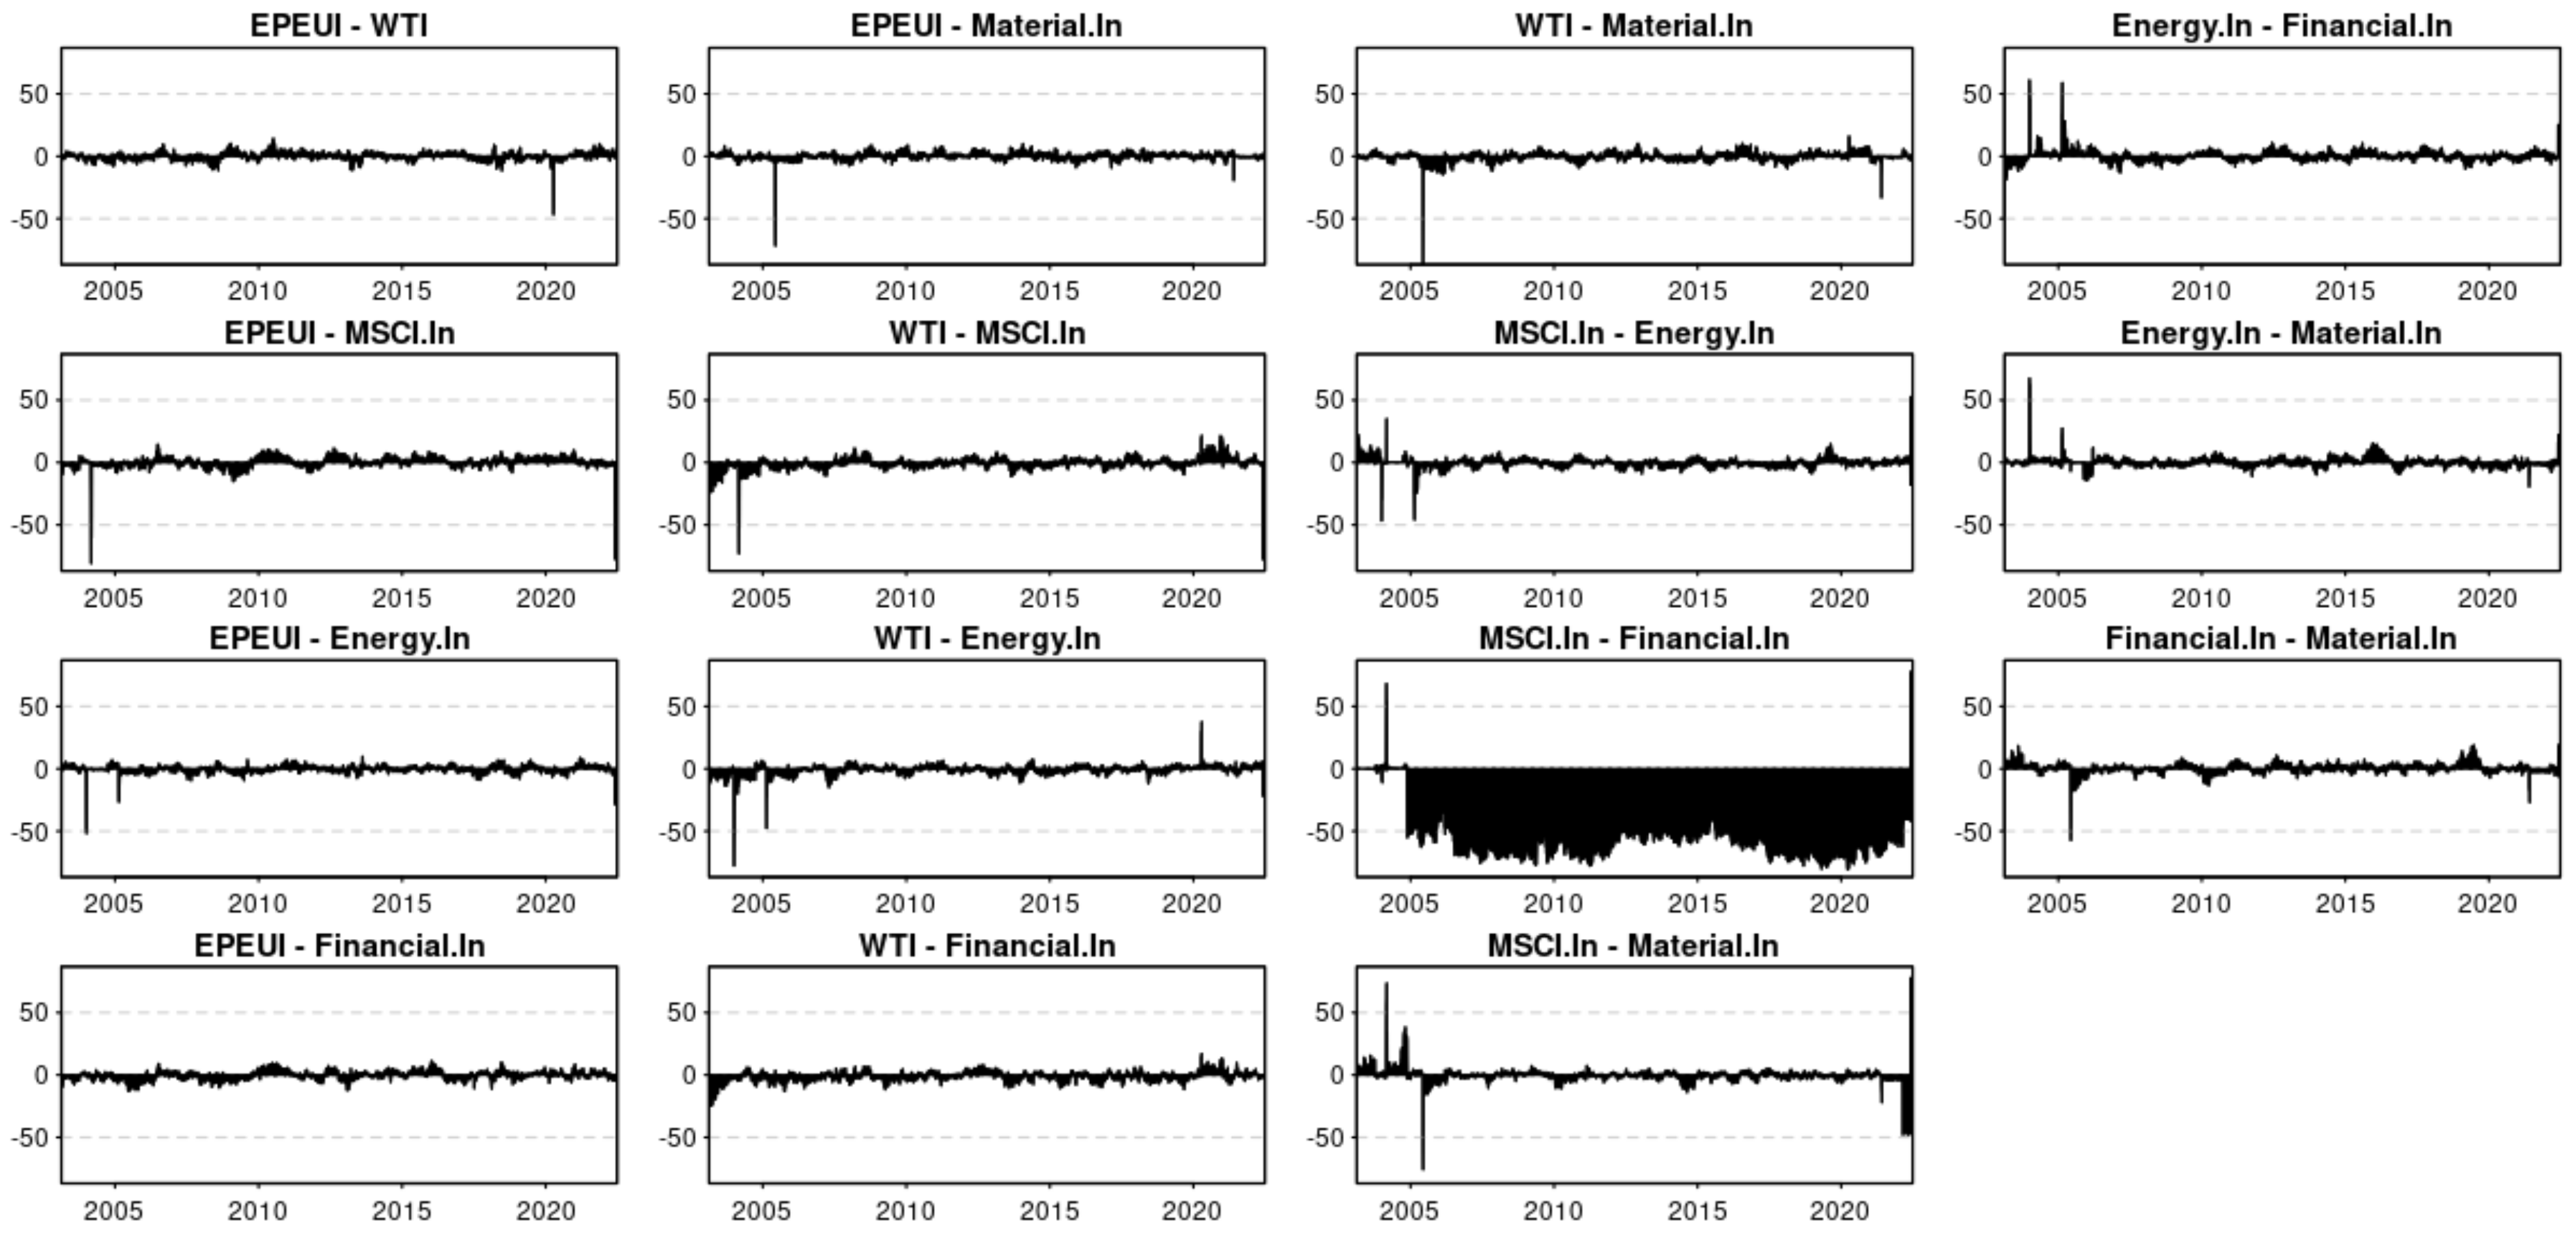
5.3. Net Pairwise Directional Connectedness

In Figure 6, beyond 2007, MSCIIn continues to be the net receiver of spillover from the financial sector, obtaining the close influence of financial upheavals. The energy sector still reflects its shifting role from net receiver to net transmitter. This cyclical pattern reflects that a network’s spillover transmission and connectedness are highly event dependent. Also, it revealed strong pairwise connectedness among global and local indices.

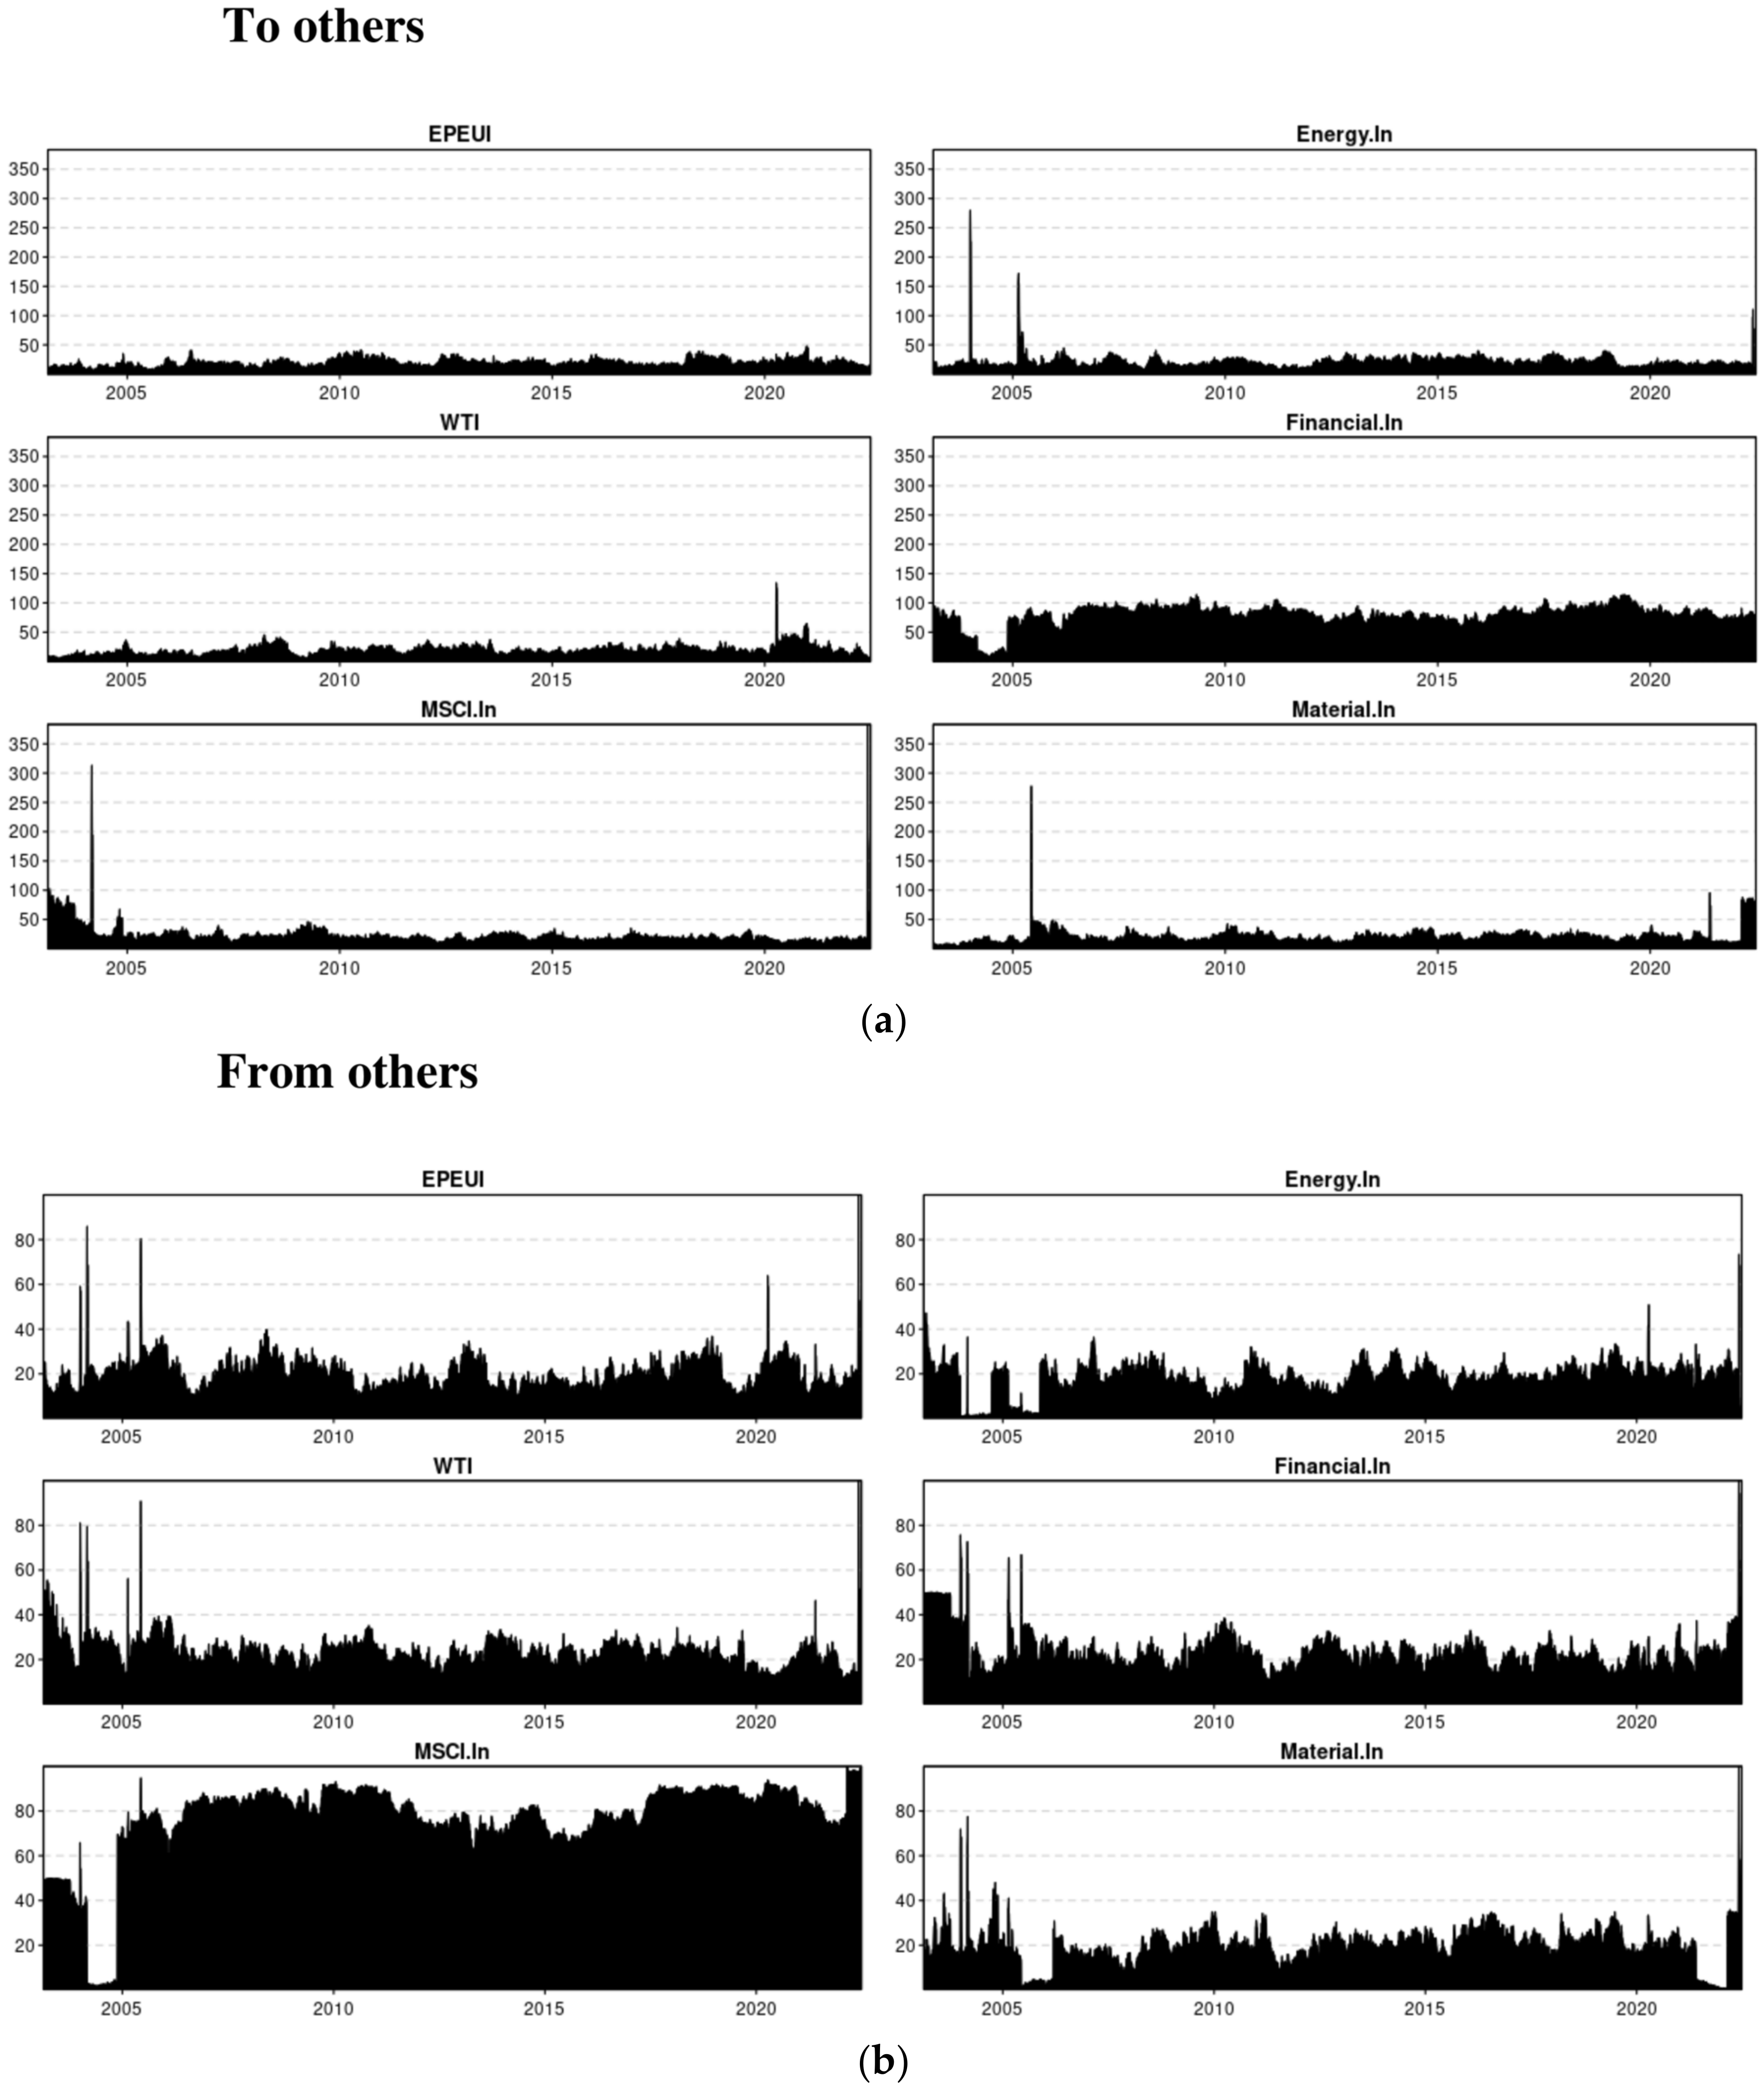
5.4. Dynamic Spillover “To Others” and “From Others”

The phrase “FROM others” denotes the overall connectivity each system sector has obtained from the other sectors. On the other hand, “TO others” denotes the overall connection that is conveyed from each sector to the whole system. In Figure 7a, findings revealed that the financial sector is transmitting more spillover shocks in a network throughout the study period. However, energy, MSCIIn, and WTI moderately transmit the spillover risk to others in a system, the results justify Hypothesis 1 and 2 in terms of pairwise connected and risk spillover among these global and sector-level indices. MSCIin shows a stable pattern after 2005. However, the energy sector’s influence has shown a mixed pattern and untimely raised the influence on others after 2020. Figure 7b MSCIIn revealed that around 80% of net receivers obtain spillover shocks from a system. It shows pairwise interconnectivity and justifies Hypothesis 2, whereas the energy sector and EPEUI indices were revealed as a moderate net receiver in a system as spikes reached around 40%. The results justify Hypotheses 3 and 4 and are consistent with previous studies [11,13,73].

5.5. Results of Static Quantile Connectedness

The GVED generalized variance error decomposition of the 10-day forward variance forecast horizon based on the VAR-(1)-model revealed results of the connectedness index. Using the quantile-frequency connectedness application, we analyzed the static, normal, and severe connectivity between industry-specific and global factor markets. We assign quantiles of 0.10, 0.50, and 0.90 to the extreme downside, normal, and severe upside connectedness effects of sector level and global markets, respectively. The selection of these extreme quantiles is predicated on producing diverse outcomes. Thus, the tail connectedness measures are estimated at the extreme lower (Q = 0.10, Q = 0.50) and upper (Q = 0.90) quantiles and placed to differentiate between severe positive and negative shocks.
In Table 2, the value total connectedness (TCI) is 69.46%, reflecting around 70% of volatility spillover connectedness among the global and sector-level indices in a network. The higher value of TCI shows a higher level of connectedness. The results of lower quantile, i.e., at q = 0.10 net spillover connectedness, show that EPEUI, WTI, and MSCI are the “net receivers” in a network. At the same time, significant sector-level indices are found to be the “net transmitters” of the volatility spillover. The Inc-Own row connectedness with its own variance, and as per the result, financial sectors remain the highly volatile sector.
The results of Table 3 with the medium quantile, i.e., q = 0.50, indicate total connectedness equal to 29.38%. It captures the volatility spillover connection among the indexes over the sample period, approximately one-third. The results of net-spillover connectedness revealed the same outcome as the results of quantile 0.05. MSCIin is a net receiver, and the financial sector is a net transmitter of spillover shocks.
The results of Table 4 with the upper quantile, i.e., q = 0.90, indicate a total connectedness equal to 67.92%. It shows around 68% volatility spillover connectedness among the indices throughout the study period. The findings of net-spillover connectedness show similar effects as MSCIIn is the net receiver, and the financial sector continues to be the net transmitter of spillover shocks in a system. The “inc-own” row shows the highest volatility of the financial sector with its variance. The results are consistent with previous research [71,72,73,74,75].

6. Conclusions

The current study investigated the quantile connectedness in a network and pairs among the global WTI crude oil index, MSCI index, EPEUI, and significant sector-level indices of Pakistan over a 20-year period. The results revealed a high degree of connectedness among global factors and significant sectors of Pakistan. Net directional connectedness results indicate that EPEUI, WTI, and MSCI indices are the net receivers of volatility spillover, while energy, financial, and material sectors are net transmitters of shocks. Total dynamic Connectedness among indices is event-dependent, showing stronger connectedness for significant sector-level indices and changes in global factors below the 20% quantile and above the 80% quantile. During periods of financial turmoil, volatility spillover connectedness is high.

6.1. Practical Implications

From a practical stance, the study provides important insights and policy recommendations. First, governments and policymakers must accommodate volatility transmission and risk contagion characteristics among the mentioned sectors to facilitate policy implementation to promote overall market stability. Due to their dominance in the commodity market, it is vital to emphasize the underlying effect of energy commodities in particular. Second, examining significant sector connectedness with global factors is critical when making business decisions. This could include corporate activities like hedging, altering alternative production plans, etc. Finally, when combining assets into portfolios, financial investors must examine the time variation in the interrelationships among global and sector-level indices to optimize portfolio strategies or establish hedging techniques.
As per the findings, material sectors proved to be more stable for investment as they have the least connection regarding network risk spillover.

6.2. Limitations and Future Research

The domain of this study is limited to the economic and geographical spheres of economies like Pakistan; for developed countries, the results might be different. Also, the study examined the impact on selected sector-level indices that seemed more relevant in terms of their dependency structure in the case of Pakistan. In the future, with the inclusion of other financial sectors or asset classes like Bitcoin, more techniques that can accommodate higher frequency data, like wavelet techniques, can be employed.

Author Contributions

S.B.Z. contributes conceptualization, original draft, review & editing, visualization; A.K. writes the original draft, review & editing, theoretical framework and methodology, visualization; S.K. writes the conceptualization, original draft, review & editing, data curation, methodology software; M.Z.R. original draft, review & editing, theoretical framework; W.B.A. original draft, review & editing, supervision; A.A.N. review & editing. All authors have read and agreed to the published version of the manuscript.

Funding

This research was funded by Researchers Supporting Project number (RSP2023R332), King Saud University, Riyadh, Saudi Arabia.

Data Availability Statement

Not applicable.

Conflicts of Interest

The authors declare no conflict of interest.

References

  1. Masson, P. Contagion: Macroeconomic models with multiple equilibria. J. Int. Money Finance 1999, 18, 587–602. [Google Scholar] [CrossRef]
  2. Forbes, K.J.; Rigobon, R. No contagion, only interdependence: Measuring stock market co-movements. J. Finance 2002, 57, 2223–2261. [Google Scholar] [CrossRef]
  3. Keohane, R.O.; Nye, J.S. Power and Interdependence. Survival 1973, 15, 158–165. [Google Scholar] [CrossRef]
  4. Solomon, R.; Gault, A. The Interdependence of Nations: An Agenda for Research; National Science Foundation (U.S.), Directorate of Applied Science and Research Applications, Brookings Institution: Alexandria, VA, USA, 1977; Available online: https://books.google.com.pk/books?id=S6lAAAAAIAAJ (accessed on 13 July 2023).
  5. Ahmed, W. On the higher-order moment interdependence of stock and commodity markets: A wavelet coherence analysis. Q. Rev. Econ. Finance 2022, 83, 135–151. [Google Scholar] [CrossRef]
  6. Kaminsky, G.L.; Reinhart, C.M. On crises, contagion, and confusion. J. Int. Econ. 2000, 51, 145–168. [Google Scholar] [CrossRef]
  7. Pindyck, R.S.; Rotemberg, J.J. The Excess Co-Movement of Commodity Prices. Econ. J. 1990, 100, 1173–1189. [Google Scholar] [CrossRef]
  8. Alquist, R.; Bhattarai, S.; Coibion, O. Commodity-price co-movement and global economic activity. J. Monet. Econ. 2020, 112, 41–56. [Google Scholar] [CrossRef]
  9. Ji, Q.; Bouri, E.; Roubaud, D.; Shahzad, S.J.H. Risk spillover between energy and agricultural commodity markets: A dependence-switching CoVaR-copula model. Energy Econ. 2018, 75, 14–27. [Google Scholar] [CrossRef]
  10. Zhang, R.; Zhang, H.; Gao, W.; Li, T.; Yang, S. The Dynamic Effects of Oil Price Shocks on Exchange Rates—From a Time-Varying Perspective. Sustainability 2022, 14, 8452. [Google Scholar] [CrossRef]
  11. Zhu, X.; Liao, J.; Chen, Y. Time-varying effects of oil price shocks and economic policy uncertainty on the nonferrous metals industry: From the perspective of industrial security. Energy Econ. 2021, 97, 105192. [Google Scholar] [CrossRef]
  12. Hajar, A. Motivated by visions: A tale of a rural learner of English. Lang. Learn. J. 2018, 46, 415–429. [Google Scholar] [CrossRef]
  13. Saeed, T.; Bouri, E.; Alsulami, H. Extreme return connectedness and its determinants between clean/green and dirty energy investments. Energy Econ. 2021, 96, 105017. [Google Scholar] [CrossRef]
  14. Tabash, M.I.; Babar, Z.; Sheikh, U.A.; Khan, A.A.; Anagreh, S. The linkage between oil price, stock market indices, and exchange rate before, during, and after COVID-19: Empirical insights of Pakistan. Cogent Econ. Finance 2022, 10, 2129366. [Google Scholar] [CrossRef]
  15. Sheikh, U.A.; Asad, M.; Ahmed, Z.; Mukhtar, U. Asymmetrical relationship between oil prices, gold prices, exchange rate, and stock prices during global financial crisis 2008: Evidence from Pakistan. Cogent Econ. Finance 2020, 8, 1757802. [Google Scholar] [CrossRef]
  16. PIMCO. Understanding Investing: Tail Risk. 2017. Available online: https://www.pimco.com/en-us/resources/education/understanding-tail-risk/ (accessed on 11 July 2023).
  17. Hussain, H.; Faridi, M.Z.; Hussain, S. Changing Oil Prices, Exchange Rates and its Impact on Inflation in Pakistan. J. Account. Finance Emerg. Econ. 2022, 8, 113–122. [Google Scholar] [CrossRef]
  18. Kolaczkowski, M. Why Do Oil Prices Matter to the Global Economy? An Expert Explains. World Economic Forum. 2022. Available online: https://www.weforum.org/agenda/2022/02/why-oil-prices-matter-to-global-economy-expert-explains/ (accessed on 12 July 2023).
  19. Taylor, J.S.; Spriggs, J. Effects of the Monetary Macro-Economy on Canadian Agricultural Prices. Can. J. Econ. 1989, 22, 278. [Google Scholar] [CrossRef]
  20. French, J.J.; Li, W.X. Economic policy uncertainty and fund flow to the United States. Finance Res. Lett. 2022, 45, 102126. [Google Scholar] [CrossRef]
  21. Cepni, O.; Colak, M.S.; Hacıhasanoglu, Y.S.; Yılmaz, M.H. Capital flows under global uncertainties: Evidence from Turkey. Borsa Istanb. Rev. 2021, 21, 175–185. [Google Scholar] [CrossRef]
  22. Chiang, T.C. Economic policy uncertainty, risk and stock returns: Evidence from G7 stock markets. Finance Res. Lett. 2019, 29, 41–49. [Google Scholar] [CrossRef]
  23. Luo, Y.; Zhang, C. Economic policy uncertainty and stock price crash risk. Res. Int. Bus. Finance 2020, 51, 101112. [Google Scholar] [CrossRef]
  24. Demir, E.; Gozgor, G.; Lau, C.K.M.; Vigne, S.A. Does economic policy uncertainty predict the Bitcoin returns? An empirical investigation. Finance Res. Lett. 2018, 26, 145–149. [Google Scholar] [CrossRef]
  25. Nilavongse, R.; Salah, G. Economic policy uncertainty shocks, economic activity, and exchange rate adjustments. Econ. Lett. 2020, 186, 108765. [Google Scholar] [CrossRef]
  26. Canh, N.P.; Binh, N.T.; Thanh, S.D. Determinants of foreign direct investment in flows: The role of economic policy uncertainty. Int. Econ. 2020, 161, 159–172. [Google Scholar] [CrossRef]
  27. Zhu, H.; Meng, L.; Ge, Y.; Hau, L. Dependent relationships between Chinese commodity markets and the international financial market: Evidence from quantile time-frequency analysis. N. Am. J. Econ. Finance 2020, 54, 101256. [Google Scholar] [CrossRef]
  28. Aslam, F.; Hunjra, A.I.; Bouri, E.; Mughal, K.S.; Khan, M. Dependence structure across equity sectors: Evidence from vine copulas. Borsa Istanb. Rev. 2023, 23, 184–202. [Google Scholar] [CrossRef]
  29. Borges, A.M. Applied general equilibrium models: An assessment of their usefulness for policy analysis. OECD Econ. Stud. 1988, 7, 15. [Google Scholar]
  30. Khan, N.; Saleem, A.; Ozkan, O. Do geopolitical oil price risk influence stock market returns and volatility of Pakistan: Evidence from novel non-parametric quantile causality approach. Resour. Policy 2023, 81, 103355. [Google Scholar] [CrossRef]
  31. Atil, A.; Nawaz, K.; Lahiani, A.; Roubaud, D. Are natural resources a blessing or a curse for financial development in Pakistan? The importance of oil prices, economic growth and economic globalization. Resour. Policy 2020, 67, 101683. [Google Scholar] [CrossRef]
  32. Ai, C.; Chatrath, A.; Song, F. On the Co-Movement of Commodity Prices. Am. J. Agric. Econ. 2006, 88, 574–588. [Google Scholar] [CrossRef]
  33. Byrne, J.P.; Sakemoto, R.; Xu, B. Commodity price co-movement: Heterogeneity and the time-varying impact of fundamentals. Eur. Rev. Agric. Econ. 2019, 47, 499–528. [Google Scholar] [CrossRef]
  34. Adhikari, R.; Putnam, K.J. Co-movement in the commodity futures markets: An analysis of the energy, grains, and livestock sectors. J. Commod. Mark. 2020, 18, 100090. [Google Scholar] [CrossRef]
  35. Chen, H.; Xu, C.; Peng, Y. Time-frequency connectedness between energy and nonenergy commodity markets during COVID-19: Evidence from China. Resour. Policy 2022, 78, 102874. [Google Scholar] [CrossRef] [PubMed]
  36. Stuermer, M. Industrialization and the demand for mineral commodities. J. Int. Money Finance 2017, 76, 16–27. [Google Scholar] [CrossRef]
  37. Hameed, Z.; Shafi, K.; Nadeem, A. Volatility spillover effect between oil prices and foreign exchange markets. Energy Strategy Rev. 2021, 38, 100712. [Google Scholar] [CrossRef]
  38. Yang, L.; Zhu, Y.; Wang, Y.; Wang, Y. Multifractal detrended cross-correlations between crude oil market and Chinese ten sector stock markets. Phys. Stat. Mech. Its Appl. 2016, 462, 255–265. [Google Scholar] [CrossRef]
  39. Ji, Q.; Liu, B.-Y.; Nehler, H.; Uddin, G.S. Uncertainties and extreme risk spillover in the energy markets: A time-varying copula-based CoVaR approach. Energy Econ. 2018, 76, 115–126. [Google Scholar] [CrossRef]
  40. Caporale, G.M.; Ali, F.M.; Spagnolo, N. Oil price uncertainty and sectoral stock returns in China: A time-varying approach. China Econ. Rev. 2015, 34, 311–321. [Google Scholar] [CrossRef]
  41. Marfatia, H.; Zhao, W.L.; Ji, Q. Uncovering the global network of economic policy uncertainty. Res. Int. Bus. Finance 2020, 53, 101223. [Google Scholar] [CrossRef]
  42. Istrefi, K.; Piloiu, A. Economic Policy Uncertainty and Inflation Expectations; Working papers 511; Banque de France: Paris, France, 2014; p. 43. [Google Scholar]
  43. Baker, S.R.; Bloom, N.; Davis, S.J. Measuring Economic Policy Uncertainty. Q. J. Econ. 2016, 131, 1593–1636. [Google Scholar] [CrossRef]
  44. Brogaard, J.; Detzel, A. The asset-pricing implications of government economic policy uncertainty. Manag. Sci. 2015, 61, 3–18. [Google Scholar] [CrossRef]
  45. Pástor, Ľ.; Veronesi, P. Political uncertainty and risk premia. J. Financ. Econ. 2013, 110, 520–545. [Google Scholar] [CrossRef]
  46. Joëts, M.; Mignon, V.; Razafindrabe, T. Does the volatility of commodity prices reflect macroeconomic uncertainty? Energy Econ. 2017, 68, 313–326. [Google Scholar] [CrossRef]
  47. Bakas, D.; Triantafyllou, A. Volatility forecasting in commodity markets using macro uncertainty. Energy Econ. 2019, 81, 79–94. [Google Scholar] [CrossRef]
  48. Van Robays, I. Macroeconomic Uncertainty and Oil Price Volatility. Oxf. Bull. Econ. Stat. 2016, 78, 671–693. [Google Scholar] [CrossRef]
  49. Albulescu, C.T.; Demirer, R.; Raheem, I.D.; Tiwari, A.K. Does the U.S. economic policy uncertainty connect financial markets? Evidence from oil and commodity currencies. Energy Econ. 2019, 83, 375–388. [Google Scholar] [CrossRef]
  50. Yin, L.; Han, L. Macroeconomic uncertainty: Does it matter for commodity prices? Appl. Econ. Lett. 2014, 21, 711–716. [Google Scholar] [CrossRef]
  51. Malik, F.; Umar, Z. Dynamic connectedness of oil price shocks and exchange rates. Energy Econ. 2019, 84, 104501. [Google Scholar] [CrossRef]
  52. Xu, Y.; Han, L.; Wan, L.; Yin, L. Dynamic link between oil prices and exchange rates: A non-linear approach. Energy Econ. 2019, 84, 104488. [Google Scholar] [CrossRef]
  53. Beckmann, J.; Czudaj, R.L.; Arora, V. The relationship between oil prices and exchange rates: Revisiting theory and evidence. Energy Econ. 2020, 88, 104772. [Google Scholar] [CrossRef]
  54. Mumtaz, H.; Theodoridis, K. Common and country specific economic uncertainty. J. Int. Econ. 2017, 105, 205–216. [Google Scholar] [CrossRef]
  55. Gu, X.; Cheng, X.; Zhu, Z.; Deng, X. Economic policy uncertainty and China’s growth-at-risk. Econ. Anal. Policy 2021, 70, 452–467. [Google Scholar] [CrossRef]
  56. Hernandez, J.A.; Kang, S.H.; Jiang, Z.; Yoon, S.M. Spillover Network among Economic Sentiment and Economic Policy Uncertainty in Europe. Systems 2022, 10, 93. [Google Scholar] [CrossRef]
  57. Jiang, Y.; Wu, L.; Tian, G.; Nie, H. Do cryptocurrencies hedge against EPU and the equity market volatility during COVID-19?–New evidence from quantile coherency analysis. J. Int. Financ. Mark. Inst. Money 2021, 72, 101324. [Google Scholar] [CrossRef]
  58. Choi, S.Y. Industry volatility and economic uncertainty due to the COVID-19 pandemic: Evidence from wavelet coherence analysis. Finance Res. Lett. 2020, 37, 101783. [Google Scholar] [CrossRef] [PubMed]
  59. Jiang, Y.; He, L.; Meng, J.; Nie, H. Non-linear impact of economic policy uncertainty shocks on credit scale: Evidence from China. Phys. Stat. Mech. Its Appl. 2019, 521, 626–634. [Google Scholar] [CrossRef]
  60. Bahloul, W.; Balcilar, M.; Cunado, J.; Gupta, R. The role of economic and financial uncertainties in predicting commodity futures returns and volatility: Evidence from a nonparametric causality-in-quantiles test. J. Multinatl. Financ. Manag. 2018, 45, 52–71. [Google Scholar] [CrossRef]
  61. Bakas, D.; Triantafyllou, A. The impact of uncertainty shocks on the volatility of commodity prices. J. Int. Money Finance 2018, 87, 96–111. [Google Scholar] [CrossRef]
  62. Ma, R.; Zhou, C.; Cai, H.; Deng, C. The forecasting power of EPU for crude oil return volatility. Energy Rep. 2019, 5, 866–873. [Google Scholar] [CrossRef]
  63. Ando, T.; Greenwood-Nimmo, M.; Shin, Y. Quantile Connectedness: Modelling Tail Behaviour in the Topology of Financial Networks. 2018. Available online: https://papers.ssrn.com/sol3/papers.cfm?abstract_id=3164772 (accessed on 10 July 2023).
  64. Koop, G.; Pesaran, M.H.; Potter, S.M. Impulse response analysis in non-linear multivariate models. J. Econom. 1996, 74, 119–147. [Google Scholar] [CrossRef]
  65. Pesaran, H.H.; Shin, Y. Generalized impulse response analysis in linear multivariate models. Econ. Lett. 1998, 58, 17–29. [Google Scholar] [CrossRef]
  66. Chatziantoniou, I.; Gabauer, D. EMU risk-synchronisation and financial fragility through the prism of dynamic connectedness. Q. Rev. Econ. Finance 2021, 79, 1–14. [Google Scholar] [CrossRef]
  67. Ripple, W.J.; Wolf, C.; Newsome, T.M.; Gregg, J.W.; Lenton, T.M.; Palomo, I.; Eikelboom, J.A.J.; Law, B.E.; Huq, S.; Duffy, P.B.; et al. World scientists’ warning of a climate emergency 2021. BioScience 2021, 71, 894–898. [Google Scholar] [CrossRef]
  68. World Economic Forum. Tackling the Climate Crisis with Innovative Green Technologies. United Nations Climate Change Conference COP27. 2022. Available online: https://www.weforum.org/impact/first-movers-coalition-is-tackling-the-climate-crisis/ (accessed on 4 May 2023).
  69. Rehman, M.Z.; Khan, S.; Khan, U.A.; Alonazi, W.B.; Noman, A.A. How Do Global Uncertainties Spillovers Affect Leading Renewable Energy Indices? Evidence from the Network Connectedness Approach. Sustainability 2023, 15, 13630. [Google Scholar] [CrossRef]
  70. Elliott, G.; Rothenberg, T.J.; Stock, J.H. Efficient Tests for an Autoregressive Unit Root; National Bureau of Economic Research: Cambridge, MA, USA, 1996. [Google Scholar]
  71. Jarque, C.M.; Bera, A.K. Efficient tests for normality, homoscedasticity and serial independence of regression residuals. Econ. Lett. 1980, 6, 255–259. [Google Scholar] [CrossRef]
  72. Zhu, H.; Chen, Y.; Ren, Y.; Xing, Z.; Hau, L. Time-frequency causality and dependence structure between crude oil, EPU and Chinese industry stock: Evidence from multiscale quantile perspectives. N. Am. J. Econ. Finance 2022, 61, 101698. [Google Scholar] [CrossRef]
  73. Das, D.; Kannadhasan, M. The asymmetric oil price and policy uncertainty shock exposure of emerging market sectoral equity returns: A quantile regression approach. Int. Rev. Econ. Finance 2020, 69, 563–581. [Google Scholar] [CrossRef]
  74. Cedic, S.; Mahmoud, A.; Manera, M.; Salah, G. Uncertainty and Stock Returns in Energy Markets: A Quantile Regression Approach. Fond. Eni Enrico Mattei FEEM 1999. [Google Scholar] [CrossRef]
  75. Si, D.K.; Zhao, B.; Li, X.L.; Ding, H. Policy uncertainty and sectoral stock market volatility in China. Econ. Anal. Policy 2021, 69, 557–573. [Google Scholar] [CrossRef]
Figure 1. Time series plots of selected indices of Pakistan with global factors from 2002 to 2022.
Mathematics 11 04177 g001
Figure 2. Illustrates the time evolution of the return series plots of selected indices of Pakistan with global factors from 2002 to 2022.
Mathematics 11 04177 g002
Figure 3. Illustrates total dynamic connectedness of selected indices of Pakistan with global factors from 2002 to 2022 based on a 200-day rolling-window QVAR (1) and 10-variant-ahead forecast. The x-axis denotes the timeline and the y-axis shows the quantiles.
Mathematics 11 04177 g003
Figure 4. Illustrates net total directional connectedness of selected indices of Pakistan with global factors from 2002 to 2022.
Mathematics 11 04177 g004
Figure 5. Illustrates dynamic pairwise connectedness of selected indices of Pakistan with global factors from 2002 to 2022.
Mathematics 11 04177 g005
Figure 6. Illustrates net pairwise directional connectedness of selected indices of Pakistan with global factors from 2002 to 2022.
Mathematics 11 04177 g006
Figure 7. (a) Illustrates connectedness “To” other sectors in a system from 2002 to 2022. (b) Illustrates connectedness “To” and “From” other sectors in a system from 2002 to 2022.
Mathematics 11 04177 g007
Table 1. Descriptive statistics of stock return of selected sector-level indices of Pakistan with global factors.
VariableObsMeanStd. dev.MinMax
EPEUI5000130.556991.537043.32861.1
WTI500066.4762724.35423−37.63145.29
MSCI.ln50003.9272331.54775108.21742
Energy.ln500011.83624.275205020.88646
Financial.ln500023.4997414.23758074.5574
Material.ln50008.6561455.658858023.20922
Table 2. Quantile connectedness (q at = 0.10).
EPEUIWTIMSCI.InEnergy.InFinancial.InMaterial.InFROM
EPEUI31.1314.2113.4513.3614.113.7468.87
WTI13.8632.4613.1613.1614.0113.3467.54
MSCI.In13.8212.7820.612.5227.1713.179.4
Energy.In13.3713.1113.4333.3213.5713.2166.68
Financial.In14.2213.3714.4813.0131.313.6268.7
Material.In13.5612.7312.5113.3113.4434.4365.57
TO68.8366.267.0465.3782.3167.01416.76
Inc.Own99.9698.6687.6498.69113.61101.44cTCI/TCI
NET−0.04−1.34−12.36−1.3113.611.4483.35/69.46
NPT312234
Table 3. Quantile connectedness at (q = 0.50).
EPEUIWTIMSCI.InEnergy.InFinancial.InMaterial.InFROM
EPEUI 4.273.643.654.293.4119.24
WTI 77.754.594.115.174.2522.25
MSCI.In3.823.7324.323.7660.014.3775.68
Energy.In3.292.953.5282.34.193.7517.7
Financial.In80.763.86.554.3477.523.9922.48
Material.In4.143.723.353.914.4281.0918.91
TO18.5718.4621.6419.7678.0619.77176.26
Inc.Own99.3296.2145.96102.06155.58100.87cTCI/TCI
NET−0.68−3.79−54.042.0655.580.8735.25/29.38
NPT211542
Table 4. Quantile connectedness at (q = 0.90).
EPEUIWTIMSCI.InEnergy.InFinancial.InMaterial.InFROM
EPEUI35.4413.0912.5913.0112.8113.0564.56
WTI12.7133.213.1113.8314.1213.0466.8
MSCI.In11.813.821.5512.5427.213.1278.45
Energy.In12.1113.1212.8835.713.6512.5464.3
Financial.In12.0314.2415.2513.5631.413.5268.6
Material.In12.3113.0712.9512.8413.6335.264.8
TO60.9567.3166.7965.7981.465.27407.52
Inc.Own96.4100.588.34101.48112.8100.47cTCI/TCI
NET−3.60.51−11.661.4812.80.4781.50/67.92
NPT042342
Disclaimer/Publisher’s Note: The statements, opinions and data contained in all publications are solely those of the individual author(s) and contributor(s) and not of MDPI and/or the editor(s). MDPI and/or the editor(s) disclaim responsibility for any injury to people or property resulting from any ideas, methods, instructions or products referred to in the content.

