1. Introduction
Resilience in engineered systems corresponds to the ability to withstand disruptive events, avoiding an interruption in operations. Otherwise, if the interruption occurs, the resilient system recovers as quickly as possible [
1]. To deploy the full resilience in a system, two main characteristics have to be considered: the systems’ taxonomy and all the resources assigned to the system in order to assure the operational continuity. This is where the maintenance function and the management of physical assets become relevant. It is through the definition of appropriate maintenance strategies and the allocation of resources (human and technical) that the required levels of operational continuity can be reached [
2,
3]. More recently, some authors have linked the correct selection of maintenance strategies to improved levels of resilience at the system level [
4]. However, despite the fact that several authors have made efforts to measure resilience levels and link them to maintenance strategies [
5,
6], it is still difficult to correctly quantify and build awareness about the impacts that adjustments in maintenance strategies and system topologies can have on system resilience.
Regarding the quantification of the system’s resilience, some definitions are needed, among them: the best method to measure it and how to deal with important levels of uncertainty [
7]. The relative importance of resilience correlates and their values are uncertain, mainly in complex engineering systems and with a great number of components distributed according to different topologies. Those relationships can be modelled using linguistic expressions and using the fuzzy set theory [
8]. Such theory constitutes a support to the subjective or natural language descriptors of systems’ characteristics and provides a methodology to allow for resilience modeling and the assessment process [
9].
From that, this work proposes a model based on a fuzzy logic model to measure and/or express the resilience derived from different systems topologies and with different maintenance strategies intending to make the system a more robust and reliable one.
The remainder of this paper is divided into four sections:
Section 2 contains the theoretical background,
Section 3 proposes the proposed methodology,
Section 4 shows a case study of the application of the proposed methodology. Additionally, in
Section 5, a sensitivity analysis and the discussion of the results is provided. Finally, conclusions, limitations and further research avenues are discussed in
Section 6.
2. Theoretical Background
Production systems are designed to operate and deliver their outputs in an efficient and sustainable manner. To achieve that, the existing equipment within the system must offer guarantees of operational continuity and should be ready to deal with the risks in a most effective mode. There is no doubt that threats (disruptive events) to operational continuity will exist continuously. The organisation’s efforts must be directed at avoiding these disruptive events and, if they do occur, dealing with them in the most appropriate way possible.
The maintenance function deploys its efforts to keep equipment available and avoid disruptive events. Reliability reflects the probability that a piece of equipment will remain operational for a certain period of time. The classical parameter representing the reliability of a given physical asset is the Mean Time Between Failure (MTBF). On the other hand, maintainability reflects the probability of repairing a given piece of equipment in a certain amount of time. This parameter is usually represented by the Mean Time To Repair (MTTR). Both parameters together constitute an indicator of Availability (A) according to Equation (1):
The term resilience was coined by Holling [
10]. In ecology, the term represents the ability of a living being or biological system to recover from threats or disruptive events. The imperative for resilient systems is aligned with the goal of achieving high performance and long-term sustainability of organizations and systems [
11]. In addition, investing in resilience is also critical in regards to climate matters. According to [
12], with an additional marginal cost (around 3%), our assets can be protected against a changing climate. Infrastructure resilience constitutes another critical aspect. Mainly, we consider that investing in more resilient infrastructure in low- and middle- income countries would return USD 4 in benefits for each USD 1 invested [
13]. A resilient system is one that is capable of providing a predefined level of service or functionality, even in the presence of disruptive events. From the physical asset management (PAM) point of view, structures and strategies must be established to provide for and enhance the resilience of physical assets [
14]. Therefore, system resilience depends on the systems structure (topology), and on the resources allocated to maintain and manage the physical assets.
A suitable resilience metric should consider properties related to the system’s functionality in time. In addition, it is desirable that a useful measure of resilience must show simplicity of implementation and computation. Both quantitative and qualitative metrics can be found in the literature. Linkov [
15] summarises a number of metrics for resilience. Some works addresses specific metrics in specific industry sectors. For instance, Sun et al. [
16] presented a literature review on resilience metrics for transportation infrastructure. Infrastructure resilience was researched by Mottahedi et al. [
17]. More recently, Yang et al. [
5] presented a quantitative metric that allows for measuring the influence of reliability parameters on the resilience of an equipment. According to that work, failure rate is the parameter that constitutes the most important correlation with the equipment’s resilience.
The loss or reduction of the functionality of a physical asset or system is not a binary situation, but a gradual one [
18]. If we represent such a reduction in functionality as the distance from a certain minimum value, or as an acceptable range within which the system must or can function, this level must be previously defined [
19]. Similarly, some authors stress that the degree of recovery does not imply a perfect or total restoration of the system’s functionality, but rather that the system has returned to a level or state where it can be considered satisfactorily functional [
20]. Therefore, resilience must consider that the functionality of the system must be compared to certain levels or ranges of acceptance values. Cholda [
20] proposes a metric called “quality of resilience”, which summarises, in a single term, the frequency and extent of the disruptive event and its impact in functionality.
There is no universally accepted single quantitative model for the assessment of systems’ resilience. A variety of metrics has been proposed to measure and evaluate resilience [
21]. Some resilience assessment models have been reported regarding different systems. For instance, organisational resilience [
22], supply chain resilience [
23] and others.
Cai et al. [
6] proposed a model to compute the resilience based on systems’s availability. Consider one shock or disruptive event that affect the system functionality.
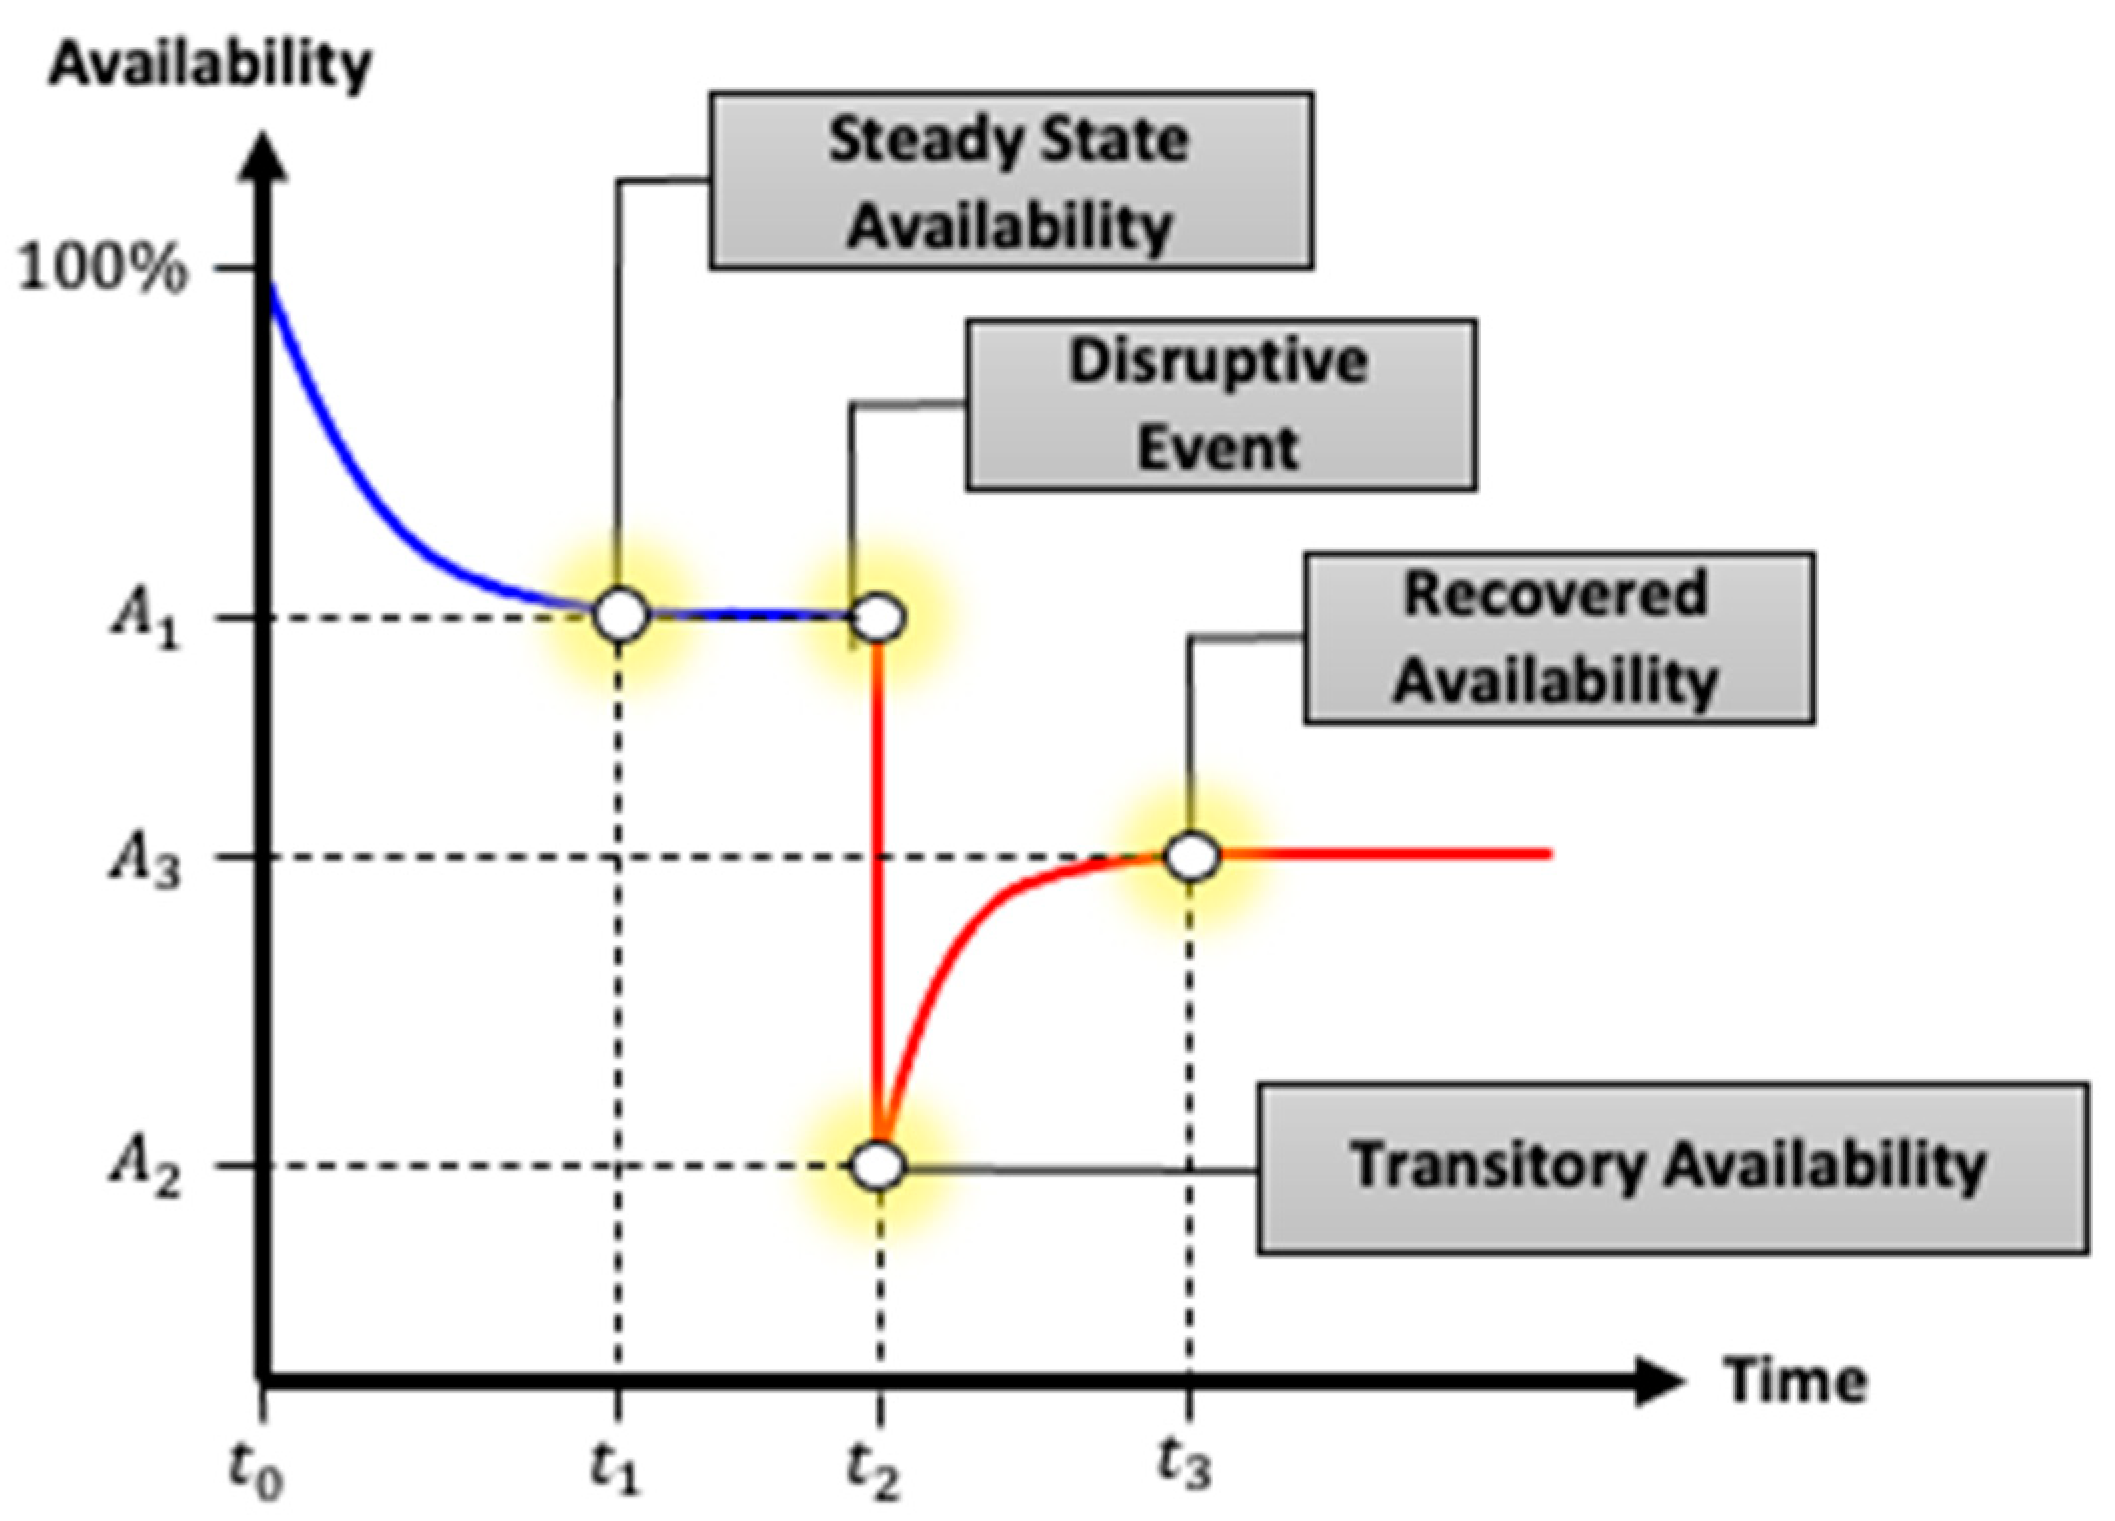
Figure 1 deploys the behavior along time of the system’s availability in the presence of one disruptive event.
In such figure, A
1 represents the availability of the system in a steady state. For model purposes, we have considered that this steady state goes from instant t
0, to instant t
1. Then, at t
2, a sudden decrease in the system’s availability occurs. The availability of the system drops to the value A
2. Then the system starts its recovery by reaching a new state or availability value A
3 (at t
3). Considering a given time frame, there may be a number “n” of availability losses. Also, A
i2 and A
i3 represent the values of availabilities for each of the n shocks (1 ≤ i ≤ n). Considering a given time frame, there may be a number “n” of availability losses. Also, A
i2 and A
i3 represent the values of availabilities for each of the n shocks (1 ≤ i ≤ n) and A
1 represents the availability of the system in a steady state. The Equation (2) shows the Cai’s model to compute the system’s resilience based on the system availability over time.
Thus, regarding the system’s availability and considering that every loss of functionality at the system level (overall impact) is caused by one or more availability losses at the equipment level (local causes), the assessment of such impact is needed. In addition, it is also relevant to recognize that the degree in which those local functionality losses impact the overall system’s functionality depend on the topological structure of the system. Various models link the availabilities of each piece of equipment to the availability of the system taking into consideration its topology.
Table 1 shows some of the equations that associate availability to the most common equipment configurations [
24]. In this equation,
μi corresponds to the repairing rate and
λi represents the failure rate of each piece of equipment
i.
Frequently, handling resilience factors and their values constitutes a challenging task. Mainly, this is down to such factors and values are uncertain and/or imprecise. Some authors [
25,
26] have pointed that the uncertain values and decisions rules are much better defined and processed by linguistic expressions than by precise (crisp) numbers. This situation leads to the possibility of modelling such terms and values using fuzzy terms [
27,
28]. Fuzzy set theory supports subjective and natural language descriptors in a wide field of areas. Using such approach, the uncertainties can be described by a set of predefined linguistic expressions. This allows dealing with subjective expressions and handling expert judgment in a readily and simplified manner. Since there is great diversity of resilience conceptions and the utilization of imprecise information, there is also great potential to describe the systemic resilience through the use of linguistic expressions [
8,
29,
30].
In the literature, there is a number of works devoted to dealing with the resilience concept using linguistic expressions, with experts’ judgment based on fuzzy logic. Mottahedi et al. [
17] address the application of expert judgement as a basis of the resilience estimation. In this work, resilience is defined a concept which is disaggregated into several levels of abstraction. Each level considers a set of other factors named as generic and influencing ones. The resilience in communities is addressed by [
31]. The proposed structure is based on two parameters: the repair time and the consequences of the failure. The main advantage of this work is intrinsically simple and comprehensive. COVID-19 has been a very relevant research topic in the last two years. From the point of view of a resilience assessment using fuzzy logic, Said et al. [
32] propose a framework where the goal is to calculate a resilience score for a process in the context of COVID-19. The main characteristic of this proposal is that the model’s outcome corresponds to a term expressed as one of five predefined echelons. Zarei et al. [
33] presented a paper where a framework for resilience assessment that uses a fuzzy-based multicriteria decision-making process. This MCDM lies on a fuzzy based Analitic hierarchy process (AHP) and VIKOR techniques. Again, as the precedent references, this approach lies on the experts’ judgments.
Perhaps the work that comes closest to our suggested approach is that presented by Bukowski et al. [
4]. They use fuzzy logic to give support to maintenance decisions including the concept of resilience. The analysis takes into account the maintenance support potential to estimate a resilience level in organizations. However, as the previously mentioned papers, this work lies on expert opinions to model the maintenance support potential and obtain the resilience estimation.
From what we have extracted from the literature so far, there is no research that is consistently capable of defining a value or expression for resilience based on objective data. All the works found are based on linguistic terms or expert judgement.
Our work is intended to develop a fuzzy-based resilience assessment model considering highly engineered systems. The main focus of this paper is the selection or assessment of maintenance strategies based on the resilience concept. Moreover, the proposed model is capable of dealing with uncertainty through the integration of the fuzzy approach using a set of decisions or evaluation rules to derive a fuzzy value of the resilience in a system. In the next section, we describe the proposed methodology.
3. Proposed Methodology
The main principle that rules this work is the following: the functionality of a system, from the point of view of the physical asset management and maintenance, is the availability of each piece of equipment and at the system level. Therefore, and considering that each availability loss (system level) is a consequence of the impact of an individual or combination (at equipment level) of disruptive events, the system’s resilience is determined by the characteristics of the system itself, the maintenance strategies and the corresponding resources assigned to them.
This paper proposes a system based on decision rules to evaluate the resilience of a system. The input of this system consists of a vector of two elements. These elements correspond to:
The average value of system availability drops over a given period of time.
The average value of the time required for the availability restoration to a value equal to or greater than the value of the pre-shock availability.
Then, these values are forwarded into a fuzzy rule system that is responsible for processing the logic and delivering a system resilience value. In the next lines, we provide further methodological details of the proposal.
3.1. Preparing Input Values
The input values of the fuzzy system are obtained from a time series containing values of the system availability. This time series reflects the variations over time of this parameter and takes into account the topology of the system and the effect of a series of disruptive events at the equipment level. The aforementioned time series can contain:
For modeling and RAM analysis of the system, reliability block diagrams (RBD) are used. The reliability block diagrams [
38] represent a system through a collection of blocks according to different connections or logics (series, parallel, stand-by, etc.). Such diagrams are capable of incorporating the behaviour of the equipment’s reliability and maintainability through the Mean Time Between Failures (MTBF) and Mean Time To Repair (MTTR) values of each piece of equipment [
24]. Therefore, from those diagrams it is possible to derive the availability of an entire system [
18,
24].
On the other hand, and as a way to measure the impact on system resilience of changing maintenance strategies on a particular piece of equipment or system topology, Monte Carlo simulation experiments are performed. Monte Carlo simulation experiments are used to solve reliability, maintainability and availability estimation problems [
39]. This is usually applied when the systems have a high complexity that make it very difficult to solve analytically. With the increase in computational speeds and memory size of computers, Monte Carlo methods have become more widely used and accepted by maintenance researchers. Some applications in reliability and maintenance analysis can be found in [
40,
41].
Figure 2 shows the diagram depicting the proposed methodology.
From these experiments, several scenarios can be analysed, obtaining for each of them a time series with the system availability values. Considering those generated time series, they may present n shocks or disruptive events, with each one including two terms which represent two characteristic magnitudes: the loss or drop in functionality and the duration of the recovery time, Li and Ti, respectively. From these n tuples, the average values of each parameter corresponding to the series of data analysed are obtained: . These two parameters correspond to crisp numbers, which in order to evaluate the resilience condition of the system, must be transformed into linguistic concepts.
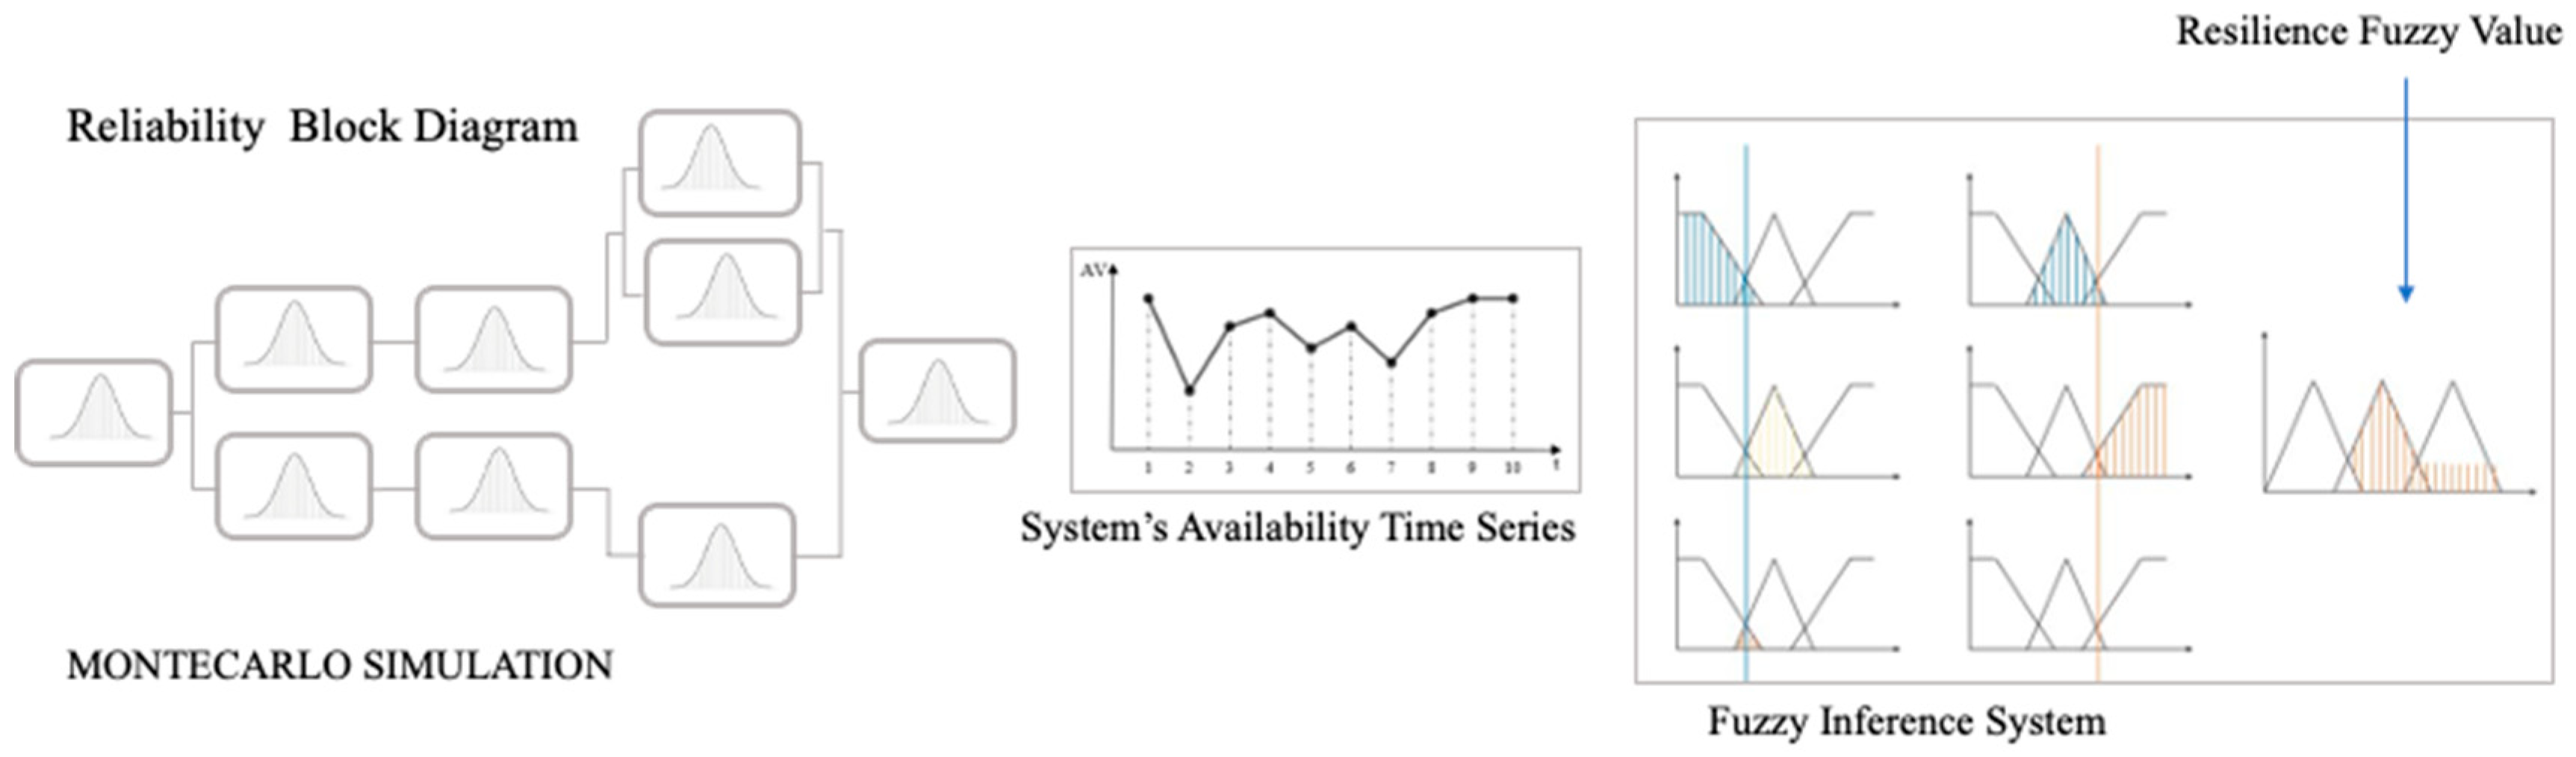
As it was mentioned earlier,
constitute the inputs for the fuzzy system that allows for the assessment of the resilience of the system. In summary, information flows from the system representation, using reliability block diagram, to a set of fuzzy rules to extract the resilience concept (literal and numeric representation), as shown in
Figure 3.
3.2. The Fuzzy Inference System
A fuzzy inference system (FIS) was defined and where the Mamdani approach was adopted [
42]. Such a model involves three main components or phases: fuzzification, inference and defuzzification. Therefore, the tuplet of crisp numbers of the input parameters (
are transformed into a fuzzy set (T* and q*, respectively). In the same way, the output variable and resilience (R*) also correspond to a fuzzy variable.
In order to fuzzify those values, and with the aim to test different configuration of the fuzzy-based system, several alternative strategies and fuzzy systems structures were implemented, tested and compared. The best two systems are presented in this paper. The difference between these two strategies essentially lies in the number of terms or fuzzy variables that explain the two input variables and the output variable. That is, two alternative sets of rules were generated that consider 3 and 5 terms for each variable. In the case of the rules that deals with three fuzzy linguistic terms,
Table 2,
Table 3 and
Table 4 show the intervals and the respective membership functions:
Since the objective is to translate the input variables into a measure of resilience (a fuzzy measure by itself), and this transformation is defined on the basis of a set of inference rules, the rules adopted in this study to relate the inputs and output are shown in
Table 5.
In the case of the rules that deals with five fuzzy linguistic terms,
Table 6,
Table 7 and
Table 8 show the intervals and the respective membership functions. The rules adopted to relate the inputs and output, considering five linguistic terms in the case of each variable, are shown in
Table 9.
The rules adopted in this study to relate the inputs and output considering variables represented by five linguistic terms each are shown in
Table 9.
To establish a point of comparison with the results produced by both fuzzy systems, resilience values were calculated for each series using the Cai et al. model [
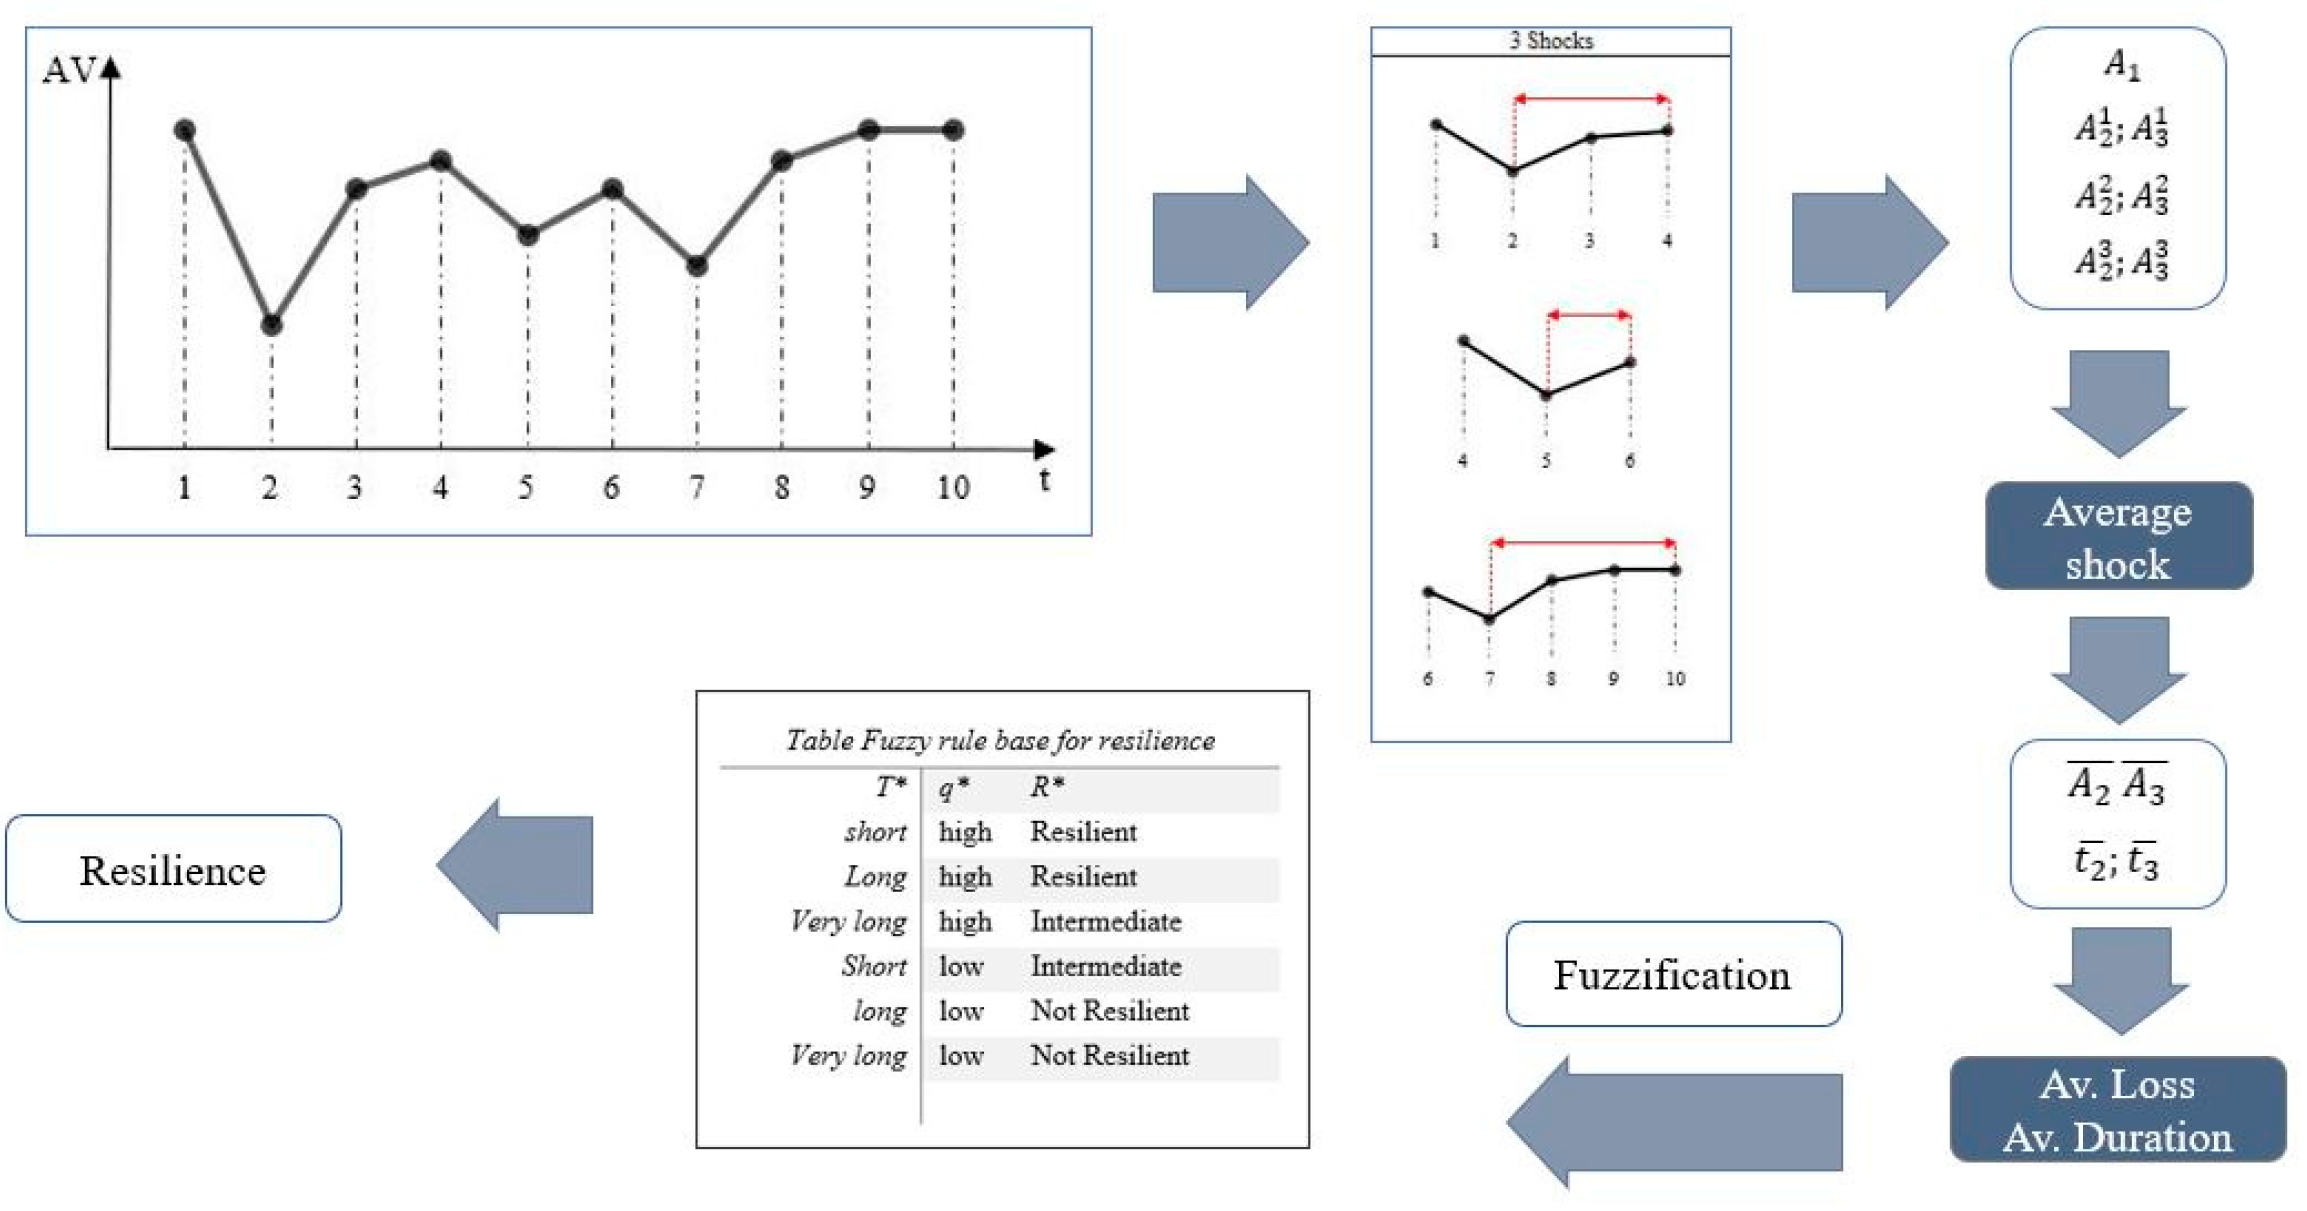
6]. This procedure was implemented using MATLAB code. This code initially reads the availability data set from the RAM analysis. Then, the program automatically detects the disruptive events in the series and identifies the representative values of each of them, as shown in
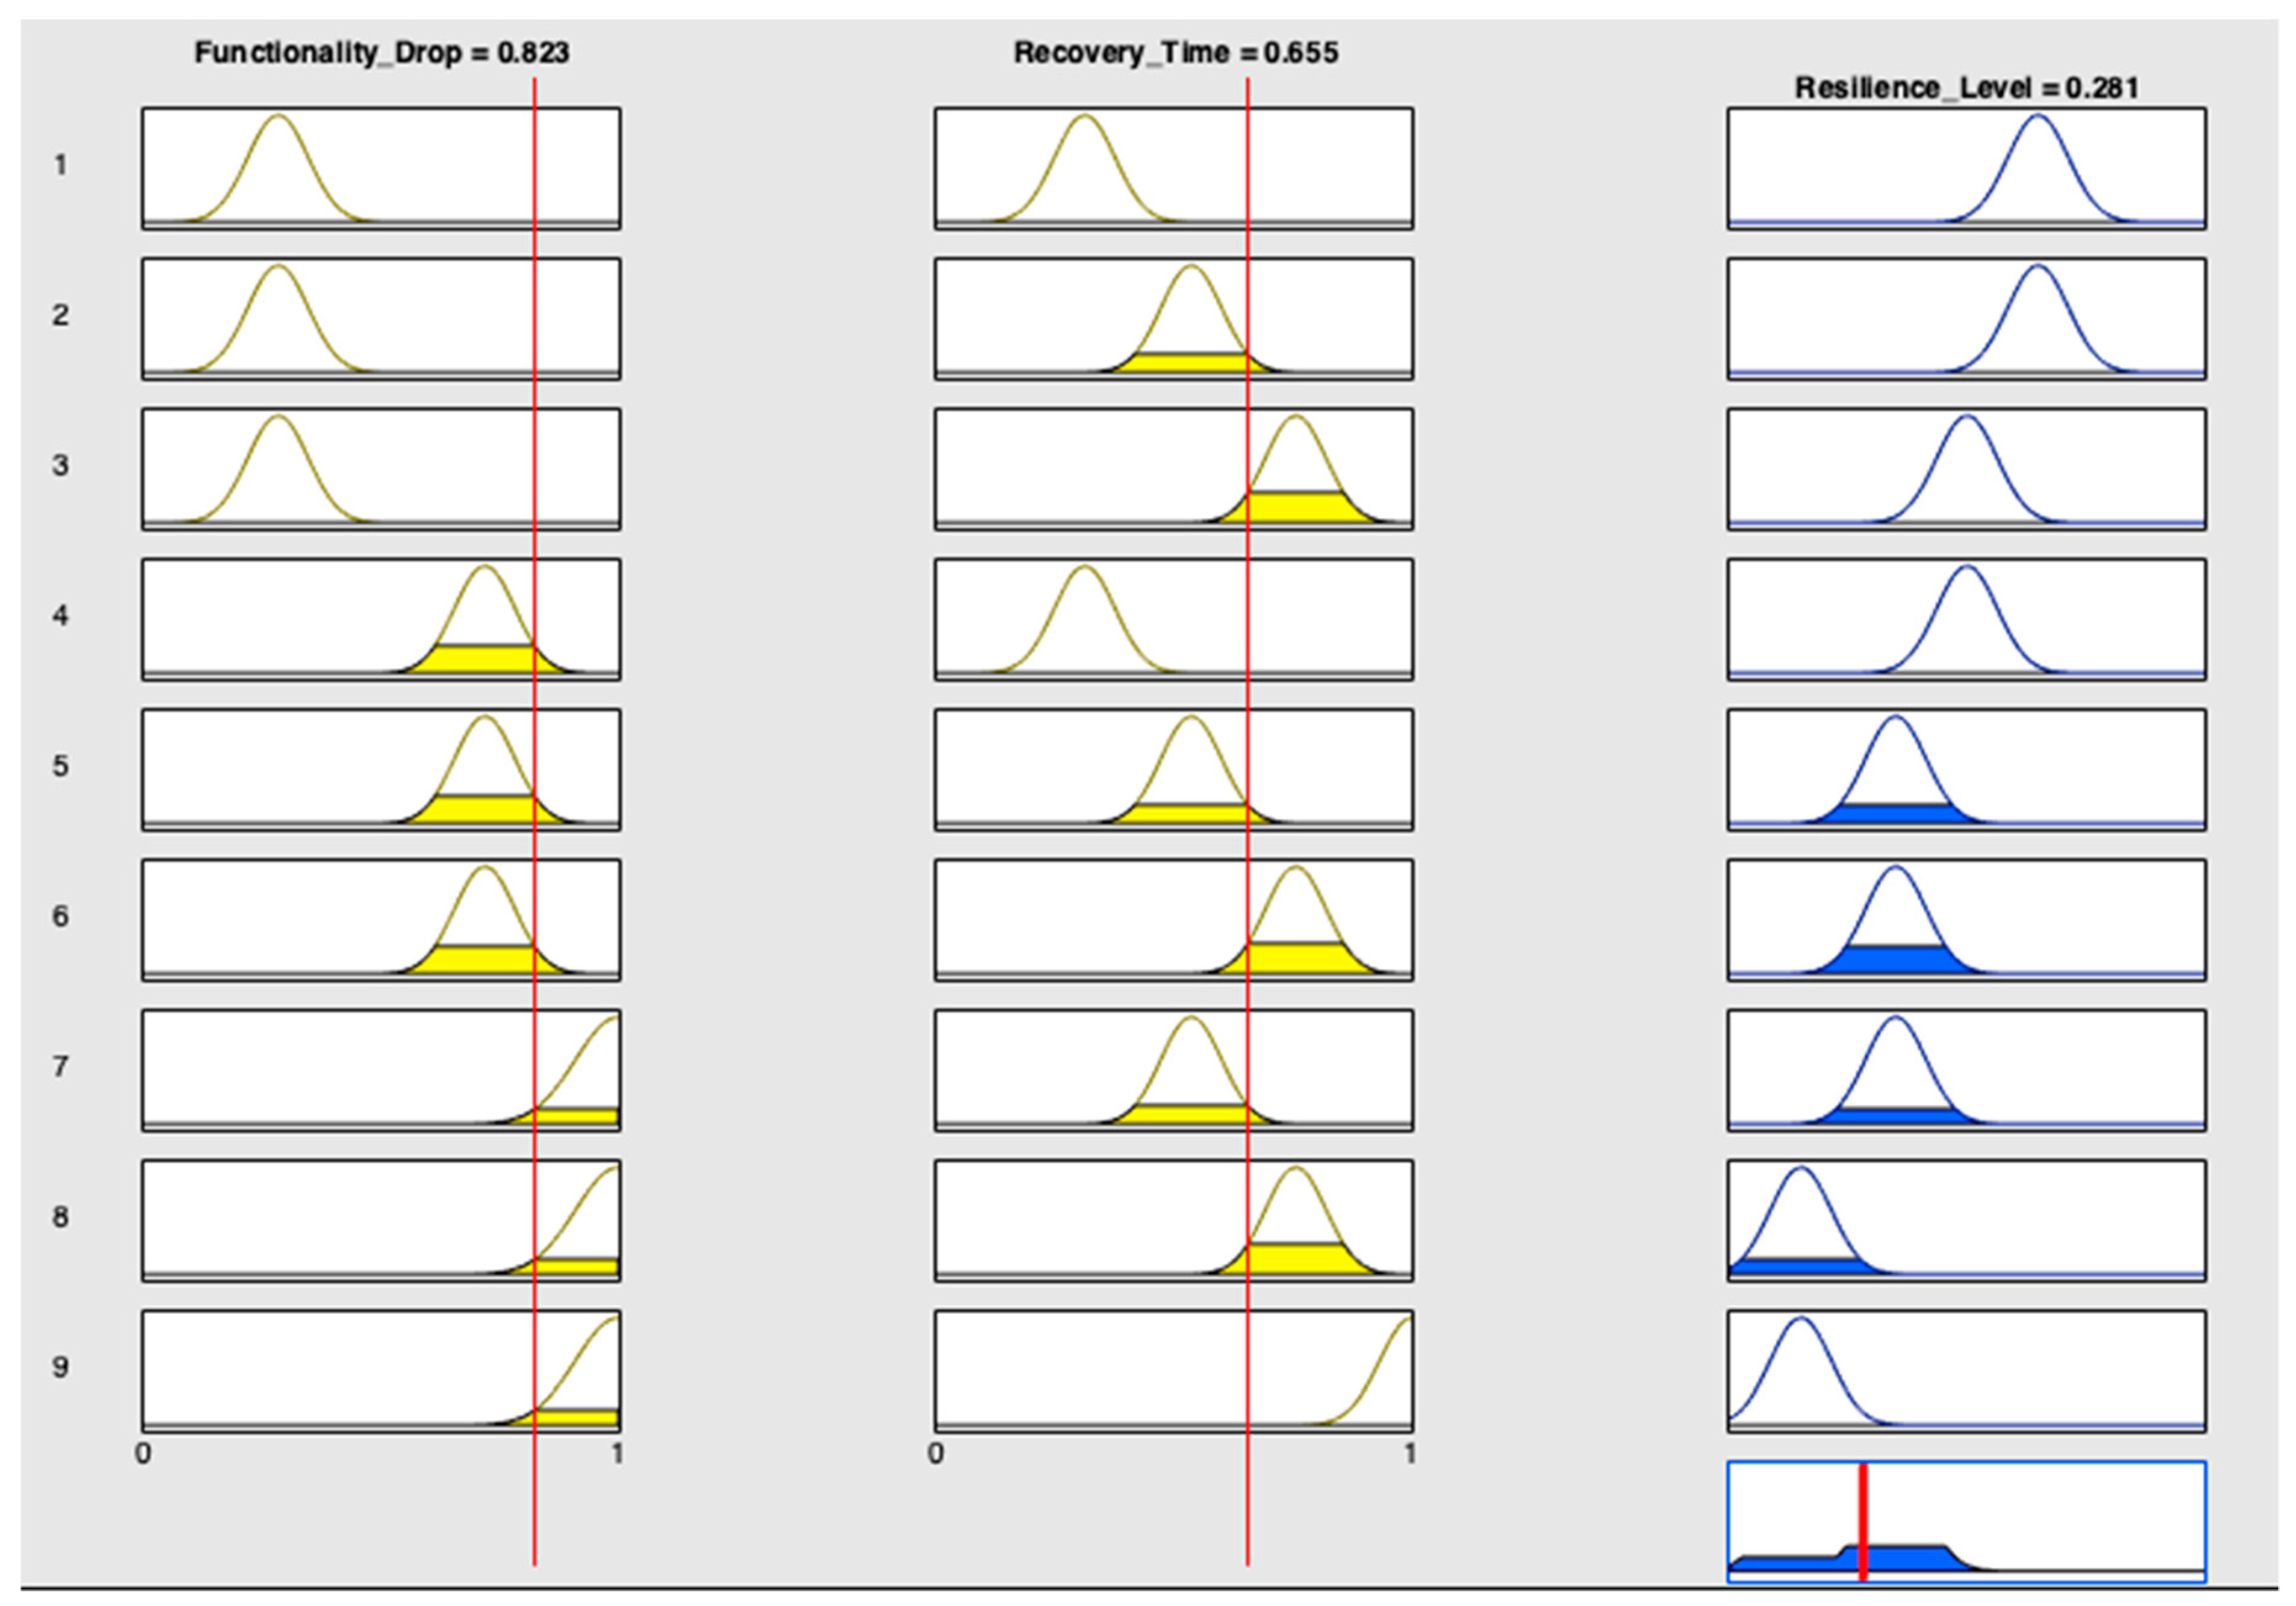
Figure 3, which calculates the mean values of these parameters and inputs such values to the fuzzy inference base. The output fuzzy value corresponding to resilience is obtained. Finally, the resulting output of the fuzzy inference model can be transformed into a crisp output (In this approach, the defuzzification method maps convex crisp sets to their centroid. The x coordinate of the centroid corresponds to the defuzzified value). Alternatively, the output may remain as a fuzzy concept and be used as a linguistic term (
Figure 4).
In the next section, we demonstrate the use and validity of the proposed system through an example based on a real system. The structure and reliability and maintainability values of the components of that system served as the basis for the RAM analysis, the Monte Carlo experiments, and finally, in order to obtain the time series with the systemic availability values.
4. Case Study
The purpose of this section is to validate the proposed model performing a case study. This study is based on a set of three fleets which operate in a mining operation located in northern Chile. In its open pit operation, there are three different types of equipment: Drilling fleet, Loading fleet and Truck fleets.
For the drilling process, the following five separate units (represented by the D letter) are considered, according to three types of drilling machines:
Drilling Machine D1 (2 units)
Drilling Machine D2 (2 units)
Drilling Machine D3 (1 units)
The loading process is carried out using three electric shovels of the same type and condition (represented by the S01, S02 and S03 codes). Finally, the ore transport system is carried out by 43 trucks (represented by the H letter) separated into three distinct sub-fleets:
Truck A (34 units)
Truck B (6 units)
Truck C (3 units)
As it was described before, to assess the resilience of a system or equipment, one must take into consideration time series with the availability of either an equipment, sub system or of an entire system. That series usually contains a set of
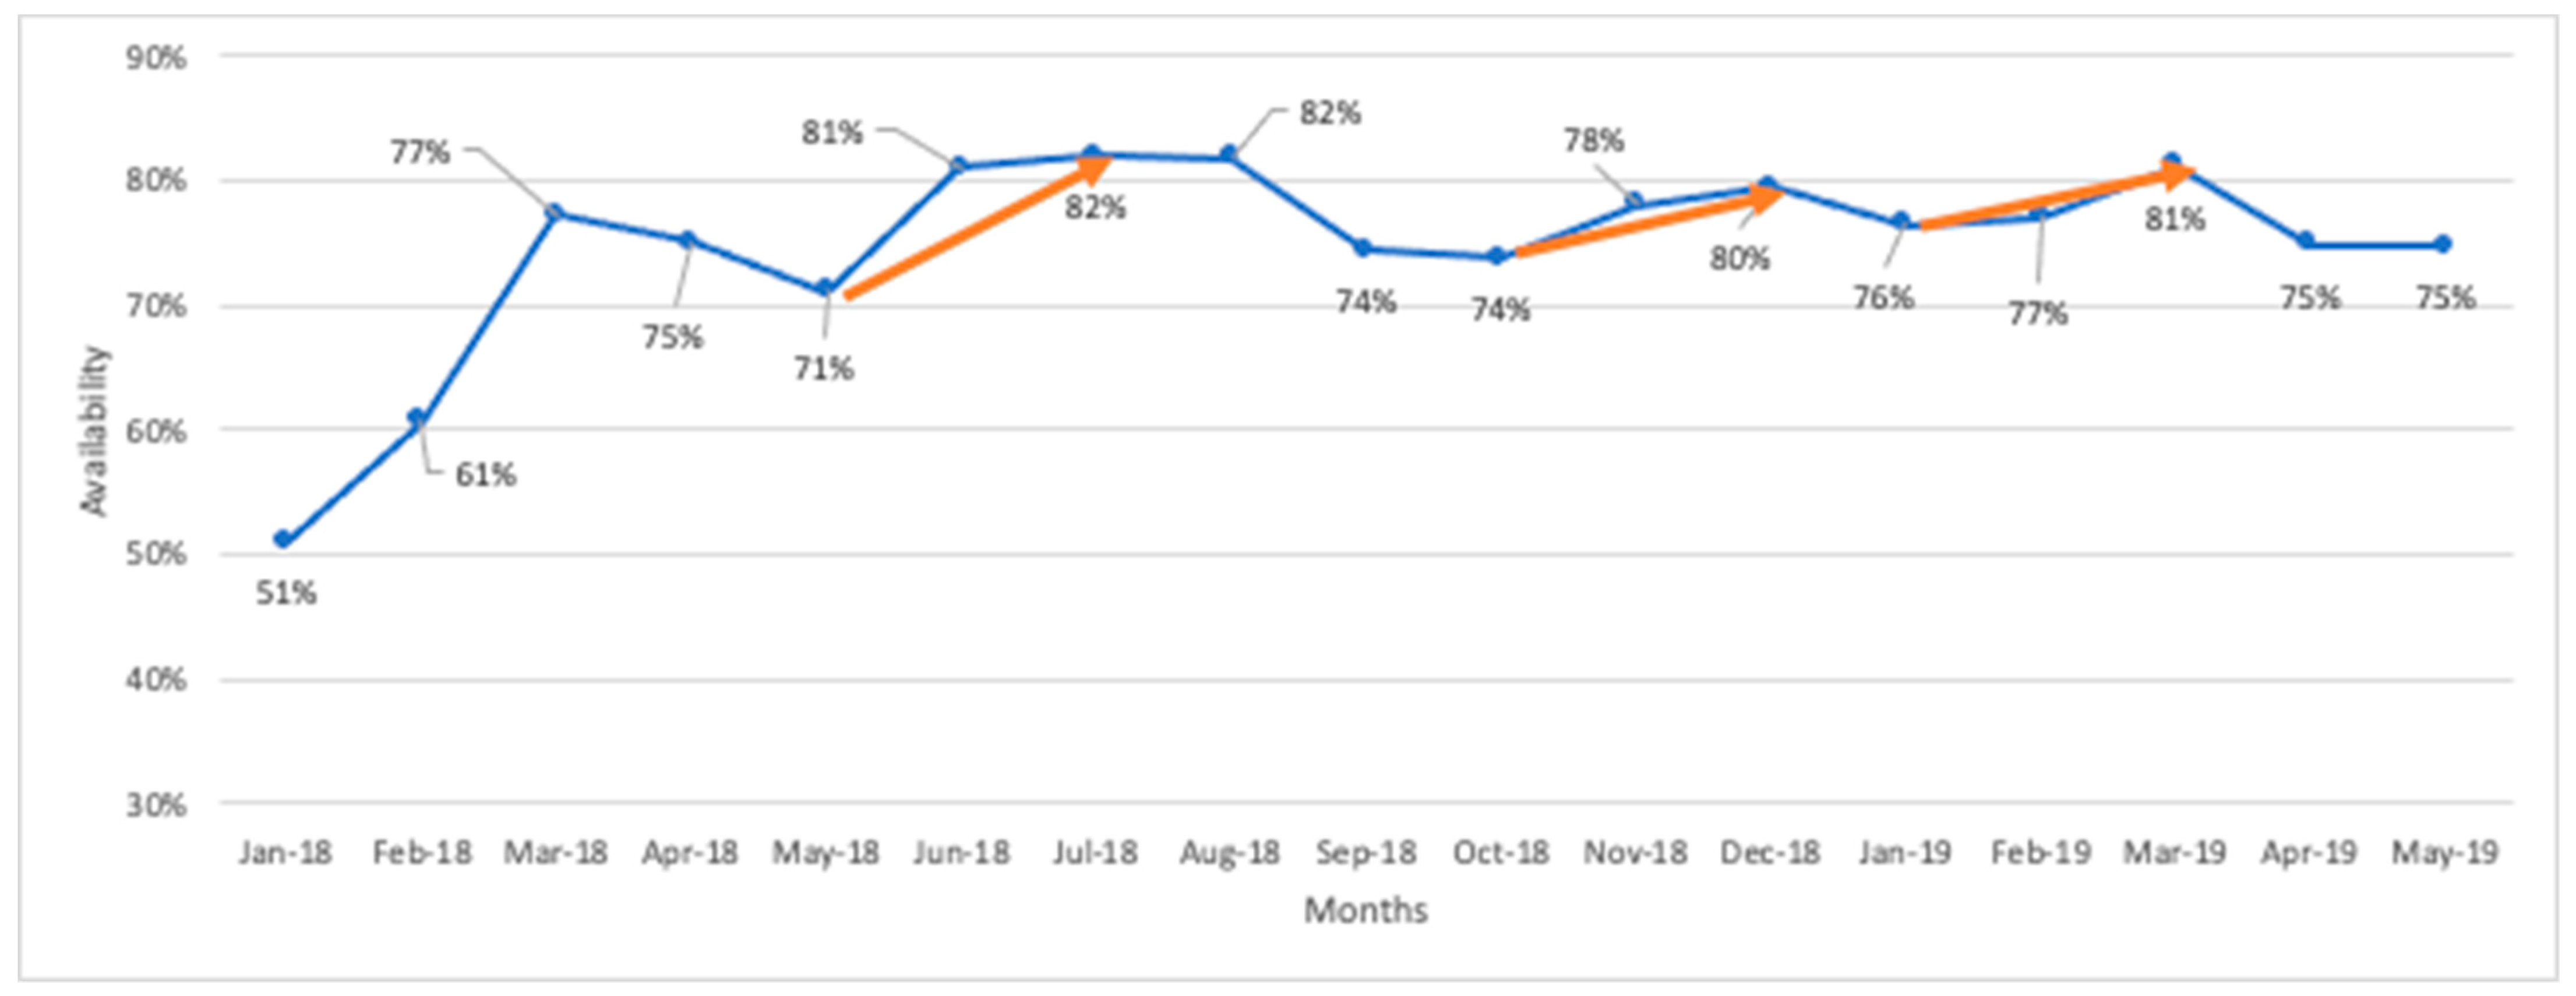
n disruptive events or loss of functionality over a given period of time. To start the analyses, we use the time series of actual availability at fleet level consisting of 17 consecutive months. Subsequently, a series of XXX experiments was generated including modifications to the maintenance strategies of critical equipment. Also, in order to measure the effect of varying redundancy levels on systemic resilience, experiments were generated where the number of such pieces of equipment was modified. In
Figure 5, it is possible to observe one sample series that contains the monthly average availability behavior of the entire fleet. Such a series was created considering the actual values of reliability (MTBF) and maintainability (MTTR) of each piece of equipment extracted from the historic records of the equipment.
As can be seen in the time series depicted in
Figure 5, the system’s availability has four shocks that affect the functionality at the system level (The arrows show four reductions in availability and their respective recoveries). Regarding
Figure 5, one can say that the resilience can be expressed by the following parameters: A
i2, A
i3, t
i2 y t
i3, with i = 1, …, 4. The values are used to perform the resilience assessment according to
Table 10.
Using the data originated by the detected shocks along the time series, average availability loss and average duration for every recovery processes were computed. Using the fuzzy rules listed in
Table 1, we obtained the output value, as shown in
Figure 4. In parallel, and in order to compare the accuracy of the values calculated through the fuzzy rules, these values, A
i2, A
i3, t
i2 and t
i3 were used to calculate resilience using Cai’s model (Equation (2)).
5. Results Discussion
As per the aforementioned and aiming at the validation of the results generated from the fuzzy based proposed approach, we have compared the resilience values obtained by Cai’s model [
6] with the defuzzified values produced by the three- and five-rule fuzzy- based inference systems. The resilience values using Cai’s model were extracted from the work published by Durán, Aguilar and Capaldo [
43] and calculated from the model expressed by Equation (1) (
Figure 3). Those values represent the systemic resilience obtained from the availability time series generated in a series of Monte Carlo-based-RAM. Such analysis includes different maintenance strategies (preventive actions with different frequencies and levels of sophistication) and some experiments generated from new fleet configurations (different levels of redundancy).
As a premise for the development of this part of the study, and in order to prioritize some pieces of equipment, a criticality analysis was initially performed. Considering the results of the RAM (reliability, availability and maintainability) analysis, the critical equipment in each sub-fleet was identified. This hierarchisation was carried out using the Jack Knife diagram [
44]. Through the use of such technique, it was possible to identify, in decreasing order, which pieces of equipment have the greatest impact at system level. That impact is understood in terms of system downtimes and unavailability. The purpose of this approach is to be able to focus efforts and analysis on that equipment, with the aim of increasing their availability over time by adjusting preventive maintenance strategies.
Table 11 shows the MTBF and MTTR values, main reliability and maintainability indicators, as well as failure frequencies and total times for general corrective maintenance for each of the considered devices.
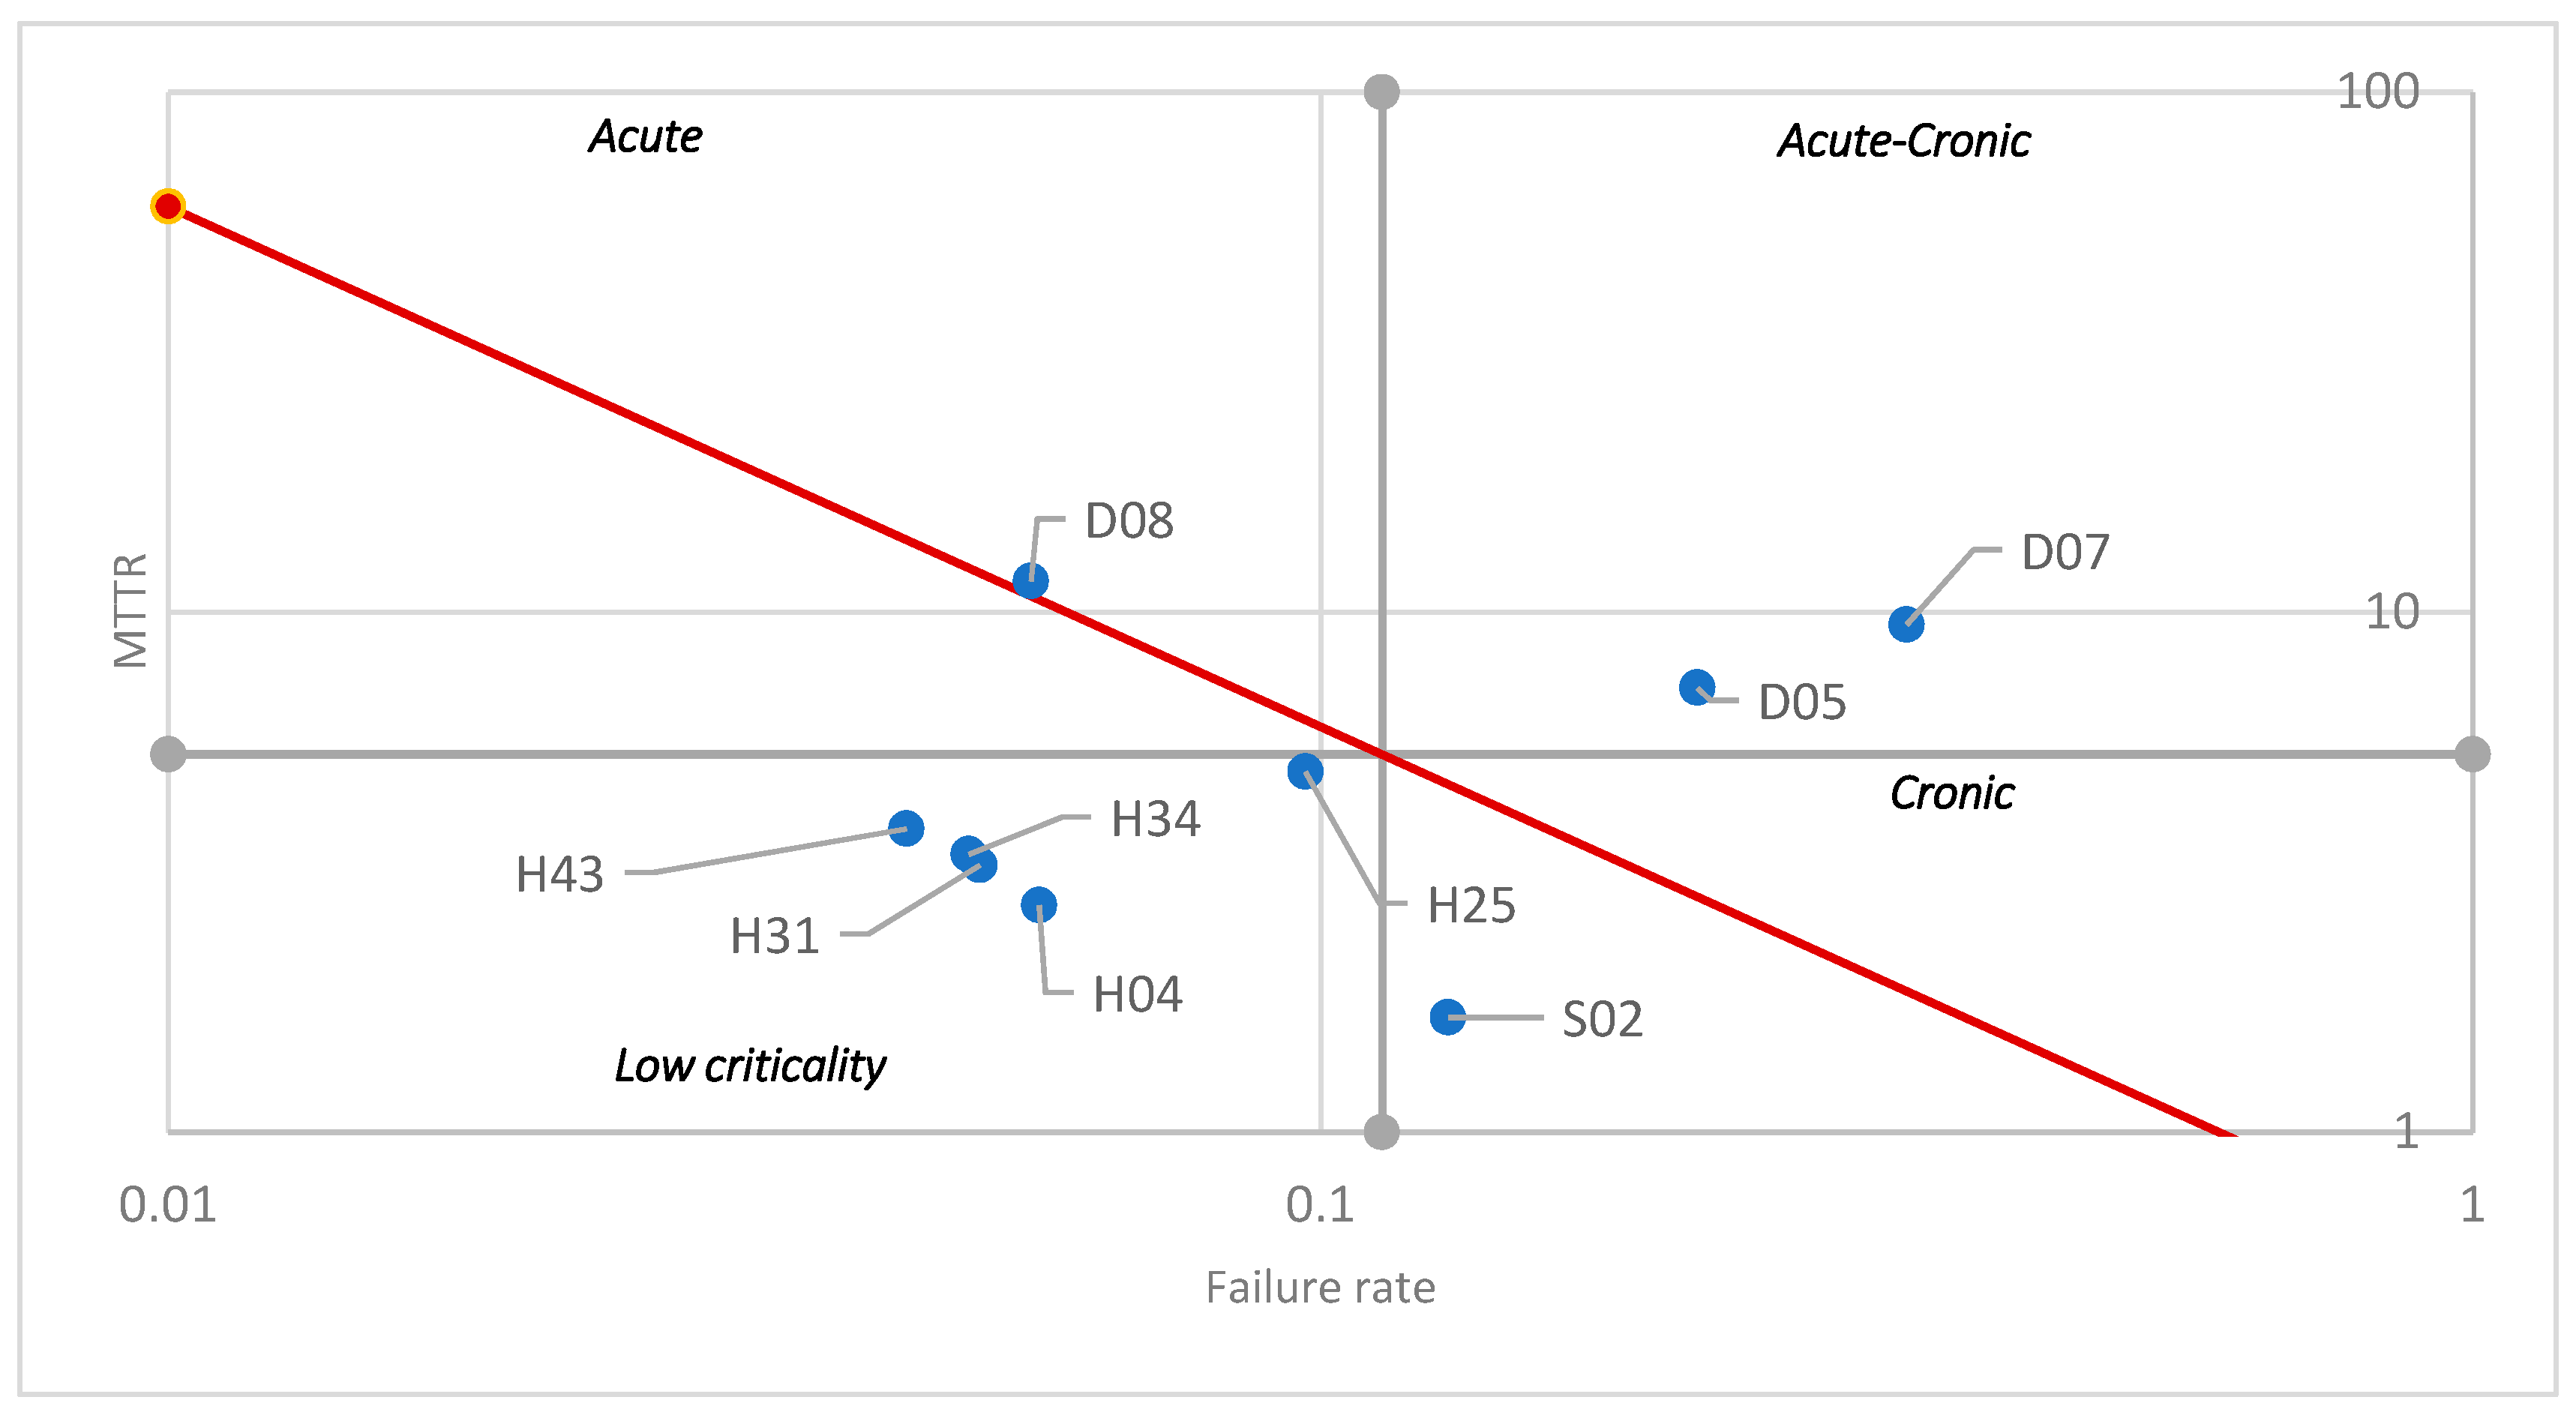
The Jack Knife Diagram for all critical devices is presented below (
Figure 6).
With regard to the
Figure 6 and the values shown in
Table 12, we can see that the drilling machines have the greatest impact at the system level, mainly the D07 and D05, as both present reliability and maintainability problems, i.e., they fail more frequently and their average repair times are high. In the case of the D08 drill, it presents only maintainability problems as it is the highest among all the pieces of equipment. In the chronic quadrant (CR), the devices H25 and S02 appear, both with reliability problems because they fail more frequently, particularly the electric shovel S02, which suffered 945 unplanned stoppages.
In the following paragraphs, it is shown how the proposed model can be used to evaluate, from a resilience point of view, various scenarios including different preventive maintenance strategies (expressed by different frequencies and different durations). Also, some comparison experiments were developed to assess how changes in the topological structure of the system impact the resilience of the system.
Different types of experiments were put forward for evaluation. With these experiments, the aim was to measure the behavior of the system resilience regarding alterations in maintenance strategies in a set of critical equipment. Such modifications were implemented by varying the frequency and complexity (expressed by different preventive interventions’ durations) of preventive interventions in such critical equipment.
As it was mentioned before, a number of maintenance strategies applied to critical equipment were simulated. This allowed the verification of the feasibility of using the fuzzy approach to express the resilience performance of the system. These hypotheses can be divided into three groups:
- (i)
The establishment of a simultaneous preventive maintenance plan for the nine most critical pieces of equipment within the fleet. The preventive interventions were designed with a duration of 6 h. In the experiments, these interventions were applied with three different frequencies (3, 6 and 9 months). This group is called Exp_1.
- (ii)
Preventive interventions on each of the critical equipment items separately, with three different durations (6, 9 and 12 h) and the same frequencies as mentioned in paragraph i. The corresponding experiments were grouped in a category called Exp_2.
- (iii)
Finally, some experiments were conducted to assess the effect in systemic resilience applying a redundancy increment to the critical assets by incorporating, separately, one piece of equipment to each one of the sub-fleets of drilling machines. This was intended to measure the behaviour of the resilience index at the fleet level system as a whole. These experiments are grouped into the Exp_3 category.
To assess the system availability behaviour according to each defined scenario (i, ii and iii), Monte Carlo experiments were run with 1000 iterations for each scenario. RAM analysis and Monte Carlo experiments were performed with the R-MES software suite. In each experiment, a new set of monthly system-level availability data was generated for each scenario. With each data set, the proposed fuzzy-based model was applied.
In order to perform a correct comparison of values, the results obtained through the analytical model were normalised and with this, these results are between 0 and 100% (the same scale as the defuzzified values of the output of the two proposed fuzzy systems). The resiliency values obtained from two fuzzy rule bases, with three and five linguistic terms (FUZZY_3 and FUZZY_5, respectively), were compared to the results obtained through the use of Cai’s analytical. These comparisons are expressed by relative percentage error measures. The data was obtained through 36 simulation experiments.
Table 12 shows the relative error values (%) for both when compared with values obtained from Cai’s model (EXP_1 and EXP_2).
Table 12 was formatted as a thermal map to highlight the largest errors. This reveals clearly that the smaller magnitude of the errors is generated by the fuzzy-based model which operates with five linguistic terms for each variable. Thus, as can be seen in
Table 12, the FUZZY_5 model leads to closer results when compared to the values obtained by an analytical model. In addition, the FUZZY_5 model has a lower dispersion of errors.
With regard to the inclusion of extra equipment to the drilling fleet, i.e., increasing redundancy by adding equipment with the same reliability and maintainability characteristics, it can be seen in
Table 13 that the resilience values obtained by the two versions of the fuzzy system are relatively small. In fact, the results obtained by the FUZZY_5 system are much closer to the values obtained analytically, and do not exceed 2% of relative error.
6. Conclusions
We have presented a decision support system that based on fuzzy reasoning and using as a measure of system functionality time series containing the value of system’s availability delivers the value of system resilience. This system allows estimating the value of resilience as a result of having applied different maintenance strategies on individual equipment or groups of them. In addition, the proposed system allows, through alterations in the RBDs, which represent the system’s structure, to assess the impact on system’s resilience to adding new equipment or removing existing ones from it.
The major difference between our proposal and previous works lies in that we will define a fuzzy based resilience model that will allow the estimation of a highly engineered system resilience regarding the system topology and dealing with uncertainty and fuzziness of the operational parameters, besides the main convenience of using linguistic expressions as a means of standardization in different levels of abstraction.
Regarding the managerial implications, the proposed model may be viewed as a decision tool that will allow managers to map the relationships that may exist between maintenance and operational strategies, different systems topologies, and perceptions about disruptive events in complex engineering systems. Moreover, the model defined will be used as a simulation-based optimization tool to solve real world problems and sensibilization assessments.
In other words, whenever there is a new hypothesis about modifying the maintenance strategy for a particular piece of equipment or set of them or altering the topology of the system by adding new instances of a critical piece of equipment, the use has to perform the following procedure: implement modifications in the system RBD by changes in the MTBF and MTTR parameters of the equipment. Then, Monte Carlo experiments are performed to generate the Availability series at the system level. With this new time series, the proposed model is executed.
Changes made to the strategy and/or topology will express themselves, to a lesser or greater degree, in the behaviour of the availability and therefore in the values of . These new values are entered into the fuzzy rule base from which a new fuzzy term (literal) and value can be extracted, allowing the user to have an evaluation (confirmation) of his hypothesis.
The use of the proposed model to estimate the behavior of the system resilience and obtain optimized operational, maintenance and structural decisions constitutes the main contribution of this work. Therefore, reliability, maintainability and availability metrics are central elements of this research, all of them under different levels of abstraction and aggregation and through a fuzzy perspective. No previous works have been devoted to the tentative mapping of the effects of different strategies on the resilience of physical assets and systems. The results show the usefulness of incorporating resilience aspects for driving maintenance strategies of physical assets.


