1. Introduction
With the development of the air transportation industry, multi-airport systems (MAS) or Multiple Airport Regions (MARs) have emerged in metropolitan areas. By the end of 2021, China had a total of 248 certified civil air transport airports (excluding Hong Kong, Macao and Taiwan). The construction and development of MAR are of great significance for the economy and for enhancing the quality of life. First, the development of MARs can promote the economic development of the region. Within the MAR itself, multiple airports can greatly increase the overall capacity of the regional airport system, strengthen the core status of hub airports, and drive the development of secondary airports. Meanwhile, it can form a differentiated regional economic layout, which can promote coordinated development, and strengthen the overall economy. Also, the MARs can optimize the allocation of airport resources. However, via the continuous increase of the airport density, adjacent airports in a region have formed increasingly complex coupling relationships in terms of airspace resources, slot resources, and passenger resources. Airports are faced with multiple relationships of competition and complementarity. Functional positioning of airports in a MAS is critical for the optimal allocation of various resources, which will in turn advance the development of the airports and the MAS itself.
One of the important tasks for China’s civil aviation is to accelerate the construction of world-class MARs in three metropolitan areas: Beijing-Tianjin-Hebei, the Yangtze River Delta and the Guangdong-Hong Kong-Macao Greater Bay Area. The close proximity of hub airports and the regional airports located in these areas do improve convenience for air travelers. However, competition among airports in these MARs has become an unavoidable issue. To improve the efficiency of multiple airport operations, management policies have proposed and enforced all around the world at different times. For example, Europe and the United States have formulated policies for the development of MARs. In 2017, it was proposed by United State to optimize the design of the arrival and departure procedures of the Los Angeles MAR in order to improve the efficiency of airspace operations. In 2015, Europe proposed that every airport in the London MAR should adopt different market positioning, attract different types of passengers, optimize the allocation of time resources, add new runways, and improve ground transportation, along with other measures. In 2020, it was proposed to reduce the complexity of traffic flow through Paris MAR and London MAR, by measures such as comparative optimization of runway configuration, capacity management.
In fact, each MAR is likely to be highly homogeneous in terms of airport capability, business level, and route network. Thus, there will be fierce competition in the aviation market. It is of great importance to evaluate the level of homogenization of the MAR at the current development stages. Potential problems between airports in the MAR would be identified, making it is easier to improve operations. Recently, there has been a variety of work on how the MAR affects airports in it [
1,
2,
3,
4,
5]. These works examined airports geographically closed within the MAR, identified key factors (fare, connectivity characteristics, on-time performance) of airport competition, or measured the interrelationships between MAR and airports. In addition to studying the factors that influence multi-airport regional development, it is also meaningful to study the homogeneous airline markets and network competition of regional airports within MARs [
6,
7,
8]. However, little attention has been paid to the development of the method for evaluating the homogenization among airports in the MAR. In this paper, a novel method based on multi-dimensional indicators is constructed to evaluate the level of homogenization between airports in a selected MAR.
The rest of the paper is organized as follows.
Section 2 summarizes related work on the MAR. A multi-dimensional and multi-layer airport operation indicator system is developed in
Section 3.
Section 4 defines the homogenization calculation formula based on similarity, and proposes a homogenization measurement indicator based on the macro airline network within the MAR. The case study is presented in
Section 5. Finally, concluding remarks are given in
Section 6.
2. Literature Review
The research work on the homogenization of MARs can be divided into several groups, including qualitative discussions and suggestions about the development of MARs [
9,
10,
11,
12,
13,
14], passengers’ preferences for airports in MARs [
15,
16,
17,
18,
19,
20,
21,
22,
23,
24], route network characteristics of MARs [
25,
26,
27], similarity measurement for a single dimension of MAR airport operation [
28,
29].
2.1. Qualitative Studies
There are several qualitative studies on the qualitative assessment of homogenization of MARs [
9,
10,
11,
12,
13,
14]. For example, Liu and Yuan proposed promotion of the construction of the Chengdu Free Trade Zone with the advantage of the Chengdu-Chongqing MAR [
9]. Suggestions for the development of Beijing Daxing Airport in the Beijing-Tianjin-Hebei MAR have been put forward from the perspective of regional legal-system- development as a collaborative mechanism, setting up a special legislative body, using shared data to promote law enforcement coordination and improving the legal management of airport management agencies [
10].The positioning of airports in the Pearl River Delta MAR were differentiated from the perspective of passenger capacity to promote the coordinated development of airports [
12,
13,
14]. These studies focused on the policy and development of the MARs at a macroscopic level.
2.2. Passengers’ Preference for MARs
The market influence of airports from the perspective of passengers’ airport choice preferences have been widely investigated [
15,
16,
17,
18,
19,
20,
21,
22,
23,
24]. For example, in the Hong Kong-Pearl River Delta (HK-PRD) MAR, the data of passengers’ preference indicated that air ticket price, flight time, flight frequency, and number of airlines can reflect the level of airport service. The results showed that air fare, access time, flight frequency, and the number of airlines were the most important factors affecting airport level-of -service (LOS) [
18]. To solve the economic and financial problems of the multi-airport system, the Puglia airport system in Italy was analyzed in terms of the sustainable development of multi-airport systems [
19]. In another study, trade-off was investigated by estimating a weighted conditional logit model of airport–airline choice, using data on passenger departure from one of three San Francisco Bay Area airports and arriving at one of four airports in greater Los Angeles. Results showed that non-price characteristics such as airport access time, airport delay, flight frequency, the availability of particular airport–airline combinations, as well as early arrival times strongly affected choice probabilities [
20]. Three regional airports (Ljubljana Jože Pučnik Airport (LJU), Venice Marco Polo Airport (VCE), and Trieste Pietro Savorgnan di Brazza Airport (TRS)), were studied to address passengers’ airport choice, and to analyzes airports’ catchment area size and homogenization within the Upper Adriatic region. The results confirmed earlier findings showing that access time to the airport was the most important factor in airport choice for all segments (business/leisure and cross-border/domestic) [
21]. Decision-making processes within the passenger travel route of the Yangtze River Delta MAR were investigated. It was found that the airport should optimize the flight frequency, ticket, and route network structure according to its own market positioning and combine this with the limited rationality of passengers to improve the performance of the MAR [
22,
23,
24].
2.3. Route Network Characteristics of MARs
Complex networks were used to characterize the structural characteristics of MAR to study the level of homogenization within MARs [
25,
26,
27]. The structural characteristics of the homogenized network in the Yangtze River Delta were analyzed. The similarity coefficient was applied to solve the homogenization coefficient of the airline network within the MAR. Suggestions for planning adjustments to the airport route structure were proposed [
25]. A route network optimization model was established [
25] to analyze the homogenization of the route network of the Beijing-Tianjin-Hebei MAR [
26]. The resilience of the aviation network was studied under different growth mechanisms [
27], it was proved that the network of a MAR established to improve the aviation network can reduce network density due to larger connection demand. Therefore, it was suggested that small airports can be appropriately enlarged to enhance the robustness of the network.
2.4. Similarity Measurement for Airport Operation in MARs
In addition to the study of homogenization within airline networks, there have been studies on similarity measurement for other airport indicators. For example, the common profits of trunk and regional airlines when various market structures reached equilibrium was compared to understand the unreasonable market structure of MAR trunk and branch routes. The results showed that profit can be maximized only through aviation cooperation [
28]. A method of similarity coefficient method was proposed to measure the scale of airports (number of flights, passenger, and cargo) in view of the homogenization of the development of the Yangtze River Delta MAR [
29].
2.5. Contributions
Previous research on the homogenization of MARs had the three following problems:
It was unable to locate accurately the exact problematic dimensions of the MAR.
The evaluation of homogenization was only from a single dimension, such as airport infrastructure or airline network layout. There was a lack of comprehensive consideration of multi-dimensional indicators.
All indicators were treated equally. None were weighted or stratified according to their information content.
Therefore, this paper develops a model to evaluate and analyze various factors that affect the homogenization level of a MAR. A method for evaluating the homogenization of MARs is proposed from multiple perspectives, the main contributions of the paper are as follows:
A multi-dimensional and multi-layer airport operation indicator system is established by combining the production and construction indicators. The indicator system comprehensively captures airport infrastructure, overall security, operational efficiency, and airline network and business strategy-related indicators.
The homogenization calculation formula based on similarity is defined, and the calculation method of airline network homogenization is summarized.
By the leverage of the Critic weighting method [
30] and the Delphi weighting method [
31], the comprehensive homogenization results of MARs are obtained.
Taking three typical MARs in China, the United States and United Kingdom as examples, the paper analyzes the airport pairs with serious homogenization tendencies, and proposes suggestions.
3. The Construction of a Multi-Dimensional Indicator System
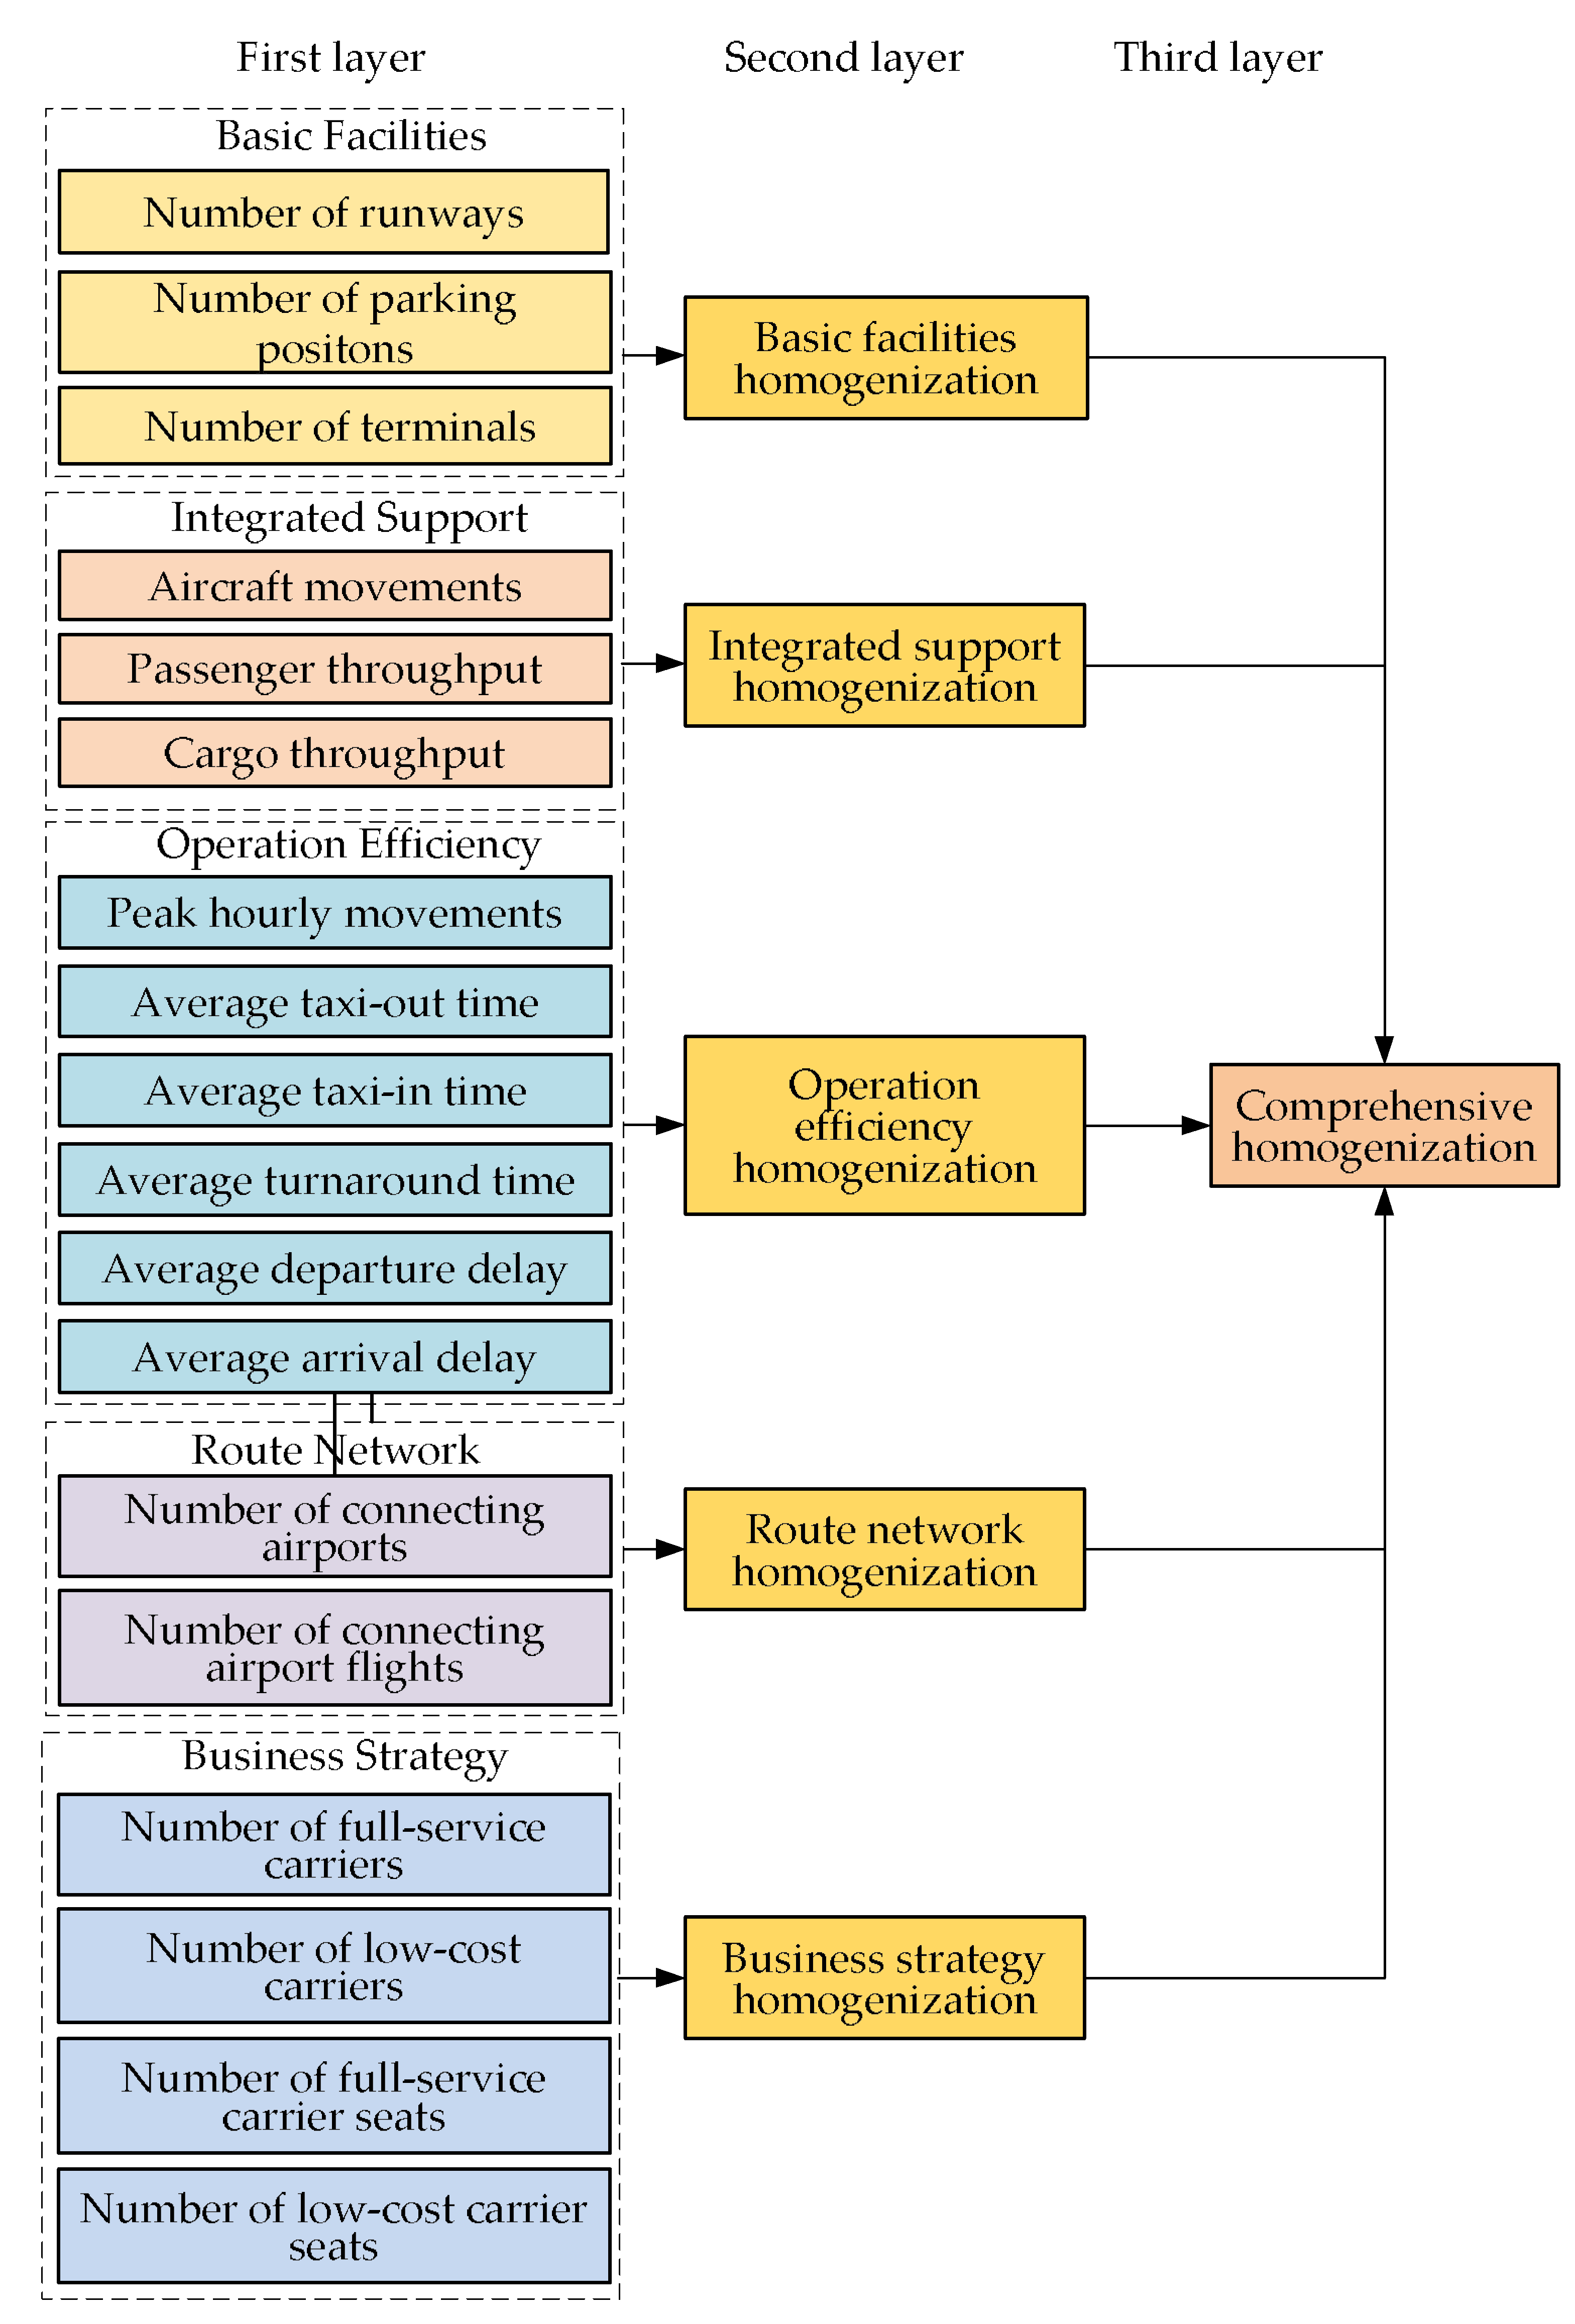
The proposed indicator system should fully and reliably represent the airport’s capability within the MAR. The proposed indicator system focuses on the operation support capability of the MAR, and takes into account all relevant indicators that can reflect the homogenization of the MAR, including basic facilities (BF), integrated support (IS), operational efficiency (OE), route network (RN) and business strategy (BS)-related indicators. The indicators of BF include the number of runway, the number of parking position, and the number of terminals; the indicators of IS include aircraft movements, passenger throughput, and cargo throughput; the indicators of OE are peak hourly flights, average taxi-out time, average taxi-in time, average turnaround time, and average arrival /departure delay; the indicators of the RN are the number of connecting airports and the number of connecting airport flights between two airports in a MAR, and with all other airports; the indicators of BS include the number of full-service carriers (FSCs), the number of low-cost carriers (LCCs), the number of FSC seats, and the number of LCC seats. The above indicators together form a multi-dimensional indicator system for the homogenization assessment of each MAR.
The homogenization evaluation indicator system in
Figure 1 includes a total of three layers. The first layer is the basic indicator level, including five types of indicators: BF, IS, OE, RN, and BS. The homogenization matrix is generated by the indicators under the first layer, then the second layer indicators are obtained through Critic weighting form the homogenization matrix. Combined with the expert input, the Delphi method is used to weight the second-level indicators and finally synthesize the third layer’s comprehensive homogenization matrix of the MAR. Detailed descriptions of the methods to calculate the indicators are shown in
Section 4.
4. Homogenization Solution
4.1. Indicator Weight Calculation
To obtain the final metric of homogenization, it was necessary to determine the weight of each indicator within the five dimensions. Given the characteristics of the aforementioned indicator system, this section introduces the Critic weighting method for BF, IS, OE, RN and BS in the first layer. Let represent the standard deviation of the data distribution of indicator , and let be the conflict between indicators, where is the correlation coefficient between the indicators. Then the information amount is calculated as . The objective weights are given to each indicator under each dimension according to the proportion of the information amount. For the second-layer’s comprehensive homogenization matrix of BF, IS, OE, RN and BS, the Delphi method was introduced for weighting, to obtain a final comprehensive homogenization matrix.
4.2. Homogenization Calculation
The homogenization assessment of the MARs was based on the similarity method, evaluating the degree of homogenization of the airports within the MAR according to different dimensions. The homogenization coefficient of the indicator
k between airport
i and airport
j in the MAR is represented by:
where
is the kth indicator of airport
i;
is the
kth indicator of airport
j.
All indicators in BF, OE, IS, and BS refer to the homogenization calculating method shown by Formula (1). The homogenization level of the number of connecting airports was calculated by the method of Formula (1), while the calculation of the connecting airports’ flights quantity required the information of overall route connections between airports and the quantity of connecting flights. Due to the complexity of the airport connection network, this section mainly describes the solution process of the connecting airport flights quantity homogenization.
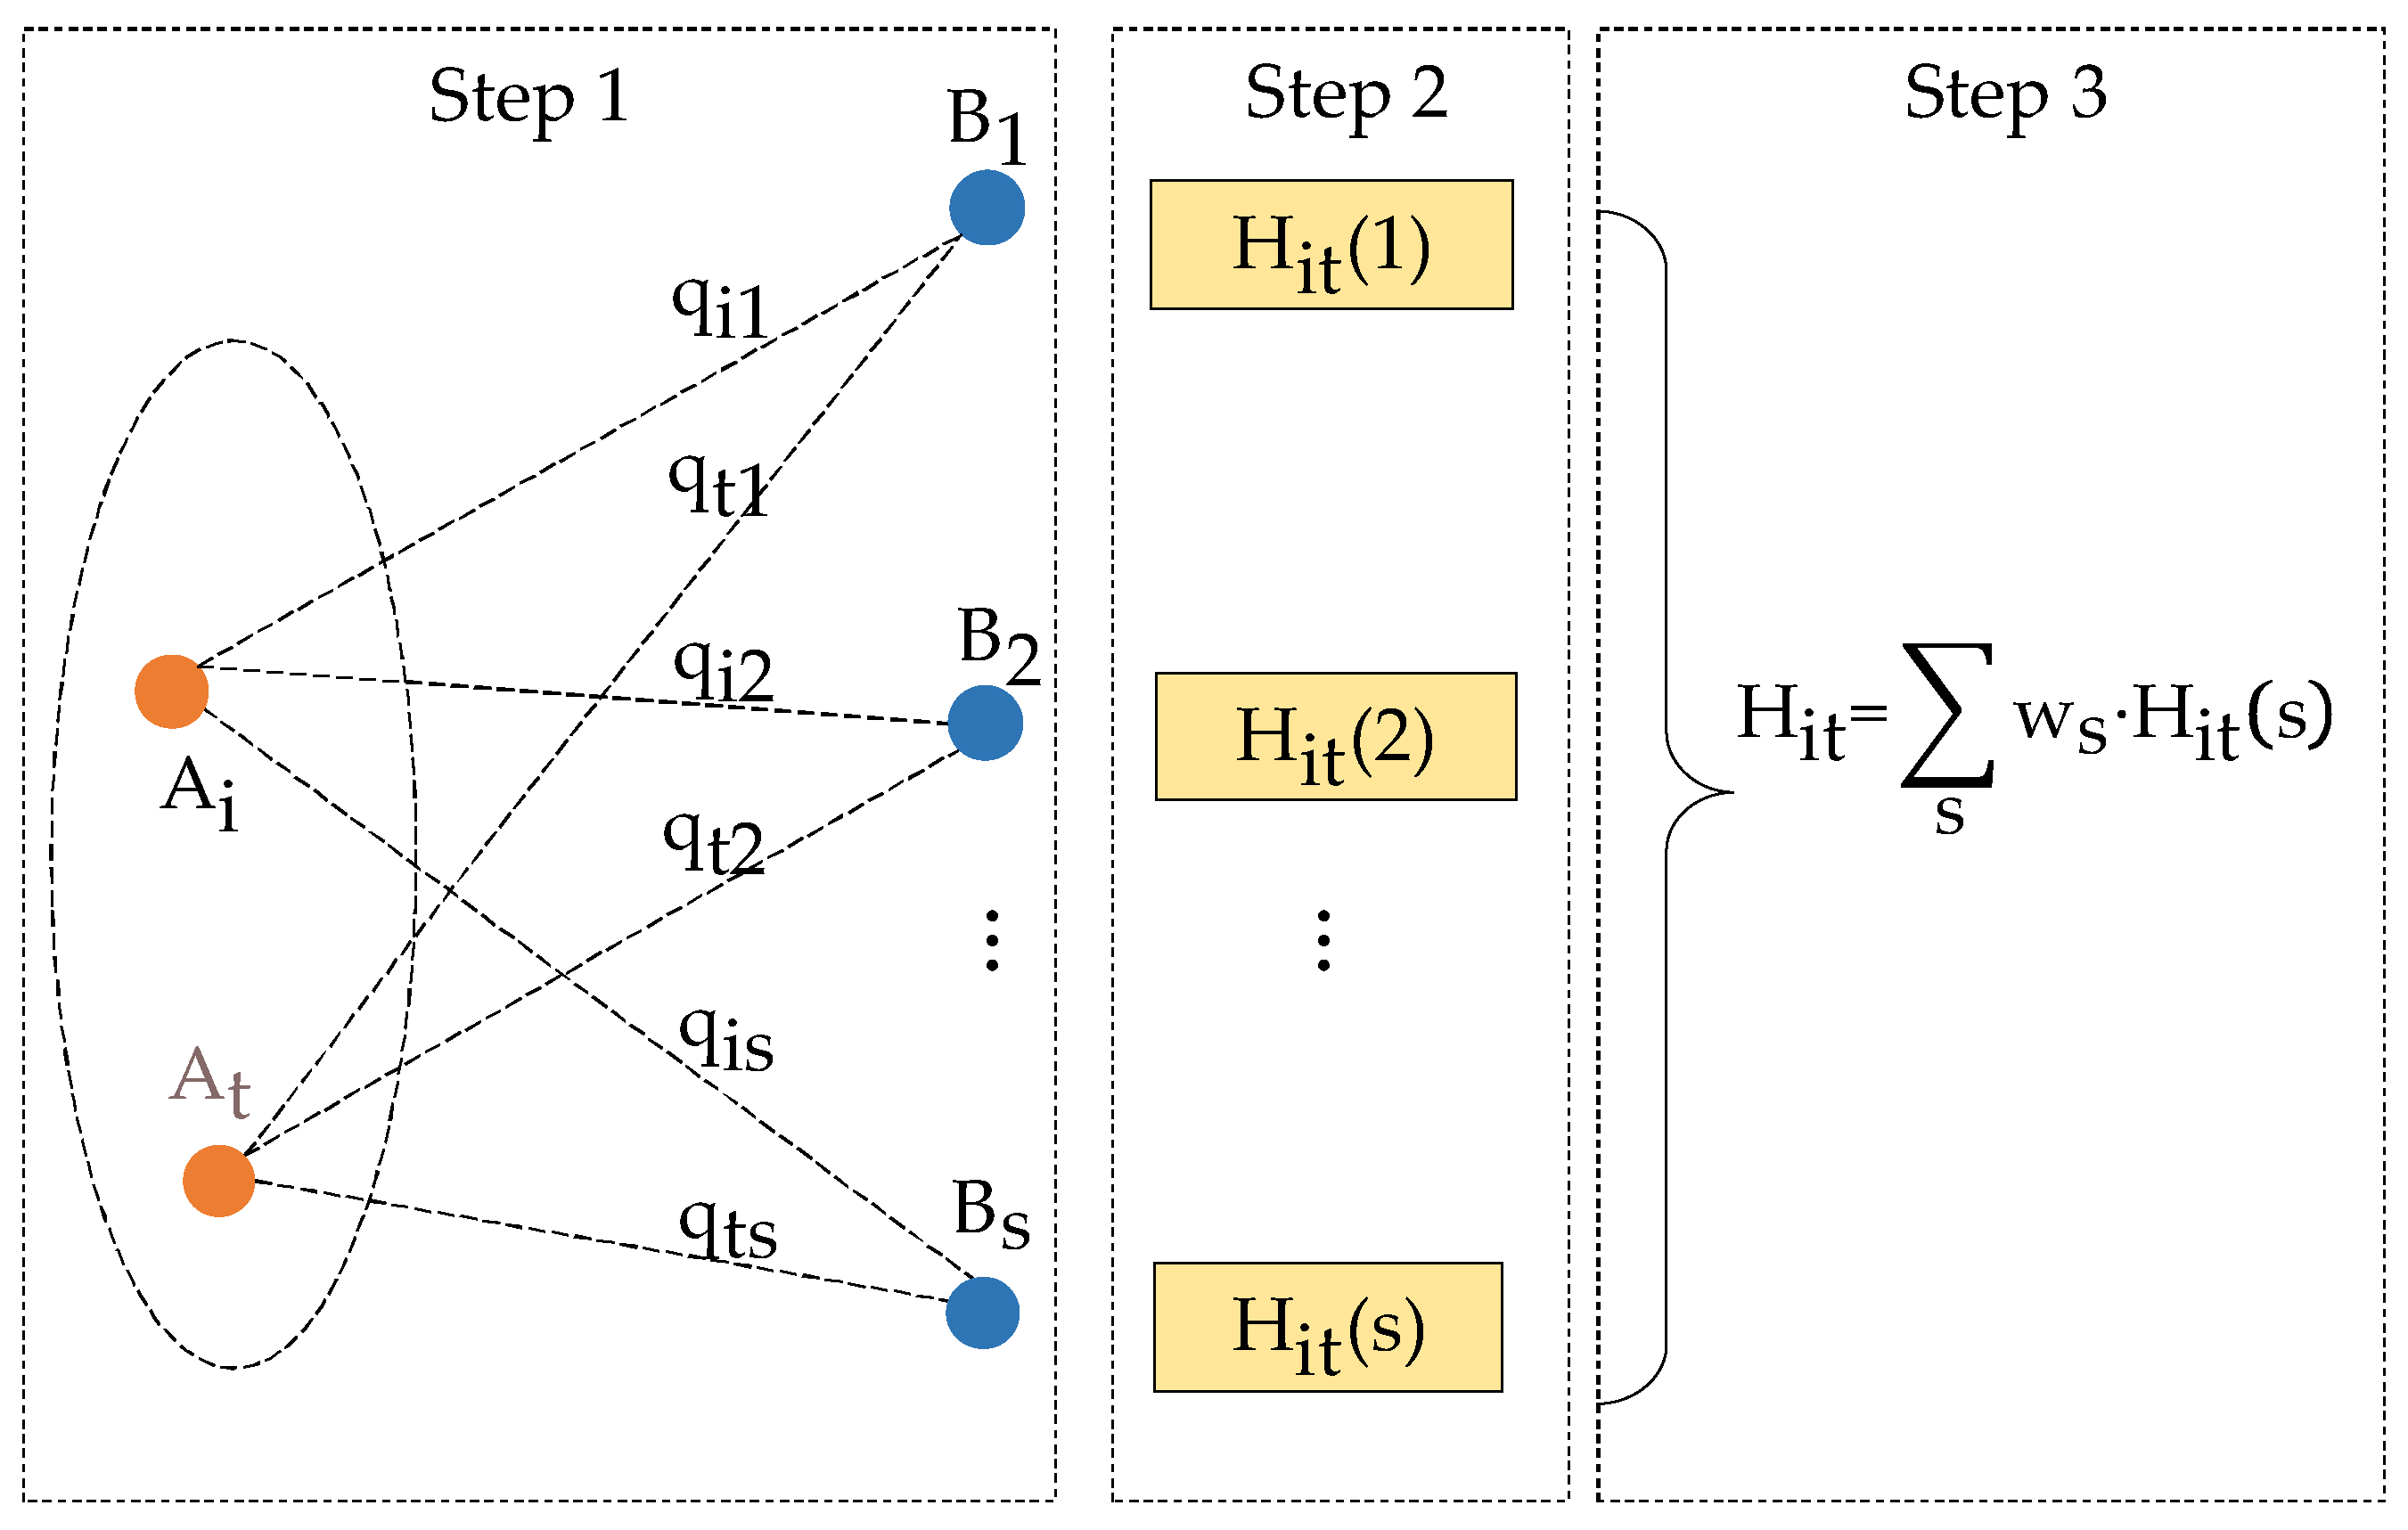
The calculation of the homogenization of connecting flights quantity is essentially divided into the following three steps:
- (1)
For an airport in the MAR, calculate the number of flights between airport , () and all connecting airports , ();
- (2)
Refer to Formula (1) to calculate the homogenization coefficient of
and
between the airports
and
about the airport
, as shown in Formula (2).
where
is the homogenization coefficient of airports
and
with connecting airport;
- (3)
The weight
is assigned to the sum of the flights of
and
corresponding to each connecting airport. The weight is calculated as:
On the basis of the homogenization coefficient matrix of the connecting flights of the MAR, for any airport pair
,
, the weighted mean of the homogenization coefficient of the flight quantity of all connecting airports is calculated by column. The result is homogenization coefficient between
and
, as shown in Formula (4).
The above steps can be summarized in
Figure 2.
4.3. Hierarchical Indicators Fusion
Taking as an example the homogenization coefficient matrix of the number of runways, the number of parking positions and the number of terminals (first layer) to form a BF homogenization matrix (second layer), according to the weights assigned to the three indicators, the BF comprehensive homogenization calculation process was follows:
where
,
,
represent the weights assigned for the number of runway, the number of parking positions and the number of terminals, while
,
,
represent any of an airport pairs’ homogenization coefficient of the above three indicators. Based on the comprehensive homogenization coefficient matrix of the second layer of BF, IS, OS, RN and BS, the weights given by the Delphi method can be fused to provide the comprehensive homogenization coefficient matrix of the third layer.
4.4. Alternative Method
Normalized Euclidean distance (NED) [
32] is an improved method based on Euclidean distance. Since the distribution of all components was different in every dimension component of the data used in this paper, NED was used to process all components separately. First, the components of each dimension are “normalized” to equal mean and variance. Assuming that the mean of the sample set
X is
M and the standard deviation is
S, the “standardized variable” of the sample set is expressed as:
Take any pair of airports as an example, then the NED formula is:
where
is the standardized variable of component
f. The indicator system in this paper used a total of five dimensions, including 21 components. Thus,
n is 21.
NED was able to unify all indicators to obtain a comprehensive homogenization result.
4.5. Evaluation of the Method
As discussed above, the method for assessing the homogenization of MARs consists of three parts: indicator selection and system construction, weight setting, and homogenization solution.
The advantages of the indicator selection of this method include: (1) representative selected indicators, that is, each indicator can represent a certain level of the airport, and the indicators do not overlap with each other; (2) the comprehensive nature of the indicators, with the indicator system fully capturing the airport’s basic facilities, integrated support level, operation efficiency, and route network structure. It also allows further research on the level of homogenization between airports within the MAR according to different aspects. A disadvantage in its application in this study lies in the lack of dynamic evaluation. Only one year of data was taken, and no dynamic calculation and evaluation of the indicator data on different time scales was carried out.
The advantage of the weight setting was seen in the combination of subjective rating and objective setting. The Critic weighting method used in the second layer can objectively consider the difference between the indicator itself and all the indicators, and can uncover the corresponding weights from a large number of indicators, the Delphi weighting method used in the third layer can determine which dimensions have a greater impact on the homogenization of the MAR. However, the experience of different experts may be different or even opposing. Thus, it is also necessary to balance the opinions of experts.
The overall homogenization solution method originated from the similarity method. Compared with the traditional similarity method, the result of the homogenization obtained in this paper was expressed between 0–1. The higher the homogenization coefficient, the more homogenization was expressed. By comprehensively considering the characteristics of the number of flights between the airports and whether the routes are connected, the homogenization coefficient of the route network was finally obtained.
5. Case Study
In this section, we select three typical MARs in the world to demonstrate the feasibility and advantage of our method. The Greater Bay Area MAR, the New York MAR and London MAR were chosen for case analysis. The whole year operation data of 2020 was obtained from the VariFlight Bigdata Platform.
5.1. The Three MARs
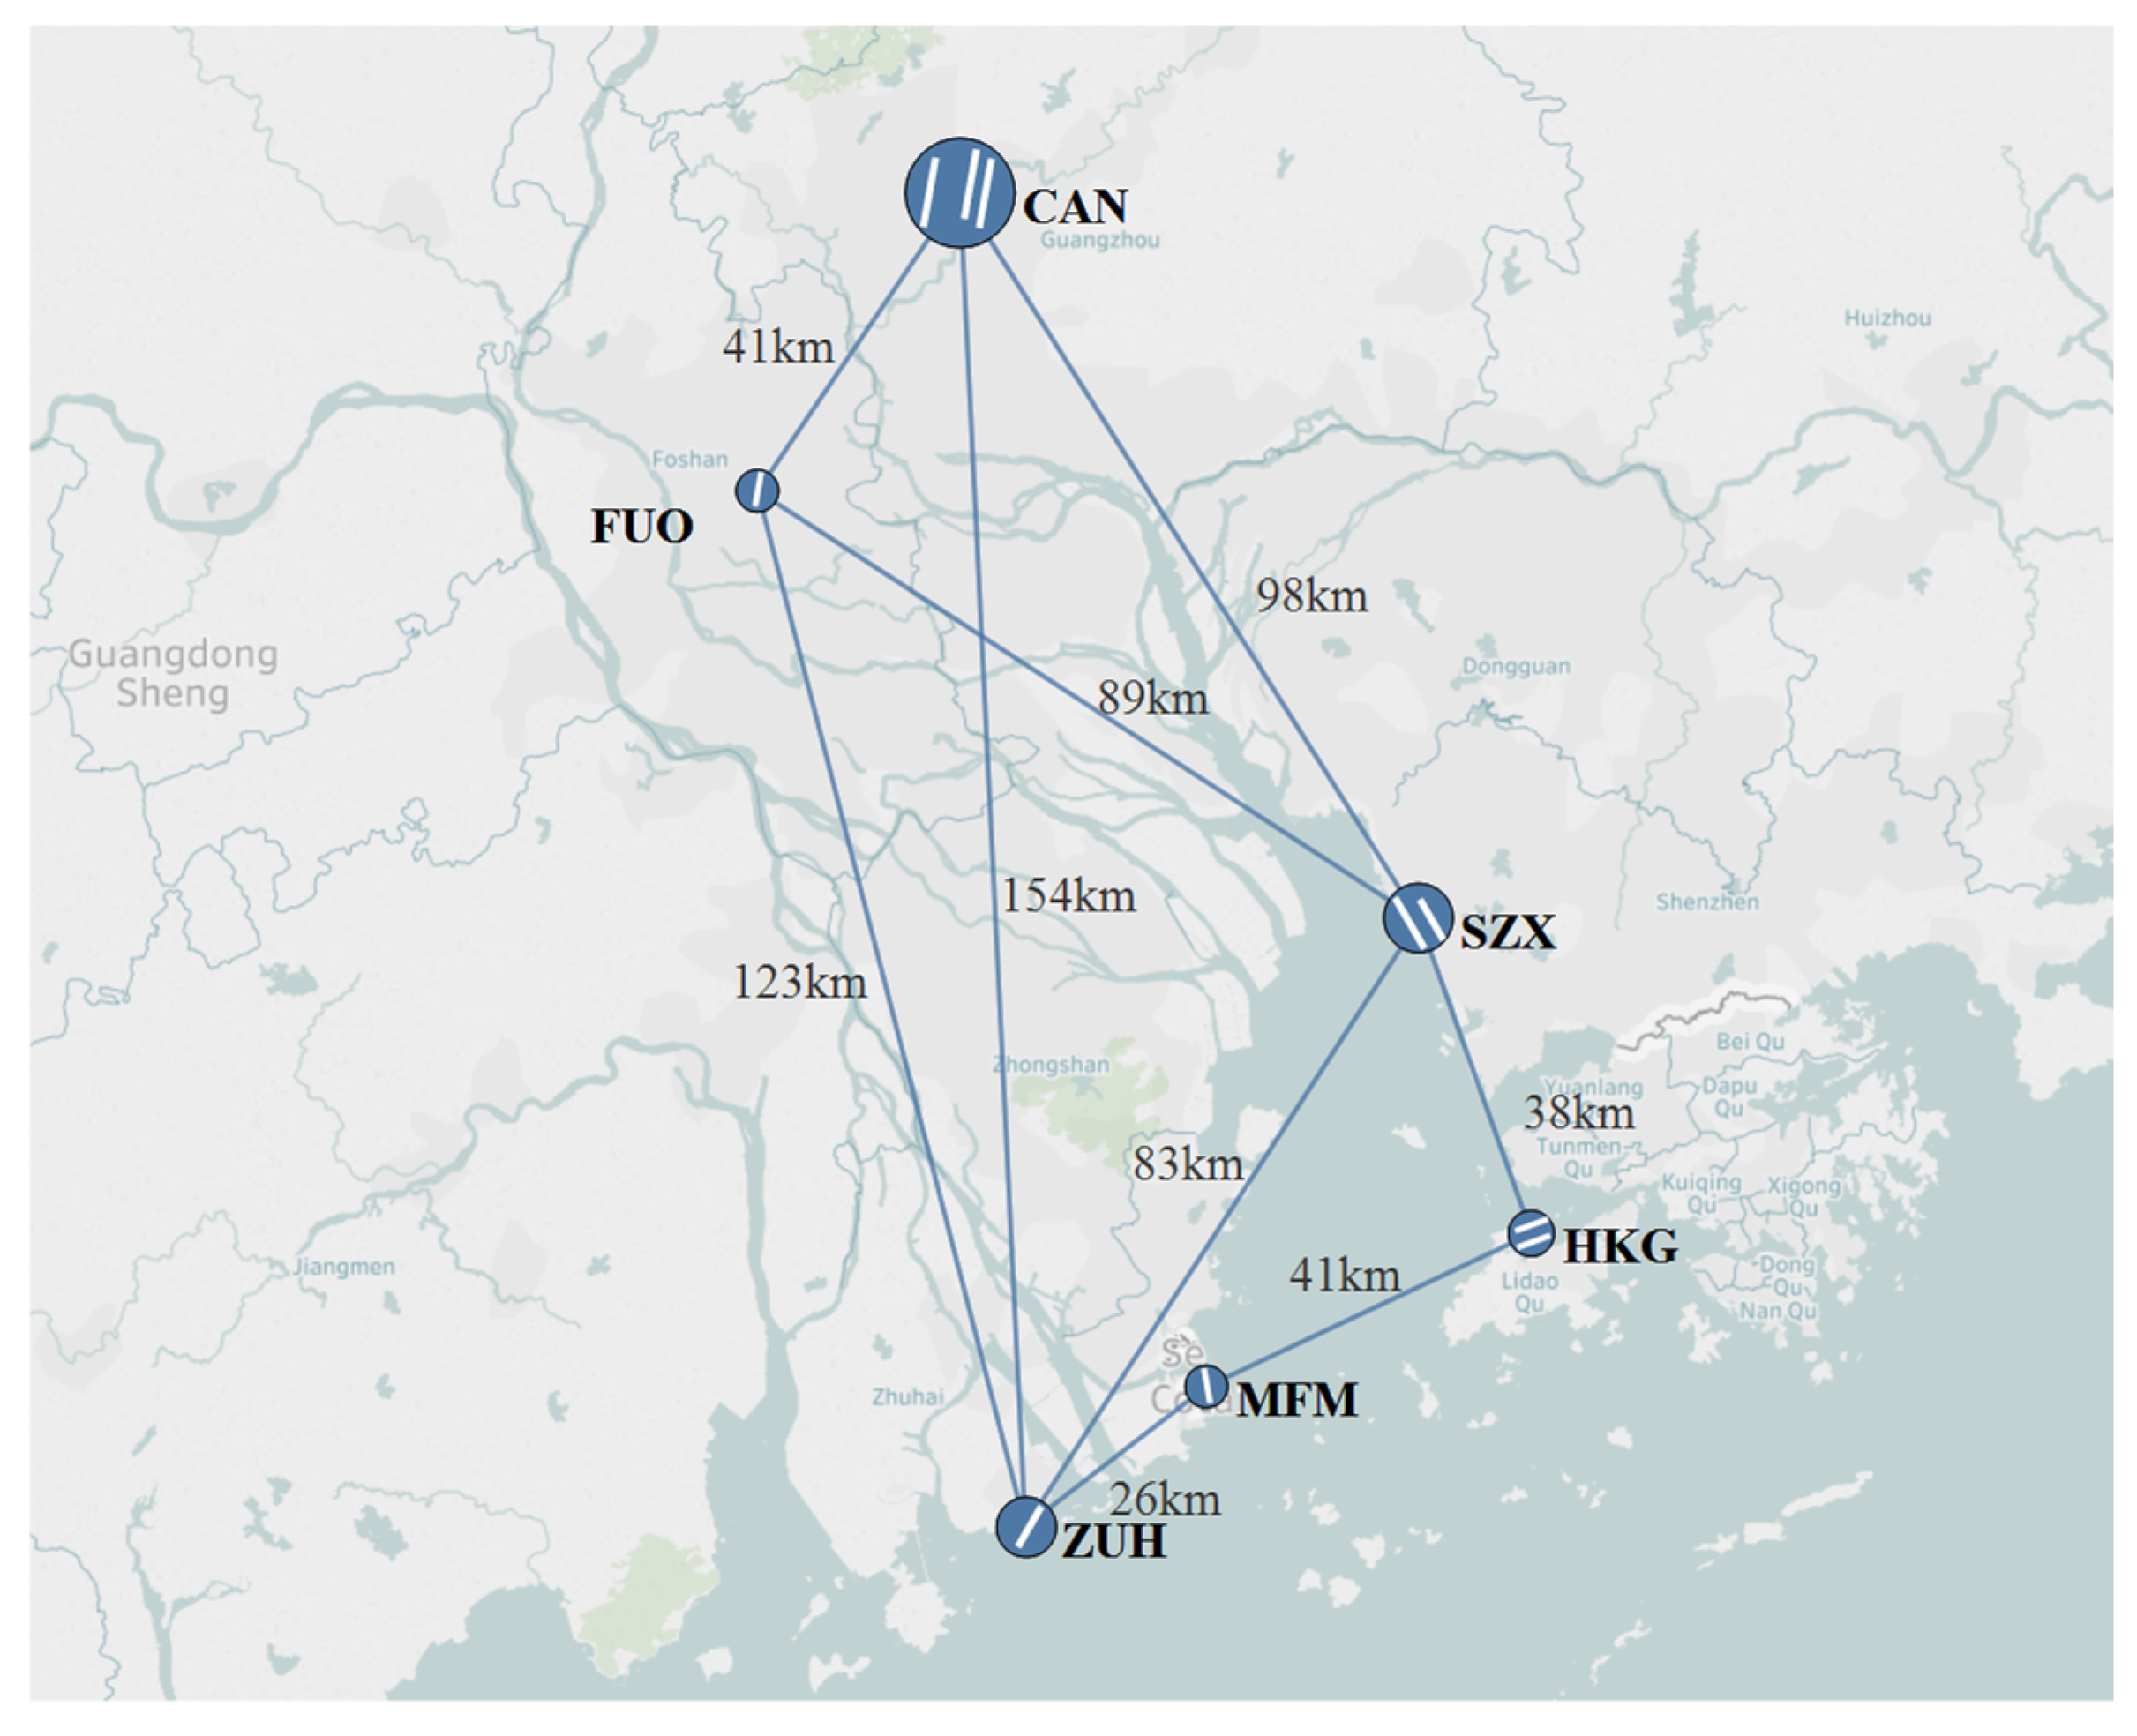
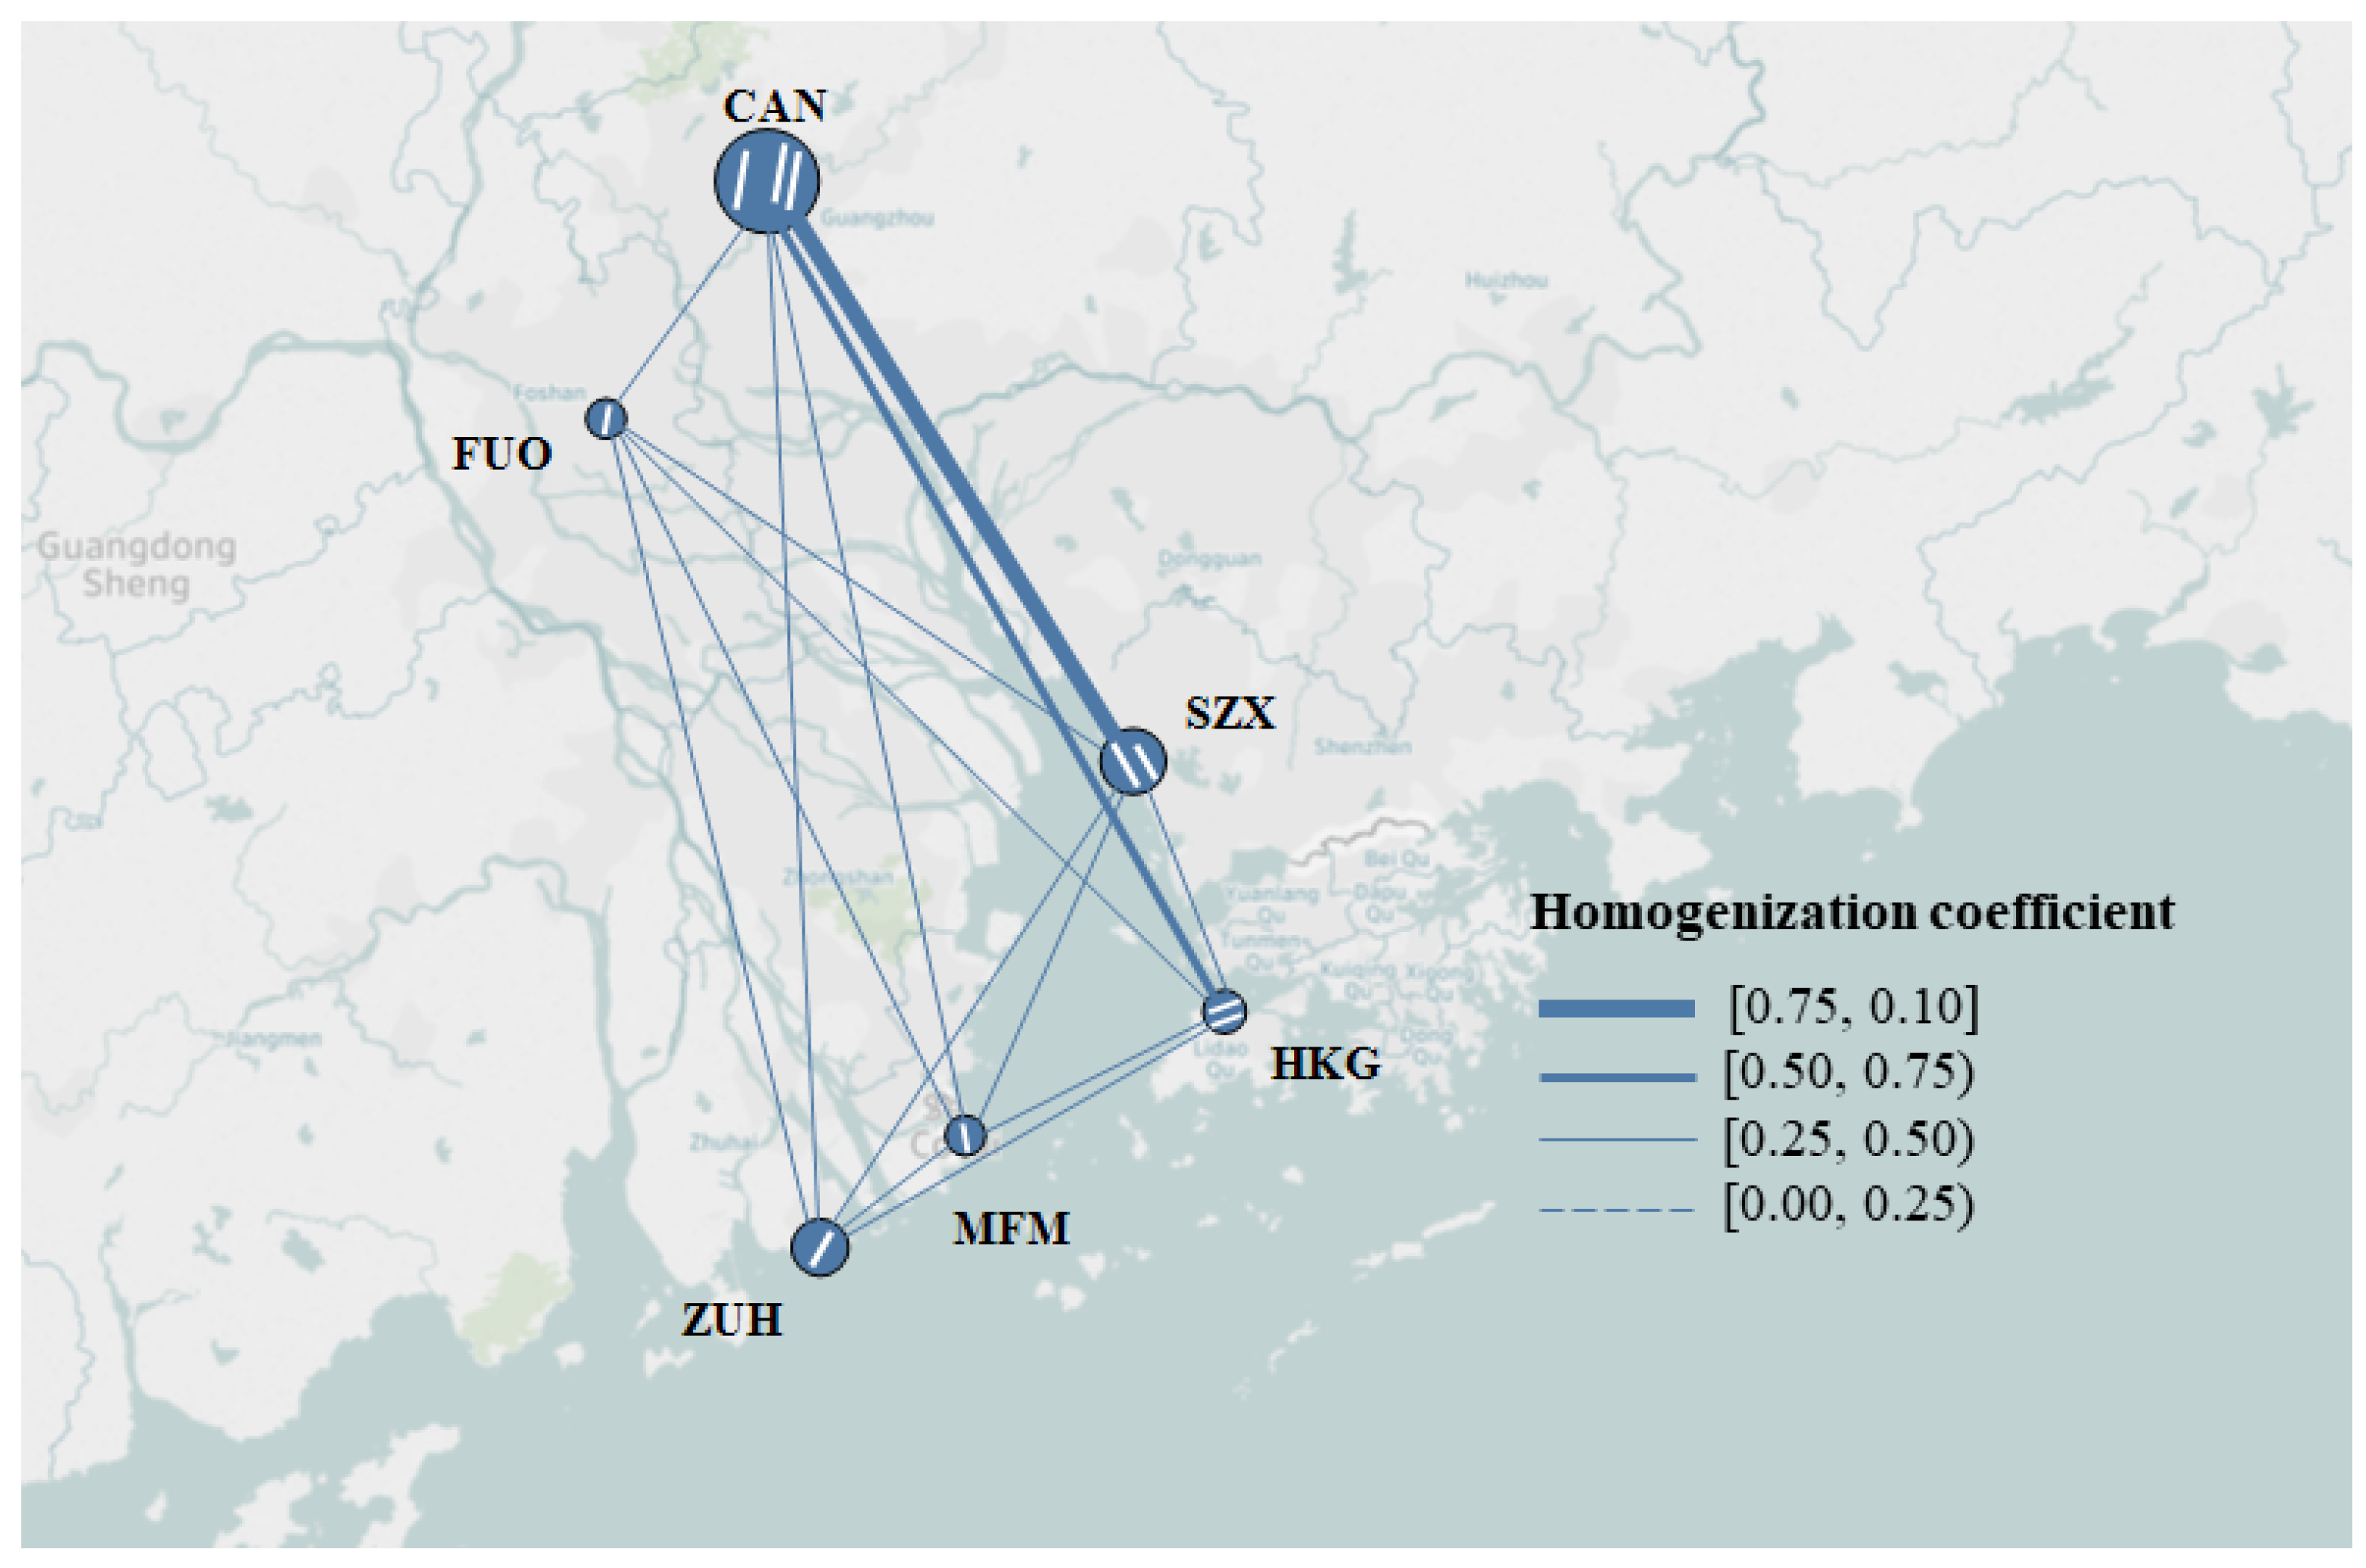
In the following, we introduce the three MARs that were analyzed. The first MAR is the MAR in the Guangdong-Hong Kong-Macao Greater Bay Area (referred to as the Greater Bay MAR). The Greater Bay Area is an important gateway for China’s opening to the outside world. It includes six major airports, Guangzhou Baiyun (CAN), Hong Kong Chek Lap Kok (HKG), Shenzhen Bao’an (SZX), Zhuhai Jinwan (ZUH), Macau (MFM), and Foshan Shadi (FUO). Among these airports, CAN, SZX, and HKG are positioned as international hub airports. HKG is currently the world’s largest air cargo airport. ZUH only serves domestic flights, while it complements the international and regional business of neighboring Macau Airport. Foshan Shadi Airport is mainly for military operations, and only China United Airlines currently operate there. The layout of the six airports in the Greater Bay Area and their respective straight-line distances are shown in
Figure 3.
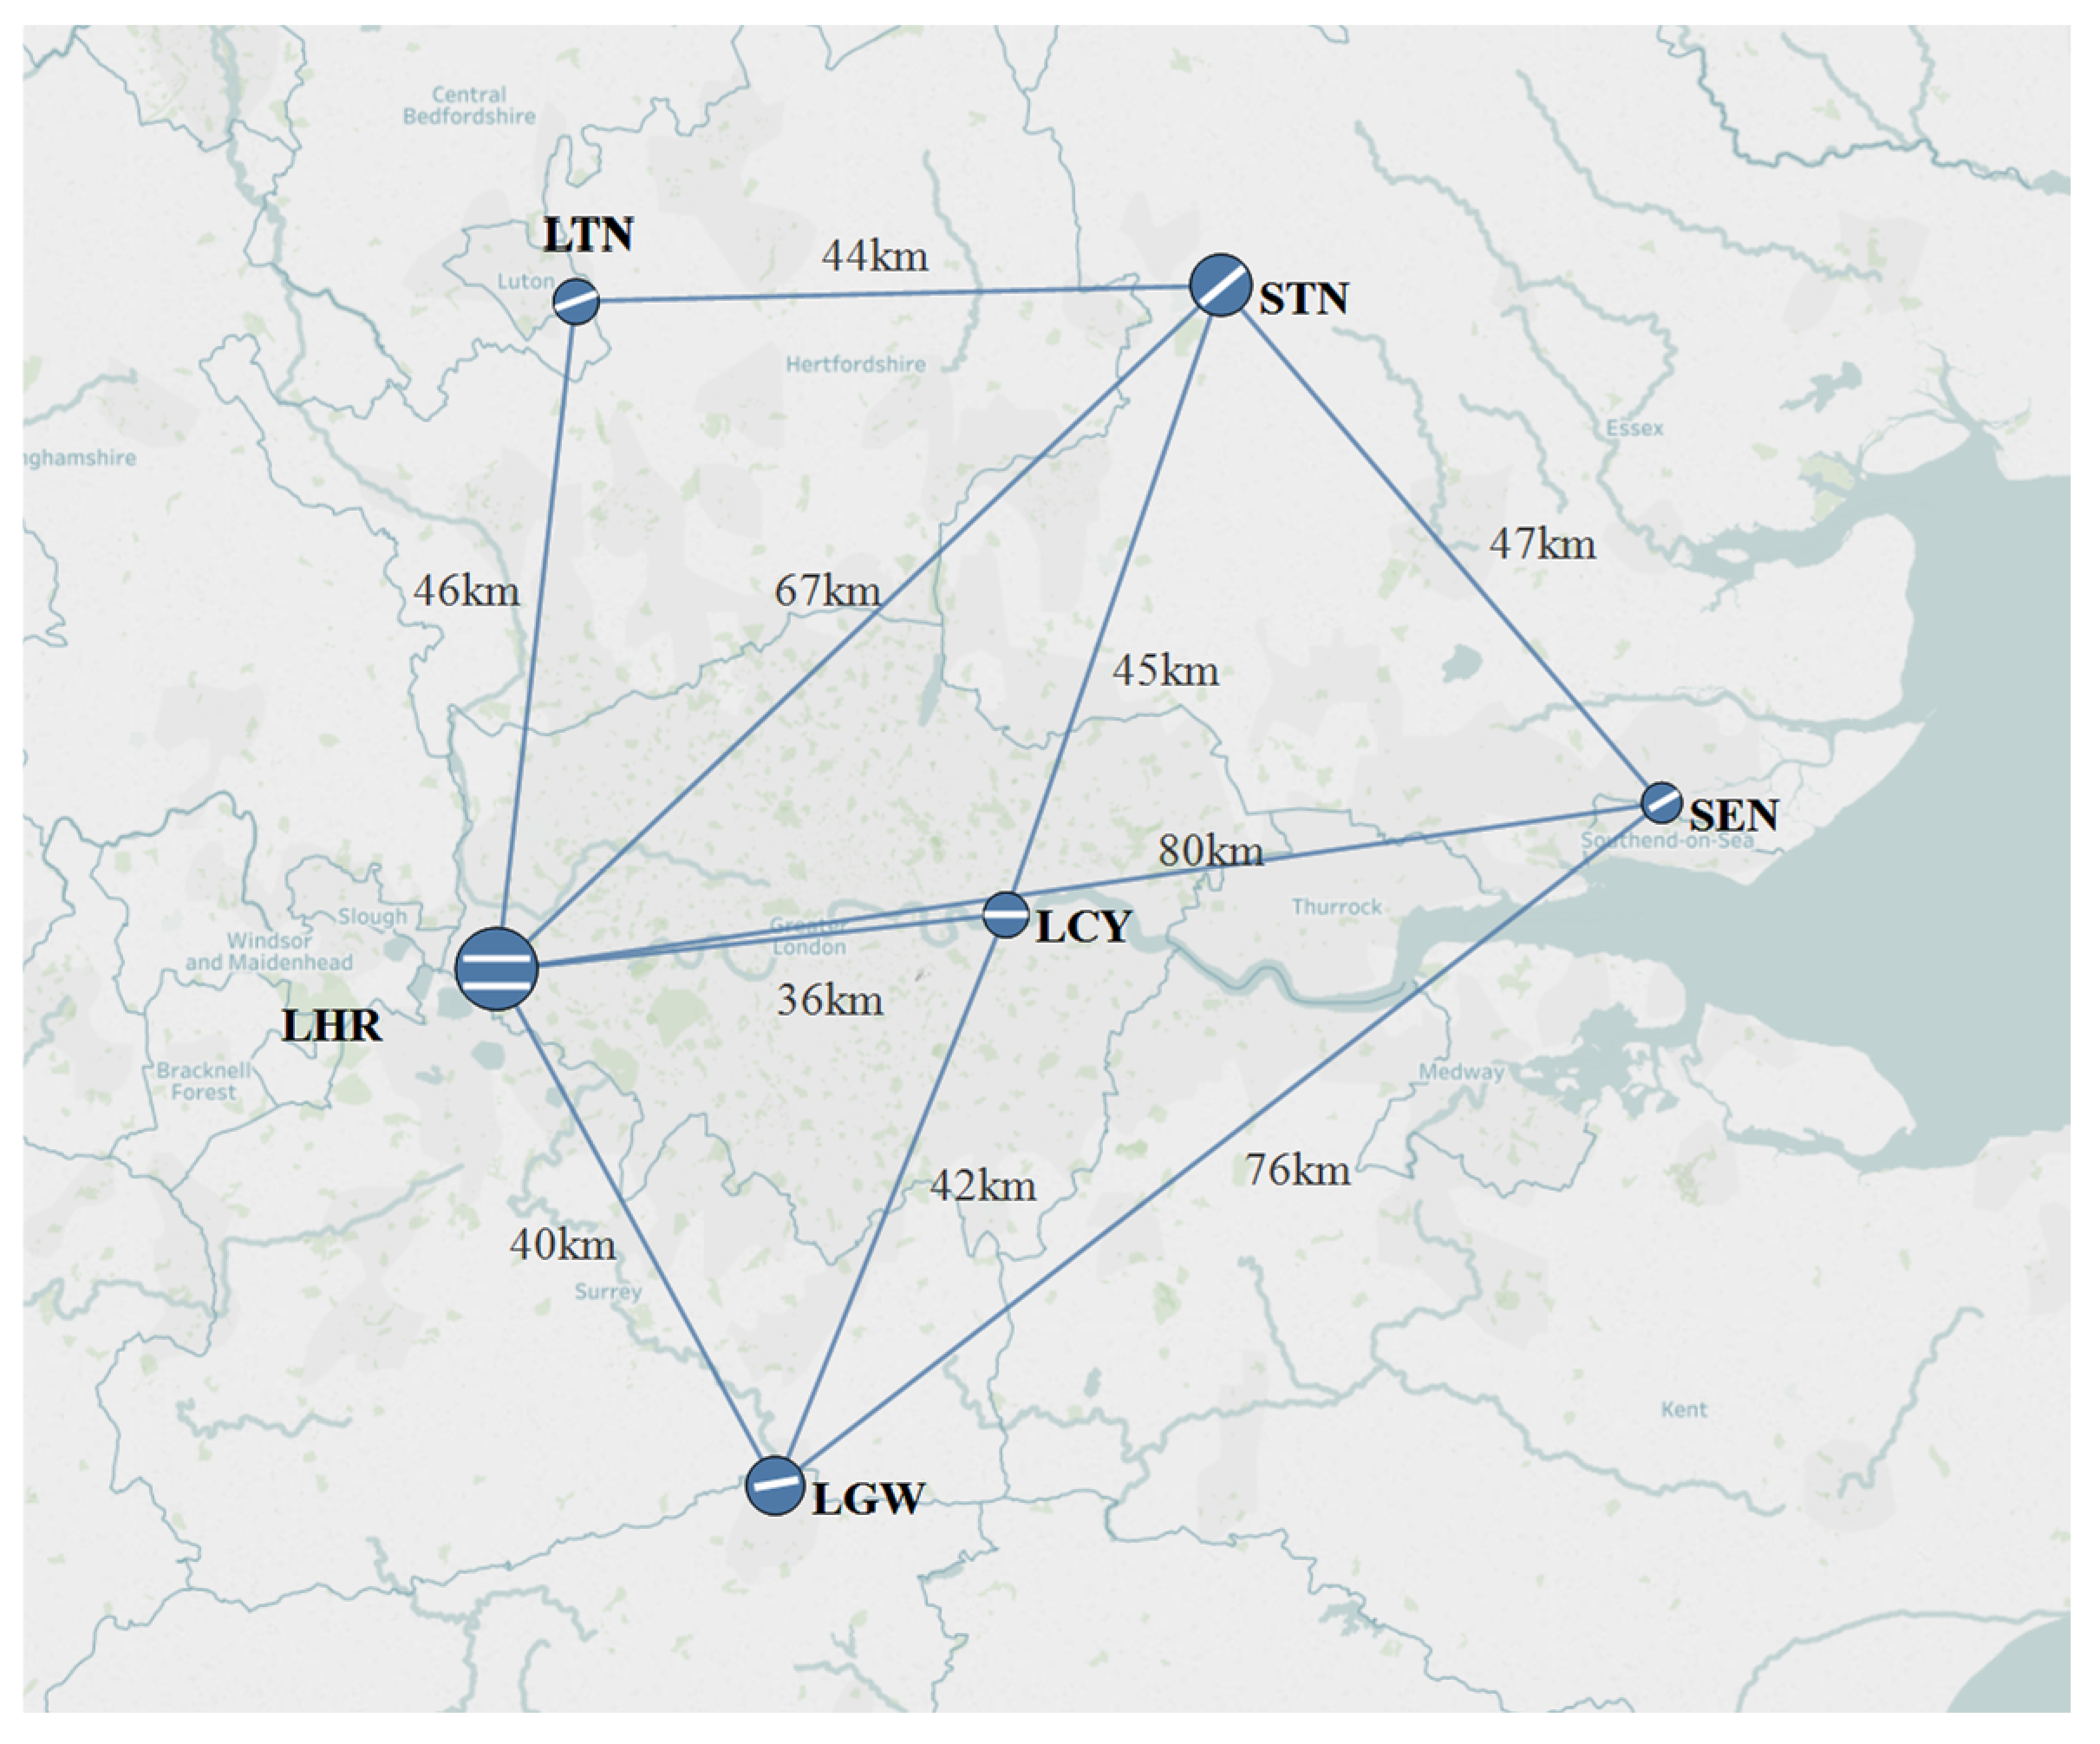
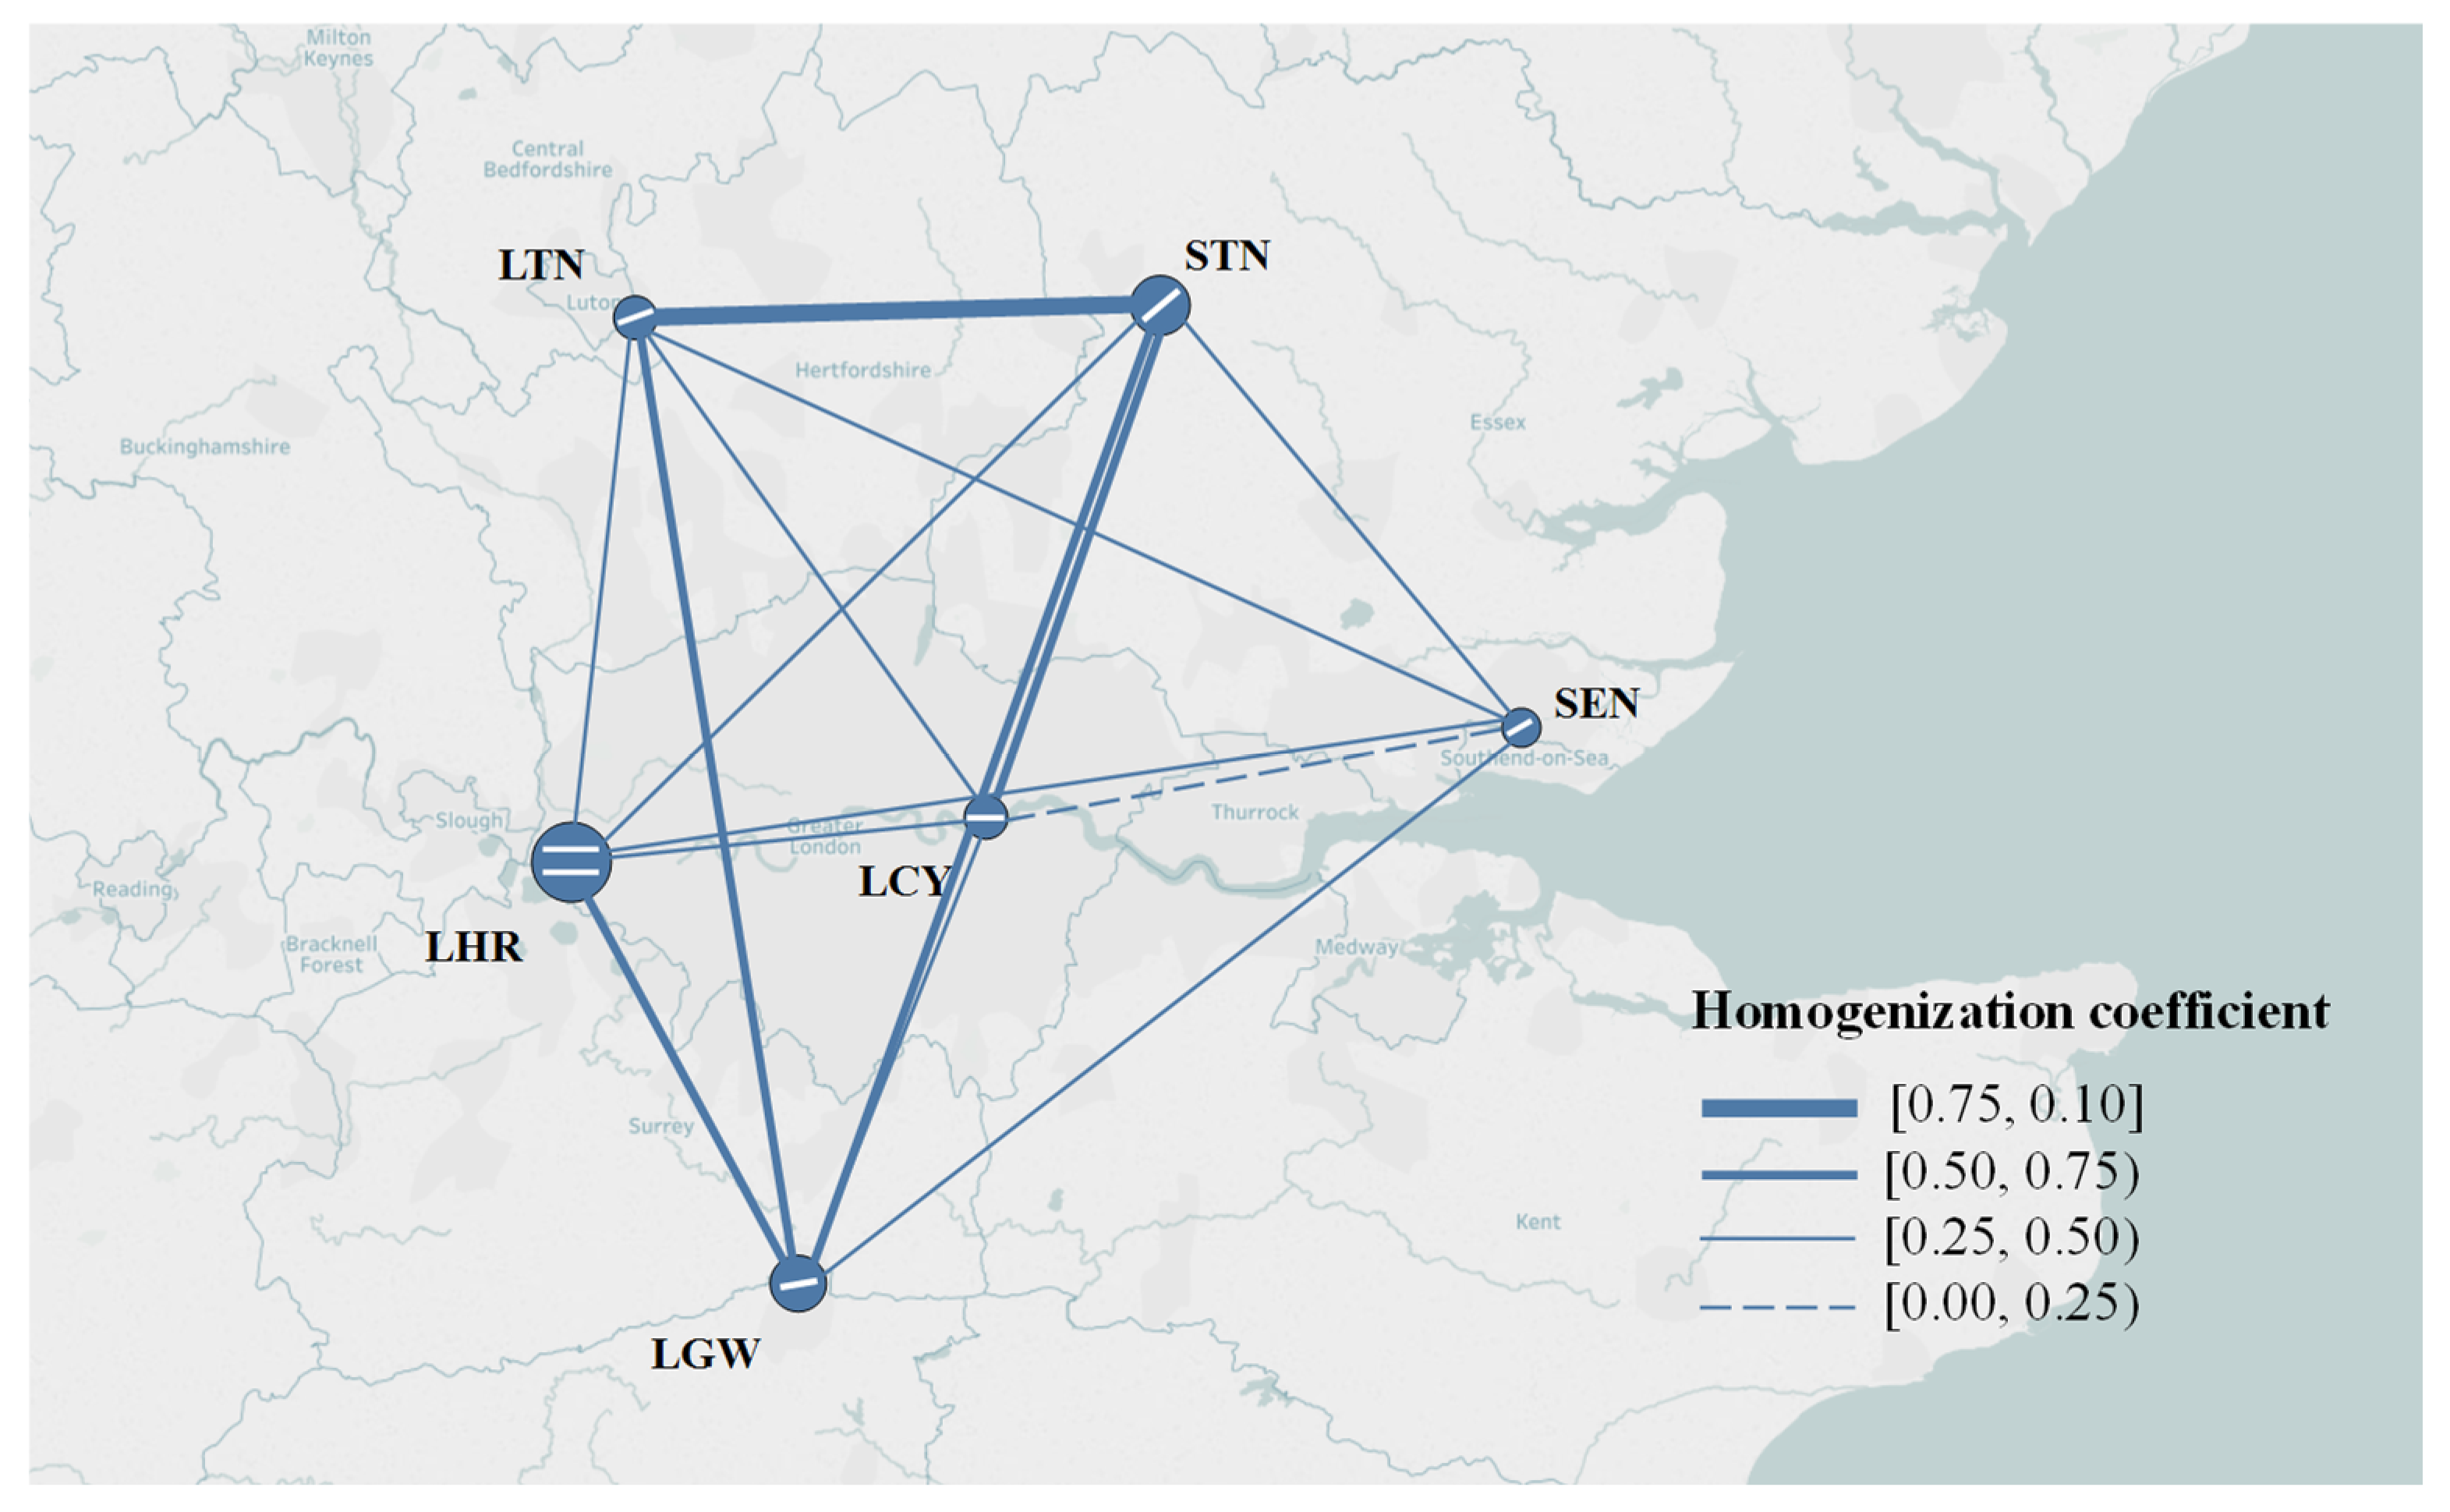
The second MAR is London MAR. As the world’s most important financial center, the multi-airport system in London includes major airports such as Heathrow (LHR), Gatwick (LGW), London City (LCY), London Luton (LTN), London Stansted (STN), as well as small community airports such as London Southend (SEN). In addition, there are more than ten small airports such as Farnborough, Cambridge Airport, and Brighton. These small airports mainly serve business jets, private jets, aviation training, scientific research and teaching, and aspects of general aviation. LHR is well known as an international hub in Europe, and it is the main operating base for full-service airlines including British Airways and Virgin Atlantic; STN, LGW, and LTN are the bases for Ryanair and EasyJet respectively. The main operating base of low-cost airlines such as Wizz, mainly operating short and medium-haul routes covering secondary markets in Europe, the Middle East, and North Africa, SEN is also mainly served by low-cost airlines and regional airlines; LCY currently mainly serves advanced business airlines. The layout of the airports and their geographical relationships in the London MAR are shown in
Figure 4.
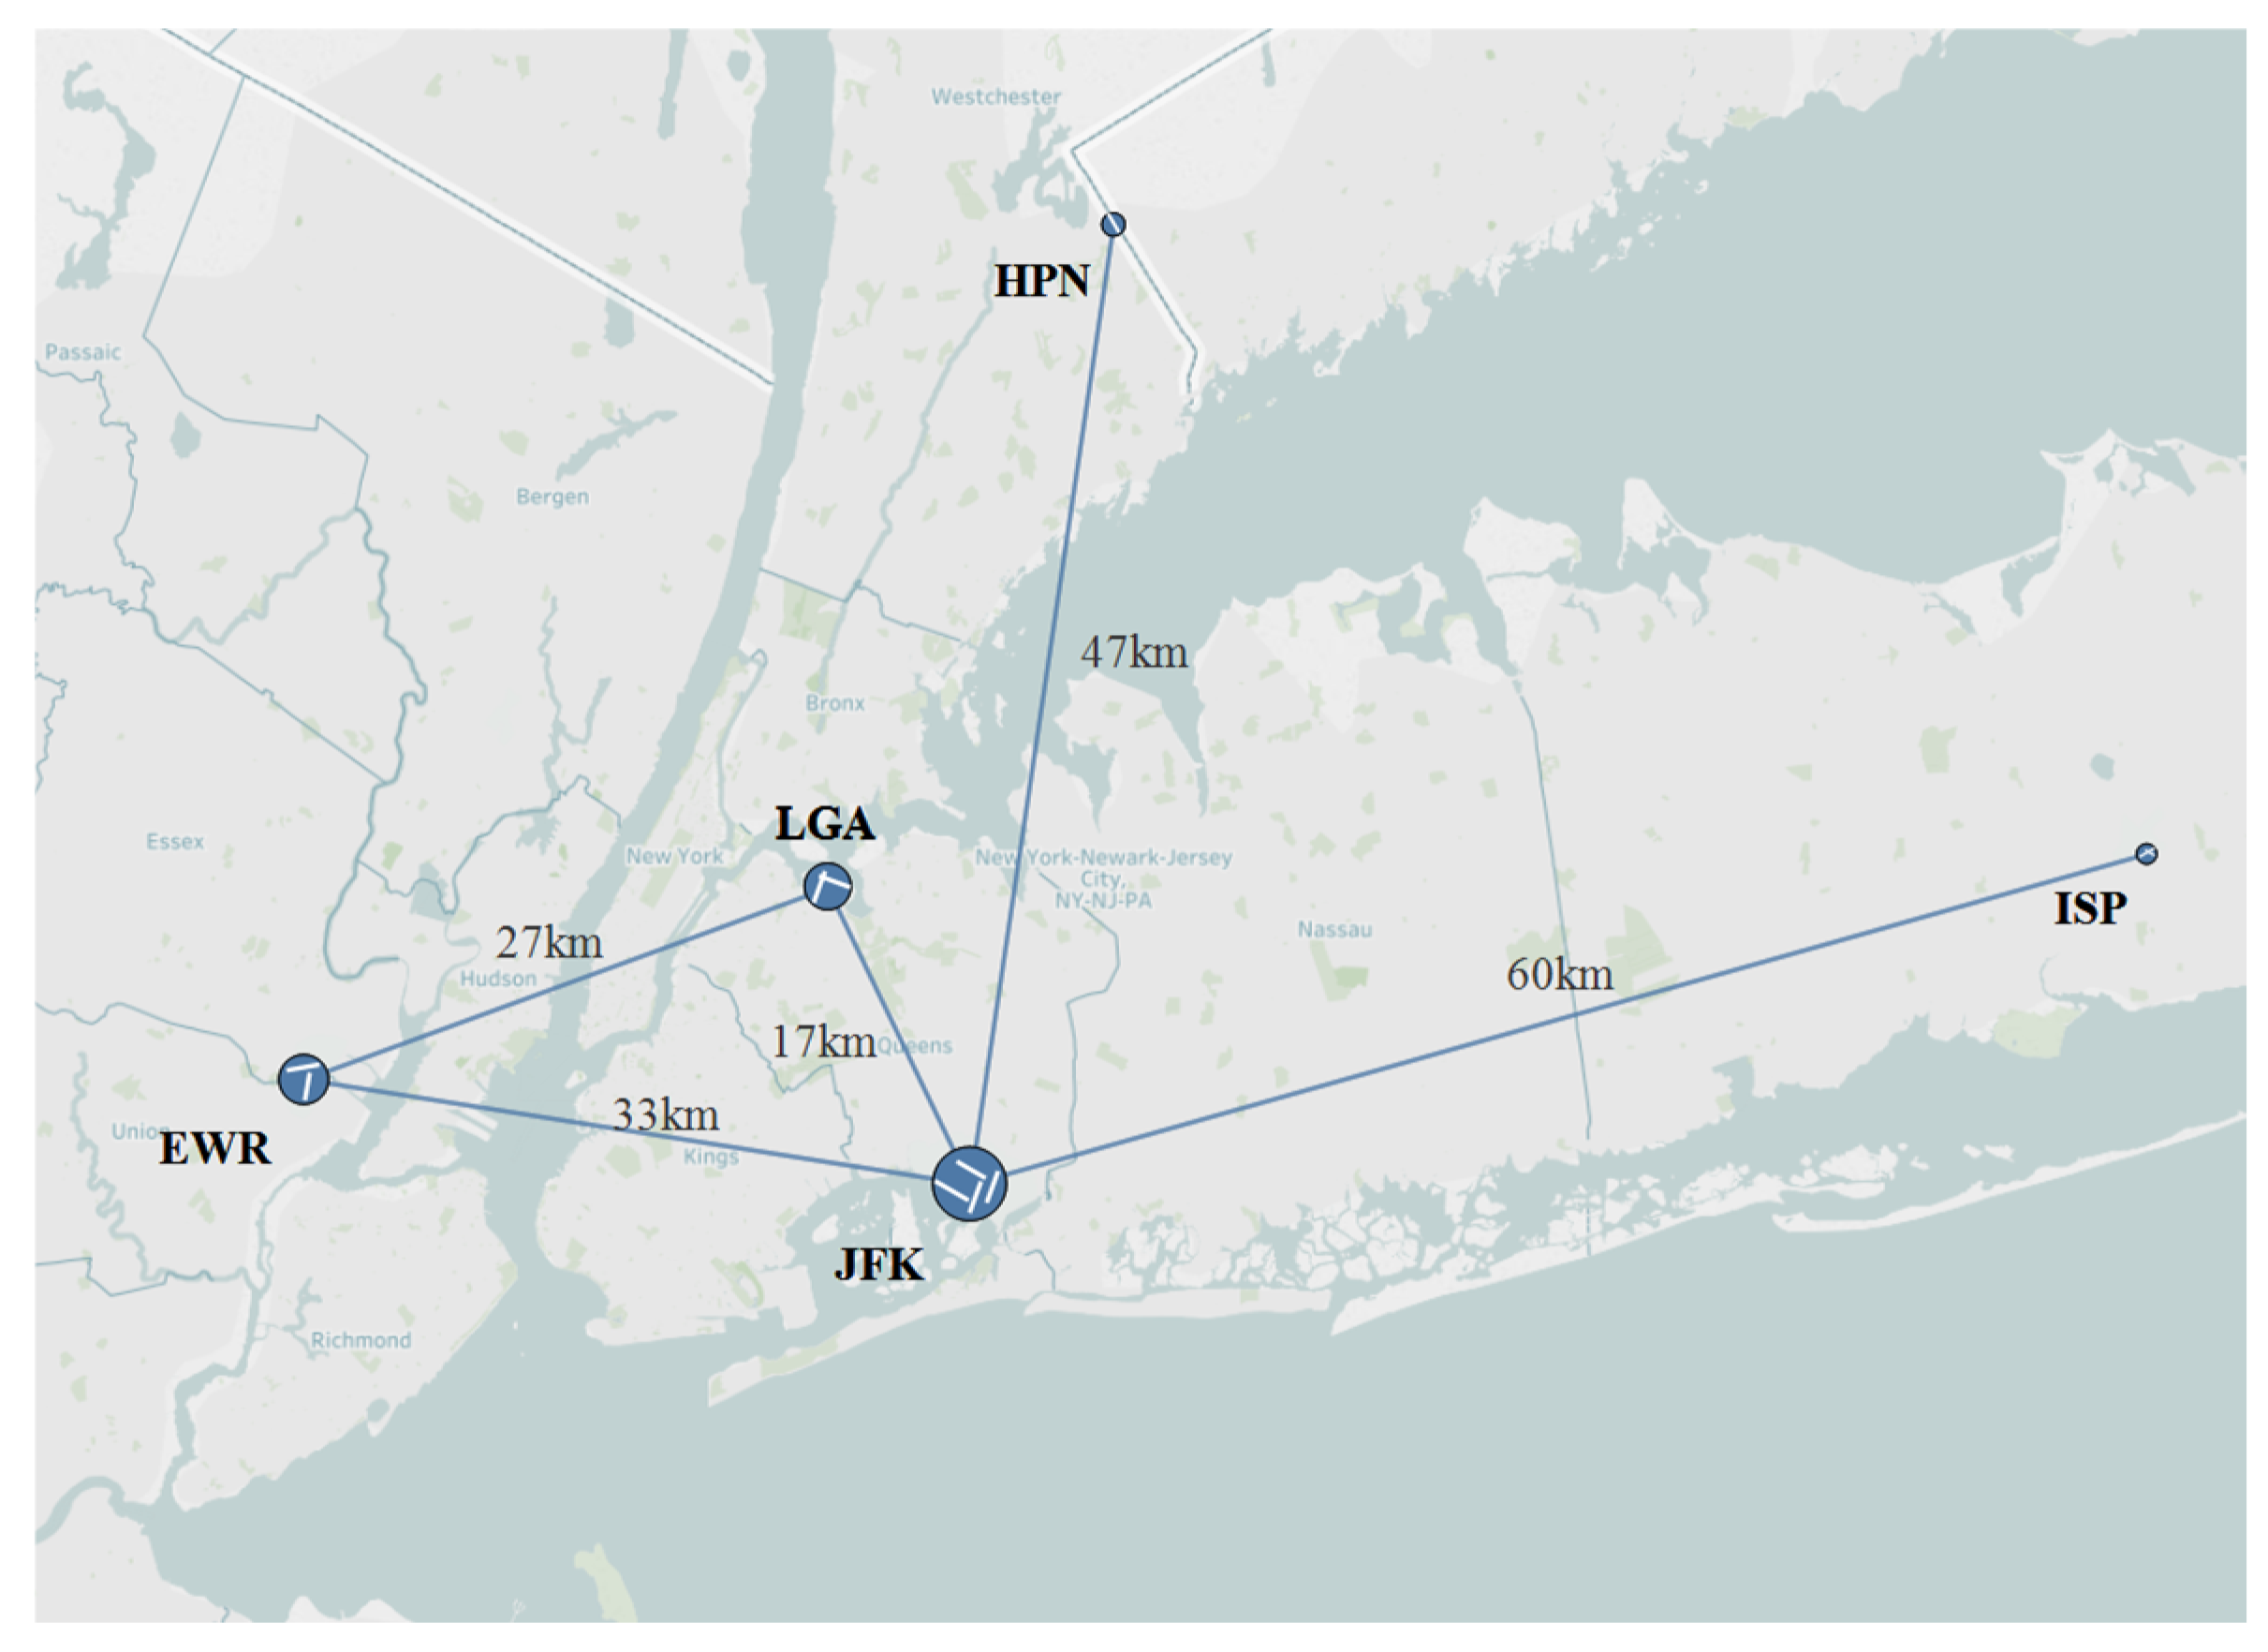
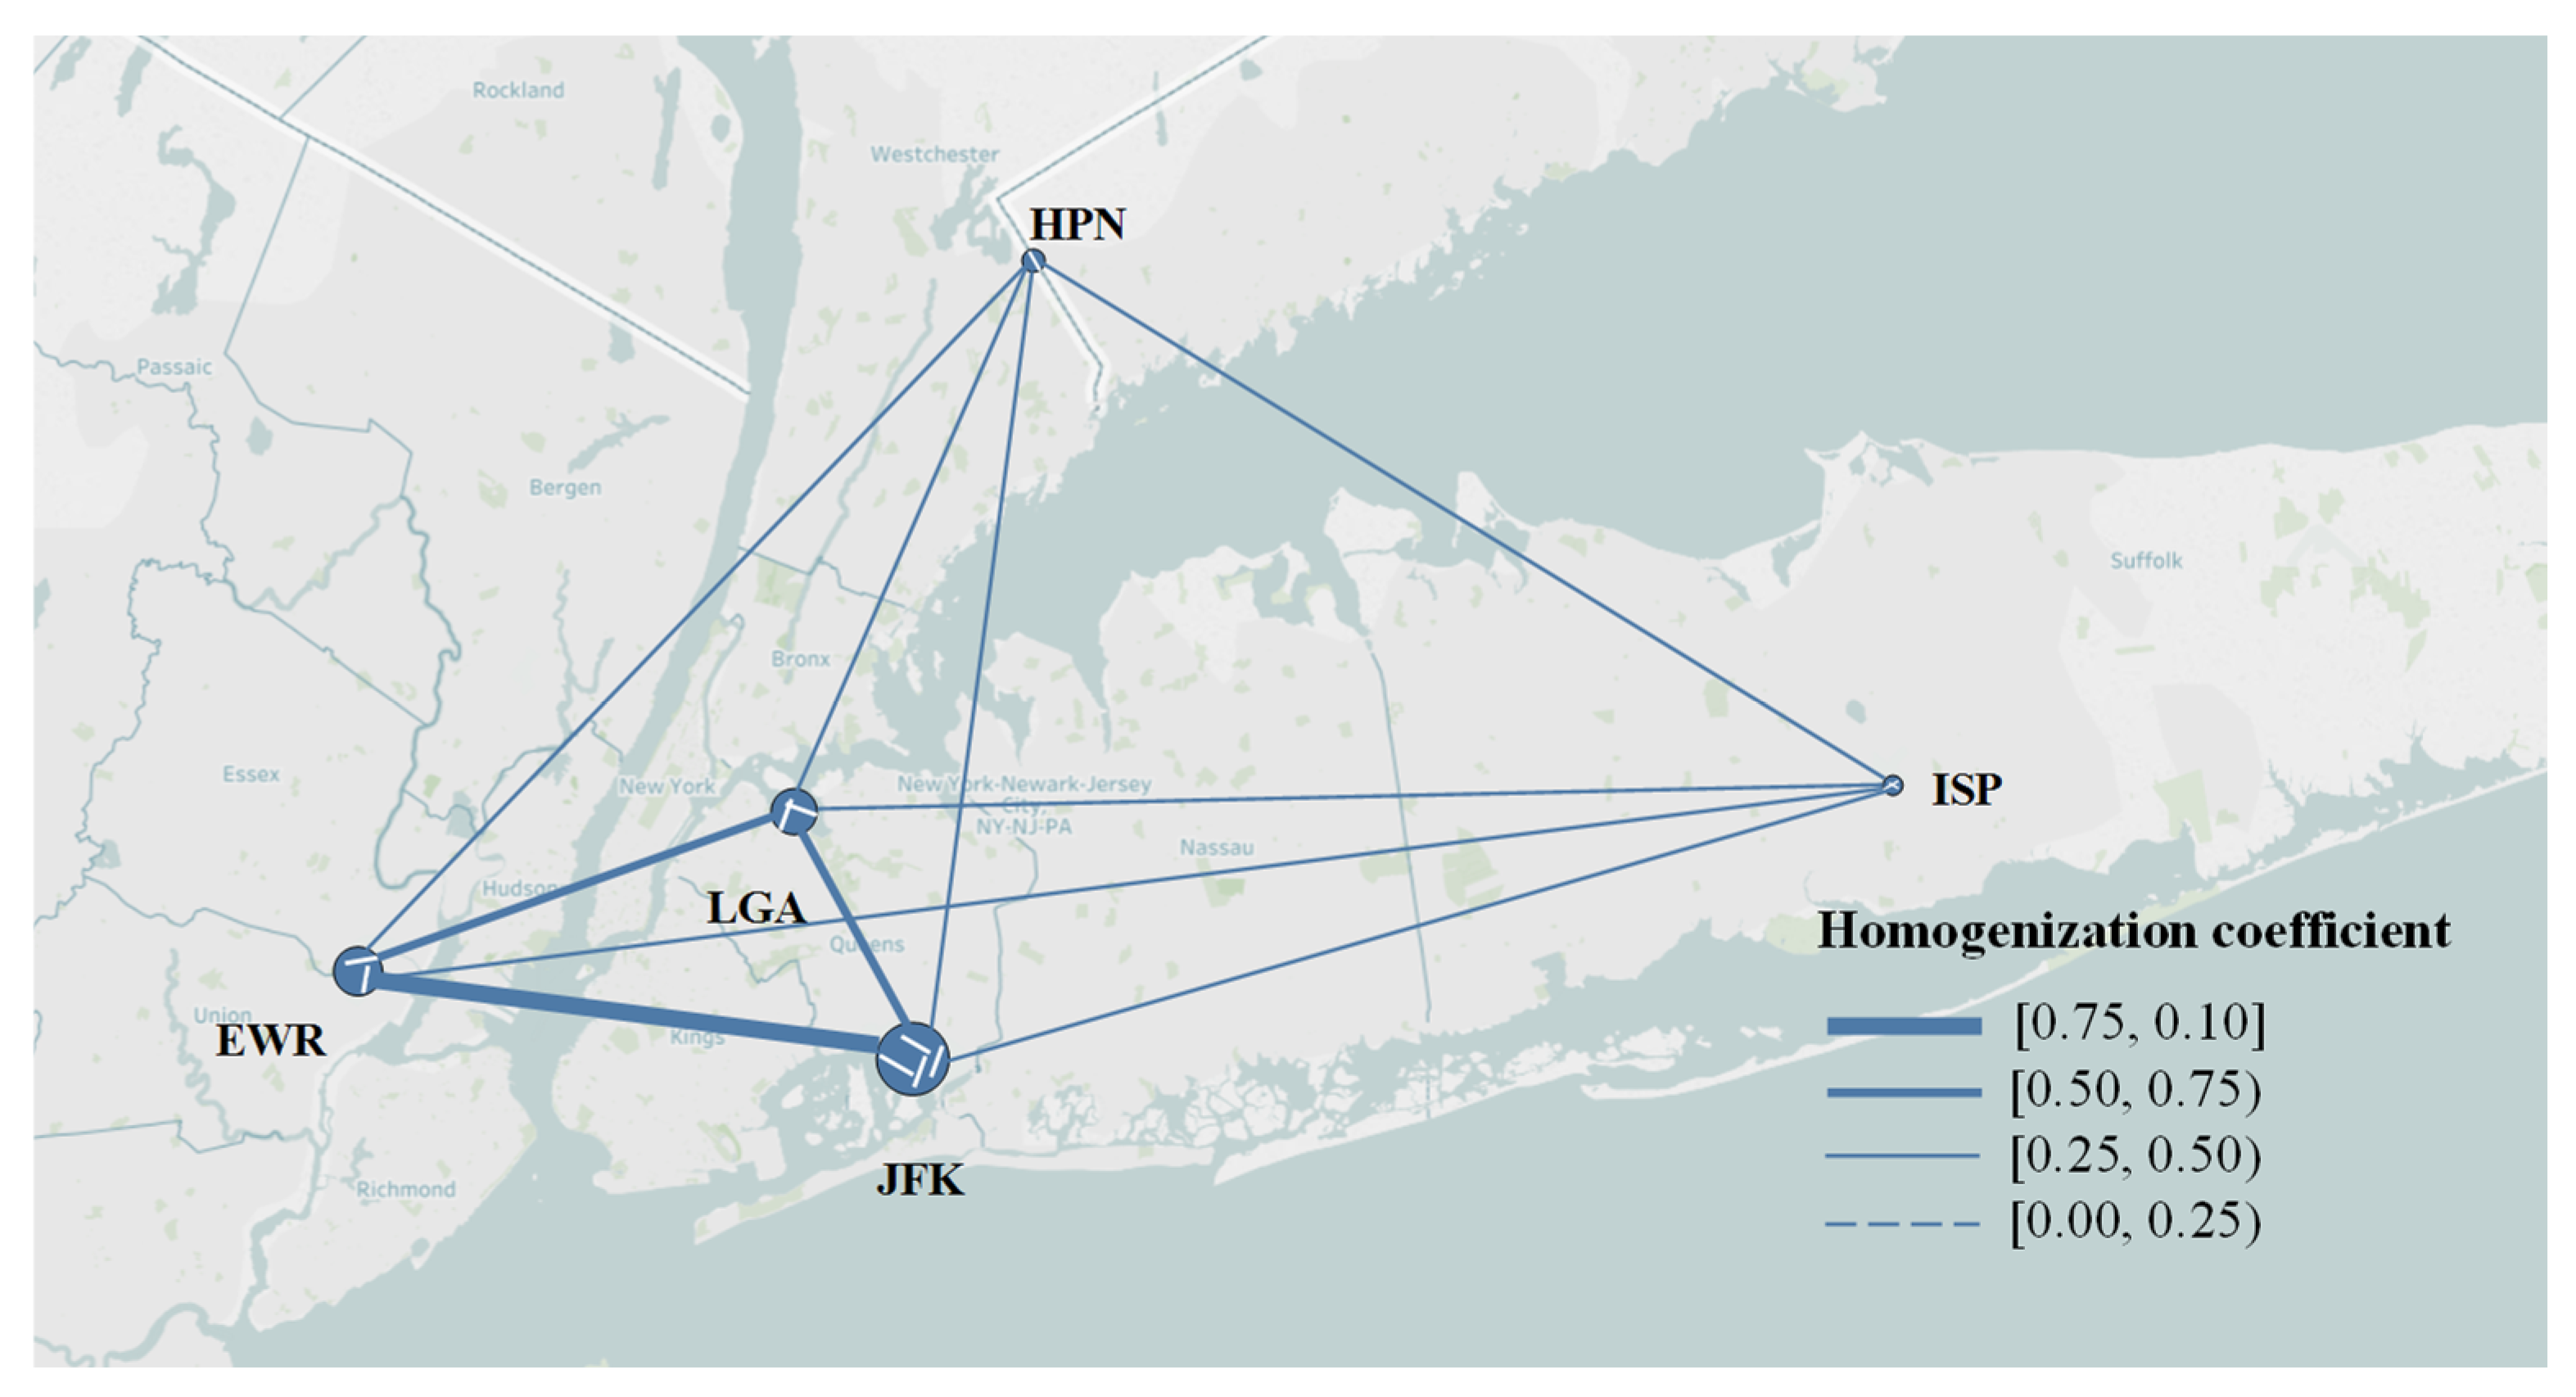
The third MAR is the New York MAR, which is the largest metropolitan area in the United States. The New York MAR includes John F. Kennedy Airport (JFK) and LaGuardia (LGA) in New York City, as well as large international hub airport Newark Liberty (EWR), two small transport airports Westchester County (HPN) and MacArthur (ISP), and more than ten business jets and general aviation airports. The layout of the airports and their geographical relationships are shown in
Figure 5.
5.2. Indicator Weight Analysis
The normalization method was used for dimensionless processing in the first layer. Maximum and minimum normalization was employed, as shown in Formula (8):
When the data was normalized, the Critic method [
30] was applied to calculate weights. The objective weights of the indicators of the three MARs are shown in
Table 1.
The Delphi method [
31] is used to weight the homogenization matrix of BF, IS, OE, RN and BS of the MAR in the second layer. Combined with multiple expert opinions, the homogenization level of RN was regarded as a more important factor affecting the final homogenization. Therefore, the weight ratio given to BF, IS, OE, RN, and BS in the comprehensive homogenization matrix was 3:3:3:4:3.
5.3. Results
Based on the indicator weights in
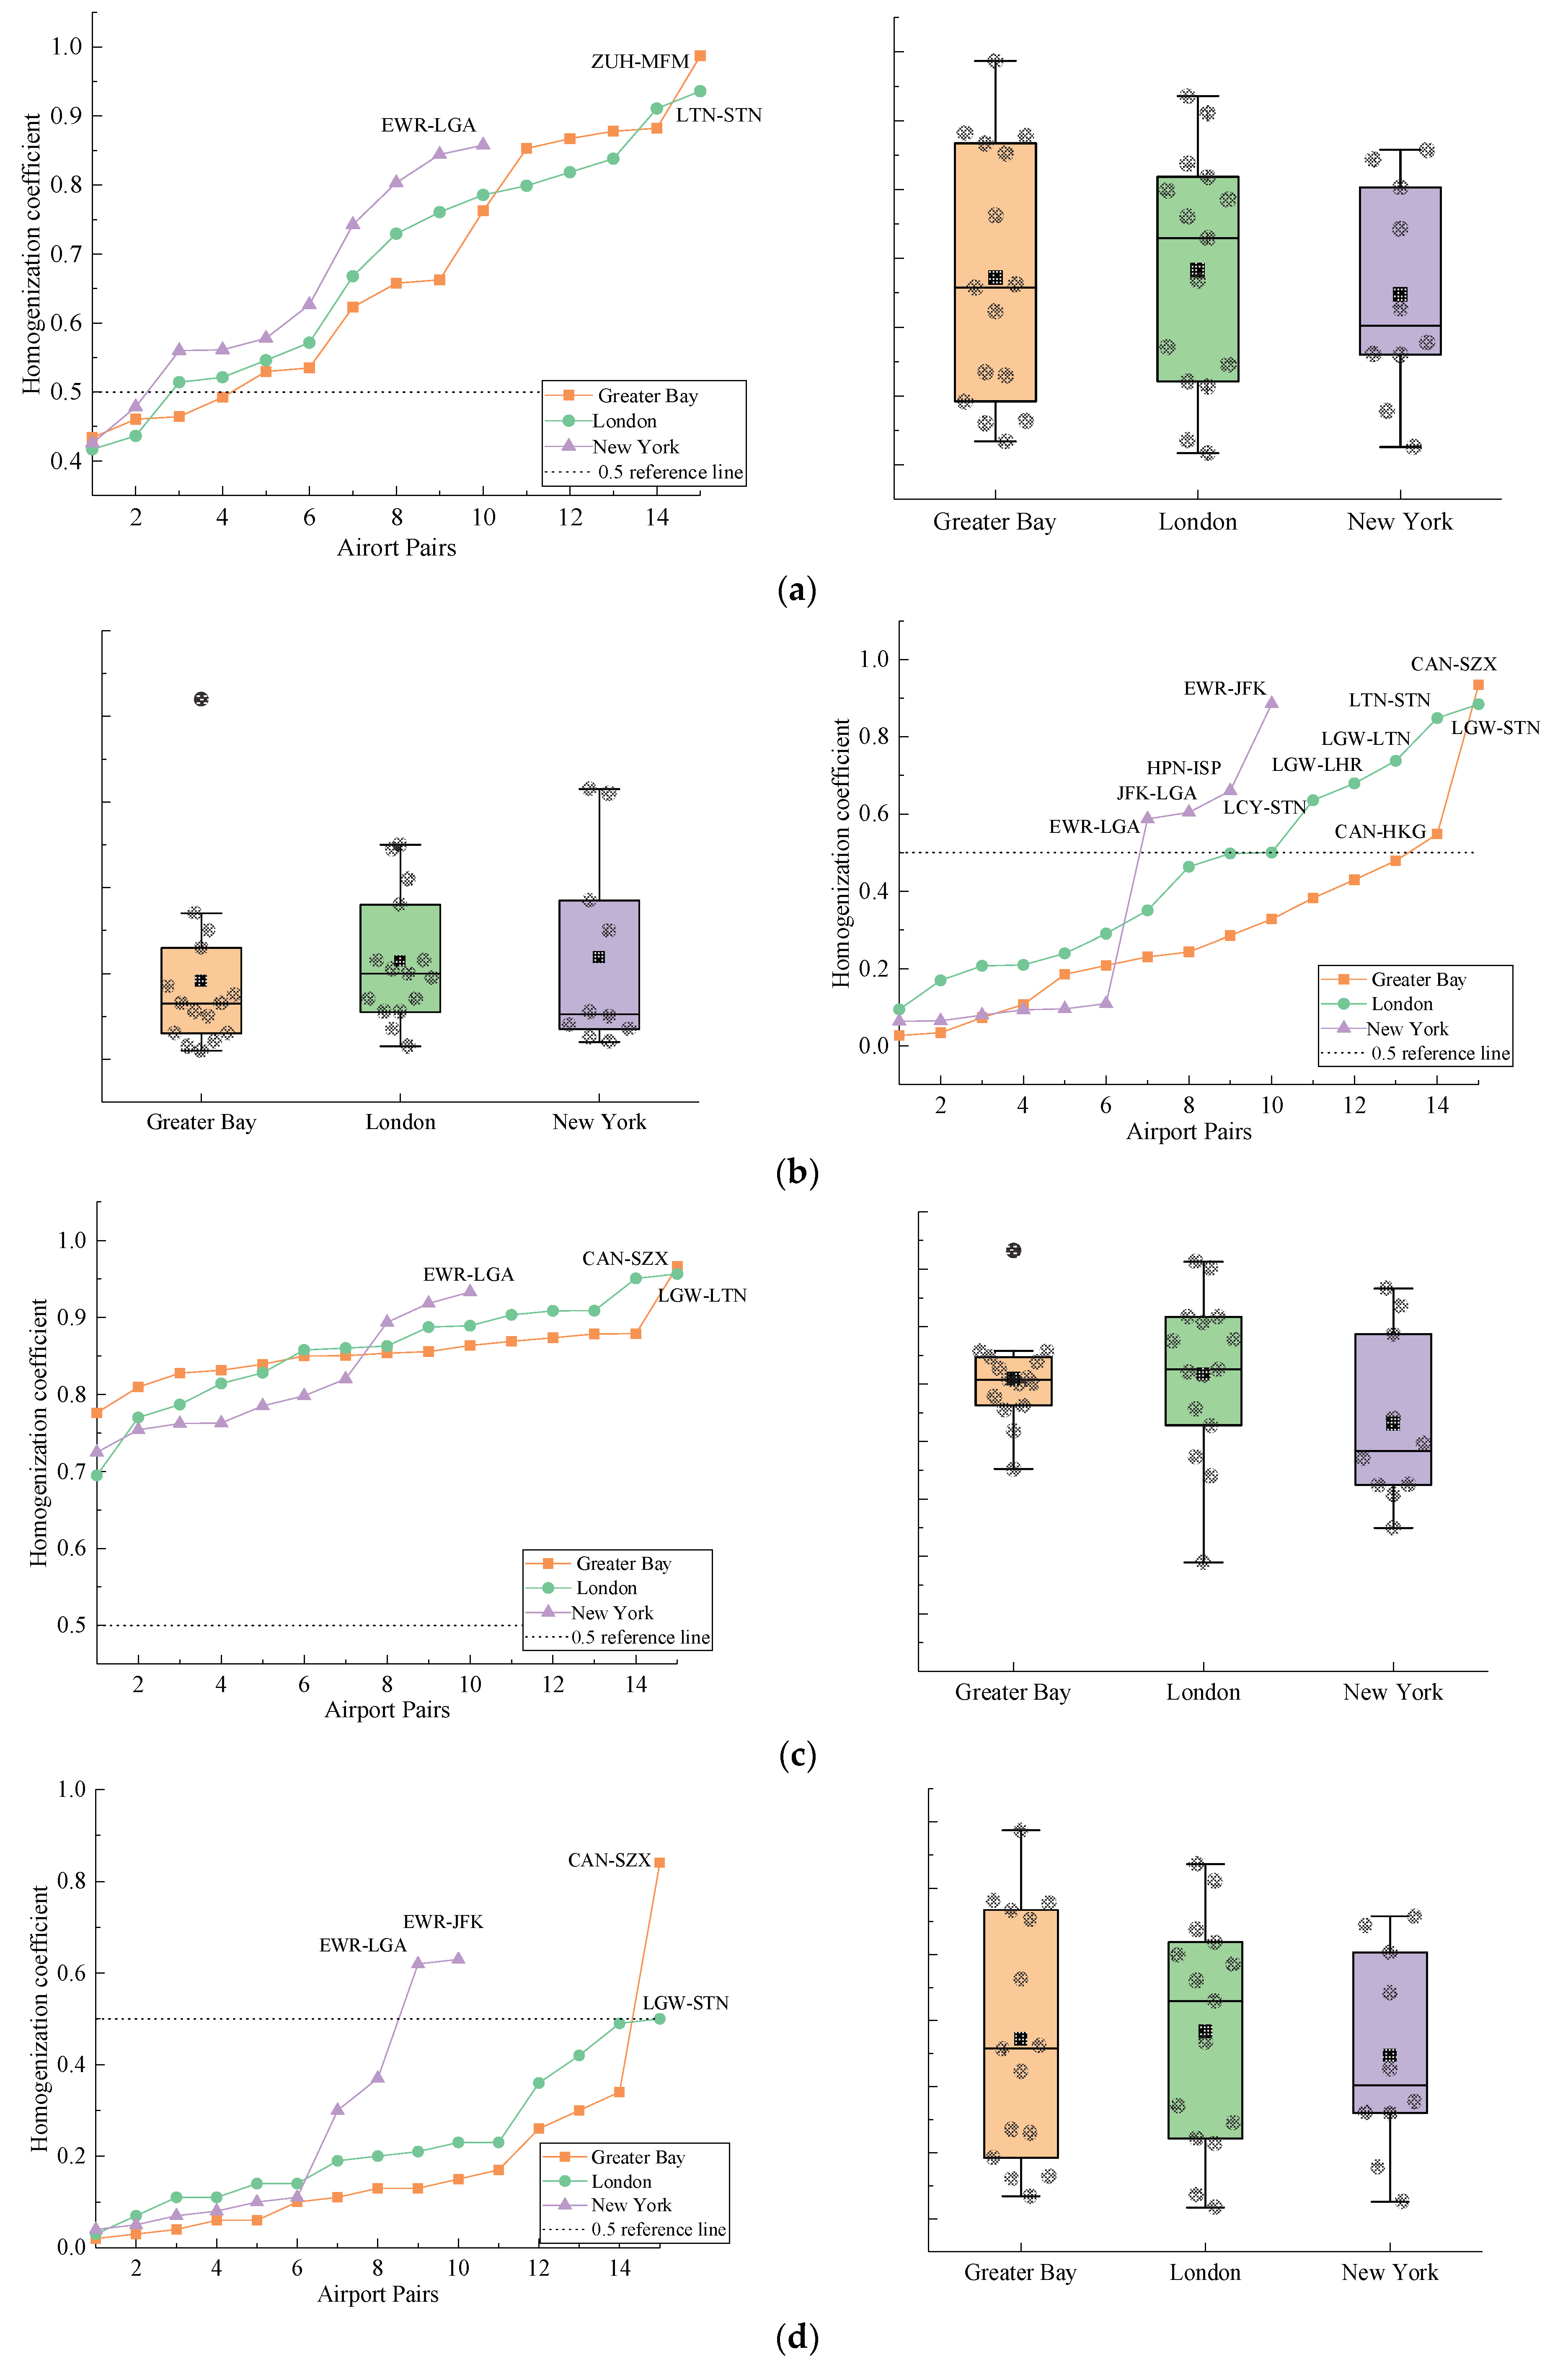
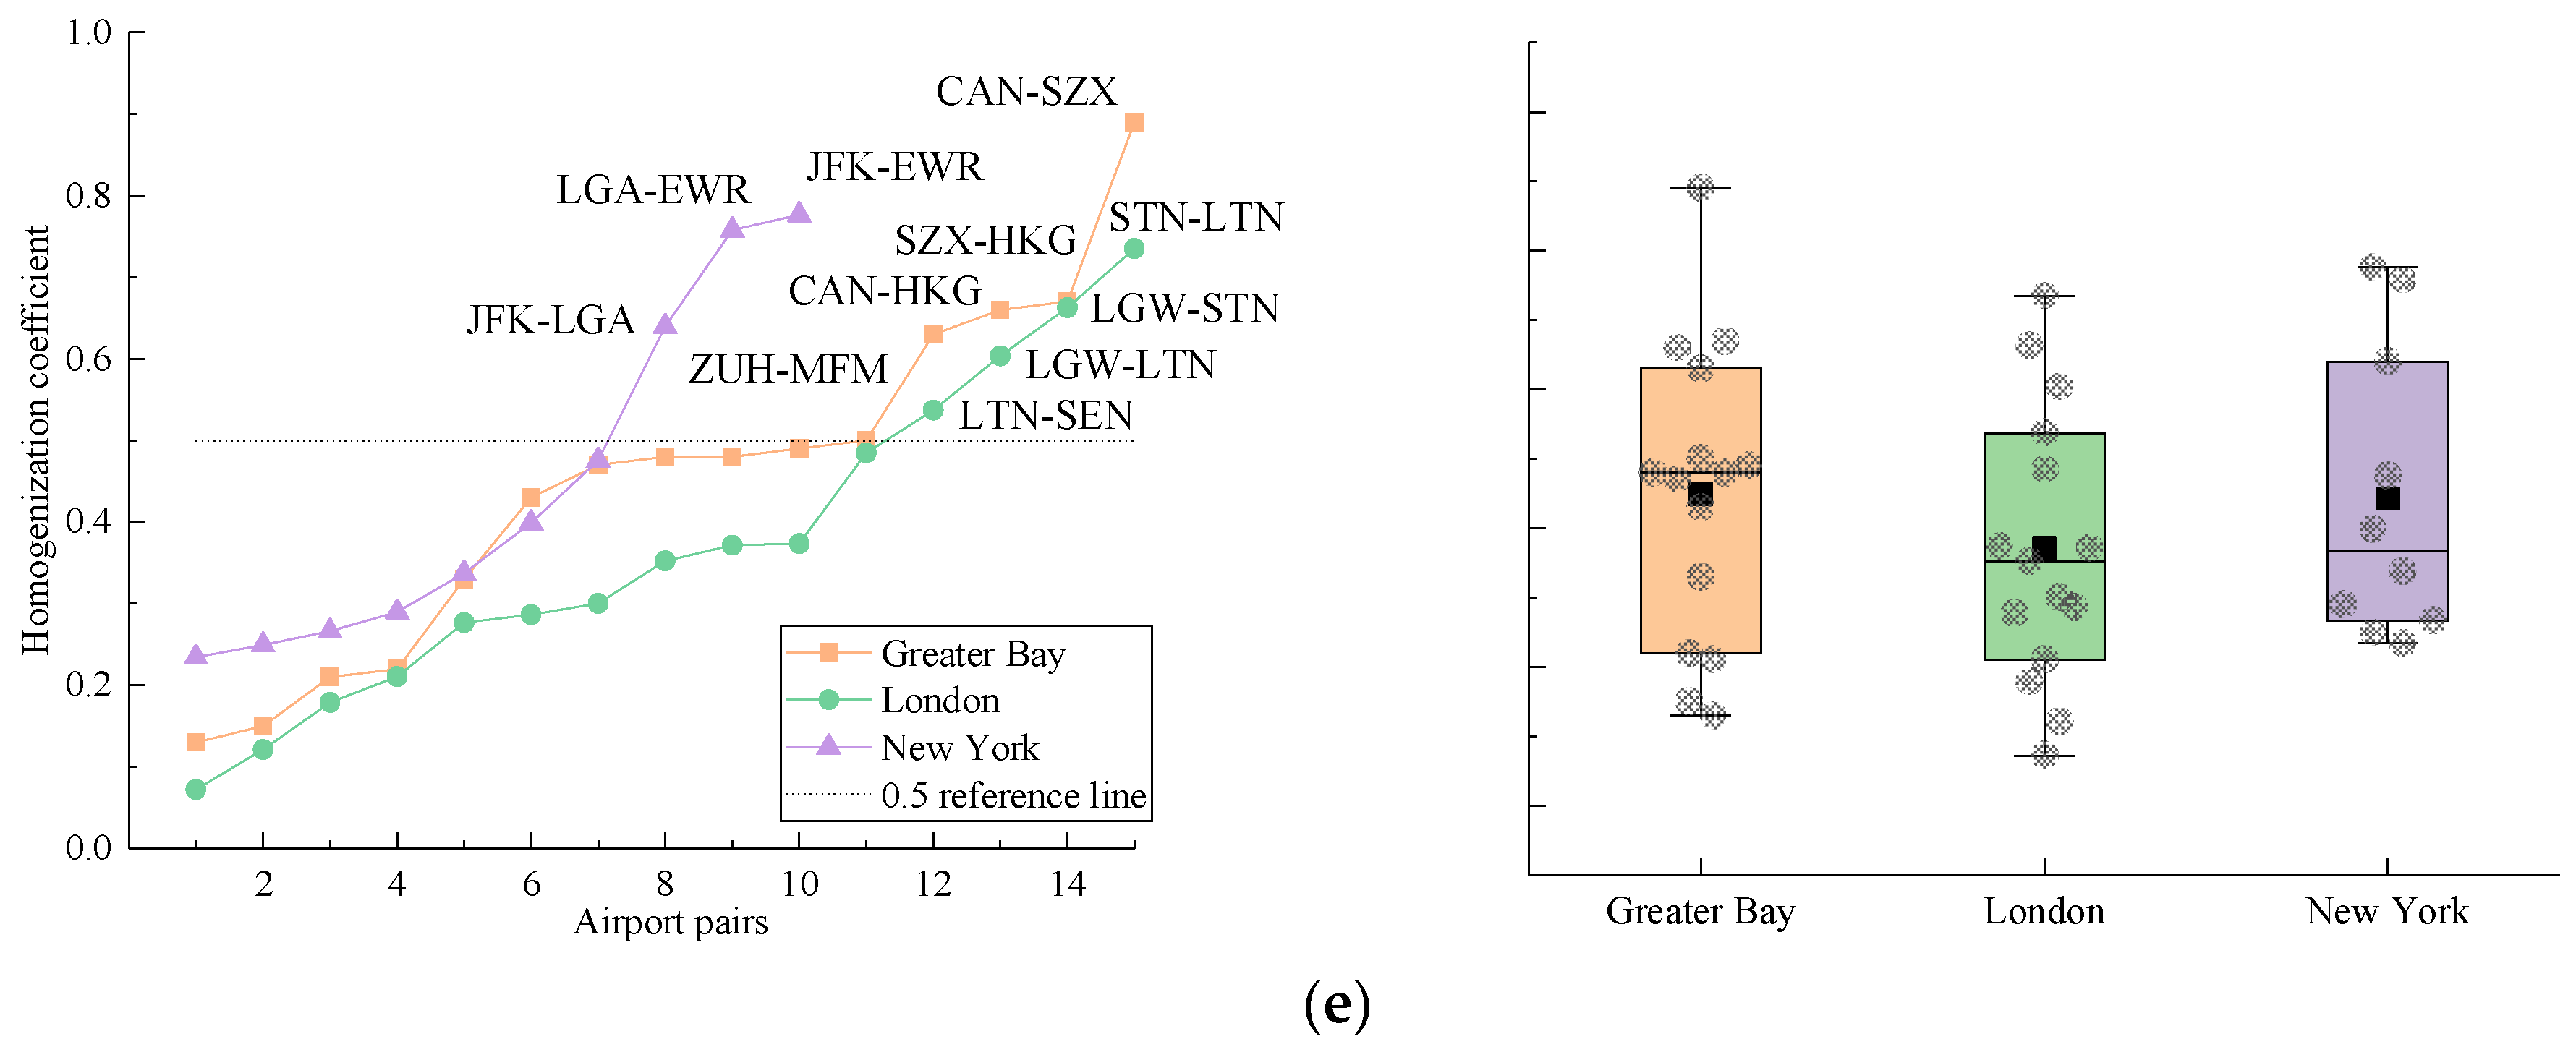
Table 1, the comprehensive homogenization levels of BF, IS, OE, RN, and BS for the three MARs with their corresponding boxplots were calculated, as shown in
Figure 6. The left parts of each panel plot the homogenization coefficients of the airport pairs in each MAR. The airport pairs have been sorted by their coefficients. The right parts of each panel are the boxplots of the coefficients of all the airport pairs in the MAR.
Comparison of the second layer homogenization results for the three MARs showed that the airport pairs of the MARs were generally at a high homogenization level in terms of BF and OE (greater than 0.5, see the boxplots in the figures). When looking at IS and BS, the homogenization level between major airports and between minor airports was relatively high (see the airport pairs above the dotted line in
Figure 6b,e). However, no obvious homogenization trend between major and minor airports was found. As for the RN, the overall levels of the MARs in New York and London was found to be higher than in the Greater Bay. The MAR in New York showed the highest level of homogenization. The individual airport pair CAN and SZX had the highest homogenization coefficient (almost reaching 1) within the route network from among all the airport pairs.
5.3.1. Homogenization of the Airports in Greater Bay MAR
From
Figure 6 and
Figure 7, it can be seen that only two airport pairs had homogenization coefficients higher than 0.5 in Greater Bay MAR (one pair higher than 0.75, one pair higher than 0.50). The overall level of comprehensive homogenization in the MAR was relatively low. CAN and SZX Airport were at the highest homogenization level, and the two airports showed high levels of convergence in five of the dimensional’ indicators.
As shown in
Table A1,
Table A2,
Table A3,
Table A4,
Table A5 and
Table 2, the homogenization coefficient between CAN and SZX was 0.76 in BF, 0.93 in IS, 0.97 in OE, 0.84 in RN, and 0.89 in BS. CAN and SZX were found to be highly homogeneous in all dimensions. Another two airport pairs, FUO-ZUH and CAN-HKG, were found to be homogeneous to some extent (slightly over 0.5) owing to the levels of BF, OE, and BS (as shown in
Table A1,
Table A3 and
Table A5). However, these two airport pairs were very different in terms of IS and RN. Each of these two airport pairs had a very low level (lower than 0.3) in RN, useful for reducing the homogenization level to differentiate the route network between 2 airports.
We further investigated the first layer indicators of CAN and SZX to analyze their comparative performance.
For indicators in BF, the number of runways in CAN was three and in SZX was two; the number of parking positions in CAN was 269 and in SZX was 199; the number of terminals at CAN was two and for SZX was one. Compared with CAN, SZX is smaller in scale and volume than CAN, but the indicators were homogeneous.
For indicators in IS, aircraft movements through CAN were about 338,000 and for SZX was about 284,000; passenger throughput of CAN was about 44 million and for SZX was 38 million; cargo throughput of CAN was about 18 billion tons and for SZX was about 14 billion tons. Indicators in IS were somewhat homogeneous.
For indicators in OE, the homogenization results were extremely high. For example, average taxi-out time for CAN was 13.95 min, while for HKG it was 17.79 min, even the smallest airport—FUO reported 9.29 min. There was no obvious difference in OE between airports in the Greater Bay MARs.
Indicators in RN, CAN, and SZX were almost the same. For example, CAN’s number of connecting airports was 238 and SZX had 206.
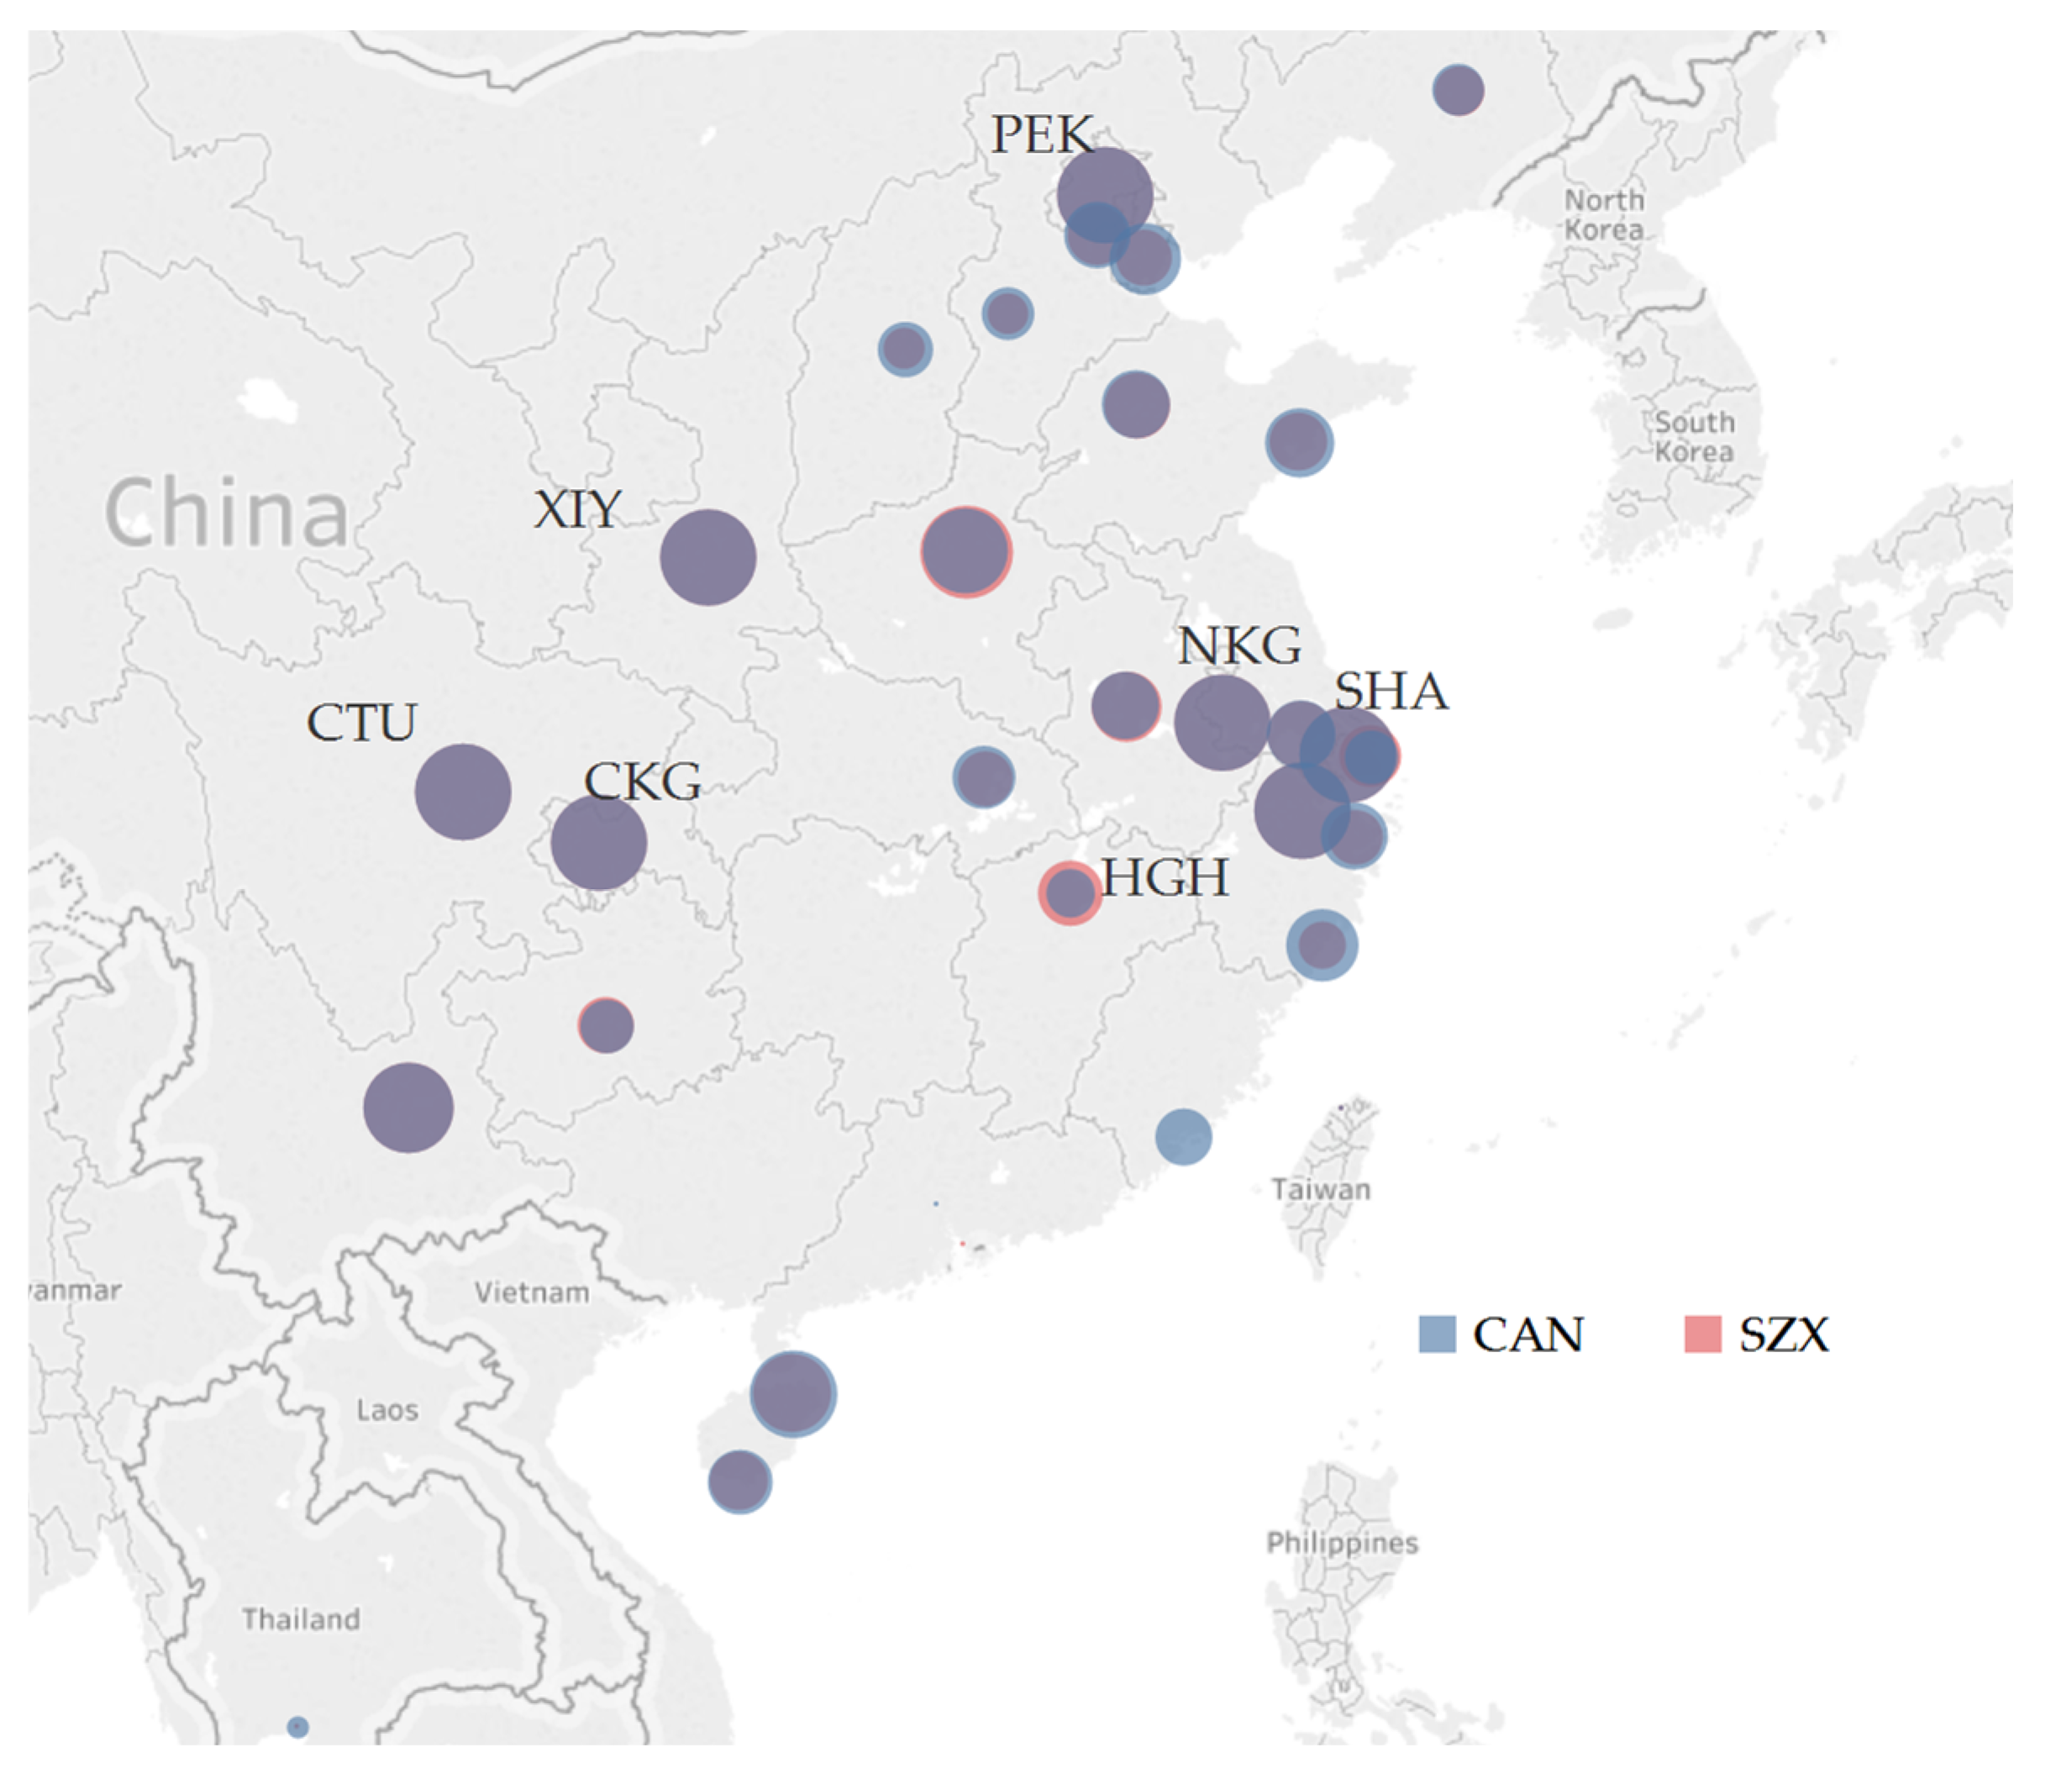
Figure 8 shows the top 30 airports connected with CAN and SZX according to the number of flights. The larger the circle is, the greater the connecting flight quantity.
Figure 8 shows that CAN and SZX have almost the same number of flights. There are 28 airports in the top 30 that CAN and SZX both cover, notably PEK, CTU, NKG, SHA, HGH etc. Only two airports were covered by CAN that were not also served by SZX.
For indicators in BS, the homogenization result for CAN and SZX is very high. The number of FSCs in CAN was 73 and in SZX was 46; the number of LCCs in CAN was 12, and SZX was 12 also; the number of FSC seats for CAN was about 31 million and for SZX was about 26 million; the number of LCC seats for CAN was about 2.1 million and for SZX was about 1.5 million.
5.3.2. Homogenization of the Airports in London MAR
From the
Figure 9, it can be seen that there was only one airport pair with a homogenization coefficient higher than 0.75, four airport pairs between 0.50–0.75, and the rest were all lower than 0.50. The homogenization levels of LHR-LGW, LGW-STN, LGW-LTN, and LCY-STN were between 0.50–0.75, LTN-STN showed the highest level of homogenization. The overall level of homogenization within the London MAR was found to be moderate. The London MAR is mainly manifested in the high level of homogenization among secondary airports.
As shown in
Table A1,
Table A2,
Table A3,
Table A4,
Table A5 and
Table 2, homogenization coefficients between LTN and STN were 0.94 in BF, 0.85 in IS, 0.89 in OE, 0.49 in RN and 0.74 in BS. Although homogeneous levels were extremely high in BF, IS, OE and BS, the homogeneous level in RN was quite low. The moderate homogeneous level of the London MAR is due to the low homogenization between the airports there. The homogenization coefficient between LTN and STN was high because LTN and STN are both key targets for low-cost airlines. There is fierce competition between the two airports for low-cost airlines. The situation between other airport pairs is basically the same. The reason the homogenization levels of LTN-LGW and STN-LGW were greater than 0.5 is because LTN, STN and LGW were operated the same number of LCCs and almost the same quantity of LCC seats, although LTN and STN are secondary airports serving LCCs and LGW (a primary airport) mainly serving FSCs that operate international flights.
The first layer indicators of LTN and STN were selected as an example to analyze the performance between them.
For indicators in BF, the number of runways of LTN was and STN was one each; the number of parking positions in LTN was 60 and in STN was 94; the number of terminals in LTN and STN was one each. The basic facilities quantity for LTN was almost the same as STN. Compared with STN, LTN is smaller in scale and volume than STN but the indicators were homogeneous.
For indicators in IS, aircraft movements through LTN were about 448,000 and STN was about 613,000; passenger throughput of LTN was about six million and STN was eight million; cargo throughput of LTN was about 31,000 tons and for SZX was about 255,000 tons. Indicators in IS were also fairly homogeneous except for the cargo throughput.
For indicators in OE, airports were also similar, which made the homogenization results of OE extremely high. For example, the average taxi-out time for LHR was 19.13 min, while for LGW it was 15.55 min, and for the smallest airport—SEN was 10.2 min. There was no obvious difference of OE between airports in the London MAR.
For indicators in RN, LTN and STN were not homogeneous, and nor were other airport pairs. For example, LTN’s number of connecting airports was 142 and STN’s was 191. As for connecting airport fight quantity, except for LHR which covers the main airports in nearby countries, other airports in the London MAR cover different areas of Europe, or those airports have different quantities of connections with main airports. For example, as a main airport, LGW covers almost the same airport as LHR, but its flight quantity was much smaller than LGR. Therefore, airports in London MAR have different RN characteristics from each other.
For indicators in BS, the homogenization result for LTN and STN was high, because the number of FSCs of LTN was 19 and STN was five; the number of LCCs for LTN was five, as it was for STN also; the number of FSC seats for LTN was about 520,000 and for STN was about 890,000; the number of LCC seats of LTN was about 507,000 and for STN was about 327,000. Indicators in BS were fairly homogeneous.
5.3.3. Homogenization of Airports in New York MAR
From the
Figure 10, it can be seen that in New York MAR, one airport pair’s comprehensive homogenization coefficient was higher than 0.75 (EWR-JFK), two airport pairs were between 0.50–0.75, and the rest of the airport pairs were all lower than 0.50. The three major airports under the jurisdiction of the Port Authority of New York and New Jersey showed a tendency to homogenize. For example, EWR-LGA and JFK-LGA had homogenization scores higher than 0.50. There was obviously high homogenization between primary airports in New York MAR.
As shown in
Table A1,
Table A2,
Table A3,
Table A4 and
Table A5, homogenization coefficients between EWR and JFK were 0.80 in BF, 0.89 in IS, 0.89 in OE, 0.63 in RN and 0.78 in BS. The homogenization level in RN was obviously lower than the other dimensions. EWR-LGA and JFK-LGA each had relative low levels in IS and RN and a high level in BS. The coefficient between JFK and LGA was 0.37, representing a huge differentiation of route network configuration between these two airports, which is why homogenous level between JFK and LGA was lower than EWR-JFK or EWR-LGA.
The first layer indicators of EWR and JFK were selected to analyze the performance between them.
For indicators in BF, the number of runways for JFK was four and EWR was three; the number of parking positions at JFK was 162 and at EWR was 121; the number of terminals at JFK was six and at EWR was three. The quantity of basic facilities of JFK was more than EWR. Compared with JFK, EWR is smaller in scale and volume but its indicators are homogeneous;
For indicators in IS, aircraft movements for JFK were about 178,000 and for EWR was about 185,000; passenger throughput of JFK was about 16 million and for EWR was 16 million also; cargo throughput of JFK was about 11 billion tons and for EWR was about seven billion tons. Indicators in IS were also reasonably homogeneous.
For indicators in OE, airports were again found to be quite similar, making the homogenization results of OE extremely high also. For example, the average taxi-out time from JFK was 19.97 min, EWR was 21.03 min, and even the smallest airport—ISP was 11.85 min. There was no obvious difference of OE between airports in the New York MAR.
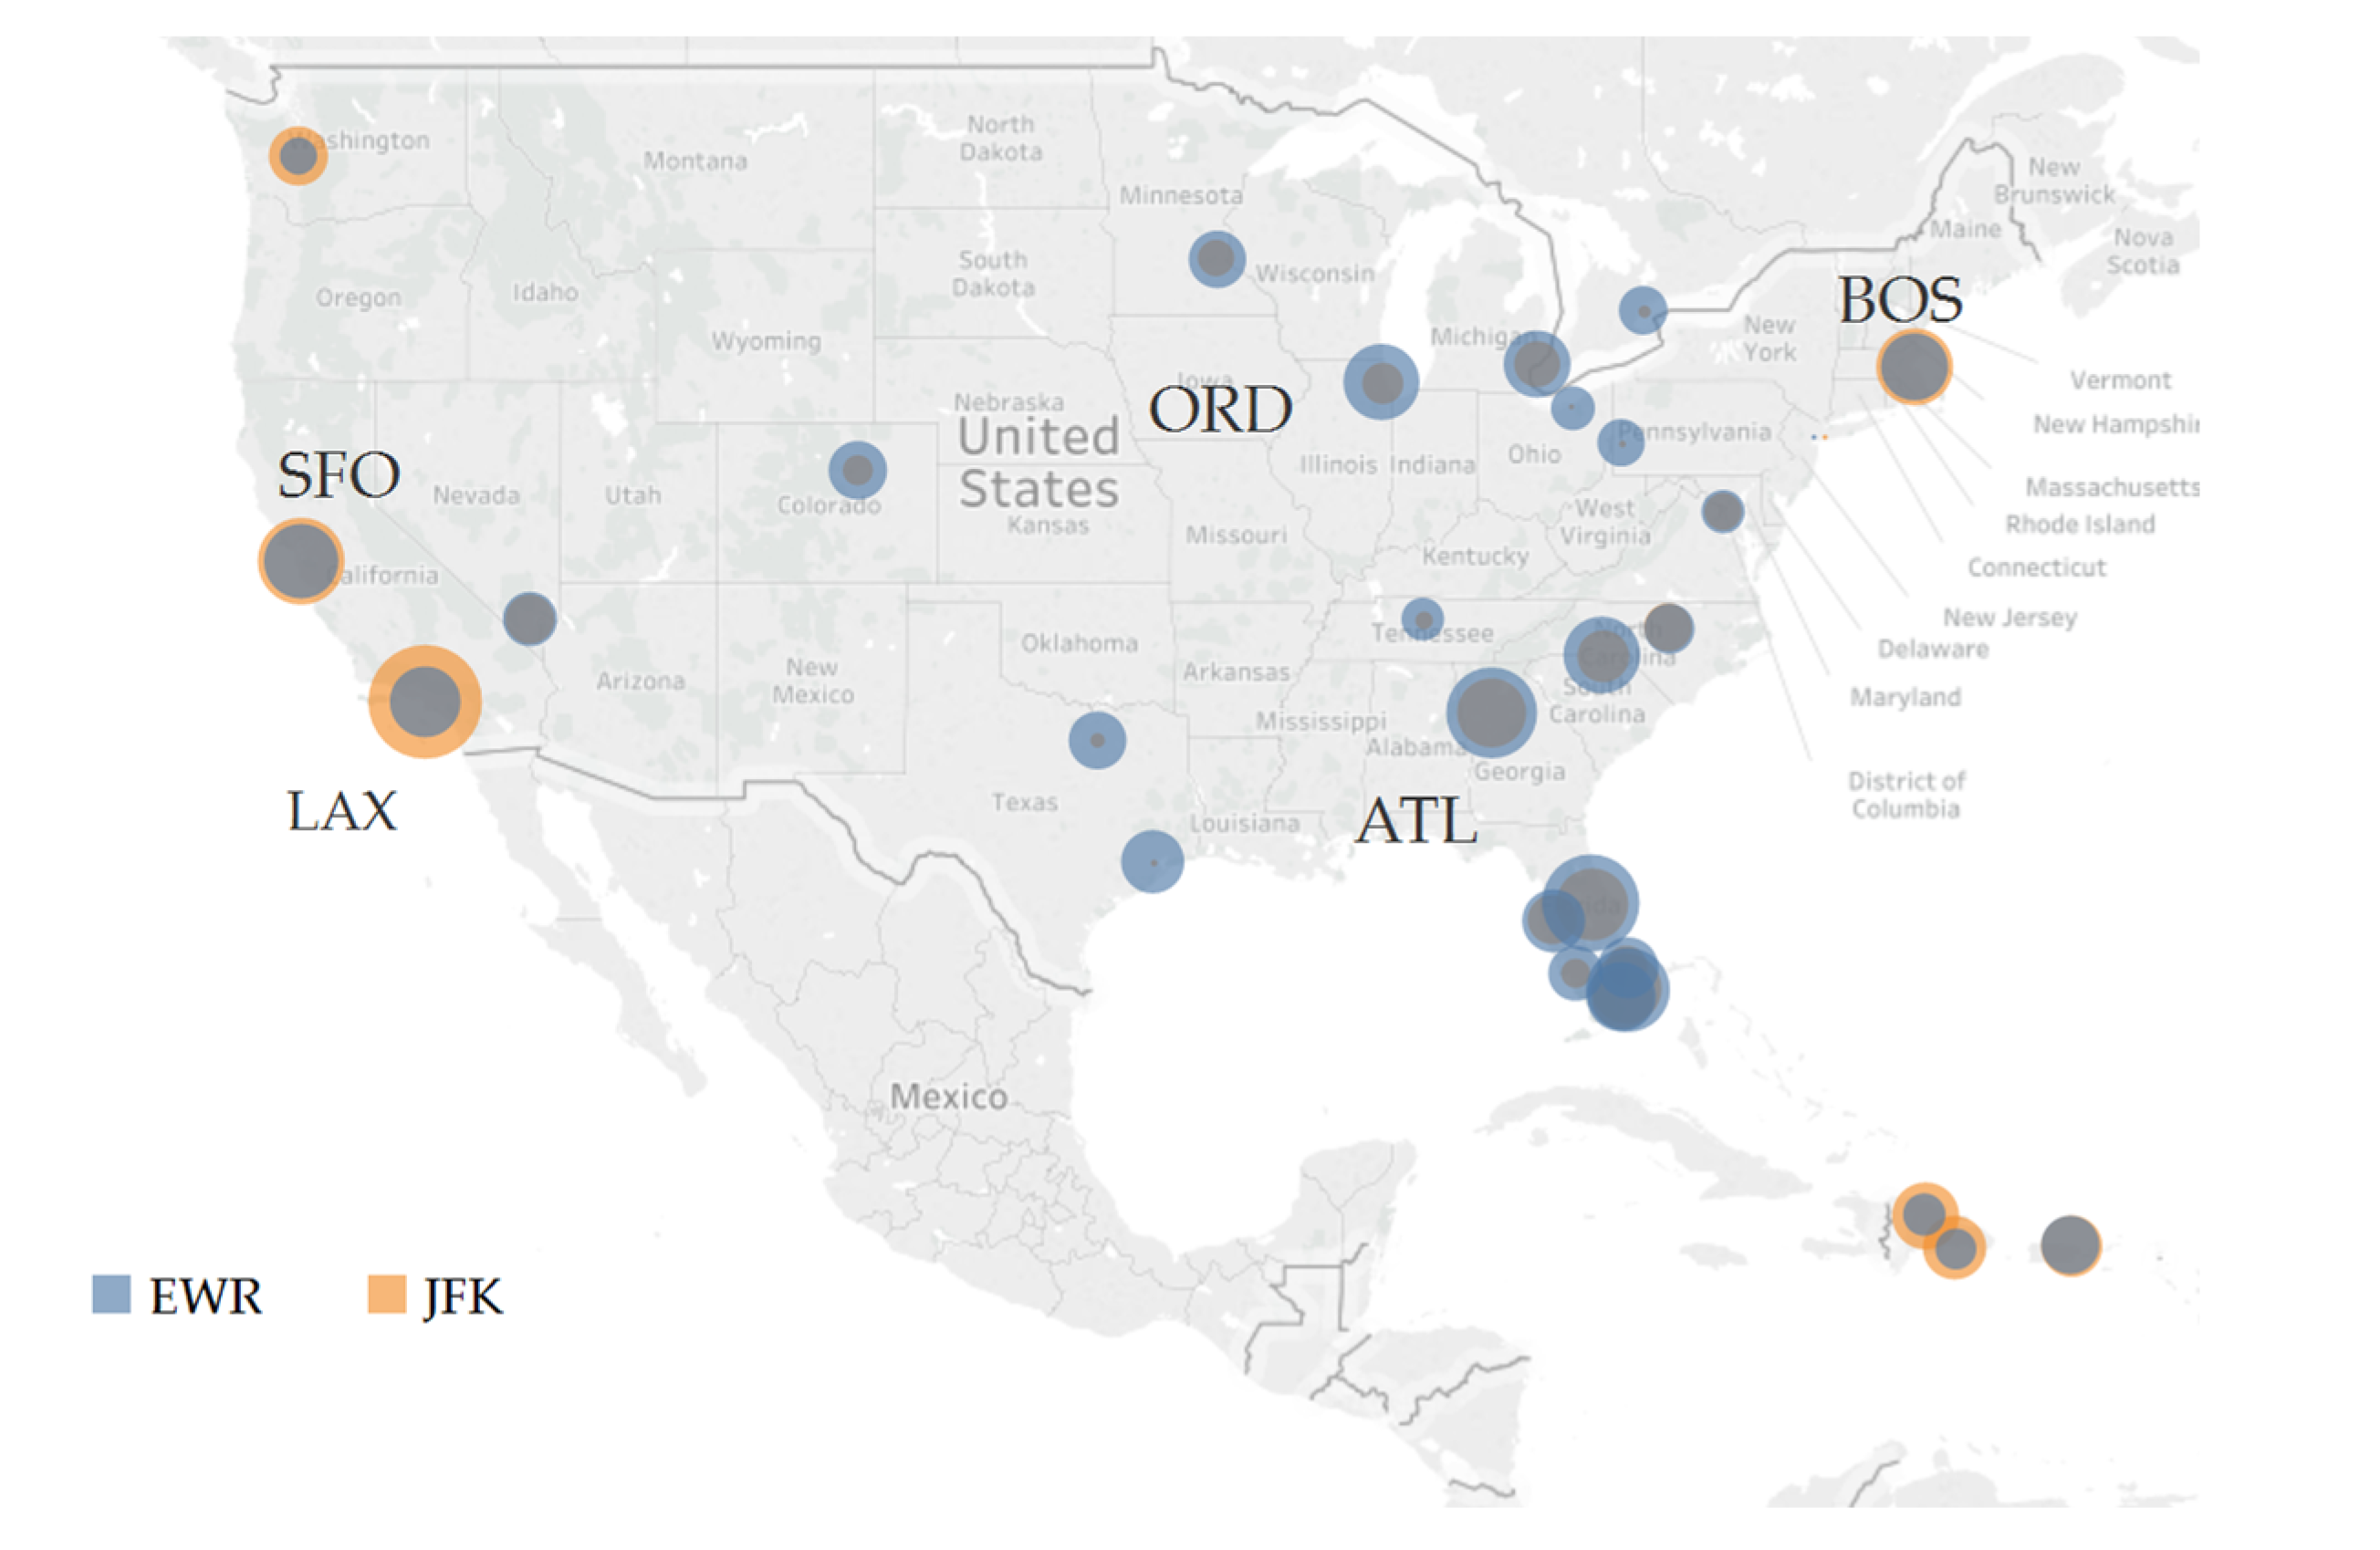
For indicators in RN, JFK and EWR were strongly homogeneous. For example, JFK’s connecting airports numbered 229 and EWR’s 203. For connecting airport flights,
Figure 11 shows the top 30 airports connected with EWR and JFK according to the number of flights. Circles in yellow or blue indicate airports connecting with JFK or EWR. The larger the circle, the more the number of connecting flights.
For indicators in BS, homogenization results of JFK and EWR were high. The number of FSCs for JFK was 76 and for EWR was 43; the number of LCCs for JFK was four and for EWR was six; the number of LSC seats at JFK was about 12 million and for EWR was about 13 million; the number of LCC seats for JFK was about 5 million and for EWR was about 2 million.
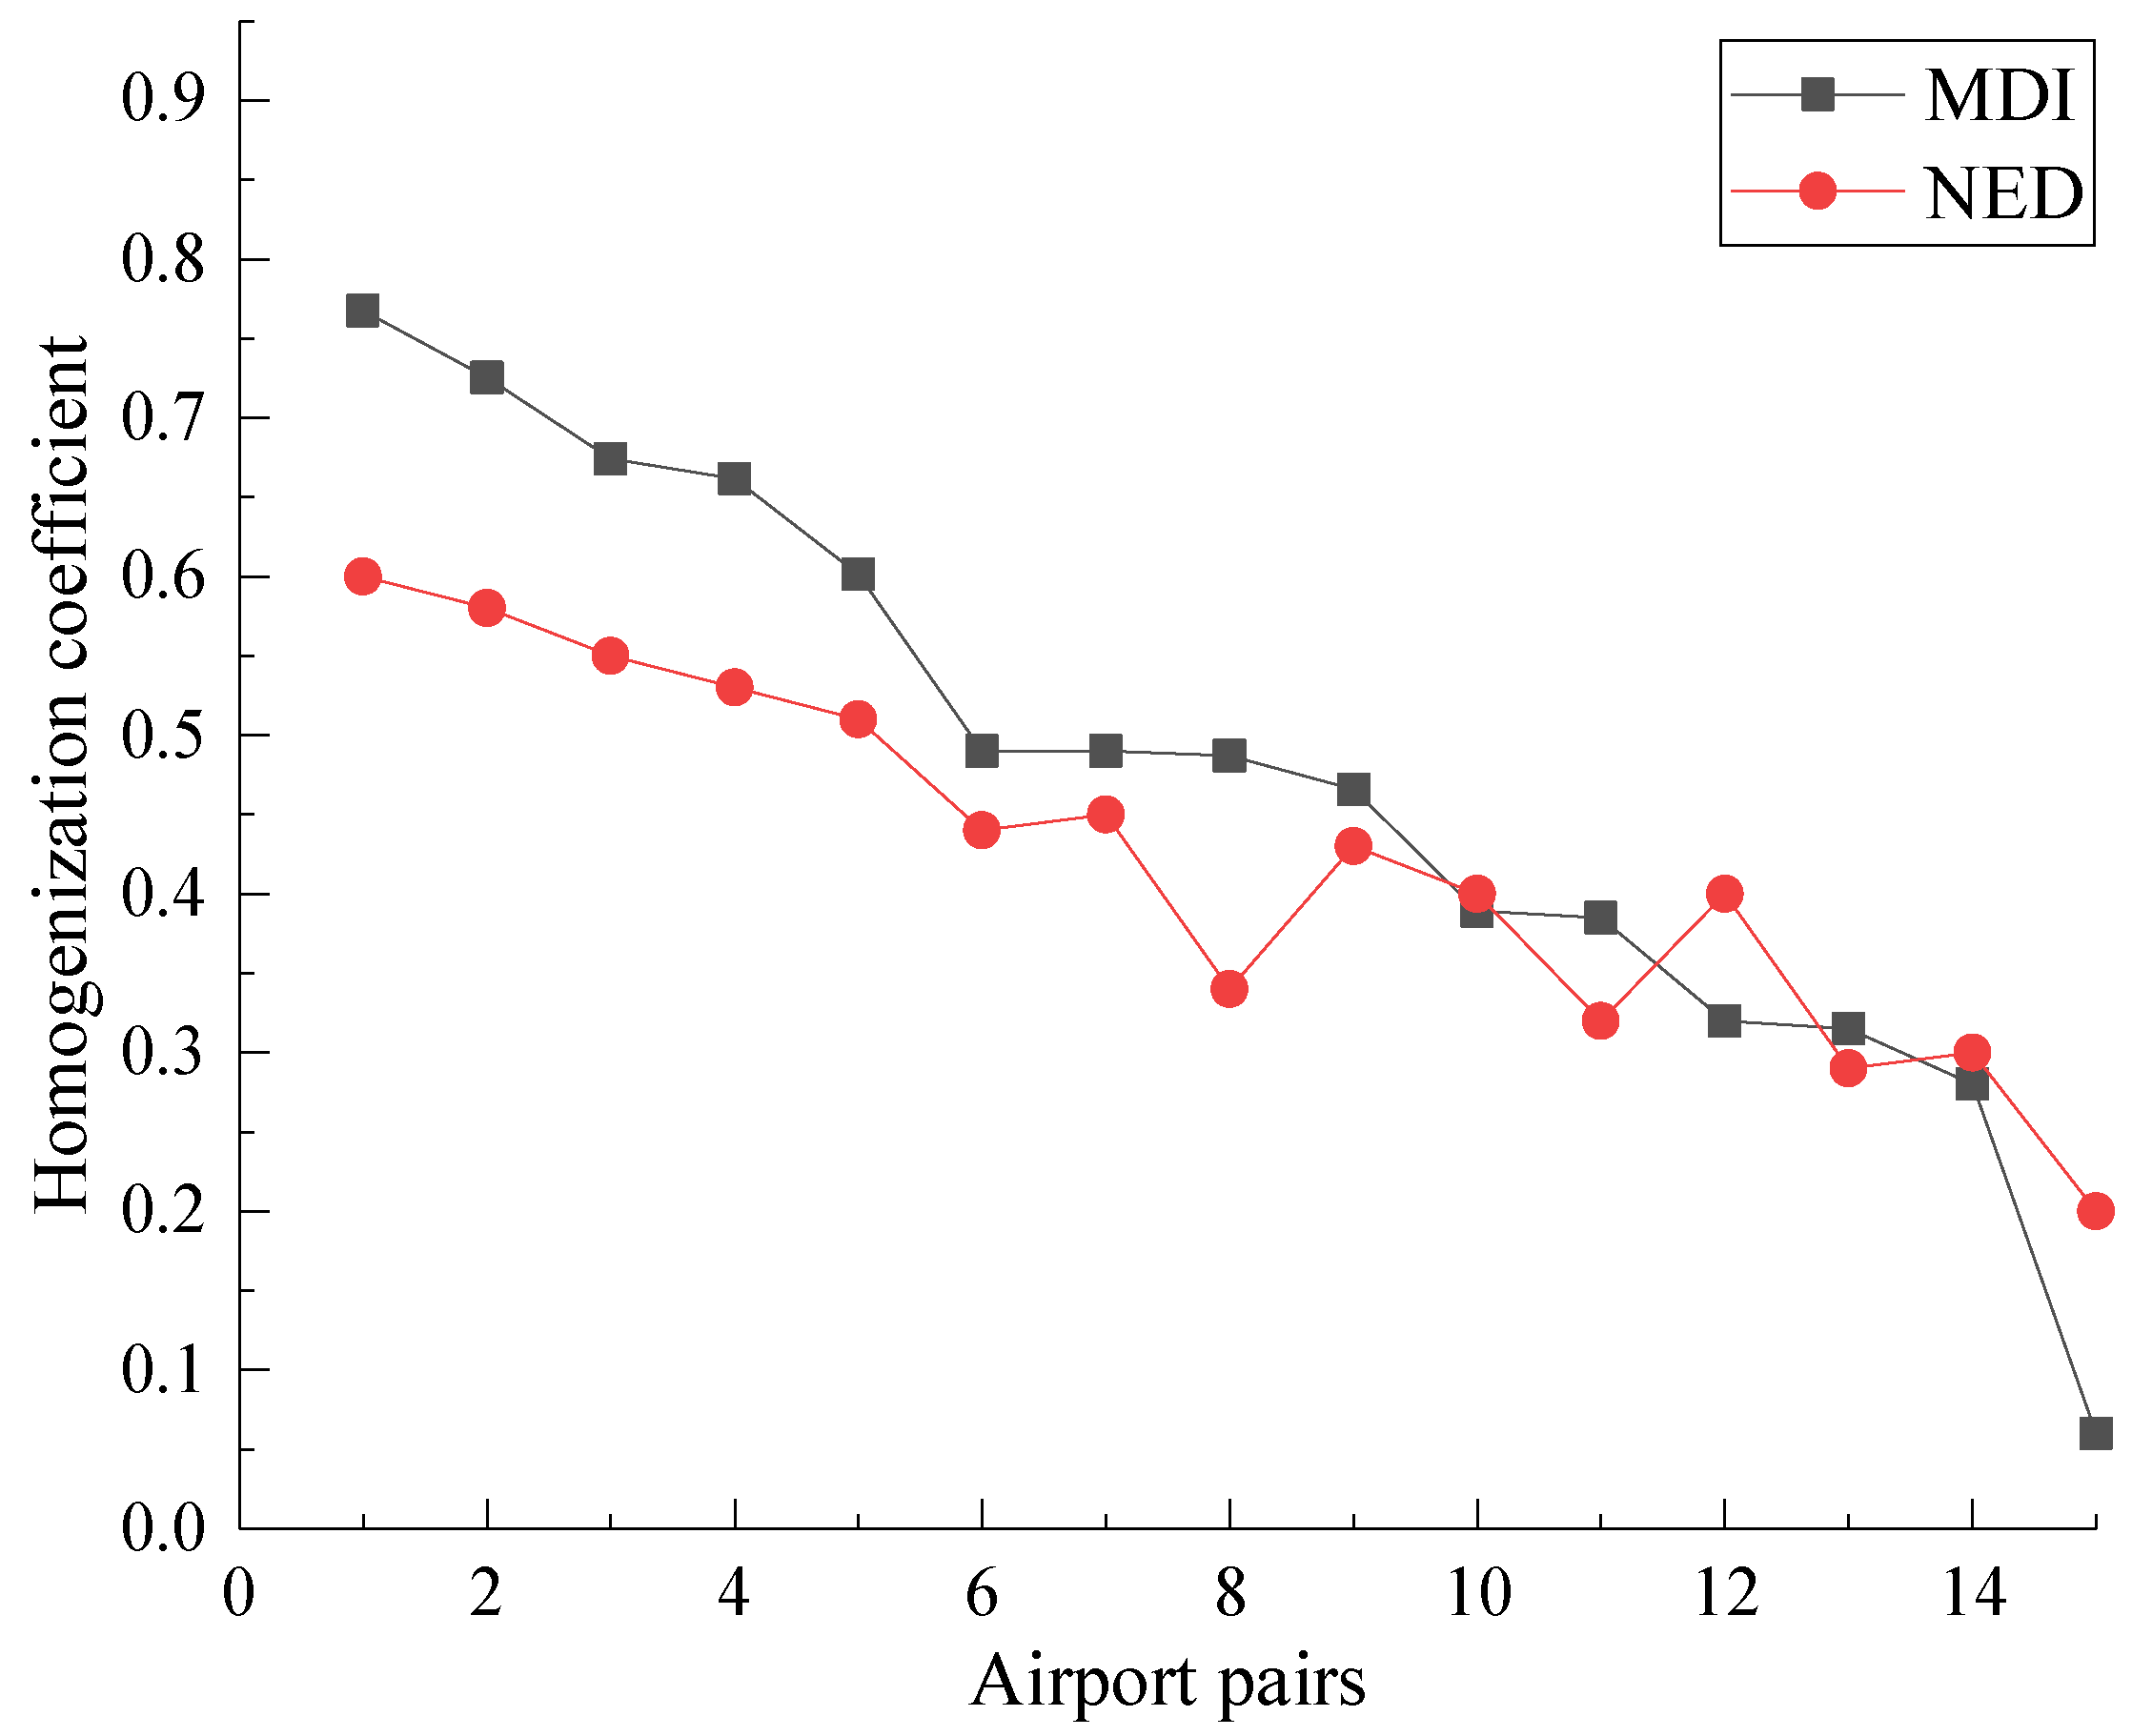
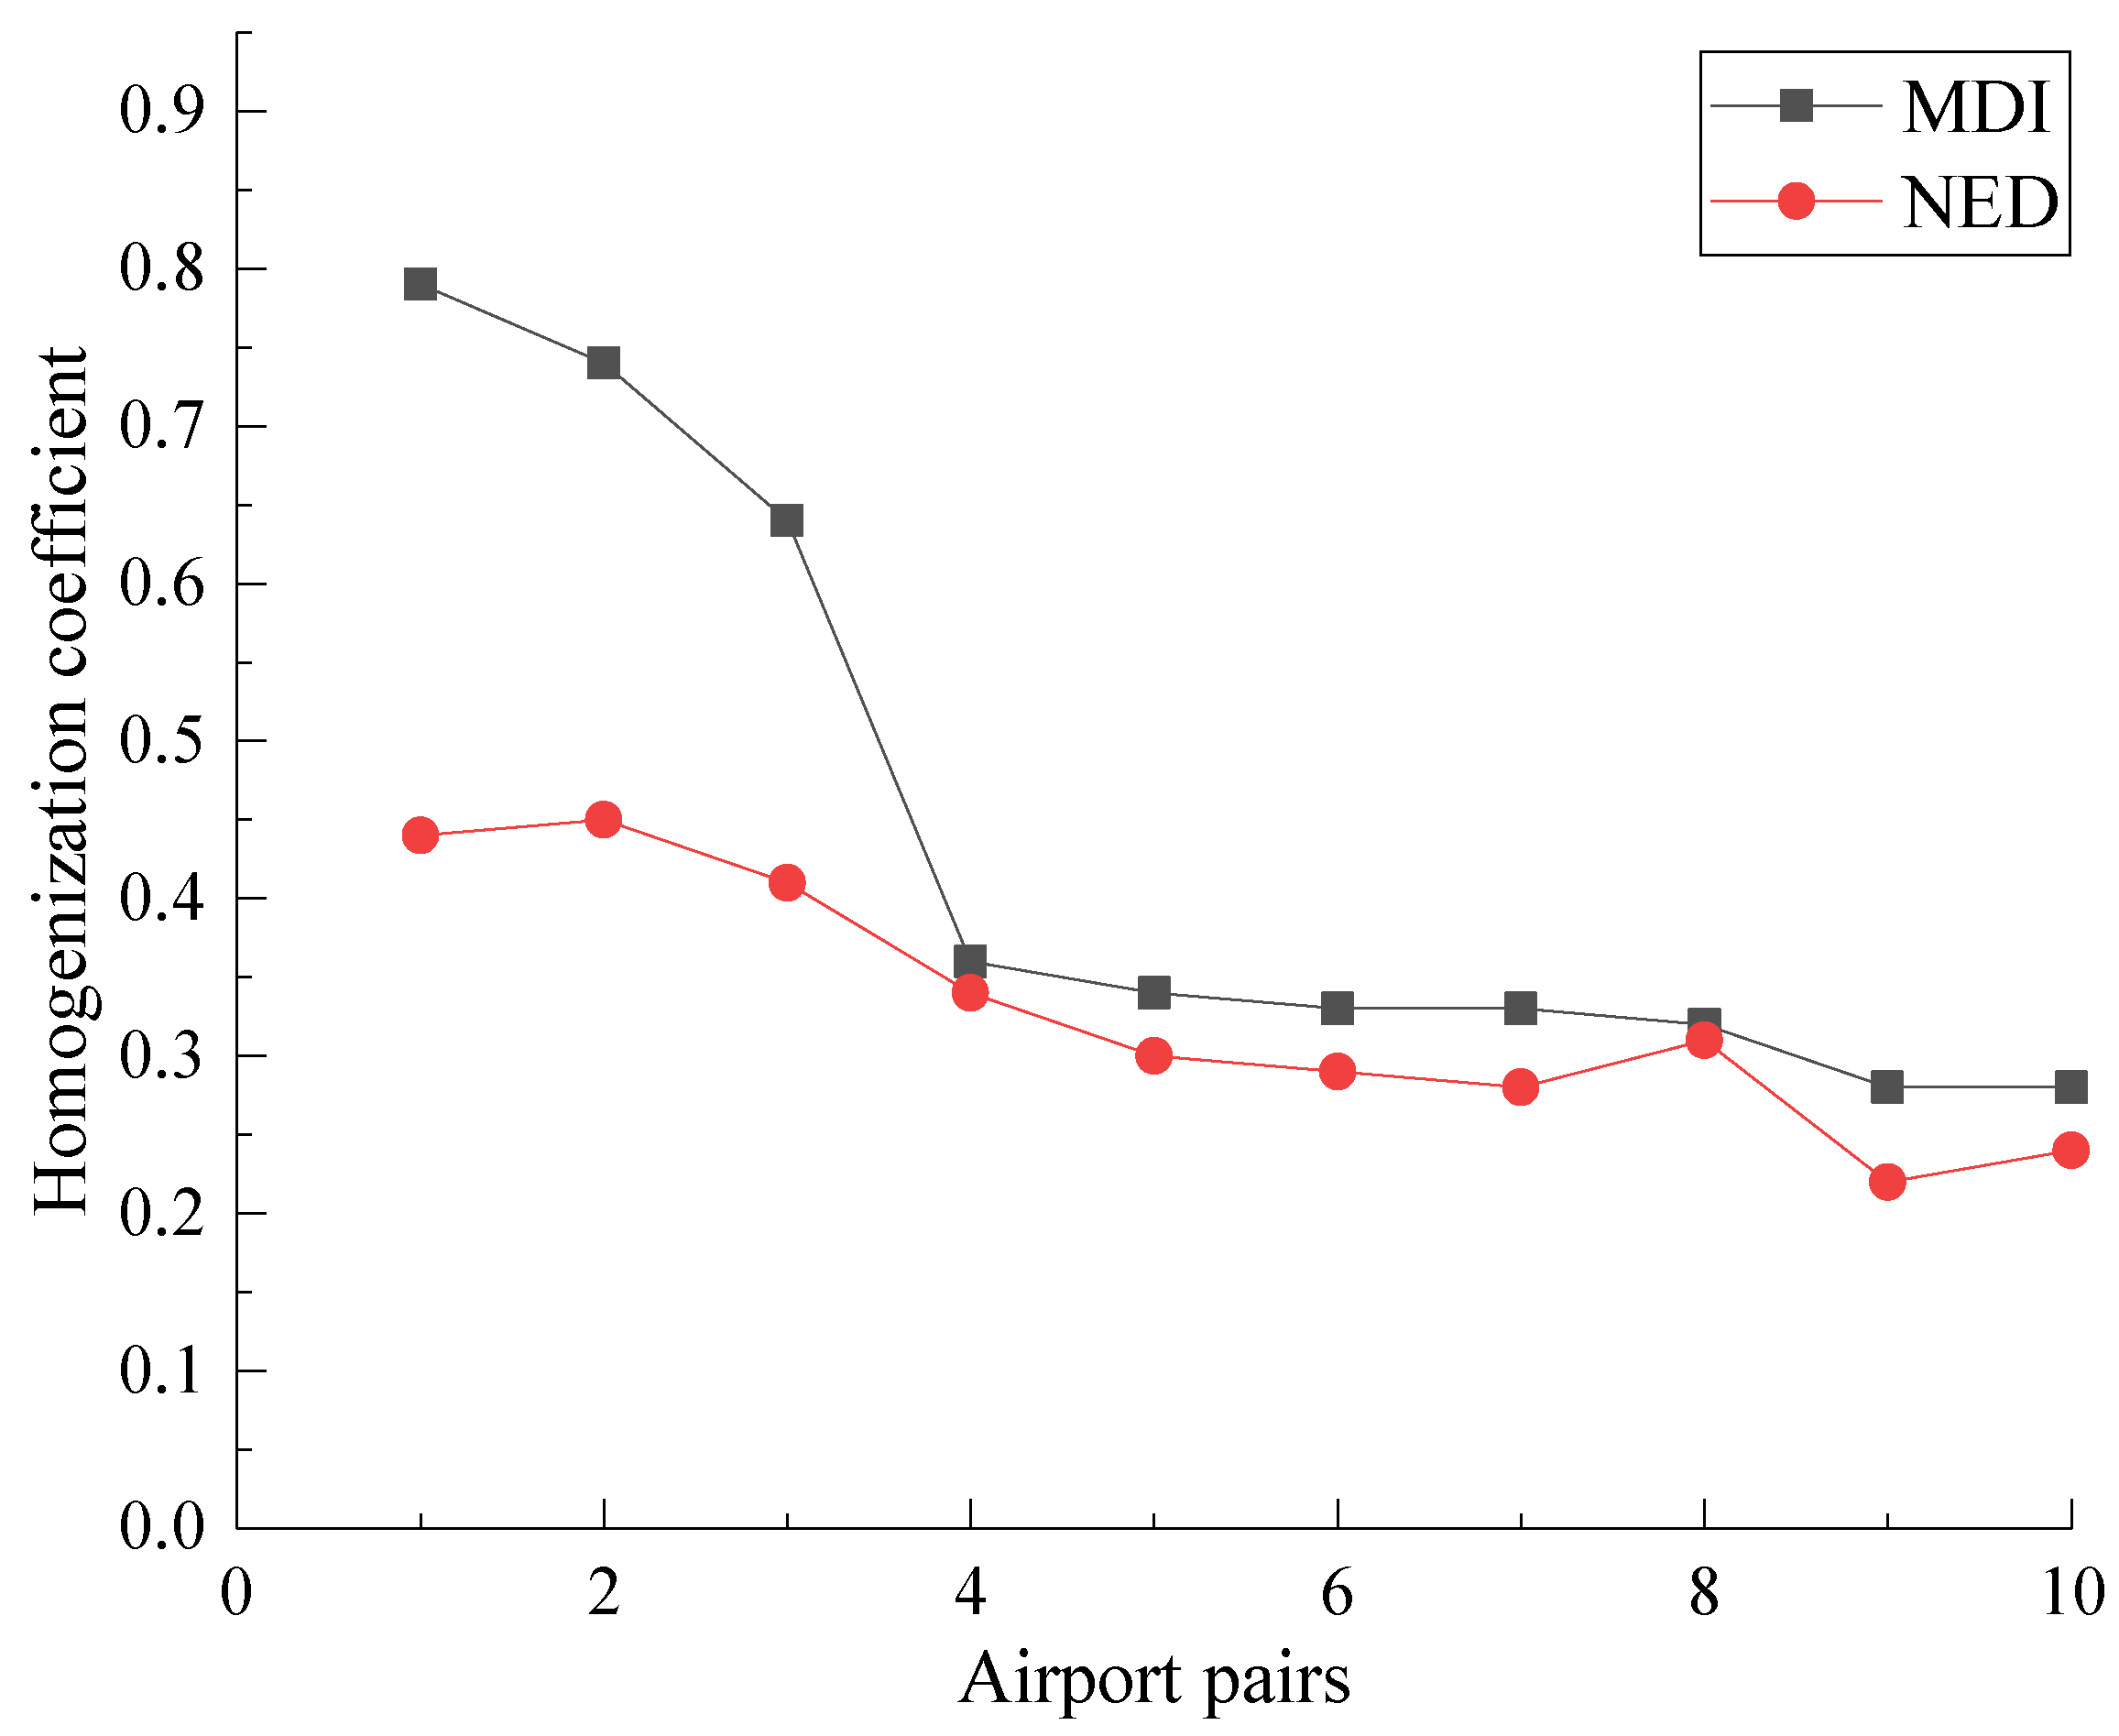
5.4. Comparison with Other Method
The method of this study was based on multi-dimensional indicators (MDI), and the validation method was normalized Euclidean distance (NED). The homogenization results obtained by the two methods are compared as shown in
Figure 12,
Figure 13 and
Figure 14.
We can see from
Figure 12,
Figure 13 and
Figure 14 that the homogenization provided by NED were generally lower than MDI. The overall trends of the results obtained by NED were consistent with MDI, which indicates that results are reasonable. Our method can better highlight homogeneous airport pairs, which can identify potential aspects of homogenization between airports.
5.5. Suggestions
The physical infrastructure of the airport (i.e., BF) is not easy to change, OE is the result of all types of resource’ operations, and BS could be analyzed by way of functional positioning. It is reasonable to propose suggestions from IS, BS, and RN perspectives, i.e., suggestions made from airport functional positioning and route network development perspectives. The main results (final homogenization coefficients over 0.5) are shown in
Table 2.
5.5.1. Greater Bay MAR
Functional Positioning Differentiation
CAN and SZX are extremely homogeneous in all of the first layer indicators. Due to government policy, SZX must develop itself in all aspects, which makes indicators of all dimensions highly homogenous with CAN. Based on the high level of IS, airport managers should implement differentiated development for different groups of passengers. For example, CAN could aim to further absorb transit flights, and to develop cargo and aviation-related industries. SZX needs to increase its international business, attract international passengers, and become another powerful pillar of the MAR. Thus, CAN and SZX will have their own characteristics in terms of IS, and homogenization level of CAN-SZX will be lower.
Route Network Differentiation
Based on their high homogenization level in RN, CAN and SZX should rearrange the route network. CAN could mainly focus on international and domestic routes to improve its influence in South China and elsewhere in the world. SZX could further open international routes, but at the same time maintain further differentiation from the route network of CAN. Diversion of passenger demand should be undertaken. Authorities need pay attention to the high homogenization between CAN and SZX in all of the indicators to avoid the occurrence of vicious competition.
5.5.2. London MAR
Functional Positioning Differentiation
Except STN-LCY, other airports are highly homogeneous in all aspects in IS. The distances between airports are not too greater. Differentiated allocation of passenger and cargo transportation will not only satisfy the airports’ positions, but will also maximize the utilization of resources. Through the overall adjustment, the level of homogenization between airports in the London MAR will decrease.
Route Network Differentiation
The number of connecting flights are quite different between airports in the MAR. It would be a good choice for London MAR to maintain its status in RN. Although there is a relatively high (only 0.50) level of homogenization between STN and LGW, LGW’s connecting airports and connecting airport flights are obviously much greater in quantity than those of STN. Thus, homogenization between STN and LGW is avoided.
5.5.3. New York MAR
Functional Positioning Differentiation
The three main airports are quite close geographically, which means their service scales highly overlap. It will be useful for the three airports to focus on different business. For example, because EWR-JFK has the highest homogenization level in all of the indicators, the two airports’ passenger and cargo transportation business should be separated instead of allowed to overlap.
Route Network Differentiation
It can be seen from
Figure 11 that EWR and JFK highly overlap in the main route structure. LGA has a route structure typically short distance and concentrating on the domestic, which is quite different from EWR and JFK. Thus, the Port Authority should make clearer for the distinction between three airports (especially EWR and JFK) as connecting airports or for connecting airport flights. For example, JFK should focus on the international market, EWR should focus on the domestic and part of the international market, and LGA should continue to focus on the domestic market. Thus, the route network structure will be more diverse and RN homogenization between three main airports will be lower.
6. Conclusions
This paper proposes a multi-dimensional evaluation indicator system to measure the homogenization of airports in a Multiple Airport Region (MAR). The indicator system covers all the aspects of the measurement of homogenization, which include airports’ basic facilities (BS), integrated support (IS), operation efficiency (OE), route network (RN), and business strategy (BS). A method for evaluating the homogenization of MAR based on the fusion of weighting methods was established. The homogenization of airports in three typical MARs were analyzed based on operational data from 2020. Suggestions were made based on the obtained indicators in BS, IS, OE, RN and BS. For the Greater Bay MAR, it is suggested that the functional positioning of the airports in the MAR should be clearly divided, and different base airlines and differentiated operating route networks should be introduced, especially for CAN and SZX; for the London MAR, there should be some adjustments between main airports in functional positioning. For example, the functional positioning of STN and LCY should be promoted; for the New York MAR, there should be functional positioning or route network differentiation to reducing the homogenization of EWR-JFK and EWR-LGA. Meanwhile, there should be functional positioning differentiation between JFK and LGA.
Our work provides air-transport decision makers with a tool to analyze airport market positioning and functions. At the airport operation level, it can support the development of the aviation market and improve airport profits. At the regional development level, it can promote the balanced development of the regional air transport industry, and avoid unnecessary competition among airports. There are several limitations to the current work which should be addressed in future. For example, the demand and operational characteristics of different flights have seasonal regularities. Therefore, the homogenization assessment of MARs can be carried out seasonally. The development of airlines’ networks is determined by various factors. It would be challenging for the authorities to propose policies to guide all airlines to develop the desired networks.
Author Contributions
Conceptualization, C.G. and W.C.; methodology, C.G. and W.C.; software, C.G. and J.S.; validation, C.G.; formal analysis, C.G.; investigation, C.G. and F.Z.; data curation, C.G. and D.J.; writing—original draft preparation, C.G.; writing—review and editing, C.G.; visualization, C.G.; supervision, W.C. and Y.W.; project administration, W.C.; funding acquisition, W.C. All authors have read and agreed to the published version of the manuscript.
Funding
This research was partly supported by the National Natural Science Foundation of China (Grant No. U2033203), the Research & Development of Anhui Province (Grant No. 201904a07020030), and 2020 Civil Aviation Safety Capability Construction Foundation of Airport-Collaborative Decision Making (A-CDM) Technical Specification Project.
Data Availability Statement
All data generated or analyzed during this study are included in this article. The original data that support the findings of this study are available from the corresponding author, Y.W., upon reasonable request.
Conflicts of Interest
The authors declare no conflict of interest.
Appendix A
The appendix A shows the homogenization results of BF, IS, OE, RN, and the third layers of three selected MARs.
Table A1.
Homogenization result of BF.
Table A1.
Homogenization result of BF.
| Greater Bay | CAN | SZX | ZUH | HKG | MFM | FUO |
| CAN | 1.00 | 0.76 | 0.46 | 0.88 | 0.46 | 0.43 |
| SZX | 0.76 | 1.00 | 0.66 | 0.85 | 0.66 | 0.62 |
| ZUH | 0.46 | 0.66 | 1.00 | 0.53 | 0.99 | 0.88 |
| HKG | 0.88 | 0.85 | 0.53 | 1.00 | 0.53 | 0.49 |
| MFM | 0.46 | 0.66 | 0.99 | 0.53 | 1.00 | 0.87 |
| FUO | 0.43 | 0.62 | 0.88 | 0.49 | 0.87 | 1.00 |
| London | LCY | LGW | LHR | LTN | SEN | STN |
| LCY | 1.00 | 0.55 | 0.44 | 0.84 | 0.91 | 0.80 |
| LGW | 0.55 | 1.00 | 0.82 | 0.67 | 0.51 | 0.73 |
| LHR | 0.44 | 0.82 | 1.00 | 0.52 | 0.42 | 0.57 |
| LTN | 0.84 | 0.67 | 0.52 | 1.00 | 0.79 | 0.94 |
| SEN | 0.91 | 0.51 | 0.42 | 0.79 | 1.00 | 0.76 |
| STN | 0.80 | 0.73 | 0.57 | 0.94 | 0.76 | 1.00 |
| New York | EWR | HPN | JFK | ISP | LGA | |
| EWR | 1.00 | 0.56 | 0.80 | 0.58 | 0.86 | |
| HPN | 0.56 | 1.00 | 0.43 | 0.84 | 0.63 | |
| JFK | 0.80 | 0.43 | 1.00 | 0.56 | 0.74 | |
| ISP | 0.58 | 0.84 | 0.56 | 1.00 | 0.48 | |
| LGA | 0.86 | 0.63 | 0.74 | 0.48 | 1.00 | |
Table A2.
Homogenization result of IS.
Table A2.
Homogenization result of IS.
| Greater Bay | CAN | SZX | ZUH | HKG | MFM | FUO |
| CAN | 1.00 | 0.93 | 0.24 | 0.43 | 0.19 | 0.03 |
| SZX | 0.93 | 1.00 | 0.29 | 0.48 | 0.21 | 0.03 |
| ZUH | 0.24 | 0.29 | 1.00 | 0.55 | 0.38 | 0.11 |
| HKG | 0.43 | 0.48 | 0.55 | 1.00 | 0.23 | 0.07 |
| MFM | 0.19 | 0.21 | 0.38 | 0.23 | 1.00 | 0.33 |
| FUO | 0.03 | 0.03 | 0.11 | 0.07 | 0.33 | 1.00 |
| London | LCY | LGW | LHR | LTN | SEN | STN |
| LCY | 1.00 | 0.56 | 0.35 | 0.29 | 0.21 | 0.65 |
| LGW | 0.56 | 1.00 | 0.68 | 0.74 | 0.17 | 0.88 |
| LHR | 0.35 | 0.68 | 1.00 | 0.46 | 0.09 | 0.58 |
| LTN | 0.29 | 0.74 | 0.46 | 1.00 | 0.24 | 0.85 |
| SEN | 0.21 | 0.17 | 0.09 | 0.24 | 1.00 | 0.21 |
| STN | 0.65 | 0.88 | 0.58 | 0.85 | 0.21 | 1.00 |
| New York | EWR | HPN | JFK | ISP | LGA | |
| EWR | 1.00 | 0.09 | 0.89 | 0.06 | 0.60 | |
| HPN | 0.09 | 1.00 | 0.10 | 0.64 | 0.11 | |
| JFK | 0.89 | 0.10 | 1.00 | 0.07 | 0.60 | |
| ISP | 0.06 | 0.64 | 0.07 | 1.00 | 0.08 | |
| LGA | 0.60 | 0.11 | 0.60 | 0.08 | 1.00 | |
Table A3.
Homogenization result of OE.
Table A3.
Homogenization result of OE.
| Greater Bay | CAN | SZX | ZUH | HKG | MFM | FUO |
| CAN | 1.00 | 0.97 | 0.87 | 0.87 | 0.83 | 0.85 |
| SZX | 0.97 | 1.00 | 0.88 | 0.88 | 0.81 | 0.83 |
| ZUH | 0.87 | 0.88 | 1.00 | 0.84 | 0.78 | 0.85 |
| HKG | 0.87 | 0.88 | 0.84 | 1.00 | 0.85 | 0.86 |
| MFM | 0.83 | 0.81 | 0.78 | 0.85 | 1.00 | 0.86 |
| FUO | 0.85 | 0.83 | 0.85 | 0.86 | 0.86 | 1.00 |
| London | LCY | LGW | LHR | LTN | SEN | STN |
| LCY | 1.00 | 0.79 | 0.69 | 0.83 | 0.86 | 0.91 |
| LGW | 0.79 | 1.00 | 0.89 | 0.96 | 0.91 | 0.86 |
| LHR | 0.69 | 0.89 | 1.00 | 0.86 | 0.81 | 0.77 |
| LTN | 0.83 | 0.96 | 0.86 | 1.00 | 0.95 | 0.89 |
| SEN | 0.86 | 0.91 | 0.81 | 0.95 | 1.00 | 0.90 |
| STN | 0.91 | 0.86 | 0.77 | 0.89 | 0.90 | 1.00 |
| New York | EWR | HPN | JFK | ISP | LGA | |
| EWR | 1.00 | 0.80 | 0.89 | 0.76 | 0.93 | |
| HPN | 0.80 | 1.00 | 0.76 | 0.75 | 0.82 | |
| JFK | 0.89 | 0.76 | 1.00 | 0.72 | 0.92 | |
| ISP | 0.76 | 0.75 | 0.72 | 1.00 | 0.79 | |
| LGA | 0.93 | 0.82 | 0.92 | 0.79 | 1.00 | |
Table A4.
Homogenization result of RN.
Table A4.
Homogenization result of RN.
| Greater Bay | CAN | SZX | ZUH | HKG | MFM | FUO |
| CAN | 1.00 | 0.84 | 0.30 | 0.13 | 0.06 | 0.02 |
| SZX | 0.84 | 1.00 | 0.34 | 0.10 | 0.06 | 0.03 |
| ZUH | 0.30 | 0.34 | 1.00 | 0.15 | 0.17 | 0.11 |
| HKG | 0.13 | 0.10 | 0.15 | 1.00 | 0.26 | 0.04 |
| MFM | 0.06 | 0.06 | 0.17 | 0.26 | 1.00 | 0.13 |
| FUO | 0.02 | 0.03 | 0.11 | 0.04 | 0.13 | 1.00 |
| London | LCY | LGW | LHR | LTN | SEN | STN |
| LCY | 1.00 | 0.23 | 0.14 | 0.21 | 0.11 | 0.19 |
| LGW | 0.23 | 1.00 | 0.36 | 0.42 | 0.07 | 0.48 |
| LHR | 0.14 | 0.36 | 1.00 | 0.20 | 0.03 | 0.23 |
| LTN | 0.21 | 0.42 | 0.20 | 1.00 | 0.14 | 0.49 |
| SEN | 0.11 | 0.07 | 0.03 | 0.14 | 1.00 | 0.11 |
| STN | 0.19 | 0.48 | 0.23 | 0.49 | 0.11 | 1.00 |
| New York | EWR | HPN | JFK | ISP | LGA | |
| EWR | 1.00 | 0.08 | 0.63 | 0.04 | 0.62 | |
| HPN | 0.08 | 1.00 | 0.10 | 0.30 | 0.11 | |
| JFK | 0.63 | 0.10 | 1.00 | 0.05 | 0.37 | |
| ISP | 0.04 | 0.30 | 0.05 | 1.00 | 0.07 | |
| LGA | 0.62 | 0.11 | 0.37 | 0.07 | 1.00 | |
Table A5.
Homogenization result of BS.
Table A5.
Homogenization result of BS.
| Greater Bay | CAN | SZX | ZUH | HKG | MFM | FUO |
| CAN | 1.00 | 0.89 | 0.43 | 0.66 | 0.47 | 0.13 |
| SZX | 0.89 | 1.00 | 0.50 | 0.67 | 0.53 | 0.15 |
| ZUH | 0.43 | 0.50 | 1.00 | 0.56 | 0.63 | 0.33 |
| HKG | 0.66 | 0.67 | 0.56 | 1.00 | 0.48 | 0.21 |
| MFM | 0.47 | 0.53 | 0.63 | 0.48 | 1.00 | 0.22 |
| FUO | 0.13 | 0.15 | 0.33 | 0.21 | 0.22 | 1.00 |
| London | LCY | LGW | LHR | LTN | SEN | STN |
| LCY | 1.00 | 0.21 | 0.07 | 0.35 | 0.12 | 0.37 |
| LGW | 0.21 | 1.00 | 0.37 | 0.60 | 0.18 | 0.66 |
| LHR | 0.07 | 0.37 | 1.00 | 0.29 | 0.48 | 0.30 |
| LTN | 0.35 | 0.60 | 0.29 | 1.00 | 0.54 | 0.74 |
| SEN | 0.12 | 0.18 | 0.48 | 0.54 | 1.00 | 0.28 |
| STN | 0.37 | 0.66 | 0.30 | 0.74 | 0.28 | 1.00 |
| New York | EWR | HPN | JFK | ISP | LGA | |
| EWR | 1.00 | 0.25 | 0.78 | 0.27 | 0.76 | |
| HPN | 0.25 | 1.00 | 0.23 | 0.48 | 0.40 | |
| JFK | 0.78 | 0.23 | 1.00 | 0.29 | 0.64 | |
| ISP | 0.27 | 0.48 | 0.29 | 1.00 | 0.34 | |
| LGA | 0.76 | 0.40 | 0.64 | 0.34 | 1.00 | |
Table A6.
Homogenization result of the third layer.
Table A6.
Homogenization result of the third layer.
| Greater Bay | CAN | SZX | ZUH | HKG | MFM | FUO |
| CAN | 1.00 | 0.87 | 0.46 | 0.54 | 0.36 | 0.31 |
| SZX | 0.87 | 1.00 | 0.49 | 0.30 | 0.41 | 0.35 |
| ZUH | 0.46 | 0.53 | 1.00 | 0.49 | 0.42 | 0.51 |
| HKG | 0.54 | 0.30 | 0.49 | 1.00 | 0.45 | 0.34 |
| MFM | 0.36 | 0.41 | 0.42 | 0.45 | 1.00 | 0.44 |
| FUO | 0.31 | 0.35 | 0.51 | 0.34 | 0.44 | 1 |
| London | LCY | LGW | LHR | LTN | SEN | STN |
| LCY | 1.00 | 0.49 | 0.38 | 0.32 | 0.06 | 0.6 |
| LGW | 0.49 | 1.00 | 0.66 | 0.67 | 0.39 | 0.73 |
| LHR | 0.38 | 0.66 | 1.00 | 0.49 | 0.32 | 0.49 |
| LTN | 0.32 | 0.67 | 0.49 | 1.00 | 0.28 | 0.77 |
| SEN | 0.06 | 0.39 | 0.32 | 0.28 | 1 | 0.47 |
| STN | 0.60 | 0.73 | 0.49 | 0.77 | 0.47 | 1 |
| New York | EWR | HPN | JFK | ISP | LGA | |
| EWR | 1 | 0.36 | 0.79 | 0.34 | 0.74 | |
| HPN | 0.36 | 1 | 0.33 | 0.28 | 0.32 | |
| JFK | 0.79 | 0.33 | 1 | 0.33 | 0.64 | |
| ISP | 0.34 | 0.28 | 0.33 | 1 | 0.28 | |
| LGA | 0.74 | 0.32 | 0.64 | 0.28 | 1 | |
References
- Moxon, R. Trends in airport surface access in the London multi-airport system. J. Air Transp. Stud. 2016, 7, 1–28. [Google Scholar] [CrossRef]
- Nikorowicz-Zatorska, K. Interrelationships between municipal spatial policy strategy and airport operation and development. Lodz airport case study. Urban Dev. Issues 2018, 59, 65–79. [Google Scholar] [CrossRef]
- Liao, W.; Cao, X.; Li, S. Competition and sustainability development of a multi-airport region: A Case study of the Guangdong–Hong Kong–Macao greater bay area. Sustainability 2019, 11, 2958. [Google Scholar] [CrossRef]
- Cheung, T.; Wong, W.; Zhang, A.; Wu, Y. Spatial panel model for examining airport relationships within multi-airport regions. Transp. Res. Part A Policy Pract. 2020, 133, 148–163. [Google Scholar] [CrossRef]
- Teixeira, F.; Derudder, B. Spatio-temporal dynamics in airport catchment areas: The case of the New York multi airport region. J. Transp. Geogr. 2021, 90, 102916. [Google Scholar] [CrossRef]
- Matsumura, T.; Matsushima, N. Airport privatization and international competition. Jpn. Econ. Rev. 2012, 63, 431–450. [Google Scholar] [CrossRef]
- Kawasaki, A. Airport privatization competition including domestic airline markets. Rev. Urban Reg. Dev. Stud. 2016, 29, 2–17. [Google Scholar]
- Bao, D.; Hua, S.; Gu, J. Relevance of airport accessibility and airport competition. J. Air Transp. Manag. 2016, 55, 52–60. [Google Scholar] [CrossRef]
- Liu, Y.; Yuan, J. Promoting the construction of Chengdu free trade zone with the advantages of the airport. J. Southwest Jiaotong Univ. (Soc. Sci.) 2014, 15, 67–72. [Google Scholar]
- Mao, H. Research on mechanism innovation and regional policy of Beijing-Tianjin-Hebei coordinated development. Adv. Geogr. Sci. 2017, 36, 2–14. [Google Scholar]
- Legal Affairs Department of Capital Airports Holding Company. Collaborative Rule of Law in Cross-Regional Airport Development: From the Perspective of Cross-Regional Operation of Beijing Daxing International Airport and Beijing-Tianjin-Hebei Airports Coordinated Development; Beijing University of Aeronautics and Astronautics: Beijing, China, 2019; Volume 32, pp. 103–109+135. (In Chinese) [Google Scholar]
- Yang, Y.; Chen, Z.; Yang, X. Analysis on the coordinated development positioning of the pearl river delta airport cluster. Aeronaut. Comput. Technol. 2016, 46, 53–55. (In Chinese) [Google Scholar]
- He, S. Research on the development path of Chengdu aviation economic industry under the background of Sichuan free trade zone construction. World Econ. Res. 2019, 8, 51–59. (In Chinese) [Google Scholar] [CrossRef]
- Wang, X. Study on the relationship between airport clusters and regional coordinated development—taking the airport clusters in the Yangtze river delta as an example. Mod. Manag. 2022, 12, 449–462. [Google Scholar] [CrossRef]
- Hess, S.; Polak, J. Mixed logit modelling of airport choice in multi-airport regions. J. Air Transp. Manag. 2005, 11, 59–68. [Google Scholar] [CrossRef]
- Blackstone, E.; Buck, A.; Hakim, S. Determinants of airport choice in a multi-airport region. Atl. Econ. J. 2006, 34, 313–326. [Google Scholar] [CrossRef]
- Fuellhart, K. Airport catchment and leakage in a multi-airport region: The case of Harrisburg International. J. Transp. Geogr. 2007, 15, 231–244. [Google Scholar] [CrossRef]
- Loo, B. Passengers’ airport choice within multi-airport regions (mars): Some insights from a stated preference survey at Hong Kong International Airport. J. Transp. Geogr. 2008, 16, 117–125. [Google Scholar] [CrossRef]
- Fasone, V.; Maggiore, P. Airport development and sustainability: A case of multi-airport system in Italy. Int. J. Sustain. Aviat. 2014, 1, 13–24. [Google Scholar] [CrossRef]
- Ishii, J.; Jun, S.; Van Dender, K. Air travel choices in multi-airport markets. J. Urban Econ. 2009, 65, 216–227. [Google Scholar] [CrossRef]
- Paliska, D.; Drobne, S.; Borruso, G.; Gardina, M.; Fabjan, D. Passengers’ airport choice and airports’ catchment area analysis in cross-border upper Adriatic multi-airport region. J. Air Transp. Manag. 2016, 57, 143–154. [Google Scholar] [CrossRef]
- Carstens, S. Domestic airport passenger access mode choice decisions in a multi-airport region of South Africa. J. Transp. Supply Chain Manag. 2014, 8, 1. [Google Scholar] [CrossRef]
- Muñoz, C.; Cordoba, J.; Sarmiento, I. Airport choice model in multiple airport regions. J. Airl. Airpt. Manag. 2017, 7, 1. [Google Scholar] [CrossRef]
- Xu, A.; Chen, X.; Zhu, J. Analysis of passenger travel decision-making behavior in airport groups based on cumulative prospect theory. Transp. Syst. Eng. Inf. 2018, 18, 14–21. (In Chinese) [Google Scholar]
- Research on structural characteristics of homogeneity development of multi-airport in Yangtze river delta region. In Proceedings of the 19th COTA International Conference of Transportation Professionals CICTP 2019, Nanjing, China, 6–8 July 2019; pp. 77–89.
- Zhang, J. Air Route Evaluation and Optimization of Beijing-Tianjin-Hebei Regional Multiple Airport System. Master’s Thesis, Nanjing University of Aeronautics & Astronautics, Nanjing, China, 2019. [Google Scholar]
- Fu, C.; Wang, Y.; Li, C. Self-healing characteristics of aviation network under different growth mechanisms. J. Beijing Univ. Aeronaut. Astronaut. 2018, 44, 1221–1229. (In Chinese) [Google Scholar]
- Wang, K.; Zhu, J.; Zhu, X. Game-based analysis on motive of regional air route cooperation. J. Southwest Jiaotong Univ. 2022, 50, 557–561. (In Chinese) [Google Scholar]
- Jiang, Y.; Wang, L.; Jiang, X.; Lu, J. Spatial-temporal evolution of multi-airports’ homogenization in China Yangtze river delta. Procedia-Soc. Behav. Sci. 2013, 96, 1402–1411. [Google Scholar] [CrossRef]
- Krishnan, A.; Kasim, M.; Hamid, R.; Ghazali, M. A modified CRITIC method to estimate the objective weights of decision criteria. Symmetry 2021, 13, 973. [Google Scholar] [CrossRef]
- Karakikes, I.; Nathanail, E. Using the Delphi method to evaluate the appropriateness of urban freight transport solutions. Smart Cities 2020, 3, 1428–1447. [Google Scholar] [CrossRef]
- Antonin, B.; Ludovic, H. Normalized Euclidean distance matrices for human motion retargeting. In Proceedings of the Tenth International Conference on Motion in Games, Barcelona, Spain, 8 November 2017. [Google Scholar]
| Publisher’s Note: MDPI stays neutral with regard to jurisdictional claims in published maps and institutional affiliations. |
© 2022 by the authors. Licensee MDPI, Basel, Switzerland. This article is an open access article distributed under the terms and conditions of the Creative Commons Attribution (CC BY) license (https://creativecommons.org/licenses/by/4.0/).


