1. Introduction
While almost every industry branch is striving to reduce emissions nowadays, the aviation sector must also examine ways to improve aircraft for a more sustainable future. Up to now, aircraft in the regional airliner class with a seat capacity of around 50 passengers are propelled either by turbofans or, even more commonly, by turboprops [
1,
2]. To improve these state-of-the-art propulsion concepts, ways need to be found that have the potential to reduce fossil fuel consumption and to avoid the associated emissions in the most harmful areas [
3]. Drastic improvements can only be achieved by rethinking the propulsion of the aircraft.
A promising way forward for this class of transport aircraft can be hybrid-electric propulsion. In the research project FutPrInt50, researchers are working on an approach to accelerate the introduction of a hybrid-electric regional aircraft for an entry into service in 2035–2040. However, the multitude of available power and energy sources allows for various powertrain architectures and specifications. To quickly assess multiple combinations of propulsion system components, an initial sizing method was developed in this work. Selected subsystems of the hybrid-electric powertrain are developed in parallel within the project. This requires first estimates on aircraft level to develop system models and to size the subsystems. Therefore, a conceptual study considering various hybrid-electric powertrain architectures was conducted, highlighting the flight performance and, more importantly, their energy and power budget. While this mainly helps to provide input values to the subsystem developers, this will also serve as the basis of the preliminary aircraft design and down-selection in the later stage of the project.
The paper will focus specifically on hybrid-electrically propelled regional aircraft. This enables the discussion of specific features that were built into this calculation method. For example, a parameter sweep feature that allows us to quickly generate a mighty set of converged aircraft configurations. This can subsequently be processed by a figure-of-merit analysis. Furthermore, this method allows us to modify the energy management strategy for every mission segment separately. With this, the method provides a strong and powerful modification tool within the hybrid-electric aircraft development process.
As hybrid-electric propulsion is relatively new to the aircraft development, a thorough safety assessment must supplement the initial sizing work. The most important new aspects of the powertrain setup are investigated in different safety analyses. Different failure scenarios of each subsystem and their impact on the aircraft design are analyzed. The assessment subsequently flows back into the initial sizing loop and adapts its modeling.
Validation is ambiguous as there are no hybrid-electric aircraft of this size constructed to this day. The only way would be to put a conventional aircraft configuration in this initial sizing process; however, those configurations were never sized to the specific requirements within FutPrInt50 demand. Therefore, the main focus in this work lies on the methods. The results depend on the input parameters, which do not yet provide a detailed level of accuracy during initial sizing. This work introduces a way to analyze different scenarios which are able to capture the wide range of technology forecasts for various subsystems of hybrid-electric aircraft.
Section 2 sets the framework for the design studies. All the requirements and assumptions required for the calculations are presented here.
Section 3 provides information on the methodology of the initial sizing and safety assessment. Afterwards, the results of the initial sizing are described and discussed in
Section 4. In
Section 5, the most important findings are summarized and an outlook is given.
2. Input Data
The initial sizing is developed as a partially automated script. To enable this, specific parameters, boundary conditions and values are defined prior to the execution of the tool. In most cases, these are the design decisions made by the aircraft designers. The parameters are presented in the following subsections. At first, the boundaries of the research project are explained to give an overview on all criteria the aircraft must fulfill. Afterwards, the hybrid-electric powertrain is explained in more detail for various architectures. Finally, all technological assumptions that are used in the calculation process are presented.
2.1. Top-Level Aircraft Requirements and Flight Mission
This initial sizing method is created in the framework of the F
utP
rI
nt50 project. In order to concentrate the efforts on the hybrid-electric aircraft investigated, various top-level aircraft requirements (TLARs) and reference flight missions were formulated in previous analyses within this project. These specifications are briefly summarized in
Table 1 but can be surveyed in full detail in [
4]. These TLARs serve as input data for the initial sizing method.
The aircraft investigated in this work is a regional airliner with a maximum seat capacity of up to 50 passengers. The aircraft is sized for a maximum range of 800 km with design payload. In addition to those range values, a reserve capacity must still be possible, consisting of a missed approach, a 185 km diversion to an alternate airport and a 30-minute holding phase. The reference flight mission is outlined in
Figure 1. The take-off field length (TOFL) shall remain under 1000 m. This applies to the maximum take-off mass (MTOM) with International Standard Atmosphere (ISA) conditions at sea level and for a paved runway. The landing distance should not be longer than the TOFL.
2.2. Hybrid-Electric Powertrain Architectures and Their Subsystems
A hybrid-electric architecture combines two or more different energy sources to provide power. The investigated architectures aim at maximizing synergistic effects between the powertrain, the airframe and the power source. Due to the multitude of options available, the characteristics of the architectures can be substantially different. In turn, this determines the subsystems to be installed in the powertrain and airframe.
The following section serves as an overview of the subsystems of the powertrain. Thereafter, the investigated architectures and their characteristics are presented.
2.2.1. Hybrid-Electric Powertrain Subsystems
The commonly investigated combination in current studies is a powertrain consisting of a gas turbine in combination with a battery. For the initial sizing, the gas turbine can either be used as a conventional aircraft engine powering a propeller (turboprop) or as an independent gas turbine powering a generator. The generator converts mechanical power into electrical power which in turn can be used by electric propulsors. Additionally, hybrid-electric propulsion allows boosting gas turbines with electric motors which will be explained in further detail in
Section 2.2.2. The gas turbines can use different propellants: Jet A-1, Sustainable Aviation Fuel (SAF) and Liquid Hydrogen (LH2), with relatively few changes to the gas turbine [
5]. However due to the environmental impact, only SAF and LH2 were considered in these studies. Beside gas turbines, also fuel cells are considered a primary power source. Though in this work, only the combination of hydrogen and oxygen is considered, other options of fuels and oxidants are out of scope.
As secondary or ancillary power source, batteries are considered in this work. They are installed as packs (assemblies of cells and modules) into the aircraft. Due to their low specific energy in comparison to fuel, they can take up a significant share of the aircraft’s empty mass while providing only a fractional amount of energy. For very short, high-power needs like during take-off, supercapacitors can be installed as well. Though, they are not considered in this initial sizing.
Hybrid-electric powertrains always include electric motors. They are either used to power propellers or to boost gas turbines through a gearbox or coupling [
6]. Due to their smaller dimensions compared to gas turbines, they offer new potential propulsor installation locations. Furthermore, some motors can also be used as a motor generator combination. This is helpful when a power regeneration is intended in certain flight segments. In this work, however, no regeneration is considered at this stage.
Hybrid-electric powertrains require some additional equipment in order to form a functioning electric circuit. A smooth power distribution requires a power management and distribution unit (PMDU). Additionally, converters are installed to converge different power supplies into one. While it is assumed that the largest share of the electric circuit is run with direct current, generators and electric motors mostly use alternating current. Therefore, inverters and rectifiers must be included. In addition, the hybrid-electric powertrain poses new demands and challenges to the thermal management system (TMS) as the added subsystems also produce excess heat due to inefficiencies. It must provide optimal operating temperatures for each electric system. A TMS model covering the high technological demands of hybrid-electric aircraft is still under development and, therefore, not part of this analysis [
7].
2.2.2. Selection of Architectures
Various powertrain architectures are developed, based on the findings from earlier state-of-the-art explorations [
8]. They are constructed in such a way that various effects can be investigated within the initial sizing process. The different architectures are listed in
Table 2 and are described in more detail in the following paragraph. For complexity reasons, a maximum of two propulsor variants within each architecture are considered.
As a reference, a conventional architecture was defined. It is called Architecture 0. This means that the main components of the powertrain are a fuel tank for SAF and turboprop engines which provide power. Architecture 1 features the first actual hybrid-electric powertrain. It is a parallel hybrid concept, which is the basis for most of the architectures shown here. In this case, the turboprop engines are each connected to an electric motor through a gearbox. This allows an electric boost of the engines in high-power flight mission segments. Thereby, the turboprop engines can be downsized, saving mass, complexity and costs [
9,
10]. The booster motors are powered by one or more battery packs. For Architecture 2, the powertrain is extended by wing tip propellers (WTPs). Both of these propellers are driven by an electric motor. Through their placement in the vicinity of the wing tip, an aerodynamic improvement is expected due to positive interactions with the wing tip vortex [
11]. The electric energy for the WTPs is provided by the battery packs as well. For a better overview, this hybrid-electric architecture is outlined in
Figure 2. All other corresponding architecture drawings and explanations on the abbreviations and color scheme can be found in
Appendix A (
Figure A1,
Figure A2,
Figure A3,
Figure A4,
Figure A5,
Figure A6).
Architecture 3 is also a derivative of Architecture 1. In this case no WTPs are considered but a boundary layer ingestion (BLI) propulsor is added. In this work, BLI is defined as a propeller powered by an electric motor and placed at the rear end of the fuselage. Similarly to the WTPs, the aim is to improve aerodynamic performance. In this case the low energy boundary layer of the fuselage is reenergized and thus, fuselage drag is reduced [
12,
13]. Architecture 4 features a serial hybrid-electric architecture with the gas turbine connected to generators for power generation. The thrust propelling the aircraft is produced by distributed electric propulsion (DEP) along the whole wing including WTPs, all driven by electric motors. Detailed effects are discussed in
Section 2.3. From Architecture 5 on, the propellant is switched from SAF to LH2. Due to extensive changes to the fuel tank and distribution system, major effects on the aircraft, like an increase in volume and empty mass, are expected. The architecture is powered by two turboprop engines injected with hydrogen. Furthermore, the batteries power WTPs. To build up knowledge about the total elimination of gas turbines as power source, the last architecture is introduced: Architecture 6 connects DEP and WTPs to a fuel cell which is used as primary power source.
The scheme drawings also show some paths which feed energy back into the electric energy storage. While this characteristic is planned for the final hybrid-electric architectures, it is not considered in this initial sizing.
2.2.3. Use of Hybridization Factors
The initial sizing method differentiates between four individual hybridization factors. They each define specific characteristics of the different hybrid-electric powertrains. The most common factor in other works on hybrid-electric propulsion is the hybridization factor of power
. As Equation (
1) shows, it is defined as the ratio of the propulsive power from electric motor and booster shafts to the total installed propulsive power:
This value is often used to specify the general category of the powertrain architecture. While depicts a conventional powertrain, represents a serial hybrid-electric architecture. Values in between describe different variants of parallel hybrid-electric architectures. All parallel architectures (Architectures 1, 2, 3 and 5) in this work are calculated with .
The second hybridization factor in use relates to specific types of parallel architectures only. The hybridization factor for electric boost
defines the ratio of the power provided by the electric boosters, so electric motors coupled to the conventional gas turbine, to the power of all installed electric motors combined. The exact definition can be seen in Equation (
2). In there,
depicts the power of the electric motors that are specifically not used as boosters:
This leads to for Architecture 1 which only contains boosted turboprops. The serial architectures (Architectures 4 and 6) have no electric boosters installed which yields . For the parallel architectures with additional propulsors (Architectures 2, 3 and 5), is defined.
A third and very important factor is the hybridization factor of energy
. This factor, defined in Equation (
3), characterizes the actual mission energy input divided into electric and fuel energy sources. This factor can be helpful to evaluate the actual hybridization of the energies after a full calculation of the mission:
A fourth hybridization factor is used in the definition of the energy management strategies (EMS): The hybridization factor of the actual power source
. As stated before, for example,
defines a serial architecture which expresses that all the propulsive power is generated by electric motors only. However, this does not provide any information about the actual power generation. As the gas turbines also produce electric power through generators, the ratio of the energy mix from battery and fuel remains unknown. To be able to control this distribution during every separate flight mission segment, the power split is introduced. This particular factor will be explained again in more detail in
Section 3.1.3.
2.3. Technology Assumptions
Every development project must consider assumptions about the future. The technology integrated into the hybrid-electric regional aircraft within FutPrInt50 shall enable an entry into service (EIS) between 2035 and 2040. Due to the long duration for development and certification, a snapshot of the technology maturity some years before the projected EIS defines the actual performance data of the systems installed in the aircraft.
For the assumptions, two scenarios are considered—conservative and optimistic—to generate a realistic range of the possible performance data of each component. The conservative approach oftentimes presents the minimum technological values that are projected to be feasible in the early 2030s. The optimistic approach, on the other hand, represents the most daring technological specifications in these years. If no reliable forecast was available, typical values from the present day were used.
Not all data are found directly in this section. Additional tables for every subsystem implemented in the hybrid-electric powertrain are given in
Appendix B.
2.3.1. Electrical Characteristics of the Powertrain Components
Every component and device in an electric circuit is subject to losses and therefore dissipates energy, mostly in terms of heat. This energy subsequently cannot be converted into propulsive power. The ratio between the output and input energy is called the efficiency. In general, the efficiencies of each subsystem can be multiplied to yield the total efficiency of the corresponding overall system. This is also done for the entire aircraft powertrain by investigating all electric subsystems and devices installed in the corresponding architecture. All the values shown in
Table A1 are gathered from [
8].
Beside efficiency, specific energy plays a major role in hybrid-electric aircraft. This value gives the ratio between the energy of a component in regard to its mass. A hybrid-electric aircraft always combines chemical and electric energy sources. For each type, two variants are given in
Table A2. The user can select SAF or LH2 as the chemical energy source. The lower heating value of those fuels are chosen as their specific energy [
14,
15]. Since this value is well established and chemically fixed, there are no differences between the conservative and optimistic scenarios.
The sole component for electrical energy storage that is considered in the initial sizing is a lithium-ion battery. For this subsystem, a lot of different values exist. The figures used in this study are based on data from [
8,
16]. It must be noted that those values apply to system level. The battery is installed as a pack, including control systems, insulation and casing resulting in a much lower specific energy than on pure cell level. In addition, realistic discharging scenarios need to account for a reserve margin in order to conserve battery life. This means that the full depth of discharge may not be used completely during regular operations [
8]. This battery characteristic is out of scope of this work; though, it will have to be incorporated in future analyses.
In most cases, the specific energy plays the substantial role for battery performance in the future propulsion of aircraft. However, due to the very high powers that the electric powertrains need to handle, the specific power can also become the dominant sizing parameter for the batteries. By packing battery cells the maximum energy of the total battery pack can be increased. However, the maximum power of the pack must also be considered, as major loads will occur during take-off and climb.
It is important to note that the battery is defined by the two values in these tables. The specific energy values originate from the different sizing modes of a battery. In a conventional aircraft, an increase in stored energy can be achieved by adding fuel and an increase in power by installing more powerful gas turbines, respectively. However for batteries, these two parameters are interconnected. Maximizing either energy or power almost always has an inverse effect on the other [
17]. An optimum has to be found when considering power and energy requirements to fulfill the specified mission. In this study, the decision on one of those two values is prefixed in the architecture specification.
For other electrical components (e.g., converters, inverters, etc.), the specific power is the essential performance characteristic used in this paper. The values are listed in
Table A3.
2.3.2. Aerodynamic Estimations
Due to the little knowledge on the overall aircraft at this stage, simple assumptions were made for aerodynamic performance in different mission sections. The performance is characterized by the lift-to-drag ratio (L/D). Similar to the other assumptions, estimates for both scenarios are given in
Table 3. These are based on previous experience with similar aircraft and coarse analyses of exemplary wing geometries. Any change in L/D within a mission segment due to burnt fuel is neglected.
To estimate the performance of a hybrid-electric aircraft, it is vital to include the aerodynamic benefits generated by the airframe-propulsor interaction [
18]. In this case due to the simplicity of the general approach, percentaged improvements were estimated from literature for the novel technologies considered (see
Table 4). The overall sum of technological improvements is added to the basic aerodynamic assumptions. These are applied to the clean climb phase as well as to the cruise and holding phase. In those segments, a significant amount of thrust is required which allows us to exploit the aerodynamic improvements. The descent, on the other hand, requires almost no thrust, thus the interaction between propulsor and wing is weak. For the holding phase, the same assumptions as for the cruise phase are used. In contrast to the other technologies, the added drag of LH2 tank fairings is present throughout the mission and is therefore included for all segments. As basis for the assumptions, ref. [
11,
19] for WTP, ref. [
18,
20,
21,
22] for DEP, ref. [
13,
23,
24,
25] for BLI and ref. [
8,
26] for LH2 were used. DEP can be installed in cruise mode or in high-lift mode. This work considers cruise mode only; however, high-lift mode can easily be implemented with adapted assumptions in specific mission segments.
2.3.3. Structural Mass Estimations
The different positions and varying numbers of propulsors, together with other powertrain equipment, influence the structural masses of the aircraft’s main components (e.g., fuselage or wing). The initial sizing method automatically applies mass adjustment factors to each architecture, depending on the technologies included. For most mass factor assumptions in this section, no separate information was found to span the technological range from conservative to optimistic. Therefore in
Table 5, the estimated values from engineering experience are used for the optimistic scenario, while the conservative column represents more cautious values of those estimates. The correcting factors are given in respect to the corresponding masses of a conventional turboprop-powered aircraft. For the propulsors, the different arrangements already known from
Section 2.2.2 are considered.
In case WTPs are installed, a reduction in wing mass can be considered. The additional weight on the outboard wing and wing tips can help counteracting the lift force on the wing, which alleviates the wing bending moment [
27]. Furthermore, the tail mass can be reduced as the WTPs can be used for yawing control support [
28]. Considering the case of One Engine Inoperative (OEI), it might seem counterintuitive to have a smaller tail as propulsors installed at the wing tip could create a strong yaw moment. However, it is assumed that the WTPs are so far away from the center of gravity that an OEI case cannot be compensated by the vertical stabilizer anyway (unless it would be unrealistically huge). Therefore, the premise is to deactivate both WTPs in case of an OEI. Considerations like these are the subject of the preliminary safety assessment described in
Section 3.2.2.
When DEP is installed on the wing, the wing area can be reduced or the aspect ratio can be increased due to aerodynamic improvements [
20]. As a growing aspect ratio is also known for wing mass increases, the wing mass in relation to wing area is assumed to go up [
29]. However, as the wing area is calculated by the wing loading, the improved wing is not considered by reducing its area in this initial sizing but by improving its aerodynamic and mass characteristics. This results in a negative mass adjustment factor. The tail mass is expected to go down too as DEP enables differential thrust being used as yaw control as well.
A BLI propeller at the aft fuselage is expected to have no direct effect on the wing mass. The tail mass, on the other hand, is increased because of additional structural reinforcements at its base [
30]. In addition, the mass of the cables laid to the BLI in the rear fuselage is included in this assumption as well.
Finally, an increase in fuselage mass is considered when LH2 tanks are installed. The tank would require the elongation of the fuselage due to the high volume of LH2 to be carried. For the tanks themselves, assumptions on the gravimetric index yield
for the conservative scenario and
for the optimistic scenario, respectively [
31].
3. Methods
This section describes the methodology to acquire the first approximate data for the aircraft design loop. Contrary to conventional configurations, a hybrid-electrically powered aircraft demands a rethought powertrain setup with new subsystems and components. Due to these new requirements, the interaction between the initial aircraft design and the safety assessment plays a significant role. Therefore, this section additionally depicts the approach on how the impacts of component failure scenarios can be determined for hybrid-electric aircraft.
3.1. Initial Sizing
In general, the initial sizing helps to provide high-level predictions within the aircraft design process. These are still on low fidelity level to ensure a quick and not too complex approach. Afterwards, those results can be used to steer decisions during the more detailed preliminary aircraft design. Specifically in hybrid-electric aircraft development, the initial sizing provides means to quickly compare different powertrain architectures at a high level.
Parameters that play a role in aircraft design are interconnected. An analytical solution is therefore very difficult to achieve. For this reason, the calculation process is based on approximating the results in iteration loops to achieve a feasible solution [
27,
32]. The continuously refined results are used as input values for each following iteration step. The initial sizing method presented here is based on this process and combines two main sizing loops. The outer iteration loop ensures that the amount of energy required for the mission can be provided (mission performance). The inner iteration loop, on the other hand, ensures that the power requirements are met for all mission segments (point performance). These loops will be explained in more detail in the following subsections, alongside descriptions of the calculation processes within.
3.1.1. Outer Sizing Loop
At the beginning of each initial sizing run, predefined values are drawn from the program to feed the aircraft modeling. The outer sizing loop is displayed in
Figure 3. In this iteration loop, the aircraft is characterized using the input data described in the previous section. This includes the TLARs, all applicable technological assumptions and the different architectures, each with their corresponding powertrain setup and their energy management strategy (see
Section 3.1.3). In addition, a sweep feature can be activated in this phase. It allows us to vary parameters to cover any range of values and converges the design. This can drastically increase the number of resulting converged aircraft configurations within one calculation run. The input information can be translated into a wing loading and power loading which is transferred into the inner sizing loop. There, the more detailed mass and power of the aircraft is iterated. The exact process within this second loop is described in the following section. In order to remain comparable, a wing loading of 400 kg/m2 and a power loading of 20 W/N was applied for all the studies that were undertaken. This also matches the wing and power loadings of suitable reference aircraft like the ATR 42-600 well.
Eventually, the resulting design from the inner loop will fulfill all point-performance constraints and satisfies the energy requirements from the previous iteration. After the inner loop is completed, the outer loop will check whether the mission energy requirements are still met in the updated design. It includes information on the total aircraft mass, component masses and power available for the mission. These point-performance values are subsequently sent into a mission solver which calculates the given results within the reference flight mission. The mission is separately specified in the outer sizing loop. Its definition is divided into discrete segments which are shown in
Figure 4. It can be seen that the sizing mission is calculated taking into account the reserve energy for the regular mission. For every mission segment, a number of characterizations in regard to the flight path are defined in the mission file (e.g., flight path angle during approach).
Beside results about the amount of energy and fuel mass, the main result of the outer sizing loop is a new estimation of the MTOM. This value is compared to the starting value from the beginning of the loop. In case the difference of the two values (so-called delta) is greater than the predefined stop criterion, the newly calculated results are sent into a feedback loop back to the next iterative step with updated starting values. The initial sizing loop is run until the stop criterion is undercut. When the outer sizing loop has converged, the initial sizing is complete and an aircraft design with a well-balanced powertrain arrangement has been determined. This is repeated for additional variants when the parameter sweep feature is activated.
3.1.2. Inner Sizing Loop
The process of the inner sizing iteration is illustrated in
Figure 5. To conduct the basic iteration of the aircraft design, it receives a complete aircraft definition data set from the outer sizing loop. This includes the architecture specification with the separate hybridization factors. The power loading and the hybridization factors are used to construct the size of the powertrain components. This of course is only a first guess as the maximum power depends on the MTOM which is an arbitrary starting value in the first iteration loop.
The information on the sized powertrain subsystems is then transferred to a mass estimation function. This file uses the mass estimation from [
27] in order to estimate the mass of the main components of the aircraft (e.g., fuselage and wing). In addition, the mass of the powertrain components are approximated through their values of specific power and specific energy. All of those single masses are added up to build the operating mass empty (OME). Adding payload mass from the TLARs and fuel mass from the last iteration yields the MTOM. Just like in the outer loop, this value is compared to its original value at the beginning of the inner sizing loop. The iteration run stops as soon as the delta is below the stop criterion. Thereafter, the fully converged aircraft is transferred back to the outer sizing loop.
3.1.3. Energy Management Strategies
Hybrid-electric aircraft can make use of various options to provide the power required to propel the aircraft. Energy management strategies are implemented to account for the different options and to enable the aircraft designer to fine-tune the design. In this work, the EMS are used in the outer sizing loop, serving two purposes: First, a way to prioritize different power or energy sources in each mission segment. Second, a way to split the power provision between components with same priority. In addition, the priority level allows the designer to prevent the usage of particular energy sources. This is for example useful during taxiing, which the Flightpath 2050 goals require to be completely emission-free [
3].
A component is disregarded in the specified mission segment when a priority level of zero is assigned to it. For all other positive integers, the lower the priority level, the earlier the component will be used to provide power to the propulsion system. Situations may arise where all components on a specific priority level are not sufficient to provide the required power. The components on this priority level will then be operated at maximum power and the components of the next priority level will be included to provide additional power. This process is repeated until the required power is provided or no component is available anymore. Normally, the point performance estimation within the inner sizing loop already prevents the occurrence of having not enough power and no further power source available.
Another case to be solved is the situation where several components are assigned the same priority and together they provide sufficient power in the segment. In these cases, a desired power split defines the distribution. If no desired power split is specified, the tool tries to distribute the power equally on all components. In both cases, equal distribution or desired split, the split is adjusted when it cannot be met due to maximum allowed power for any component. The split is adapted in such a way that the component that reached maximum power is kept running at this level and the rest of the required power is provided by the remaining components. The code will repeat this procedure until the available power results in the required thrust.
3.2. Safety Assessment
A large part of designing an aircraft consists of showing that the resulting aircraft is safe. Before the concept resulting from the initial sizing process is progressed into the next design iteration, a preliminary safety assessment should be performed. The results of this assessment provide insight into the required redundancies which has a direct effect on aircraft mass, power requirements and space allocations. Based on the results of the safety assessment, among other feedback, a next design iteration can be performed.
Safety considerations are the basis for airworthiness certification. The European Union Aviation Safety Agency (EASA) has published Certification Specifications (CS) for large airplanes, the so-called CS-25. This CS contains paragraph CS 25.1309 which is aimed at achieving an acceptable level of safety for aircraft systems and equipment, taking into account the integration of those systems and equipment into the aircraft. The acceptable means of compliance (AMC) and guidance material (GM) to CS 25.1309, also published by EASA, provide methods to determine whether the aircraft equipment and systems comply with these requirements [
33]. This guidance is to supplement engineering and operational judgment, which is always the starting point for compliance demonstration.
It is common practice in (preliminary) aircraft design to perform safety assessments in accordance with the AMC to the CS applicable to that type of aircraft, that is, in the case of regional aircraft in accordance with the AMCs to CS 25.1309.
3.2.1. General Method
A generally accepted method is to perform a safety analysis in accordance with the ARP 4754A/ED-79A [
34] and the ARP 4761 [
35]. The general principle is that an inverse relationship should exist between the probability of a failure condition and its effect on the aircraft and/or its occupants, as is shown in
Figure 6. The definitions of the various failure condition classifications is given by the AMC to CS 25.1309, which also provide a definition of the quantification of the probability of occurrence. When showing compliance of an aircraft design as a whole to CS 25.1309, it is advised to start with a top-down approach on functional level by means of a Functional Hazard Analysis (FHA). This top-down approach is particularly convenient in the preliminary aircraft design phase when the interfaces between various systems are not yet clearly defined. The FHA provides input to the determination of the required redundancies and design assurance levels. In the conceptual design of a novel aircraft type, the use of novel technologies makes it difficult to estimate failure probabilities for systems or components. This is another reason why it is convenient to start by performing an FHA.
The FHA starts by identifying the function of an aircraft, system or product and determining what will happen to the aircraft, its occupants and its surroundings when the function cannot be fulfilled. These functional failure effects can be classified in accordance with CS 25.1309 ranging from ‘no safety effect’ to ‘catastrophic’. The classifications lead to the required probability of the functional failure occurring. Using the FHA results, Fault Tree Analyses (FTAs) can be created on system level. This is a bottom-up approach that shows the probability of a system function failing. Combining the required probability from the FHA with the probability determined in the FTA, a conclusion can be drawn on the required amount of redundancy for functions or systems. Since failure probabilities are not yet determined for technology that is under development, in this stage estimations and predictions based on experience and models are used. The use of these estimations and predictions gives at least an insight into the feasibility of the technical solution under consideration. During later design stages the estimations and predictions of failure probabilities will become more accurate, and the safety assessment will go through several iterations.
3.2.2. Integrated Safety Analysis for the Initial Sizing
In this work, the FHA is used to identify the functional failures of the initial sizing and design. The initial design efforts, as described earlier, show similar functions where the specific systems to fulfill those functions are interchanged. To prevent the creation of multiple similar FHA documents, one FHA is created to incorporate all initial design efforts. Per design, a summary of design related findings is stated, accompanied by FTAs on the most important functional failures. These efforts are summarized, per concept, in preliminary aircraft safety assessment (PASA) documents. This process is summarized in a flowchart overview in
Figure 7. It is important to note that the work done now is primarily on the aircraft level. The maturing of the design towards the preliminary and eventually detailed design will create a shift to the system level and the safety analysis at that level.
The conceptual nature of the initial sizing effort introduces uncertainties to the safety analysis at hand. A more conservative approach is used to deal with uncertainties, to challenge the designers to find solutions. That is why the concept of functional development assurance levels (FDALs) for the general aircraft systems is used to translate the safety analysis into a design action. FDAL ratings range from A representing `catastrophic’ to E representing ‘no safety effect’. Furthermore, safety considerations can be mentioned per design where the detailing of the design will change the analysis at hand.
4. Results and Discussion
The following subsections present the results of the architecture analyses explained in the previous sections. Three main impacts on the aircraft design are examined. At first, the effects of installing WTPs and BLI are discussed. Thereafter, the investigation of installing DEP is shown. At last, the impact of a fuel switch from SAF to LH2 is investigated. This covers LH2 combustion in gas turbines as well as the use of fuel cells as primary power source. For those technologies, the resulting values from the initial sizing are presented for the corresponding architectures (see
Table 2). This is followed by a description of the most essential findings from the integrated safety assessment, which was incorporated into the initial sizing and thus strongly influenced it.
In order to define a reference in this particular initial sizing method, a conventional configuration is calculated first. To facilitate matters, the amount of energy from fuel consumed during the mission is the key measure in this study. It serves as the reference to compare conventional to hybrid-electric aircraft. A more detailed approach, including calculations on the resulting emissions or an elaborate analysis of the total figure of merit, will be performed in the subsequent preliminary aircraft design. For the hybrid-electric aircraft, it is assumed that all electrical charging power can be drawn from renewable energies, making it CO2-neutral.
Table 6 shows data on the mass, power and required energy for both technological scenarios. The mission consists of the 800 km flight profile and the reserve defined in
Section 2.1.
The estimation of MTOM might be distracting at first sight as it is unusually low in comparison to actual conventional regional aircraft flying today. This is primarily due to the drastic reduction of the range requirement in the TLARs in order to adapt the mission specifically to hybrid-electric aircraft. Other reasons include using a slightly higher wing loading in the calculations which affects the wing mass and therefore the aircraft’s structural mass in a positive way. However, it is important to note that this initial sizing method is specialized on mapping trends instead of generating absolute results. Substantial absolute values of general aircraft parameters can be produced more reliably in the preliminary aircraft design phase as it also includes a sophisticated mass calibration method.
The improvement of the values in the optimistic scenario mainly originates from an assumed increase of gas turbine efficiency and specific power. This shows well the far-reaching effect in aircraft design where slight improvements on one powertrain component can converge to a much smaller MTOM.
The maximum propulsive power is mainly coupled to MTOM by the power loading. The mission energy is returned in the unit as this is the common unit for electric energy storage. This way comparisons between conventional and hybrid-electric aircraft are easier. The given values for fuel energy correspond to a fuel (SAF) mass of 939 kg, and 760 kg respectively.
4.1. Impact of Using Wing Tip Propellers and Boundary Layer Ingestion
The results in this section concern the installation of WTP and BLI in parallel hybrid-electric architectures. In order to study the effect of WTP, Architectures 1 and 2 are investigated. Both architectures are the same except for Architecture 2 being complemented by a WTP at each wing tip. For the effects of the BLI, Architectures 1 and 3 are used in an analogous manner.
The key mass properties of those architectures are listed in
Table 7. When comparing within each of the technology scenarios, the separate values do not differ a lot from each other. The mass differences between the architectures result mainly from the varied setup of electric motors and the consequential effects on structural mass and aerodynamic interactions. It is important to note that the battery mass in Architectures 1–3 accounts for about 35% of the empty mass in the conservative scenario and still about 25% in the optimistic scenario.
In contrast to the previous values of the conventional aircraft (
Table 6), the difference between the conservative and the optimistic scenario for the hybrid-electric architectures is substantial. Primarily due to the major decrease of battery mass, the MTOM drops by nearly 30%. This highlights that the range of the technology assumptions for the future, and particularly the corresponding effect on the overall aircraft properties, is still significant. The assumptions leading to those results are given in
Section 2.3 and
Appendix B.
A closer view on the mission energy results is presented in
Figure 8. It becomes clear that the hybrid-electric architectures in the conservative scenario do not get close to the conventional reference. In the optimistic scenario on the other hand, the mission fuel energy for both Architectures 2 and 3 is slightly below the energy demand for a conventional configuration. This indicates that a hybrid-electric aircraft with electric boosters and WTPs or BLI installed has the potential to have a competitive fuel energy balance. It means that those two configurations are more environmentally friendly during operation than the conventional reference. The exact values for the diagram can be found in
Table A4 in
Appendix C.
In addition to the computations within the initial sizing method, the preliminary safety assessment was taken into account. It focused on new and added technologies and their integration into the aircraft. The introduction of a hybrid-electric propulsion system creates new ways of optimizing for fuel efficiency. The gas turbine engines can be downsized and optimized for the cruise condition, while the electric motors provide the boost required for take-off [
36]. However, this creates new failure conditions as an OEI condition is not as straightforward as for conventional aircraft. A WTP failure will impact the yawing moment whilst a rear BLI failure might have no impact on take-off performance (pending on type of failure). The WTP has the option to not only produce thrust but also to harvest energy, this switch in functionality needs to be considered.
The WTP specific architecture can have a motor or generator failure which will negatively impact the WTP. The outboard location and the use of an electric motor/generator impose new challenges. A mechanical fail-safe system in current turboprop engines decouples the propeller and places it in feathering mode. The electric motor, however, might not require a decoupling as the shaft is powered by magnetic coils (depending on specific design). An electric motor requires fewer rotating parts, creating less means of failure. Since electric motors are not commonly used in aircraft propulsion yet, they also introduce uncertainties. Additional measures of overcoming increased drag should be considered, for example, when the WTP fails to produce thrust or is stuck in its harvesting mode. Similarly, aeroelastic effects need to be determined for the off-design conditions in which the WTP might be operated (most probable after an engine failure of the WTP). The design of the engine mount to the wing has consequences for the (aircraft-level) effects of motor detachment. Overall, the WTP electric motor failure or detachment must not lead to a catastrophic failure condition. The probability of occurrence of an engine detachment should be ‘extremely remote’, which means the severity of the impact can be higher. The occurrence probability for loss of thrust is ‘probable’, thus the severity of impact shall be low by design. The FDAL level (
Section 3.2.2) for the WTP electric engine is set to B.
The BLI specific architecture can create undesired airframe and fuselage vibrations when considering non-uniform inflow conditions from the fuselage boundary layer. The unknown disturbed flow aft of the aircraft probably requires mitigating design measures to ensure safe operations for non-uniform inflow conditions. If this is not feasible, considerations to the engine mounting and integration into the airframe should ensure that no adverse effects are created. Despite being improbable, it can lead to a catastrophic effect, so the FDAL for the engine integration and mounting is FDAL A. For the BLI motor itself, FDAL B is to be considered (similar to the WTP).
The safety assessment findings presented here are fed back into the initial sizing iteration loop in order to review and generate the results described before.
4.2. Impact of Using Distributed Electric Propulsion
The distributed propulsion is investigated with the means of Architecture 2 and 4. While Architecture 2 features turboprop engines alongside WTPs, the latter can be described as a serial hybrid-electric architecture which uses DEP and WTPs as propulsors.
The most noteworthy comparison in
Table 8 is between the MTOMs and battery masses in the conservative scenario. While Architecture 2 has a significantly higher battery mass, its MTOM remains lower than the one of Architecture 4. This is due to the different architecture types. DEP is mostly installed in serial hybrid-electric architectures. Those architectures, however, tend to higher powertrain masses as the battery savings are fully compensated by the reduced efficiency of the gas turbines and the high number of electric motors.
In the optimistic scenario, the behavior is slightly inversed due to the improved technological assumptions. This indicates that the energy management strategies still offer potential to improve the energy usage and distribution. This should be investigated more closely in the preliminary aircraft design process where major parts of the energy management strategy could be implemented in an own optimization loop.
Table 9 shows that a serial hybrid-electric architecture with a hybridization factor of energy of just
still has the potential of undercutting the energy balance of conventional architectures in the optimistic scenario.
In this study case, the safety assessment regarding the DEP motors shows a high dependency with the aircraft design and engine integration into the wing structure. At this point, it is not yet clear what the probability is of multiple engines failing at the same time. In addition, the regulations have not yet been updated to reflect the DEP case. The worst case from the design point of view would be when a single engine failure is accepted while multiple engine failures are not. Multiple engine failure should then be prevented by design and integration. To achieve this type of redundancy, each engine shall have its own systems where no coupling may exist. Some level of coupling will probably be required to reduce system weight (e.g., cables, inverters etc.), creating the question on the number of engines that may be coupled inboard and outboard of the wing. The conceptual and detailed design needs to provide broad system information to make it feasible to model engine failures. Secondly, a DEP engine failure or improper functioning can create vibrations and unwanted aerodynamic effects on the wing. Similarly, DEP engine separation must be considered. Both cases should not lead to major adverse effects on the aircraft structure or aerodynamic properties of the wing. The FDAL for the DEP engines is set to FDAL B and the engine mounting to FDAL A.
4.3. Impact of Switching to Liquid Hydrogen
The impact of the implementation of LH2 as propellant can be investigated with Architectures 2 and 5. Both have a similar architecture but differ in the fuel type. The most important masses of the architectures are listed in
Table 10.
When comparing the MTOMs for both technological scenarios, it becomes apparent that the LH2 architecture is significantly heavier than the SAF architecture. The greatest changes can be seen in the fuel mass and, inversed, in the operating mass empty. This shows that the fuel mass reduction is overshot by the massively increased LH2 fuel tank mass and the degraded aerodynamics of the fuselage. This is also the case for the optimistic scenario because the predictions from the sources mentioned in
Section 2.3.3 do not indicate any giant leaps in regard to the gravimetric index of LH2 fuel tanks.
The numbers given in
Table 11 show that switching to LH2 does not automatically save fuel energy. In both scenarios, Architecture 5 does not consume less fuel than Architecture 2 or even the conventional reference. In more detailed analyses, like a thorough definition of a figure of merit, however, it must be considered that hydrogen combustion does not emit any CO
2 which can make it more environmentally friendly in the end.
On the other hand, the release of emissions like nitrogen oxides (NOX) and water must also be taken into account. A possibility to eliminate NOX emissions is the usage of a fuel cell. This is done in the analysis of Architecture 6. Due to the low specific power of the fuel cell in the conservative scenario, the iteration of this architecture did only converge in the optimistic scenario. These data are shown in
Table 12.
The table shows a significantly higher MTOM for Architecture 6 with the fuel cell installed. As the batteries and fuel cells must provide the entire propulsive power for the mission, these components take up massive shares of the empty mass. In addition, the LH2-tank is also adding to the empty weight with almost double the mass of how much LH2 it carries.
Due to this significant mass increase, the findings from the mission energy analysis in
Table 13 appear all the more surprising. Architecture 6 shows less mission fuel consumption than all other architectures analyzed in this initial sizing. This is because of the replacement of the gas turbines with the fuel cells. Fuel cells offer a better efficiency from the energy source, the fuel tank, to the propulsors. The efficiency assumptions that went into this calculation are listed in
Table A1. In addition to a reduced energy demand, it should be highlighted again that fuel cells do not emit any CO
2 or NOX emissions. While this initial sizing focuses on the fuel energy required, an emission analysis needs to be done for realistic evaluations of the aircraft configurations.
Despite those positive environmental characteristics, a significant shortcoming of this initial sizing method is revealed by this architecture. This is the absence of realistic integration concepts. Battery packs or fuel cell stacks, with a mass between three to four tons, cannot be positioned in a regional aircraft without a proper space allocation analysis and investigation of the center of gravity. Therefore, in order to validate these results, this architecture must become subject to more detailed studies.
The usage of LH2 in itself introduces new considerations into the safety assessment. The leakage of LH2 not only creates a loss of fuel but also hazardous gases. Depending on the conditions in which the LH2 is leaking, it might self-ignite and/or explode. Additional measures are to be taken to ensure that the LH2 tank has monitoring systems and protection measures. The same holds true for the fuel lines which need to account for the transport of the LH2. This will eventually limit fuel tank locations as well as its surrounding systems, unless mitigating measures are put in place. The fuel tank within the rear of the passenger compartment for example would require the introduction of a separation wall to protect passengers in case of a hydrogen leak. Another example would be the cargo compartment where the fuel tank should not negatively impact the avionics and systems bay in case of a hydrogen leak, to ensure correct functioning of flight-critical systems. LH2 fuel tanks in the cargo compartment also lead to additional uncertainties in regard to crash requirements. This finding from the safety analysis led to the assumption in the initial sizing computations that the LH2 tanks are installed in the aft fuselage only.
In case the liquid hydrogen is directly combusted in the gas turbines, they need to account for safety measures to ensure safe combustion, for example, combustion chamber linings, fuel injector nozzles, and so forth. In case fuel cells are used to create electricity to power the electric motors, the thermal management systems need to account for an appropriate heat transfer when converting the liquid hydrogen to gaseous hydrogen and subsequently to electrical power. From quick approximation, it must be expected that several megawatts in heat are generated during the take-off run.
In summary, the storage of the liquid hydrogen should be developed to an FDAL A, where the fuel cell itself can be developed for FDAL B. The gas turbine should retain its FDAL C level, whether it is combusting the hydrogen or not. One could argue that the supporting systems should be developed under FDAL B but more design information would be required for a final decision.
5. Conclusions and Outlook
In this work, it was shown that the initial sizing method can calculate entire hybrid-electric aircraft designs on a conceptual level. The results can quickly present trends that are reasonable and will be helpful for subsequent design decisions. For a number of selected powertrain architectures, a range of results for the conservative and the optimistic scenario was determined. These data are taken as the first results which can be used in the lower-level subsystem modeling and also in the following, more detailed preliminary aircraft design within the research project.
The results from the initial sizing show that, in regard to a conventional configuration, a reduction of mission fuel can be achieved by several hybrid-electric architectures. This is due to the new possibility of combining different propulsion concepts. It is important to note, however, that these results could not be reached with the conservative assumptions. The finding that hybrid-electric powertrains do not offer great amounts of fuel energy savings, if any, is a crucial one. However, the analysis presented here remains at a coarse level. It also must be noted that the conventional reference is sized for the same specifically hybrid-electric flight mission which is significantly shorter than typical flight ranges of today’s regional turboprop aircraft. Hence, the results could not be compared to an updated ATR 42 for example. Furthermore, important additional beneficial aspects have not yet been factored in, including the systematic exploitation of synergistic effects of interconnected subsystems. In addition, selected parameters in the design process still offer the potential of performing an optimization in order to find the best characteristics of the powertrain. This is especially the case for the batteries where only one energy-sized or one power-sized battery concept is used. Adapting those to better suit the aircraft demands will reduce battery mass.
Attention should also be paid to LH2-propelled architectures. The results show that the poor prospects on the gravimetric index of LH2 tanks lead to excessive tank masses. Nevertheless, these architectures still indicate the potential of being able to be operated more environmentally friendly than other architectures. This is not only due to the eliminated CO2 emissions but also due to the erased NOX emissions when using a fuel cell. In addition, replacing the gas turbines with fuel cells as a primary power source also leads to a significant efficiency boost within the powertrain which can result in a reduced overall mission energy demand. Since battery and fuel cell represent significantly heavy components within the powertrain, a detailed space allocation analysis and an investigation of the center of gravity must be conducted. Additionally, major challenges in the field of thermal management have to be addressed.
The safety assessment gives a first insight into which levels of safety have to be considered for the different components in the development of hybrid-electric powertrains. It was determined that the engine integration and mounting of the propulsors need functional development assurance level FDAL A which is equivalent to a catastrophic failure condition effect. The same FDAL is valid for the LH2 storage. All of the other components investigated in this work received a lower FDAL rating. The design needs to account for these ratings.
Another very important outcome from this work is the identification of variables and processes that need to be adapted in order to be helpful in the preliminary aircraft design. The high-level gathering of technological assumptions leads to quick but coarse results. As mentioned before, relative deltas and trends can be reliable as all data are processed by the same algorithm. For reliable absolute values, however, more currently predefined input data must be implemented into an optimization loop within the preliminary aircraft design initiated later in the process.
Future investigation methods must include the possibility to flexibly adapt and optimize the power split during the different mission segments through various EMS. This would allow an actual interconnected sizing of all the subsystems, for example between batteries, fuel cells and also supercapacitors. In addition, the hybridization factors of power and of electric boost must be implemented into an optimization loop as well.
Author Contributions
Conceptualization, N.M. and D.E.; methodology, N.M., D.E., E.W. and J.v.d.P.; software, N.M. and D.E.; investigation, N.M., D.E., E.W. and J.v.d.P.; data curation, N.M. and D.E.; writing—original draft preparation, N.M., D.E., E.W. and J.v.d.P.; writing—review and editing, N.M., D.E., E.W., J.v.d.P. and A.S.; visualization, N.M.; supervision, A.S.; project administration, A.S. All authors have read and agreed to the published version of the manuscript.
Funding
The research leading to these results has received funding from the European Union’s Horizon 2020 Research and Innovation program under Grant Agreement No. 875551.
Institutional Review Board Statement
Not applicable.
Informed Consent Statement
Not applicable.
Acknowledgments
We thank all researchers and contributors of the entire FutPrInt50 Consortium, namely University of Stuttgart, Cranfield University, Airholding S.A., TU Delft, ADSE, CEA, EASN, Unicusano, Embraer, TsAGI, GosNIIAS, CIAM, NRC and MAI, for their valuable input.
Conflicts of Interest
The funders had no role in the design of the study; in the collection, analyses, or interpretation of data; in the writing of the manuscript, or in the decision to publish the results.
Abbreviations
The following abbreviations are used in this manuscript:
| AMC | Acceptable Means of Compliance |
| ARP | Aerospace Recommended Practice |
| BLI | Boundary Layer Ingestion |
| CS | Certification Specification |
| DEP | Distributed Electric Propulsion |
| EASA | European Union Aviation Safety Agency |
| ED | EUROCAE Document |
| EIS | Entry Into Service |
| EMS | Energy Management Strategy |
| EUROCAE | European Organization for Civil Aviation Equipment |
| FDAL | Functional Development Assurance Levels |
| FHA | Functional Hazard Assessment |
| FMDU | Fuel Management and Distribution Unit |
| FTA | Fault Tree Analysis |
| G | Electric Generator |
| GM | Guidance Material |
| ISA | International Standard Atmosphere |
| L/D | Lift-to-Drag Ratio |
| LH2 | Liquid Hydrogen |
| M | Electric Motor |
| M/G | Electric Motor and Generator |
| MTOM | Maximum Take-Off Mass |
| NOX | Nitrogen Oxides |
| PASA | Preliminary Aircraft Safety Assessment |
| PMDU | Power Management and Distribution Unit |
| OEI | One Engine Inoperative |
| OME | Operating Mass Empty |
| SAE | Society of Automotive Engineers |
| SAF | Sustainable Aviation Fuel |
| SL | Sea Level |
| TLAR | Top-Level Aircraft Requirement |
| TMS | Thermal Management System |
| TP | Turboprop |
| WTP | Wing Tip Propeller |
Appendix A
This section features the schematic drawings of all investigated architectures. Each box in dark blue represents one of the various propulsors, namely turboprop, wing tip propeller, distributed electric propulsion (DEP) and boundary layer ingestion (BLI). The light blue elements serve as components that convert energy, such as motors, generators, motor/generators, gas turbines and fuel cells. Red lines and boxes stand for electric parts, such as cables, batteries and power management and distribution units (PMDU). The green elements represent all components that process chemical energy, such as SAF or LH2 fuel tank, fuel lines and fuel management and distribution units (FMDU).
The arrows show the direction the power was originally planned to flow. In later analyses, it shall be possible to include power regeneration for example, from energy harvesting or gas turbines. In this initial sizing method however, no power regeneration was implemented at this stage.
Figure A1.
Architecture 0: Conventional reference architecture.
Figure A1.
Architecture 0: Conventional reference architecture.
Figure A2.
Architecture 1: Parallel hybrid-electric architecture with electric motors boosting the gas turbines.
Figure A2.
Architecture 1: Parallel hybrid-electric architecture with electric motors boosting the gas turbines.
Figure A3.
Architecture 3: Parallel hybrid-electric architecture with electric boosters and BLI.
Figure A3.
Architecture 3: Parallel hybrid-electric architecture with electric boosters and BLI.
Figure A4.
Architecture 4: Serial hybrid-electric architecture powering DEP and WTPs.
Figure A4.
Architecture 4: Serial hybrid-electric architecture powering DEP and WTPs.
Figure A5.
Architecture 5: Parallel hybrid-electric architecture with electric boosters and WTPs propelled by LH2.
Figure A5.
Architecture 5: Parallel hybrid-electric architecture with electric boosters and WTPs propelled by LH2.
Figure A6.
Architecture 6: Serial hybrid-electric architecture primarily powered by a fuel cell propelled by LH2.
Figure A6.
Architecture 6: Serial hybrid-electric architecture primarily powered by a fuel cell propelled by LH2.
Appendix B
Table A1.
Assumed efficiencies of powertrain components.
Table A1.
Assumed efficiencies of powertrain components.
| Description | | Conservative | Optimistic |
|---|
| Battery | | 92% | 96% |
| Converter | | 95% | 98% |
| Inverter | | 95% | 98% |
| Rectifier | | 95% | 98% |
| Cables and distribution | | 99% | 99% |
| Fuel cell | | 50% | 60% |
| Electric motor | | 90% | 96% |
| Gas turbine | | 35% | 38% |
| Electric generator | | 99% | 99% |
| Gearbox | | 98% | 99% |
| Propeller | during take-off | 64% | 64% |
| | during climb | 73% | 73% |
| | during cruise | 86% | 86% |
| | during all other segments | 80% | 86% |
Table A2.
Assumed specific energies of energy storage systems.
Table A2.
Assumed specific energies of energy storage systems.
| Description | | Conservative | Optimistic |
|---|
| | | kWh/kg | kWh/kg |
|---|
| Sustainable Aviation Fuel | | 12.2 | 12.2 |
| Liquid Hydrogen | | 32.9 | 32.9 |
| Battery (Li-ion, system level) | energy sized | 0.300 | 0.400 |
| | power sized | 0.065 | 0.130 |
Table A3.
Assumed specific powers of powertrain components.
Table A3.
Assumed specific powers of powertrain components.
| Description | | Conservative | Optimistic |
|---|
| | | kW/kg | kW/kg |
|---|
| Battery (Li-ion, system level) | energy sized | 0.70 | 0.70 |
| | power sized | 2.15 | 2.15 |
| Gas turbine | | 3.40 | 6.00 |
| Fuel cell | | 0.65 | 1.70 |
| Electric motor | | 5.00 | 10.00 |
Appendix C
Table A4.
Results on energy from the initial sizing for Architectures 1–3.
Table A4.
Results on energy from the initial sizing for Architectures 1–3.
| Description | Unit | Conservative | Optimistic |
|---|
| | | Arch 1 | Arch 2 | Arch 3 | Arch 1 | Arch 2 | Arch 3 |
|---|
| Total mission energy | kWh | 17,911 | 17,199 | 17,597 | 10,646 | 9963 | 9659 |
| Mission energy from fuel | kWh | 15,860 | 15,224 | 15,570 | 9518 | 8905 | 8627 |
| Mission energy from battery | kWh | 2051 | 1975 | 2027 | 1128 | 1059 | 1032 |
| Hybridization of energy | % | 11 | 11 | 12 | 11 | 11 | 11 |
References
- Avions de Transport Régional. ATR Turboprop Market Forecast 2018–2037. Available online: https://www.atr-aircraft.com/wp-content/uploads/2020/09/2018-MarketForecast_Digital.pdf (accessed on 1 February 2021).
- Jackson, P. Jane’s All the World’s Aircraft 2017–2018. Development & Production; IHS Global: Coulsdon, UK, 2017. [Google Scholar]
- European Commission. Flightpath 2050: Europe’s Vision for Aviation; Maintaining Global Leadership and Serving Society’s Needs; Report of the High-Level Group on Aviation Research; Policy/European Commission; Publication Office of the European Union: Luxembourg, 2011. [Google Scholar] [CrossRef]
- Eisenhut, D.; Moebs, N.; Windels, E.; Bergmann, D.; Geiß, I.; Reis, R.; Strohmayer, A. Aircraft Requirements for Sustainable Regional Aviation. Aerospace 2021, 8, 61. [Google Scholar] [CrossRef]
- Corchero, G.; Montañés, J.L. An approach to the use of hydrogen for commercial aircraft engines. Proc. Inst. Mech. Eng. Part G J. Aerosp. Eng. 2005, 219, 35–44. [Google Scholar] [CrossRef] [Green Version]
- Cameretti, M.; Del Pizzo, A.; Di Noia, L.; Ferrara, M.; Pascarella, C. Modeling and Investigation of a Turboprop Hybrid Electric Propulsion System. Aerospace 2018, 5, 123. [Google Scholar] [CrossRef] [Green Version]
- Affonso, W.; Tavares, R.; Barbosa, F.R.; Gandolfi, R.; dos Reis, R.J.N.; Da Silva, C.R.I.; Kipouros, T.; Laskaridis, P.; Enalou, H.B.; Chekin, A.; et al. System architectures for thermal management of hybrid-electric aircraft—FutPrInt50. IOP Conf. Ser. Mater. Sci. Eng. 2022, 1226, 012062. [Google Scholar] [CrossRef]
- FutPrInt50 Consortium. Subsystem Enablers and Technology Gaps: Deliverable 3.1. Publication pending.
- Hoelzen, J.; Liu, Y.; Bensmann, B.; Winnefeld, C.; Elham, A.; Friedrichs, J.; Hanke-Rauschenbach, R. Conceptual Design of Operation Strategies for Hybrid Electric Aircraft. Energies 2018, 11, 217. [Google Scholar] [CrossRef] [Green Version]
- Thorbeck, J.; Scholz, D. DOC-Assessment Method: TU Berlin—DOC Method. 2013. Available online: https://www.fzt.haw-hamburg.de/pers/Scholz/Aero/TU-Berlin_DOC-Method_with_remarks_13-09-19.pdf (accessed on 19 March 2021).
- Miranda, L.; Brennan, J. Aerodynamic effects of wingtip-mounted propellers and turbines. In Proceedings of the 4th Applied Aerodynamics Conference, San Diego, CA, USA, 9–11 June 1986; American Institute of Aeronautics and Astronautics: Reston, VA, USA, 1986. [Google Scholar] [CrossRef]
- Hoogreef, M.; de Vries, R.; Sinnige, T.; Vos, R. Synthesis of Aero-Propulsive Interaction Studies Applied to Conceptual Hybrid-Electric Aircraft Design. In AIAA Scitech 2020 Forum; American Institute of Aeronautics and Astronautics: Reston, VA, USA, 2020; p. 78037. [Google Scholar] [CrossRef]
- Drela, M. Power Balance in Aerodynamic Flows. AIAA J. 2009, 47, 1761–1771. [Google Scholar] [CrossRef] [Green Version]
- Huq, N.A.; Hafenstine, G.R.; Huo, X.; Nguyen, H.; Tifft, S.M.; Conklin, D.R.; Stück, D.; Stunkel, J.; Yang, Z.; Heyne, J.S.; et al. Toward net-zero sustainable aviation fuel with wet waste-derived volatile fatty acids. Proc. Natl. Acad. Sci. USA 2021, 118, e2023008118. [Google Scholar] [CrossRef] [PubMed]
- Klell, M.; Eichlseder, H.; Trattner, A. Wasserstoff in der Fahrzeugtechnik; Springer Fachmedien Wiesbaden: Wiesbaden, Germany, 2018. [Google Scholar] [CrossRef]
- BATTERY 2030+ Consortium. Inventing the Sustainable Batteries of the Future: Research Needs and Future Actions. Available online: https://battery2030.eu/wp-content/uploads/2021/08/c_860904-l_1-k_roadmap-27-march.pdf (accessed on 17 December 2021).
- Budde-Meiwes, H.; Drillkens, J.; Lunz, B.; Muennix, J.; Rothgang, S.; Kowal, J.; Sauer, D.U. A review of current automotive battery technology and future prospects. Proc. Inst. Mech. Eng. Part D J. Automob. Eng. 2013, 227, 761–776. [Google Scholar] [CrossRef]
- de Vries, R.; Brown, M.; Vos, R. Preliminary Sizing Method for Hybrid-Electric Distributed-Propulsion Aircraft. J. Aircr. 2019, 56, 2172–2188. [Google Scholar] [CrossRef]
- Sinnige, T.; van Arnhem, N.; Stokkermans, T.C.A.; Eitelberg, G.; Veldhuis, L.L.M. Wingtip-Mounted Propellers: Aerodynamic Analysis of Interaction Effects and Comparison with Conventional Layout. J. Aircr. 2019, 56, 295–312. [Google Scholar] [CrossRef] [Green Version]
- Conner, M. NASA Armstrong Fact Sheet: NASA X-57 Maxwell. 2019. Available online: https://www.nasa.gov/centers/armstrong/news/FactSheets/FS-109.html (accessed on 27 July 2020).
- Hepperle, M. Aspects of Distributed Payload: A View on Regional Aircraft. 2016. Available online: https://elib.dlr.de/109315/1/E2Fliegen-2016-Hepperle-DLR_Distributed%20Propulsion%202016.pdf (accessed on 1 April 2020).
- Borer, N.K.; Derlaga, J.M.; Deere, K.A.; Carter, M.B.; Viken, S.; Patterson, M.D.; Litherland, B.; Stoll, A. Comparison of Aero-Propulsive Performance Predictions for Distributed Propulsion Configurations. In AIAA SciTech Forum; American Institute of Aeronautics and Astronautics: Reston, VA, USA, 2017; p. 246. [Google Scholar] [CrossRef] [Green Version]
- Greitzer, E.M.; Slater, H.N.; Aurora Flight Sciences.; Pratt&Whitney. N+3 Aircraft Concept Designs and Trade Studies: Final Report. Available online: http://web.mit.edu/drela/Public/N+3/Final_Report.pdf (accessed on 24 April 2020).
- Uranga, A.; Drela, M.; Hall, D.K.; Greitzer, E.M. Analysis of the Aerodynamic Benefit from Boundary Layer Ingestion for Transport Aircraft. AIAA J. 2018, 56, 4271–4281. [Google Scholar] [CrossRef]
- Habermann, A.L.; Bijewitz, J.; Seitz, A.; Hornung, M. Performance bookkeeping for aircraft configurations with fuselage wake-filling propulsion integration. CEAS Aeronaut. J. 2019, 11, 529–551. [Google Scholar] [CrossRef] [Green Version]
- Westenberger, A. Hydrogen Fueled Aircraft. International Air and Space Symposium (Evolution of Flight). In Proceedings of the AIAA, Long Beach, CA, USA, 23–25 September 2003. [Google Scholar] [CrossRef]
- Raymer, D.P. Aircraft Design: A Conceptual Approach, 6th ed.; AIAA Education Series; American Institute of Aeronautics and Astronautics Inc.: Reston, VA, USA, 2018. [Google Scholar]
- Nguyen Van, E.; Troillard, P.; Jezegou, J.; Alazard, D.; Pastor, P.; Döll, C. Reduction of Vertical Tail Using Differential Thrust: Influence on Flight Control and Certification. Proceeding of Advanced Aircraft Efficiency in a Global Air Transport System (AEGATS’18), Toulouse, France, 23–25 October 2018; pp. 1–8, hal-02164023. [Google Scholar]
- Roskam, J. Component Weight Estimation, 3th ed.; Airplane Design/Jan Roskam; DARcorporation: Lawrence, KS, USA, 2003; Volume V. [Google Scholar]
- Seitz, A.; Habermann, A.L.; Peter, F.; Troeltsch, F.; Castillo Pardo, A.; Della Corte, B.; van Sluis, M.; Goraj, Z.; Kowalski, M.; Zhao, X.; et al. Proof of Concept Study for Fuselage Boundary Layer Ingesting Propulsion. Aerospace 2021, 8, 16. [Google Scholar] [CrossRef]
- Clean Sky 2 JU and FCH 2 JU. In Hydrogen-Powered Aviation: A Fact-Based Study of Hydrogen Technology, Economics, and Climate Impact by 2050, 1st ed.; Publications Office of the European Union: Luxembourg, 2020.
- Finger, D.F.; Braun, C.; Bil, C. An Initial Sizing Methodology for Hybrid-Electric Light Aircraft. In Proceedings of the 18th AIAA Aviation Technology, Integration, and Operations Conference 2018, Atlanta, GA, USA, 25–29 June 2018; Curran Associates Inc.: Red Hook, NY, USA, 2018. [Google Scholar] [CrossRef]
- EASA. Certification Specifications and Acceptable Means of Compliance for Large Aeroplanes CS-25: Amendment 25. Available online: https://www.easa.europa.eu/sites/default/files/dfu/cs-25_amendment_25.pdf (accessed on 11 November 2020).
- Landi, A.; Nicholson, M. ARP4754A/ED-79A—Guidelines for Development of Civil Aircraft and Systems—Enhancements, Novelties and Key Topics. SAE Int. J. Aerosp. 2011, 4, 871–879. [Google Scholar] [CrossRef]
- S-18 Aircraft and Sys Dev and Safety Assessment Committee. ARP4761—Guidelines and Methods for Conducting the Safety Assessment Process on Civil Airborne Systems and Equipment. [CrossRef]
- Atanasov, G. Energy Efficient Hybrid Propulsion Concept for Twin Turboprop Aircraft. 2019. Available online: https://elib.dlr.de/132688/1/2019-E2FLIGHT-Concept-3-EnergyEfficientHybridPropulsion-ATANASOV.pdf (accessed on 3 June 2020).
Figure 1.
800 km reference flight mission for the initial sizing calculations. The aircraft’s energy resources must also cover a reserve segment after the regular flight. The flight distance covered within the holding pattern is not shown here.
Figure 1.
800 km reference flight mission for the initial sizing calculations. The aircraft’s energy resources must also cover a reserve segment after the regular flight. The flight distance covered within the holding pattern is not shown here.
Figure 2.
Scheme drawing of the parallel hybrid-electric Architecture 2.
Figure 2.
Scheme drawing of the parallel hybrid-electric Architecture 2.
Figure 3.
Schematic flowchart of the outer sizing loop.
Figure 3.
Schematic flowchart of the outer sizing loop.
Figure 4.
Separate flight mission segments used in the initial sizing process.
Figure 4.
Separate flight mission segments used in the initial sizing process.
Figure 5.
Schematic flowchart of the inner sizing loop.
Figure 5.
Schematic flowchart of the inner sizing loop.
Figure 6.
Relation of probability of failure condition to severity of failure condition effects as used in CS 25.1309, adapted from [
33].
Figure 6.
Relation of probability of failure condition to severity of failure condition effects as used in CS 25.1309, adapted from [
33].
Figure 7.
General process of the integrated safety assessment within the initial sizing method.
Figure 7.
General process of the integrated safety assessment within the initial sizing method.
Figure 8.
Comparison of the mission energy for the parallel hybrid-electric Architectures 1, 2 and 3. Mission energy includes the regular and the reserve mission.
Figure 8.
Comparison of the mission energy for the parallel hybrid-electric Architectures 1, 2 and 3. Mission energy includes the regular and the reserve mission.
Table 1.
Top-level aircraft requirements for the hybrid-electric regional aircraft development planned in FutPrInt50.
Table 1.
Top-level aircraft requirements for the hybrid-electric regional aircraft development planned in FutPrInt50.
| Description | Value |
|---|
| Maximum seat capacity | 50 passengers
|
| Design payload | ≥5300 kg |
| Maximum operating altitude | 7620 m |
| Design flight speed | 450–550 km/h |
| Maximum range | ≥800
km |
| Reserves | ≥185
km +
30
min |
| Take-off field length | ≤1000 m |
Table 2.
Overview of the different architecture variants investigated in the initial sizing process and their individual characteristics.
Table 2.
Overview of the different architecture variants investigated in the initial sizing process and their individual characteristics.
| No. | Propellant | Primary Power Source | Secondary Power Source | Propulsors |
|---|
| 0 | SAF | Gas turbine | - | Turboprop (TP) |
| 1 | SAF | Gas turbine boosted | Battery | TP |
| 2 | SAF | Gas turbine boosted | Battery | TP, WTP |
| 3 | SAF | Gas turbine boosted | Battery | TP, BLI |
| 4 | SAF | Gas turbine generator | Battery | DEP, WTP |
| 5 | LH2 | Gas turbine boosted | Battery | TP, WTP |
| 6 | LH2 | Fuel cell | Battery | DEP, WTP |
Table 3.
Basic aerodynamic assumptions on the glide ratio of a conventional regional aircraft during various flight segments.
Table 3.
Basic aerodynamic assumptions on the glide ratio of a conventional regional aircraft during various flight segments.
| Description | Conservative | Optimistic |
|---|
| L/D during take-off (with flaps) | 10.5 | 11.5 |
| L/D during climb (clean) | 16.0 | 17.0 |
| L/D during cruise | 14.5 | 15.5 |
| L/D during descent | 16.0 | 17.0 |
| L/D during holding (clean) | 17.0 | 18.0 |
| L/D during landing (with full flaps) | 7.5 | 8.5 |
Table 4.
Assumption on glide ratio improvements for selected novel propulsion technologies during various flight segments.
Table 4.
Assumption on glide ratio improvements for selected novel propulsion technologies during various flight segments.
| Description | Flight Segment | Conservative | Optimistic |
|---|
| L/D factor if WTPs installed | Climb | +5% | +10% |
| | Cruise | +3% | +5% |
| L/D factor if DEP installed | Climb and cruise | +15% | +25% |
| L/D factor if BLI installed | Climb and cruise | +3% | +10% |
| L/D factor if LH2 tank installed | Entire flight | –5% | –3% |
Table 5.
Factors for structural mass estimations.
Table 5.
Factors for structural mass estimations.
| Description | Conservative | Optimistic |
|---|
| Wing mass factor if WTPs installed | −3% | −5% |
| Tail mass factor if WTPs installed | −5% | −10% |
| Wing mass factor if DEP installed | −3% | −5% |
| Tail mass factor if DEP installed | −5% | −10% |
| Tail mass factor if BLI installed | +10% | +5% |
| Fuselage mass factor if LH2 tank installed | +33% | +20% |
Table 6.
Results from the initial sizing for conventional Architecture 0 as a reference for the following analyses. Fuel is given in to allow comparisons with electrical energy and LH2.
Table 6.
Results from the initial sizing for conventional Architecture 0 as a reference for the following analyses. Fuel is given in to allow comparisons with electrical energy and LH2.
| Description | Unit | Conservative | Optimistic |
|---|
| Maximum take-off mass | kg | 15,071 | 14,021 |
| Maximum propulsive power | kW | 2956 | 2750 |
| Mission energy from fuel | kWh | 11,479 | 9279 |
Table 7.
Mass estimation from the initial sizing for Architectures 1 (TP), 2 (TP, WTP) and 3 (TP, BLI).
Table 7.
Mass estimation from the initial sizing for Architectures 1 (TP), 2 (TP, WTP) and 3 (TP, BLI).
| Description | Unit | Conservative | Optimistic |
|---|
| | | Arch 1 | Arch 2 | Arch 3 | Arch 1 | Arch 2 | Arch 3 |
|---|
| Maximum take-off mass | kg | 25,803 | 25,434 | 25,956 | 18,020 | 17,624 | 17,649 |
| Operating mass empty | kg | 19,202 | 18,885 | 19,379 | 11,939 | 11,594 | 11,641 |
| Mission fuel mass | kg | 1301 | 1248 | 1202 | 781 | 730 | 707 |
| Total battery mass | kg | 6837 | 6583 | 6755 | 2818 | 2647 | 2525 |
Table 8.
Results on the masses from the initial sizing for Architecture 2 (TP) and 4 (DEP).
Table 8.
Results on the masses from the initial sizing for Architecture 2 (TP) and 4 (DEP).
| Description | Unit | Conservative | Optimistic |
|---|
| | | Arch 2 | Arch 4 | Arch 2 | Arch 4 |
|---|
| Maximum take-off mass | kg | 25,434 | 25,824 | 17,624 | 18,787 |
| Operating mass empty | kg | 18,885 | 19,018 | 11,594 | 12,738 |
| Mission fuel mass | kg | 1248 | 1506 | 730 | 749 |
| Total battery mass | kg | 6583 | 5205 | 2647 | 2944 |
Table 9.
Results on energy from the initial sizing for Architectures 2 and 4.
Table 9.
Results on energy from the initial sizing for Architectures 2 and 4.
| Description | Unit | Conservative | Optimistic |
|---|
| | | Arch 2 | Arch 4 | Arch 2 | Arch 4 |
|---|
| Total mission energy | kWh | 17,199 | 19,923 | 9963 | 10,011 |
| Mission energy from fuel | kWh | 15,224 | 18,361 | 8905 | 9135 |
| Mission energy from battery | kWh | 1975 | 1562 | 1059 | 876 |
| Hybridization of energy | % | 11 | 8 | 11 | 9 |
Table 10.
Results on the essential masses from the initial sizing for Architecture 2 (SAF) and 5 (LH2).
Table 10.
Results on the essential masses from the initial sizing for Architecture 2 (SAF) and 5 (LH2).
| Description | Unit | Conservative | Optimistic |
|---|
| | | Arch 2 | Arch 5 | Arch 2 | Arch 5 |
|---|
| Maximum take-off mass | kg | 25,434 | 28,923 | 17,624 | 18,415 |
| Operating mass empty | kg | 18,885 | 23,087 | 11,594 | 12,827 |
| Mission fuel mass | kg | 1248 | 536 | 730 | 287 |
| LH2 tank + system mass | kg | - | 1252 | - | 533 |
| Total battery mass | kg | 6583 | 7625 | 2647 | 2805 |
Table 11.
Results on energy from the initial sizing for Architectures 2 and 5.
Table 11.
Results on energy from the initial sizing for Architectures 2 and 5.
| Description | Unit | Conservative | Optimistic |
|---|
| | | Arch 2 | Arch 5 | Arch 2 | Arch 5 |
|---|
| Total mission energy | kWh | 17,199 | 19,931 | 9963 | 10,566 |
| Mission energy from fuel | kWh | 15,224 | 17,643 | 8905 | 9444 |
| Mission energy from battery | kWh | 1975 | 2288 | 1059 | 1122 |
| Hybridization of energy | % | 11 | 11 | 11 | 11 |
Table 12.
Results on the essential masses from the initial sizing for Architecture 5 (LH2-Turboprop) and 6 (LH2-Fuel cell). As Architecture 6 did not converge in the conservative scenario, a comparison can only be shown for the optimistic scenario.
Table 12.
Results on the essential masses from the initial sizing for Architecture 5 (LH2-Turboprop) and 6 (LH2-Fuel cell). As Architecture 6 did not converge in the conservative scenario, a comparison can only be shown for the optimistic scenario.
| Description | Unit | Optimistic |
|---|
| | | Arch 5 | Arch 6 |
|---|
| Maximum take-off mass | kg | 18,415 | 23,976 |
| Operating mass empty | kg | 12,827 | 18,425 |
| Mission fuel mass | kg | 287 | 252 |
| LH2 tank + system mass | kg | 533 | 467 |
| Total fuel cell mass | kg | - | 3031 |
| Total battery mass | kg | 2805 | 4008 |
Table 13.
Results on energy from the initial sizing for Architecture 5 and 6.
Table 13.
Results on energy from the initial sizing for Architecture 5 and 6.
| Description | Unit | Optimistic |
|---|
| | | Arch 5 | Arch 6 |
|---|
| Total mission energy | kWh | 10,566 | 8794 |
| Mission energy from fuel | kWh | 9444 | 8273 |
| Mission energy from battery | kWh | 1122 | 521 |
| Hybridization of energy | % | 11 | 6 |
| Publisher’s Note: MDPI stays neutral with regard to jurisdictional claims in published maps and institutional affiliations. |
© 2022 by the authors. Licensee MDPI, Basel, Switzerland. This article is an open access article distributed under the terms and conditions of the Creative Commons Attribution (CC BY) license (https://creativecommons.org/licenses/by/4.0/).


 ,
, 


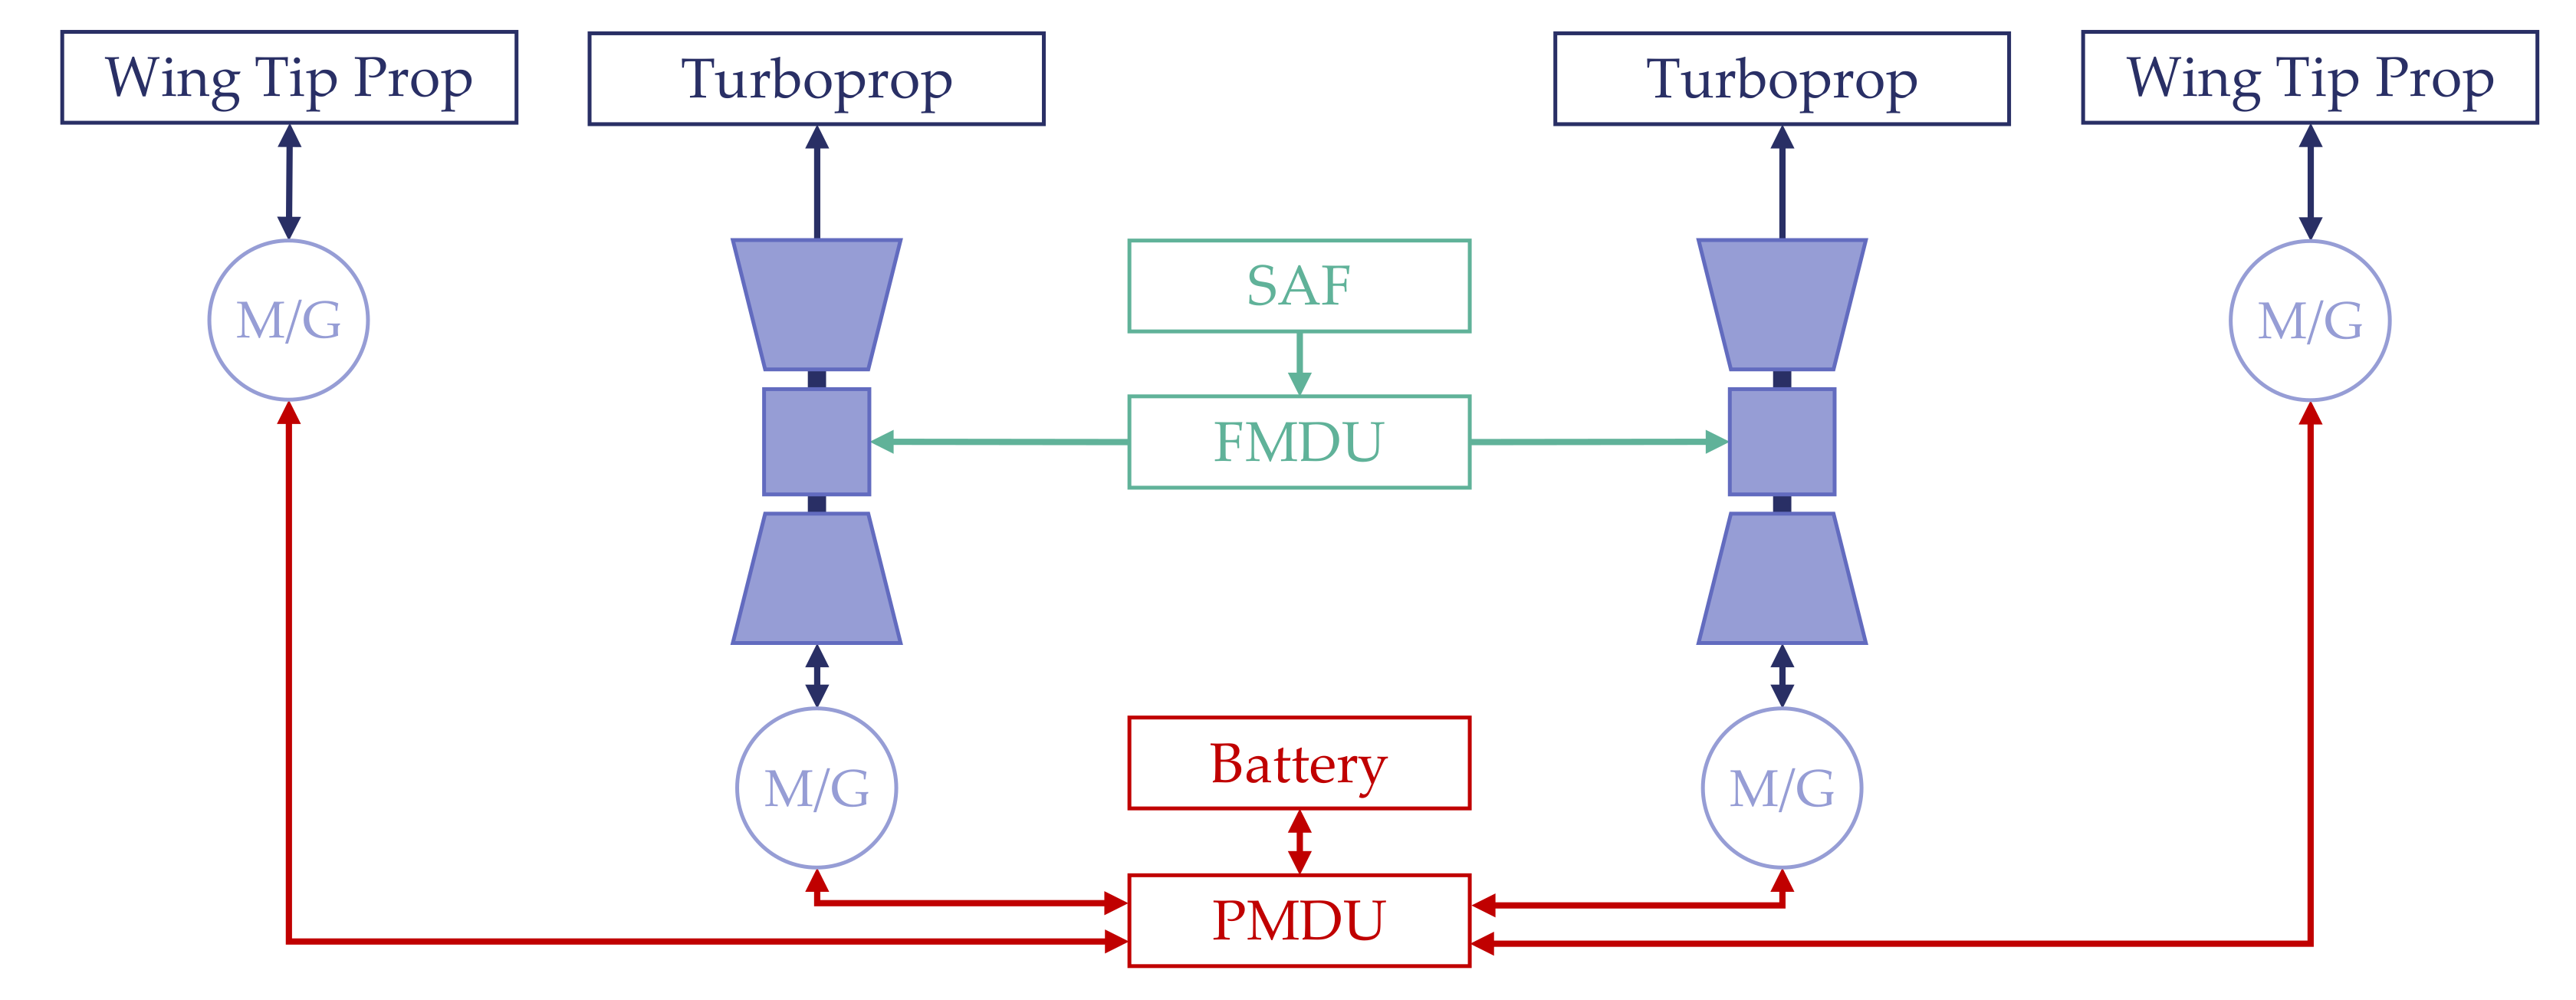
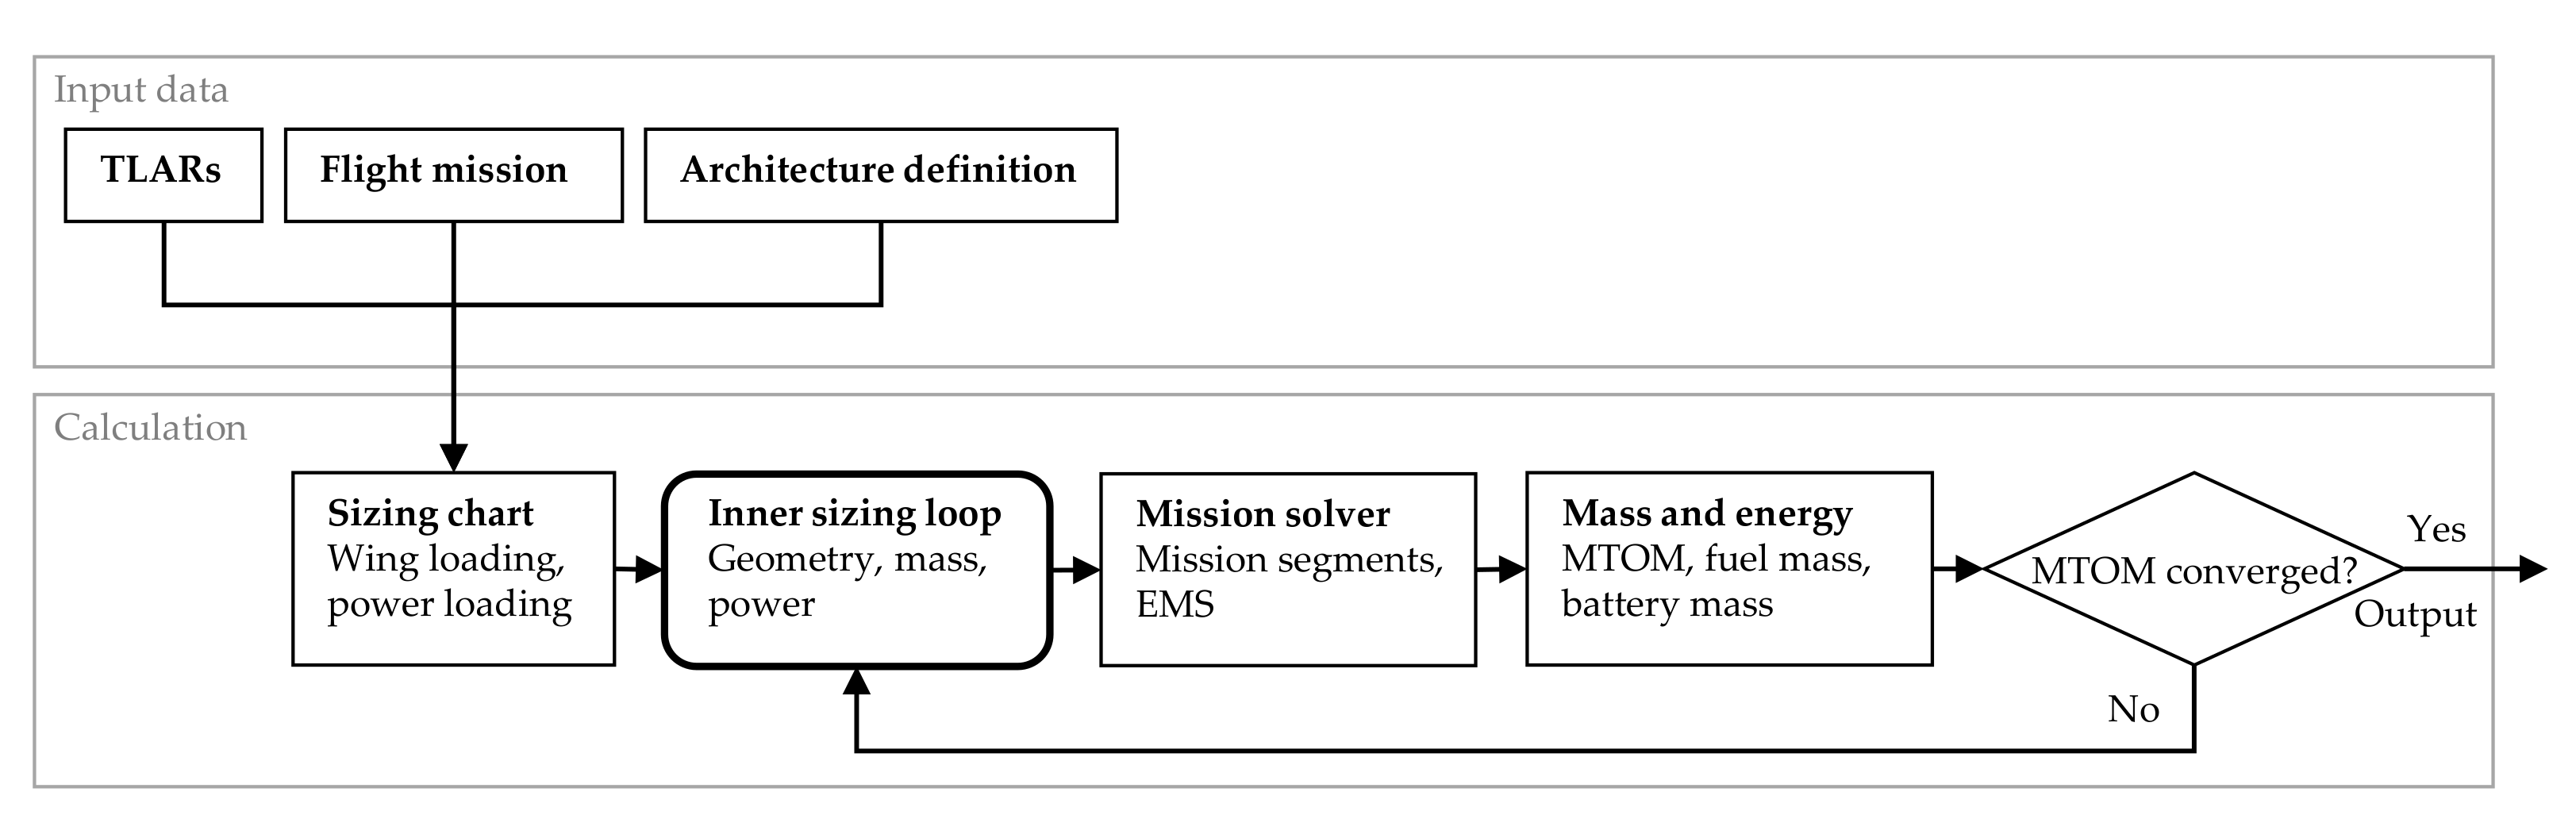
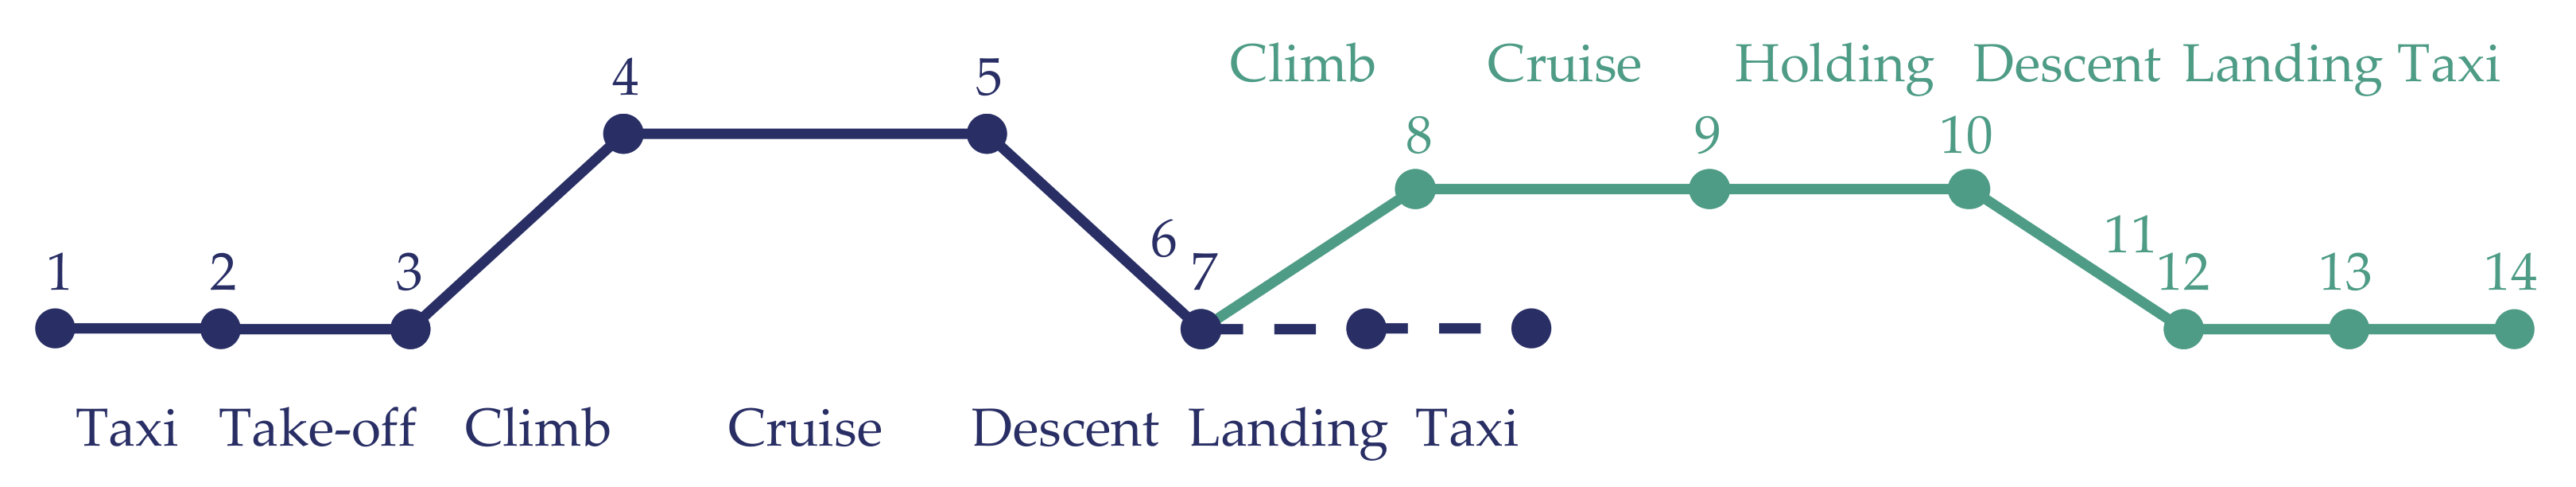
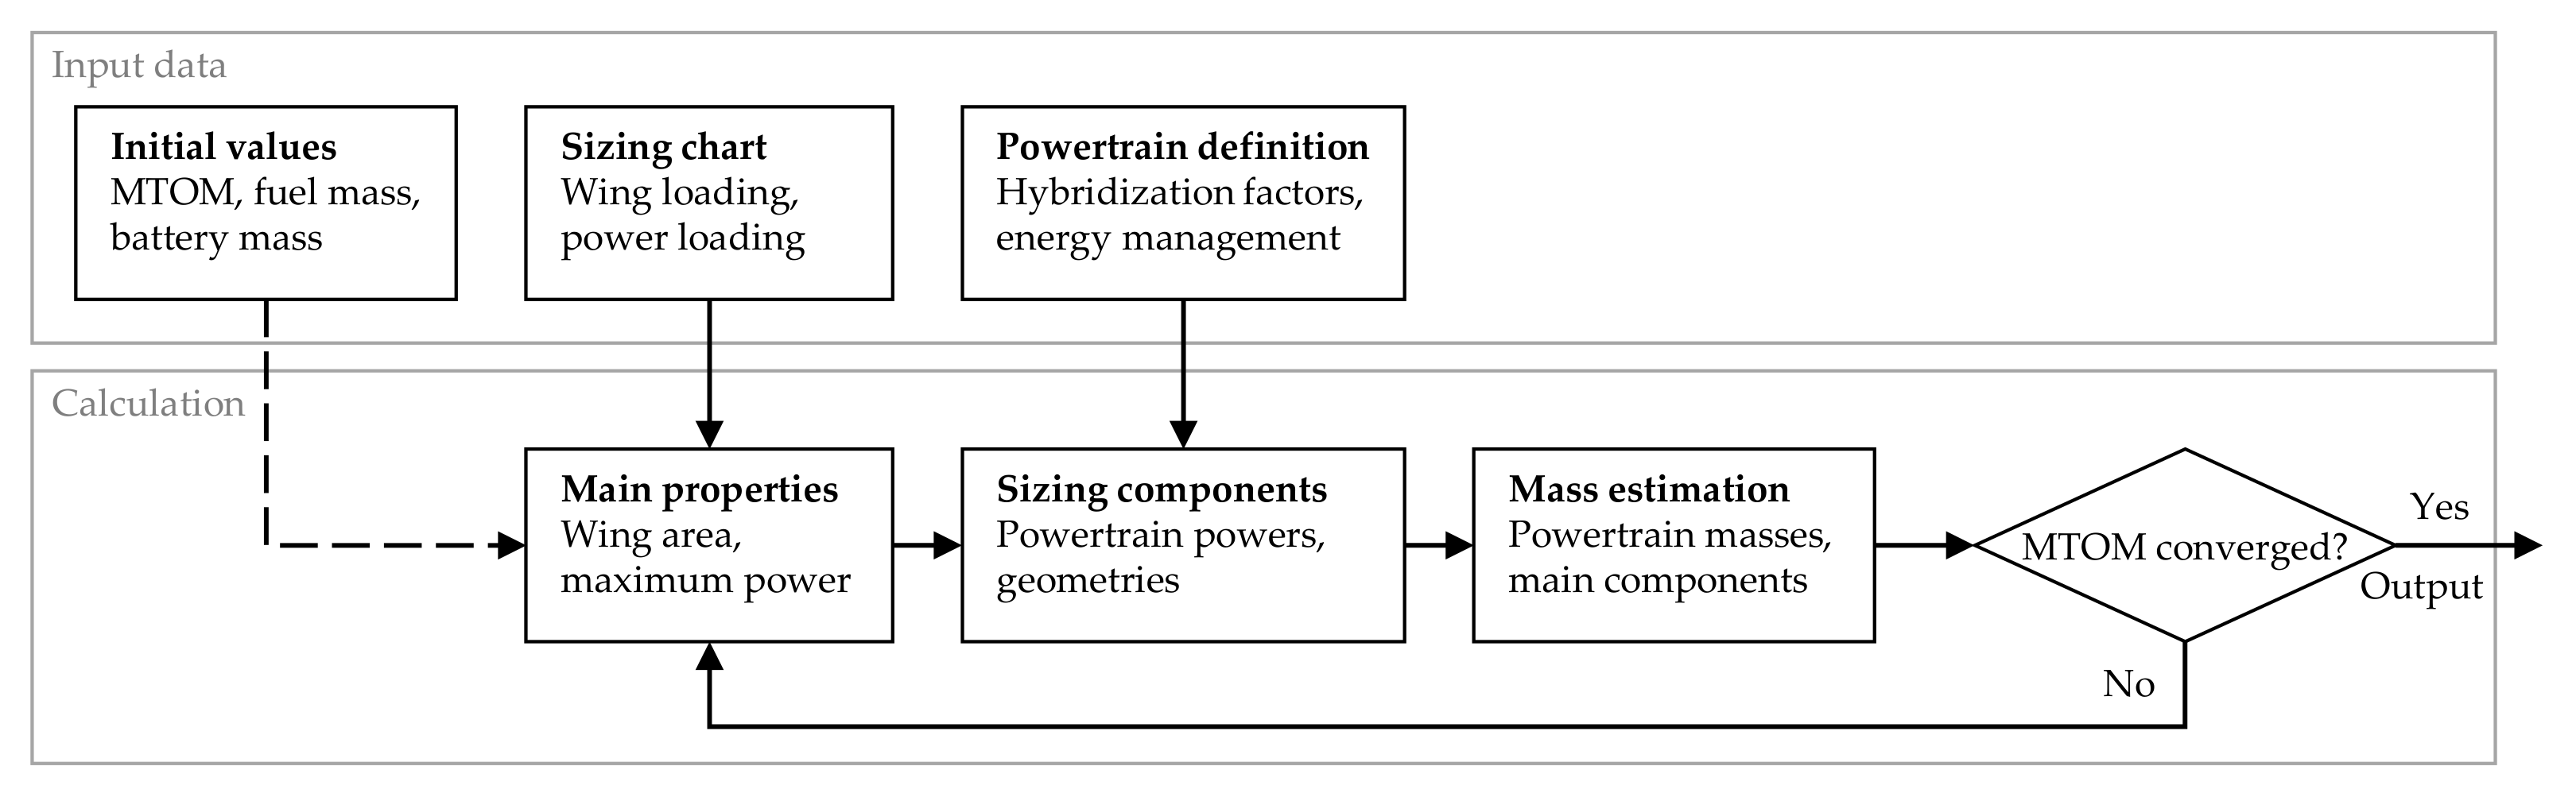
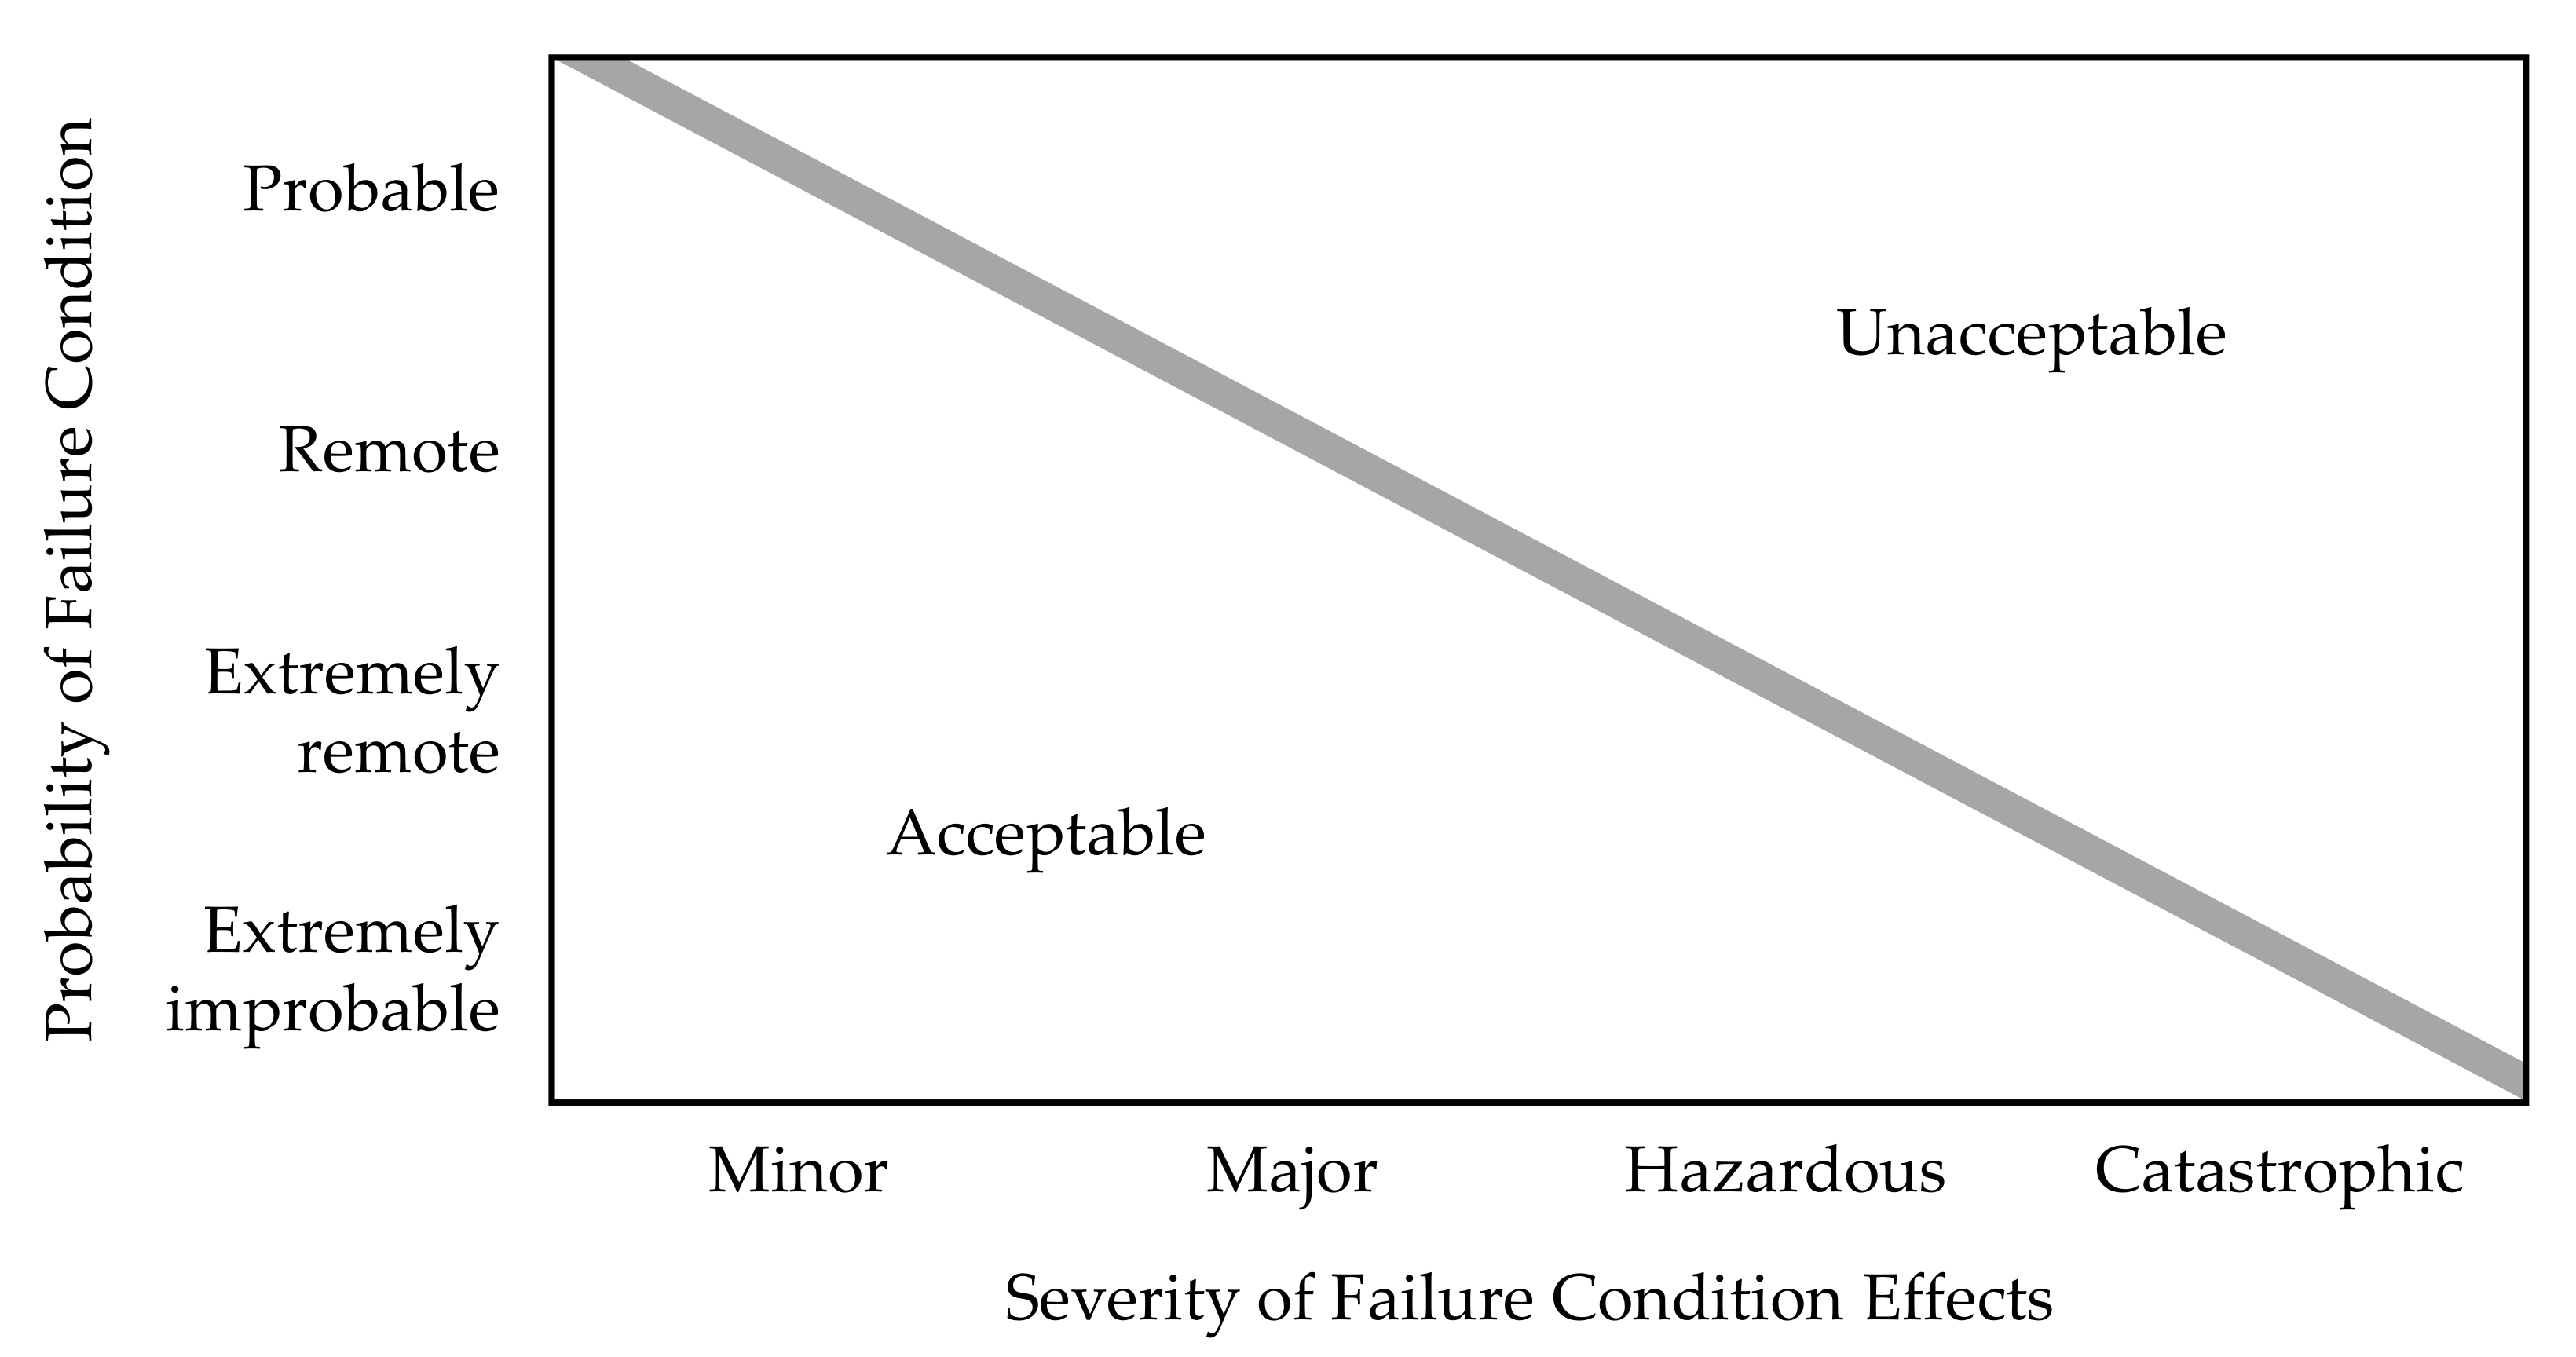
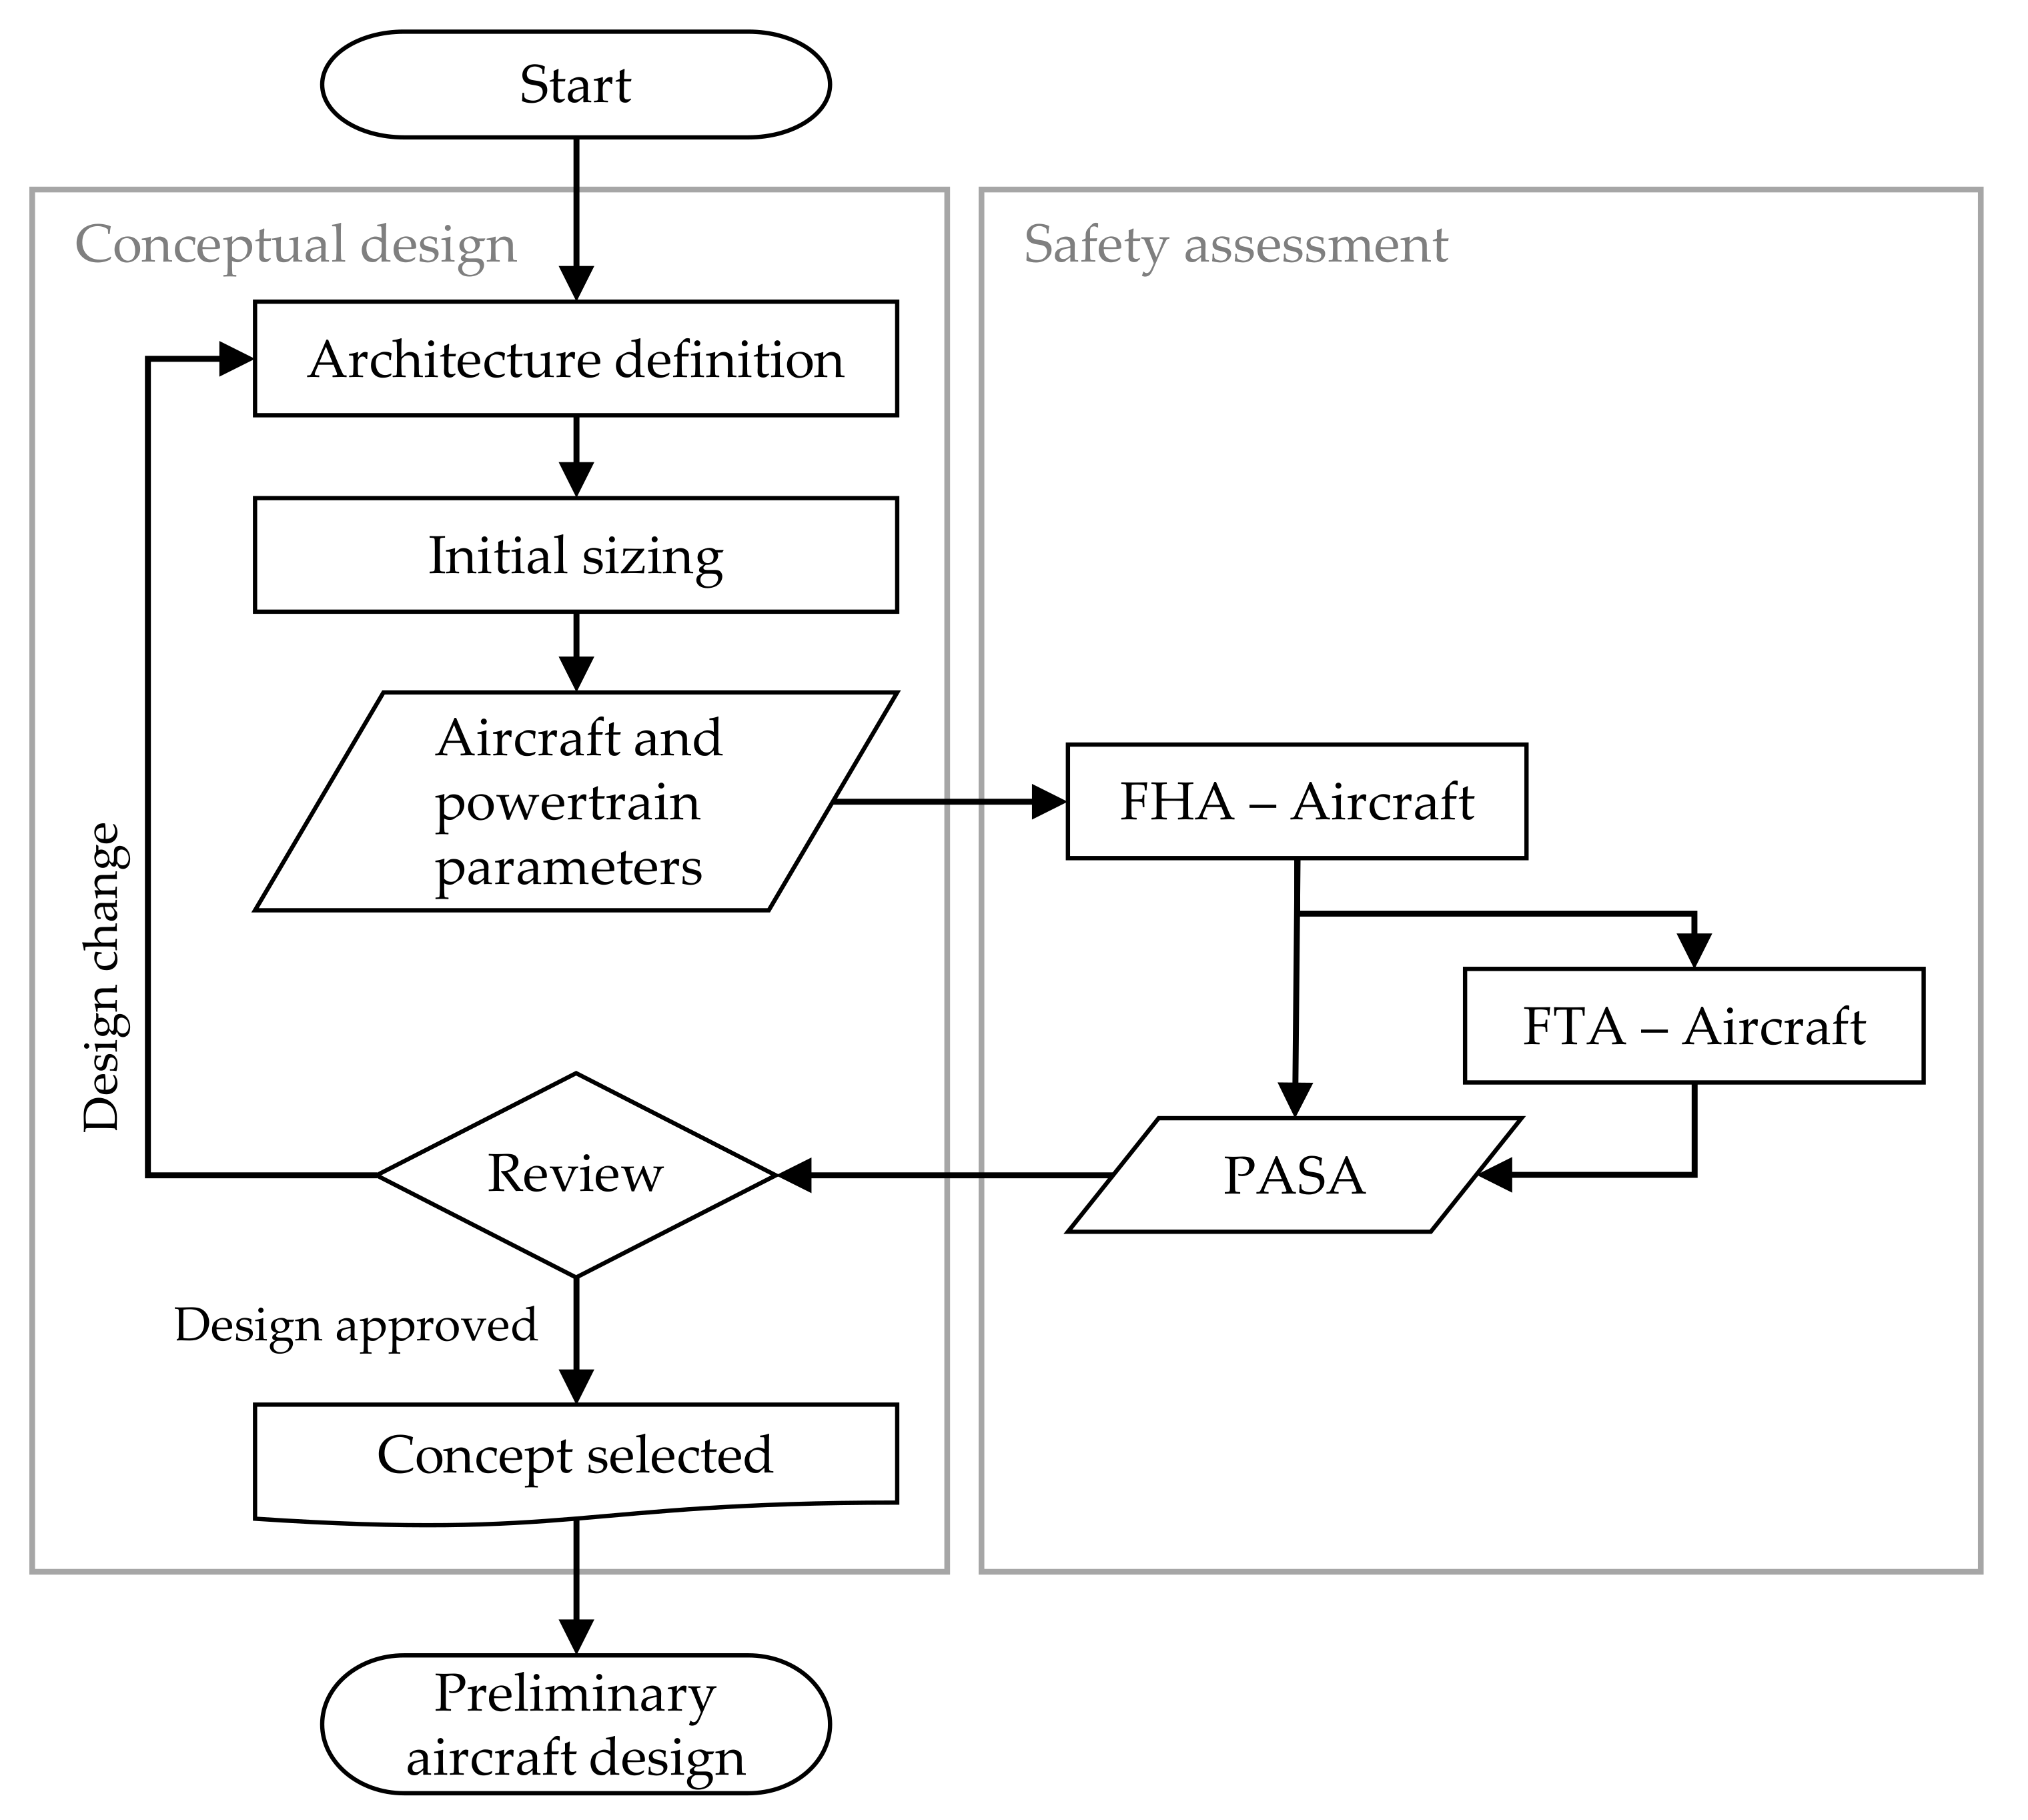
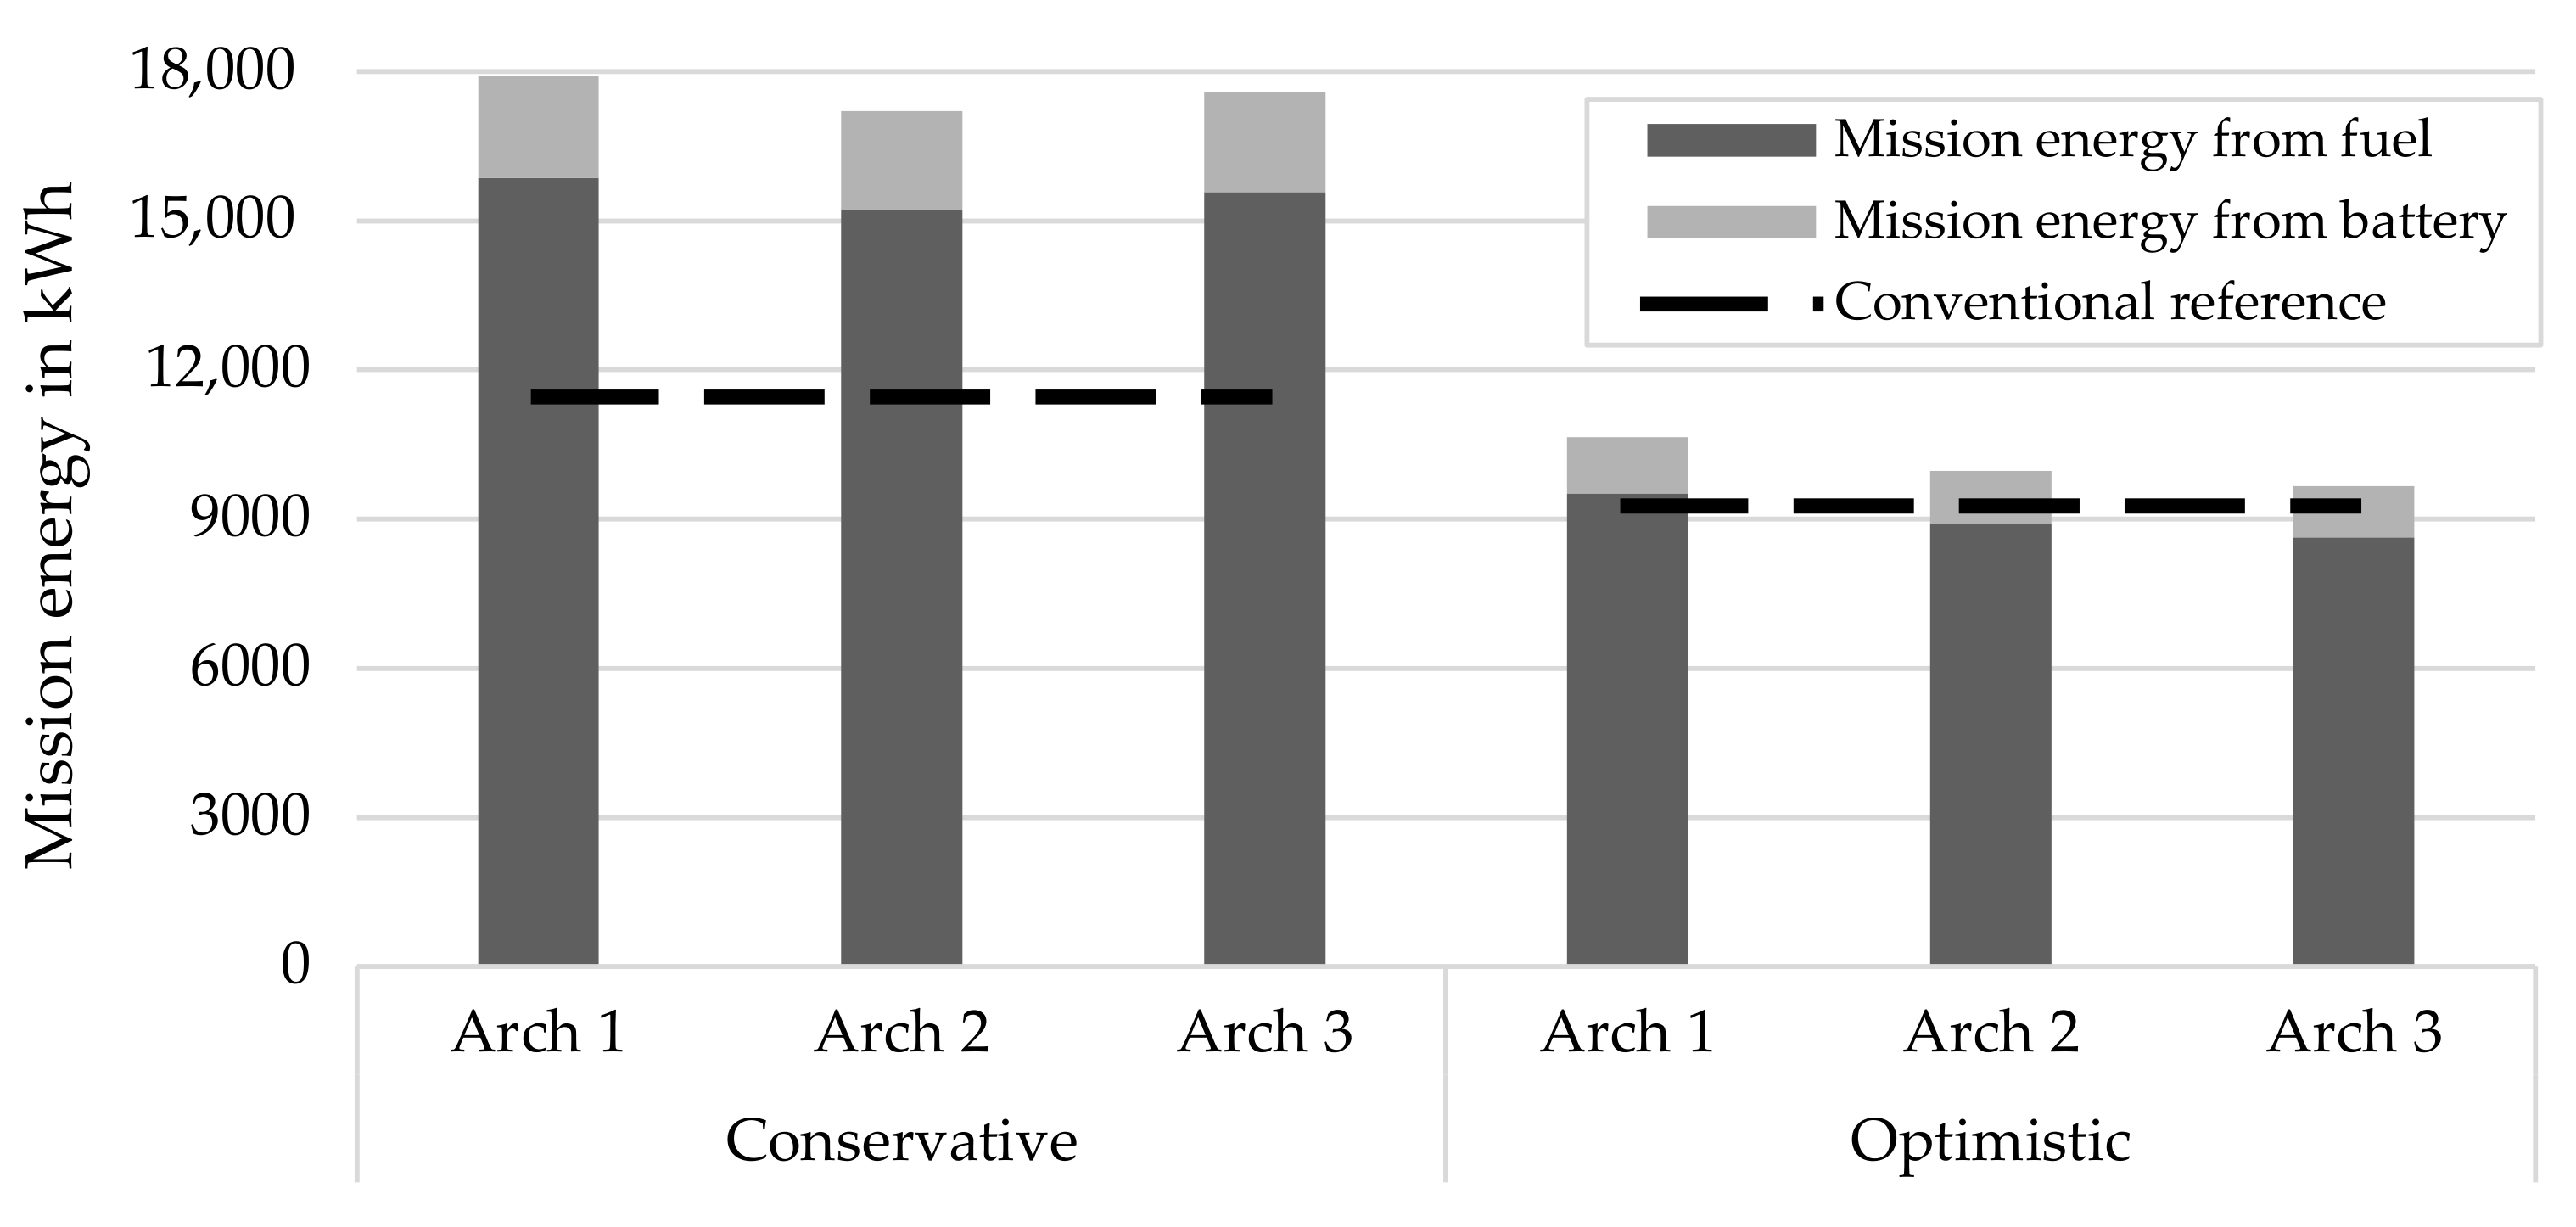
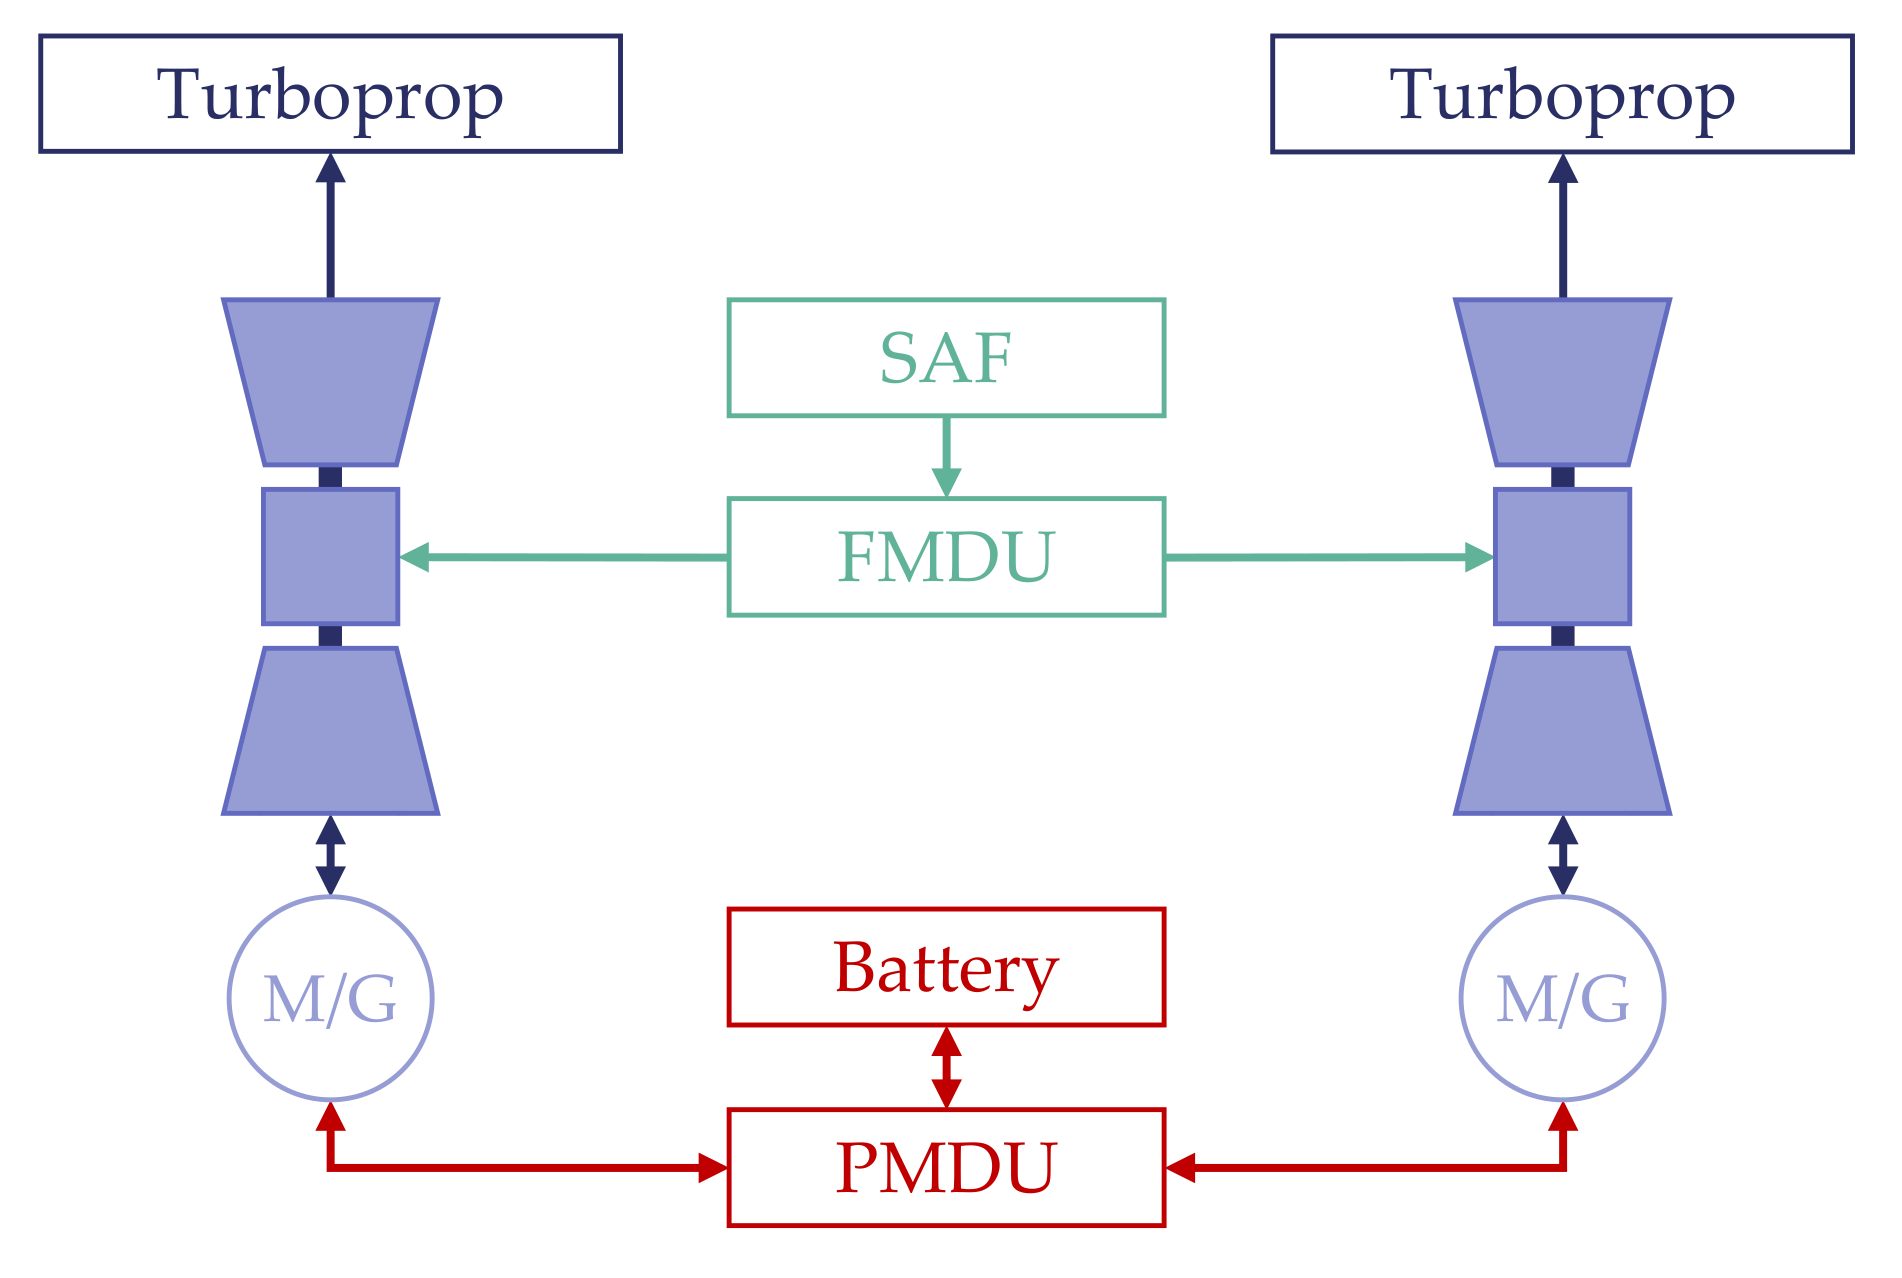
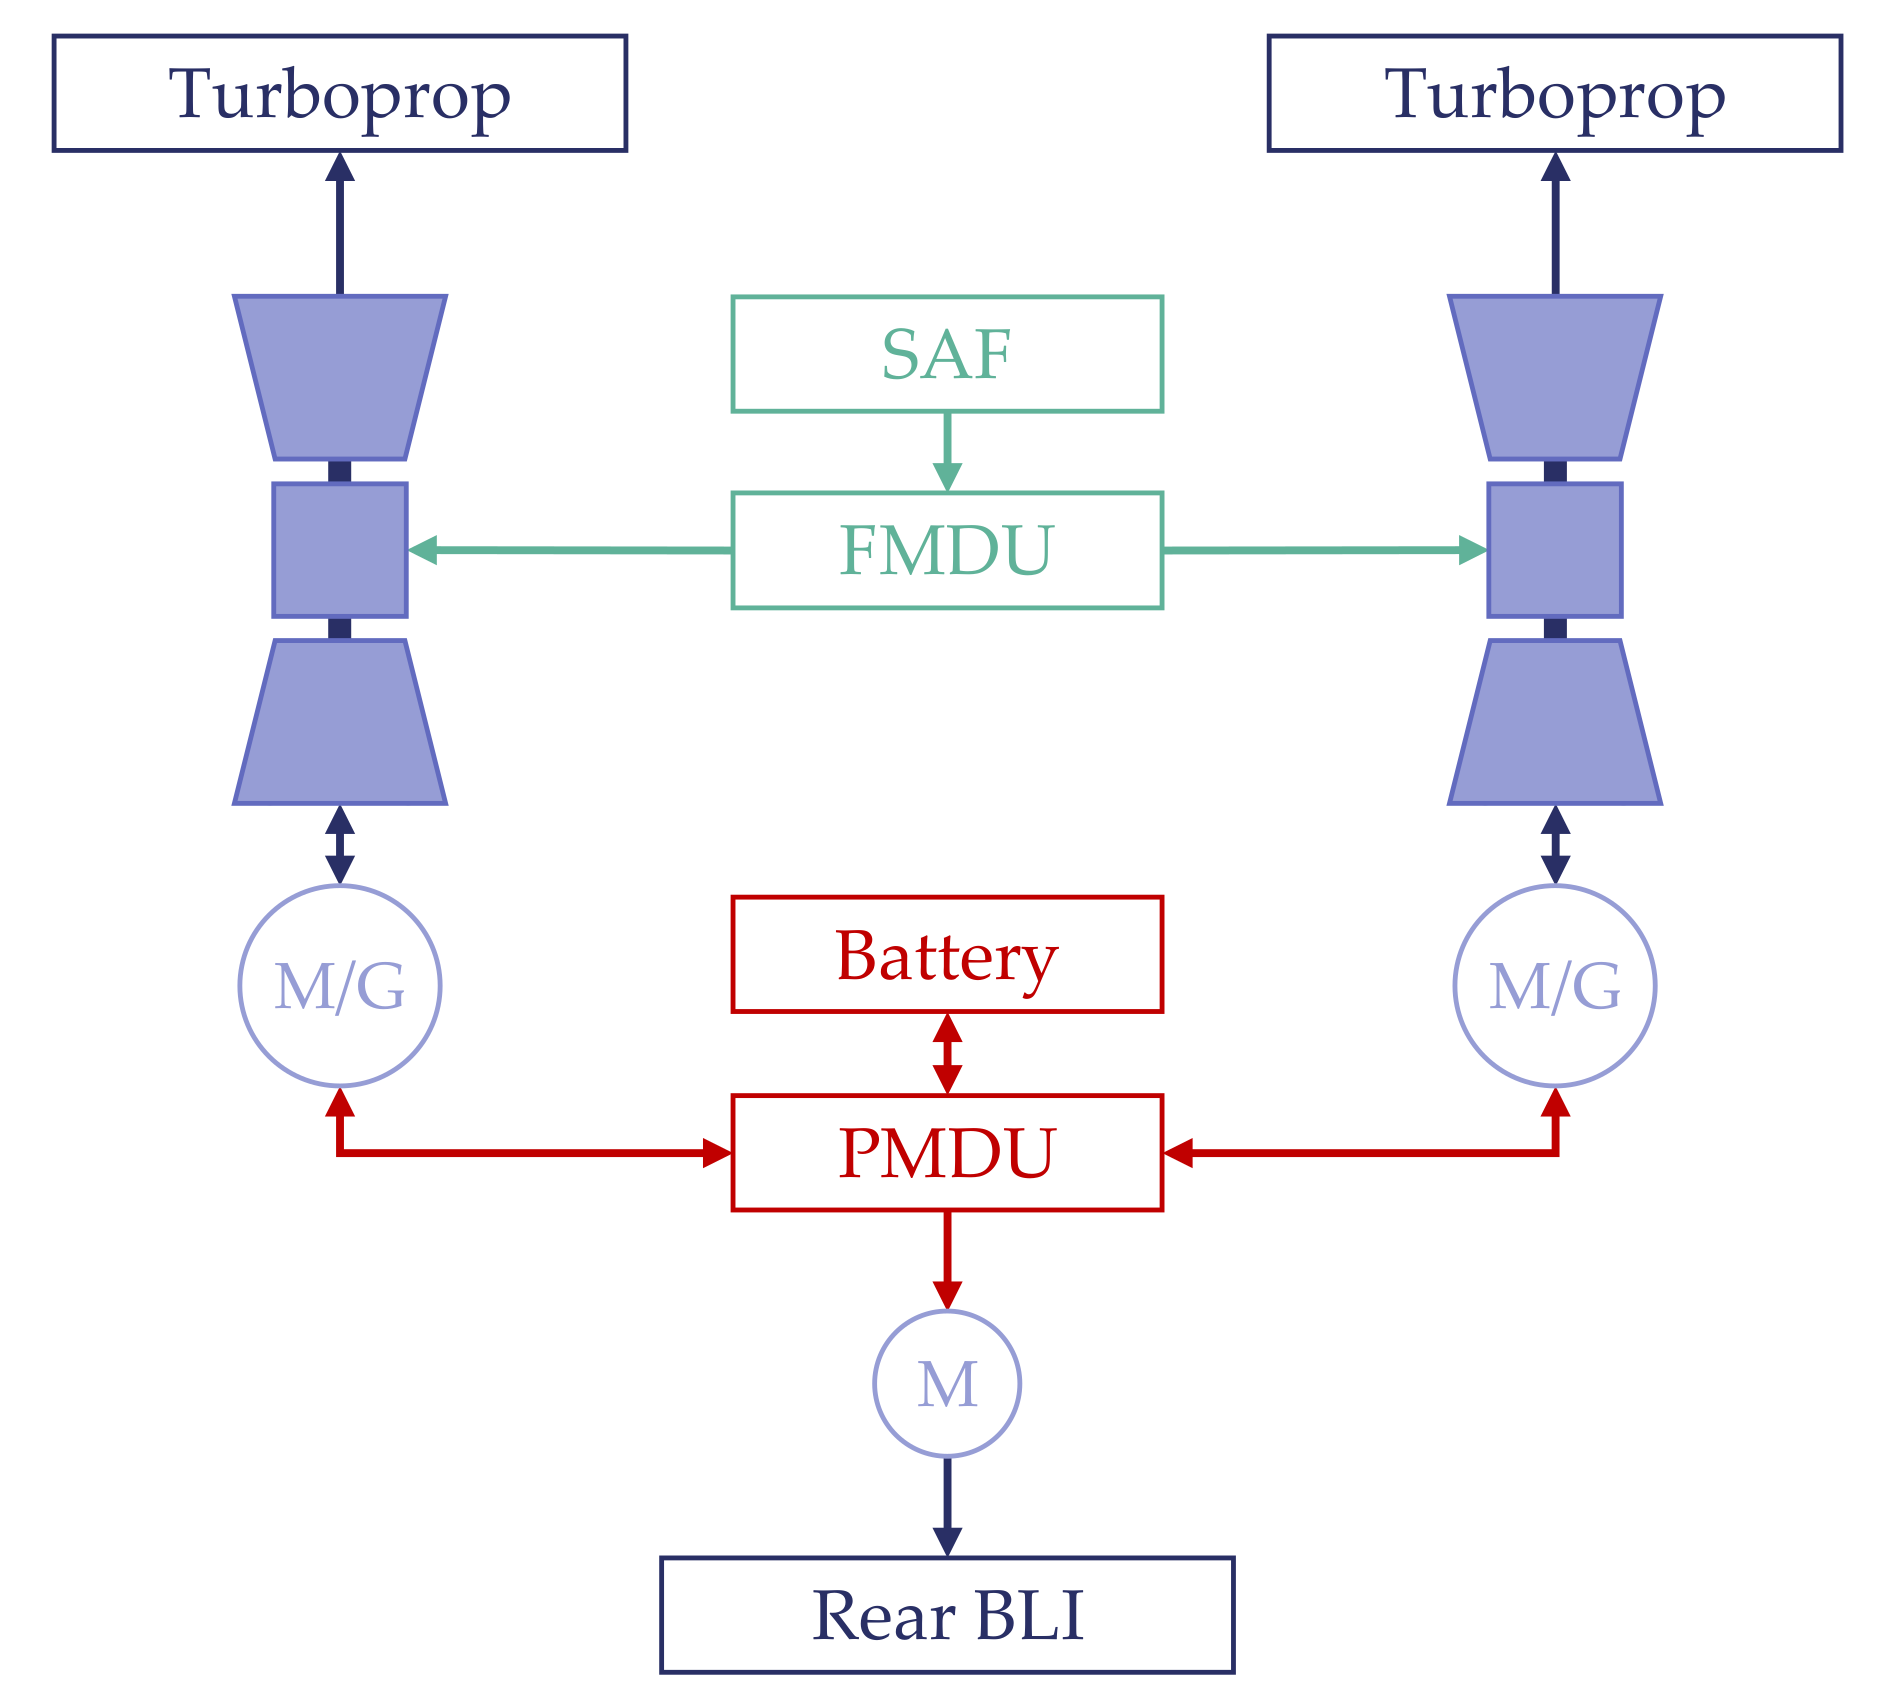
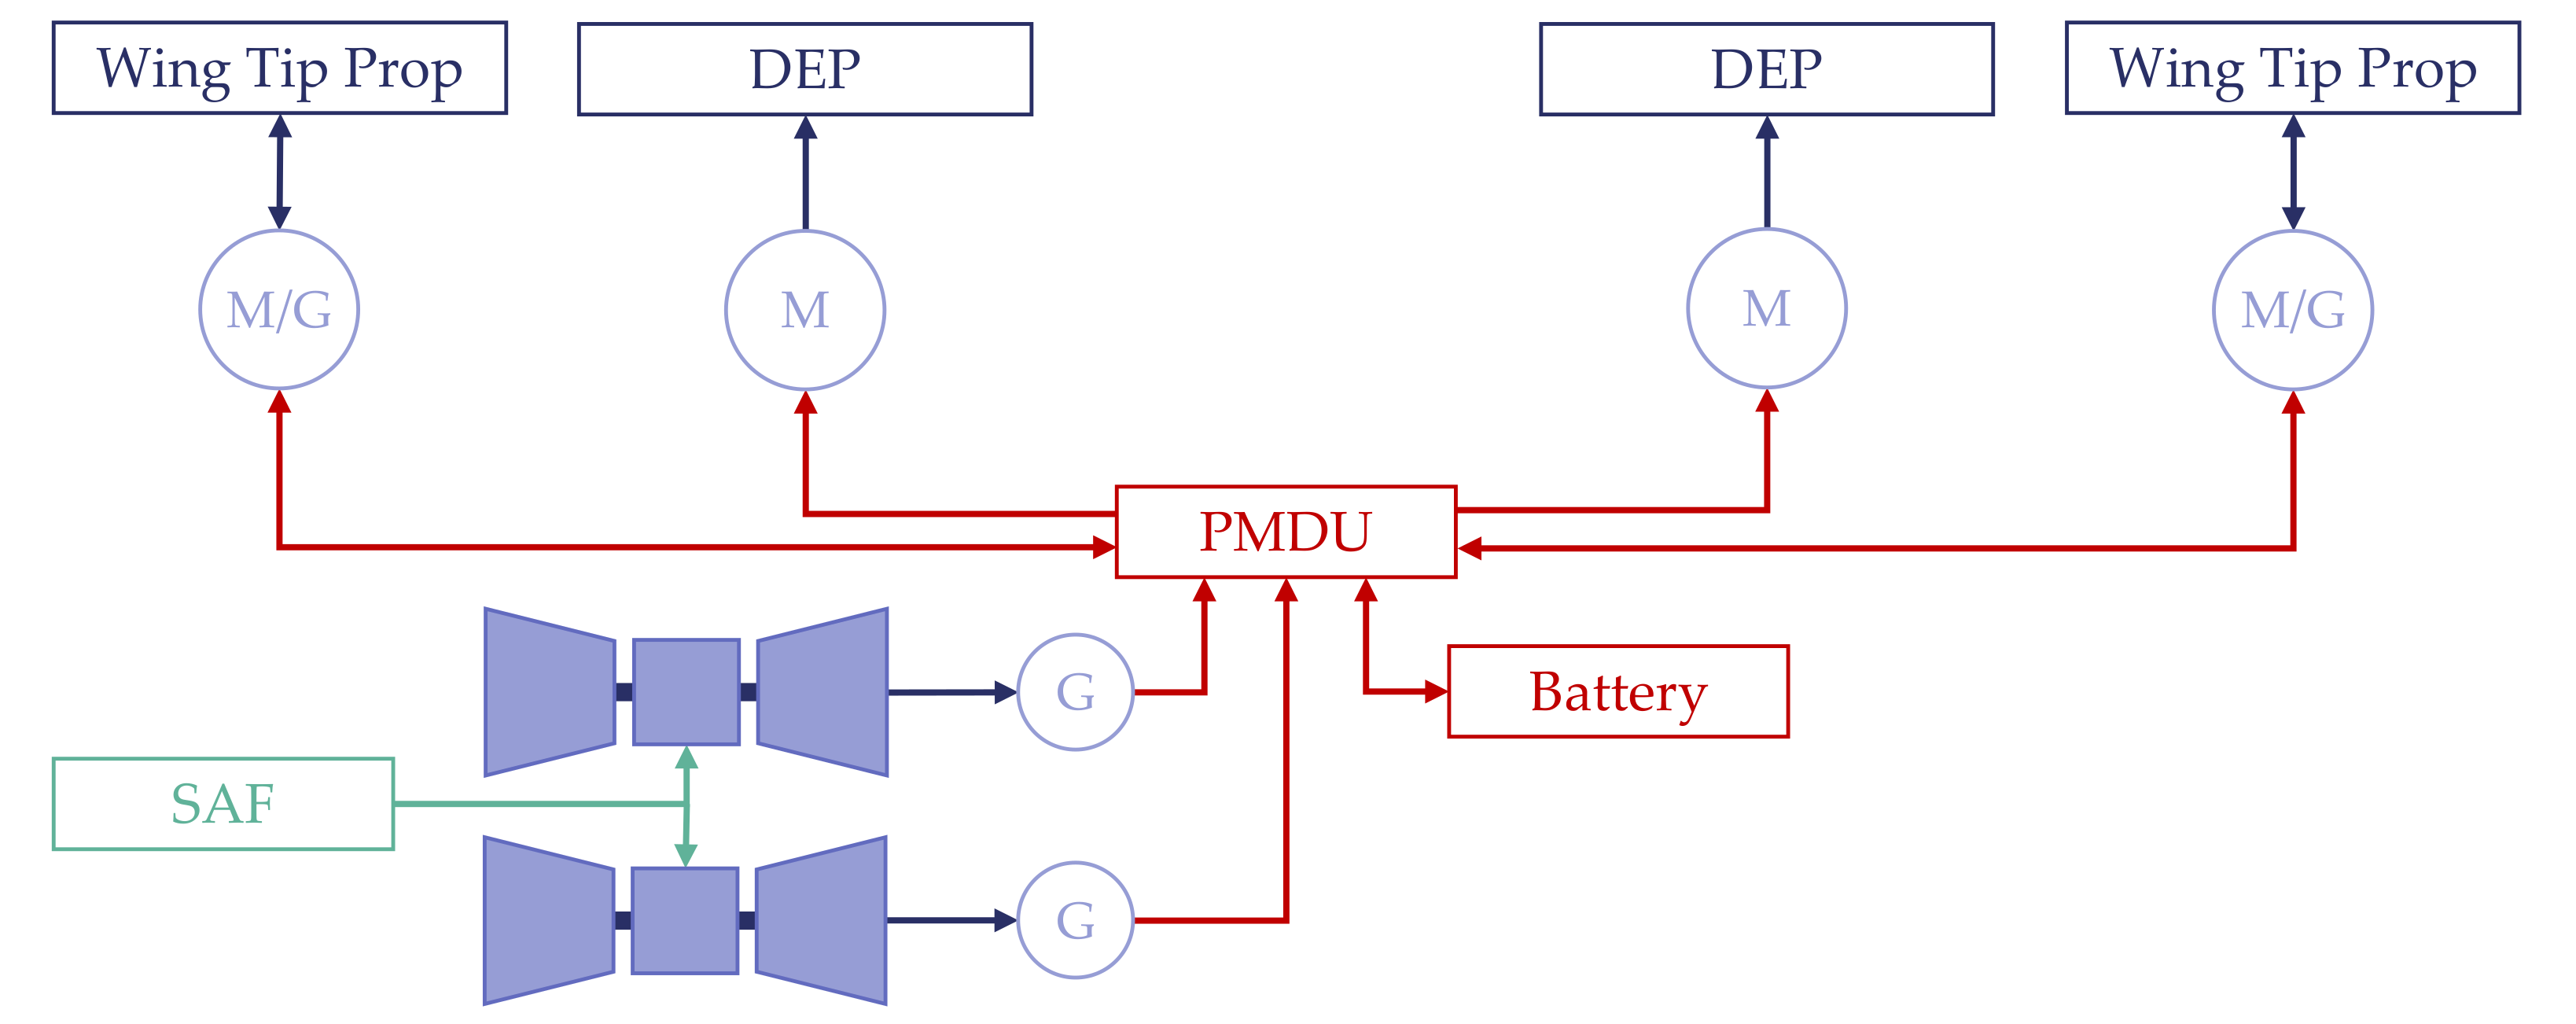
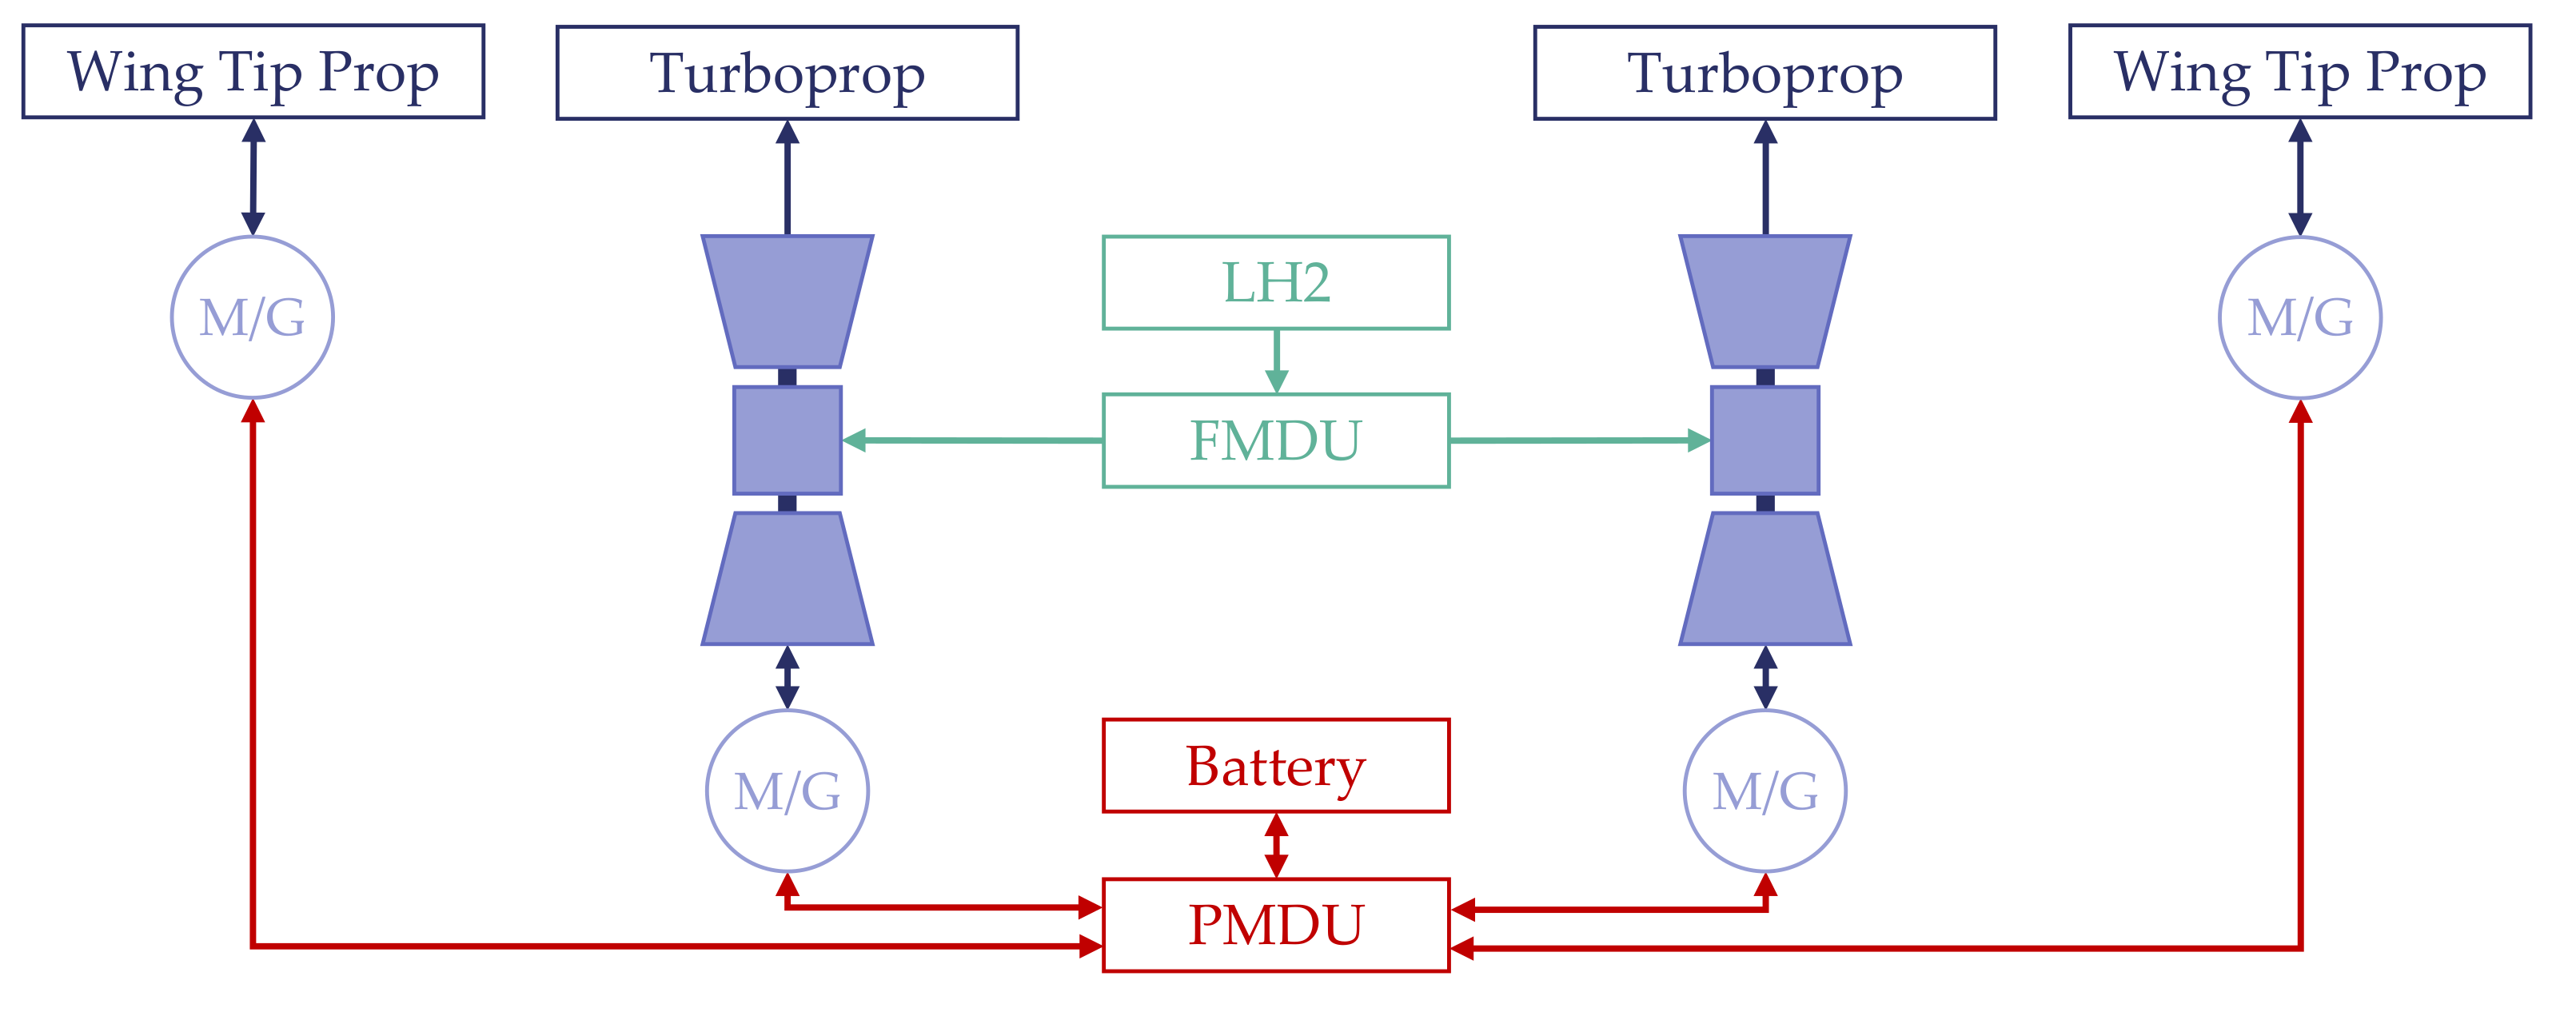
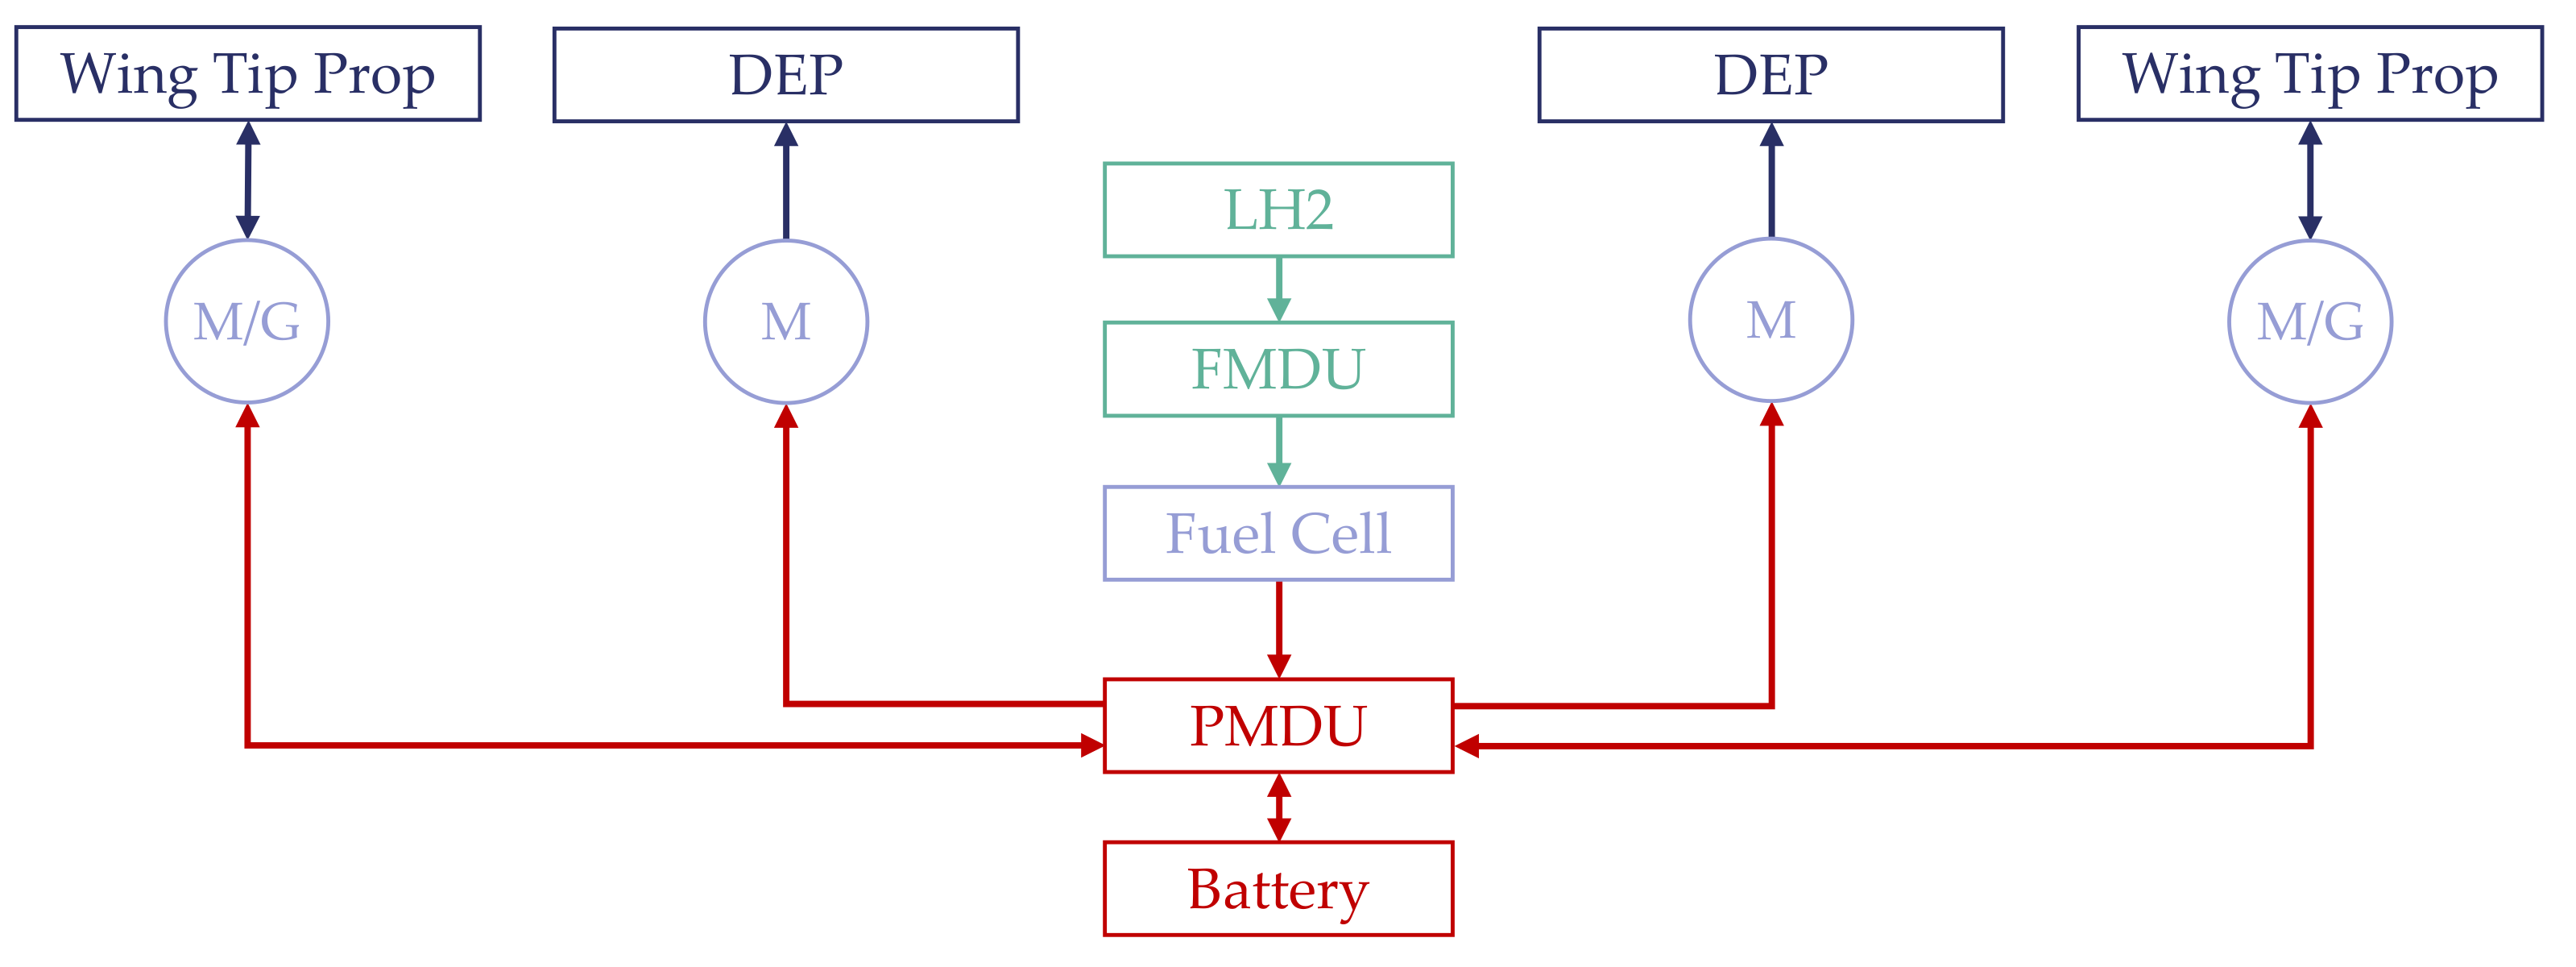


