Article

A Numerical Study on Aircraft Noise Mitigation Using Porous Stator Concepts

Department of Wind Energy, Delft University of Technology, 2628 CD Delft, The Netherlands
*
Author to whom correspondence should be addressed.
These authors contributed equally to this work.
Aerospace 2022, 9(2), 70; https://doi.org/10.3390/aerospace9020070
Submission received: 28 December 2021 / Revised: 21 January 2022 / Accepted: 24 January 2022 / Published: 27 January 2022
(This article belongs to the Special Issue Aircraft Noise)

Abstract

:
This manuscript presents the application of a recently developed noise reduction technology, constituted by poro-serrated stator blades on a full-scale aircraft model, in order to reduce rotor-stator interaction noise in the fan stage. This study was carried out using the commercial lattice Boltzmann solver 3DS-SIMULIA PowerFLOW. The simulation combines the airframe of the NASA High-Lift Common Research Model with an upscaled fan stage of the source diagnostic test rig. The poro-serrations on the stator blades have been modeled based on a metal foam with two different porosity values. The results evidence that the poro-serrations induce flow separation on the stator blades, particularly near the fan-stage hub. Consequently, the thrust generated by the modified fan stage is lower and the broadband noise emission at low frequencies is enhanced. Nevertheless, the tonal noise components at the blade-passage frequency and its harmonics are mitigated by up to 9 dB. The poro-serrations with lower porosity achieve a better trade-off between noise emission and thrust penalty. An optimization attempt was carried out by limiting the application of porosity near the tip of the stator blades. The improved leading-edge treatment achieves a total of 1.5 dB in sound power level reduction while the thrust penalty is below 1.5 %. This demonstrates that the aerodynamic effects of a leading-edge treatment should be taken into account during the design phase to fully benefit from its noise reduction capability.

1. Introduction

Aircraft noise emission is an important aspect in aircraft design as aviation regulations become more stringent. On a modern airliner, the propulsion system, such as a turbofan engine, contributes to a large portion of the total noise emission [1]. The periodic impingement of the fan wake on the outlet guide vane (OGV) is one of the major noise generation mechanisms in a high-bypass turbofan that is responsible for both tonal and broadband noise emissions [2]. Mitigating such aeroacoustic mechanism is even more important during the approach phase of an aircraft, wherein the jet noise contribution is smaller [3], due to the noise impact on areas surrounding airports. With progressively increasing bypass ratios to improve fuel efficiency, the fan wake–OGV interaction noise in a turbofan, especially the tonal component, is expected to become stronger as the axial distance between the fan and the OGV is reduced in order to limit the total engine weight [4]. This happens for multiple reasons [5]: (1) turbulence structures in the fan wake are more coherent closer to the fan blades, leading to more intense aerodynamic perturbations on the OGVs; (2) the unsteady loading on the fan blades due to flow distortion induced by the downstream OGVs (i.e., potential flow effect); (3) the fan blades scatter the sound waves emitted by the OGVs, generating additional cut-on acoustic modes. Existing noise reduction approaches, such as acoustic liners, might face additional challenges for this application due to the reduced amount of space available in the fan stage. Therefore, it is necessary to introduce appropriate solutions directly at the source level.
The fan wake–OGV interaction mechanism can be considered as a turbulence- impingement noise (TIN) [6] problem, for which several mitigation approaches have been suggested in literature, such as serrations [7,8,9,10] and permeable treatments [8,11,12,13,14,15]. The serrations are modifications of the leading-edge shape along the blade span, such as by implementing a sinusoidal planform instead of a regular straight one. The serrations allow for reducing the coherence of the noise scattering phenomena along the spanwise direction [16]. In addition, the source intensity at the tip and at the side of the serrations is weakened in comparison to that on a straight leading edge (LE) [17]. A sinusoidal serration can be characterized by its wavelength Λ (spanwise tip-to-tip distance) and amplitude H (tip-to-root distance). Recent studies have shown that both Λ and H can be optimized for a given turbulence length scale L in the flow field, such that Λ / L z 4 and H / L x 2 [18,19], where the subscripts x and z denote the streamwise and spanwise directions, respectively.
Permeable treatments, on the other hand, are modifications of the surface and of the internal volume of a body to allow for flow communication. The usage of permeable treatments is aimed at mitigating the distortion of impinging vortical structures on a leading edge by realizing a gradual dissipation of these structures as they penetrate into the porous medium [8]. As a consequence, the noise scattering on a permeable surface is milder than on a solid one. Recent investigations have shown that TIN reduction generally becomes higher as the permeability of the leading edge is increased [12,14], although this would also cause a more significant aerodynamic penalty. Unfortunately, to the authors’ best knowledge, the optimization procedure for the design and implementation of a permeable LE is still inconclusive, unlike for LE serrations. In fact, novel permeable LE designs are still being actively investigated at the time of writing [14,15,20,21]. Regardless, these studies have shown that permeable LE applications are very promising in both efficacy and versatility aspects.
As a proof-of-concept, the authors have previously investigated the application of LE serrations and porous LE in a rod-airfoil configuration (RAC) [15] using the lattice Boltzmann method. The RAC was chosen as it could emulate the TIN mechanisms of the fan wake–OGV interaction in a turbofan. A thin and cambered airfoil was employed for resembling the typical features of a turbomachinery blade. The aforementioned study was intended for comparing the effects of LE serrations and porous LE on TIN emission and on the aerodynamic performance of the airfoil. It was found that the serrations suppressed the noise source intensity near the serration tip and induced a strong decorrelation of the noise sources that are distributed along the LE span. The porous LE, which was modeled after a metal foam, was also capable of mitigating the intensity of the noise sources at the porous medium surface, although the spanwise coherence distribution was only slightly affected. Moreover, additional noise scattering was observed near the solid–porous junction (i.e., the transition location between the porous LE and the solid afterbody). As a result, the usage of LE serrations achieved higher noise reduction than that of the porous LE, particularly for the tonal noise component. An attempt to improve the porous LE design was carried out by coupling it with a serration-like planform. With this combination, it was found out that a larger broadband noise reduction could be achieved while the tonal noise remained similar as that of the regular serrations.
While the usage of a permeable edge treatment has been considered promising in literature, most investigations were performed using simplified, laboratory-scale models, which cannot completely mimic the physical environment in real-life systems. This is partly due to the costs and the enormous complexity when dealing with manufacturing, instrumentation, and testing of a full-scale configuration. On the other hand, such investigation is crucial for assessing the impact of these noise mitigation solutions, for instance, on a realistic aircraft model, particularly during the initial design phase. Nevertheless, using the combination of a high-fidelity numerical method and parallel computing, aeroacoustic investigations of complete aircraft models have recently become attainable [22,23]. By employing a similar approach, this manuscript presents a numerical investigation on porous LE modifications applied to the stators in the fan stage of an aircraft model. The simulation considers the combined NASA High-Lift Common Research Model (HL-CRM) and source diagnostic test (SDT) [2] geometries, wherein the latter has been upscaled to match the dimensions that resemble its real-life counterpart. Hence, this investigation aims to assess the efficacy of the permeable LE modification on stators in a turbofan fan stage, while also providing deeper insights into the consequences of such noise mitigation approach from both acoustics and aerodynamics perspectives.
The remainder of this manuscript is structured in the following order. Section 2 provides an overview of the lattice Boltzmann solver that has been employed, followed by the description of the simulation setup. The simulation is later verified in Section 3. The outcome of the simulation is discussed in Section 4. The manuscript is concluded with Section 5.

2. Methods

2.1. Description of Numerical Method

This study was performed using the commercial solver 3DS-SIMULIA PowerFLOW 6-2019, based on a lattice Boltzmann method (LBM). It has been previously used for studying the aerodynamics of an aircraft fuselage [24] and the aeroacoustics of a turbofan model [4,5]. Further details on the methodology can be found in [25].
The LBM is derived from the Boltzmann’s kinetic theory that describes a fluid as a collection of particles that continuously evolve towards a thermodynamic equilibrium state. The state of the particles is not tracked at an individual level, but rather by using a probability distribution function. This process can be described using the Boltzmann transport equation (BTE), which has the following expression (neglecting body forces):
F t + V · F = C ,
where F ( x , t ) is the particle distribution function in spatial ( x ) and temporal (t) dimensions, V is the particle velocity vector, and C is the collision operator.
The BTE is discretized onto a Cartesian grid (i.e., lattice) where the particles are confined to the nodes, and the particle velocity vectors are limited to a predetermined (discrete) number of directions. The discretized form of the BTE is given as
F n ( x + V n Δ t , t + Δ t ) F n ( x , t ) = C n ( x , t ) ,
where n = 1 , 2 , , Q are the discrete directions. While PowerFLOW employs a D3Q19 (3 spatial dimensions, 19 discrete velocity vectors) solver for low Mach number flows, the present study employs a high-subsonic version which incorporates an entropy relationship similar to the formulation of Zhang et al. [26]. The left hand side of equation 2 refers to a time-explicit advection. The collision term C n is based on that of the Bhatnagar–Gross–Krook (BGK) model [27]:
C n = Δ t τ [ F n ( x , t ) F n eq ( x , t ) ] .
In essence, the BGK formulation states that the local distribution function F eventually returns to the equilibrium one F eq within a time scale characterized by τ . This single relaxation time is also related to the dimensionless kinematic viscosity ν and temperature Θ as follows [28]:
ν = Θ τ Δ t 2 .
The equilibrium distribution function F eq can take the form of the regular Maxwell–Boltzmann distribution, but it has been approximated with a third-order expansion as [29]
F n eq ρ w n 1 + V n · u Θ + ( V n · u ) 2 2 Θ 2 u 2 2 Θ + ( V n · u ) 3 6 Θ 3 ( V n · u ) u 2 2 Θ 2 ,
where w n are the weighting functions depending on the number of discrete velocity vectors. Eventually, macroscopic flow quantities, such as density ρ and velocity u , can be recovered after solving Equation (2) for F n .
ρ ( x , t ) = n F n ( x , t ) ,
ρ u ( x , t ) = n V n F n ( x , t ) .
PowerFLOW employs a very large eddy simulation (VLES) model, which can be classified as a hybrid approach (e.g., hybrid RANS/LES and detached eddy simulation—DES), but it is fundamentally different from its Navier–Stokes-based counterparts. The VLES model was derived [30] by drawing an analogy between the phenomenon of turbulence (eddy viscosity hypothesis) and the kinetic theory of gases. In this approach, a two-equation k ϵ renormalization group (RNG) [31] was applied to locally adjust the turbulent relaxation time τ eff :
τ eff = τ + C μ k 2 / ϵ ( 1 + η 2 ) 0.5 ,
where C μ = 0.09 and η is based on a local strain parameter ( k S / ϵ ), a local vorticity parameter ( k ω / ϵ ), and local helicity parameters. Using Equation (8), it is implied that the effective relaxation time governs the relaxation properties of the BTE and, consequently, it also determines the characteristic time scales of turbulence in the flow field. Notice that the turbulence model has not been explicitly used to calculate the Reynolds stresses, unlike in RANS where the turbulence model is generally used to solve a closure problem. The VLES model allows for capturing the nonlinearity of Reynolds stresses, which enables the development of large eddies in the simulation domain [30,32].
The wall boundary condition is approximated by specular-reflection and bounce-back processes for slip and no-slip walls, respectively [28]. On a no-slip wall, a wall function is applied based on the generalized law-of-the-wall model [33], which has been extended to account for pressure gradient and surface roughness. The formulation is given by
u + = 1 k ln y + A + B ,
where
A = 1 + f d p d x , B = 5.0 , k = 0.41 , y + = u τ y ν
such that A is a function of the pressure gradient.
The BTE is solved on a lattice of cubic elements, which are referred to as voxels. Currently, a variable resolution scheme is implemented such that the simulation domain can be subdivided into regions with different voxel sizes as long as the voxel resolution varies by a factor of two between adjacent regions. When the voxels intersect with solid bodies, planar surfaces are created along the solid–fluid boundaries. The solution produced by the lattice Boltzmann scheme is inherently unsteady and compressible. Moreover, the scheme has low dispersion and dissipation properties, allowing for acoustic phenomena to be resolved in the simulation domain. This implies that the solver offers a direct noise computation capability with a cutoff frequency that corresponds to approximately 15 voxels per wavelength. Nevertheless, the computational cost associated with extending high-resolution voxel region into the acoustic far-field often remains expensive. Hence, an acoustic analogy based on Farrasat’s formulation 1A [34] of the Ffowcs-Williams and Hawkings (FW-H) analogy [35] was employed and solved using the forward-time formulation [36].

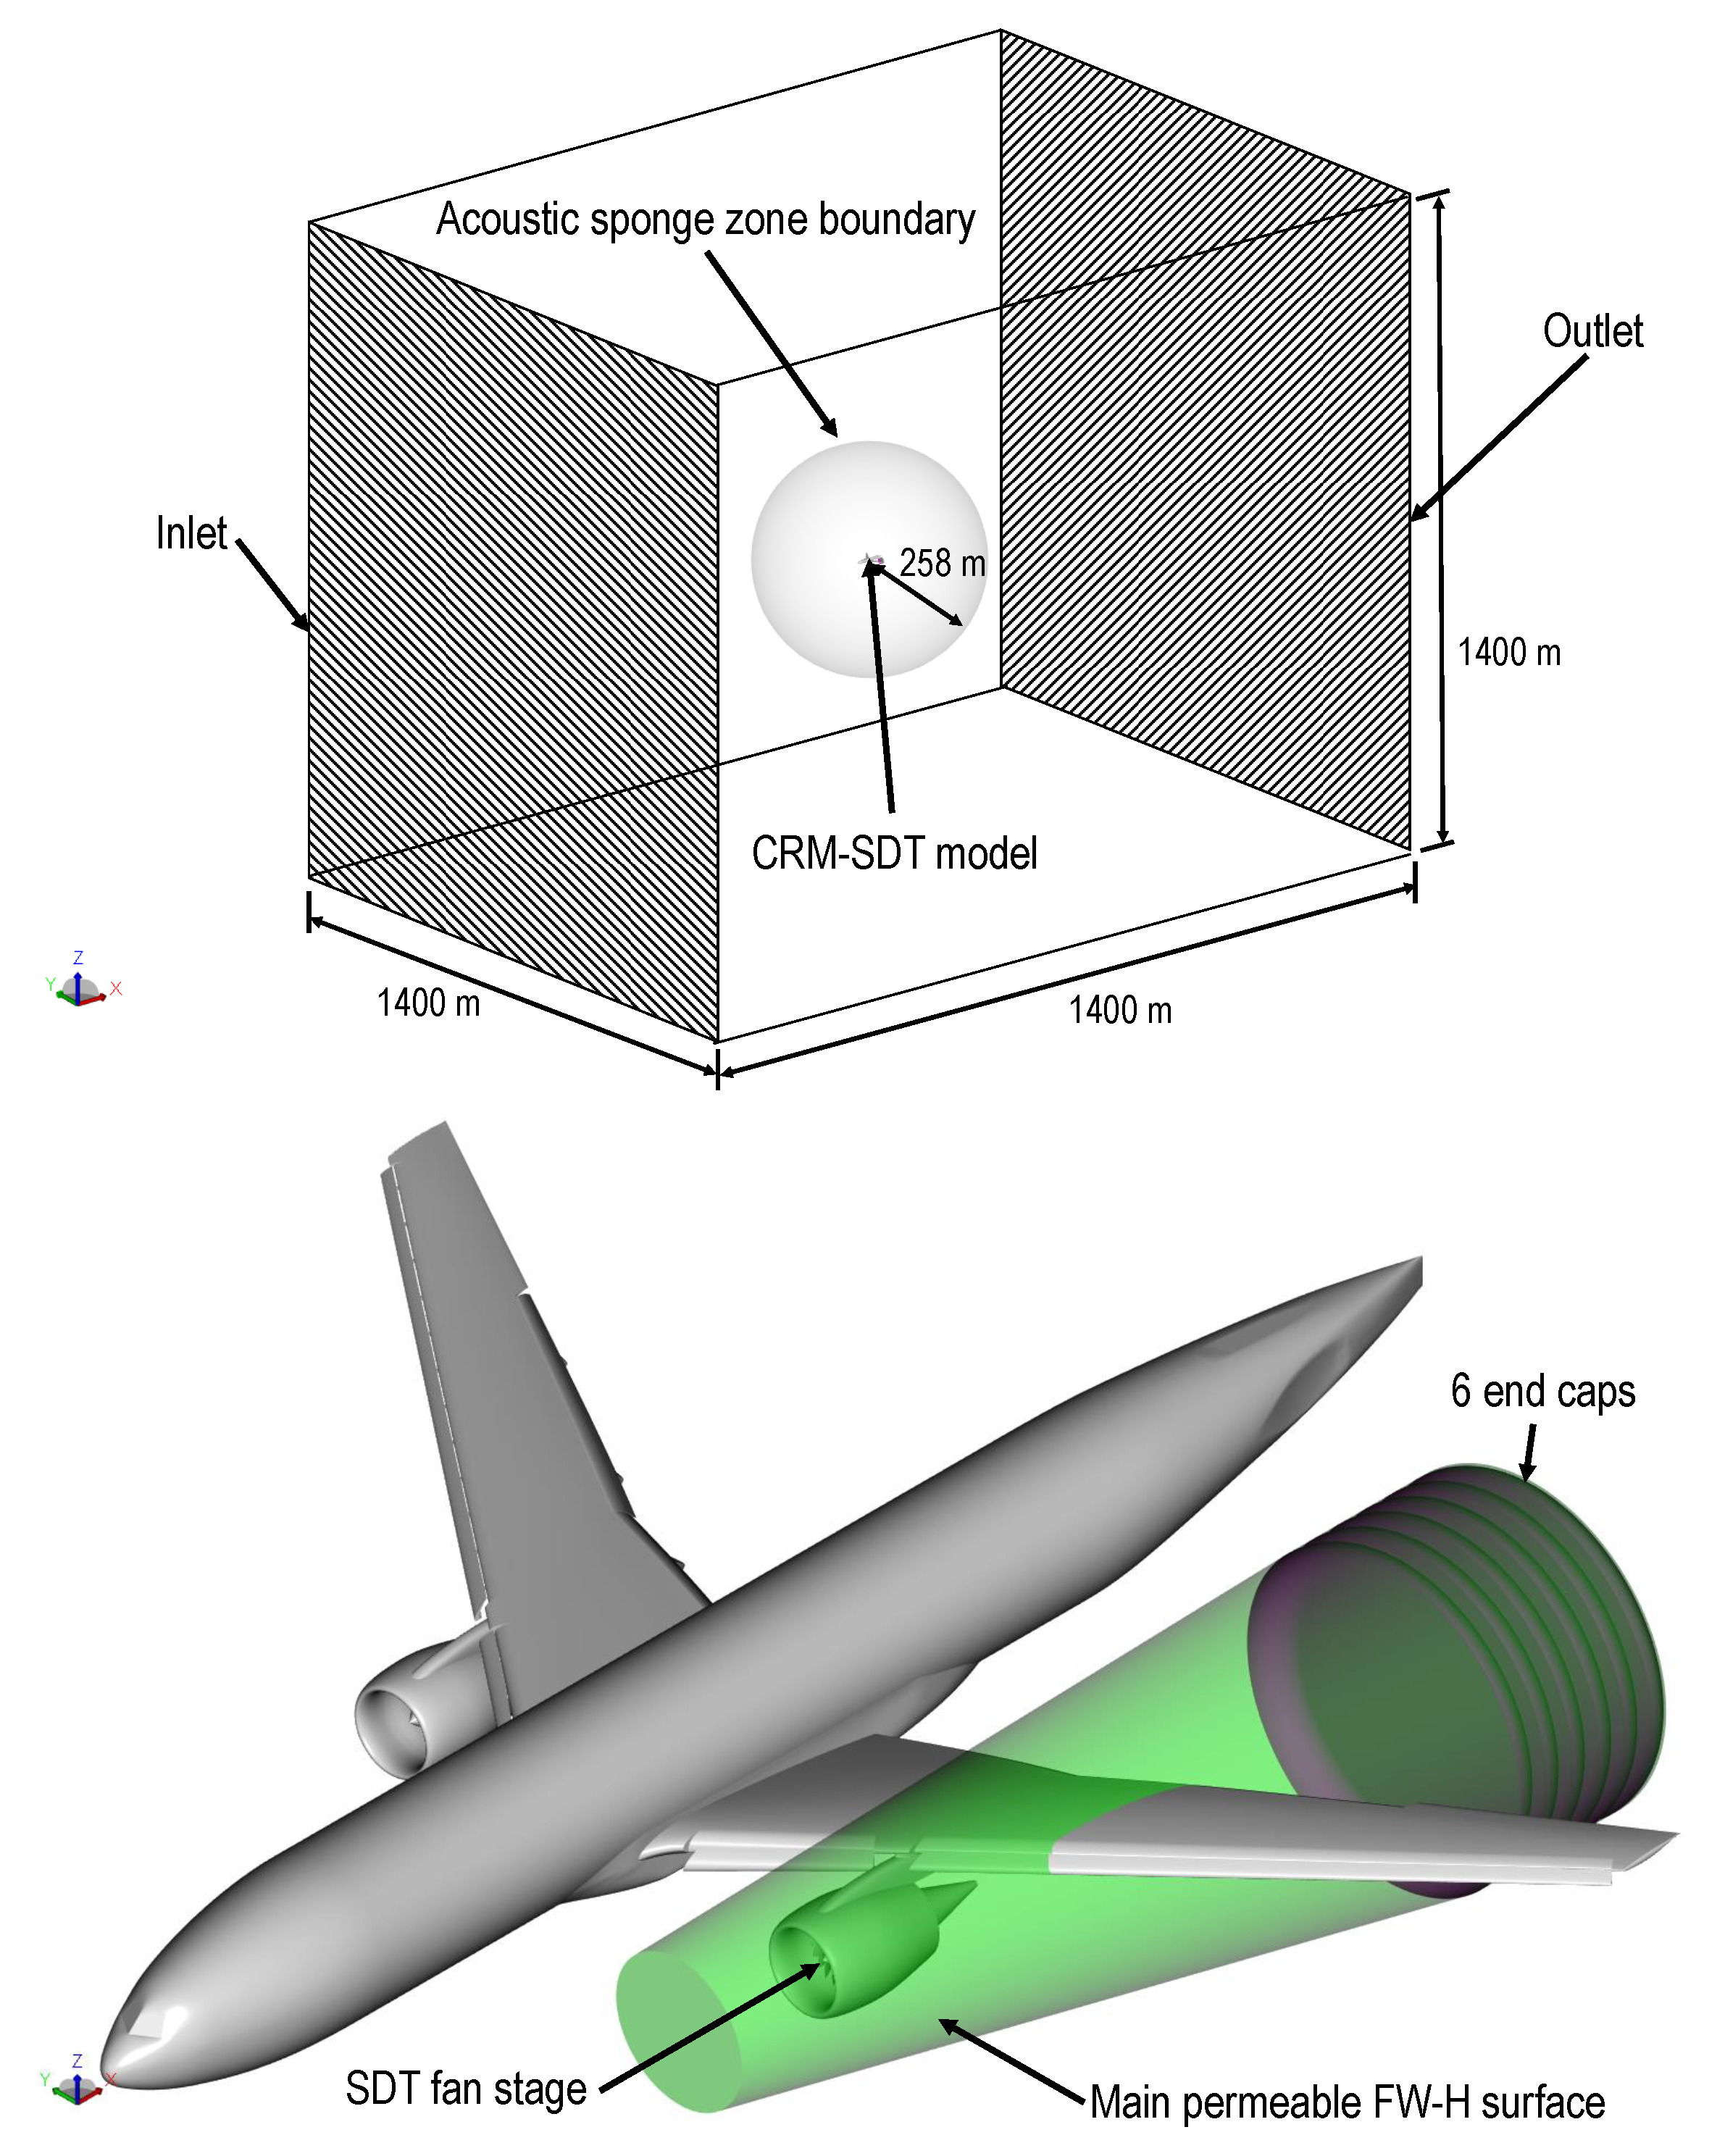
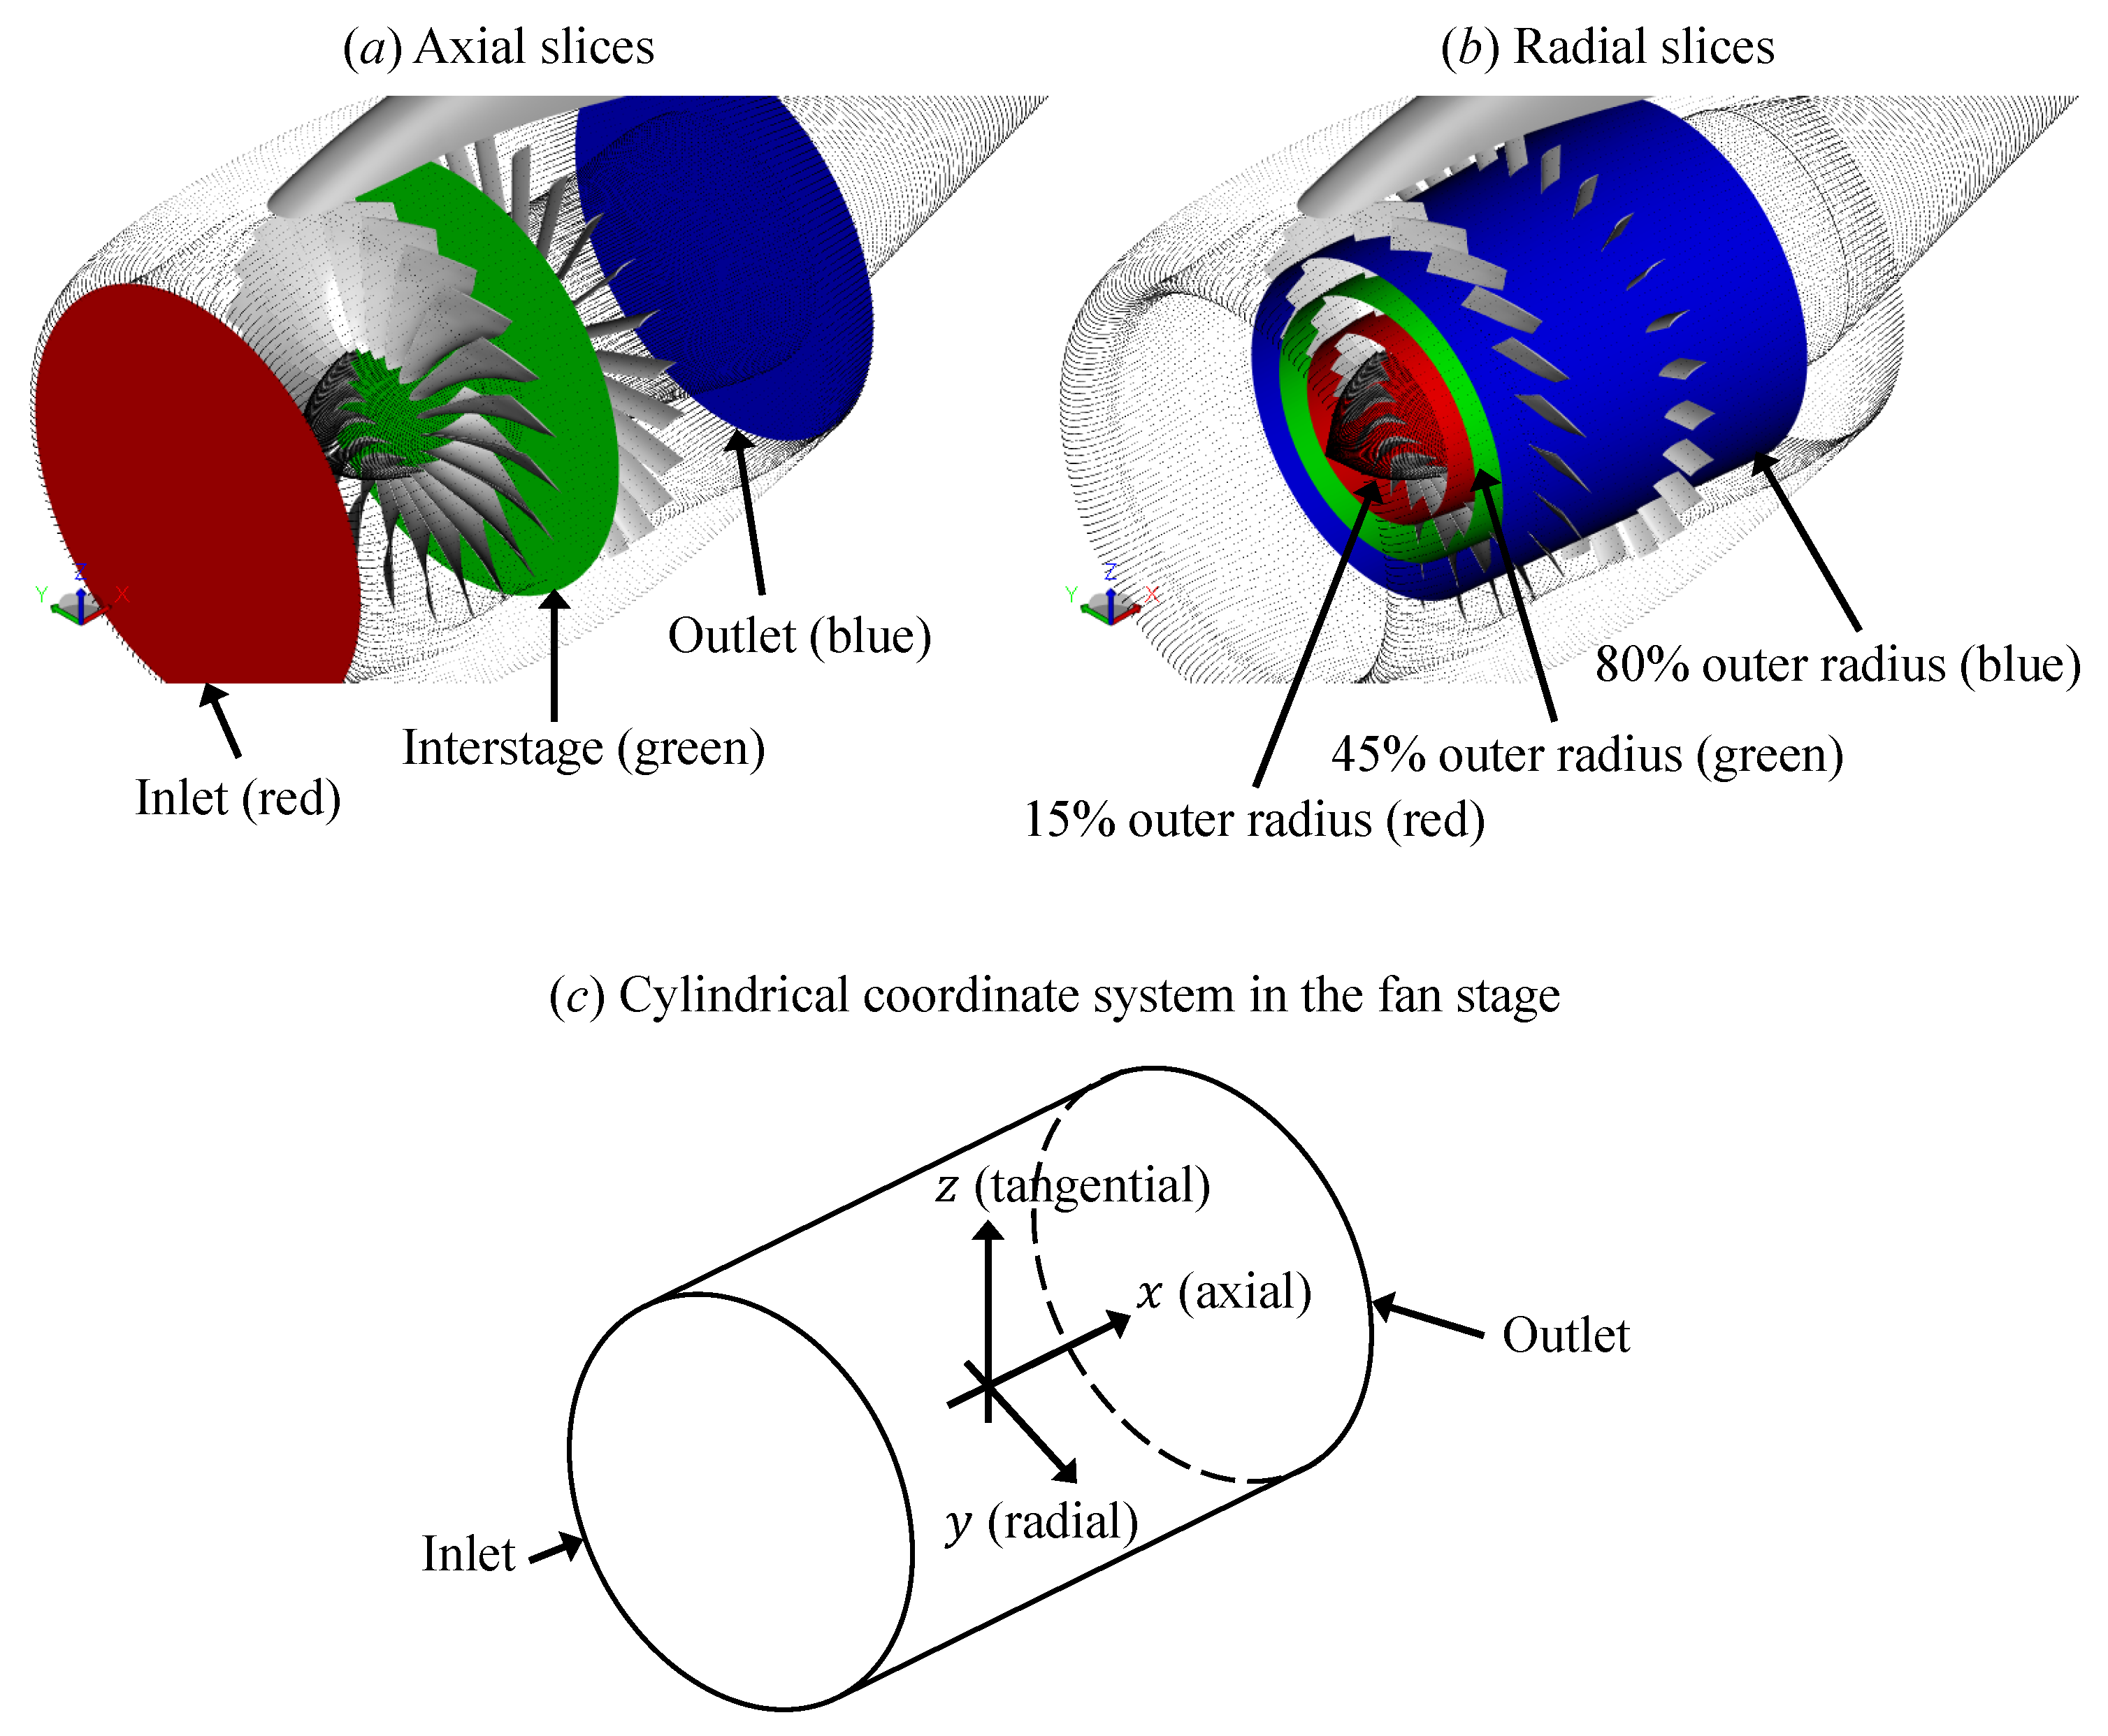
2.2. Simulation Setup

The present study considers a full-scale aircraft model that combines two main elements, both of which were developed by NASA. The airframe (e.g., fuselage and lifting surfaces) is obtained from the common research model (CRM), which resembles a typical transonic wide-body airliner. The default CRM configuration is equipped with flow-through (empty) nacelles. Hence, the port nacelle is replaced with the fan stage model from the source diagnostic test (SDT) rig. Figure 1 illustrates the present CRM/SDT configuration. It is worth mentioning that the CRM geometry lacks the horizontal and vertical stabilizers. The high-lift devices (slats and flaps) are deployed as the main wings are set in an approach condition. This airframe configuration is also referred to as the high lift CRM (HL-CRM) [37]. In the present study, the SDT fan stage is upscaled by a factor of 5.5 to match the dimensions of typical modern turbofans. Upscaling is not performed for the CRM geometry as it was made available in full scale. The dimensions of the NASA HL-CRM and the upscaled NASA-SDT geometries are compared against their closest real-life counterparts in Table 1. Note that the fan in the current CRM/SDT setup operates at a lower rotational speed (i.e., 1420 RPM) than that in the original SDT study [2] in order to maintain the same fan tip speed U ref = 237.57   m / s .
This study is particularly interested in addressing the noise produced by the fan wake–OGV interaction mechanism, and for this purpose, the LE of the OGVs was modified using poro-serrations. A closer view of the poro-serrated OGV in the fan stage is provided in Figure 2. Such LE modification was chosen based on authors’ past findings [15]; the serration planform is very effective at attenuating the tonal noise component at low frequencies, while the porosity of the LE reduces the broadband noise generation in the higher frequency range. The porous treatment is modeled after a Ni–Cr–Al metal foam [38] with two different mean pore diameters, i.e., 800 μ m and 450 μ m; the former was also employed in the authors’ previous investigation [15]. The properties of the metal foam are reported in Table 2. In the subsequent sections, the aircrafts equipped with poro-serrated OGVs are referred to as the M800 and M450 configurations respectively, emphasizing the mean pore size. The serrations in these configurations have a sinusoidal planform that is characterized by a wavelength Λ = 0.76 c and amplitude H = 0.38 c , where c = 218.5 mm is the average chord length of the OGV. The serration parameters are selected based on the turbulence length scales in the axial and radial directions upstream of the OGV. The serrations modify the planform of the OGV only at the first 20% of the OGV chord. Downstream of the serration root, the porous medium region wraps around a streamlined solid–porous junction that extends in between 35% to 60% of the OGV chord.
Aside from the previous two, the M450E configuration was introduced to mitigate the adverse aerodynamic impact from the M800 and M450 designs. In this particular case, the porous medium region is applied only at the outer 85% of the OGV radius, where the strength of the noise sources is expected to be the strongest [4]. The inner span of the OGV is equipped with solid serrations to prevent the cross-flow in the porous medium region due to the pressure difference between the suction and pressure sides of the blade [15], and therefore the blade loading characteristic is preserved. The serration planform remains uniform across the OGV blade, where the serration wavelength is half of that of the M450 configuration but the amplitude remains the same.
The simulation domain is shown at the top of Figure 3. The CRM/SDT model is positioned at the center of a cubic domain whose sides are 1400 m long, or roughly 24 times the aircraft wingspan. All domain boundaries are specified as “inlets” with a freestream velocity of 68 m/s and a static pressure of 101,325 Pa. Despite the designation, PowerFLOW allows some inlet boundaries to behave as outlets depending on the numerical solution. The airframe is installed at an incidence of 7 deg to realize an angle of attack of 4 deg and a standard rate of descent of 3 deg [39]. For computing far-field noise using the acoustic analogy, a permeable surface is defined enclosing the exterior of the turbofan and an inboard segment of the port wing as shown in Figure 3. A total of six end caps are added at the downstream end of the permeable surface to filter pseudo-sound contamination from the jet plume. These surface samples’ pressure and velocity fluctuate at 5.93 kHz, resulting in a Nyquist frequency that equals 5.7 times the expected blade-passage frequency ( BPF 1 520 Hz ). Data recording was performed for 1.32 s, which is roughly equivalent to 31 fan rotational cycles. This allows for capturing acoustic data at frequencies as low as 100 Hz (≈0.2 BPF 1 ). An acoustic sponge region was specified starting from a radius of 258 m (i.e., four times the length of the CRM fuselage) from the aircraft’s nose to prevent acoustic reflection at the domain boundaries.
The simulation domain was subdivided into 16 grid refinement regions, in which the finest voxels are located inside the fan stage and at regions surrounding the jet plume. A snapshot of the voxel distribution in the simulation domain is shown in Figure 4. The smallest voxel size is equal to 2.54 mm, or 0.0116 c , and thus there are approximately 33 voxels along the axial distance between the serration tip and root. The simulation is carried out for a total of 2.56 s with an initial transient of 1.24 s. The simulations were carried out using the Dutch National Supercomputer facility (Cartesius) with 720 cores of Intel-Haswell Xeon E5-2690 v3. For the finest grid configuration, the computational cost is approximately 95,000 CPU hours for the configuration with poro-serrated OGVs (M800/M450).

3. Simulation Verifications

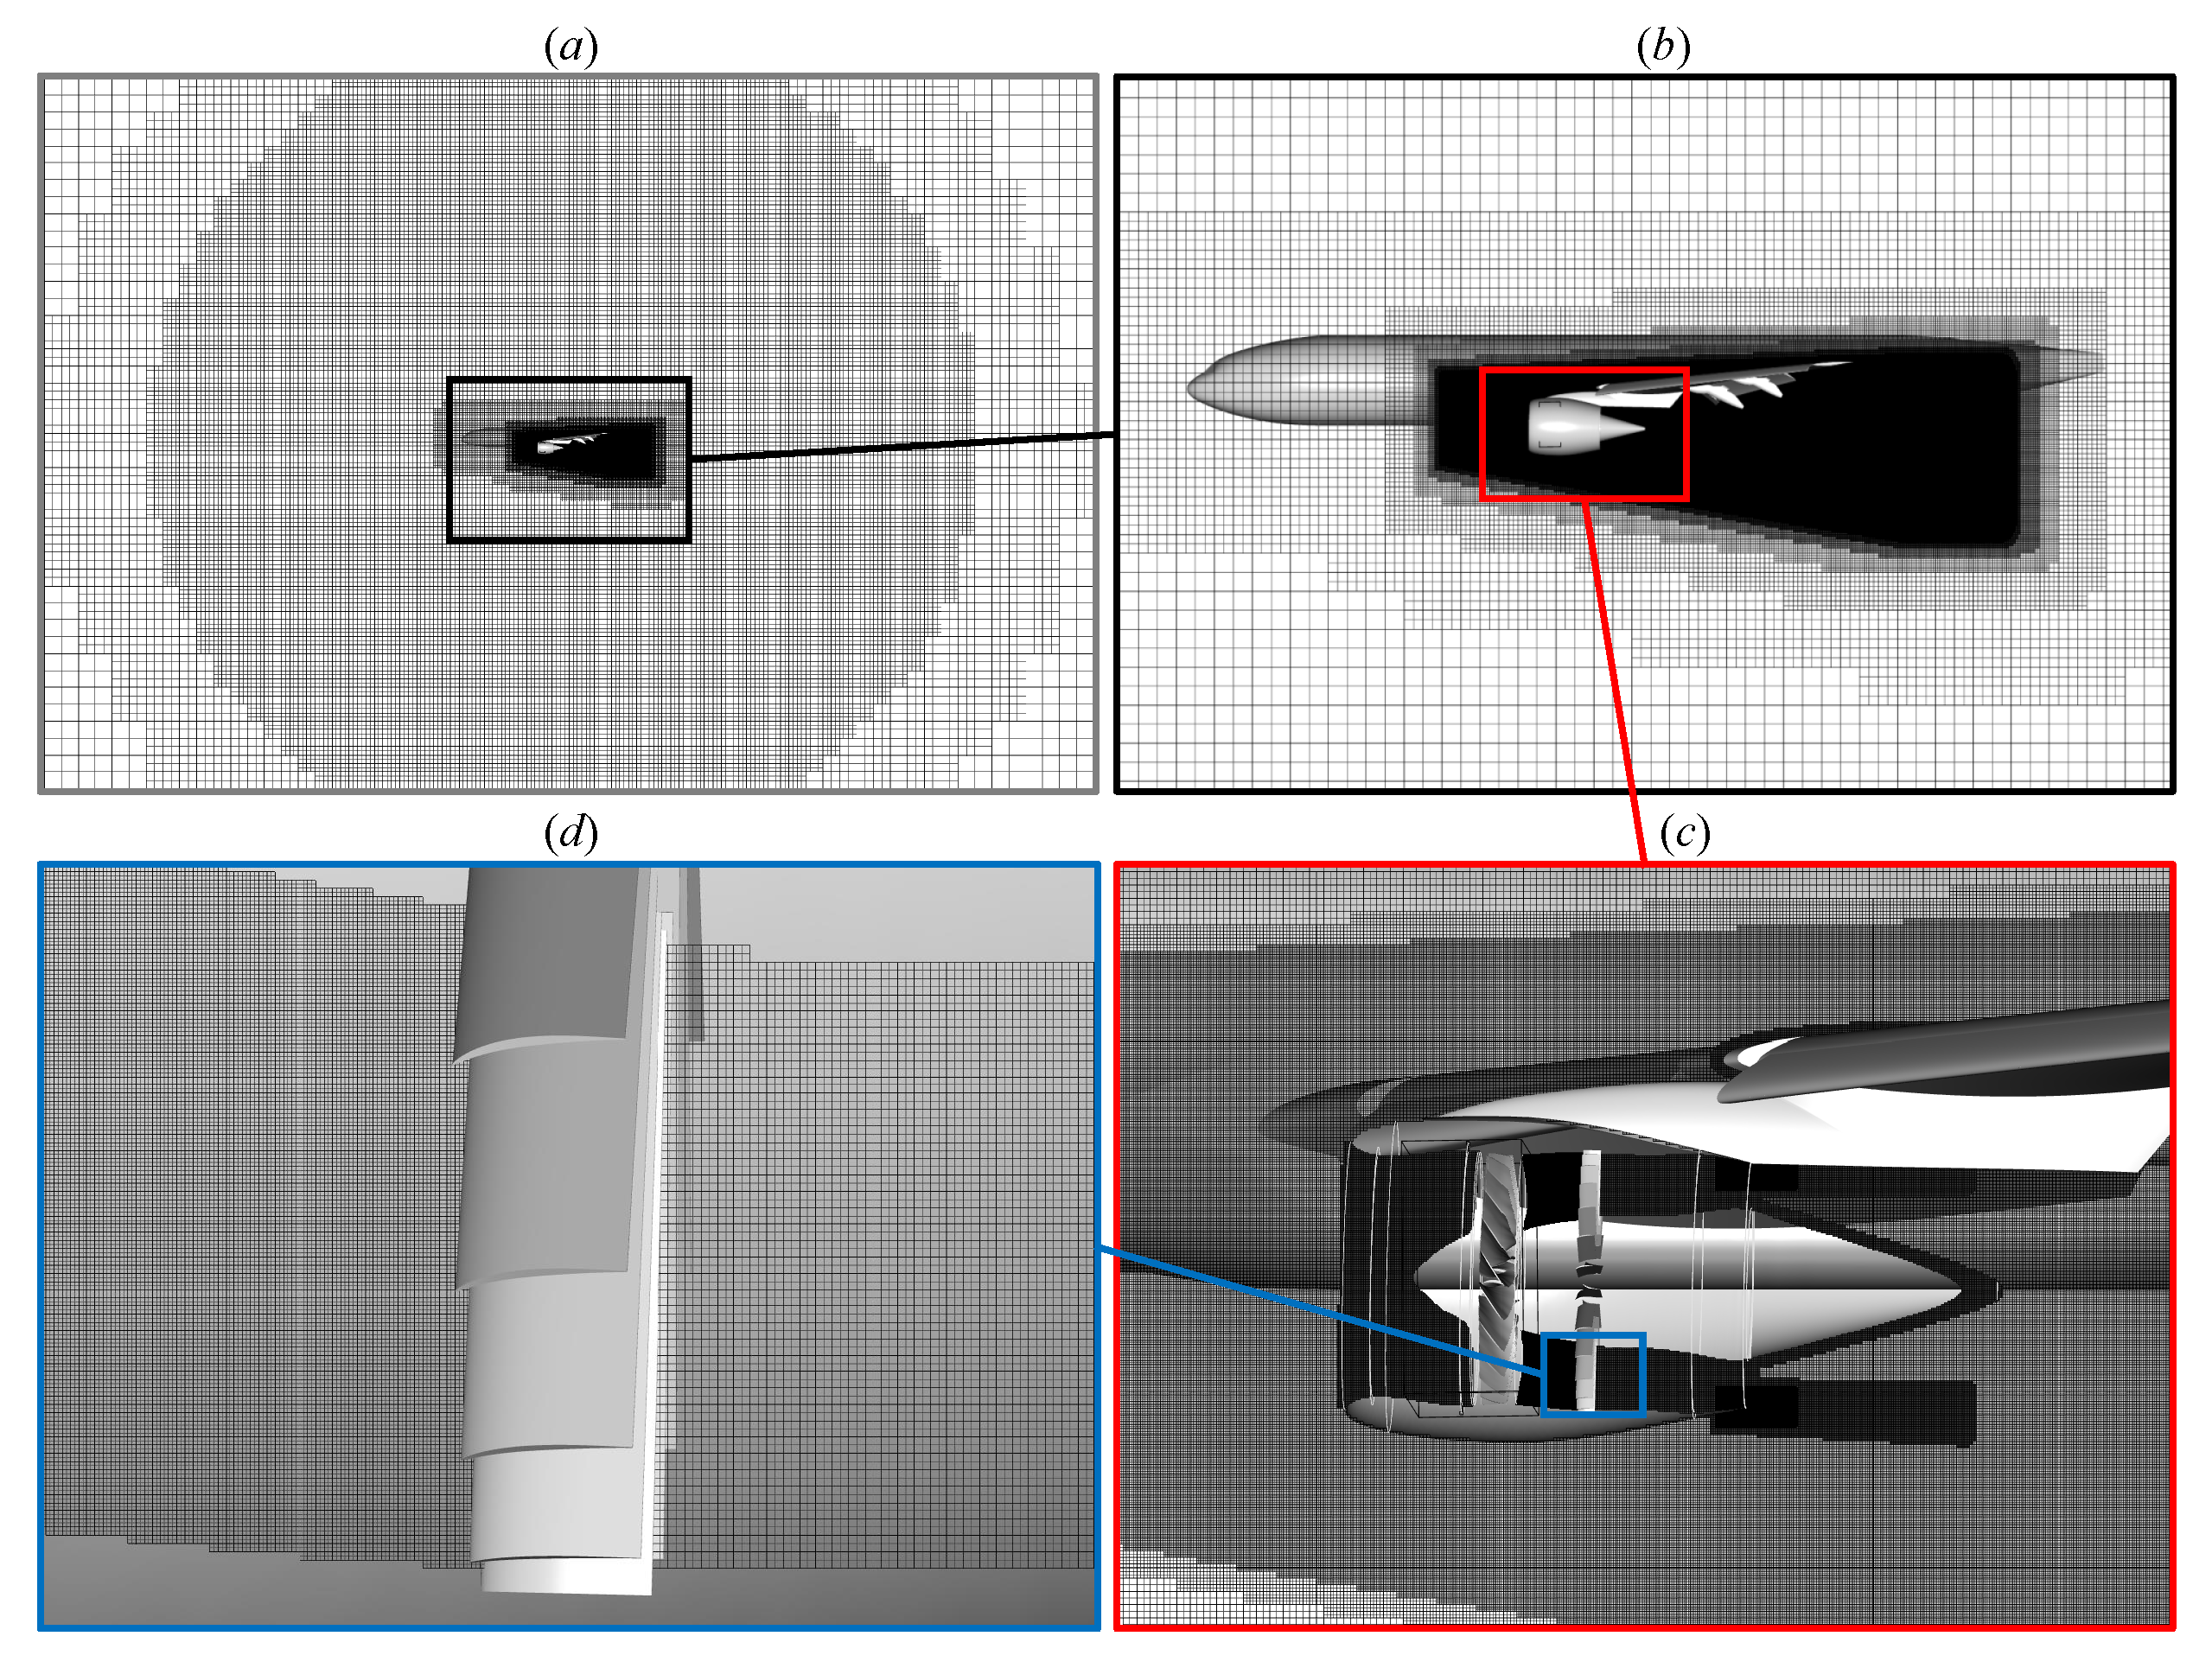
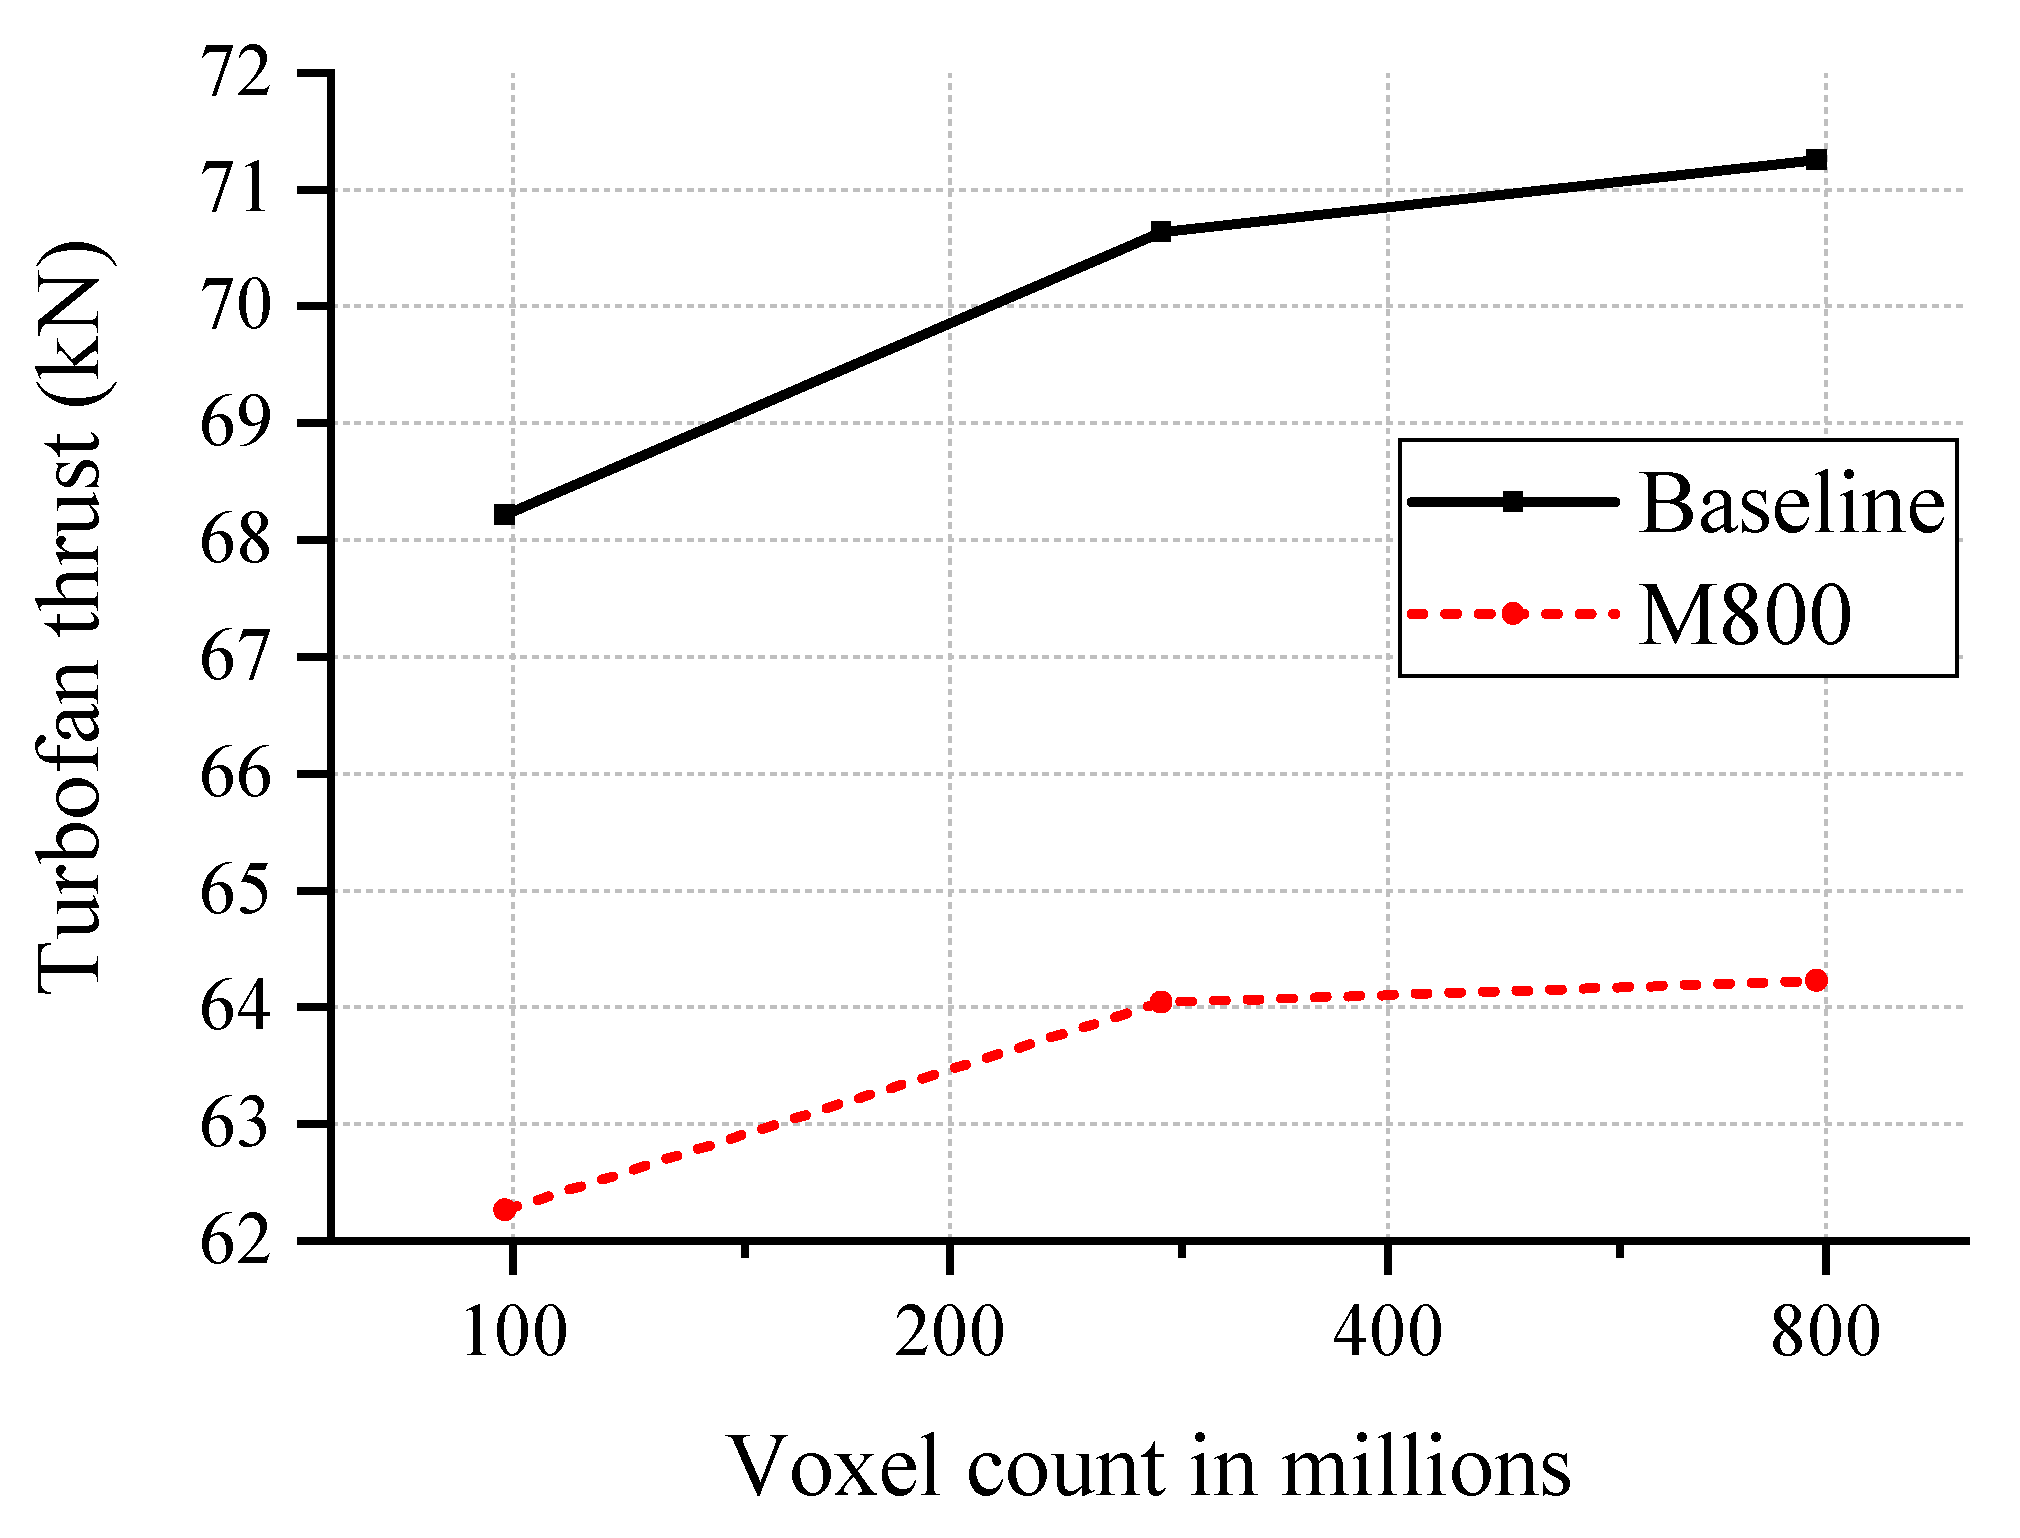
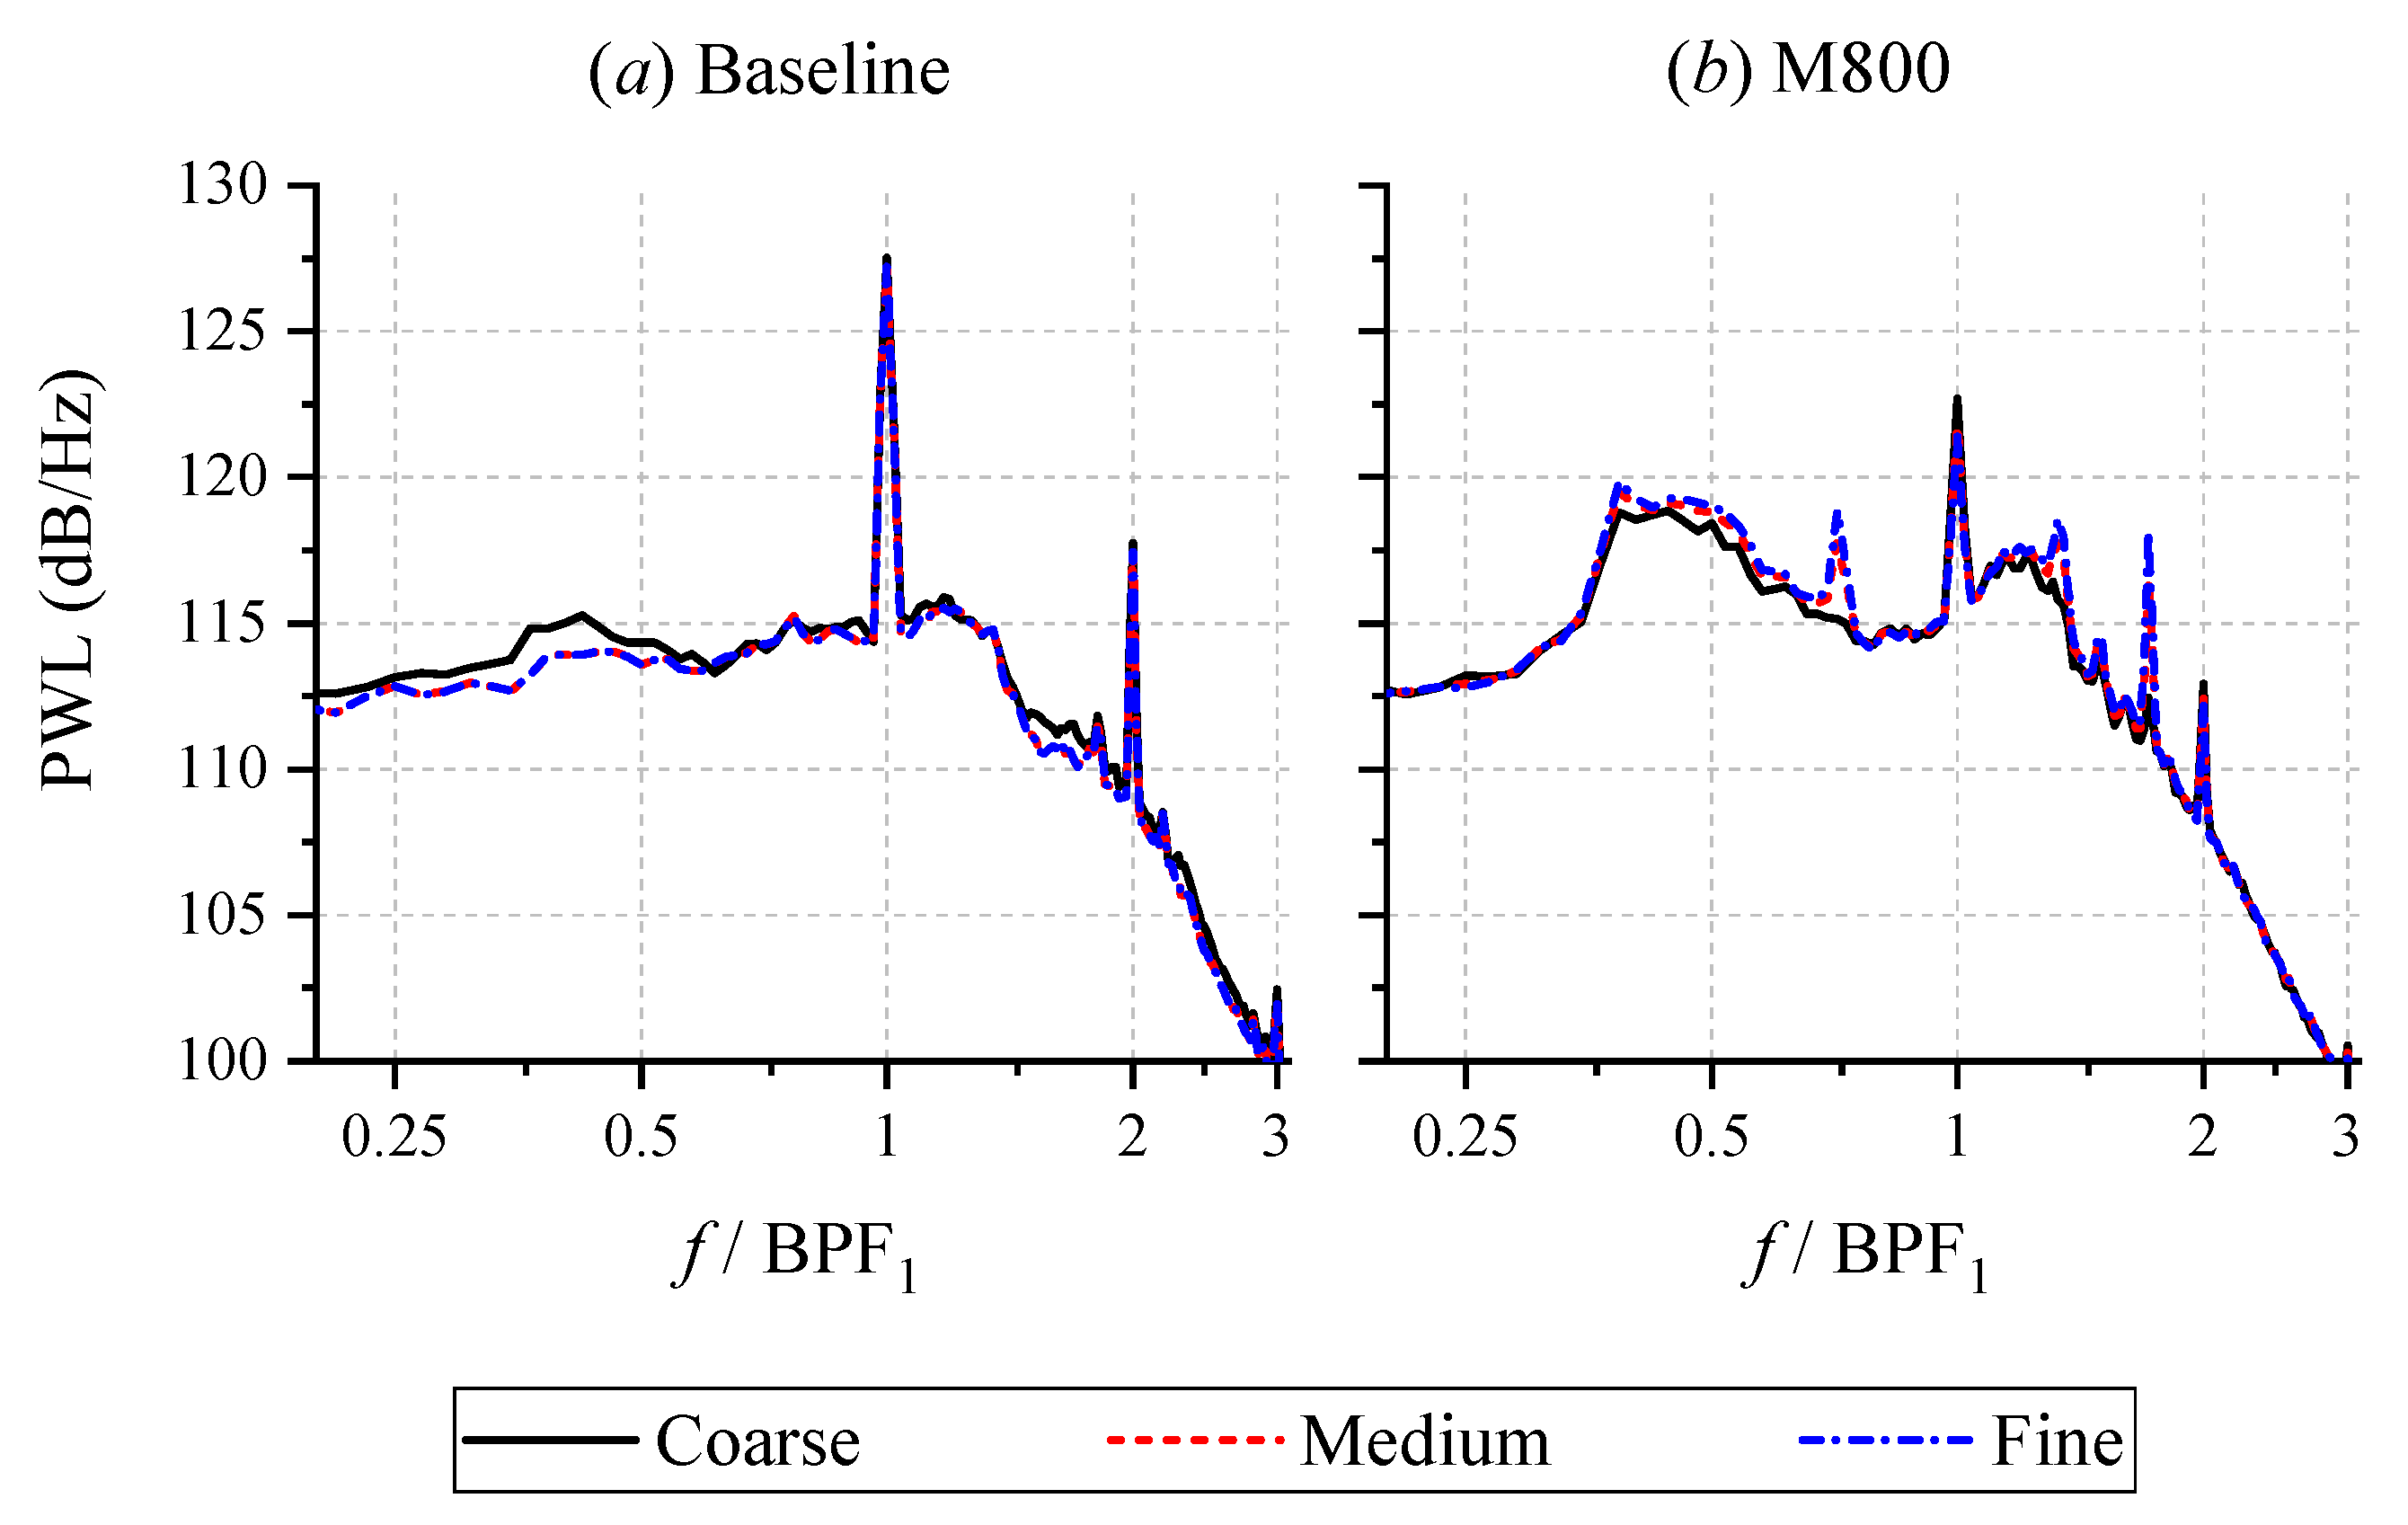
3.1. Grid-Convergence Study

A grid-convergence study of the simulation results is carried out using three different mesh resolutions, namely coarse, medium, and fine, with a refinement ratio of 2 . The simulation settings are reported in Table 3. Note that the grid resolution level is defined using the number of voxels assigned over the chord length (c) of the baseline SDT OGV.
The effect of varying the grid resolution level on the mean flow field is evaluated using the time-averaged thrust values. The fan-stage thrust was computed using the following equation.
Thrust = m ˙ outlet U x , outlet m ˙ inlet U x , inlet + ( p outlet p inlet ) A outlet
The mass flow at the inlet m ˙ inlet is equal to that at the outlet m ˙ outlet as the SDT configuration lacks a core engine stage, and thus the thrust contribution from the first term of the Equation (11) is only due to the difference between the average axial velocity ( U x ) at the fan-stage inlet and that at the outlet. The second term in Equation (11) refers to the pressure-area term, with A outlet being the cross-section area of the fan-stage outlet. Figure 5 shows the variation of the thrust with the number of voxels in the simulations for both baseline and M800 configurations. The thrust value approaches convergence as the number of voxels is increased, such that the differences between the values for the fine and medium grid resolution levels are 0.87 % and 0.28 % for the baseline and M800 cases, respectively.
The influence of the grid resolution on the sound emission characteristics of the CRM/SDT configuration is evaluated using the sound power level (PWL) spectra. The source power level (PWL) was estimated by integrating the far-field noise intensity over a fictitious spherical surface with a radius of 120 m (i.e., ≈ twice the length of the CRM fuselage) centered at the fan-stage inlet. A total of 648 measurement points are distributed on the surface with an increment of 10 ° in both azimuthal and polar directions. The variation of the PWL spectra with the grid resolution level is depicted in Figure 6, where converging trends can be observed for both the baseline and M800 cases. For the M800 configuration, the variations in the tonal noise component are more noticeable than the broadband ones. The spectra also show the presence of tones that are unrelated to the harmonics of BPF 1 only when the medium or fine grid setting is employed. These tones might be related to a physical phenomenon that cannot be resolved properly without a sufficiently fine grid. Nevertheless, they only have a minor contribution to the overall PWL (OPWL), such that the differences in OPWL between the medium and coarse grid settings is 0.3 dB, and 0.15 dB between the fine grid setting and the medium one.

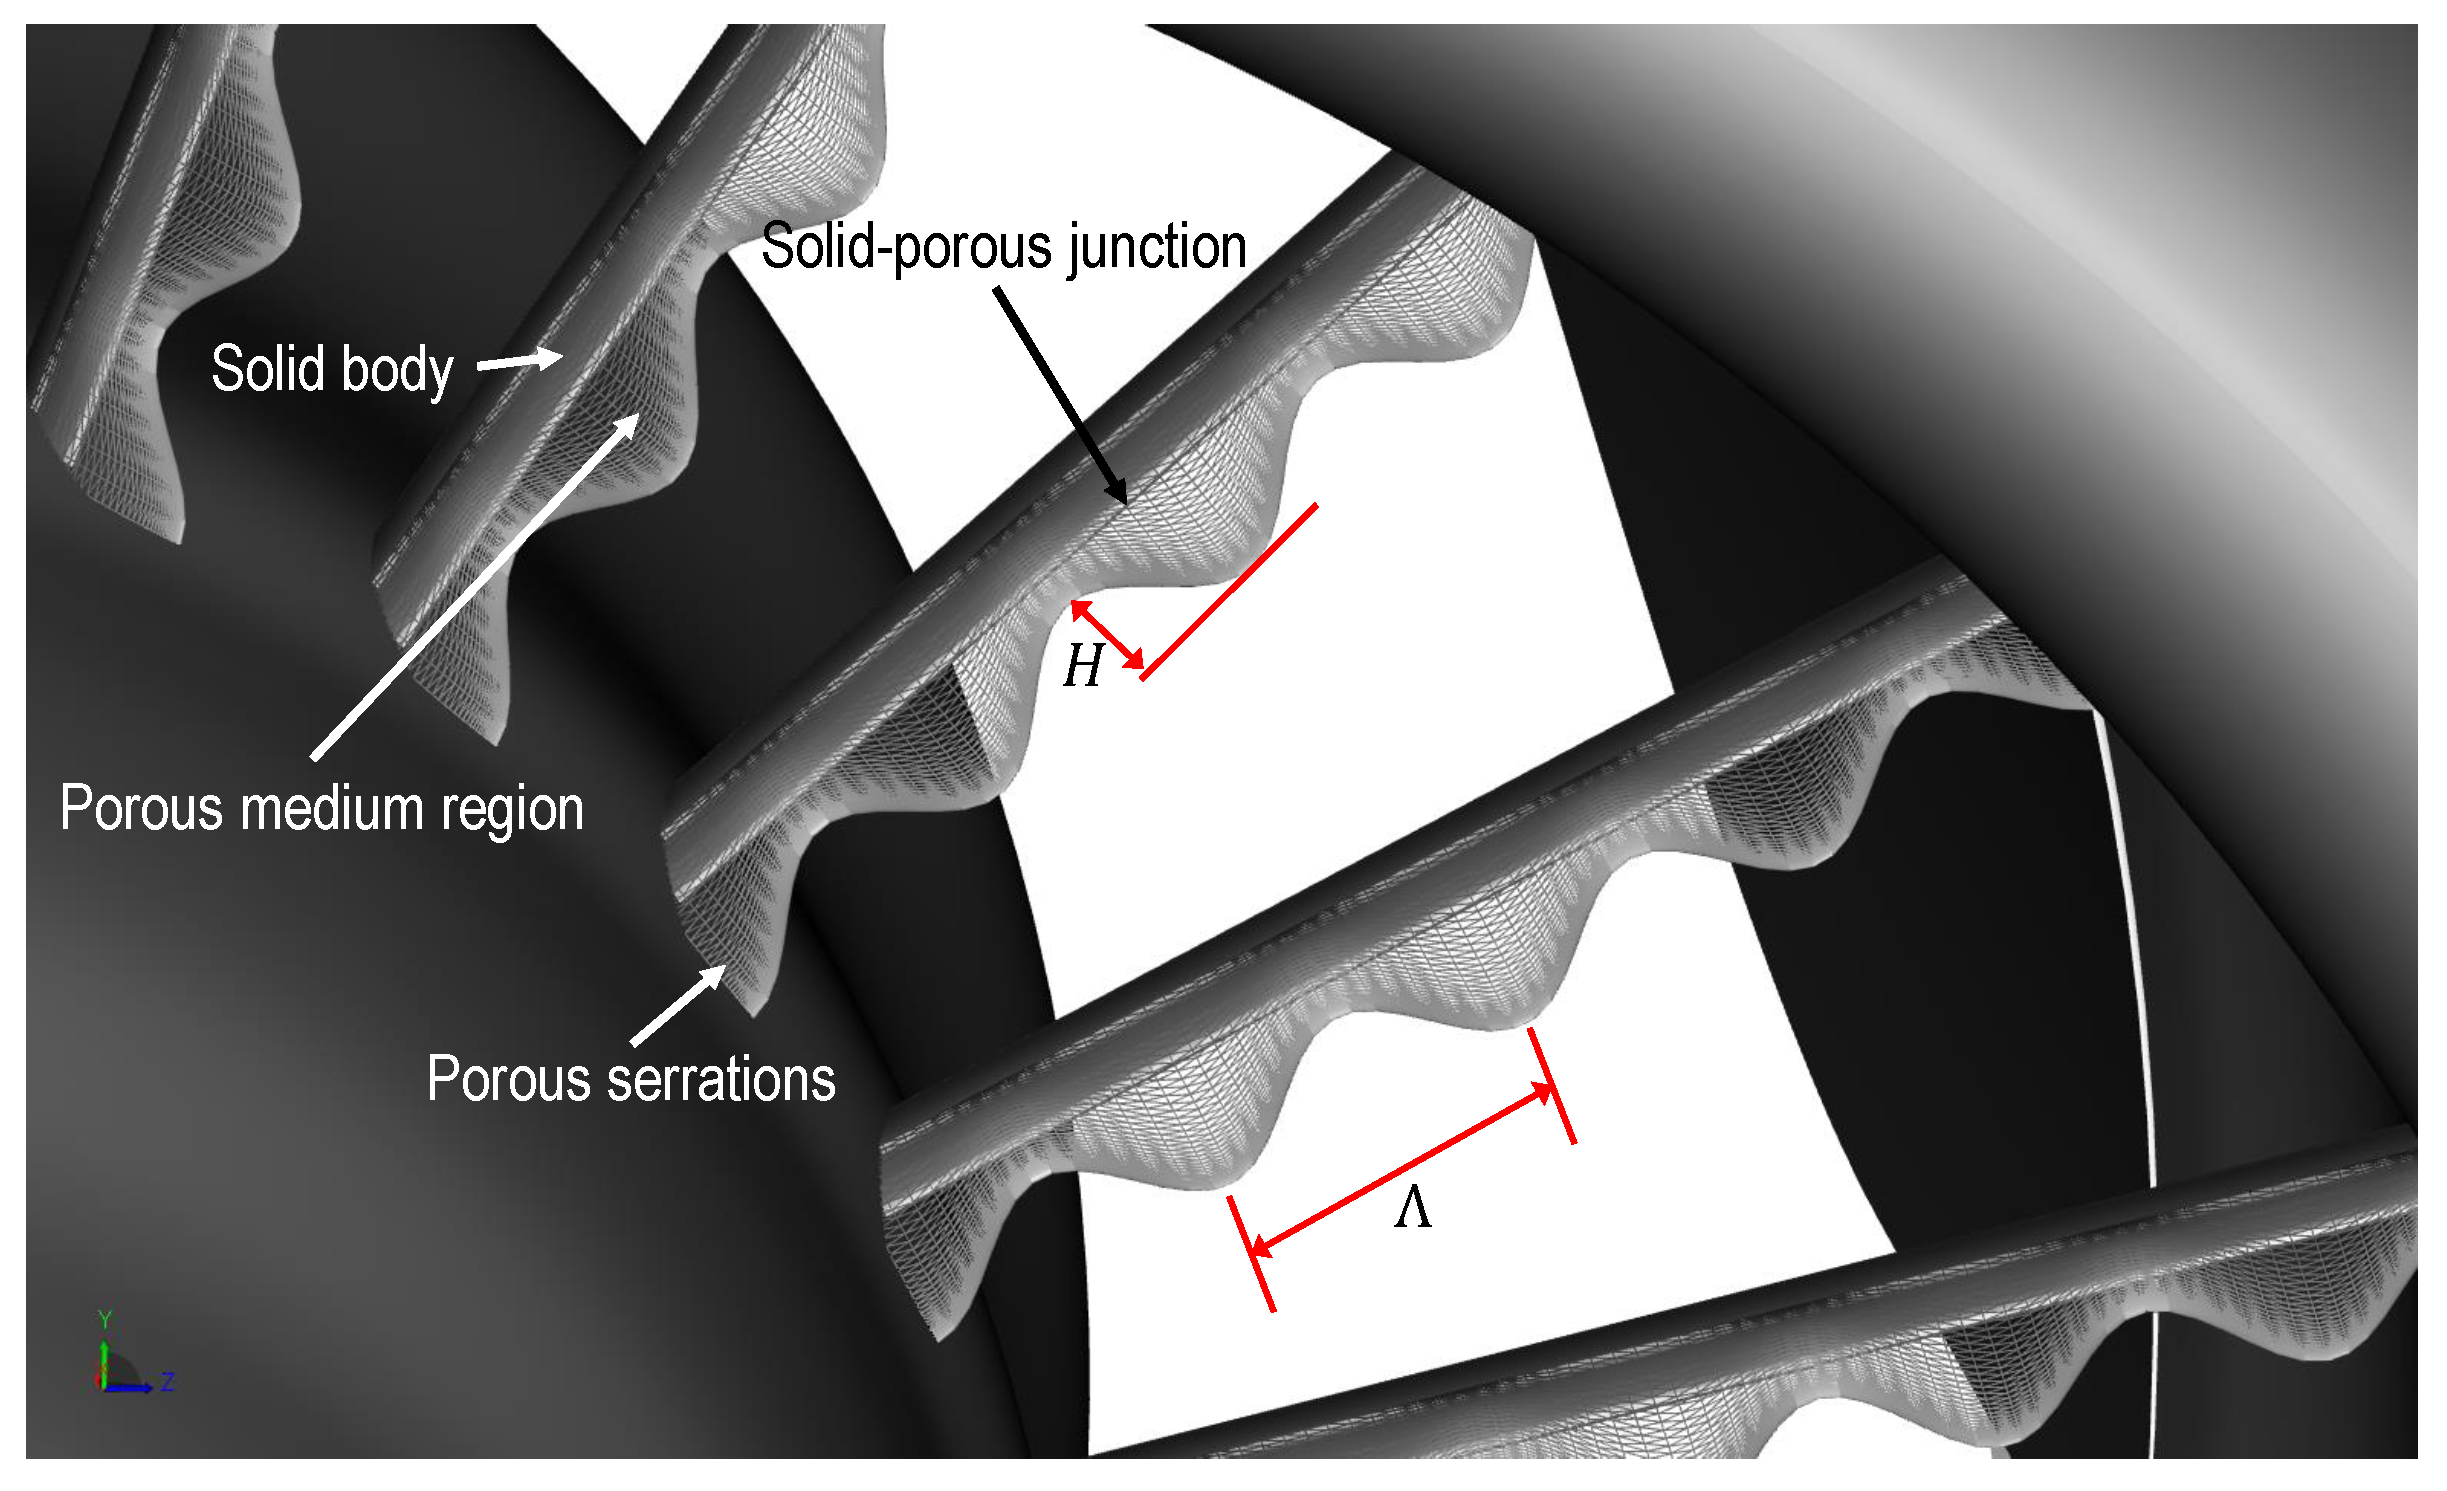
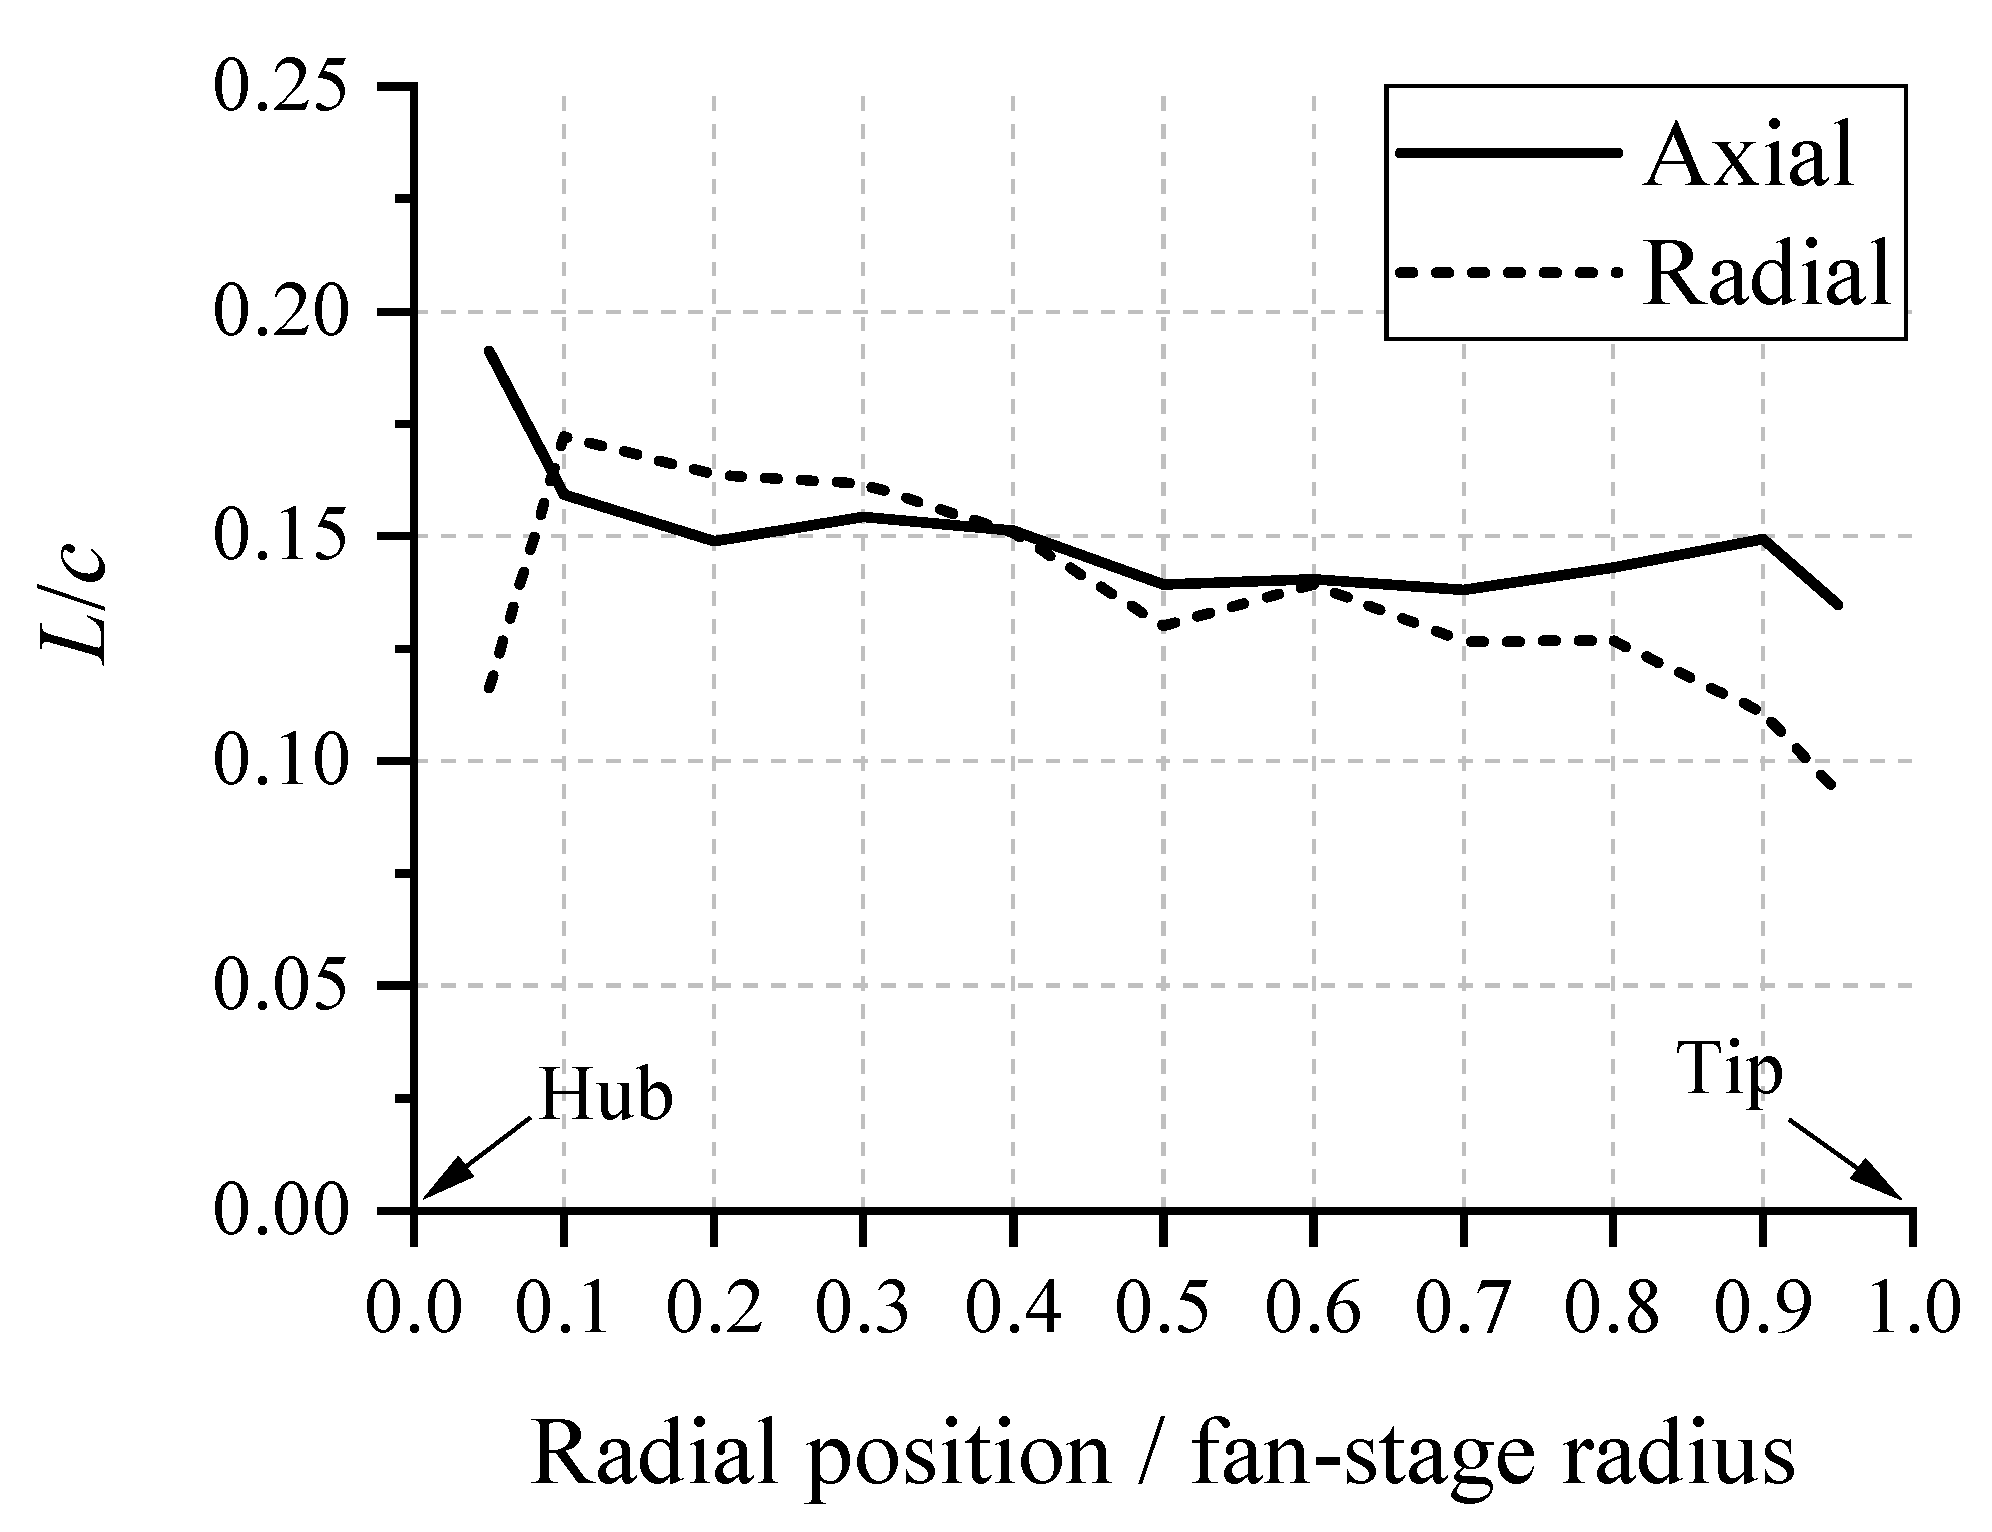
3.2. Integral Length Scales and Serration Design Verification

Obtaining the integral length scales in the fan wake is essential for optimizing the serration design parameters. At present, the integral length scales are computed at axial locations halfway between the fan and OGV blades, which will be referred to as the interstage in subsequent sections. The procedure mimics that of Podboy et al. [40], where axial and radial velocity fluctuations are measured locally using a probe. The integral length scales are then calculated by invoking Taylor’s frozen turbulence hypothesis as follows:
L i = U 0 u i ( t ) u i ( t + Δ t ) u i 2 d t ,
where U is the local velocity magnitude, u i is the velocity fluctuation in the ith direction, and · is the ensemble averaging operator.
The variation of axial and radial length scales along the fan-stage radius for the baseline configuration is shown in Figure 7. In the axial direction, the integral length scale is around L x = 0.15 c , although it can reach up to 0.19 c near the hub. Regardless, the usage of a serration amplitude H = 0.38 c still satisfies the optimal ratio H / L x 2 . The radial length scale ( L z ) tends to decrease towards the outer fan-stage radius, varying in between 0.17 c and 0.1 c . The serration wavelength in both M800 and M450 configurations is Λ = 0.76 c , which satisfies the optimal ratio Λ / L z 4 near the hub, but overestimates near the tip. In order to maximize noise attenuation at the outer radius of the OGV, where local noise sources are expected to be the strongest, the serrations in the M450E are designed using a shorter wavelength of Λ = 0.38 c .

4. Results

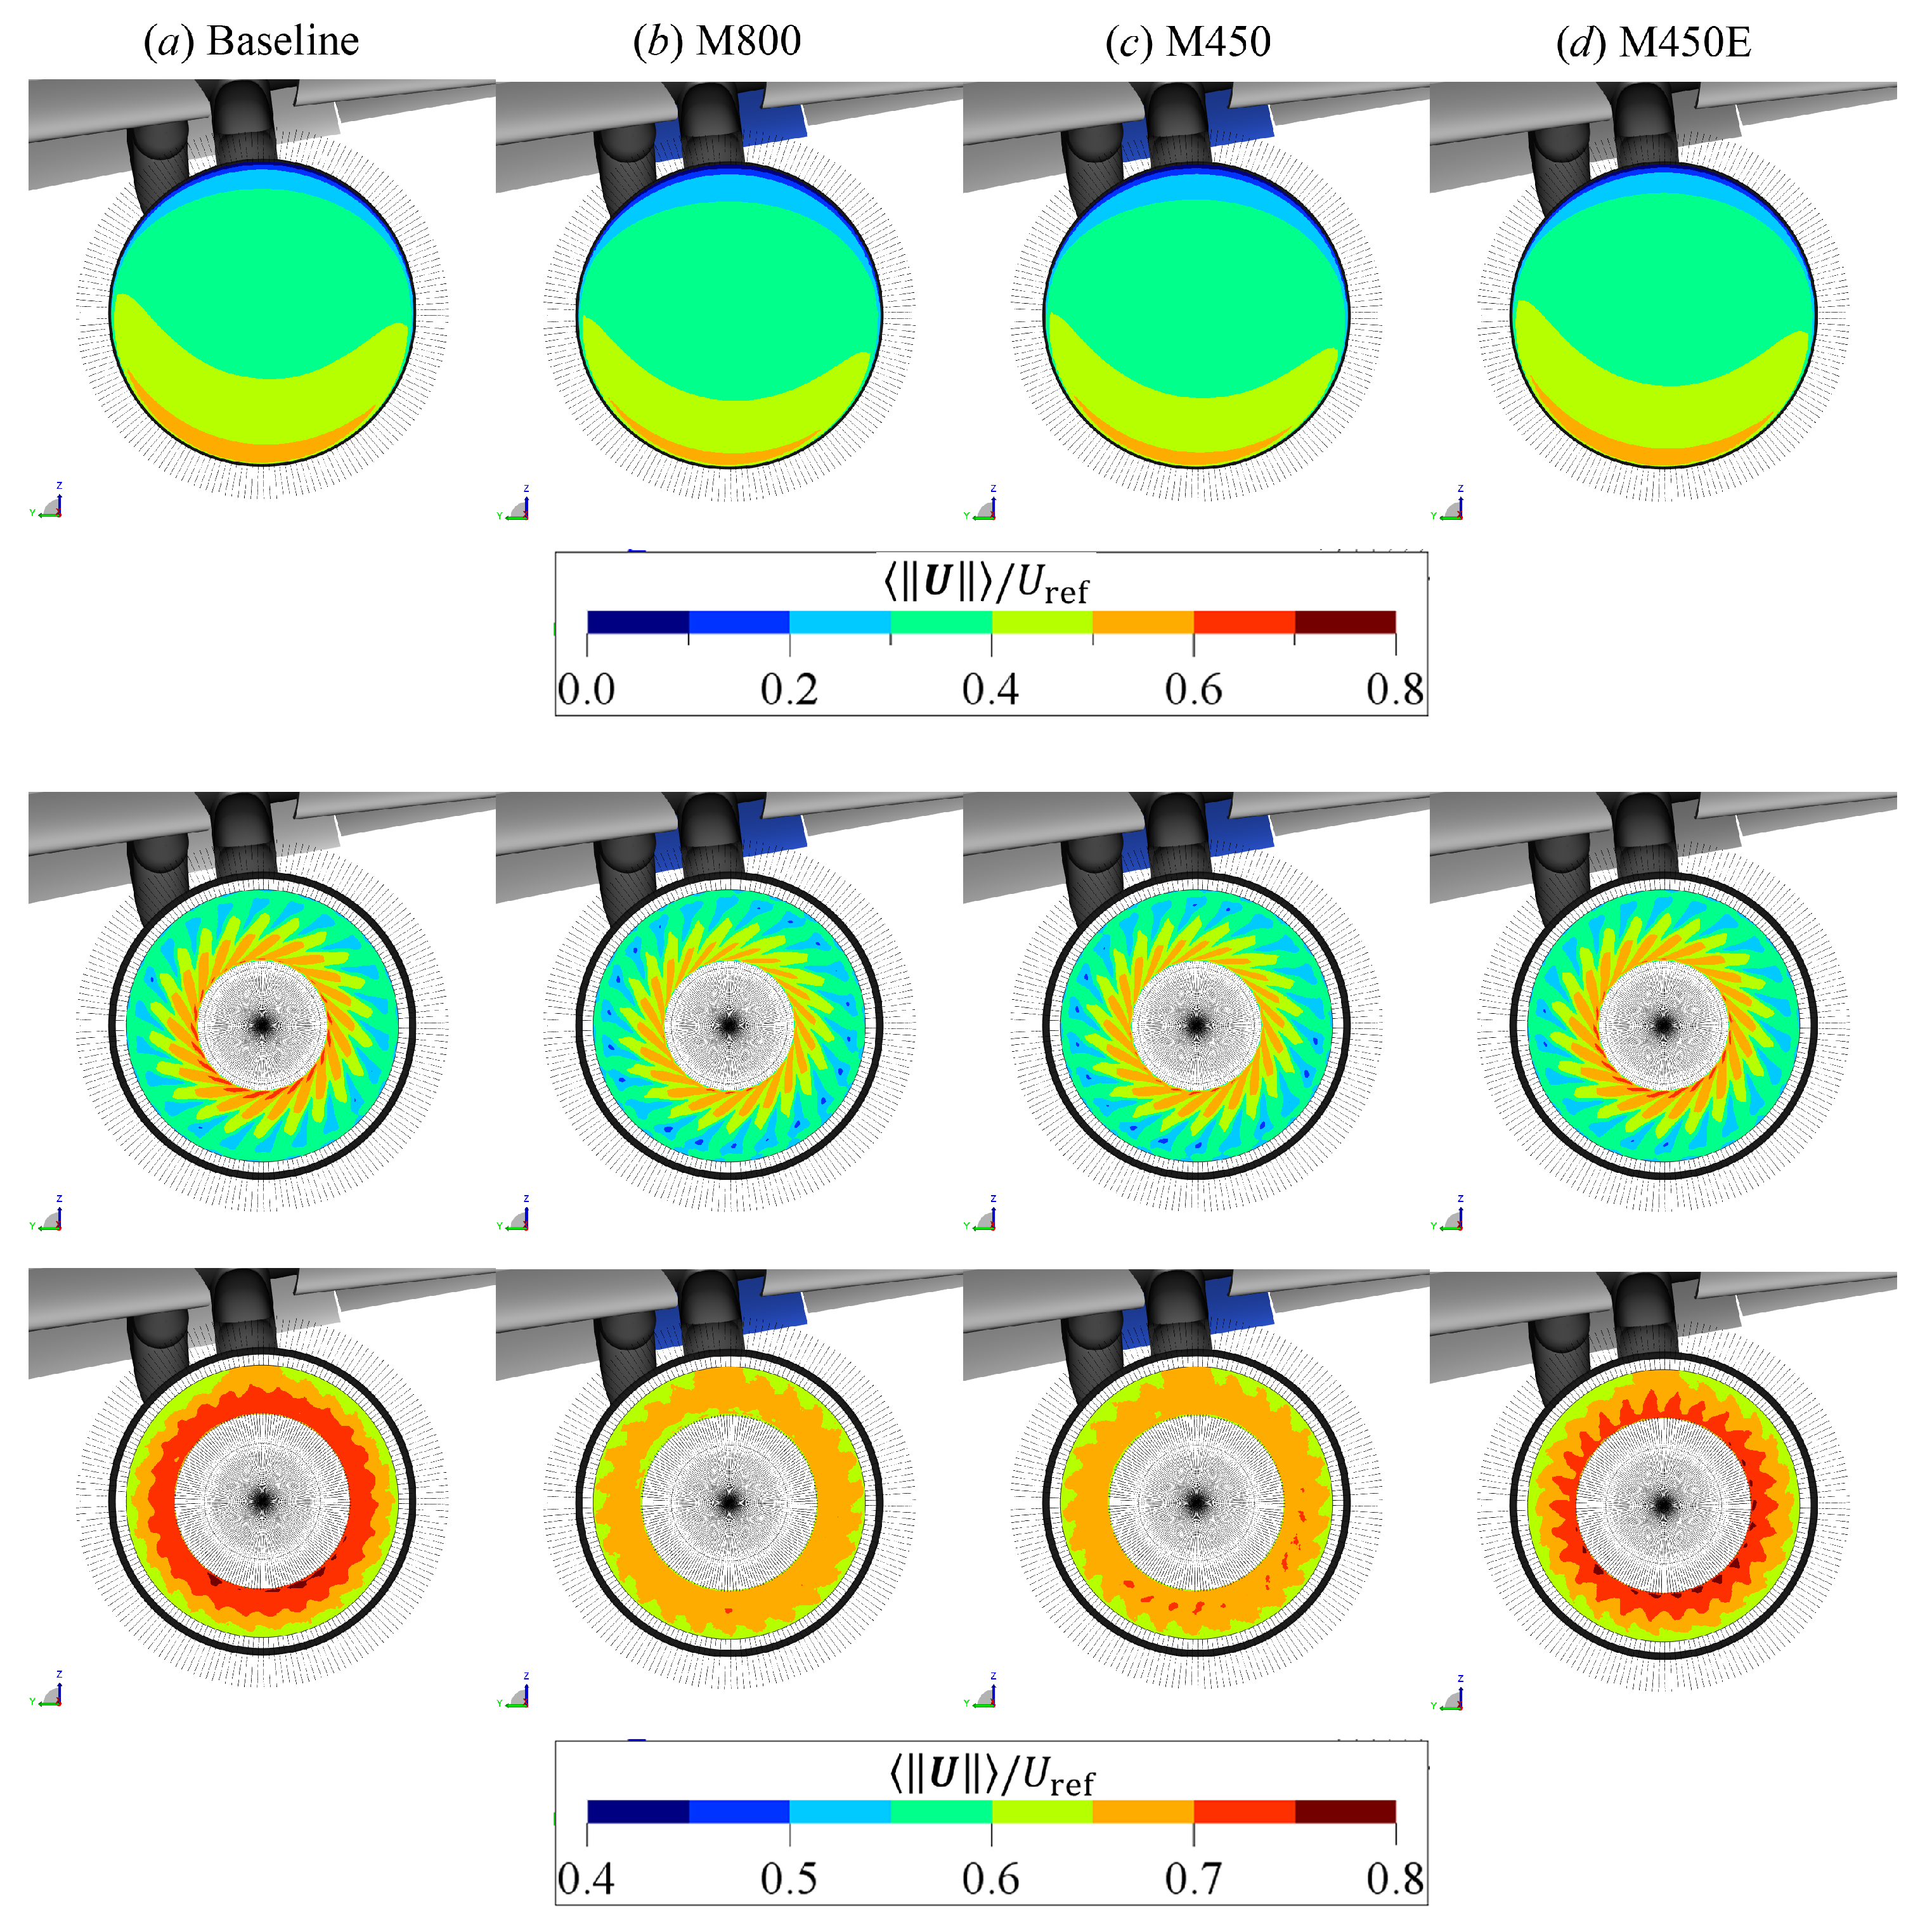
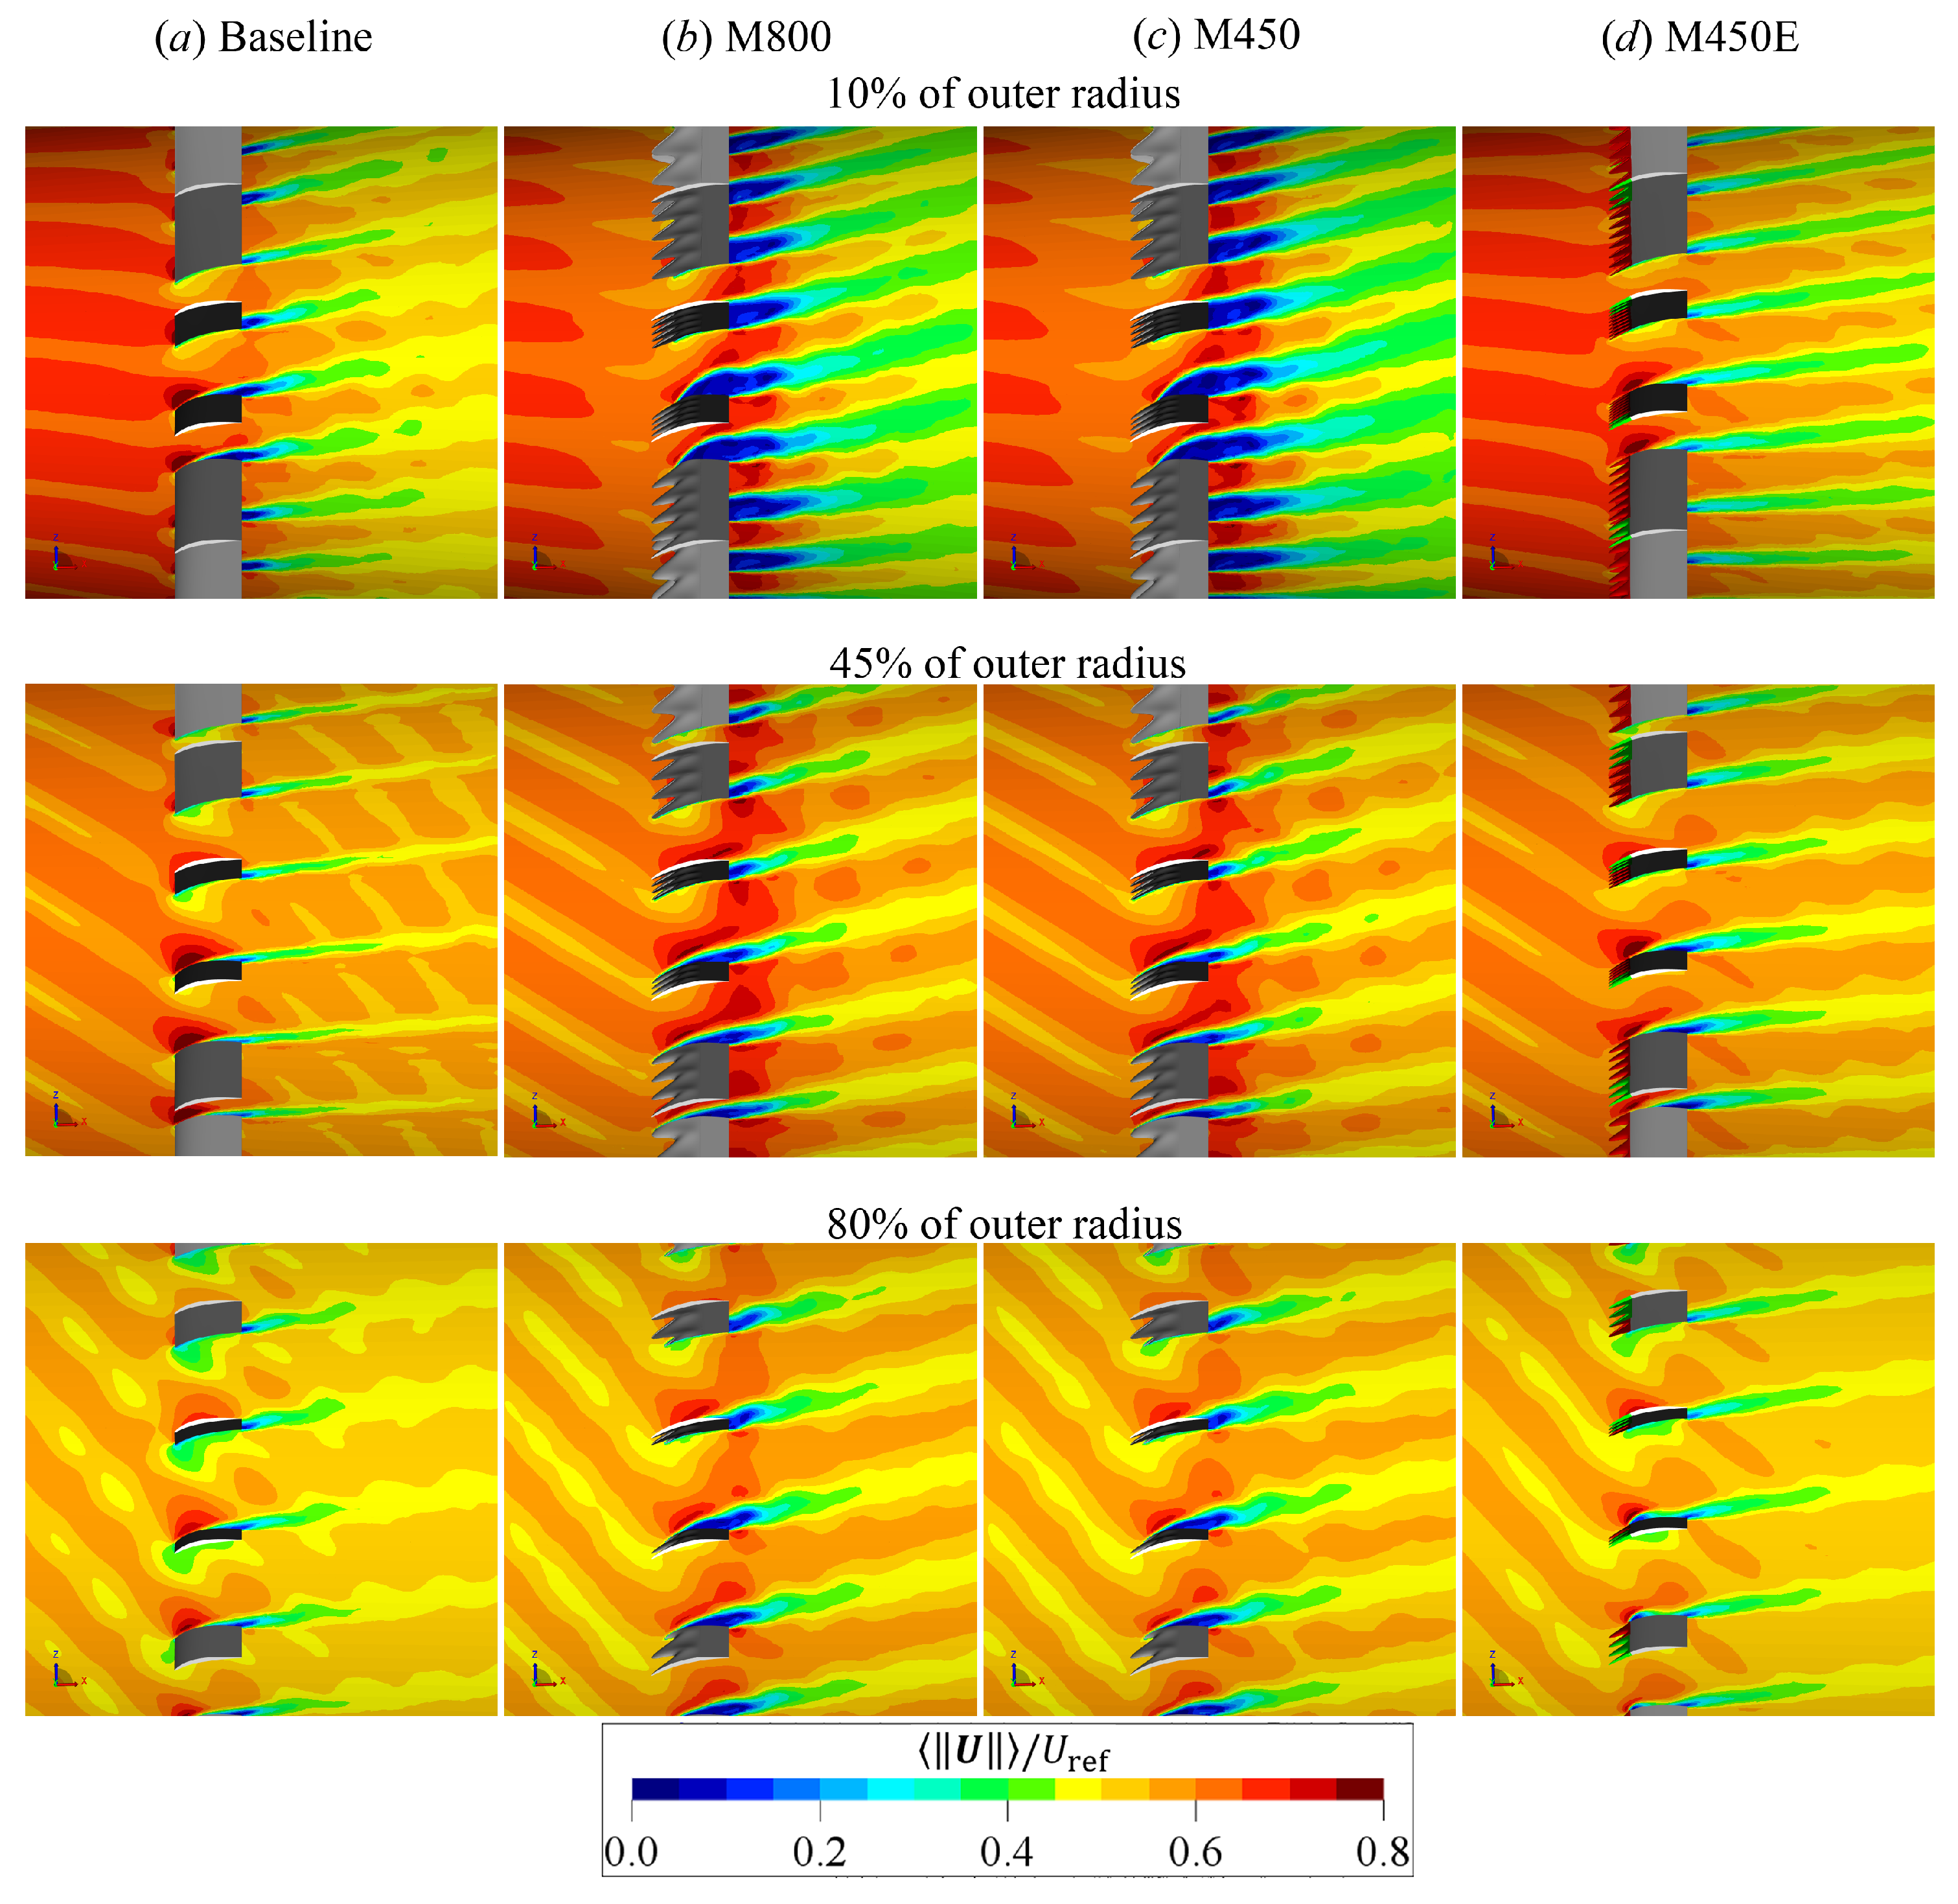
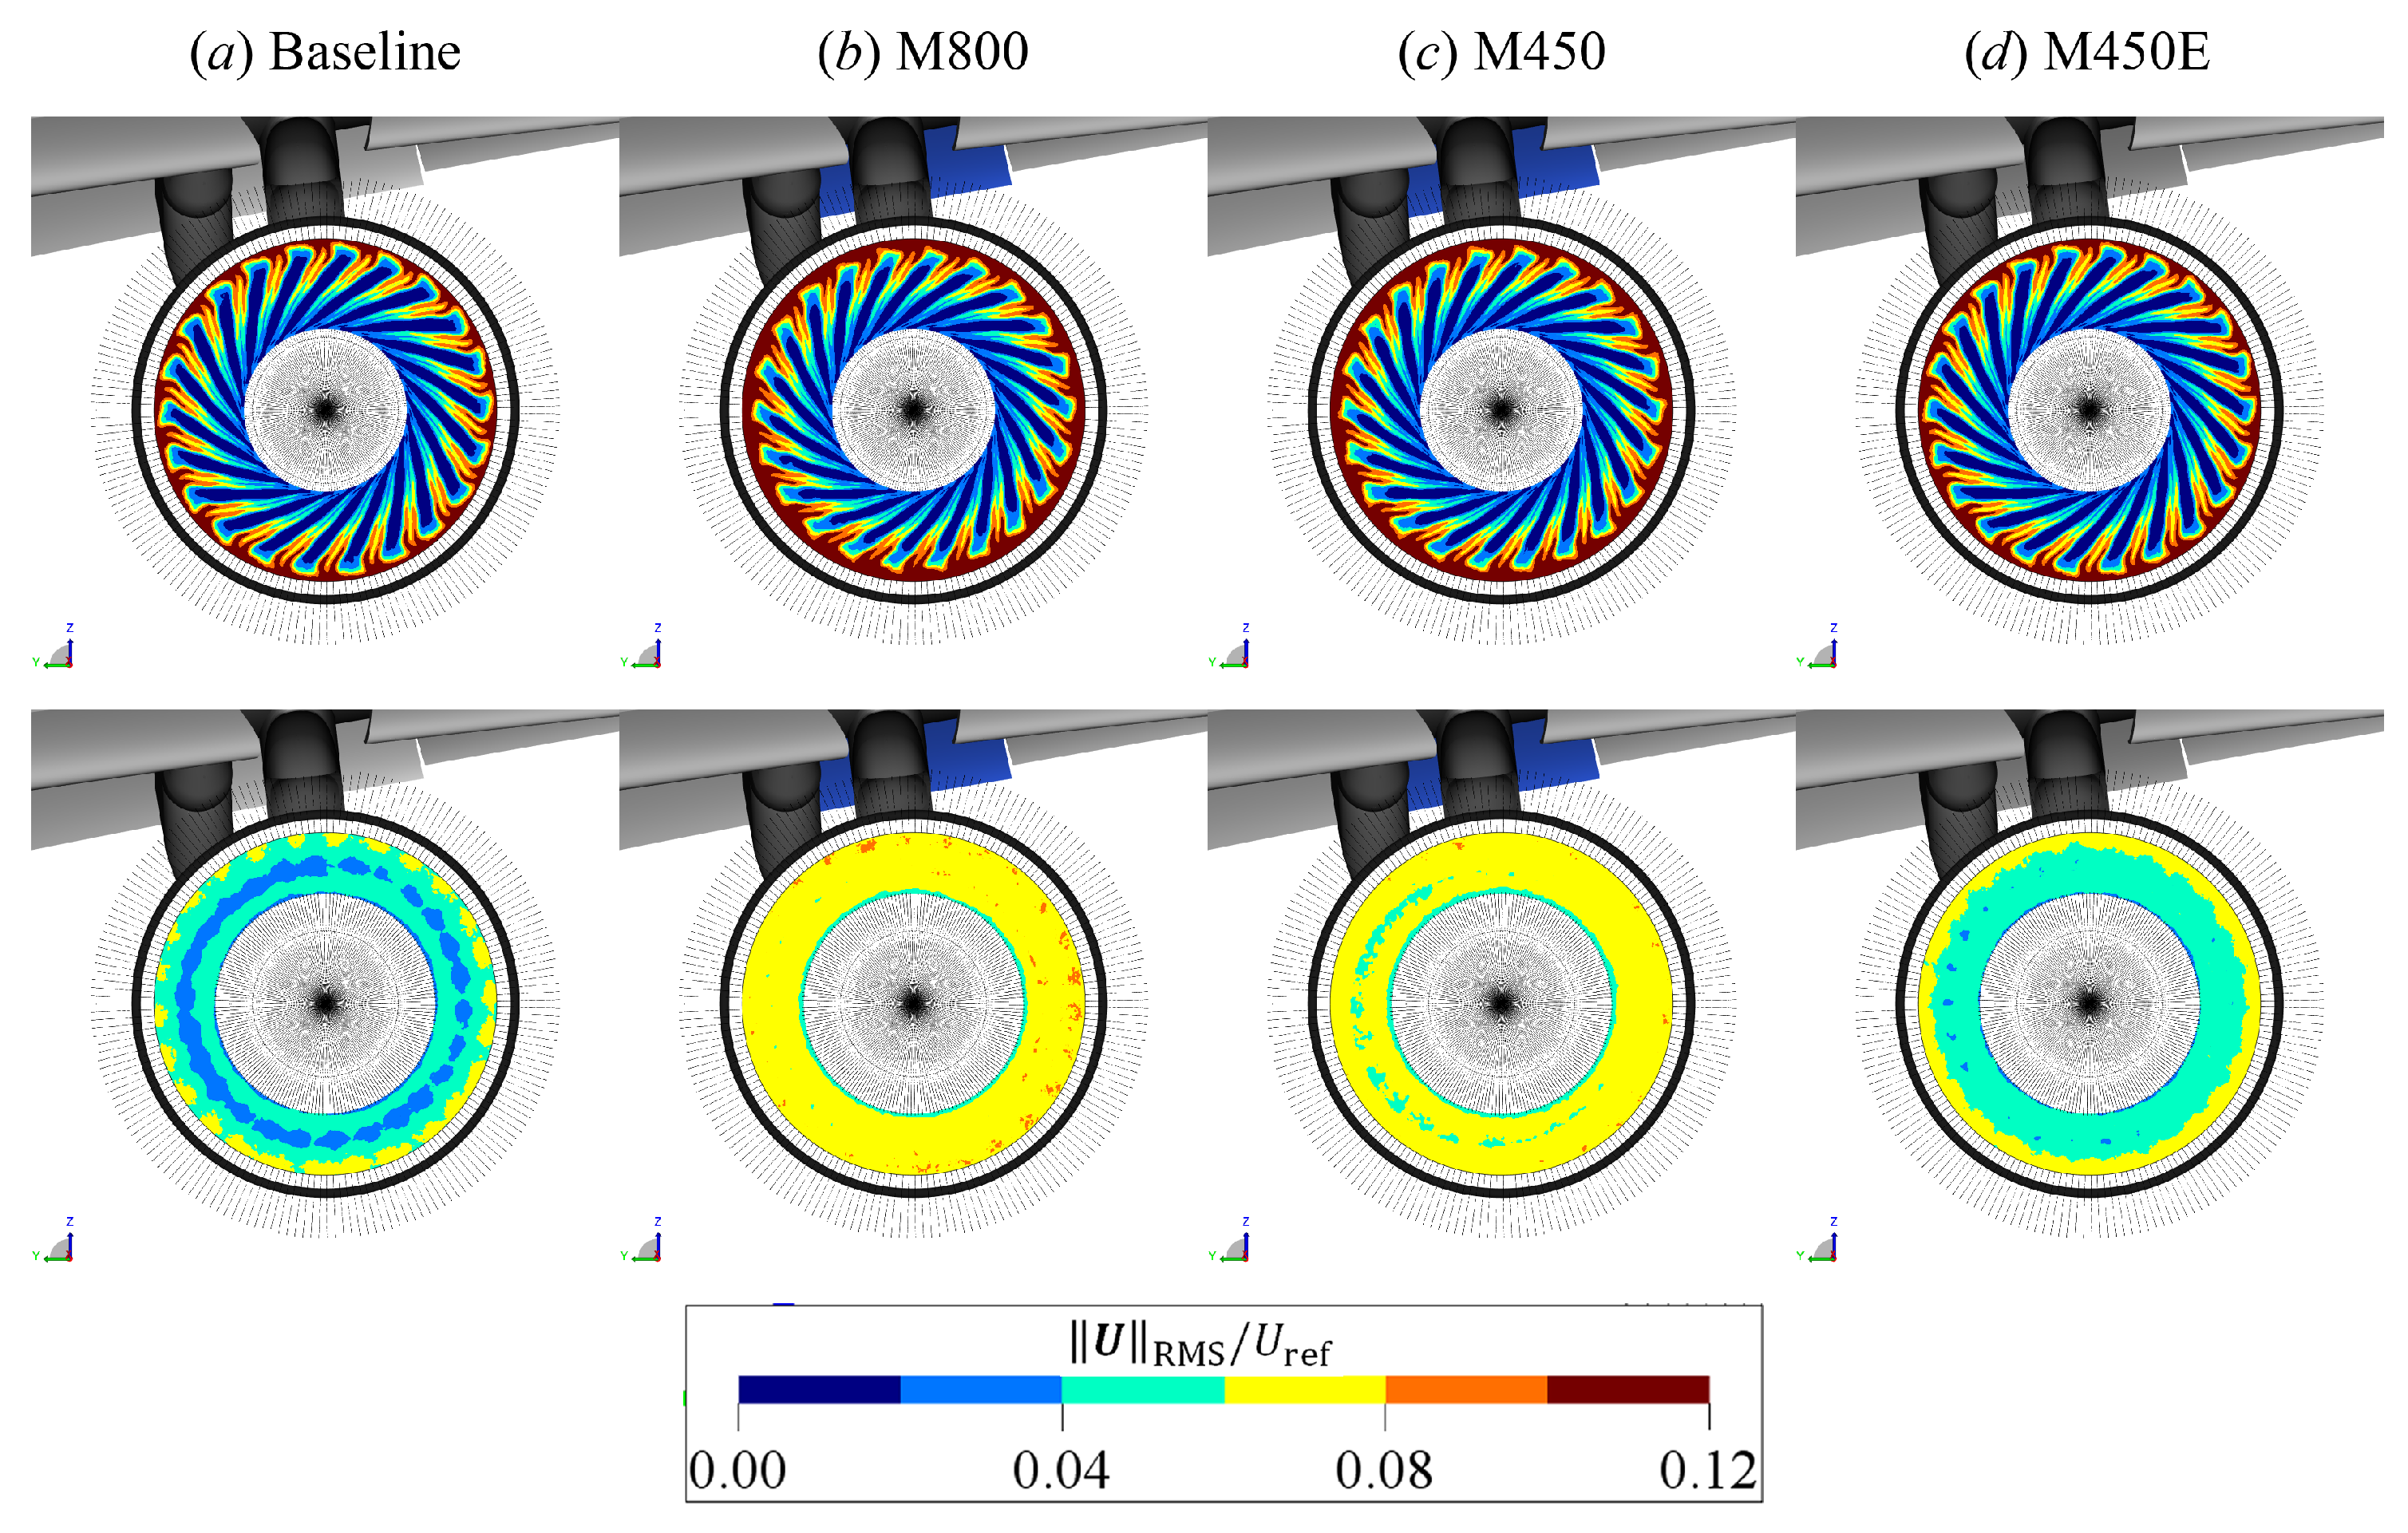
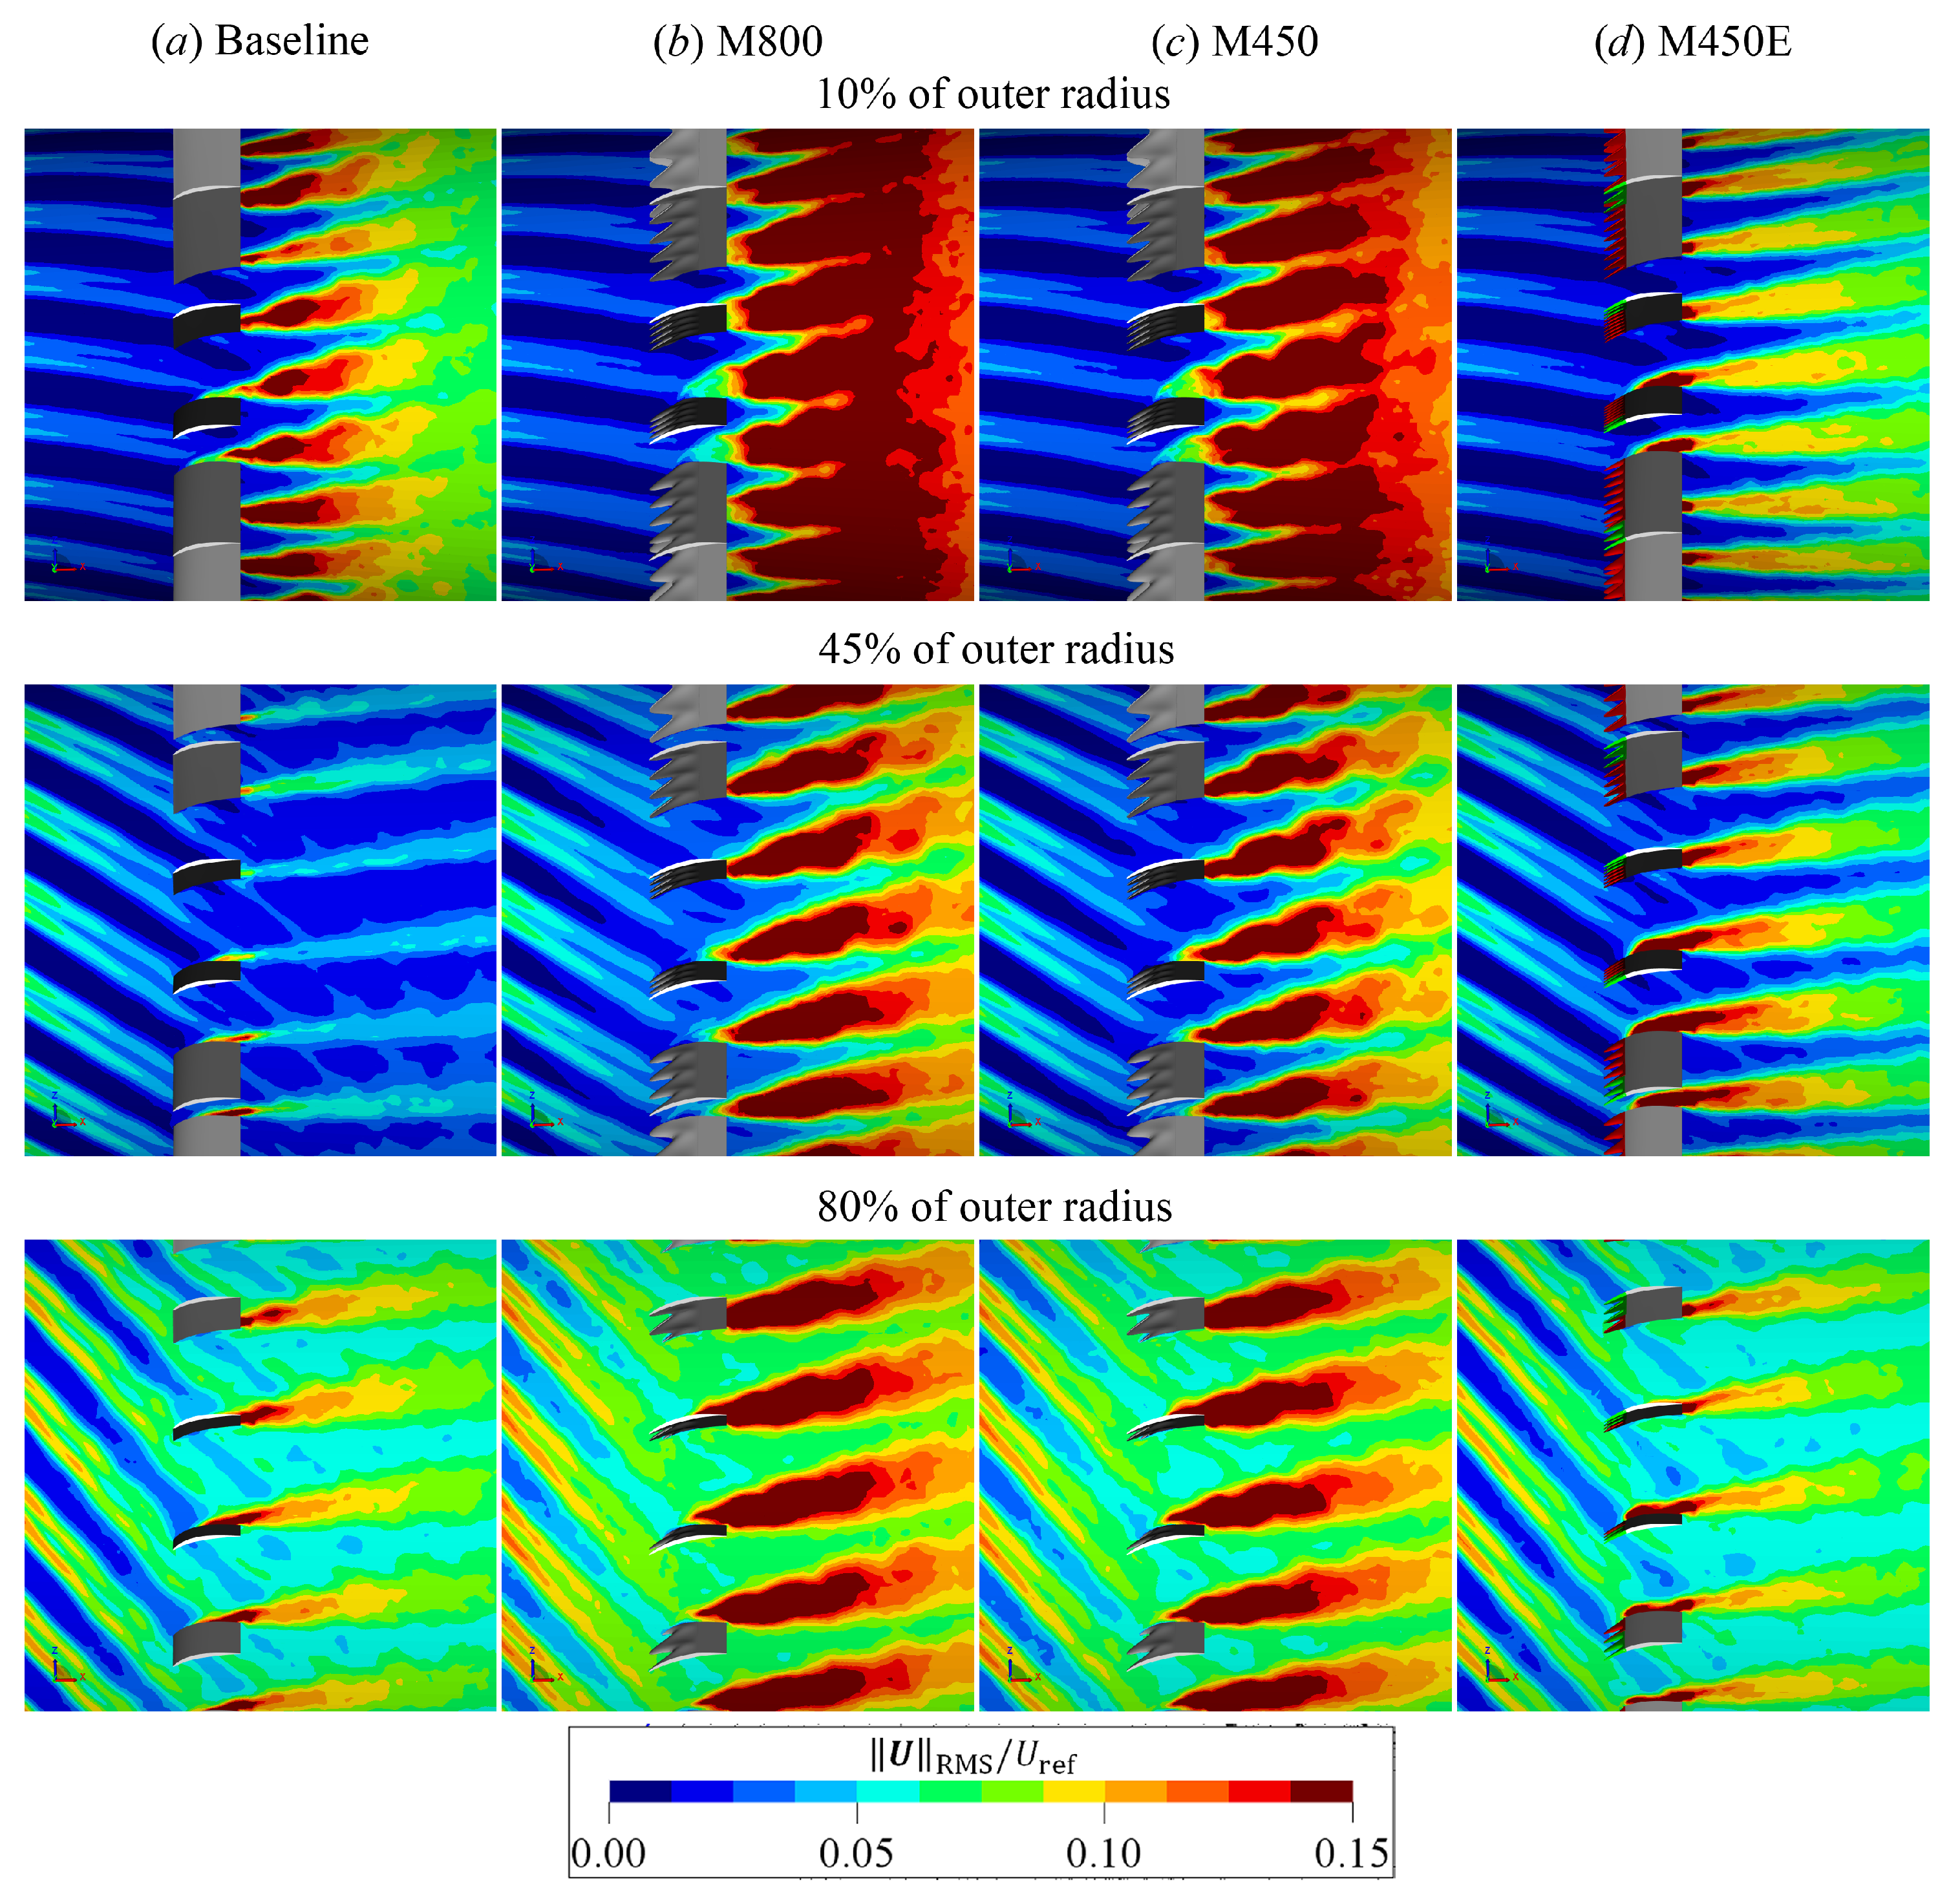
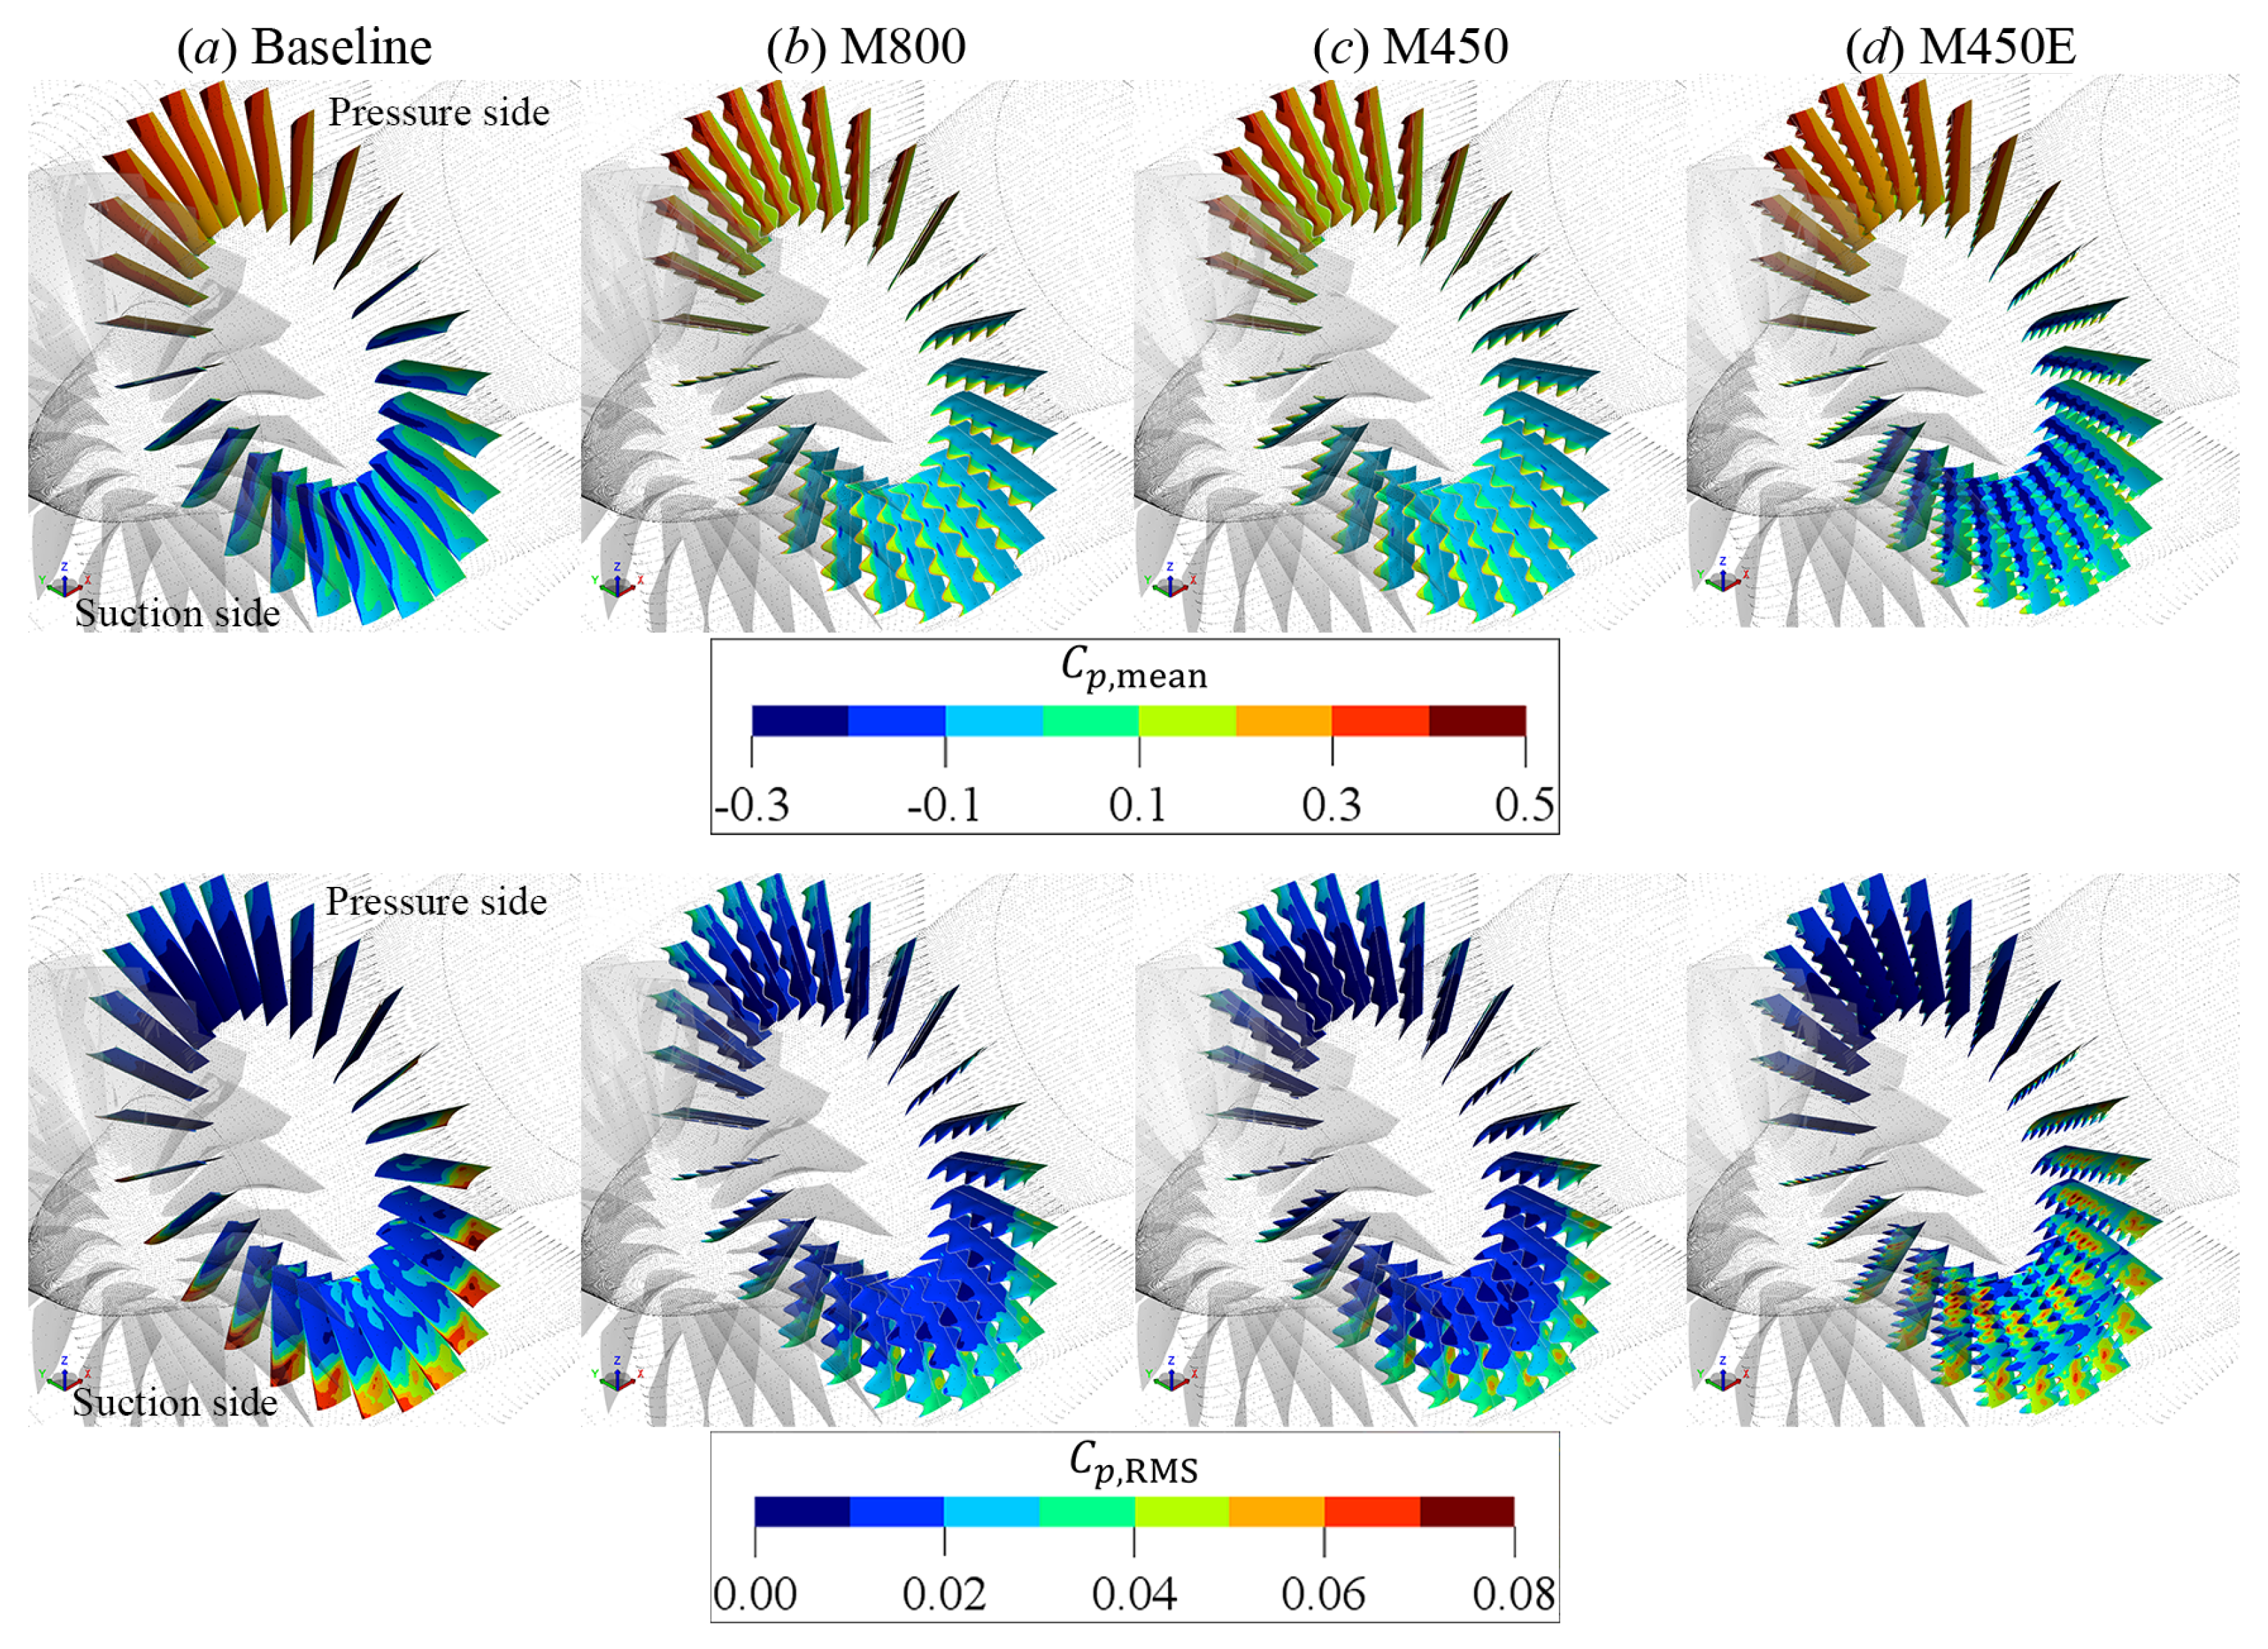
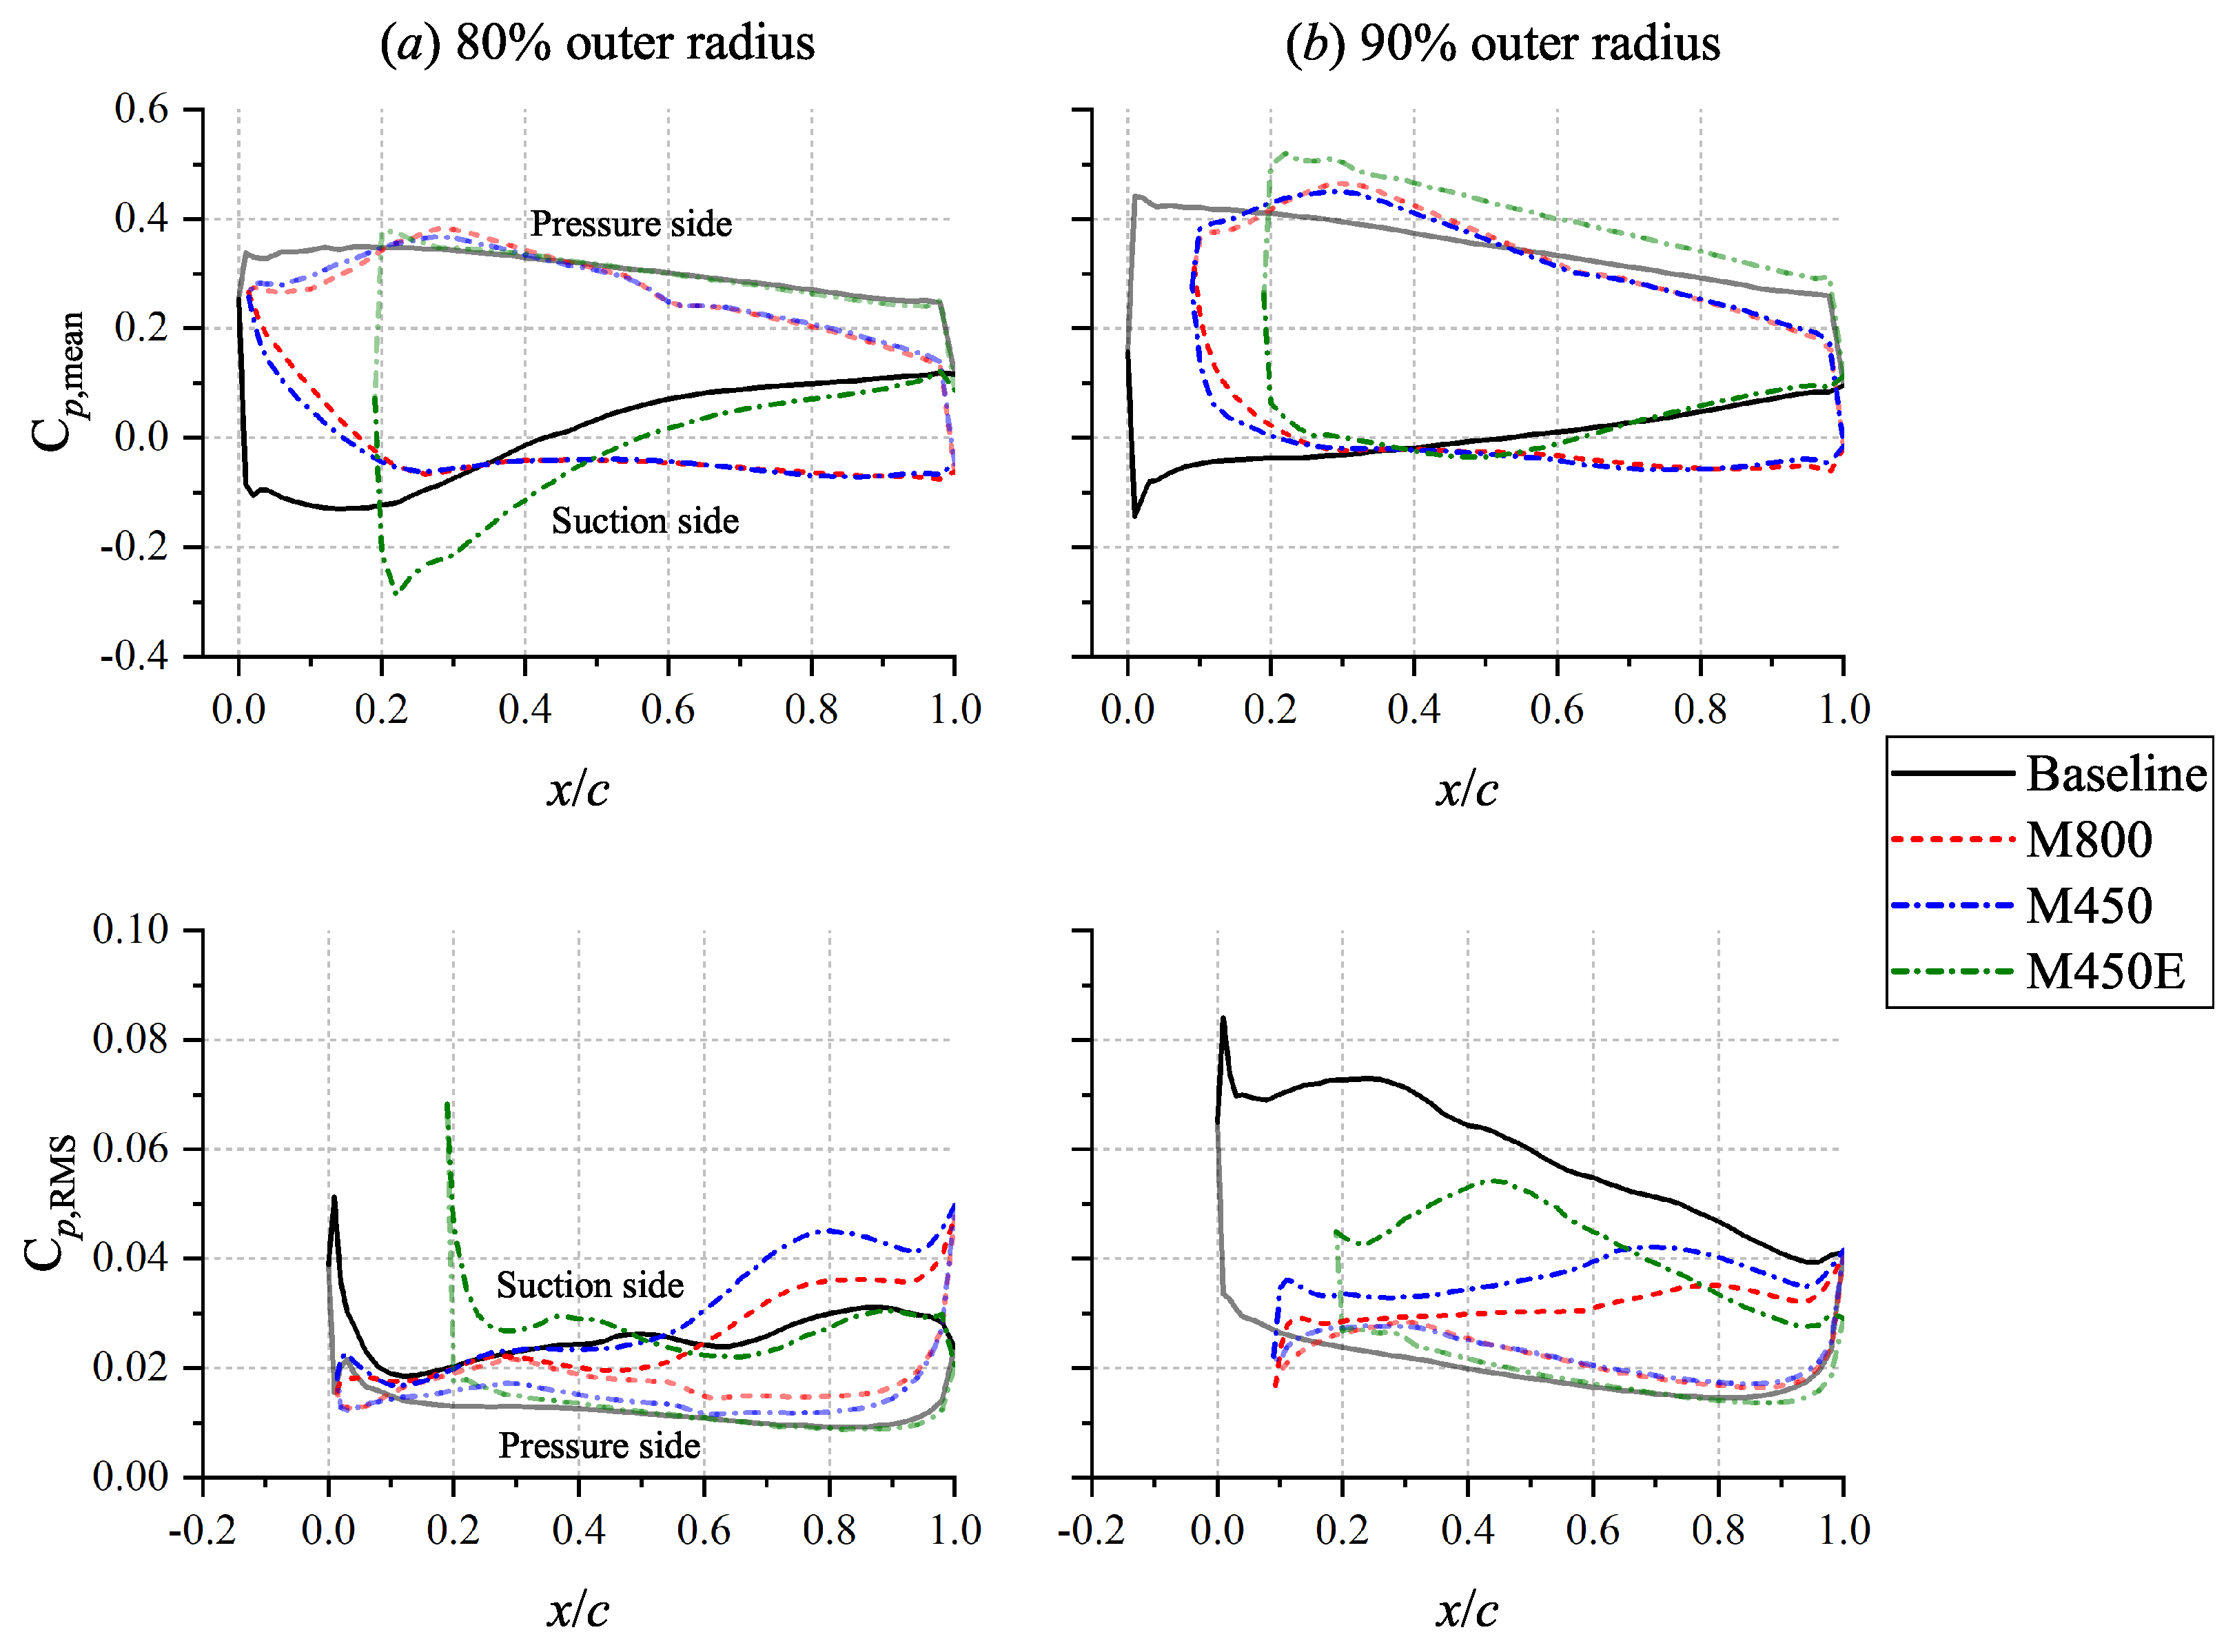
4.1. Aerodynamic Performance and Flow Statistics

This subsection discusses the impact of the poro-serrations on the aerodynamics of the fan stage, such as the mean flow conditions and turbulence behaviors. The overall aerodynamic performance of the fan stage is examined based on the amount of thrust generated. The thrust produced by the baseline configuration is 70.64 kN. It is worth mentioning that this thrust level corresponds to a fan rotational speed that is 61.7 % of the maximum value [2]. Although a simulation with the fan at maximum rotational speed has yet to be performed, the maximum thrust of the SDT fan stage was estimated to be 325 kN using a typical RPM-thrust curve for a turbofan engine [41]. This amount is comparable to the take-off thrust rating of a Trent 1000 turbofan [42]. In comparison, the M800 configuration achieves a lower thrust of 64.22 kN. Consequently, the poro-serrations in the M800 case led to a 9% thrust penalty. In comparison, the thrust penalty for the lower-porosity configuration (M450) is 7.5 %. Assuming that the thrust penalty does not vary for a small change in the fan RPM, and the aforementioned RPM–thrust relationship is also valid for the fan stages with modified stators, it is estimated that the rotational speed of the fan in the M800 configuration should be increased to 1462 RPM (i.e., an increase of 1.8 %) to retain the same amount of thrust as the baseline. Correspondingly, the fan rotational speed should be increased by 1.5 % to 1454 RPM for the M450 configuration. Nevertheless, it is conjectured that the overall fan-stage noise would only increase by less than 0.5 dB in both cases, assuming that the dipoles at the fan and OGV surfaces are the main noise sources [43]. As expected, the thrust penalty for the M450E configuration is the smallest compared to others, which are 1.4 %. This also evidences the opposite trend between the extent of the porous treatment and aerodynamic performance [12].
Flow statistics are examined at different locations in the fan stage as provided in Figure 8. Figure 8a shows three axial slices corresponding to the fan-stage inlet, the interstage between the fan blades and the OGVs, and the fan-stage outlet. The interstage slice is equally distanced from both the trailing edge (TE) of the fan blades and the leading edge (LE) of the OGVs. Aside from the axial slices, radial slices are also made at 10%, 45%, and 80% of the outer radius of the fan stage, as shown in Figure 8b.
Firstly, the phase-locked mean velocity magnitude contours on the axial slices are provided in Figure 9. The usage of phase-locked statistics allows for emphasizing the periodic flow phenomena at each fan blade passage. Note that the phase-locked average velocity magnitude values | | U | | are normalized against a reference velocity U ref = 237.57   m / s , which is the average fan tip speed. As there is an incidence angle between the airframe and the incoming flow, the velocity distribution at the fan-stage inlet is not uniform; the flow at the lower side of the fan stage has a higher velocity than that at the upper side. The average velocity magnitude for the M800 and M450 configurations is slightly lower than in the baseline case, indicating that the air intake at the inlet decreases due to the poro-serrated OGVs. The mean flow field at the interstage is characterized by a spiral pattern due to the swirl induced by the fan rotation. At this location, the mean velocity is, on average, lower for the M800 and M450 configurations, although the swirling patterns do not appear to be affected by the presence of the poro-serrated OGVs. A more noticeable discrepancy can be found at the outlet of the fan stage, where the velocity magnitude near the hub for the M800 case is around 10% lower than that of its baseline counterpart. On the other hand, the reduction of the mean velocity is less severe for the M450E configuration due to the limited spanwise extent of porous LE treatment. Given that the fan RPM is identical for all cases, it is reasonable to deduce that the poro-serrations have introduced a stronger flow resistance, which results in the thrust reduction discussed earlier.
In Figure 10, the contours of phase-locked average of velocity magnitude are plotted on the different radial slices. Due to the variation in the tangential velocity along the radius of the fan, the fan wake approaches the OGV with an oblique angle, resulting in a sweeping motion from the bottom of each plot to the top.
The contours at the top row of the figure (the slice at 10% of the outer radius) reveal that separated-flow regions at the suction sides of the poro-serrated OGVs (in M800 and M450 cases) result in significantly wider wake trails than those in the baseline configuration. As a consequence, the average mean velocity in the fan-stage cross section downstream of the poro-serrated OGVs becomes lower with respect to the baseline one, which is associated with the aforementioned thrust penalty for the configurations with modified stators. A comparable behavior was reported by the authors previously in a rod-airfoil configuration [15], where an isolated airfoil was used instead of a high-solidity configuration. The flow separation is induced by the cross-flow through the porous medium region, which itself is driven by the surface pressure imbalance between the suction and pressure sides of the poro-serrations. Consequently, the poro-serrated OGVs are also less effective at recovering the swirl in the fan wake. This is particularly noticeable in the middle row of the figure (i.e., the slice at 45% of the outer radius), where the inclination of the wake trail behind the poro-serrated OGV relative to the axial direction is steeper than that of the unmodified OGV. On the other hand, the swirl recovery process in the M450E configuration appears to be comparable to the baseline one. Nonetheless, the solid serrations also cause wider wake trails compared to those of the baseline. This is associated with the enhanced adverse pressure gradient, particularly downstream of the serration root, as reported previously in literature [15,16,19].
The effects of the poro-serrations on the unsteady velocity fluctuations in the flow field are examined using the contours of the RMS (i.e., standard deviation) of velocity magnitude | | U RMS | | in Figure 11 and Figure 12. In the top row of Figure 11, the spiral patterns corresponding to the fan wake can be clearly identified. It is also evident that the level of velocity fluctuations tends to be higher towards the outer radius of the fan stage [4], and thus it is expected that the TIN sources near the outer span of the OGV blades are stronger than the inner ones. This is the reason behind the design of the M450E configuration, where the serrations are made porous only at the outer span of the stator blade.
The contours at the interstage of all four configurations are relatively similar, implying that the turbulence level in the fan wake is relatively unaffected by the LE modifications at the OGV blades. In the bottom row of Figure 11, the contours at the fan stage outlet clearly show noticeably higher velocity fluctuations for both M800 and M450 cases, which can be associated with the wake trails downstream of the separated-flow region. The same phenomena are depicted by the radial slices in Figure 12. The contours at 10% of the outer radius (top row) clearly depict the separated-flow region at the suction sides of the OGVs in the M800 and M450 cases. Interestingly, the flow fluctuations downstream of the OGV in the M450E case appear to be weaker than in the baseline. This behavior might be associated with the serrations’ capability in re-energizing the boundary layer at the suction side of the OGV due to the streamwise vortices generated from the serration tip [44,45]. At other radial positions, the influence of the separated-flow regions in the M800 and M450 configurations is still evident. Nevertheless, the enhancement of the velocity fluctuations in the separated-flow regions is slightly milder for the M450 case due to the lower porosity value.
To better understand the flow characteristics in the separated-flow region above the suction side of the poro-serrated OGVs, the spectra of of the axial ( S u u ) and tangential ( S w w ) velocity fluctuations are examined in Figure 13. For this purpose, the velocity fluctuations are sampled at a distance of 50 mm above the OGV TE. The frequency axis is expressed in multiples of the blade-passage frequency BPF 1 520.5   Hz . The spectra for the M450E configuration is only shown under plot (c) for the sake of clarity of the other plots.
At 10% of the outer radius, it is apparent that the velocity fluctuations in the separated-flow region are dominated by the low-frequency components. This behavior is particularly noticeable in the S w w spectra, which can be associated with the unsteady upwash due to the flow ejection at the suction side of the poro-serrations. The M450 configuration also exhibits higher axial and tangential velocity fluctuations compared to those in the M800 case at this radial position, reflecting the contours in Figure 12. Unlike at the previous location, the S u u and S w w levels of both M800 and M450 configurations at 45% of the outer radius are, on average, stronger than those of the baseline in almost the entire frequency range of interest. However, the spectra of the M800 case show an additional tonal peak at f / BPF 1 = 0.71 , which is especially prominent in the S w w plot. Nevertheless, this tonal peak is completely absent in the M450 case, implying the influence of porosity. Interestingly, the frequency of the tonal peak corresponds to a Strouhal number of approximately 0.1 when it is normalized against the mean velocity magnitude upstream of the poro-serrated OGV and the maximum blade thickness. This behavior might be attributed to a quasi-periodic vortex shedding at a solid–porous junction (see Figure 2), as previously reported by Carpio, et al. [46]. At 80% of the outer radius (plot c), all three modified configurations exhibit almost identical spectra, although their velocity fluctuation intensity is generally stronger compared to that of the baseline.
The aerodynamic loading characteristics on the OGVs are examined using the contours in Figure 14 and surface pressure distribution plots in Figure 15. The time-averaged surface pressure is expressed as C p , mean = ( p p ) / ( 0.5 ρ U ref 2 ) , where p = 101,325   Pa . Meanwhile the RMS of surface pressure fluctuations is expressed as C p , RMS = p RMS / ( 0.5 ρ U ref 2 ) .
The mean surface pressure contour for the baseline configuration (Figure 14a) evidences the clearly-defined suction regions near the LE (i.e., area with low C p , mean ). In both M800 and M450 configurations, prominent suction peaks are no longer present on the poro-serrations. The tip of the solid serrations in the M450E configuration also exhibits the same behavior. However, a noticeable suction region can still be found at the serration root, which compensates for the loss of aerodynamic loading at the serration tip; this can be clearly seen in plot (a) of Figure 15. In the same plot, the separated-flow regions at the suction side of the OGVs for both M800 and M450 configurations are evidenced by the relatively flat C p , mean distributions downstream of the poro-serrations ( x / c > 0.2 ). On the pressure side of the M800 and M450 OGVs, the C p , mean values decrease with a steeper slope compared to that of the baseline, indicating flow acceleration caused by the narrowing of the flow passage in the inter-OGV channel due to the separated-flow region (see the velocity contours in Figure 10). The pressure distribution on the porous segment of the serrations in the M450E configuration is shown in Figure 15b. This location also corresponds to the serrations root as in Figure 15a. Nevertheless, the permeability of this region causes the suction peak at the blade LE to vanish, similar to that in both M800 and M450 configurations.
The lower halves of Figure 14 and Figure 15 illustrate the distribution of pressure fluctuations on the OGVs. The C p , RMS contour for the baseline case shows that the largest pressure fluctuations can be found near the outer span of the blades. When the baseline OGV is replaced with the poro-serrated one (M800 and M450 configurations), the surface pressure fluctuations near the LE tip become less intense. Towards the TE, however, the C p , RMS values on the poro-serrated OGVs tend to be higher than those on the baseline blades, especially at the suction side. Such behavior seems to be associated with the flow separation, which eventually induces a stall-noise mechanism [47] that is responsible for generating excess broadband noise in the low-frequency range. In Figure 15a, the root segment of the solid serrations in the M450E case exhibits a higher C p , RMS peak than that of the baseline. This is caused by the reinforcement of upwash/downwash at the serration root due to the production of a secondary streamwise vortex system from the serration tip [15,17]. This mechanism is reflected in the C p , RMS contour in Figure 14d, where regions with relatively high pressure fluctuations can be found immediately downstream of the serration root. As shown in Figure 15b, the usage of poro-serrations at the outer span of the OGV in the M450E configurations appears to be beneficial as the overall C p , RMS levels along the chord are lower compared to the those in the baseline case.

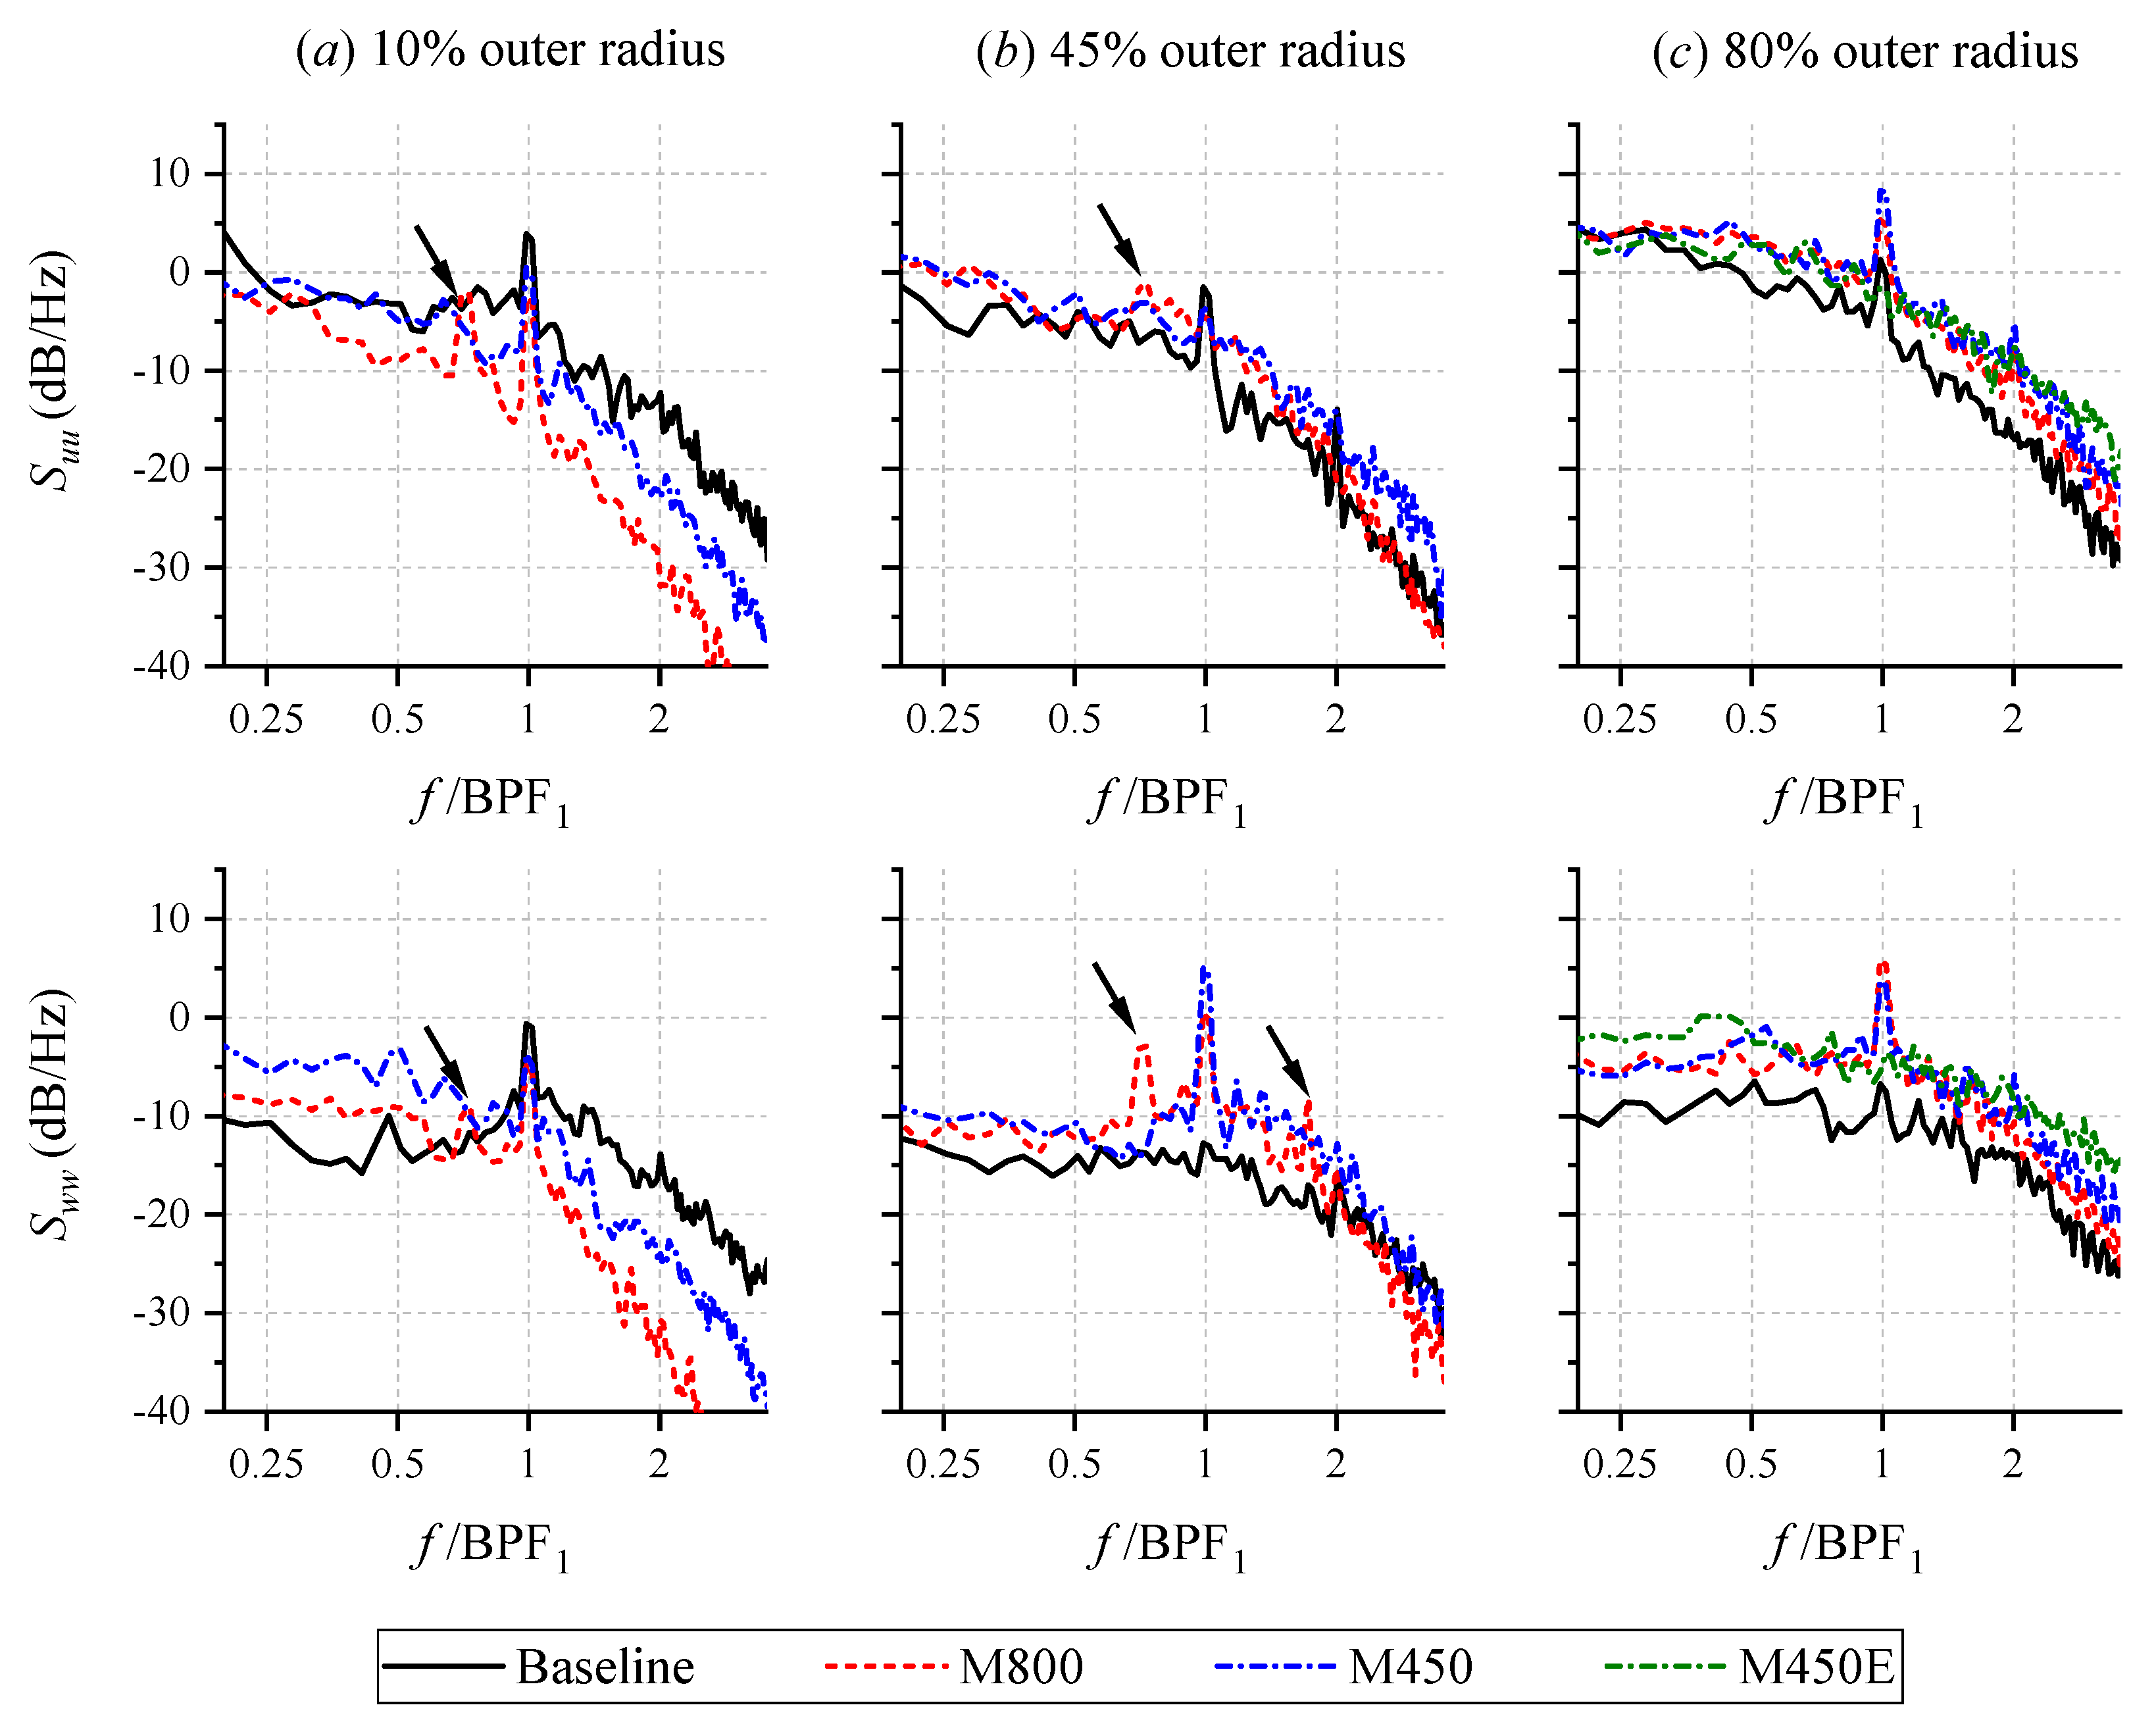
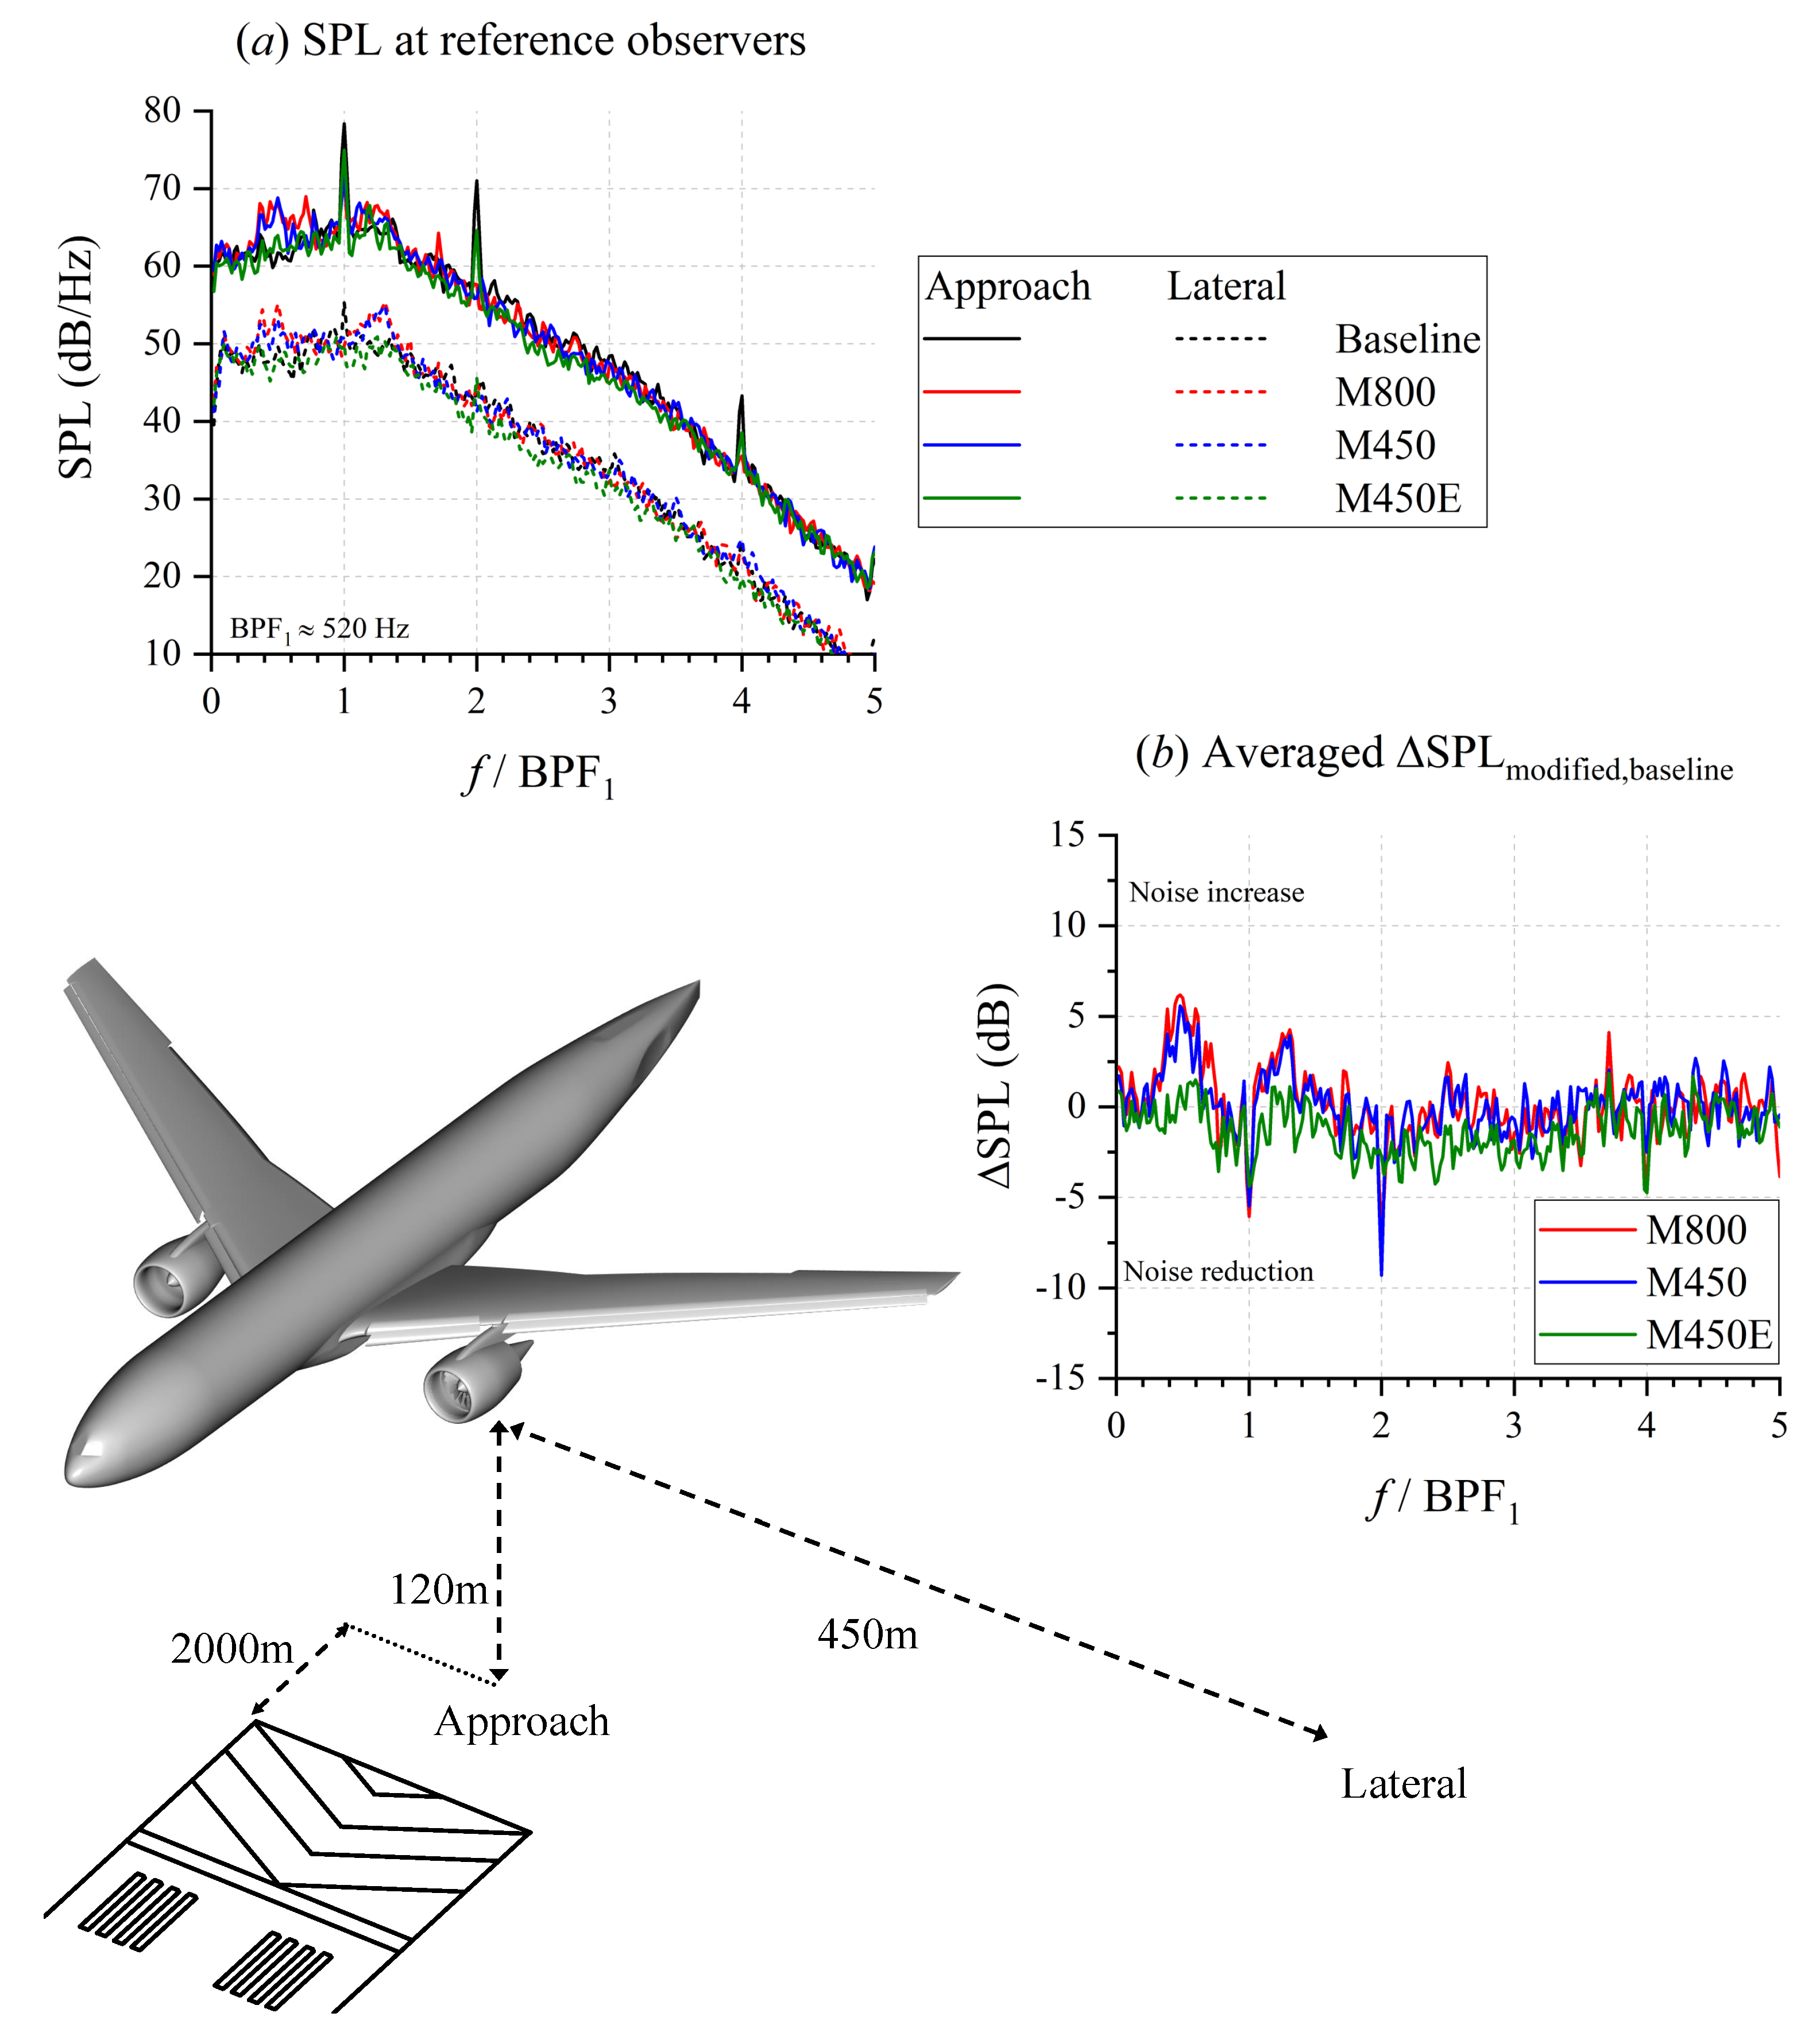
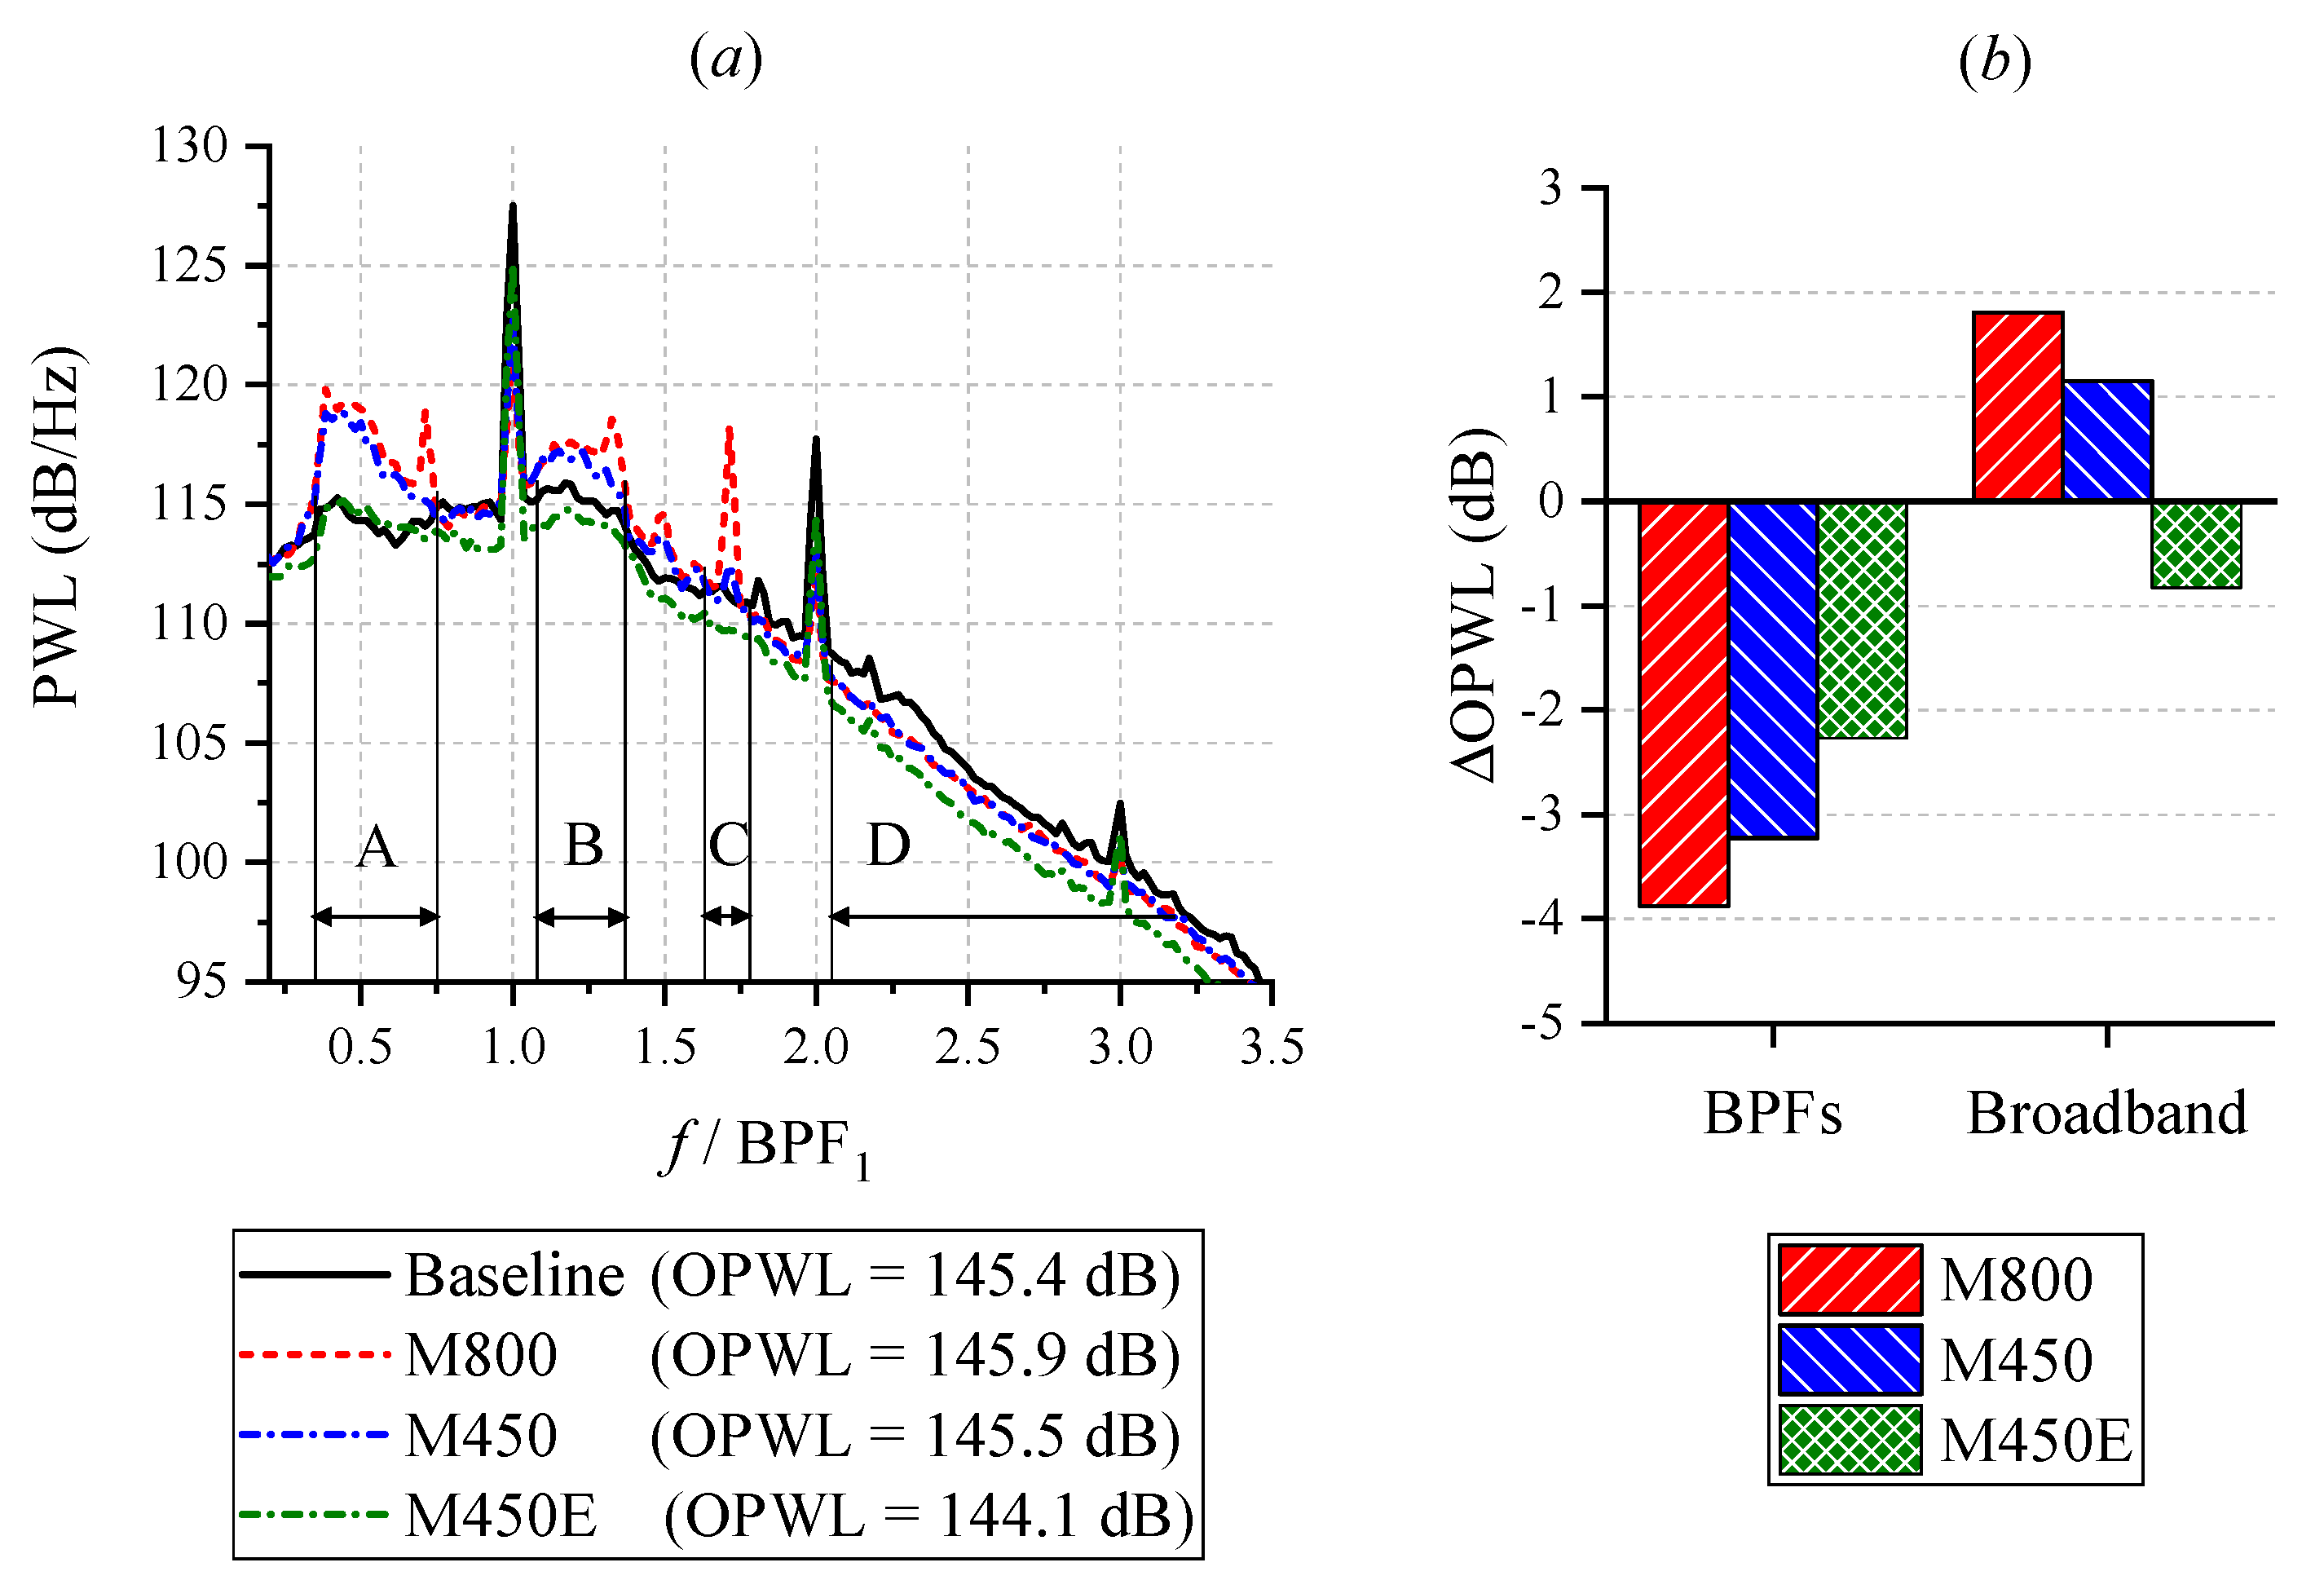
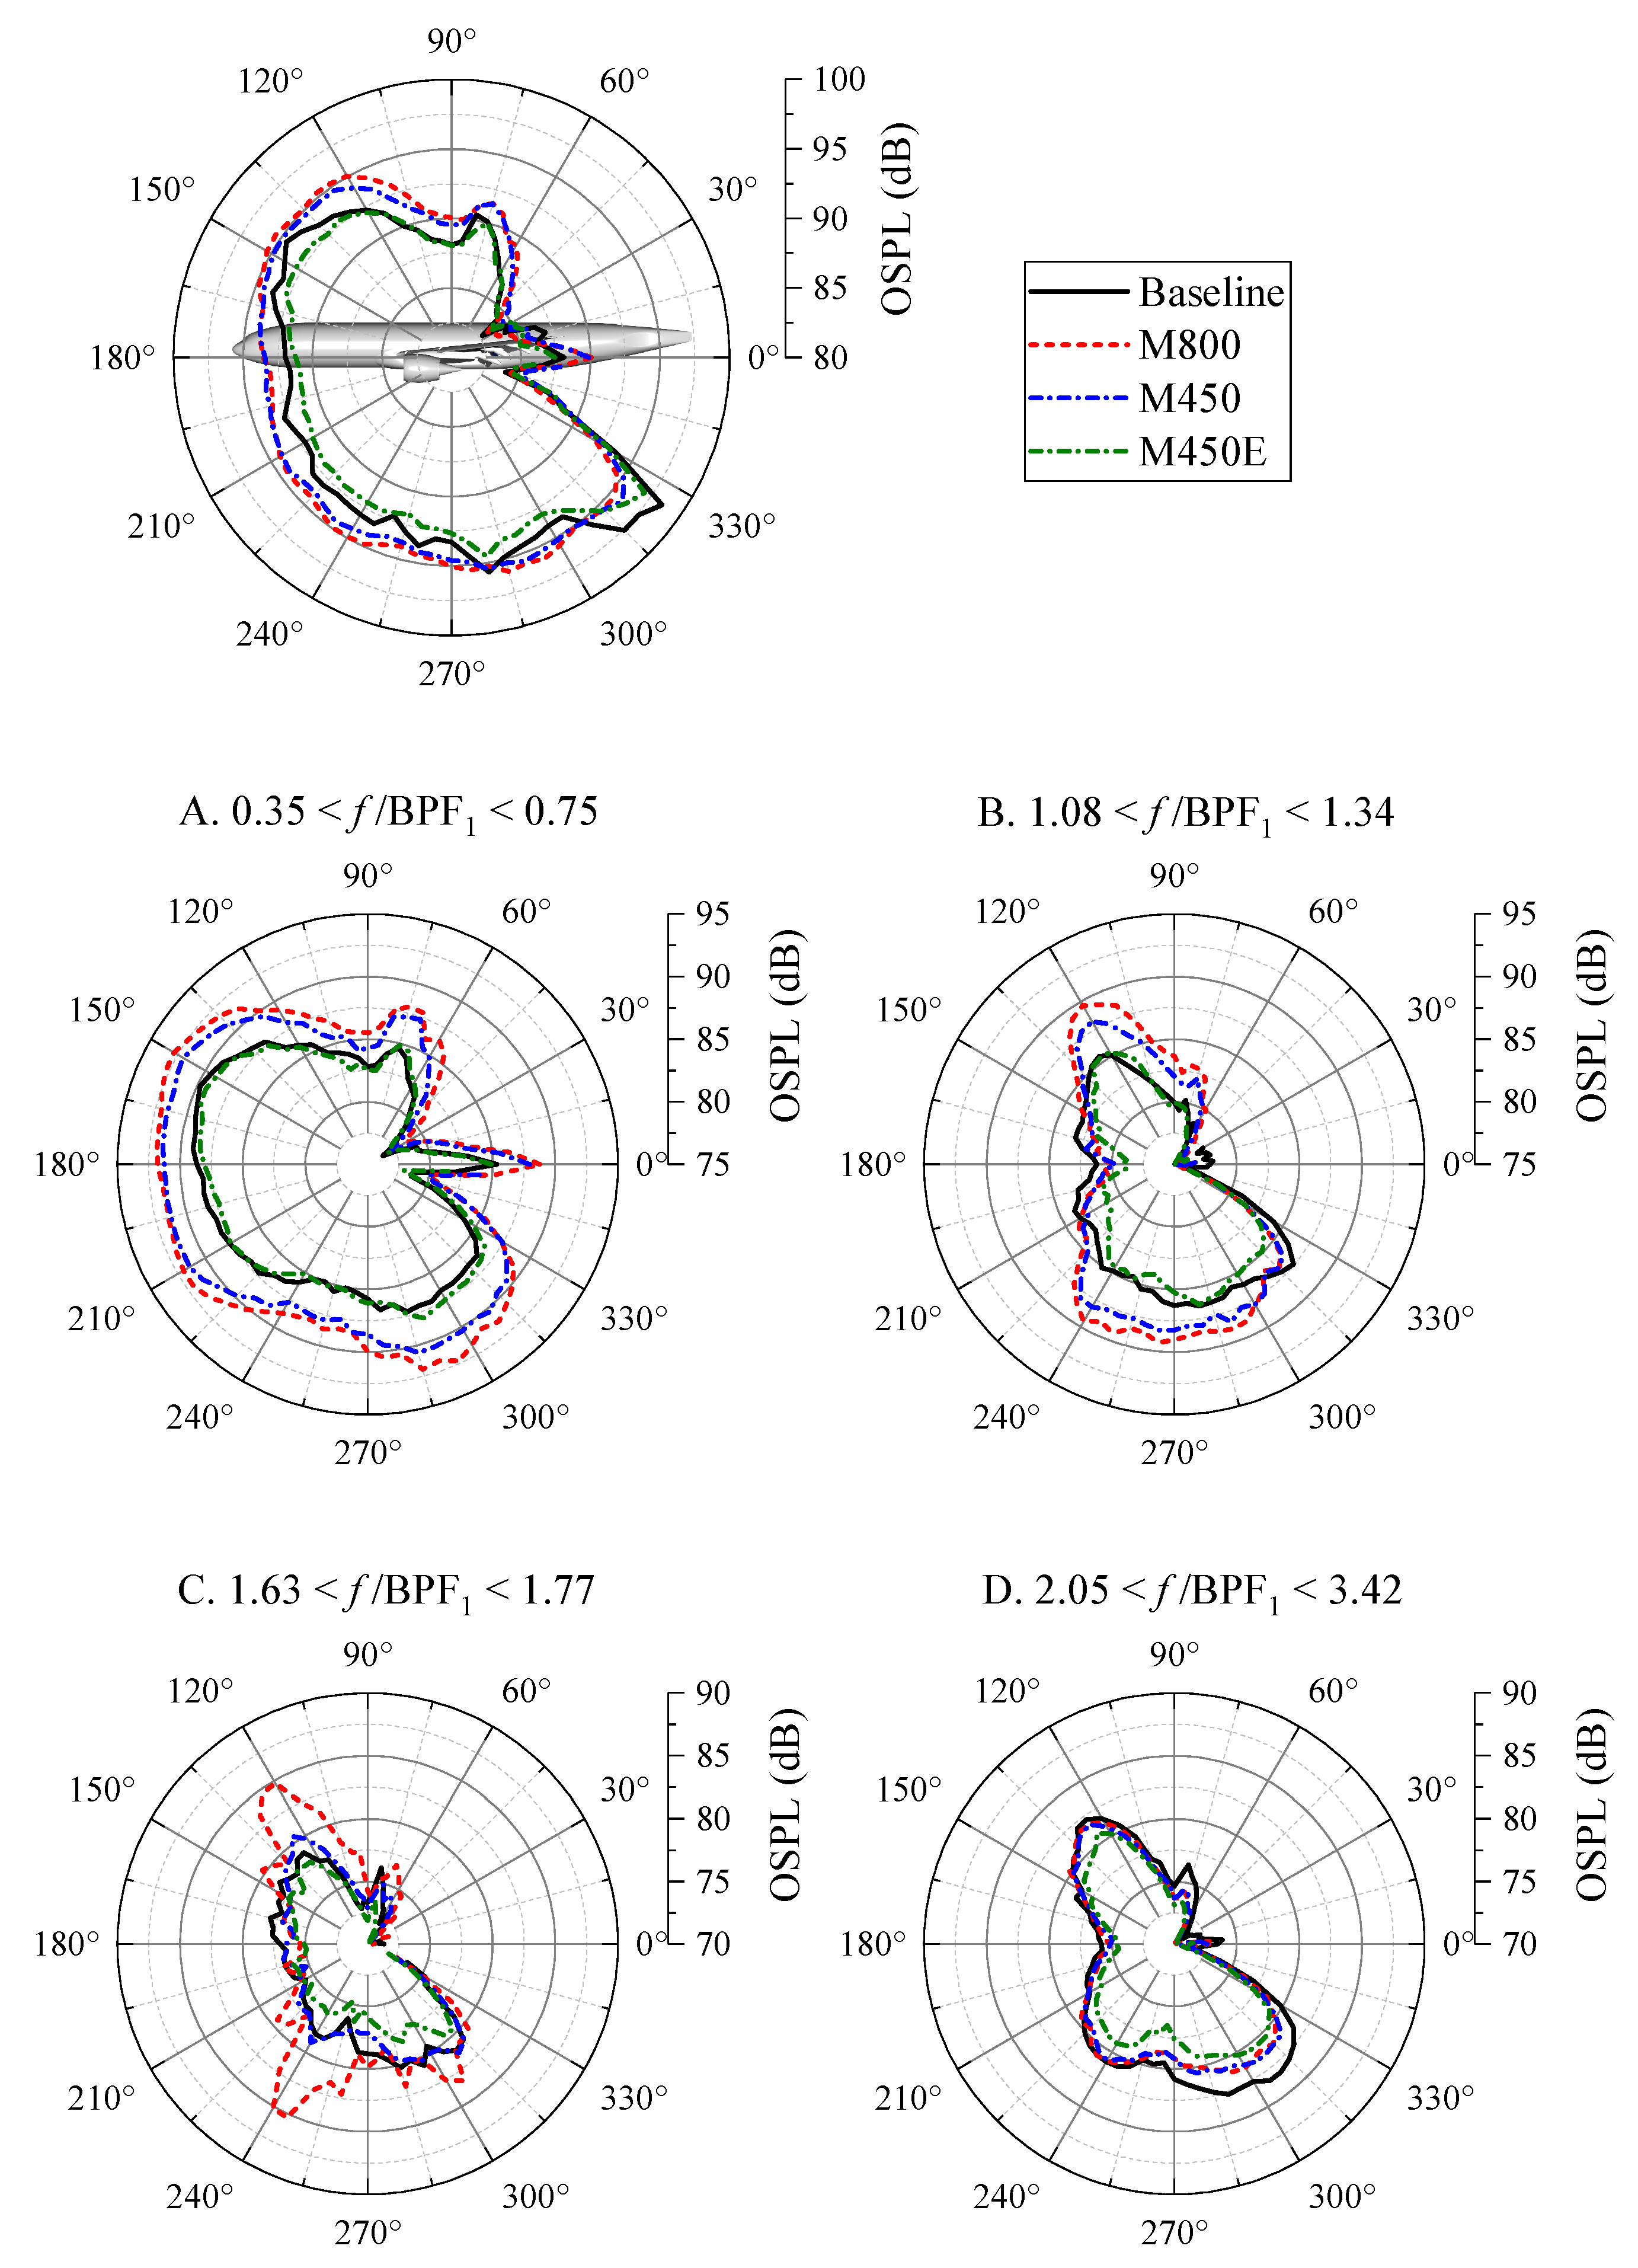
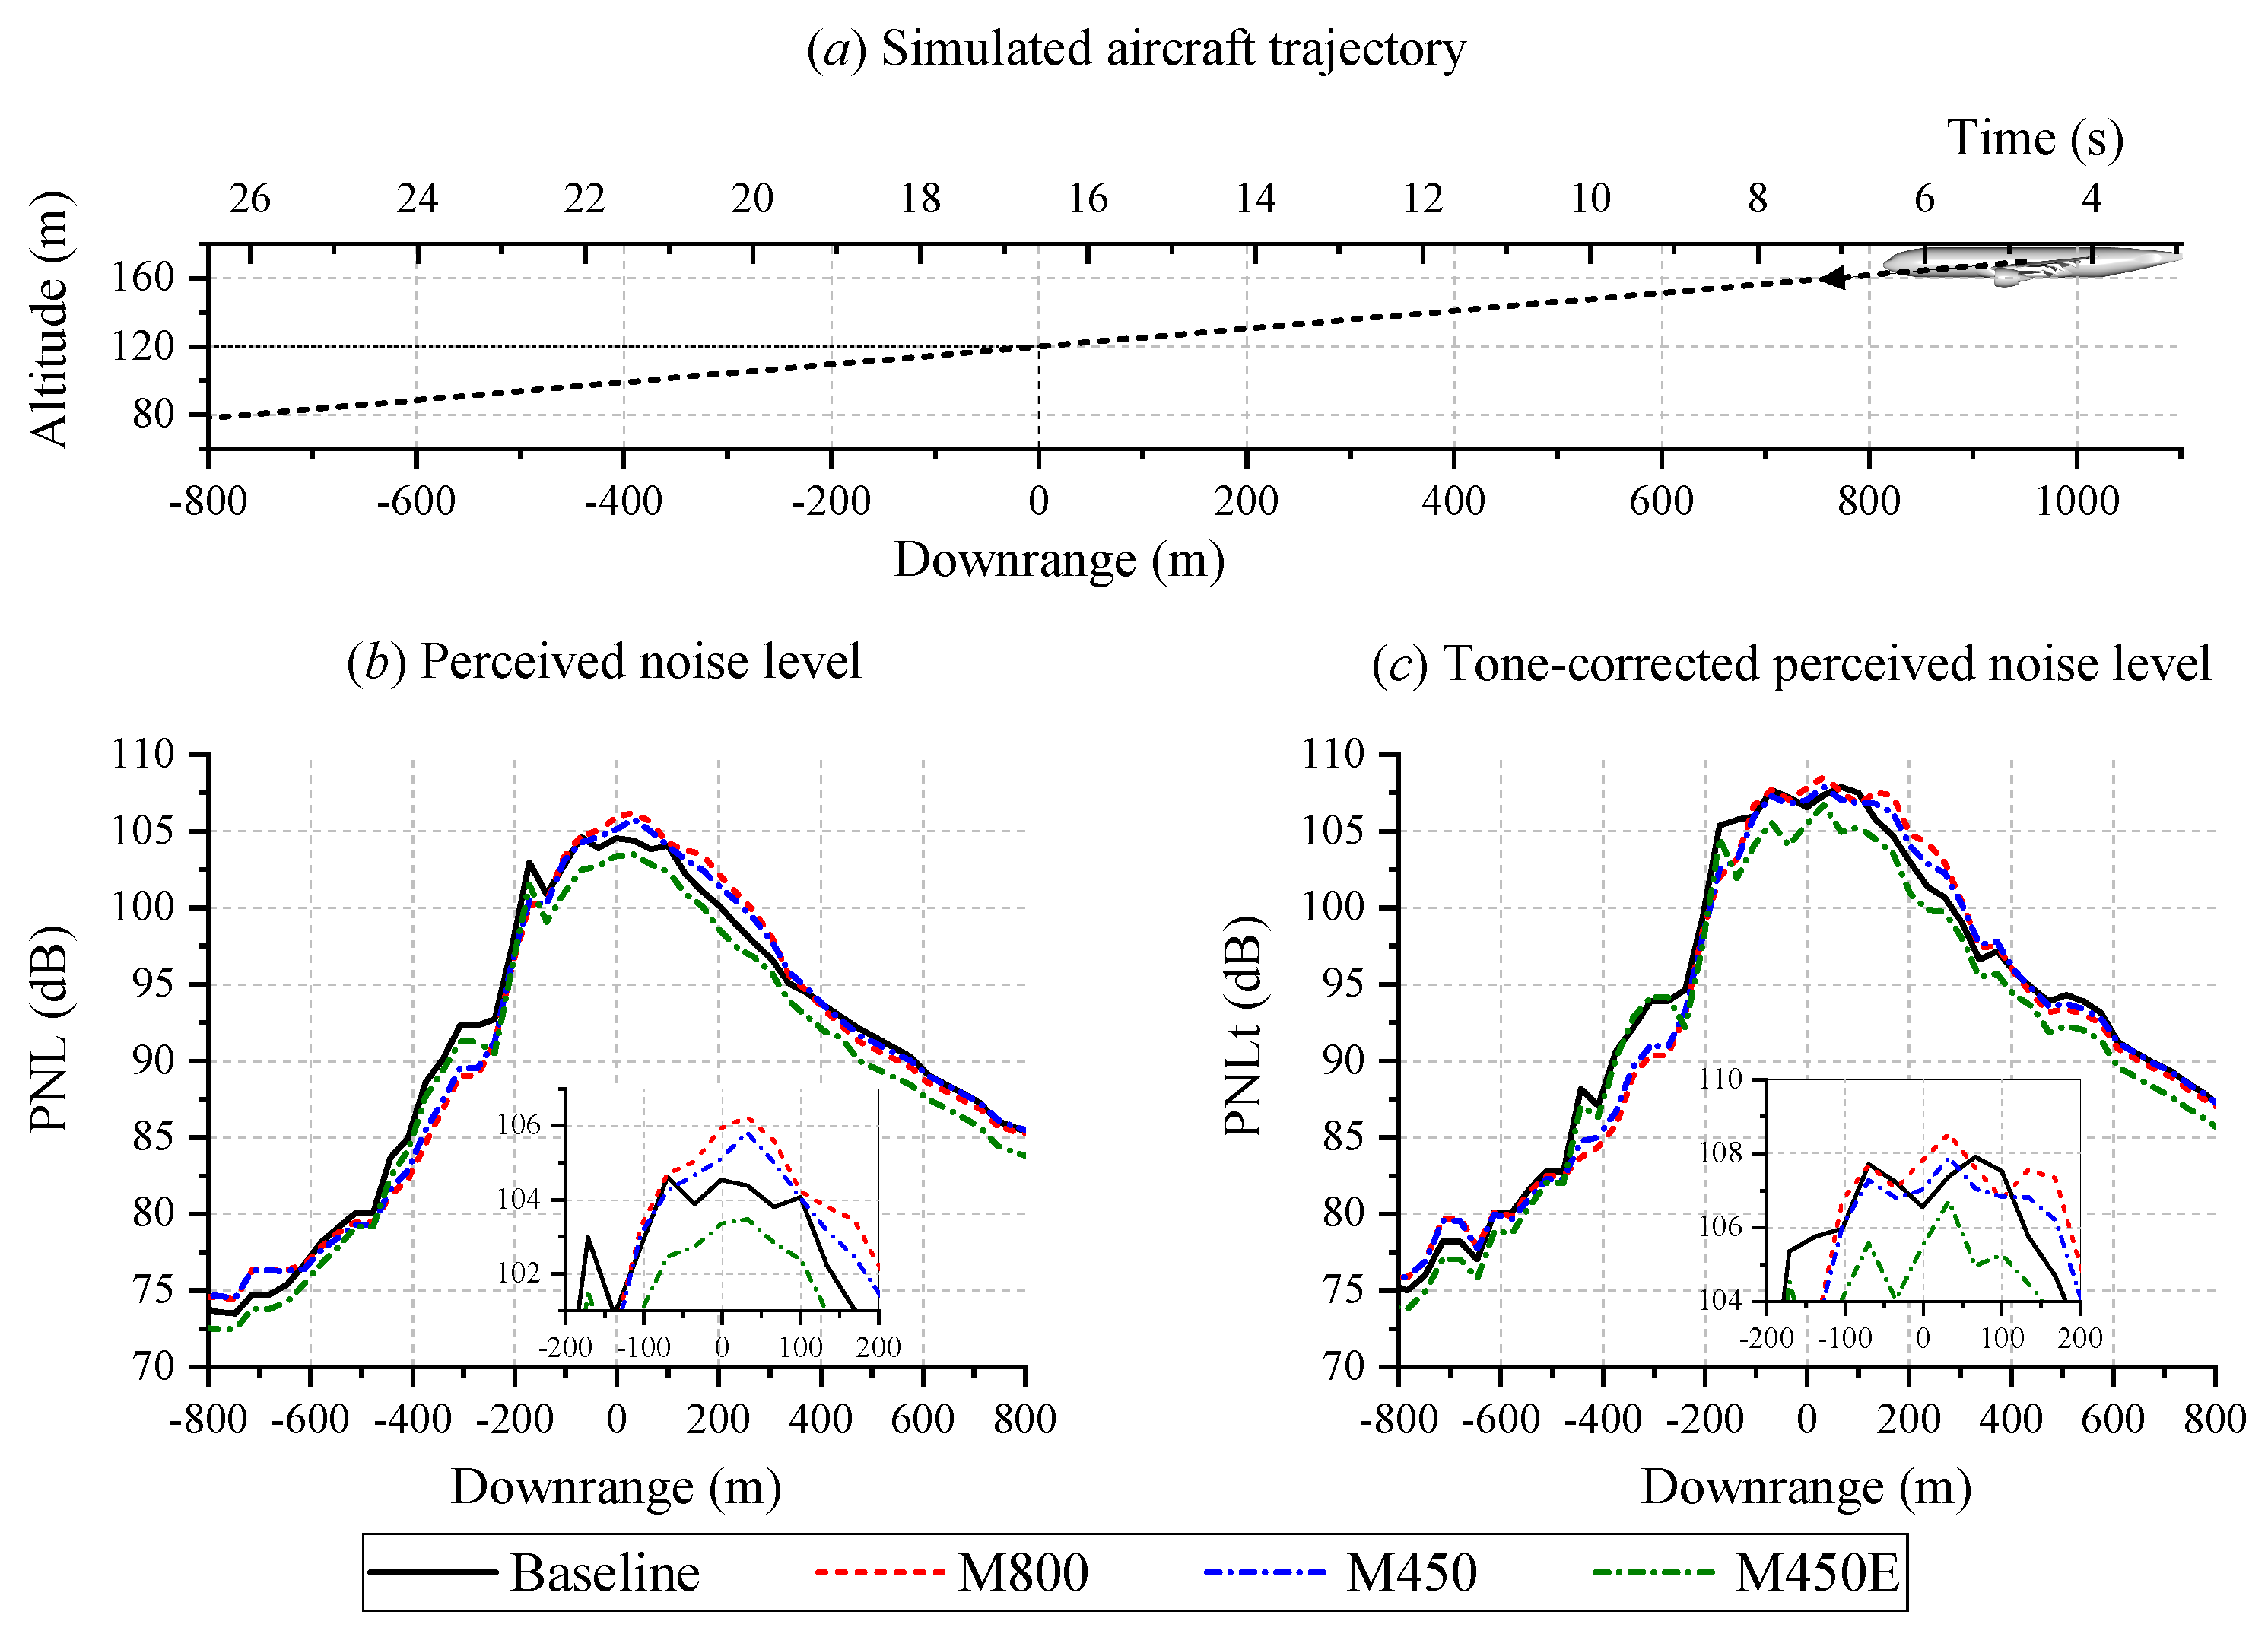
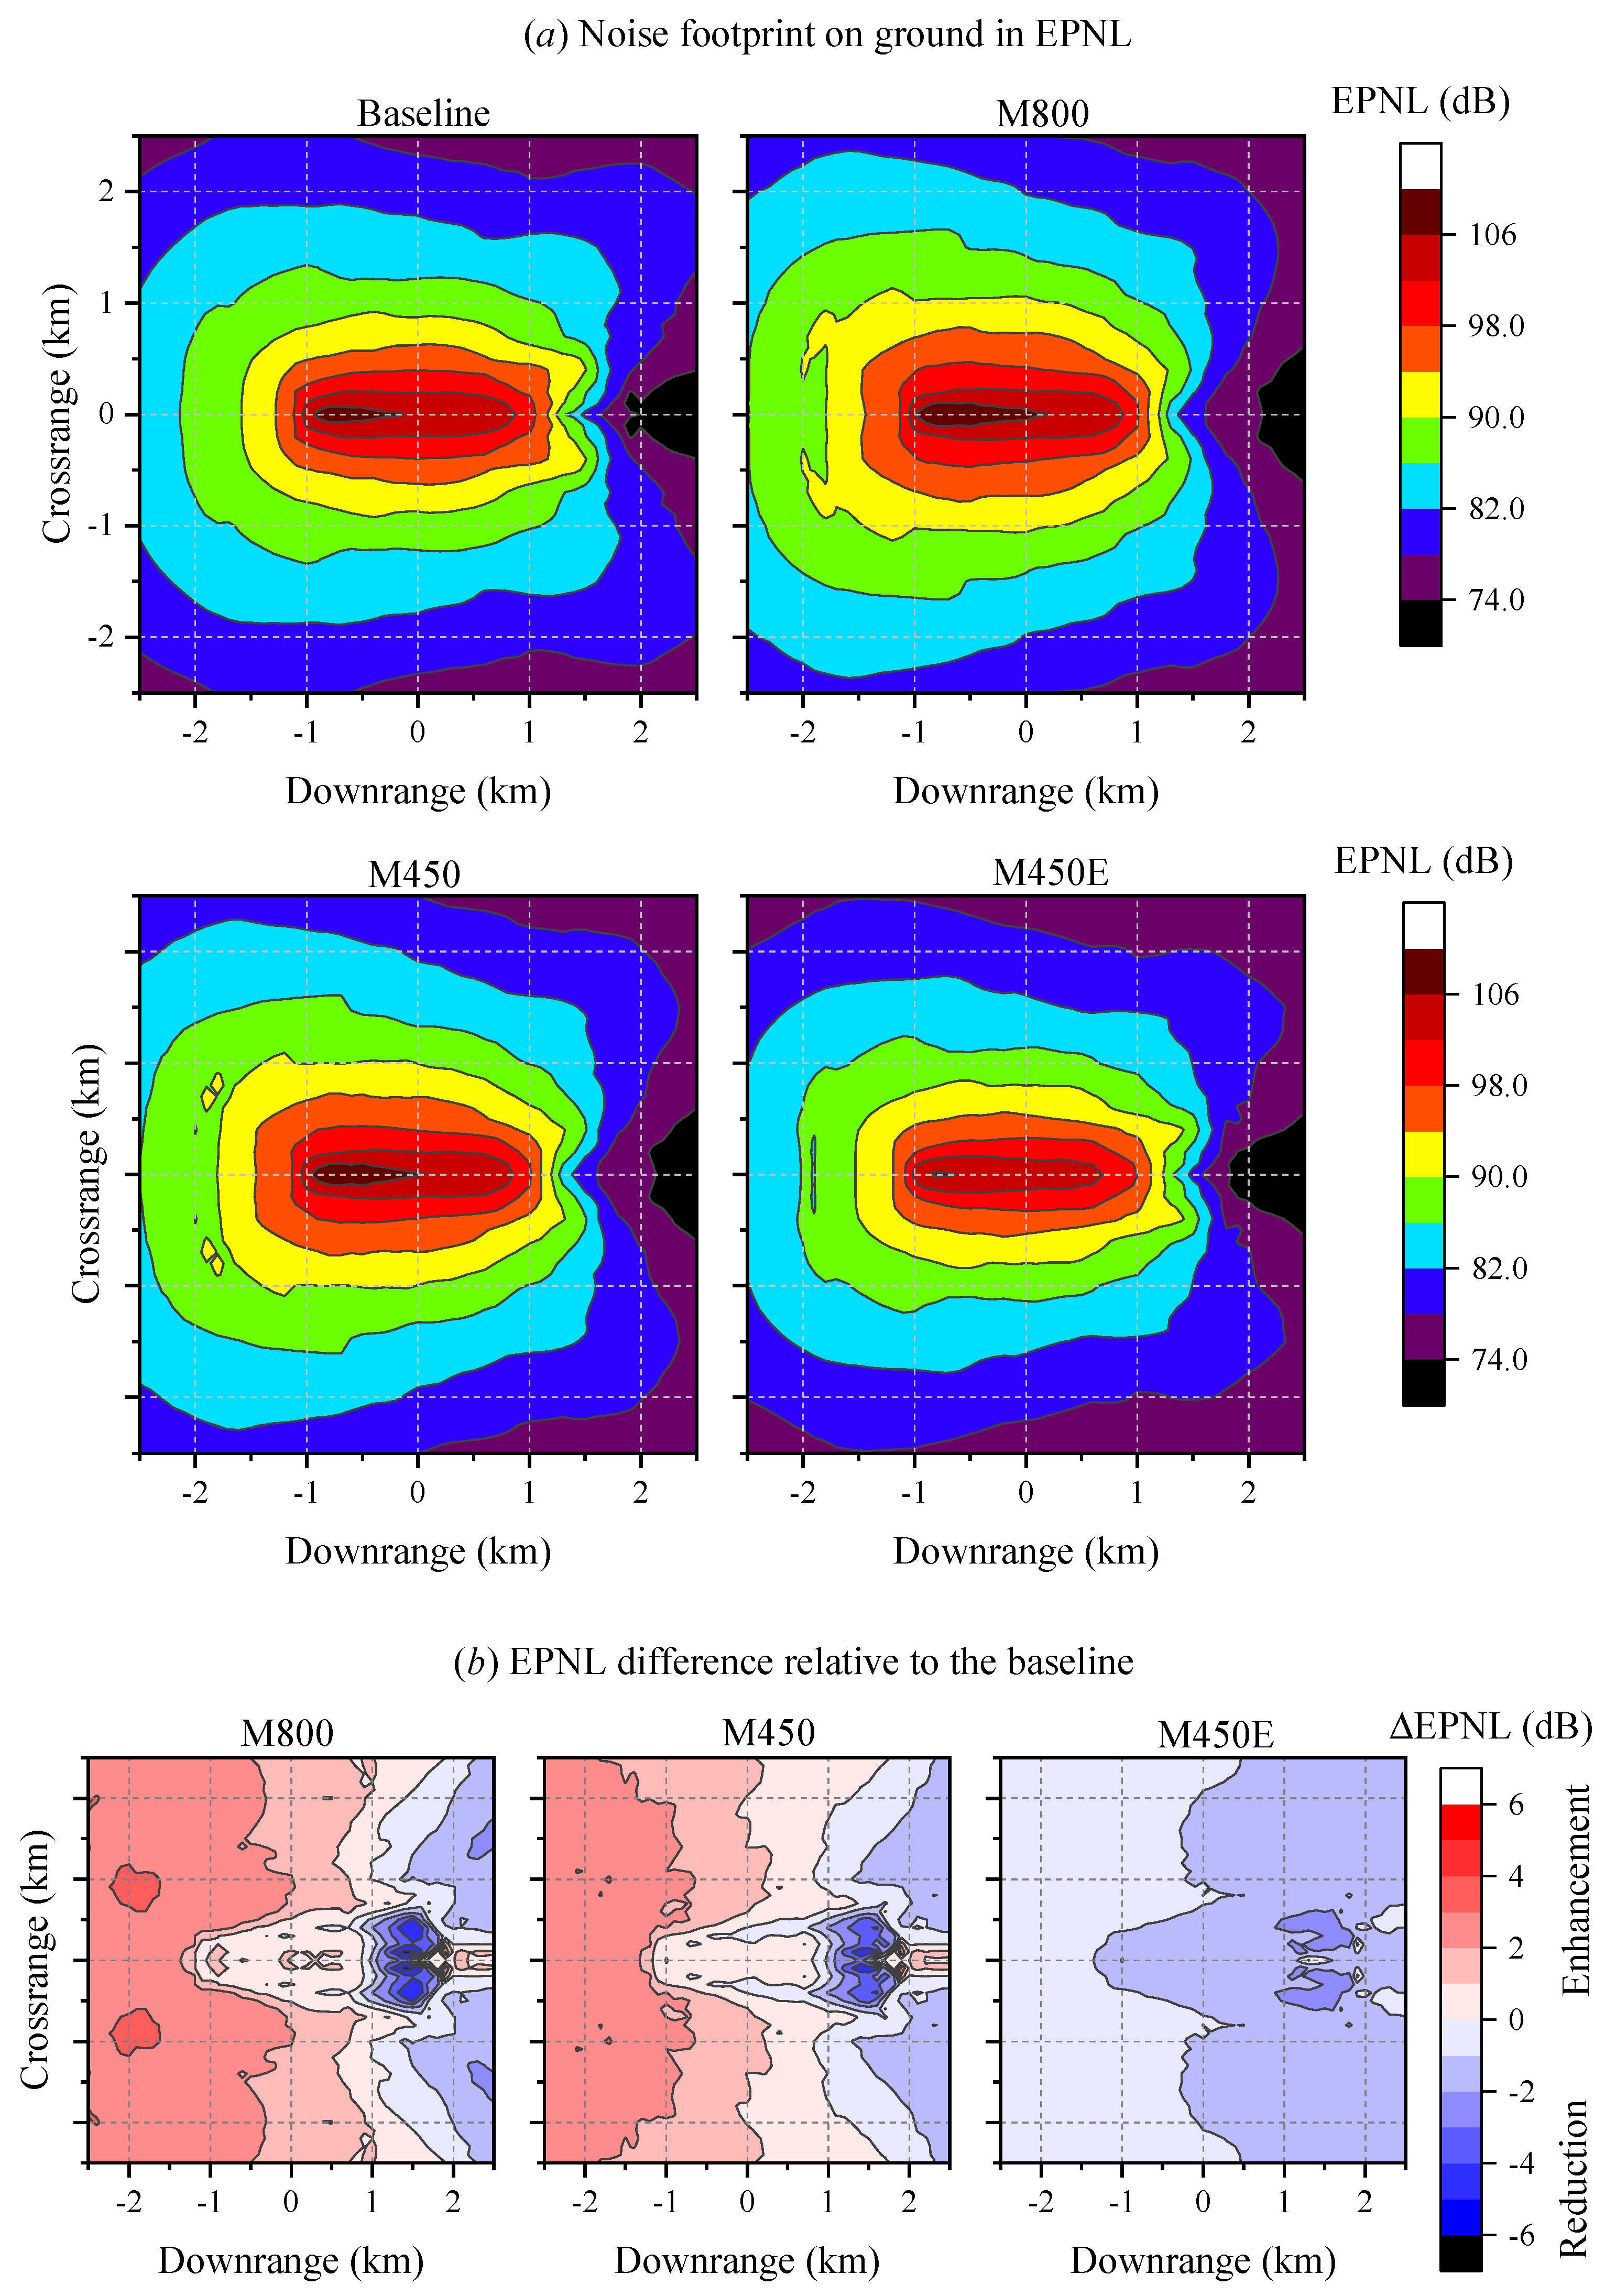
4.2. Far-Field Noise Characteristics

The effects of the porous treatments on the acoustic characteristics of the CRM/SDT configuration are discussed in this subsection. The sound generated by the CRM/SDT model can be visualized using the dilatation field contour, which is provided in Figure 16. The figure only shows the contour for the baseline configuration as it has been found that the contours for the other configurations are qualitatively similar. The contour clearly shows wavefronts originating from the inlet and the outlet of the nacelle, which correspond to the sound produced by the fan stage components. After leaving the fan stage, sound waves are also diffracted by the high-lift devices. Additional noise is also generated from within the jet plume downstream of the nacelle.
In Figure 17, the noise emitted by the aircraft is evaluated at two observers that are referred to as approach and lateral locations, respectively. The approach reference position is located at a distance of 120 m directly underneath the aircraft. On the other hand, the lateral position is located at a distance of 450 m alongside the aircraft. These locations are based on the reference measurement distances outlined in ICAO Annex 16 [48,49]. The sound pressure level (SPL) spectra in the figure show that the sound intensity at the approach location is 12 dB higher on average than at the lateral one, which is roughly equal to the difference assuming a spherical spreading by a point source (i.e., both measurement points are located in the acoustic far-field). The tones corresponding to the blade-passage frequency are less prominent at the lateral position, due to the noise directivity. By comparing the noise spectra between the different configurations (see Figure 17b), it can be deduced that the application of poro-serrations can substantially reduce the tonal noise component at BPF 1 and its harmonics. However, in the M800 and M450 cases, it is also evident that the broadband noise component in the low-frequency range has been enhanced, particularly at frequencies below BPF 2 .
The acoustic energy emitted by the fan stage is characterized by the source power level (PWL) spectra in Figure 18a. The overall PWL (OPWL) values in the frequency range of 0.2 < f / BPF 1 < 3.5 are also reported in the figure. It is evident that only the M450E configuration achieves a reduction in acoustic power emission, whereas the M800 and M450E ones produce comparable OPWL as the baseline case. As depicted in Figure 18b, this is due to the fact that the reduction of PWL at the BPFs (i.e., the main tonal noise component) has been counterbalanced by the enhanced broadband noise component. The plot also shows that changes in the Δ OPWL are proportional to the porosity of the poro-serrations. For instance, based on Figure 18a, the PWL values in the frequency range “A” ( 0.3 < f / BPF 1 < 0.7 ) are increased by an average of 2 dB and 1.5 dB for the M800 and M450 configurations, respectively. The broadband noise increase is absent in the M450E case because its solid serrations do not induce any severe flow separation. Above 2 BPF 1 (frequency range “D”), broadband noise attenuation can be observed in the spectra of all three modified configurations. It is worth mentioning that the spectra of the M800 configuration exhibit additional tones that are unrelated to the harmonics of BPF 1 , which can be found at f / BPF 1 = 0.71 , 1.33, 1.48, and 1.71. Following the velocity fluctuations spectra in Figure 13, the tones are likely associated with the vortex shedding process taking place at the solid–porous junction of the poro-serrated OGV [46]. Nevertheless, these additional tones are absent in the M450 configuration, which results in a lower OPWL value relative to its higher-porosity counterpart.
The noise directivity on the lateral plane of the aircraft is shown in Figure 19. The overall SPL (OSPL) values are reported at a distance of 120 m from the fan-stage inlet corresponding to the approach reference location. The nose of the aircraft is aligned with the 180 ° angle. The directivity plot implies that noise is radiated predominantly towards the upstream and downward directions, the latter of which is attributed to the shielding effect from the wing [50]. For most observer angles, both M800 and M450 configurations produce higher OSPL by 1 to 2 dB relative to the baseline configuration, whereas the M450E configuration produces a reduction of 1 dB. Noise attenuation in the M800 and M450 cases is present only in between 310 ° and 330 ° , i.e., in the downstream direction.
The noise directivity analysis is expanded in the lower part of the figure, where the directivity patterns are plotted for the different frequency ranges that are previously highlighted in Figure 18a. Plot A, which corresponds to 0.35 < f / BPF 1 < 0.75 , evidences that the noise increase caused by the M800 and M450 OGVs can be observed in all directions. Similar trends are found in plot B ( 1.08 < f / BPF 1 < 1.34 ), except that the noise increase is only present in directions normal to the fan stage axis. In both plots, nonetheless, the excess noise produced by the M450 case is less severe than that by the M800 one. On the other hand, a slight noise reduction in the M450E case can be found in these frequency ranges. A more noticeable discrepancy between the M800 and M450 cases is shown in plot C, where the OSPL distribution of the latter is relatively similar to that of the baseline, unlike the former. This is related to the additional tone produced by the M800 configuration, whose intensity is comparable to the BPF 2 of the baseline configuration, which is not present with the lower-porosity case. Plot D shows the broadband noise reduction in the high-frequency range, which is mainly observed in the lower downstream direction for the M800 and M450 configurations. Conversely, the M450E also exhibits reduced noise level in the upstream direction.
Basic noise metrics, such as OSPL, do not fully describe the noise characteristics as perceived by a human listener. As a matter of fact, a person with normal hearing capability is most sensitive to sound at frequencies in between 2 and 4 kHz [48]. Furthermore, tonal noise component, in general, induces more annoyance than the broadband one. In the interest of evaluating the impact of the porous treatments on the perceived noise features of the CRM/SDT setup, the perceived noise level (PNL) metric is used, followed by a noise footprint analysis. This analysis was performed using the 3DS-SIMULIA Opty B -FOOTPRINT tool in conjunction with 3DS-SIMULIA PowerACOUSTICS. The tool has been used to perform digital aircraft noise pre-certification [51], as well as to investigate the impact of trajectory and flight conditions on the noise footprint generated by eVTOL vehicles [52].
Currently, the noise footprint analysis assumes that the aircraft travels along an approach trajectory, as illustrated in Figure 20a, which is a descending flight path with a constant slope of 3 degrees. While the present simulation only considers a single fan stage that is installed underneath the port wing of the aircraft, its far-field noise signal (i.e., computed using FW-H analogy) has been mirrored along the symmetry plane of the aircraft to emulate the noise contribution of a second (starboard) fan stage. As shown in Figure 17, the aircraft altitude is 120 m when it is directly above the reference approach microphone location, which is indicated as the zero downrange position in Figure 20.
In Figure 20b,c, the perceived noise level (PNL) and its tone-corrected level (PNLt) were used to evaluate the noise level measured at the reference microphone as the aircraft travels along its trajectory. The downrange coordinate is defined from 850 m to 850 m and the PNL values are computed in steps of 0.5 s. When the aircraft is approaching the microphone (i.e., downrange > 0), the M800 and M450 configurations tend to produce higher PNL values (e.g., by up to 2 dB) than the baseline, while reduced PNL can be observed in the M450E case. The difference between the M450E and the baseline configurations becomes more apparent in the PNLt plot due to the mitigated tonal noise emission in the former. However, the PNLt distributions of both M800 and M450 configurations remain comparable to the baseline one, as the tonal noise attenuation is offset by the broadband excess noise. The PNL values for all cases peak slightly ahead of the reference microphone location due to the stronger tendency of noise radiation in the lower upstream direction as previously indicated in Figure 19. As the aircraft leaves the reference microphone location, the PNL and PNLt values for all three modified configurations become smaller than those of the baseline, which is attributed to the noise reduction in the lower downstream direction previously shown in Figure 19.
The noise footprint of the aircraft during the flyover is illustrated in Figure 21 in term of effective PNL (EPNL). The footprint was computed on a square grid that is 2.5 km by 2.5 km wide. For the M800 and M450 configurations, the contours also evidence the enhancement of noise radiation in front of the aircraft, whereas noise reduction is only present downstream of it. The figure shows that the noise increase is more severe in the M800 case than the M450 one, which reflects the source power spectra trends in Figure 18. On the other hand, the M450E configuration exhibits EPNL reduction in the entire map, although noise attenuation is also larger behind the aircraft. Based on the contours, the EPNL values at the origin (i.e., approach reference location) are 105.9 dB, 106.8 dB, 106.2 dB, and 104.4 dB for the baseline, M800, M450, and M450E configurations, respectively. For comparison, the approach EPNL for a Boeing 777-300ER is 101   dB [53]. While this is substantially lower than the EPNL value for the baseline CRM-SDT model, it is worth mentioning that the SDT fan stage might no longer be acoustically optimized due to the upscaling. Furthermore, the SDT fan stage also lacks acoustic liner in the nacelle, unlike in typical modern turbofans.

5. Conclusions

The present study focuses on a numerical investigation of the application of a porous leading-edge (LE) treatment in a full-scale aircraft simulation. The model consists of the NASA HL-CRM airframe combined with the NASA-SDT fan stage. The outlet guide vanes (OGV) of the fan stage are modified to incorporate a poro-serration treatment to mitigate the fan wake-OGV interaction noise. The poro-serrations were modeled after a metal foam with two different porosity values (e.g., M800 and M450E configurations) to examine how porosity affects the efficacy of the noise reduction treatment. A third modified configuration (M450E) was proposed where the serrations are made permeable only at the outer 85% of the OGV blade span, where the noise source intensity is expected to be the strongest.
The fan stages with the modified OGVs are found to produce a substantial tonal noise reduction at the blade-passage frequency (BPF) and its harmonics (e.g., by up to 7 dB at BPF 1 and 9 dB at BPF 2 ). However, the poro-serrations in the M800 and M450 configurations are also responsible for enhancing the broadband noise component in the low-frequency range. Moreover, additional tones that are not associated with the BPFs are also emitted in the higher porosity case (i.e., M800). As a consequence, the overall source power levels of both M800 and M450 cases are relatively unchanged with respect to the baseline one. Conversely, the M450E configuration achieves 1.5 dB reduction in term of overall source power level. The noise directivity analysis reveals that the modified fan stages exhibit noise reduction mainly in the lower downstream direction. This behavior is also reflected in the noise footprint contours where the noise reduction level is generally higher behind the aircraft.
By analyzing the flow field in the fan stage, it has been shown that the broadband noise enhancement in the M800 and M450 configurations is attributed to the flow separation above the suction side of the poro-serrated OGVs. The separated-flow region is induced by an unsteady cross-flow in the porous medium region, which is driven by a pressure balancing process. A vortex shedding phenomenon near the solid-porous junction was identified for the poro-serrations with higher porosity, which causes additional tones to be emitted. The flow separation on the poro-serrated OGVs eventually decreases the mean axial velocity and the mass flow rate in the fan stage, lowering the amount of thrust generated. The thrust penalty is found to be proportional with the porosity of the LE treatment, which is 9% in the M800 case and 7.5 % in the M450 case. Thus, the poro-serration with the lower porosity value exhibits a more favorable trade-off between acoustic and aerodynamic characteristics compared to that with higher porosity.
Using the M450E configuration, it was demonstrated to be more beneficial to apply porous treatment only at the outer span of the OGV for two reasons. Firstly, the fan-wake impingement at these locations generates stronger surface pressure fluctuations on the OGV, which can be efficiently mitigated by the porous medium. Secondly, by limiting the spanwise extent where the leading edge is permeable, the adverse aerodynamic impact associated with the porous medium region, such as the mean cross-flow between the suction and pressure sides of the poro-serrations, can be mitigated.

Author Contributions

Conceptualization, D.C., C.T. and L.R.; methodology, D.C., C.T. and L.R.; software, D.C.; validation, C.T.; formal analysis, C.T. and L.R.; investigation, C.T. and L.R.; resources, D.C., D.R. and F.A.; data curation, C.T. and L.R.; writing—original draft preparation, C.T.; writing—review and editing, C.T., D.C., D.R. and F.A.; visualization, C.T. and D.C.; supervision, D.C., D.R. and F.A.; project administration, D.C. and D.R.; funding acquisition, D.R. and F.A. All authors have read and agreed to the published version of the manuscript.

Funding

This study is supported by the project SMARTANSWER (Smart Mitigation of flow-induced Acoustic Radiation and Transmission for reduced Aircraft, surface traNSport, Workplaces and wind enERgy noise) which has received funding from the European Union’s Horizon 2020 research and innovation program under the Marie Skłodowska-Curie grant agreement No. 722401. More information can be found on https://www.h2020-smartanswer.eu/ (accessed on 27 December 2021).

Institutional Review Board Statement

Not applicable.

Informed Consent Statement

Not applicable.

Data Availability Statement

The data presented in this study are available on request from the corresponding author. The data are not publicly available due to the usage of commercial software packages and proprietary data formats.

Acknowledgments

The authors acknowledge the computing time on the Dutch National Computer Facilities, Cartesius, which was provided by the Dutch Research Council (NWO) through the project 2021/ENW/01050159.

Conflicts of Interest

The authors declare no conflict of interest.

Abbreviations

The following abbreviations are used in this manuscript:
BPFBlade-passage frequency
CRMCommon research model airframe
EPNLEffective perceived noise level
FW-HFfowcs-Williams and Hawkings analogy
LELeading edge
OGVOutlet guide vane
OPWLOverall source power level
OSPLOverall sound pressure level
PNLPerceived noise level
PNLtTone-corrected perceived noise level
PWLSource power level
SDTSource diagnostic test rig
SPLSound pressure level
TETrailing edge
TINTurbulence-impingement noise

References

  1. Casalino, D.; Diozzi, F.; Sannino, R.; Paonessa, A. Aircraft noise reduction technologies: A bibliographic review. Aerosp. Sci. Technol. 2008, 12, 1–17. [Google Scholar] [CrossRef]
  2. Woodward, R.; Hughes, C.; Jeracki, R.; Miller, C. Fan Noise Source Diagnostic Test–Far-field Acoustic Results. In Proceedings of the 8th AIAA/CEAS Aeroacoustics Conference & Exhibit, Breckenridge, CO, USA, 17–19 June 2002; p. 2427. [Google Scholar]
  3. Zaporozhets, O.; Tokarev, V.; Attenborough, K. Aircraft Noise: Assessment, Prediction and Control; CRC Press: Boca Raton, FL, USA, 2011. [Google Scholar]
  4. Casalino, D.; Hazir, A.; Mann, A. Turbofan broadband noise prediction using the Lattice Boltzmann Method. AIAA J. 2018, 56, 609–628. [Google Scholar] [CrossRef]
  5. Casalino, D.; Avallone, F.; Gonzalez-Martino, I.; Ragni, D. Aeroacoustic study of a wavy stator leading edge in a realistic fan/OGV stage. J. Sound Vib. 2019, 442, 138–154. [Google Scholar] [CrossRef] [Green Version]
  6. Paterson, R.W.; Amiet, R.K. Noise and surface pressure response of an airfoil to incident turbulence. J. Aircr. 1977, 14, 729–736. [Google Scholar] [CrossRef]
  7. Hersh, A.S.; Soderman, P.T.; Hayden, R.E. Investigation of acoustic effects of leading-edge serrations on airfoils. J. Aircr. 1974, 11, 197–202. [Google Scholar] [CrossRef]
  8. Roger, M.; Schram, C.; De Santana, L. Reduction of airfoil turbulence-impingement noise by means of leading-edge serrations and/or porous material. In Proceedings of the 19th AIAA/CEAS Aeroacoustics Conference, Berlin, Germany, 27–29 May 2013; p. 2108. [Google Scholar]
  9. Narayanan, S.; Chaitanya, P.; Haeri, S.; Joseph, P.; Kim, J.; Polacsek, C. Airfoil noise reductions through leading edge serrations. Phys. Fluids 2015, 27, 025109. [Google Scholar] [CrossRef]
  10. Bampanis, G.; Roger, M.; Ragni, D.; Avallone, F.; Teruna, C. Airfoil-turbulence interaction noise source identification and its reduction by means of leading edge serrations. In Proceedings of the 25th AIAA/CEAS Aeroacoustics Conference, Delft, The Netherlands, 20–23 May 2019; p. 2741. [Google Scholar]
  11. Lee, S. Reduction of blade-vortex interaction noise through porous leading edge. AIAA J. 1994, 32, 480–488. [Google Scholar] [CrossRef]
  12. Sarradj, E.; Geyer, T. Noise generation by porous airfoils. In Proceedings of the 13th AIAA/CEAS Aeroacoustics Conference (28th AIAA Aeroacoustics Conference), Rome, Italy, 21–23 May 2007; p. 3719. [Google Scholar]
  13. Geyer, T.; Sarradj, E.; Giesler, J.; Hobracht, M. Experimental assessment of the noise generated at the leading edge of porous airfoils using microphone array techniques. In Proceedings of the 17th AIAA/CEAS Aeroacoustics Conference (32nd AIAA Aeroacoustics Conference), Portland, OR, USA, 5–8 June 2011; p. 2713. [Google Scholar]
  14. Geyer, T.F.; Lucius, A.; Schrödter, M.; Schneider, M.; Sarradj, E. Reduction of turbulence interaction noise through airfoils with perforated leading edges. Acta Acust. United Acust. 2019, 105, 109–122. [Google Scholar] [CrossRef]
  15. Teruna, C.; Avallone, F.; Casalino, D.; Ragni, D. Numerical investigation of leading edge noise reduction on a rod-airfoil configuration using porous materials and serrations. J. Sound Vib. 2021, 494, 115880. [Google Scholar] [CrossRef]
  16. Chen, W.; Qiao, W.; Tong, F.; Wang, L.; Wang, X. Numerical investigation of wavy leading edges on rod–airfoil interaction noise. AIAA J. 2018, 56, 2553–2567. [Google Scholar] [CrossRef]
  17. Turner, J.M.; Kim, J.W. Aeroacoustic source mechanisms of a wavy leading edge undergoing vortical disturbances. J. Fluid Mech. 2017, 811, 582–611. [Google Scholar] [CrossRef] [Green Version]
  18. Gea Aguilera, F.; Gill, J.R.; Angland, D.; Zhang, X. Wavy leading edge airfoils interacting with anisotropic turbulence. In Proceedings of the 23rd AIAA/CEAS Aeroacoustics Conference, Denver, CO, USA, 5–9 June 2017; p. 3370. [Google Scholar]
  19. Chaitanya, P.; Joseph, P.; Narayanan, S.; Vanderwel, C.; Turner, J.; Kim, J.W.; Ganapathisubramani, B. Performance and mechanism of sinusoidal leading edge serrations for the reduction of turbulence–aerofoil interaction noise. J. Fluid Mech. 2017, 818, 435–464. [Google Scholar] [CrossRef] [Green Version]
  20. Palleja-Cabre, S.; Paruchuri, C.C.; Joseph, P.; Priddin, M.J.; Ayton, L.J. Downstream Perforations for the Reduction of Turbulence-Aerofoil Interaction Noise: Part I-Experimental Investigation. In Proceedings of the AIAA AVIATION 2021 FORUM, Washington, PA, USA, 2–6 August 2021; p. 2149. [Google Scholar]
  21. Ayton, L.J.; Colbrook, M.J.; Geyer, T.F.; Chaitanya, P.; Sarradj, E. Reducing aerofoil–turbulence interaction noise through chordwise-varying porosity. J. Fluid Mech. 2021, 906. [Google Scholar] [CrossRef]
  22. Lockard, D.P.; Choudhari, M.M.; O’Connell, M.D.; Duda, B.M.; Fares, E. Noise simulations of the high-lift common research model. In Proceedings of the 23rd AIAA/CEAS Aeroacoustics Conference, Denver, CO, USA, 5–9 June 2017; p. 3362. [Google Scholar]
  23. Ribeiro, A.F.; Ferris, R.; Khorrami, M.R. Aeroacoustic Computations of a Generic Low Boom Concept in Landing Configuration: Part 2-Airframe Noise Simulations. In Proceedings of the AIAA AVIATION 2021 FORUM, Washington, PA, USA, 2–6 August 2021; p. 2196. [Google Scholar]
  24. König, B.; Fares, E. Exa powerflow simulations for the sixth AIAA drag prediction workshop. J. Aircr. 2018, 55, 1482–1490. [Google Scholar] [CrossRef]
  25. Succi, S. The Lattice Boltzmann Equation: For Fluid Dynamics and Beyond; Oxford University Press: Oxford, UK, 2001. [Google Scholar]
  26. Zhang, R.; Fan, H.; Chen, H. A lattice Boltzmann approach for solving scalar transport equations. Philos. Trans. R. Soc. A 2011, 369, 2264–2273. [Google Scholar] [CrossRef] [PubMed]
  27. Bhatnagar, P.L.; Gross, E.P.; Krook, M. A model for collision processes in gases. I. Small amplitude processes in charged and neutral one-component systems. Phys. Rev. 1954, 94, 511. [Google Scholar] [CrossRef]
  28. Chen, H.; Teixeira, C.; Molvig, K. Realization of fluid boundary conditions via discrete Boltzmann dynamics. Int. J. Mod. Phys. C 1998, 9, 1281–1292. [Google Scholar] [CrossRef]
  29. Chen, H.; Chen, S.; Matthaeus, W.H. Recovery of the Navier-Stokes equations using a lattice-gas Boltzmann method. Phys. Rev. A 1992, 45, R5339. [Google Scholar] [CrossRef]
  30. Chen, H.; Orszag, S.A.; Staroselsky, I.; Succi, S. Expanded analogy between Boltzmann kinetic theory of fluids and turbulence. J. Fluid Mech. 2004, 519, 301–314. [Google Scholar] [CrossRef]
  31. Yakhot, V.; Orszag, S.A. Renormalization group analysis of turbulence. I. Basic theory. J. Sci. Comput. 1986, 1, 3–51. [Google Scholar] [CrossRef]
  32. Teixeira, C.M. Incorporating turbulence models into the lattice-Boltzmann method. Int. J. Mod. Phys. C 1998, 9, 1159–1175. [Google Scholar] [CrossRef]
  33. Launder, B.E.; Spalding, D.B. The numerical computation of turbulent flows. In Numerical Prediction of Flow, Heat Transfer, Turbulence and Combustion; Elsevier: Amsterdam, The Netherlands, 1983; pp. 96–116. [Google Scholar]
  34. Farassat, F.; Succi, G.P. A review of propeller discrete frequency noise prediction technology with emphasis on two current methods for time domain calculations. J. Sound Vib. 1980, 71, 399–419. [Google Scholar] [CrossRef]
  35. Ffowcs-Williams, J.; Hawkings, D.L. Sound generation by turbulence and surfaces in arbitrary motion. Phil. Trans. R. Soc. Lond. A 1969, 264, 321–342. [Google Scholar]
  36. Casalino, D. An advanced time approach for acoustic analogy predictions. J. Sound Vib. 2003, 261, 583–612. [Google Scholar] [CrossRef]
  37. Lacy, D.S.; Sclafani, A.J. Development of the high lift common research model (hl-crm): A representative high lift configuration for transonic transports. In Proceedings of the 54th AIAA Aerospace Sciences Meeting, San Diego, CA, USA, 4–8 January 2016; p. 0308. [Google Scholar]
  38. Rubio Carpio, A.; Merino Martinez, R.; Avallone, F.; Ragni, D.; Snellen, M.; van der Zwaag, S. Broadband Trailing-Edge Noise Reduction Using Permeable Metal Foams. In Proceedings of the INTER-NOISE and NOISE-CON Congress and Conference, Hong Kong, China, 27–30 August 2017; Volume 255, pp. 2755–2765. [Google Scholar]
  39. Regulations, F.A. Noise Standards: Aircraft Type and Airworthiness Certification; Technical Report, Technical Report 14 CFR Part 36; United States Federal Aviation Administration: Washington, DC, USA, 2009.
  40. Podboy, G.; Krupar, M.; Helland, S.; Hughes, C. Steady and unsteady flow field measurements within a NASA 22 inch fan model. In Proceedings of the 40th AIAA Aerospace Sciences Meeting & Exhibit, Hampton, VA, USA, 14–17 January 2002; p. 1033. [Google Scholar]
  41. FAA. Airplane Flying Handbook (FAA-H-8083-3A); Skyhorse Publishing Inc.: New York, NY, USA, 2011. [Google Scholar]
  42. EASA. Type-Certificate Data Sheet for Trent 1000 Series Engines (EASA.E.036); European Union Aviation Safety Agency: Cologne, Germany, 2019. [Google Scholar]
  43. Curle, N. The influence of solid boundaries upon aerodynamic sound. Proc. R. Soc. London. Ser. A 1955, 231, 505–514. [Google Scholar]
  44. Hansen, K.L.; Kelso, R.M.; Dally, B.B. Performance variations of leading-edge tubercles for distinct airfoil profiles. AIAA J. 2011, 49, 185–194. [Google Scholar] [CrossRef]
  45. Kim, J.W.; Haeri, S.; Joseph, P.F. On the reduction of aerofoil–turbulence interaction noise associated with wavy leading edges. J. Fluid Mech. 2016, 792, 526–552. [Google Scholar] [CrossRef] [Green Version]
  46. Carpio, A.R.; Avallone, F.; Ragni, D.; Snellen, M.; van der Zwaag, S. Quantitative criteria to design optimal permeable trailing edges for noise abatement. J. Sound Vib. 2020, 485, 115596. [Google Scholar] [CrossRef]
  47. Brooks, T.F.; Pope, D.S.; Marcolini, M.A. Airfoil Self-Noise and Prediction; NASA Reference Publication, NASA-RP-1218; NASA: Washington, DC, USA, 1989.
  48. Boettcher, J. Noise Certification Workshop. In Session 2: Aircraft Noise Certification; International Civil Aviation Organization: Montreal, QC, Canada, 2006. [Google Scholar]
  49. Nöding, M.; Bertsch, L. Application of Noise Certification Regulations within Conceptual Aircraft Design. Aerospace 2021, 8, 210. [Google Scholar] [CrossRef]
  50. Bertsch, L.; Heinze, W.; Guérin, S.; Lummer, M.; Delfs, J.W. 10 Years of Joint Research at DLR and TU Braunschweig toward Low-Noise Aircraft Design-What Did we Achieve? Aeronaut. Aerosp. Open Access J. 2019, 3, 89–105. [Google Scholar] [CrossRef] [Green Version]
  51. De La Puente, F.; Guerra Crespo, J.J.; Rodríguez Ahlquist, J.; García Merino, I.; Mancini, S.; Kolb, A. On C295 FWSAR military transport aircraft acoustic certification by CAA. In Proceedings of the AIAA AVIATION 2021 FORUM, Washington, PA, USA, 2–6 August 2021; p. 2202. [Google Scholar]
  52. Casalino, D.; van der Velden, W.C.; Romani, G. Community noise of urban air transportation vehicles. In Proceedings of the AIAA Scitech 2019 Forum, San Diego, CA, USA, 7–11 January 2019; p. 1834. [Google Scholar]
  53. Michel, U. Correlation of aircraft certification noise levels EPNL with controlling physical parameters. In Proceedings of the 19th AIAA/CEAS Aeroacoustics Conference, Reno, NV, USA, 27–29 May 2013; p. 2014. [Google Scholar]
Figure 1. The NASA HL-CRM/SDT configuration in the present study. The lower part of the figure shows a comparison between the baseline configuration and others equipped with poro-serrated OGVs. LE serrations in the M450E inset are colored red and green to distinguish the solid region from the porous one.
Aerospace 09 00070 g001
Figure 2. A closer view of the modified OGV (M800/M450 configurations) in the fan stage, highlighting the amplitude H and wavelength Λ of the serration planform.
Aerospace 09 00070 g002
Figure 3. (Top) The simulation domain enclosing the CRM/SDT model. (Bottom) The configuration of permeable FW-H surface for noise analyses.
Aerospace 09 00070 g003
Figure 4. The voxel distribution in the simulation domain: (a) near the borders of the acoustic sponge boundary; (b) surrounding the airframe; (c) surrounding the SDT fan stage; (d) near the OGVs.
Aerospace 09 00070 g004
Figure 5. The variation of the thrust produced by the SDT fan stage against the grid resolution level.
Aerospace 09 00070 g005
Figure 6. The variation of the sound power level (PWL) of the SDT fan stage against the grid resolution level.
Aerospace 09 00070 g006
Figure 7. The axial and radial integral length scales of turbulence in the interstage for the baseline configuration.
Aerospace 09 00070 g007
Figure 8. A sketch of the slice planes where contours are plotted in the subsequent figures: (a) axial slices and (b) radial slices. The cylindrical coordinate system in the fan stage is described in (c).
Aerospace 09 00070 g008
Figure 9. (Front view) Contours of phase-locked average of velocity magnitude ( | | U | | ) at the SDT inlet (top row), interstage (middle row), and outlet (bottom row).
Aerospace 09 00070 g009
Figure 10. (Side view) Contours of phase-locked average of velocity magnitude | | U | | at the different radial sections (top—10%, middle—45%, and bottom—80% of the outer radius) in the fan stage.
Aerospace 09 00070 g010
Figure 11. (Front view) Contours of phase-locked standard deviation of velocity magnitude ( | | U RMS | | ) at the SDT interstage (top row) and outlet (bottom row).
Aerospace 09 00070 g011
Figure 12. (Side view) Contours of phase-locked standard deviation of velocity magnitude ( | | U RMS | | ) at the different radial sections (top—10%, middle—45%, and bottom—80% of the outer radius) in the fan stage.
Aerospace 09 00070 g012
Figure 13. Plots of axial ( S u u ) and tangential ( S w w ) velocity fluctuations spectra at a height of 50 mm ( 0.23 c ) above the OGV TE. The power spectral density is normalized against a reference velocity of 1 m/s. The arrows in (a,b) indicate narrowband velocity fluctuations components that are unrelated to the BPFs.
Aerospace 09 00070 g013
Figure 14. (Isometric view) Contours of time-averaged surface pressure coefficient C p , mean and the RMS of surface pressure fluctuations C p , RMS on the OGV blades.
Aerospace 09 00070 g014
Figure 15. Plots of (top row) time-averaged surface pressure coefficient and (bottom row) RMS of surface pressure fluctuations at the outer span of the OGV. Pressure coefficient values shown are averaged over the 26 blades. The pressure distributions at the pressure side are plotted with lower opacity. For the M450E configuration, note that the LE porosity is only implemented at > 85 % of the blade outer radius.
Aerospace 09 00070 g015
Figure 16. The contour of the dilatation field (time derivative of pressure) surrounding the nacelle containing the SDT fan stage (baseline configuration). Note that the dilatation field is expressed in nondimensional unit.
Aerospace 09 00070 g016
Figure 17. (a) The sound pressure level (SPL) at reference observers beneath and alongside the aircraft. (b) The SPL difference between the baseline and the two modified cases. Note that the dimensions in the illustration at the lower left of the figure are not to scale.
Aerospace 09 00070 g017
Figure 18. (a) Source power level (PWL) of the CRM/SDT configuration. The capital letters denote the frequency ranges where the directivity patterns are plotted in Figure 19. Plot (b) shows the OPWL difference between the modified configurations and the baseline, divided into two categories: BPFs (the tonal peaks BPF 1 to BPF 3 ) and broadband (the broadband noise component and other tones up to f / BPF 1 = 3.5 ).
Aerospace 09 00070 g018
Figure 19. The noise directivity pattern along the lateral axis. Directivity plots A to D correspond to the frequency bands where notable discrepancies between the modified and baseline configurations are present in Figure 18.
Aerospace 09 00070 g019
Figure 20. (a) The aircraft trajectory for noise footprint analysis, (b) the variation of perceived noise level (PNL), and (c) the tone-corrected PNL (PNLt) for a reference aircraft approach scenario. The reference microphone is located at the origin of the downrange axis, where the aircraft altitude is 120 m.
Aerospace 09 00070 g020
Figure 21. Noise footprint contours, in term of effective PNL (EPNL), corresponding to the aircraft trajectory shown in Figure 20.
Aerospace 09 00070 g021
Table 1. Comparisons between the NASA-CRM/SDT geometries against some real-life examples.
NASA HL-CRMAirbus A330-300
Fuselage length (m)62.863.6
Wingspan (m)58.760.3
NASA SDT (5.5:1 scale)Rolls-Royce Trent 1000
Fan diameter (m)2.932.85
Bypass ratio-10.8–11.0
Fan blade count2220
OGV blade count2646
Table 2. The properties of porous materials employed for the poro-serrated OGVs.
Typedp (μm)ϕ (%)K (m2)C (m−1)
Metal foam (M800)80091.652.7 × 10−92613
Metal foam (M450/M450E)45089.286.11 × 10−109758
Table 3. Simulation domain specifications for grid convergence study.
Grid TypeResolution (Voxels/c)Voxel Count (Millions)
BaselineM800
Coarse41104.83104.89
Medium61279.28279.44
Fine86744.05744.43
Publisher’s Note: MDPI stays neutral with regard to jurisdictional claims in published maps and institutional affiliations.

