
Guidelines for the LTO Noise Assessment of Future Civil Supersonic Aircraft in Conceptual Design


Abstract
:1. Introduction: Background and Motivation
- One of the major applications of ANOPP has been to support the Supersonic Cruise Research (SCR) project at Langley, while the next application has been in conjunction with the Federal Aviation Administration (FAA) study to determine the economic and technological feasibility of noise limits for future supersonic transport [16]. The purpose is a high-fidelity system noise prediction along arbitrary flight paths, ANOPP embeds models for sound propagation, including the effects of the atmosphere and terrain, the installation effect, scattering and shielding. Over the years, the tool has been maintained and updated, including the ongoing development of new methods, essential for a more accurate physics-based prediction. Hence, in 2011, NASA announced the ANOPP2 release, which provides a modern prediction environment with a flexible framework meeting the needs of the future unconventional aircraft noise studies [17].
- PANAM has been developed by the German Aerospace Laboratory (DLR) to integrate noise prediction within the aircraft conceptual design and to support decision-making processes towards low-noise designs. Differently from ANOPP, the current version is only applicable to conventional tube-and-wing aircraft concepts [18]. However, PANAM uses proprietary source models for airframe noise, which are based on real modern aircraft [19]. Major aircraft noise components are modelled stand-alone, neglecting interactions. Sound propagation and convection effects are directly applied to the emitting noise source, to be more representative of the actual flight operating conditions [14].
- CARMEN is a tool developed by French aerospace laboratory ONERA and is connected with IESTA [20], a proprietary modular distributed simulation platform for the evaluation of air transport systems. The model dedicated to aircraft noise can predict the noise footprint around the airport on existing and future aircraft and is composed of three modules: the acoustic source models, the installation effects and the atmospheric propagation [15].
- Airframe noise, comprised of: clean/trailing edge noise and flap side edge noise (abbreviation: t.e.), leading edge noise (abbreviation: l.e.), main landing gear noise (abbreviation: m.g.), nose landing gear noise (abbreviation: n.g.);
- Engine tonal and broadband noise, comprised of: fan broadband noise (abbreviation: fan bb), fan tonal noise (abbreviation: fan t), jet noise (abbreviation: jet).
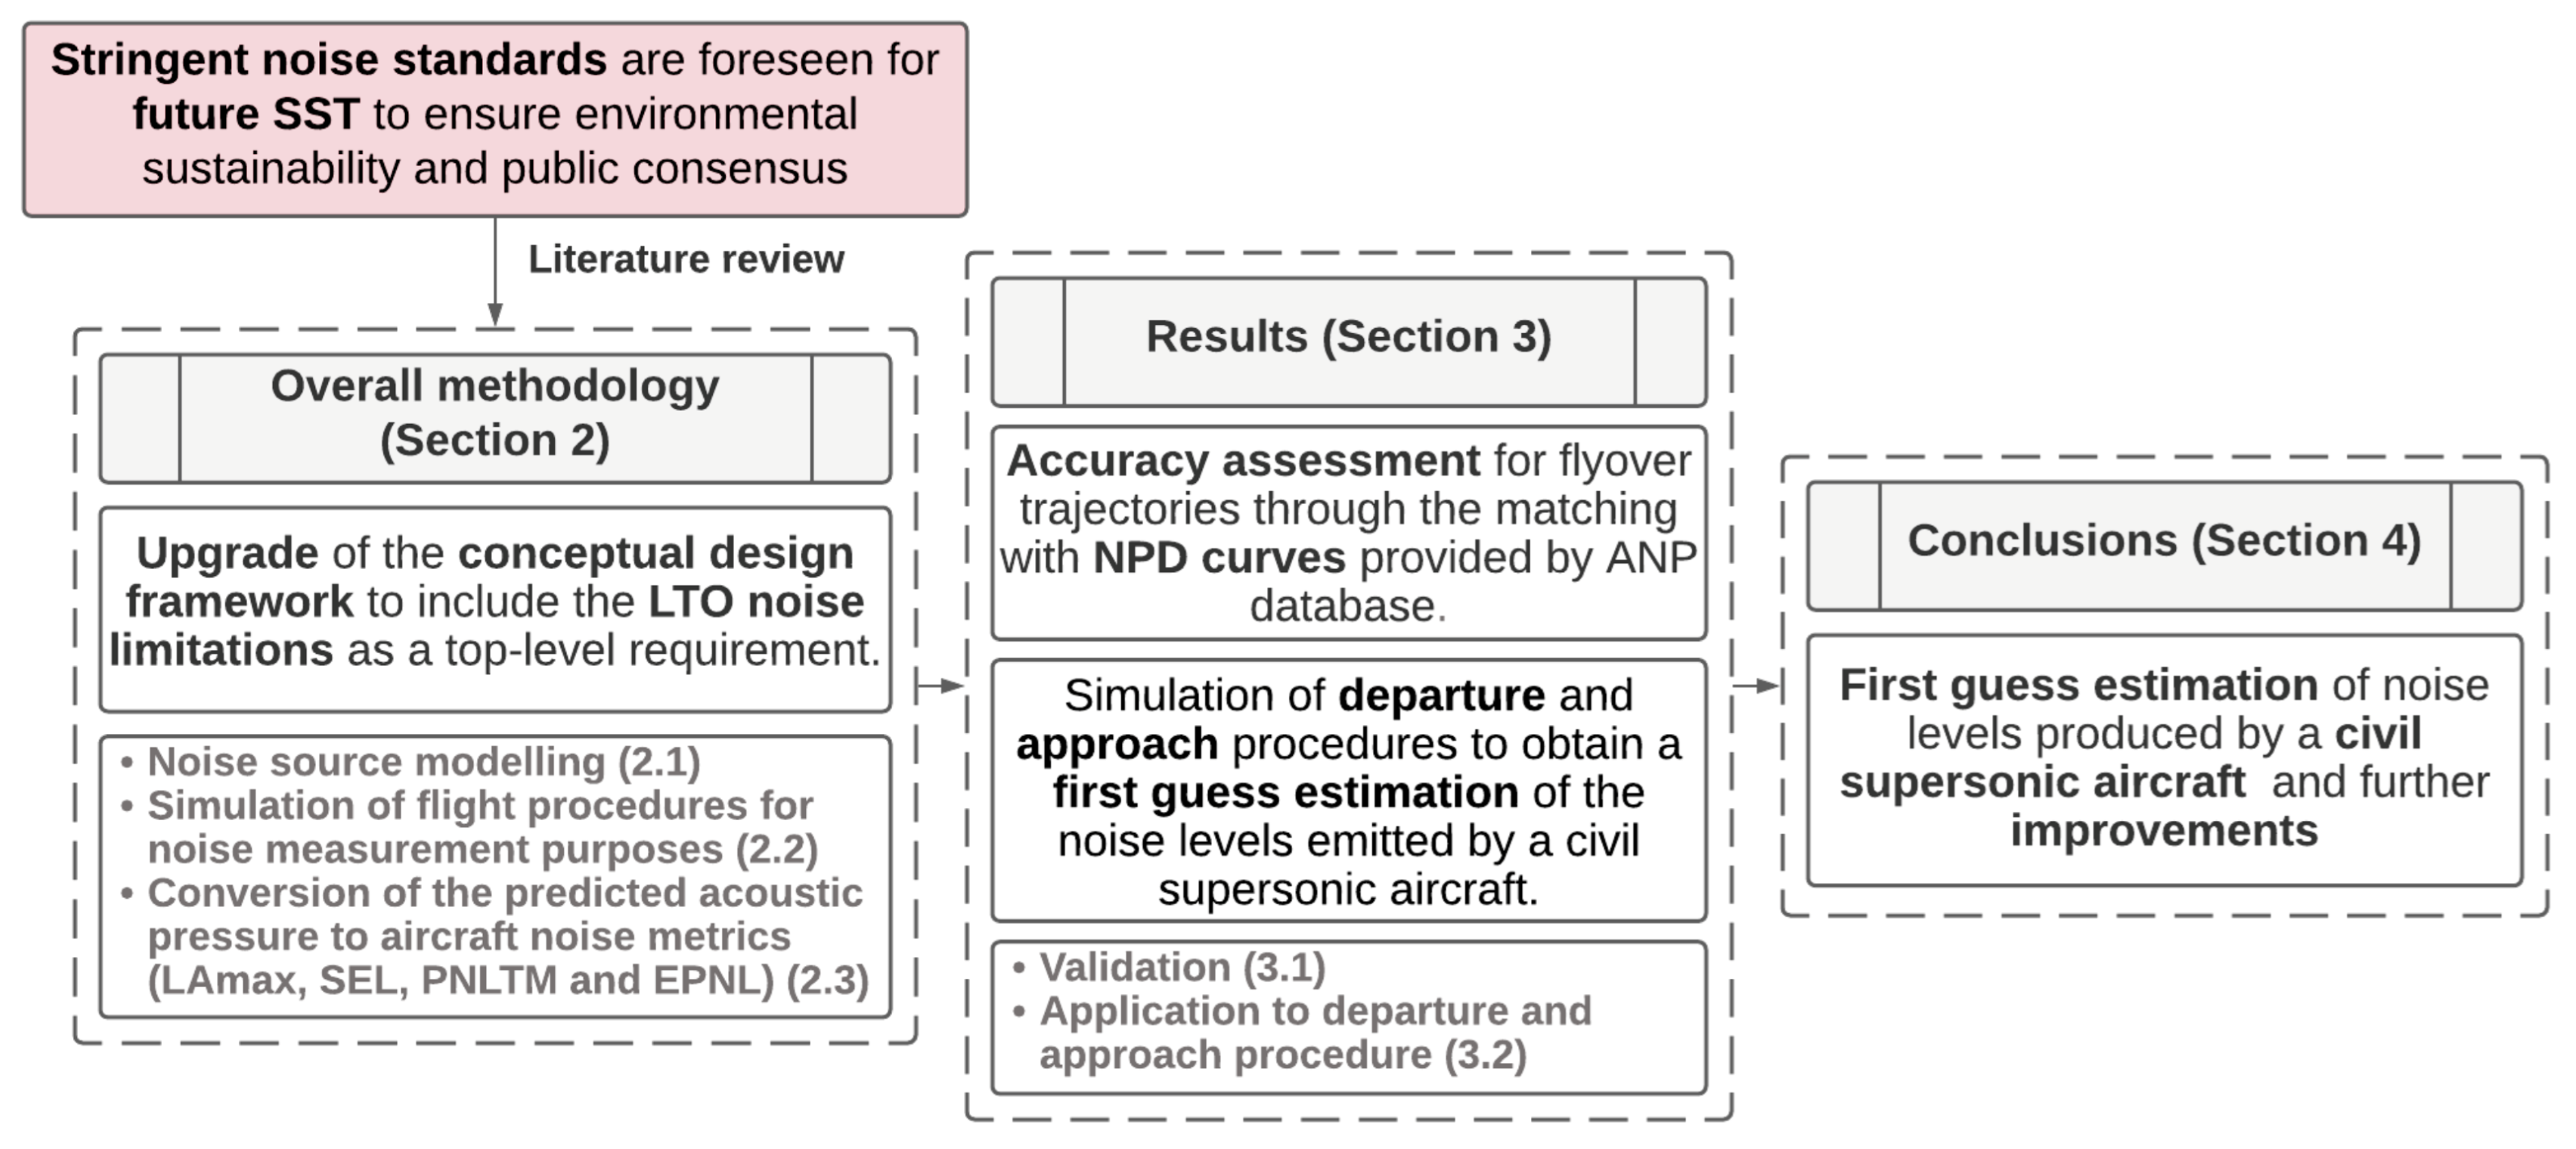
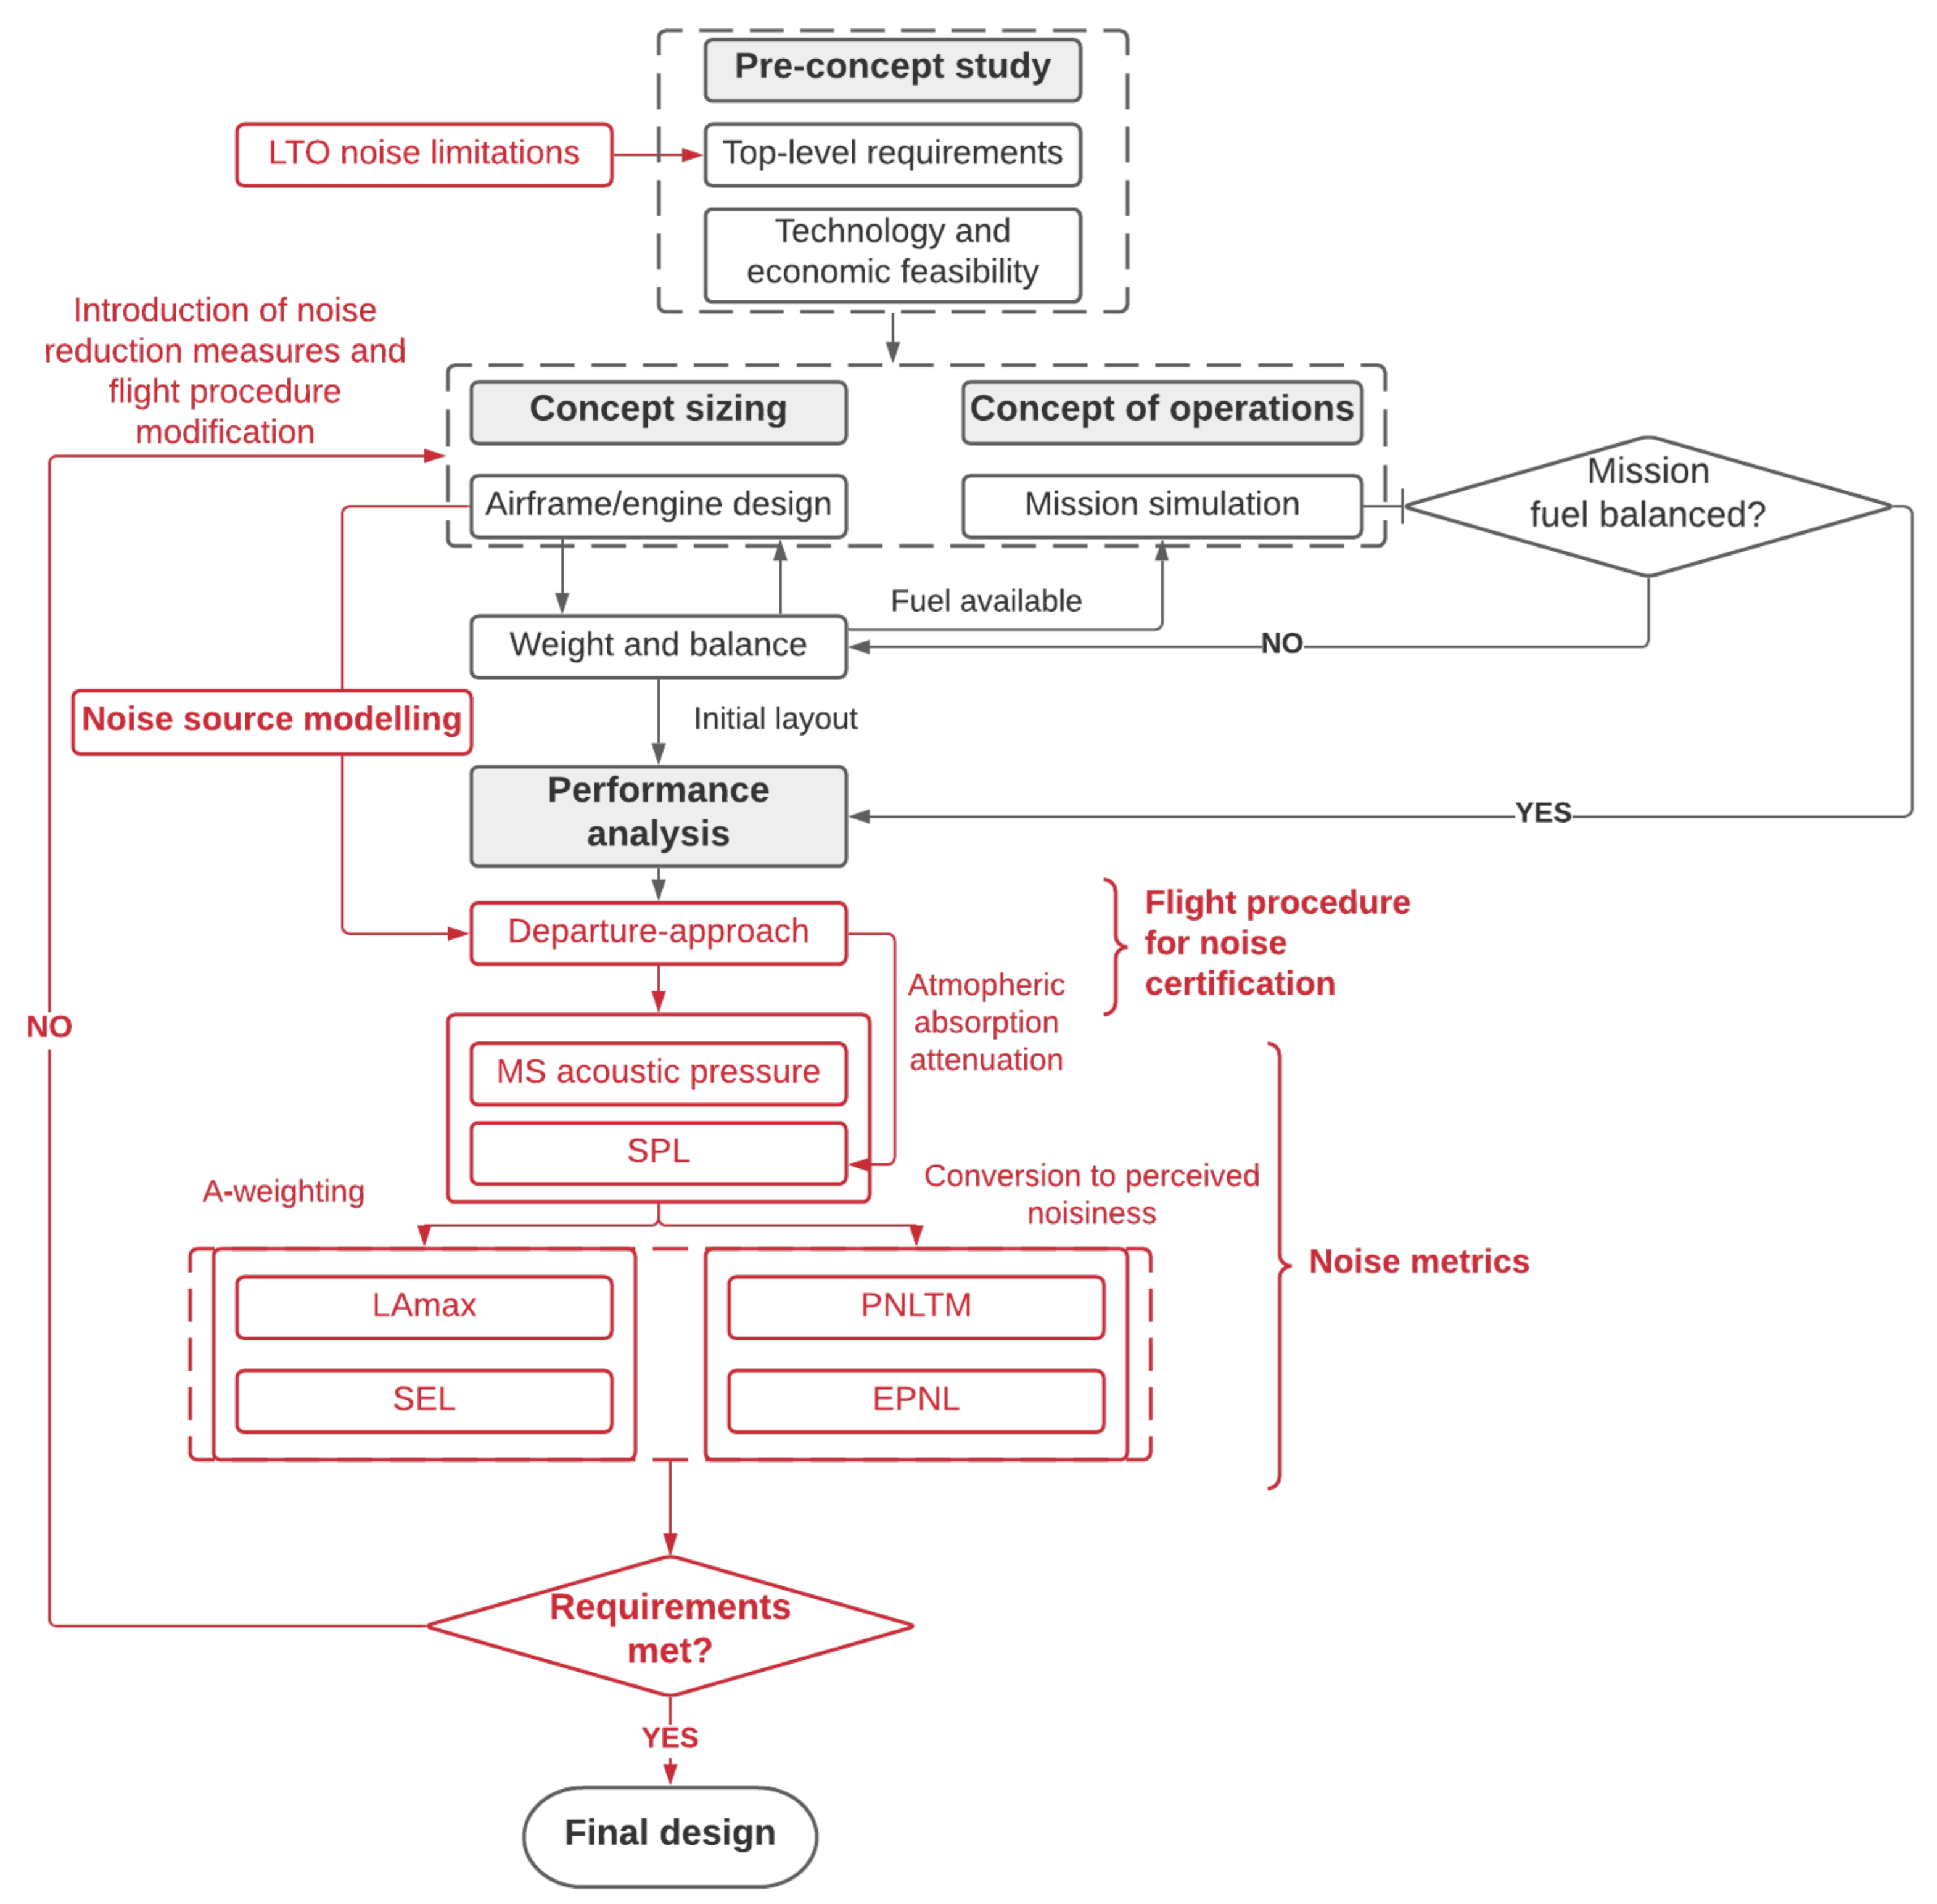
2. Overall Methodology
2.1. Noise Source Modelling
2.1.1. Airframe Noise
- : overall acoustic power, re ;
- : directivity function;
- : spectrum function;
- S: Strouhal number;
- : dimensionless distance from source to observer, re ;
- : wingspan of the aerodynamic surface;
- : spherical propagation factor;
- : Doppler factor accounting for the forward velocity effect;
- : aircraft Mach number;
- : polar directivity angle (deg);
- : azimuthal directivity angle (deg).
- K and a are constants determined from empirical data;
- G is a geometry function different for each airframe component and incorporated all geometrical effects on the acoustic power.
2.1.2. Engine Noise
- : dimensionless distance from the nozzle exit , referred to as ;
- and : fully expanded jet area, density, velocity and total temperature respectively, with all three quantities evaluated for the primary stream, and normalized by , , and ;
- : modified directivity angle, ;
- : directivity function;
- : spectral distribution function;
- : forward flight effects factor;
- and : configuration factors;
- : jet mixing noise Strouhal number;
- : empirical function of .
- Noise emitted from the fan or compressor inlet duct (broadband noise, discrete-tone noise, combination-tone noise);
- Noise emitted from the fan discharge duct (broadband noise, discrete-tone noise).
- : mass flow rate, re ;
- : total temperature rise across fan, re ;
- : relative tip Mach number;
- : defined as , where is the fan rotor relative tip Mach number at design point;
- : rotor-stator spacing, re C (mean rotor blade chord);
- : empirical constants and factors depending on geometry and configuration.
- Inlet broadband noise
- Inlet rotor-stator interaction tones
- Inlet flow distortion tones
- Combination tone noisewith for 1/8 fundamental combination tone, for 1/4 fundamental combination tone and for 1/2 fundamental combination tone.
- Discharge broadband noise:
- Discharge rotor-stator interaction tones:
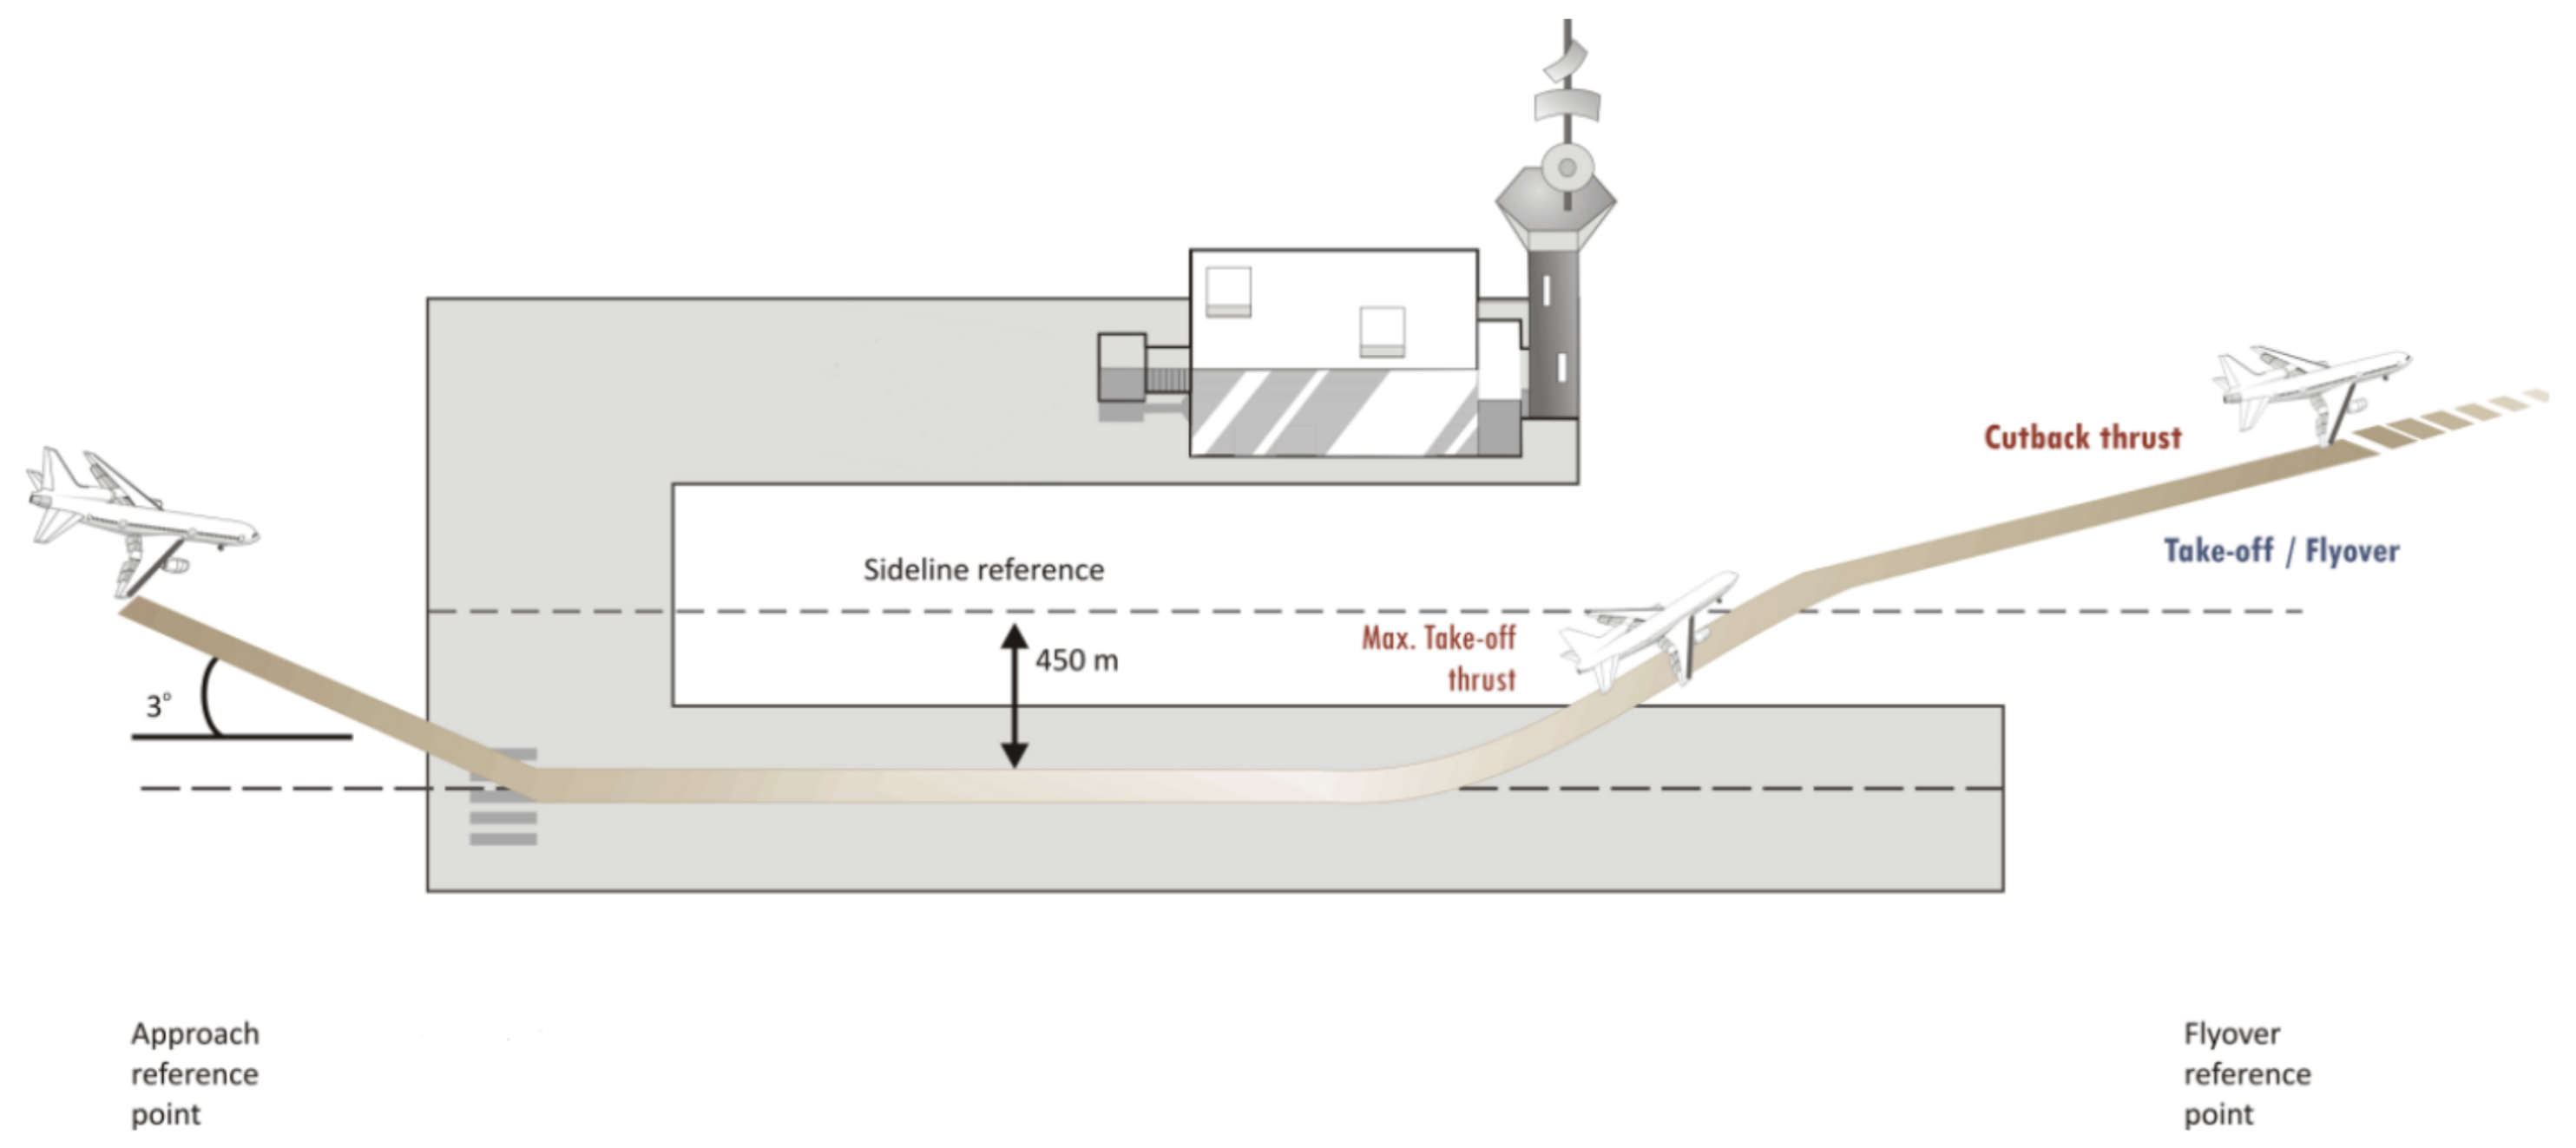
2.2. Flight Procedure for Noise Certification
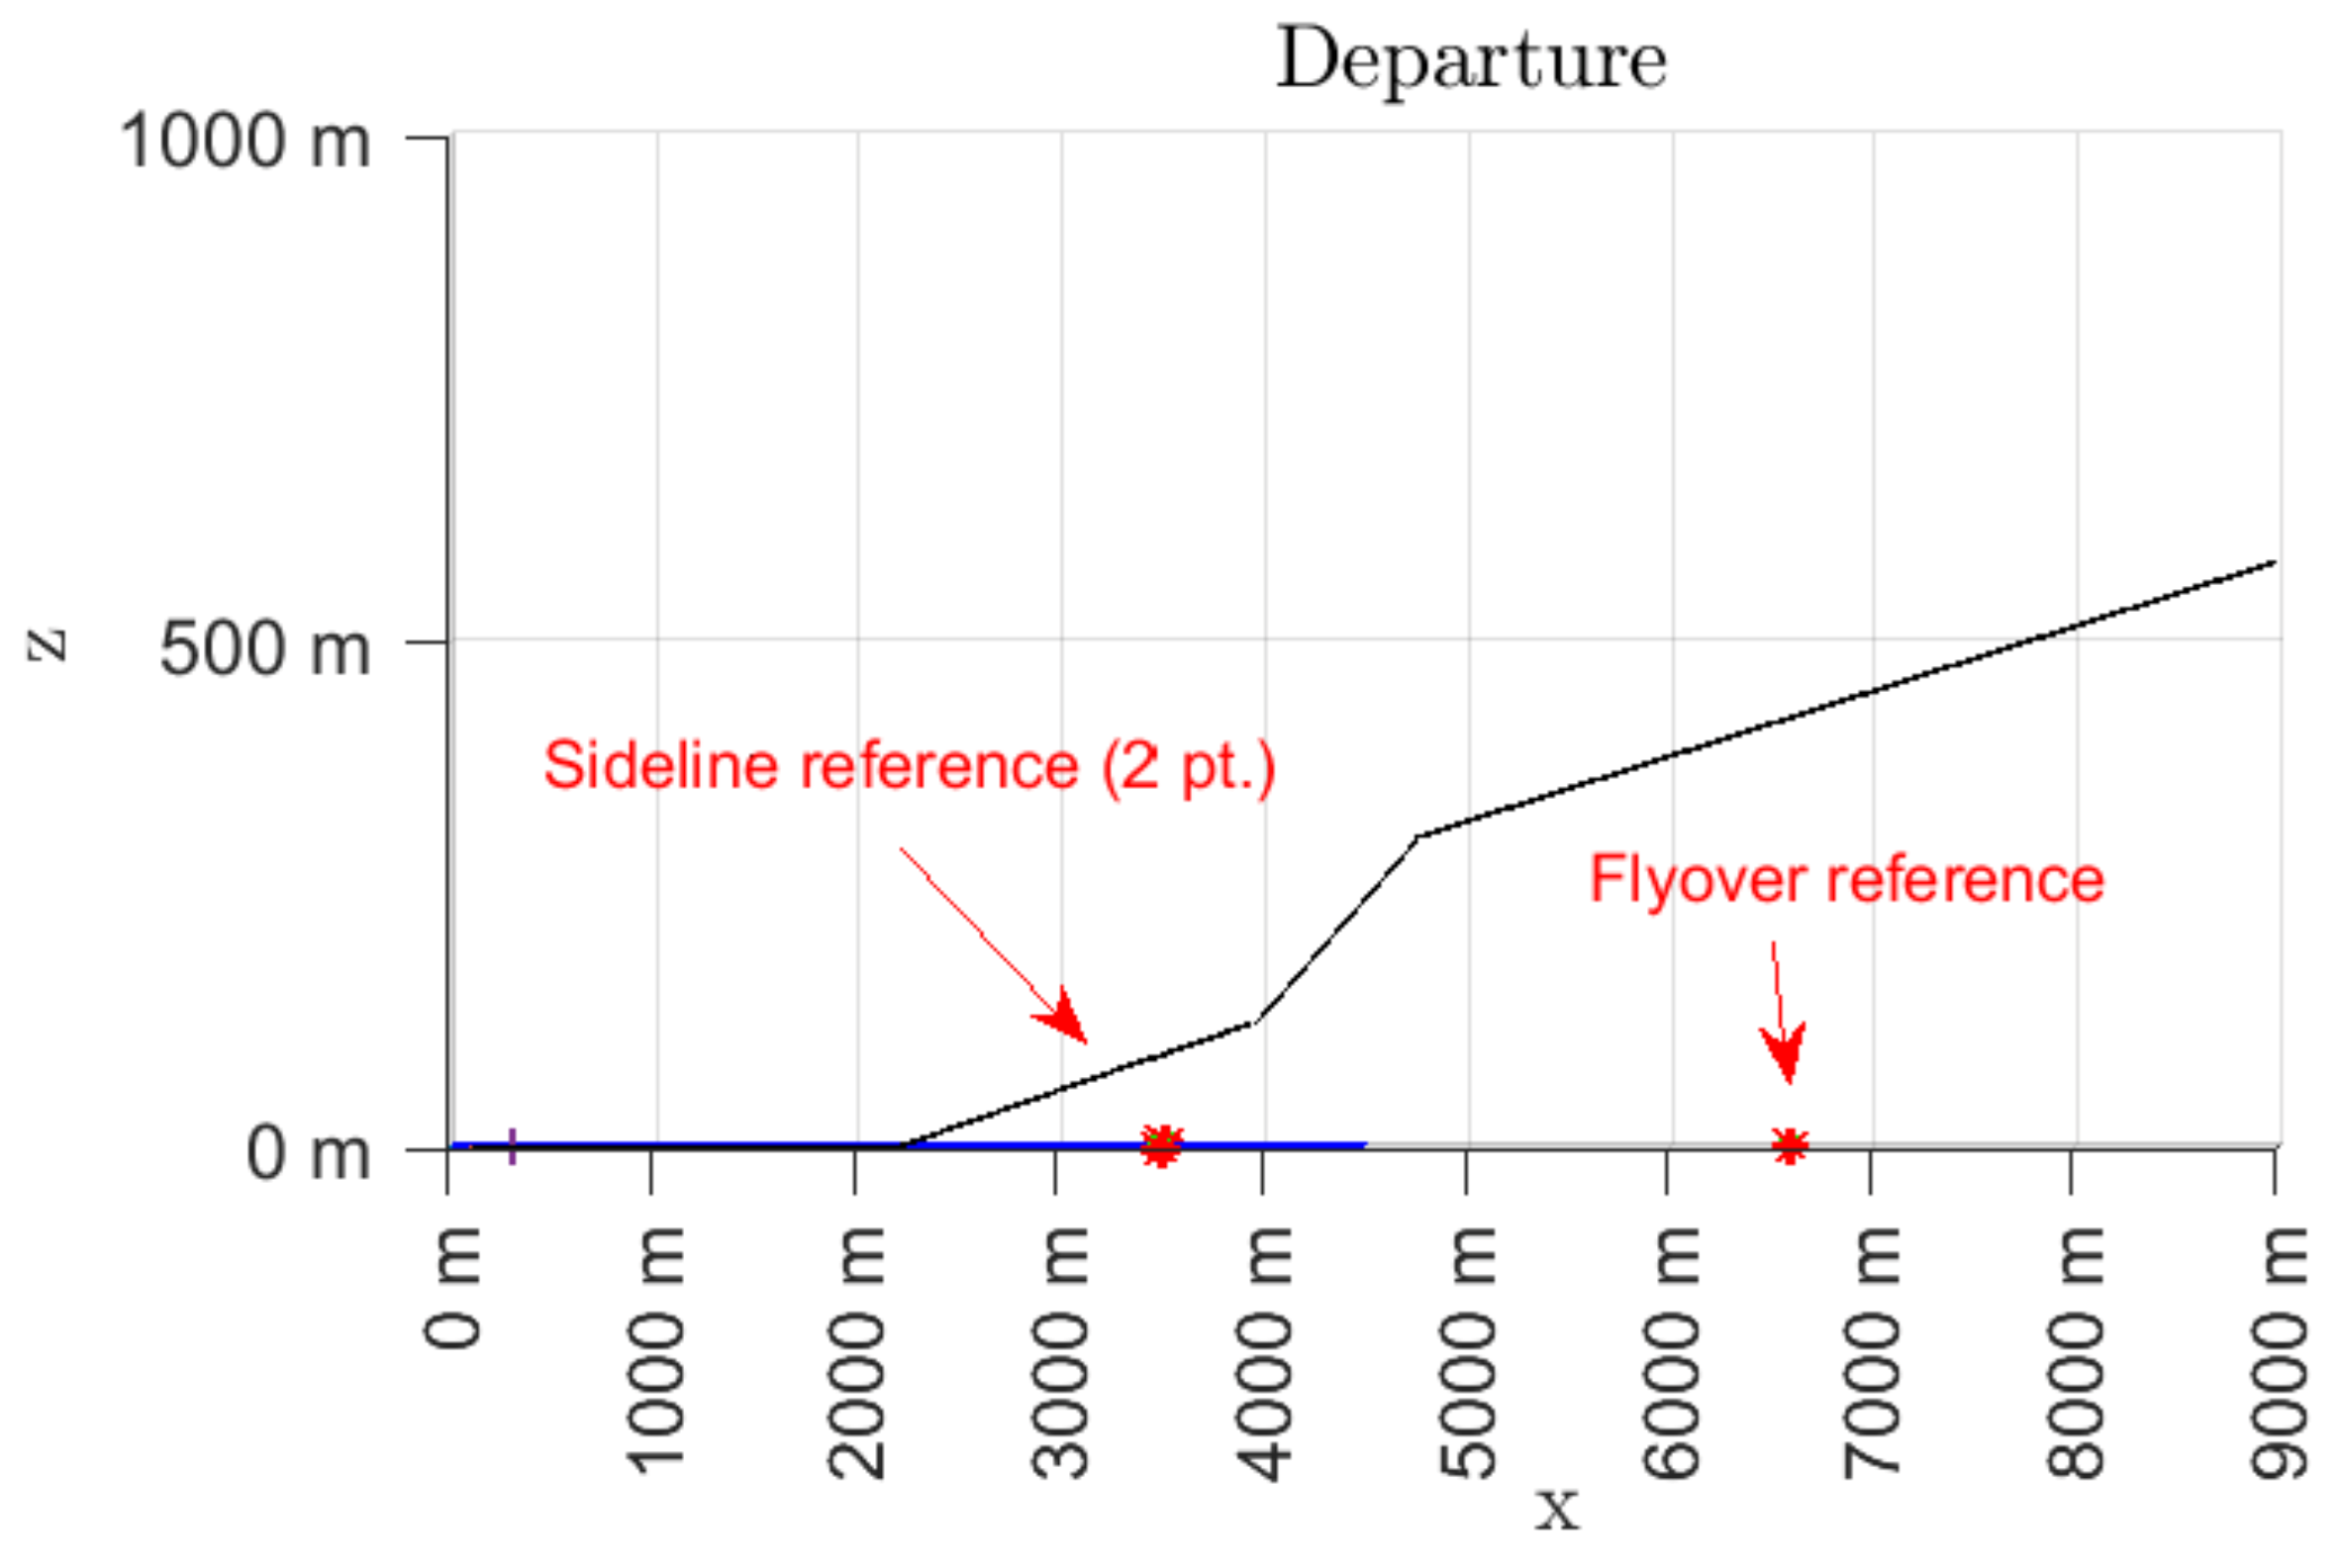
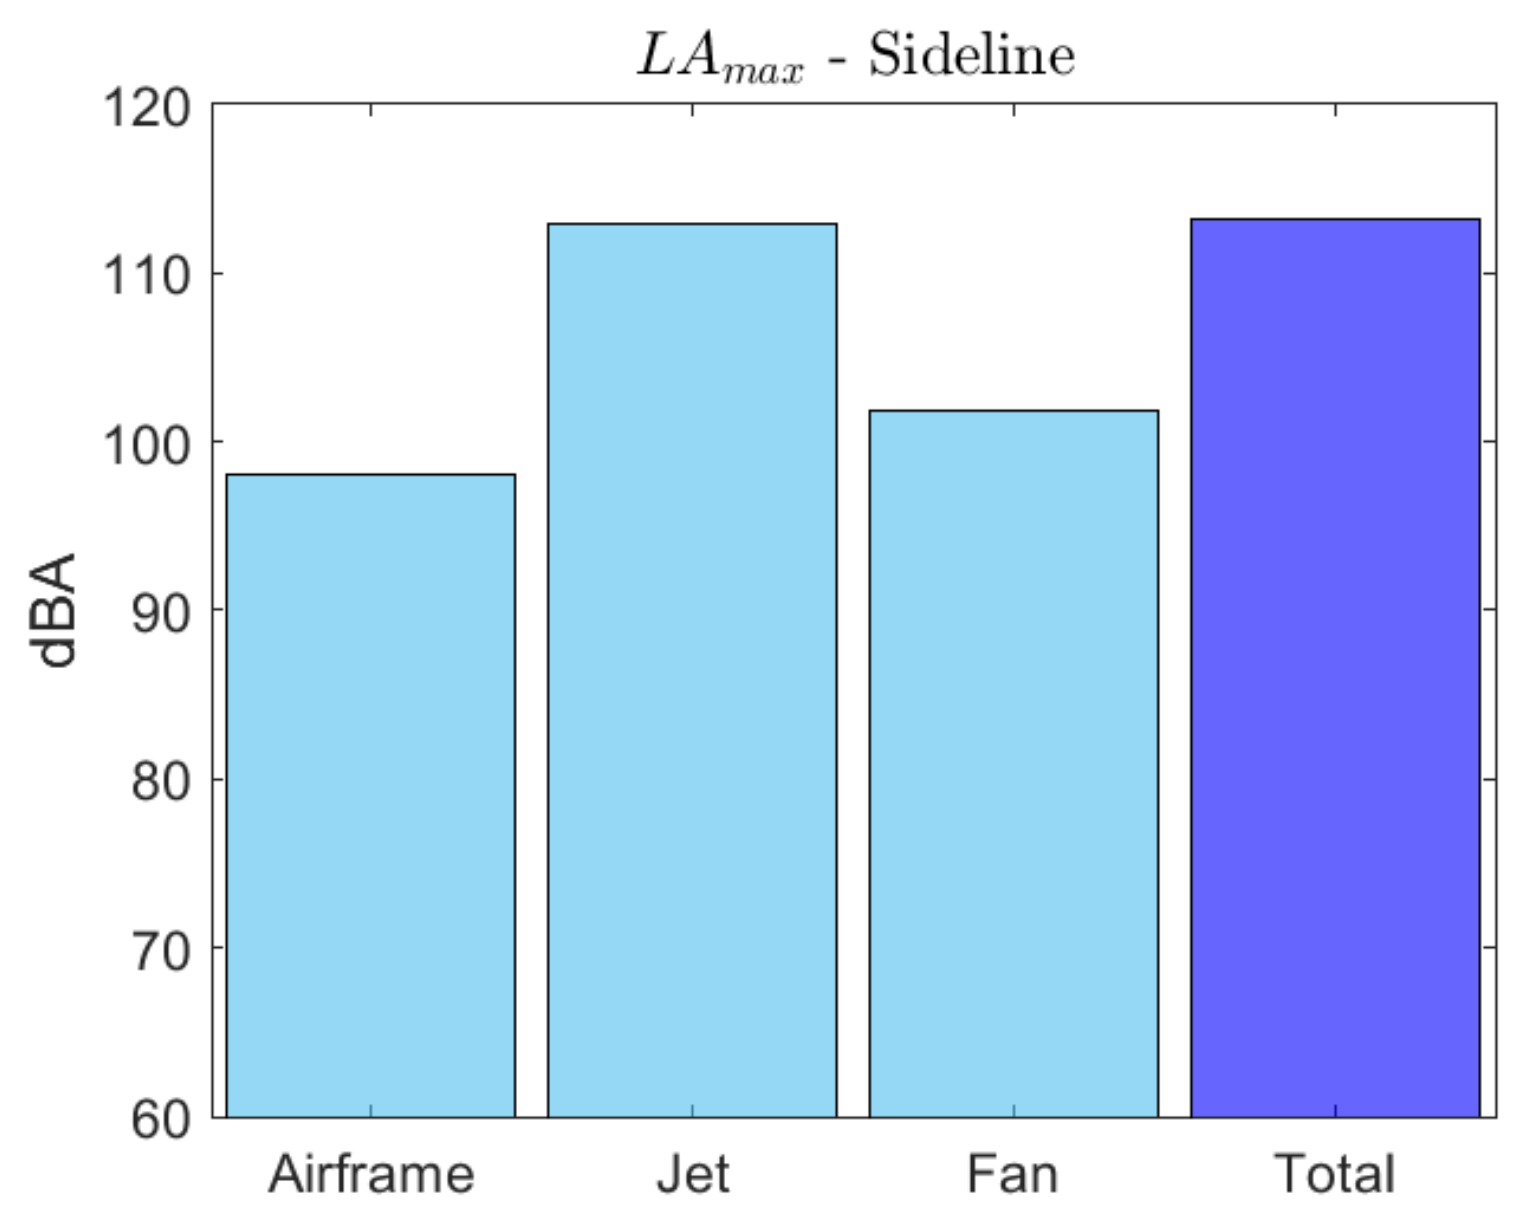
- Sideline-maximum power condition: the measurement point is along the line parallel to the axis of the runaway centre line at 450 m, where the noise level is maximum during take-off. This operating condition corresponds to the so-called sideline measurement, which is the maximum sound level reached along the lateral full-power line;
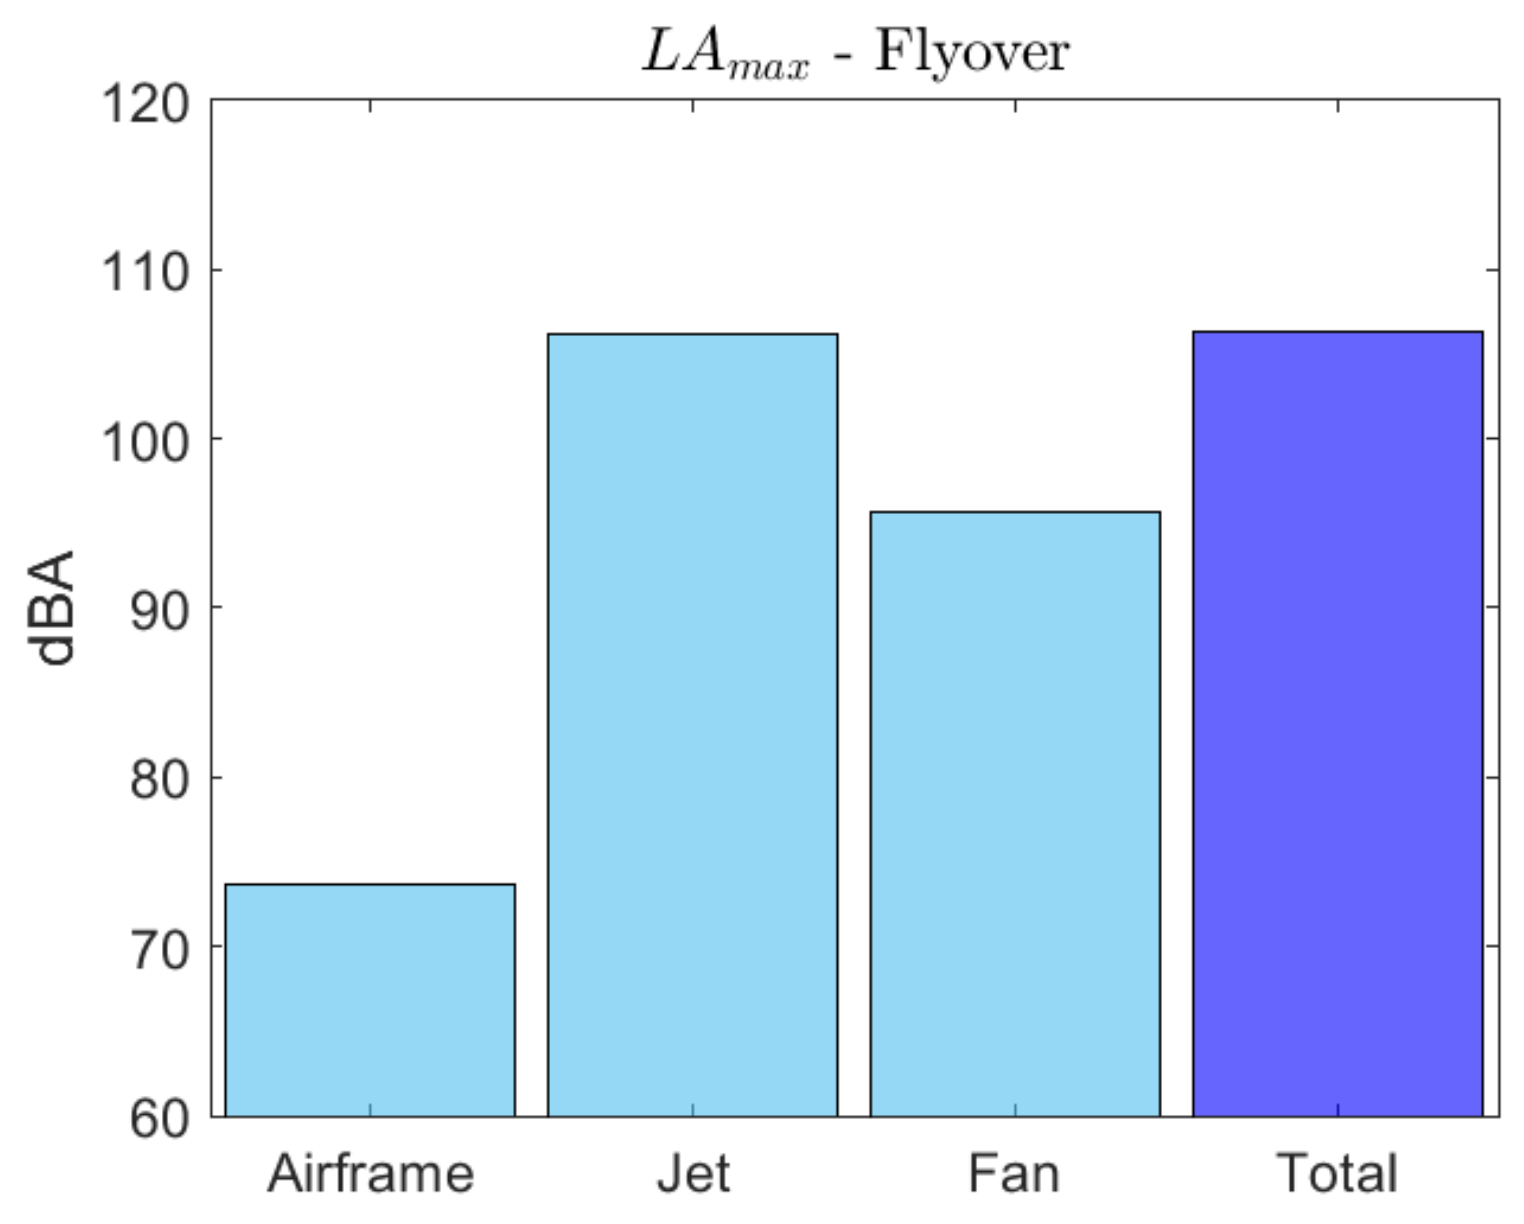
- Flyover-intermediate power condition: the measurement point is along the extended runaway centre line at 6500 m from the start to roll;
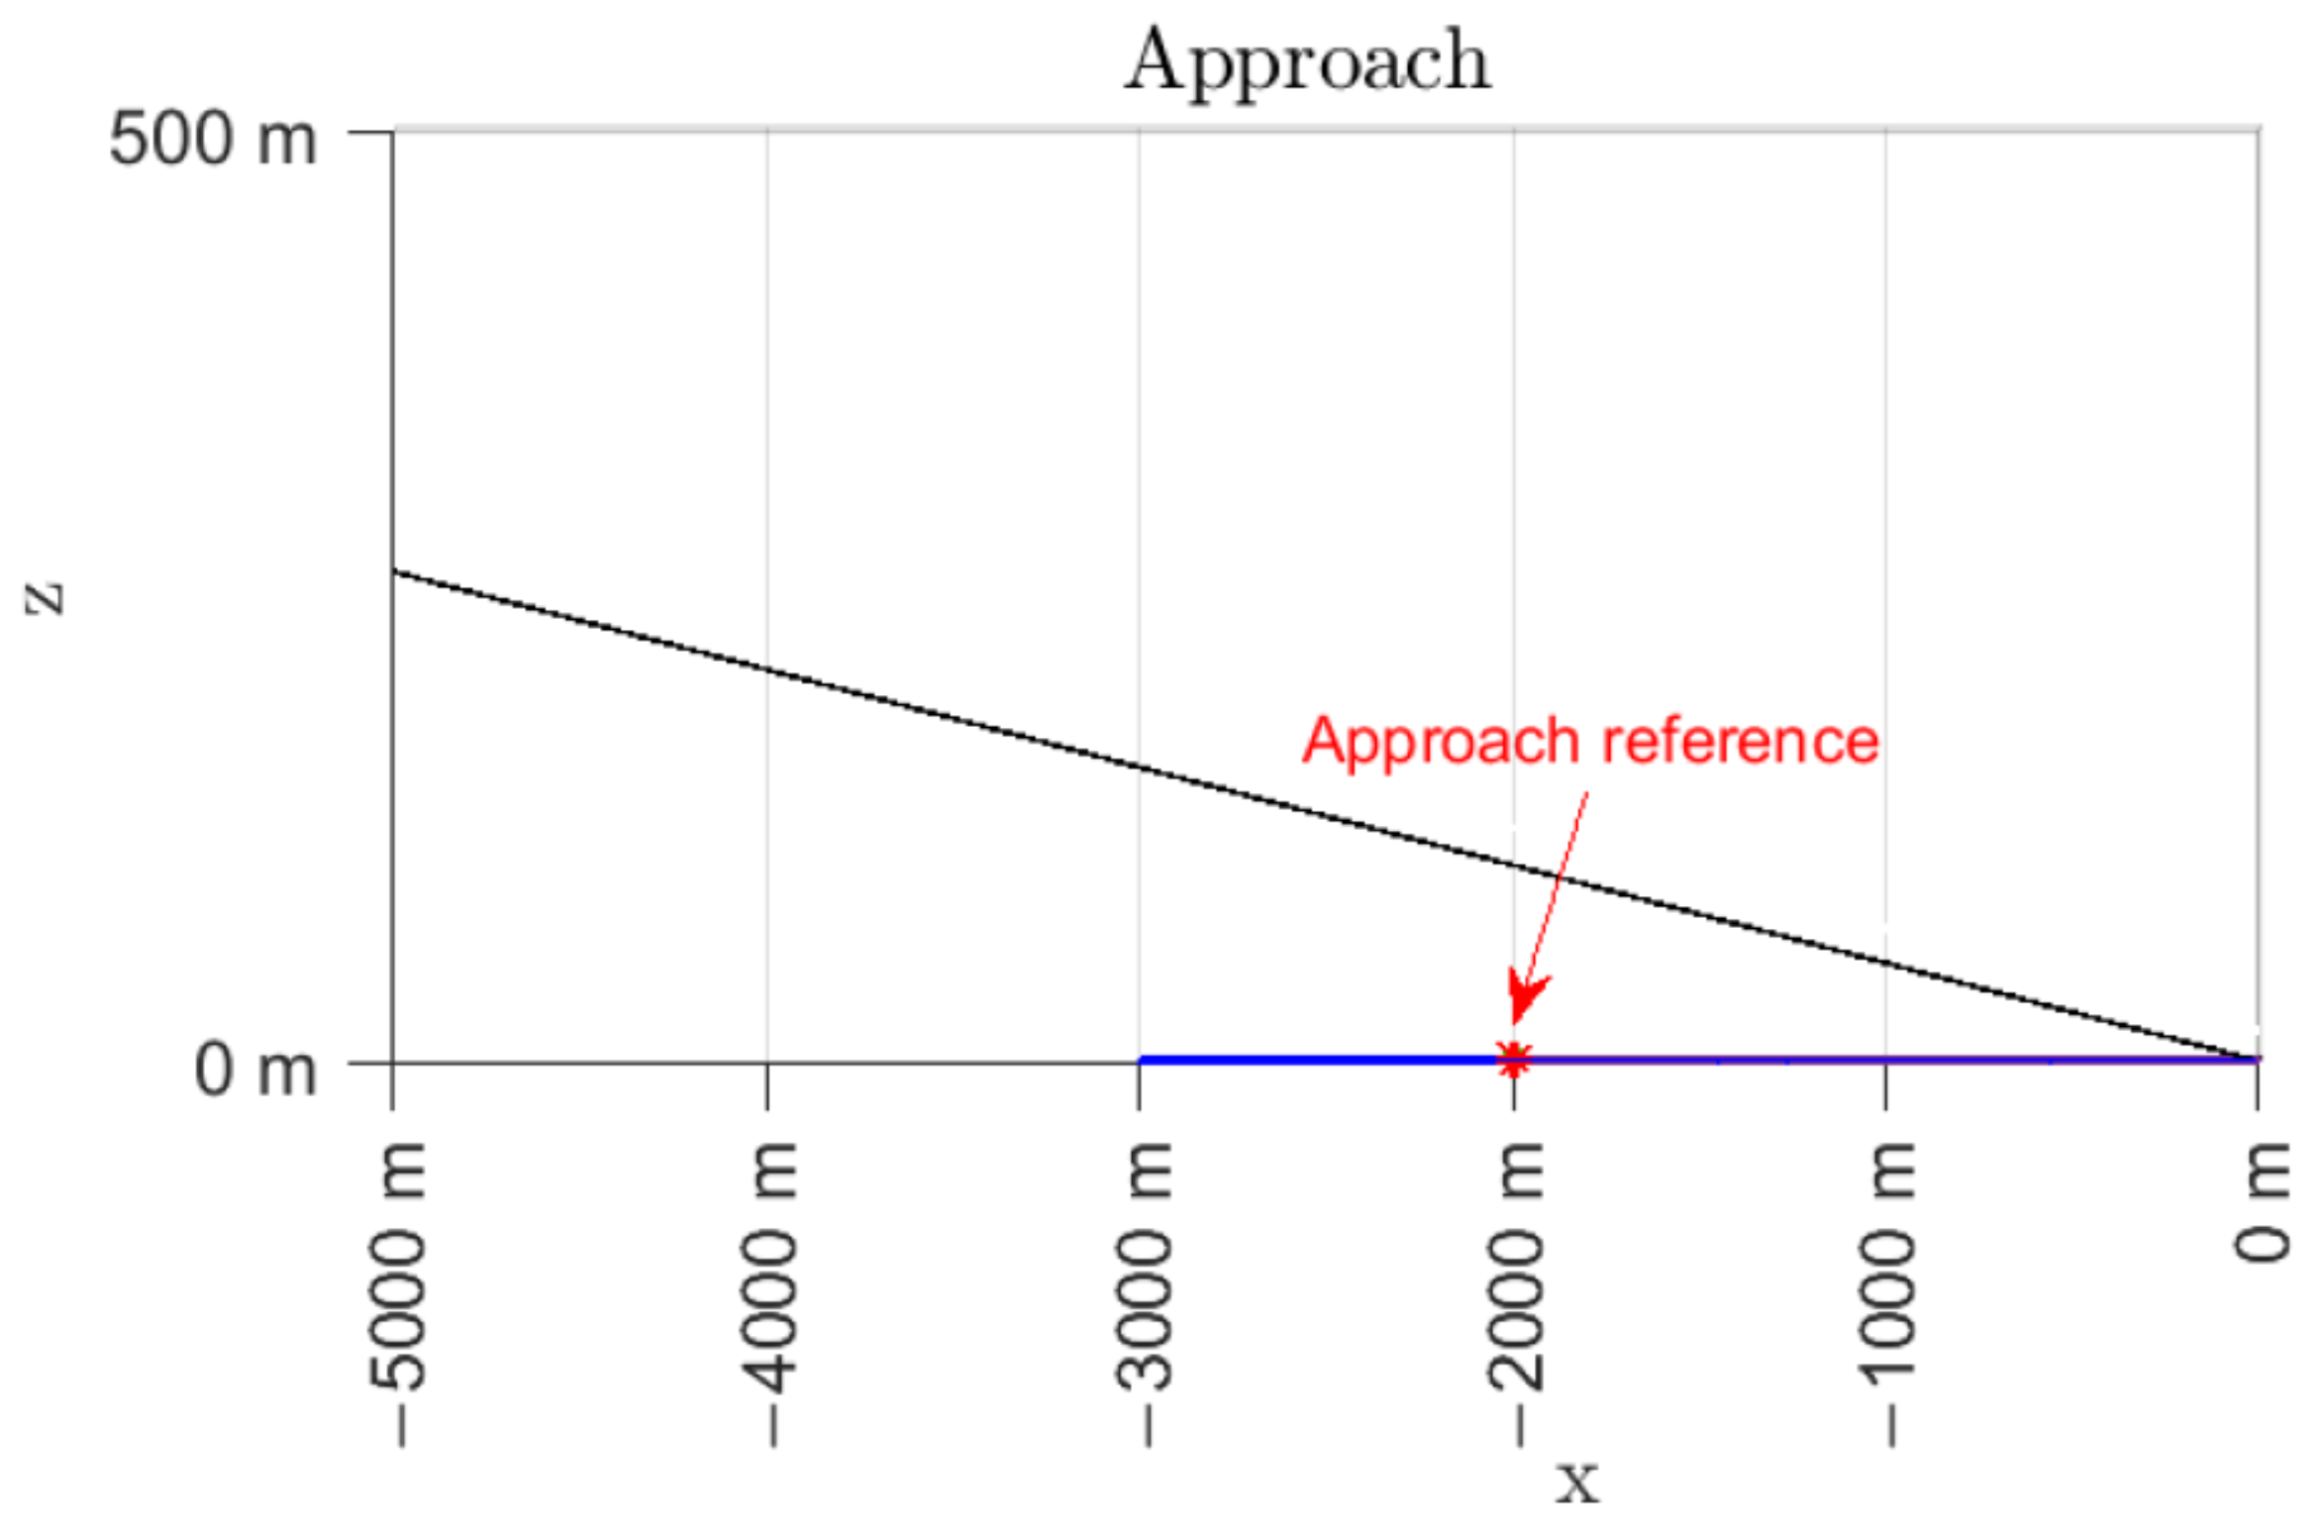
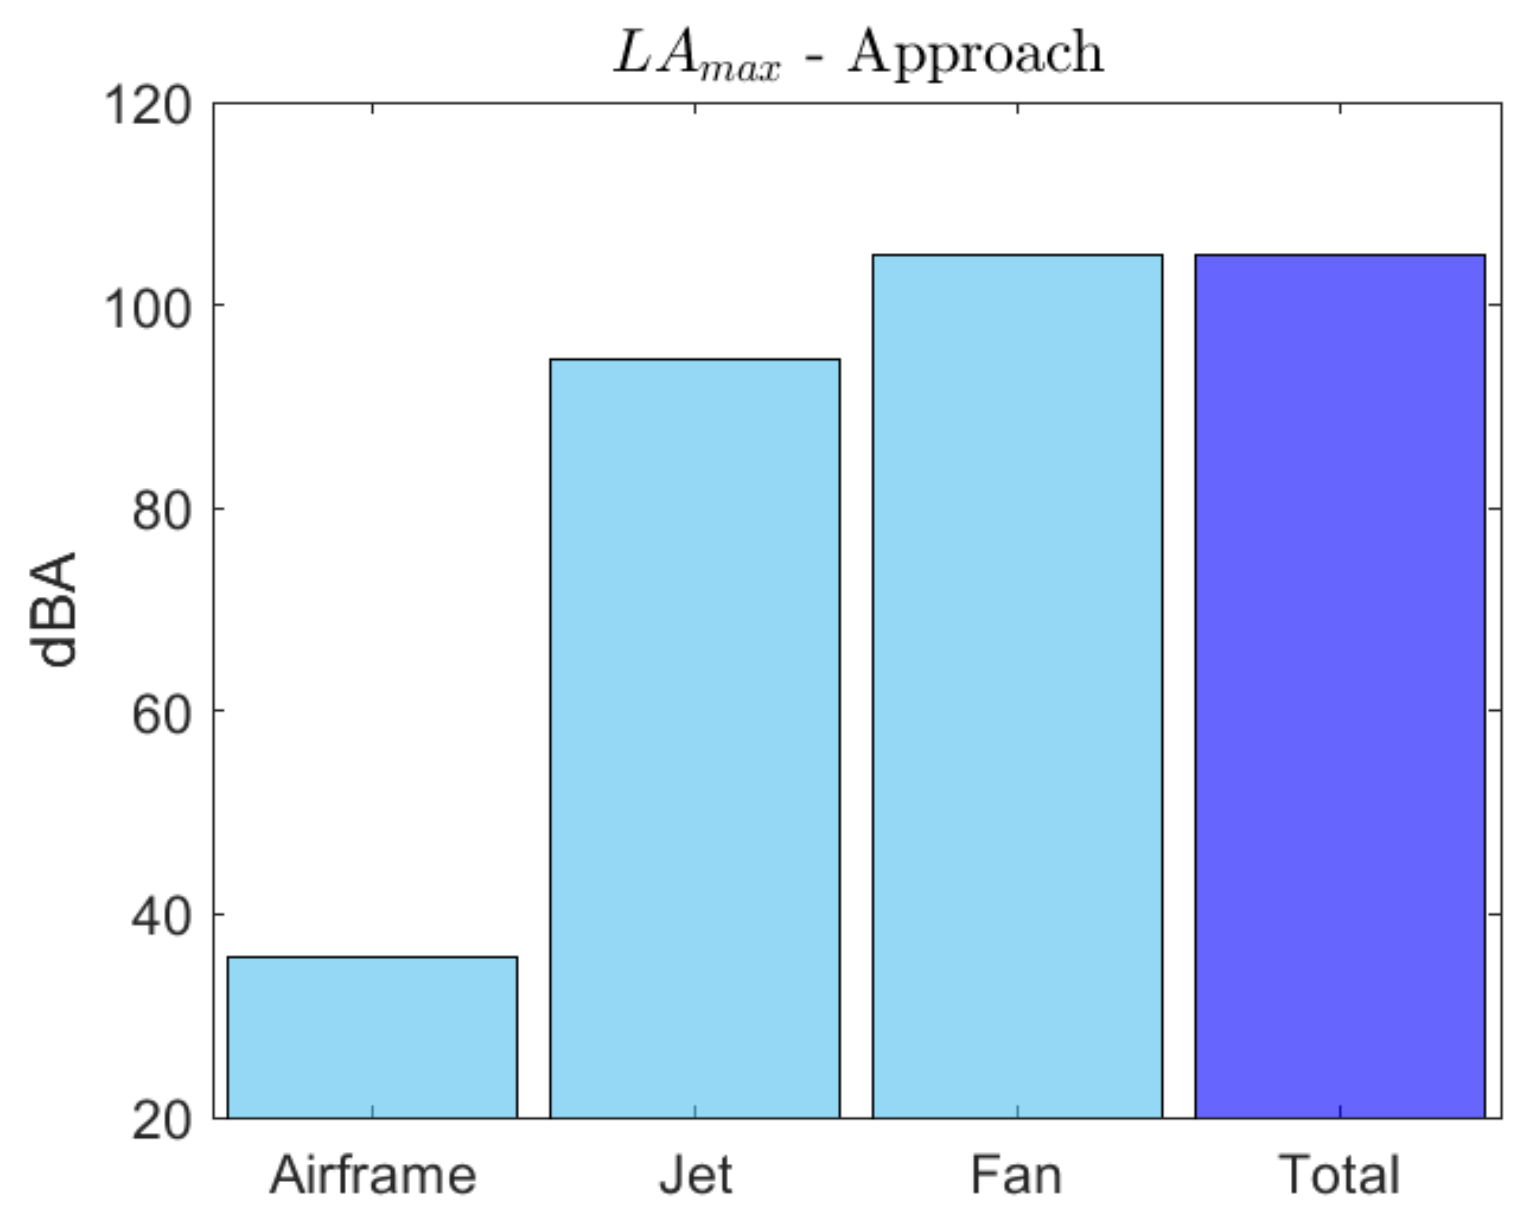
- Approach-low power condition: the measurement point is 120 m vertically below the descent path originating from a point 300 m beyond the threshold.
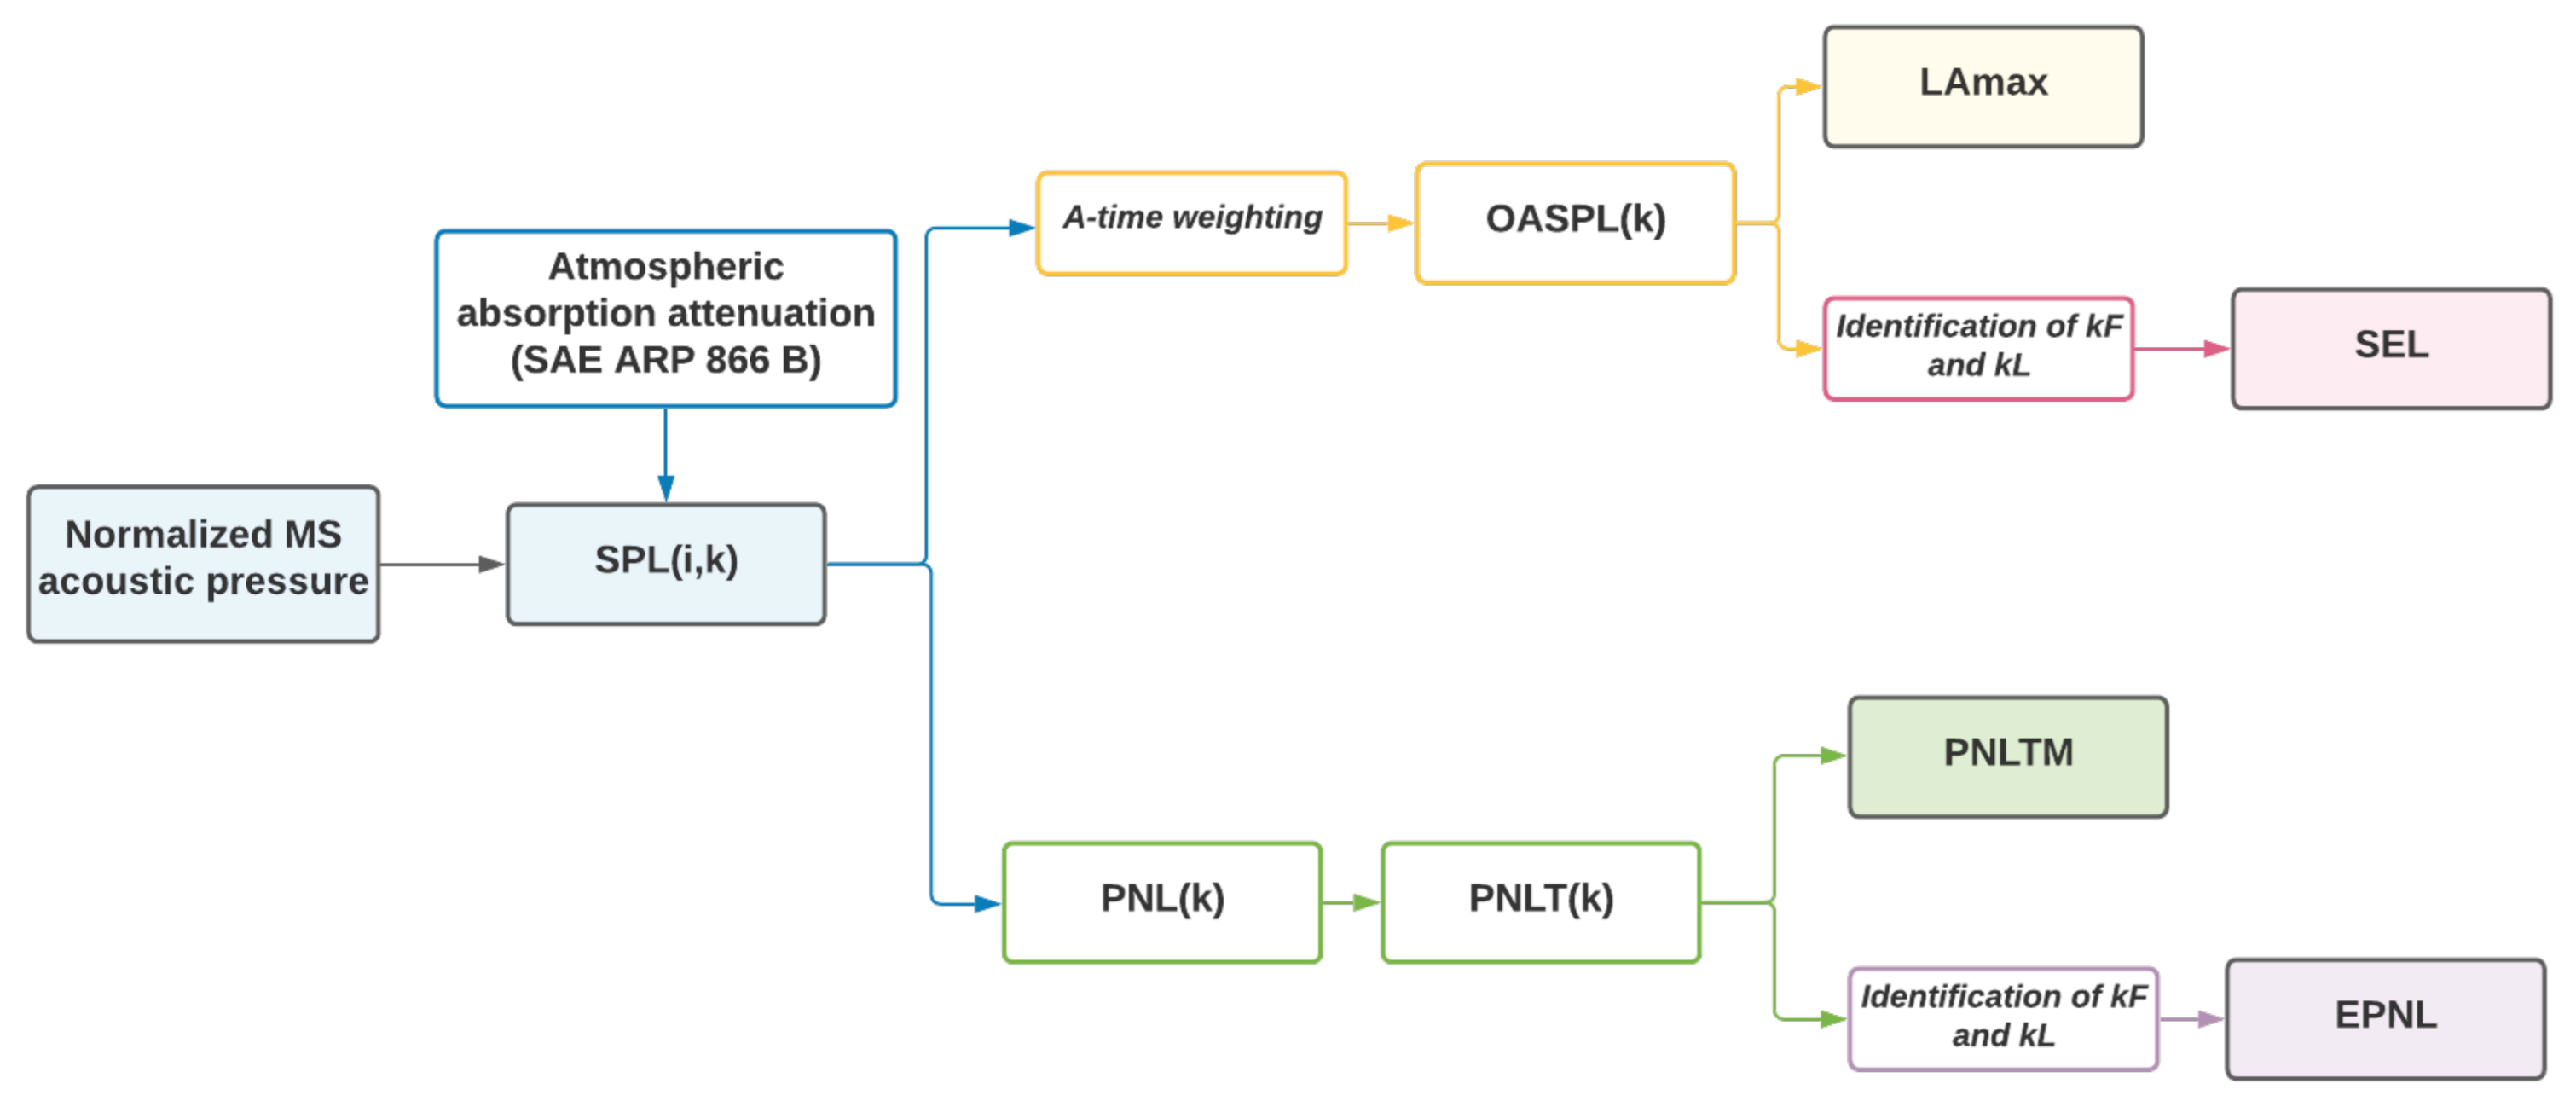
2.3. Noise Metrics
- Single event (or instantaneous) metrics: used to provide a description of noise occurring during one noise event, accounting for sound amplitude only;
- Exposure (or integral) metrics: used to provide a description of the type of noise exposure experienced over a given interval of time;
- Supplementary metrics: measurements often used in conjunction with the above, to provide a more meaningful depiction of the potential impact of noise exposure.
3. Results
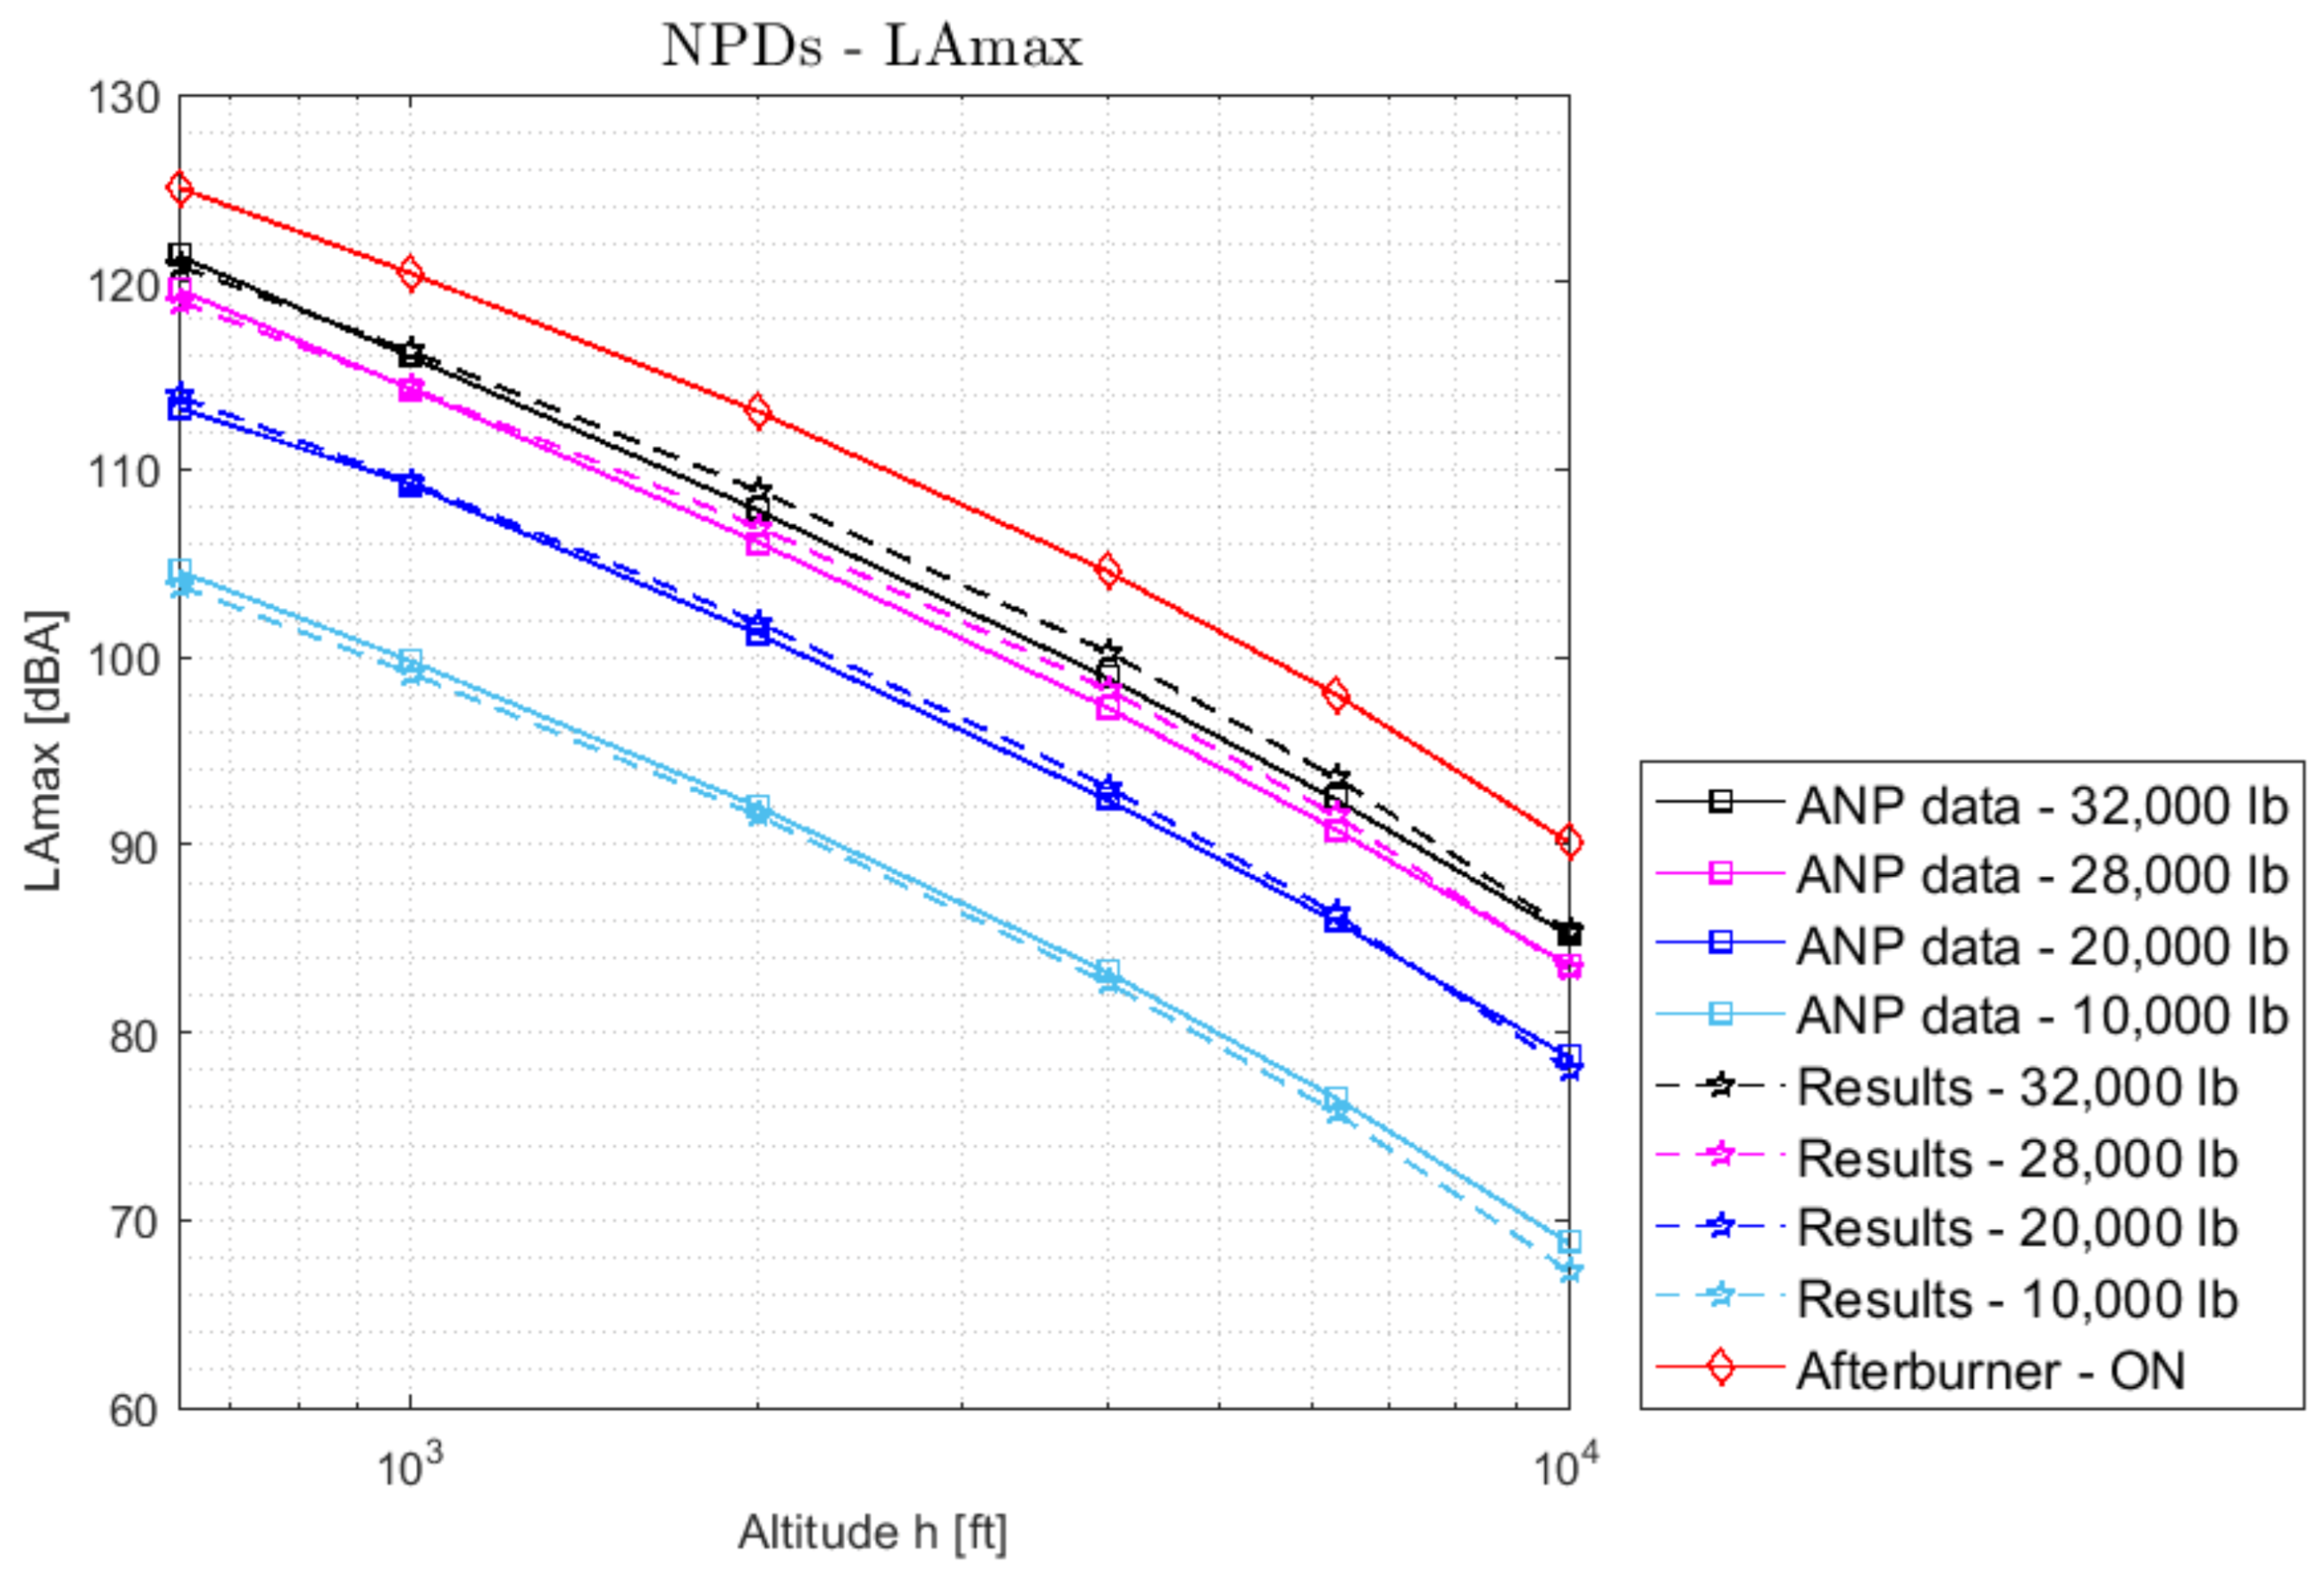
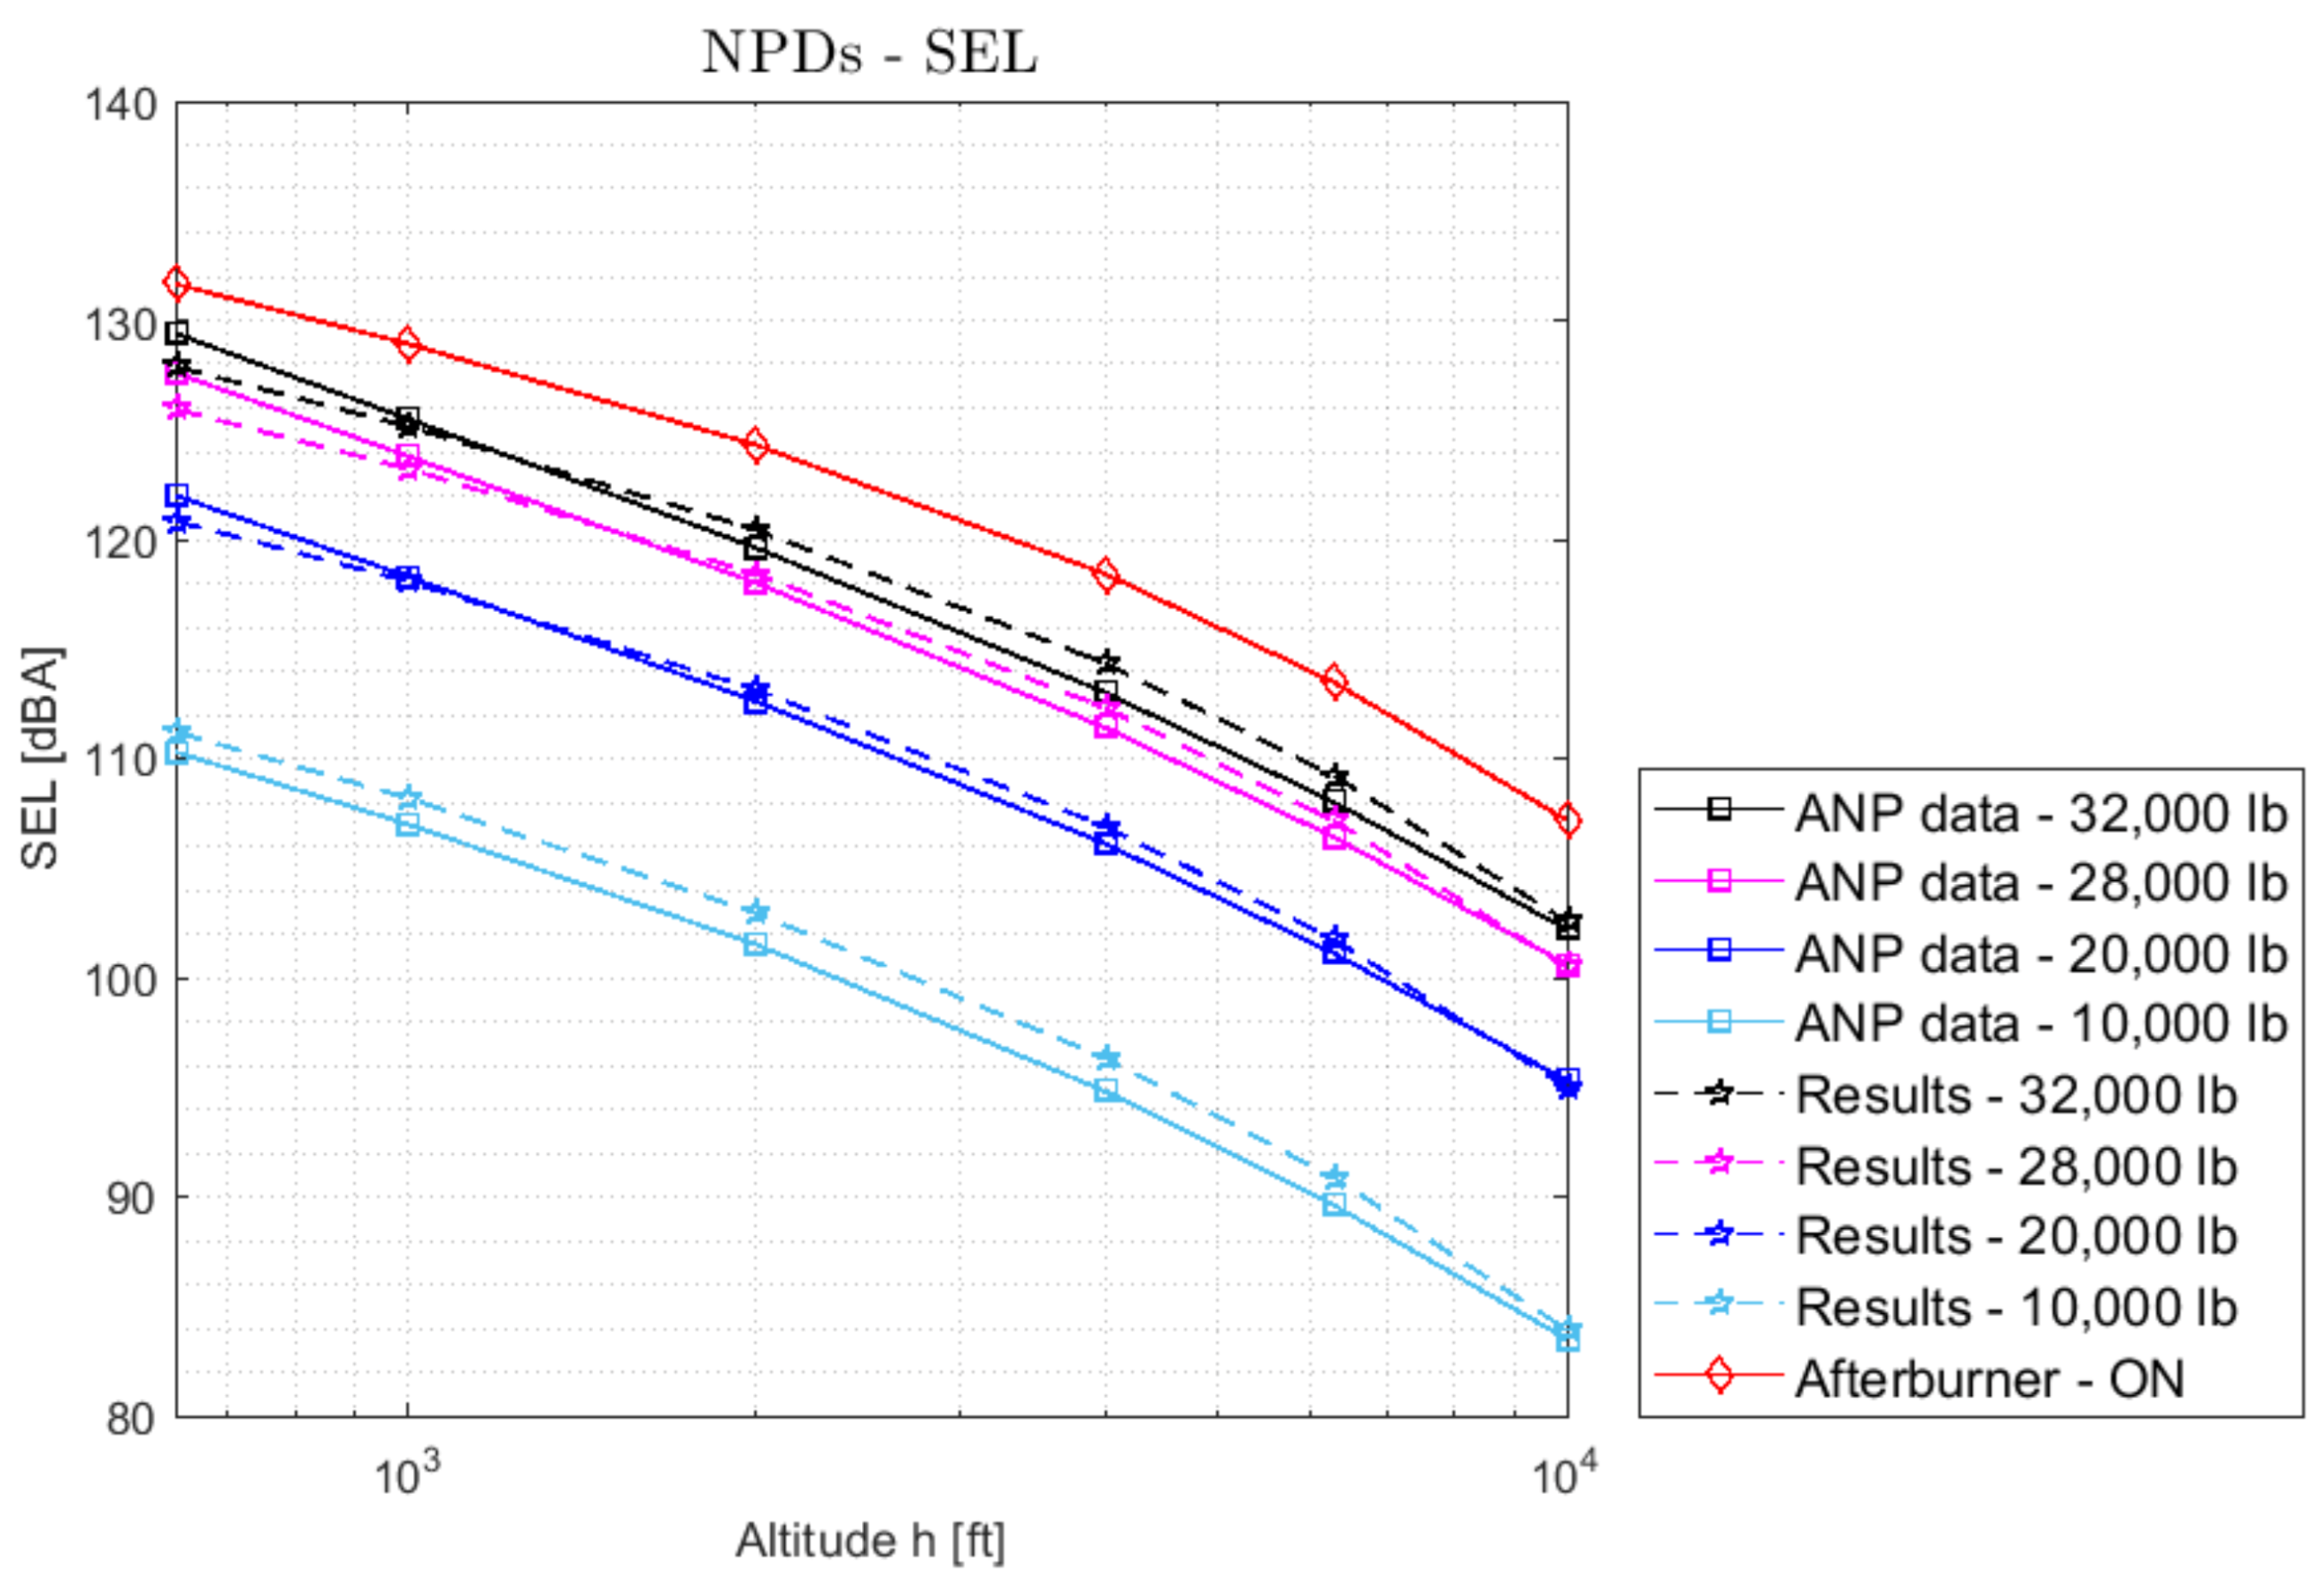
3.1. Validation
3.2. Application to Departure and Approach Procedures
- Sideline-full power:
- Flyover-intermediate power:
- Approach-low power condition:
4. Conclusions
Author Contributions
Funding
Data Availability Statement
Conflicts of Interest
Abbreviations
| ANOPP | Aircraft NOise Prediction Program |
| ANP | Aircraft Noise and Perfomance database |
| CAEP | Committee on Aviation Environmental Protection |
| DLR | German Aerospace Laboratory |
| EPNL | Effective Perceived Noise Level |
| EU | European Union |
| FAA | Federal Aviation Administration |
| FRSF | Frequency Response Scale Factor |
| ICAO | International Civil Aviation Organization |
| LAmax | A-weighted Sound Pressure Level |
| LTO | Landing and Take-Off |
| MORE&LESS | MDO and REgulations for Low-boom and |
| Environmentally Sustainable Supersonic aviation | |
| MTOM | Maximum Take-Off Mass |
| NASA | National Aeronautics and Space Administration |
| NPD | Noise Power Distance |
| OASPL | Overall Sound Pressure Level |
| ONERA | French Aeronautics and Space Research Center |
| PANAM | Parametric Aircraft Noise Analysis Module |
| PNL | Perceived Noise Level |
| PNLTM | Maximum Tone Corrected Perceived Noise Level |
| SAE | Society of Automotive Engineers |
| SARPs | Standard and Recommended Practices |
| SCR | Supersonic Cruise Research |
| SEL | Sound Exposure Level |
| SPL | Sound Pressure Level |
| SST | SuperSonic Transport |
| SAE | Society of Automotive Engineers |
| SARPs | Standard and Recommended Practices |
| SCR | Supersonic Cruise Research |
| SEL | Sound Exposure Level |
| SPL | Sound Pressure Level |
| SST | SuperSonic Transport |
References
- ICAO. Destination Green: The Next Chapter. In Environmental Report; ICAO: Montreal, QC, Canada, 2019. [Google Scholar]
- Hardeman, A.; Maurice, L. Sustainability: Key to enable next generation supersonic passenger flight. IOP Conf. Ser. Mater. Sci. Eng. 2021, 1024, 012053. [Google Scholar] [CrossRef]
- Antoine, N.E.; Kroo, I.M. Aircraft Optimization for Minimal Environmental Impact. J. Aircr. 2004, 41, 790–797. [Google Scholar] [CrossRef] [Green Version]
- X-59 QueSST (Quiet SuperSonic Technology)-Silencing the Sonic Boom. Available online: https://www.lockheedmartin.com/en-us/products/quesst.html (accessed on 25 October 2021).
- Boom Supersonic-Overture. Available online: https://boomsupersonic.com/overture (accessed on 25 October 2021).
- SENECA-LTO noiSe and EmissioNs of supErsoniC Aircraft. Available online: https://seneca-project.eu/ (accessed on 25 October 2021).
- RUMBLE-RegUlation and norM for Low Sonic Boom LEvels. Available online: https://rumble-project.eu/i/project/project-overview (accessed on 25 October 2021).
- Drake, F.; Purvis, M. The effect of supersonic transports on the global environment: A debate revisited. Sci. Technol. Hum. Values 2001, 26, 501–528. Available online: http://www.jstor.org/stable/690166 (accessed on 25 October 2021). [CrossRef]
- Tang, R.Y.; Elias, B.; Luther, L.; Morgan, D. Supersonic Passenger Flights. 2018. Available online: https://sgp.fas.org/crs/misc/R45404.pdf (accessed on 25 October 2021).
- ICAO-Supersonic Aircraft Noise Standards Development. Available online: https://www.icao.int/environmental-protection/pages/Supersonic-Aircraft-Noise-Standards-Development.aspx (accessed on 25 October 2021).
- Hay, J.A. Concorde-Community Noise. Aerospace Engineering and Manufacturing Meeting; Technical Report 0148-7191; SAE International: Warrendale, PA, USA, 1976. [Google Scholar]
- Hirshorn, S.R. NASA Systems Engineering Handbook, 2nd ed.; NASA: Washington, DC, USA, 2016; pp. 17–23. [Google Scholar]
- Raney, J. Development of a new computer system for aircraft noise prediction. In Proceedings of the AIAA 2nd Aeroacoustics Conference, Hampton, VA, USA, 24–26 March 1975. [Google Scholar] [CrossRef]
- Bertsch, L.; Guerin, S.; Looye, G.; Pott-Pollenske, M. The Parametric Aircraft Noise Analysis Module-Status overview and recent applications. In Proceedings of the 17th AIAA/CEAS Aeroacoustics Conference (32nd AIAA Aeroacoustics Conference), Portland, OR, USA, 5–8 June 2011. [Google Scholar] [CrossRef] [Green Version]
- Sanders, L.; Malbéqui, P.; LeGriffon, I. Capabilities of IESTA-CARMEN to predict aircraft noise. In Proceedings of the 23rd International Congress on Sound & Vibration (ICSV23): “From Ancient to Modern Acoustics”, Athens, Greece, 10–14 July 2016; Available online: https://hal.archives-ouvertes.fr/hal-01385584 (accessed on 25 October 2021).
- Raney, J.P.; Padula, S.L.; Zorumski, W.E. NASA Progress in Aircraft Noise Prediction; NASA Technical Memorandum 81915; National Aeronautics and Space Administration: Washington, DC, USA, 1981. [Google Scholar]
- Lopes, L.V.; Burley, C.L. Design of the Next Generation Aircraft Noise Prediction Program: ANOPP2. In Proceedings of the 17th AIAA/CEAS Aeroacoustics Conference (32nd AIAA Aeroacoustics Conference), Portland, OR, USA, 5–8 June 2011. [Google Scholar] [CrossRef] [Green Version]
- Bertsch, L.; Heinze, W.; Guerin, S.; Lummer, M.; Delfs, J. 10 years of joint research at DLR and TU Braunschweig toward low-noise aircraft design-what did we achieve? Aeronaut. Aerosp. Open Access J. 2019, 3, 89–104. [Google Scholar] [CrossRef] [Green Version]
- Dobrzynski, W.; Ewert, R.; Pott-Pollenske, M.; Herr, M.; Delfs, J. Research at DLR towards airframe noise prediction and reduction. Aerosp. Sci. Technol. 2008, 12, 80–90. [Google Scholar] [CrossRef]
- Elie, A.; Kervarc, R.; Dubot, T.; Bourrely, J. IESTA: A Modular Distributed Simulation Platform for the Evaluation of Air Transport Systems; MASCOT08-IMACS/ISGG Workshop; IAC-CNR: Roma, Italy, 2008. [Google Scholar]
- Bertsch, L.; Clark, I.A.; Thomas, R.H.; Sanders, L.; Legriffon, I. The Aircraft Noise Simulation Working Group (ANSWr)-Tool Benchmark and Reference Aircraft Results. In Proceedings of the 25th AIAA/CEAS Aeroacoustics Conference, Delft, The Netherlands, 20–23 May 2019; Available online: https://hal.archives-ouvertes.fr/hal-02196662 (accessed on 30 September 2021).
- Bertsch, L. Noise Prediction Within Conceptual Aircraft Design. Ph.D. Thesis, Technical University of Braunschweig, Braunschweig, Germany, 2012. [Google Scholar]
- Bertsch, L.; Isermann, U. Noise prediction toolbox used by the DLR aircraft noise working group, INTER-NOISE 2013. In Proceedings of the 42nd International Congress and Exposition on Noise Control Engineering, Innsbruck, Austria, 15–18 September 2013. [Google Scholar]
- Zorumski, W.E. Aircraft Noise Prediction Program Theoretical Manual-Part 2; NASA Technical Memorandum 83199; National Aeronautics and Space Administration: Washington, DC, USA, 1982. [Google Scholar]
- ANOPP and ANOPP2. Available online: https://software.nasa.gov/software/LAR-19861-1 (accessed on 30 September 2021).
- Filippone, A.; Bertsch, L.; Pott-Pollenske, M. Validation strategies for comprehensive aircraft noise prediction methods. In Proceedings of the 12th AIAA Aviation Technology, Integration, and Operations (ATIO) Conference and 14th AIAA/ISSM, Indianapolis, IN, USA, 17–19 September 2012. [Google Scholar] [CrossRef]
- ANP-Eurocontrol Experimental Centre. Available online: https://www.aircraftnoisemodel.org/ (accessed on 30 September 2021).
- ICAO. Environmental Protection. In Annex 16 to the Convention on International Civil Aviation, 8th ed.; Vol. I: Aircraft Noise, Chapter 12; ICAO: Montreal, QC, Canada, 2017. [Google Scholar]
- Berton, J.J.; Huff, D.L.; Geiselhart, K.; Seidel, J. Supersonic Technology Concept Aeroplanes for Environmental Studies. In Proceedings of the AIAA SciTech Forum and Exposition, Orlando, FL, USA, 6–10 January 2020. [Google Scholar] [CrossRef] [Green Version]
- Nöding, M.; Bertsch, L. Application of Noise Certification Regulations within Conceptual Aircraft Design. Aerospace 2021, 8, 210. [Google Scholar] [CrossRef]
- Berton, J.J.; Jones, S.M.; Seidel, J.A.; Huff, D.L. Noise predictions for a supersonic business jet using advanced take-off procedures. Aeronaut. J. 2018, 122, 556–571. [Google Scholar] [CrossRef] [Green Version]
- Project-MORE&LESS. Available online: https://www.h2020moreandless.eu/project/ (accessed on 25 October 2021).
- Raymer, P.D. Aircraft Design: A Conceptual Approach, 5th ed.; Shetz, J.A., Ed.; AIAA Education Series; Wright-Patterson Air Force Base: Fairborn, OH, USA, 2013. [Google Scholar]
- Torenbeek, E. Advanced Aircraft Design: Conceptual Design, Analysis and Optimization of Subsonic Civil Airplanes; Wiley: Hoboken, NJ, USA, 2013. [Google Scholar]
- Ferretto, D.; Fusaro, R.; Viola, N. Innovative Multiple Matching Charts approach to support the conceptual design of hypersonic vehicles. Proc. Inst. Mech. Eng. Part J. Aerosp. Eng. 2020, 234, 1893–1912. [Google Scholar] [CrossRef]
- Ferretto, D.; Fusaro, R.; Viola, N. A conceptual design tool to support high-speed vehicle design. In Proceedings of the AIAA AVIATION 2020 FORUM, Virtual Event, 15–19 June 2020; p. 22. [Google Scholar] [CrossRef]
- Fusaro, R.; Ferretto, D.; Viola, N. MBSE approach to support and formalize mission alternatives generation and selection processes for hypersonic and suborbital transportation systems. In Proceedings of the 2017 IEEE International Systems Engineering Symposium (ISSE), Vienna, Austria, 11–13 October 2017; p. 8088275. [Google Scholar] [CrossRef] [Green Version]
- Fusaro, R.; Viola, N.; Fenoglio, F.; Santoro, F. Conceptual design of a crewed reusable space transportation system aimed at parabolic flights: Stakeholder analysis, mission concept selection, and spacecraft architecture definition. CEAS Space J. 2017, 9, 5–34. [Google Scholar] [CrossRef]
- Nijsse, J. Design and Noise Acceptability of Future Supersonic Transport Aircraft. Ph.D. Thesis, Delft University of Technology, Delft, The Netherlands, 2020. [Google Scholar]
- Aerospace Standard ARP86; Standard Values of Atmospheric Absorption as a Function of Temperature and Humidity for Use in Evaluating Aircraft Flyover Noise. SAE International: Warrendale, PA, USA, 1964.
- Hubbard, H.H. Aeroacoustic of Flight Vehicles: Theory and Practice, Volume 1: Noise Sources; NASA Reference Publication 1258, RDC Technical Report 90-3052; NASA Langely Center: Hampton, VA, USA, 1991. [Google Scholar]
- Farassat, F.; Casper, J. Towards an airframe noise prediction methodology: Survey of current approaches. In Proceedings of the 44th AIAA Aerospace Sciences Meeting and Exhibit, Reno, NV, USA, 9–12 January 2006. [Google Scholar] [CrossRef] [Green Version]
- Filippone, A. Aircraft noise prediction. Prog. Aerosp. Sci. 2014, 68, 27–63. [Google Scholar] [CrossRef]
- Bertsch, L.; Simons, D.G.; Snellen, M. Aircraft Noise: The Major Sources, Modelling Capabilities, and Reduction Possibilities; DLR-Interner Berich, DLR-IB 224-2015 A 110, 29 S; 1st Joint DLR & TU Delft Aviation Noise Workshop; Institute of Aerodynamics and Flow Technology: Göttingen, Germany, 2015. [Google Scholar] [CrossRef]
- Morgan, H.G.; Hardin, J.C. Airframe Noise-The Next Aircraft Noise Barrier. J. Aircr. 1975, 12, 622–624. [Google Scholar] [CrossRef]
- Dobrzynski, W. Almost 40 Years of Airframe Noise Research: What Did We Achieve? J. Aircr. 2010, 47, 353–367. [Google Scholar] [CrossRef]
- Fink, M.R. Airframe Noise Prediction Method, FAA Research Report, FAA-RD-77-29; Federal Aviation Administration RD-77-29: Springfield, VA, USA, 1977. [Google Scholar]
- Merino-Martinez, R.; Bertsch, L.; Simons, D.; Snellen, M. Analysis of landing gear noise during approach. In Proceedings of the 22nd AIAA/CEAS Aeroacoustics Conference, Lyon, France, 30 May–1 June 2016. [Google Scholar] [CrossRef] [Green Version]
- Ihme, M. Combustion and Engine-Core Noise. Annu. Rev. Fluid Mech. 2017, 49, 277–310. [Google Scholar] [CrossRef]
- Lighthill, M.J. On sound generated aerodynamically I. General theory. Proc. R. Soc. London. Ser. A. Math. Phys. Sci. 1952, 211, 564–587. [Google Scholar]
- Stone, J.R.; Groesbeck, D.E.; Zola, C.L. Conventional profile coaxial jet noise prediction. AIAA J. 1983, 21, 336–342. [Google Scholar] [CrossRef]
- Feiler, C.E.; Conrad, E.W. Fan Noise from Turbofan Engines. J. Aircr. 1976, 13, 128–134. [Google Scholar] [CrossRef]
- Heidmann, M. Interim Prediction Method for Fan and Compressor Source Noise; Technical Memorandum 19750017876; NASA Lewis Research Center: Cleveland, OH, USA, 1975. [Google Scholar]
- Chima, R.V. Analysis of Buzz in a Supersonic Inlet; NASA, Glenn Research Center: Cleveland, OH, USA, 2012. [Google Scholar]
- Adetifa, O.E. Prediction of Supersonic Fan Noise Generated by Turbofan Aircraft Engines. Ph.D. Thesis, University of Southampton, Faculty of Engineering and the Environment, Southampton, UK, 2015. [Google Scholar]
- ICAO-Reduction of Noise at Source. Available online: https://www.icao.int/environmental-protection/pages/reduction-of-noise-at-source.aspx (accessed on 30 September 2021).
- ICAO. Environmental Technical Manual, Vol. I, Procedures for the Noise Certification of Aircraft; ICAO: Montreal, QC, Canada, 2018. [Google Scholar]
- Talbot, J.E. Concorde Development-Powerplant Installation and Associated Systems, SAE Transactions. J. Aerosp. 1991, 100, 2681–2698. Available online: http://www.jstor.org/stable/44548124 (accessed on 30 September 2021).
- Stiuso, G. Tecnica di Simulazione Numerica delle Prestazioni Stazionarie e Transitorie di Turbomotori. Ph.D. Thesis, Politecnico di Torino, Turin, Italy, 2019. Available online: http://webthesis.biblio.polito.it/id/eprint/11258 (accessed on 30 September 2021).
- Vasov, L.; Stojiljkovic, B.; Cokorilo, O.; Mirosavljevic, P.; Gvozdenovic, S. Aircraft noise metrics. Saf. Eng. 2014, 4. [Google Scholar] [CrossRef]
- Jones, K.; Cadoux, R. Metrics for Aircraft Noise; R ERCD Report 0904; Environmental Research and Consultancy Department: London, UK, 2009.
- Bennett, R.L.; Pearsons, K.S. Handbook of Aircraft Noise Metrics; NASA Contractor Report; Bolt, Beranek, and Newman, Inc.: Canoga Park, CA, USA, 1981. [Google Scholar]
- ICAO. Environmental Protection. In Annex 16 to the Convention on International Civil Aviation, 8th ed.; Vol. I: Aircraft Noise, Appendix 2; ICAO: Montreal, QC, Canada, 2017. [Google Scholar]
- ICAO. Environmental Protection. In Annex 16 to the Convention on International Civil Aviation, 8th ed.; Vol. I: Aircraft Noise, Appendix 1; ICAO: Montreal, QC, Canada, 2017. [Google Scholar]
- Torija, A.; Woodward, R.; Flindell, I.; McKenzie, A.; Self, R. On the assessment of subjective response to tonal content of contemporary aircraft noise. Appl. Acoust. 2018, 146, 190–203. [Google Scholar] [CrossRef] [Green Version]
- ECAC. CEAC Doc 29, 4th ed. Report on Standard Method of Computing Noise Contours Around Civil Airports. In Proceedings of the European Civil Aviation Conference, European Civil Aviation Conference (ECAC) Document 29, Paris, France, 7 December 2016; Available online: https://www.ecac-ceac.org/ecac-docs (accessed on 30 September 2021).
- Citarella, R.; Federico, L.; Cicatiello, A. Modal acoustic transfer vector approach in a FEM–BEM vibro-acoustic analysis. Eng. Anal. Bound. Elem. 2007, 31, 248–258. [Google Scholar] [CrossRef]
- Kontos, K.B.; Janardan, B.A.; Gliebe, P.R. Improved NASA-ANOPP Noise Prediction Computer Code for Advanced Subsonic Propulsion Systems-Vol. 1 ANOPP Evaluation and Fan Noise Model Imporvements; NASA Contractor Report 195480; NASA: Cincinnati, OH, USA, 2013. [Google Scholar]
- Krejsa, E.A.; Stone, J.R. Enhanced Fan Noise Modeling for Turbofan Engines; NASA Contractor Report 218421; NASA: Cincinnati, OH, USA, 2014. [Google Scholar]
- ICAO. Environmental Protection. In Annex 16 to the Convention on International Civil Aviation, 8th ed.; Vol. I: Aircraft Noise, Chapter 14; ICAO: Montreal, QC, Canada, 2017. [Google Scholar]
- Saiyed, N.; Mikkelsen, K.; Bridges, J. Acoustics and Thrust of Separate-Flow Exhaust Nozzles with Mixing Devices for High Bypass- Ratio Engines. AIAA J. 2003, 41, 372–378. [Google Scholar] [CrossRef]
- Callender, B.; Gutmark, E.; Martens, S. Far-Field Acoustic Investigation into Chevron Nozzle Mechanisms and Trends. AIAA J. 2005, 43, 87–95. [Google Scholar] [CrossRef]
- Rask, O.; Kastner, J.; Gutmark, E. Understanding How Chevrons Modify Noise in Supersonic Jet with Flight Effects. AIAA J. 2011, 49, 1569–1576. [Google Scholar] [CrossRef]
- Cuppoletti, D.R. Supersonic Jet Noise Reduction with Novel Fluidic Injection Techniques. Ph.D. Thesis, University of Cincinnati, Cincinnati, OH, USA, 2013. [Google Scholar]
- Semlitsch, B.; Cuppoletti, D.R.; Gutmark, E.J.; Mihăescu, M. Transforming the Shock Pattern of Supersonic Jets Using Fluidic Injection. AIAA J. 2019, 57, 1851–1861. [Google Scholar] [CrossRef] [Green Version]
- Sahai, A.K. Consideration of Aircraft Noise Annoyance During Conceptual Aircraft Design. Ph.D. Thesis, Rheinisch-Westfälische Technische Hochschule Aachen, Aachen, Germany, 2016. Available online: https://publications.rwth-aachen.de/record/668901 (accessed on 25 October 2021).


| PANAM | ANOPP | CARMEN | |
|---|---|---|---|
| Airframe noise models | |||
| t.e. | DLR Airframe | Boeing: Flap, | Boeing: Flap, |
| Fink: Trailing edge | Fink: Trailing edge | ||
| l.e. | DLR Airframe | Boeing Airframe | DLR Airframe |
| m.g. | DLR Airframe | Boeing Airframe | DLR Airframe |
| n.g. | DLR Airframe | Boeing Airframe | DLR Airframe |
| Engine noise models | |||
| fan bb | mod. Heidemann | Heidmann Fan, | mod. Heidmann Fan |
| GE Large Fan Option | and Kontos | ||
| fan t | mod. Heidemann | Heidmann Fan, | mod. Heidmann Fan |
| GE Large Fan Option | and Kontos | ||
| jet | mod. Stone | Stone2 | mod. Stone |
| Propagation effects | ISO9613 | ISO9613 | ISO9613 |
| K | a | G | |
|---|---|---|---|
| Clean delta wing (aerodinamically clean) | 5 | ||
| Vertical tail (aerodinamically clean) | 5 | ||
| 1-and-2 wheel landing gear wheel noise | 6 | ||
| 4 wheel landing gear wheel noise | 6 | ||
| Landing gear strut noise | 6 |
| Directivity Function | Spectrum Function | |
|---|---|---|
| Clean delta wing (aerodinamically clean) | ||
| Vertical tail (aerodinamically clean) | ||
| 1-and-2-wheel landing gear wheel | ||
| 1-and-2-wheel landing gear strut | ||
| 4 wheel landing gear wheel | ||
| 4 wheel landing gear strut |
| Airframe Parameters | Value |
|---|---|
| Wing span | 25.6 m |
| Wing surfrace | 358.25 m |
| Wing span (vertical tail) | 11.32 m |
| Wing surfrace (vertical tail) | 33.91 m |
| N struct main landing-gear | 2 |
| N wheels main landing-gear | 4 |
| Tyre diameter main landing-gear | 1.2 m |
| Length strut main landing-gear | 2.5 m |
| N struct forward landing-gear | 1 |
| N wheels forward landing-gear | 2 |
| Tyre diameter forward landing-gear | 0.787 m |
| Length strut forward landing-gear | 3 m |
| Engine parameters | Value |
| Number of engines | 4 |
| Engine reference area | 1.15 m |
| Fan rotor diameter | 1.21 m |
| Fan reference area | 1.15 m |
| Number of stator vanes | 32 |
| Number of blades B | 19 |
| Mean rotor blade chord C | 0.22 m |
| Rotor-stator spacing s | 0.22 m |
| Fan rotor relative tip Mach number at design point | 1 |
| Inlet guide vane index i | 2 |
| Sideline | Flyover | Approach | |
|---|---|---|---|
| LAmax [dBA] | 113.22 | 106.30 | 104.92 |
| SEL [dBA] | 123.16 | 116.31 | 115.34 |
| PNLTM [PNdB] | 126.57 | 119.26 | 118.23 |
| EPNL [EPNdB] | 124.53 | 118.45 | 118.85 |
Publisher’s Note: MDPI stays neutral with regard to jurisdictional claims in published maps and institutional affiliations. |
© 2022 by the authors. Licensee MDPI, Basel, Switzerland. This article is an open access article distributed under the terms and conditions of the Creative Commons Attribution (CC BY) license (https://creativecommons.org/licenses/by/4.0/).
Share and Cite
Piccirillo, G.; Viola, N.; Fusaro, R.; Federico, L. Guidelines for the LTO Noise Assessment of Future Civil Supersonic Aircraft in Conceptual Design. Aerospace 2022, 9, 27. https://doi.org/10.3390/aerospace9010027
Piccirillo G, Viola N, Fusaro R, Federico L. Guidelines for the LTO Noise Assessment of Future Civil Supersonic Aircraft in Conceptual Design. Aerospace. 2022; 9(1):27. https://doi.org/10.3390/aerospace9010027
Chicago/Turabian StylePiccirillo, Grazia, Nicole Viola, Roberta Fusaro, and Luigi Federico. 2022. "Guidelines for the LTO Noise Assessment of Future Civil Supersonic Aircraft in Conceptual Design" Aerospace 9, no. 1: 27. https://doi.org/10.3390/aerospace9010027