Article

Numerical and Experimental Research on Flight Control of a V-Tail Configuration for the Wind Tunnel Model of Aircraft

1
School of Aeronautics and Astronautics, Dalian University of Technology, Dalian 116023, China
2
State Key Laboratory of Structural Analysis for Industrial Equipment, Dalian University of Technology, Dalian 116023, China
3
Advanced Technology for Aerospace Vehicles of Liaoning Province, Dalian University of Technology, Dalian 116023, China
*
Author to whom correspondence should be addressed.
Aerospace 2022, 9(12), 792; https://doi.org/10.3390/aerospace9120792
Submission received: 29 October 2022 / Revised: 28 November 2022 / Accepted: 29 November 2022 / Published: 3 December 2022
(This article belongs to the Special Issue Thermal Fluid Dynamics and Control in Aerospace)

Abstract

:
The V-tail configuration has excellent stealth performance and has been using widely in the aerodynamic shape design of advanced aircraft. Many recent studies have focused on numerical simulation about V-tail configuration flight performance. The relative wind tunnel tests still need to be developed. This challenge is a focused aspect in such research. In the present experimental study, the role of flight control law was investigated in order to keep the test model in the target attitude and height. An effective design method of a full model of the aircraft with twin V-tails is proposed based on CFD evaluation. This model was manufactured based on the design of a two degrees of freedom support system via a Chinese wind tunnel. A longitudinal flight control law was proposed and simulated. Wind tunnel tests were employed to find the effectiveness of the model design and the control law. It is seen from the results that the proposed experimental method via a full model of the aircraft with twin V-tails and a novel longitudinal flight control law is effective. These test results can provide appliable contributions on the development of the support system for wind tunnel experiments. The proposed model design and test methods can be useful for applications in the aeroelastic wind tunnel tests of the full model aircrafts.

1. Introduction

The V-tail configuration has excellent stealth performance and has been using widely in the aerodynamic shape design of advanced aircraft [1,2,3,4]. The research on V-tail aircraft is of more significance. However, the literature and papers about V-tails are very limited [5]. Malcolm J. Abzug [6] studied the stall problem of V-tails. Qiao et al. [7] put forward an adaptive back-stepping neural control (ABNC) method for the coupled nonlinear model of a novel type of embedded surface morphing aircraft, based on a large number of aerodynamic data for different V-tail configurations. Wang et al. [8] studied the three-axis static and dynamic stability characteristics of an example Blended-Wing-Body (BWB) aircraft with V-tail configuration. Leshikar et al. [9] developed an approach for generating linear time invariant state-space models of a small Unmanned Air System and verified the approach by an inverted V-tail aircraft model. Jin et al. [10] summarized the design technique of rigid/flexible hybrid model and testing methods of all-moving V-tail buffet wind tunnel test, and established a set of systematical theoretical analysis techniques, design criteria, and test methods for aircraft V-tail structure buffet dynamic strength design and test of advanced fighters and unmanned aerial vehicles. The research about V-tail configuration mainly concentrates on numerical simulations whereas the related wind tunnel tests are rare.
Compared with numerical simulations and flight tests, wind tunnel tests are important means of aeroelastic performance evaluation and verification of aerospace vehicles due to their advantages of high reliability [11,12,13]. The focus of this paper is to study the flight performance of V-tail configuration aircraft by means of wind tunnel tests.
According to different test requirements, it is important to select an appropriate wind tunnel test support system. With the development of wind tunnel test technology, various support systems have been developed. Many kinds of support system are used for wind tunnel test [14], such as tail support system, external/balance support system, side wall support system and wing tip support system. As a special wind tunnel for aeroelastic test, NASA Langley center Transonic Dynamics Tunnel (TDT) has a variety of test model sup-port methods, such as sidewall support, cable mount, and forced/free oscillation crossbar [15]. Russia TsAGI has developed a Floating Suspension System in a T-128 wind tunnel [16]. Typical facilities allow one or two degrees of freedom and some sophisticated testing facilities such as those operated by NASA and German Dutch Wind Tunnels (DNW) allow up to six degrees of freedom [17]. Many scholars made corresponding experimental studies based on different support systems. Gebbink et al. [18] conducted a wind tunnel test in the High-Speed Tunnel (HST) of DNW about a full-span scaled model mounted to a dorsal sting. Tang and Dowell [19] studied the effects of a free-to-roll fuselage on wing flutter and verified the proposed theory by wind tunnel test with a tail support. Allen et al. [20,21] carried out a dynamically scaled aeroelastic wind tunnel test in NASA’s TDT wind tunnel on a sidewall support half span Truss-Braced Wing model.
Recently, in order to simulate the free flight condition accurately, a wind tunnel model support system with release of pitch and plunge degrees of freedom has been developed in China, which can simulate rigid body motion mode of aircraft [22]. The research of this paper is carried out based on a developed support system. The structural design needs to match the support system. The flight control law was designed to keep the aircraft model in steady level flight. The purpose of the paper is to verify the flight control law under the support system with release of pitch and plunge degrees of freedom and investigate the longitudinal flight performance of the V-tail configuration aircraft. This experimental research method provides technical support for the future wind tunnel test of elastic aircraft model.
The paper is organized as follows. Section 2 describes the design and manufacture process of the wind tunnel test model. Section 3 presents details on the design of flight control law, which contains the establishment of dynamic equations, the measurement of parameters and the simulation of flight control law. Section 4 presents analysis of the experimental results of the wind tunnel test. Conclusions are drawn in Section 5.

2. Model Design and Manufacture

The design of a wind tunnel test model needs to comprehensively consider aerodynamic shape, stiffness, strength, and flight control requirements. It can make it more feasible to simulate the steady level flight of the aircraft in the wind tunnel. The design process of the aircraft model is shown in Figure 1.

2.1. Aerodynamic Shape Design

A 3D full model aircraft is established as shown in Table 1. The wind tunnel test model is an 8%-length, full-span, rigidly scaled model of the original model. As shown in Figure 2, this aircraft was composed of a fuselage, wings, and V-tails. The aircraft is 1.82 m with 1.28 m wingspan. The mean dynamic chord (MAC) is 0.32 m and the dihedral angle of the V-tails is 40°.

2.2. Aerodynamic Parameters

Some aerodynamic parameters such as lift force, pitch moment, and the position of aerodynamic center (AC) should be considered before the structure design.
The aerodynamic parameters of the aircraft at 0.2 Mach can be obtained through high-precision Computational Fluid Dynamics (CFD) calculation [23]. The parameters included the lift coefficient, drag coefficient, pitch moment coefficient, and hinge moment under different angles of attack and V-tail deflection angles (see Figure 3 and Figure 4).

2.3. Aircraft Trimming

As shown in Figure 4, the sign of the pitch moment coefficient changed from negative to positive with the increase in V-tail deflection angle. This indicated that the aerodynamic shape can be balanced. The pitch moment generated by V-tail deflection was enough to change the pitch angle of the aircraft.

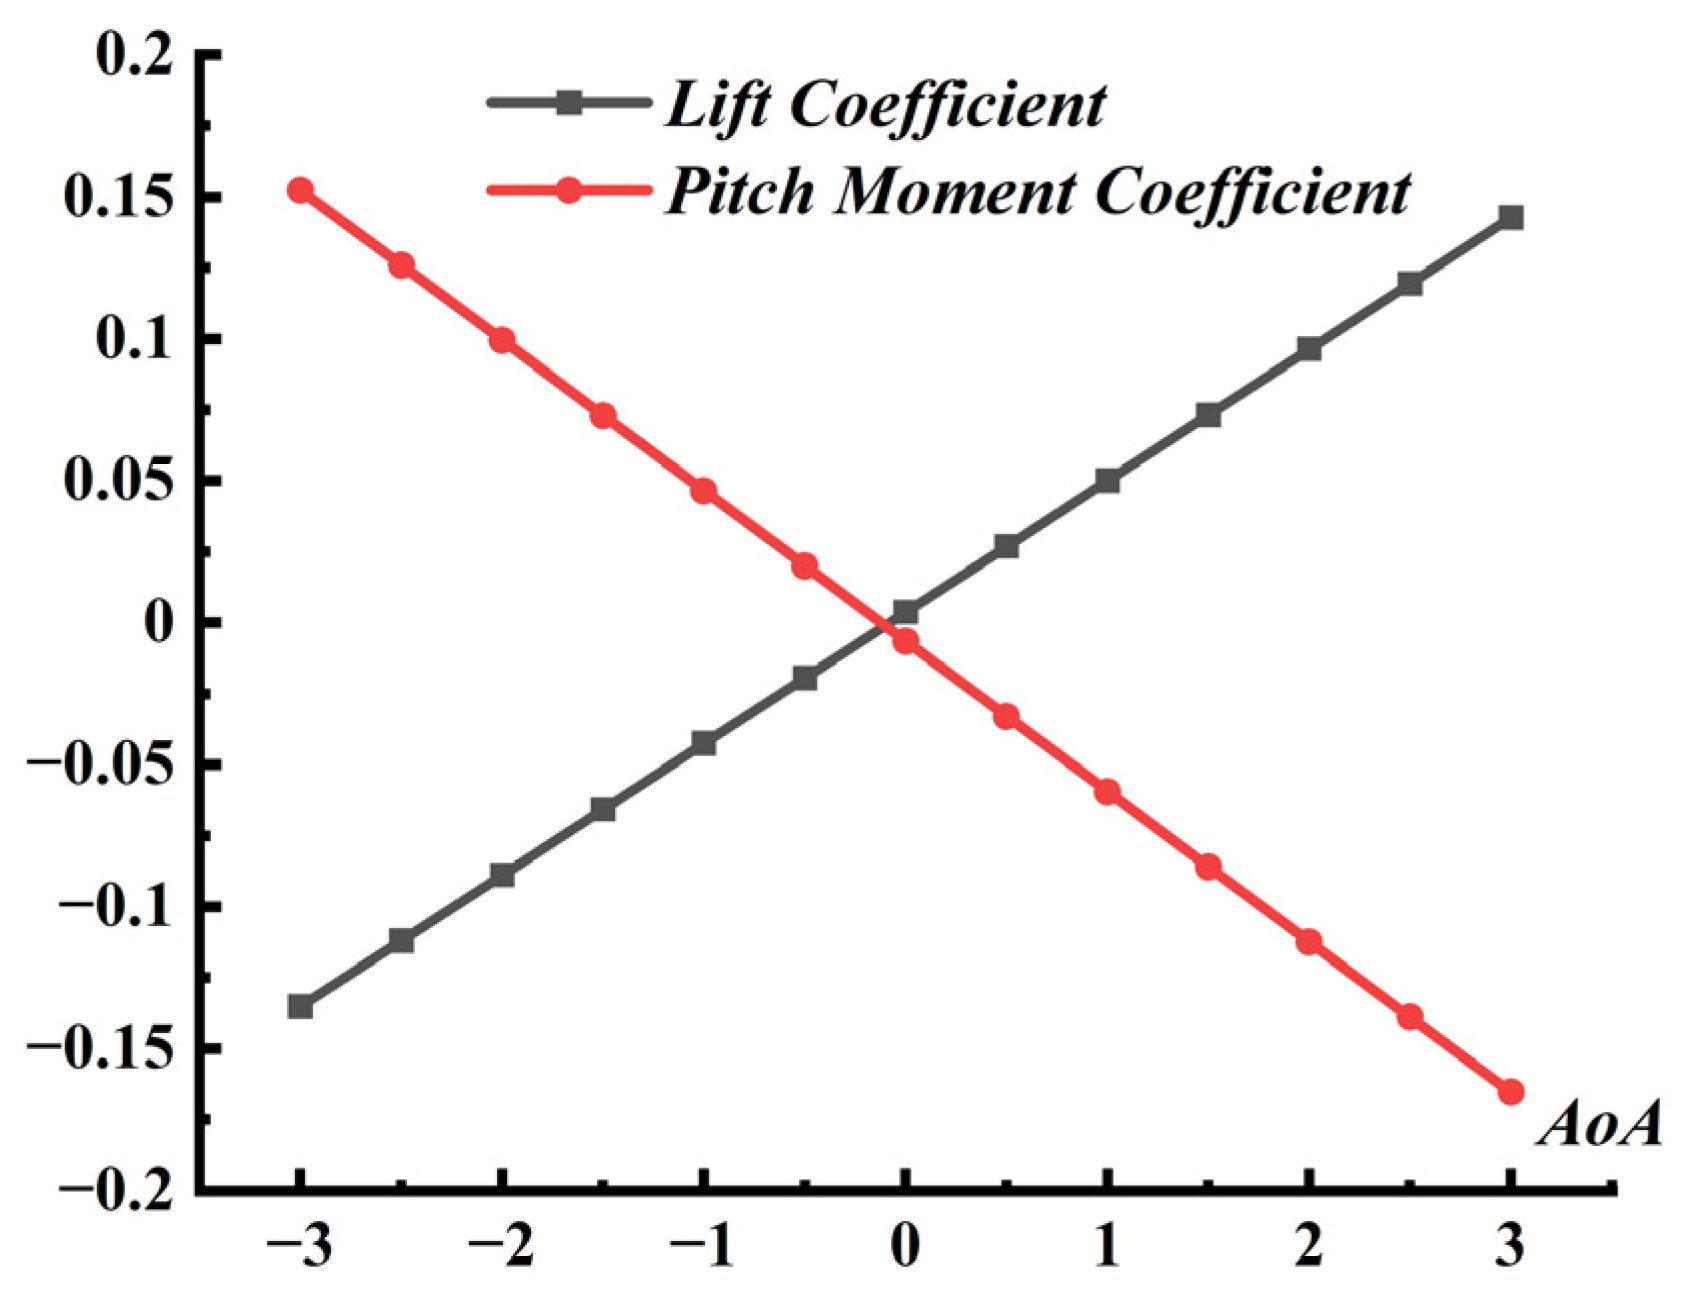
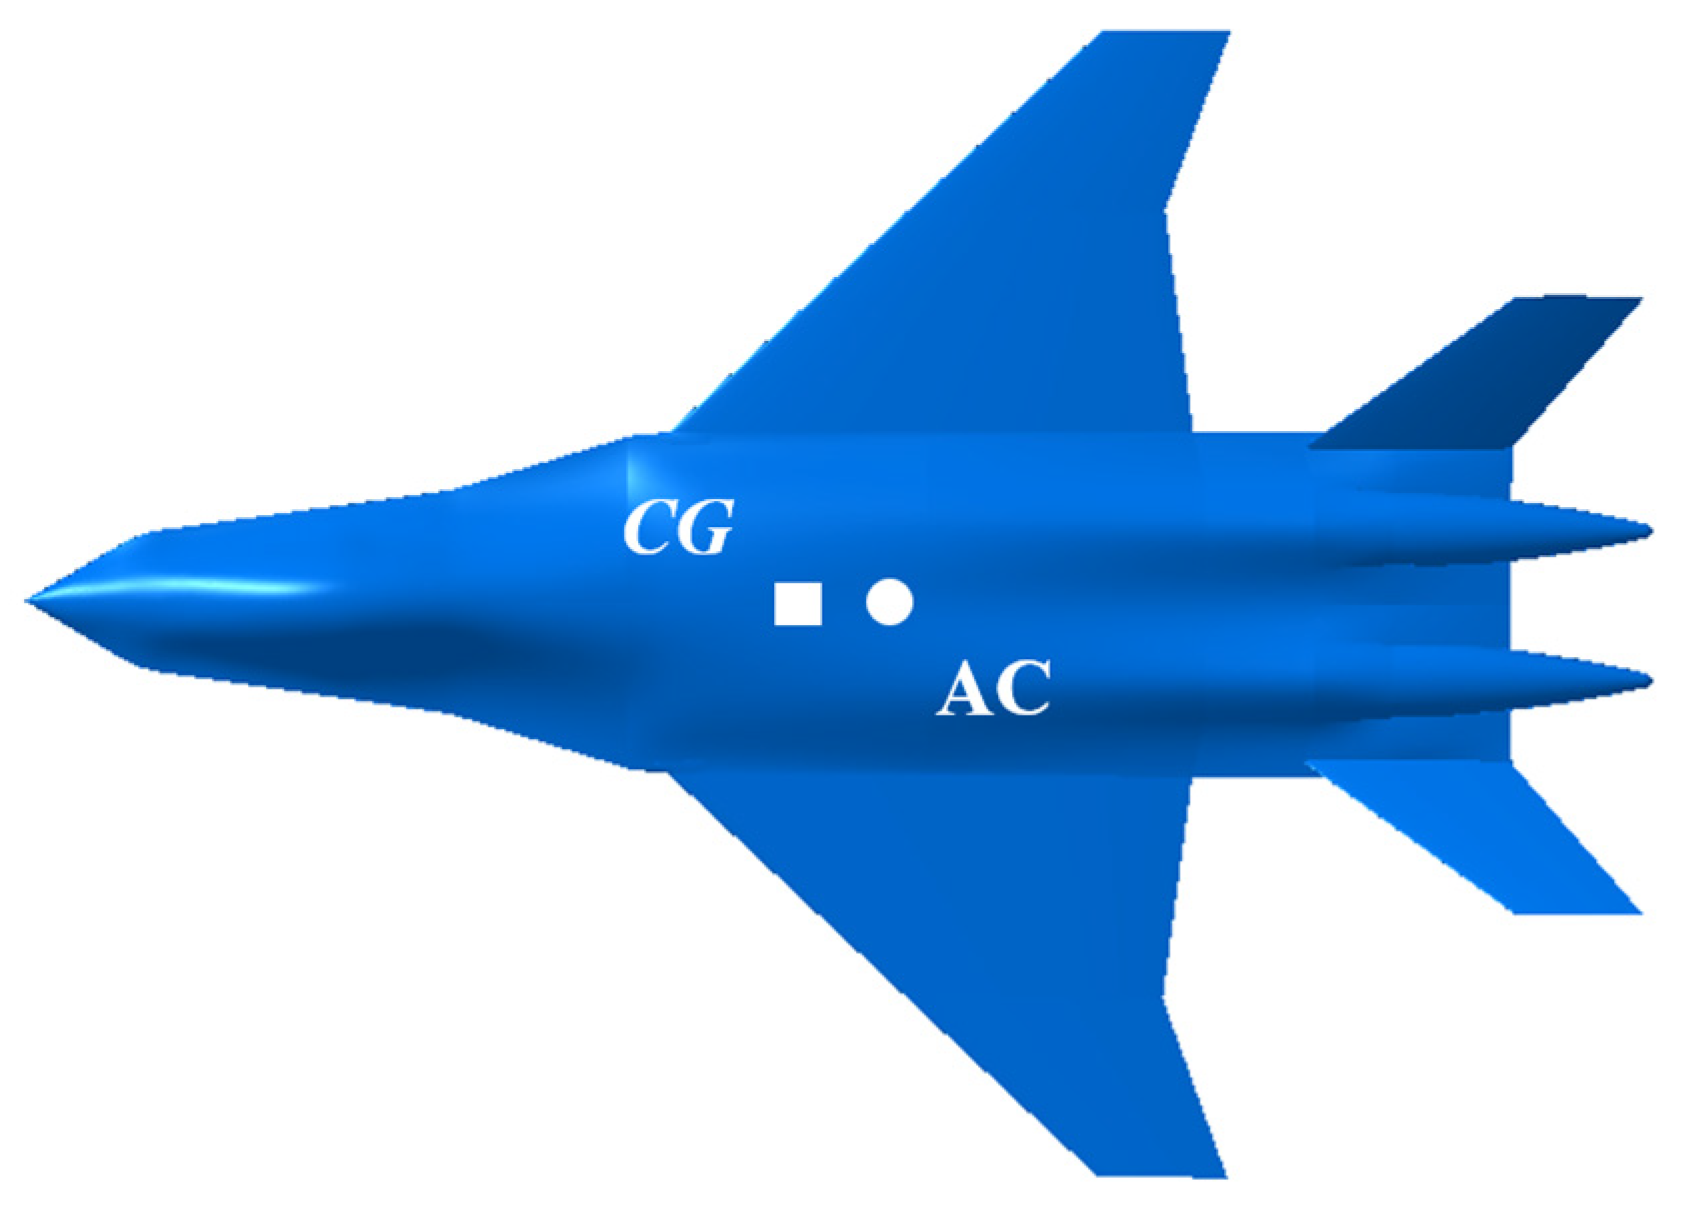
2.4. Aerodynamic Center

The AC is the action point of aerodynamic increment of aircraft. The pitch moment at this position is always equal to the zero-lift moment. During the process of CFD calculation, the position of the reference center of gravity (CG) was given in advance. The moment balance equation is established according to the obtained aerodynamic parameters [24]. The position of CG is taken as the moment action point, see Figure 5.
M = L   ×   X AC + M 0  
M = 1 2 ρ V 2 S c ¯ C M
L = 1 2 ρ V 2 S C L
M 0 = 1 2 ρ V 2 S c ¯ C M 0
According to the aerodynamic theory, the following equations can be obtained.
Substitute Equations (2)–(4) into Equation (1), it is obtained that
C M 0 = X A C c ¯ C L + C M
The lift coefficient curve and pitch moment coefficient curve (i.e., as shown in Figure 6) without V-tail deflection are linearly fitted, and the expressions are obtained.
C L = A 1 α + B 1
C M = A 2 α + B 2
Substitute Equations (6) and (7) into Equation (5), it is obtained that
C M 0 = ( A 1 α + B 1 ) X A C c ¯ + A 2 α + B 2 = ( A 1 X A C c ¯ + A 2 ) α + B 1 X A C c ¯ + B 2
Since the zero-lift moment coefficient is independent of the angle of attack, so
A 1 X A C c ¯ + A 2 = 0
X A C = A 2 c ¯ A 1
The position of AC is thus obtained.
The stability of an aircraft is closely dependent to the position of its CG and AC [25]. The proposed CG is selected as 17.1% of MAC in front of AC by considering the model design and the assembly of wind tunnel test support system, as shown in Figure 7.
The pitch moment coefficients based on the new CG with different V-tail deflection angles are shown in Figure 8, which is significant for the design of flight control law.

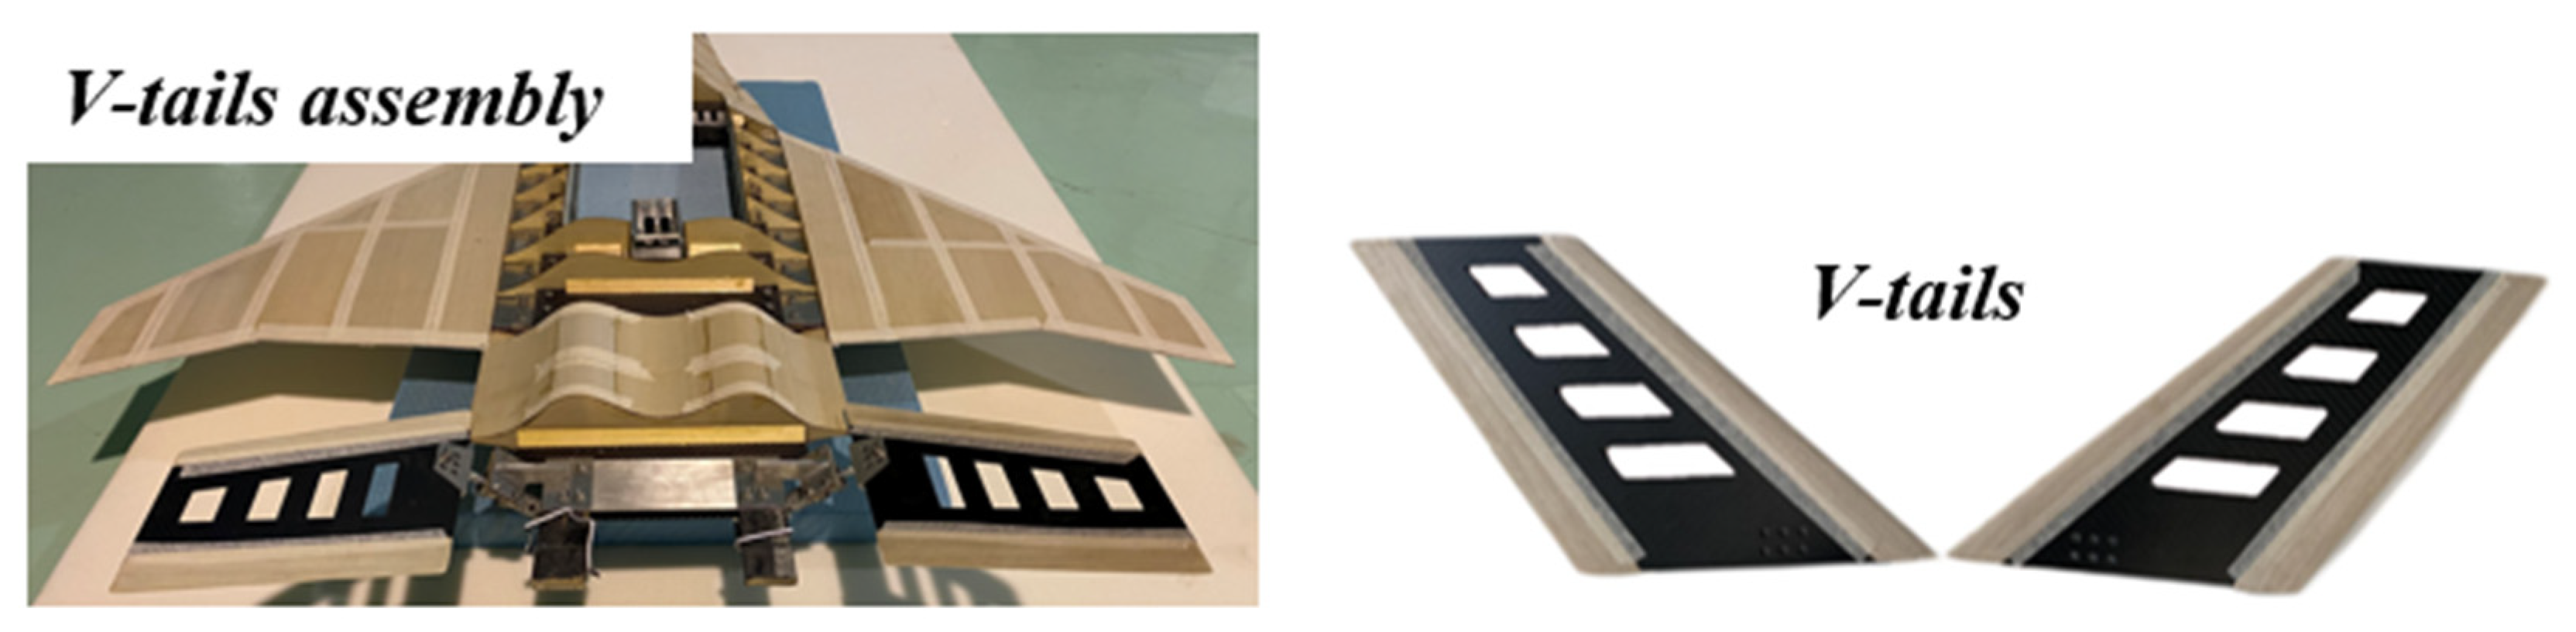
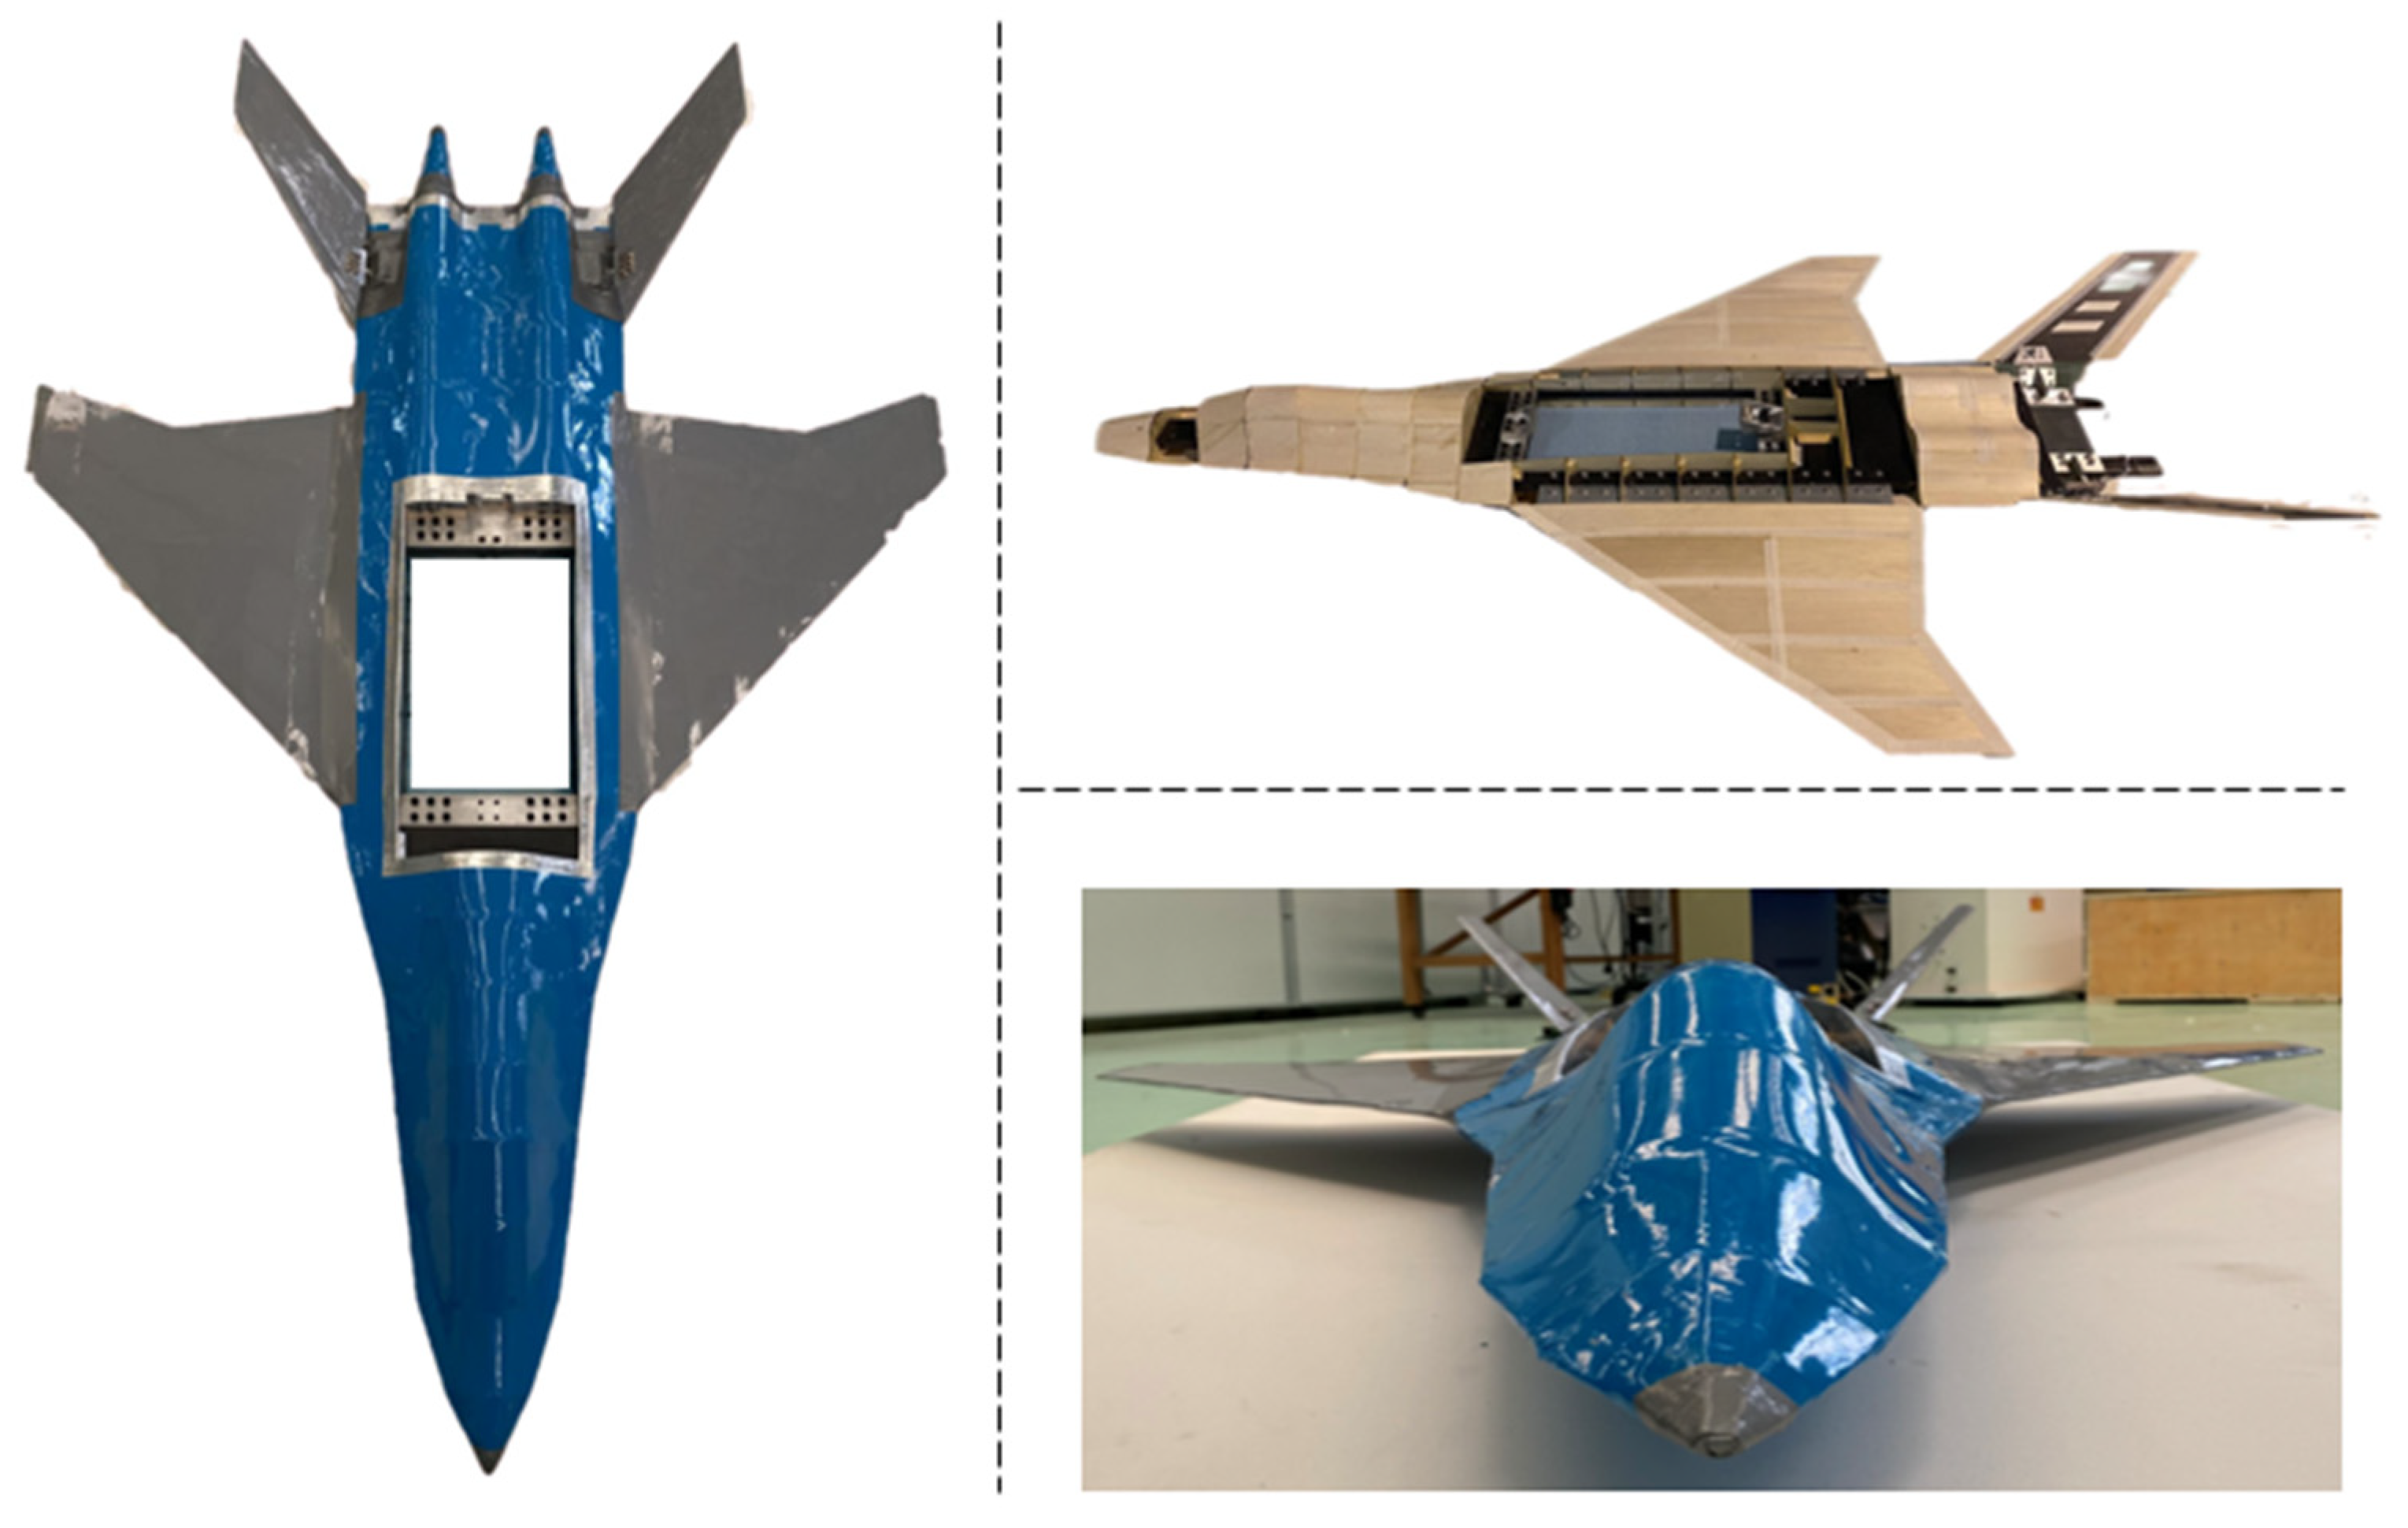
2.5. Detailed Structure Design of Full Model Aircraft

The concept of the wind tunnel support system is shown in Figure 9, in which a vertical beam and a carriage were included. It was installed inside the aircraft model and provides the pitch and plunge degrees of freedom to allow the model to “fly” in the wind tunnel test section.
The real aircraft structure is always composed of beams, shear webs, and skins. The aircraft in this paper has obvious thin fuselage. Considering assembly within the wind tunnel support system, it is a better choice to replace the beams with one core board. The shear webs were adhered to the core board vertically. In addition, the skins were stuck to the edge of shear webs.
During the process of structural design, it is necessary to ensure that CG coincides with the rotating axis of the support system to avoid additional pitch moment. This can be achieved by placing lead counterweight at the front of the model after the main structure of the model was assembled. An opening was set at CG to provide space for connection with support system. The front and rear metal joints were designed to ensure the rigid connection between the model and the support system. In addition, the metal joint at the back can slide back or forth to fit with support system, see Figure 10.
The fuselage included one core board, shear webs and skins. The core board has typical sandwich construction. The top and bottom layers are made of carbon fiber composites, and the core (i.e., the ② part shown in Figure 11) is balsa wood strip (i.e., it was wrapped with carbon fiber cloth cured with resin), which can satisfy the requirements of mass and stiffness at the same time. The shear webs were made of aviation laminate. In order to reduce the mass, the skins were made of balsa wood. Then the PVC heat shrinkable film was adhered to the surface of balsa to preserve smoothness.
The structure of the present wing was similar with the fuselage, except that the core board was only made of Carbon fiber composites. The stringers made of aviation laminate were stuck to the edge of wing shear webs. The wing was connected to the fuselage by an aluminum alloy joint, as shown in Figure 12.
The shear webs were not included in the structure of V-tails due to narrow space. The leading and tailing edges were made of balsa wood and stuck to the edge of the core board, respectively. Aviation laminate was used to stick to the top and bottom surface of the core board. The aerodynamic shape was preserved by polishing. Similarly, the PVC heat shrinkable film was adhered to the surface. The structure and assembly of the V-tails are shown in Figure 13.
The full-span assembled aircraft model is shown in Figure 14.

2.6. V-Tail Actuator Design

The key components in closed-loop active control are sensor, controller (optimization algorithm) and dynamic actuator [26]. The servo actuator was directly connected with the tail shaft to control the V-tail deflection. The aerodynamic loads of the V-tails are mainly transmitted to the fuselage in the form of bending and torque moment. The torque generated by the aerodynamic loads can be offset by the servo actuator. In order to ensure the normal operation of the servo actuator, it was not allowed to balance the bending moment by the servo actuator. Therefore, two bearings were added at the tail shaft to resist the bending moment generated by the aerodynamic force, see Figure 15.
In order to guarantee that the rated torque of the servo actuator is big enough to resist the aerodynamic force, the chosen rated torque is 10 times that of the hinge moment calculated by CFD.

3. Flight Control Law

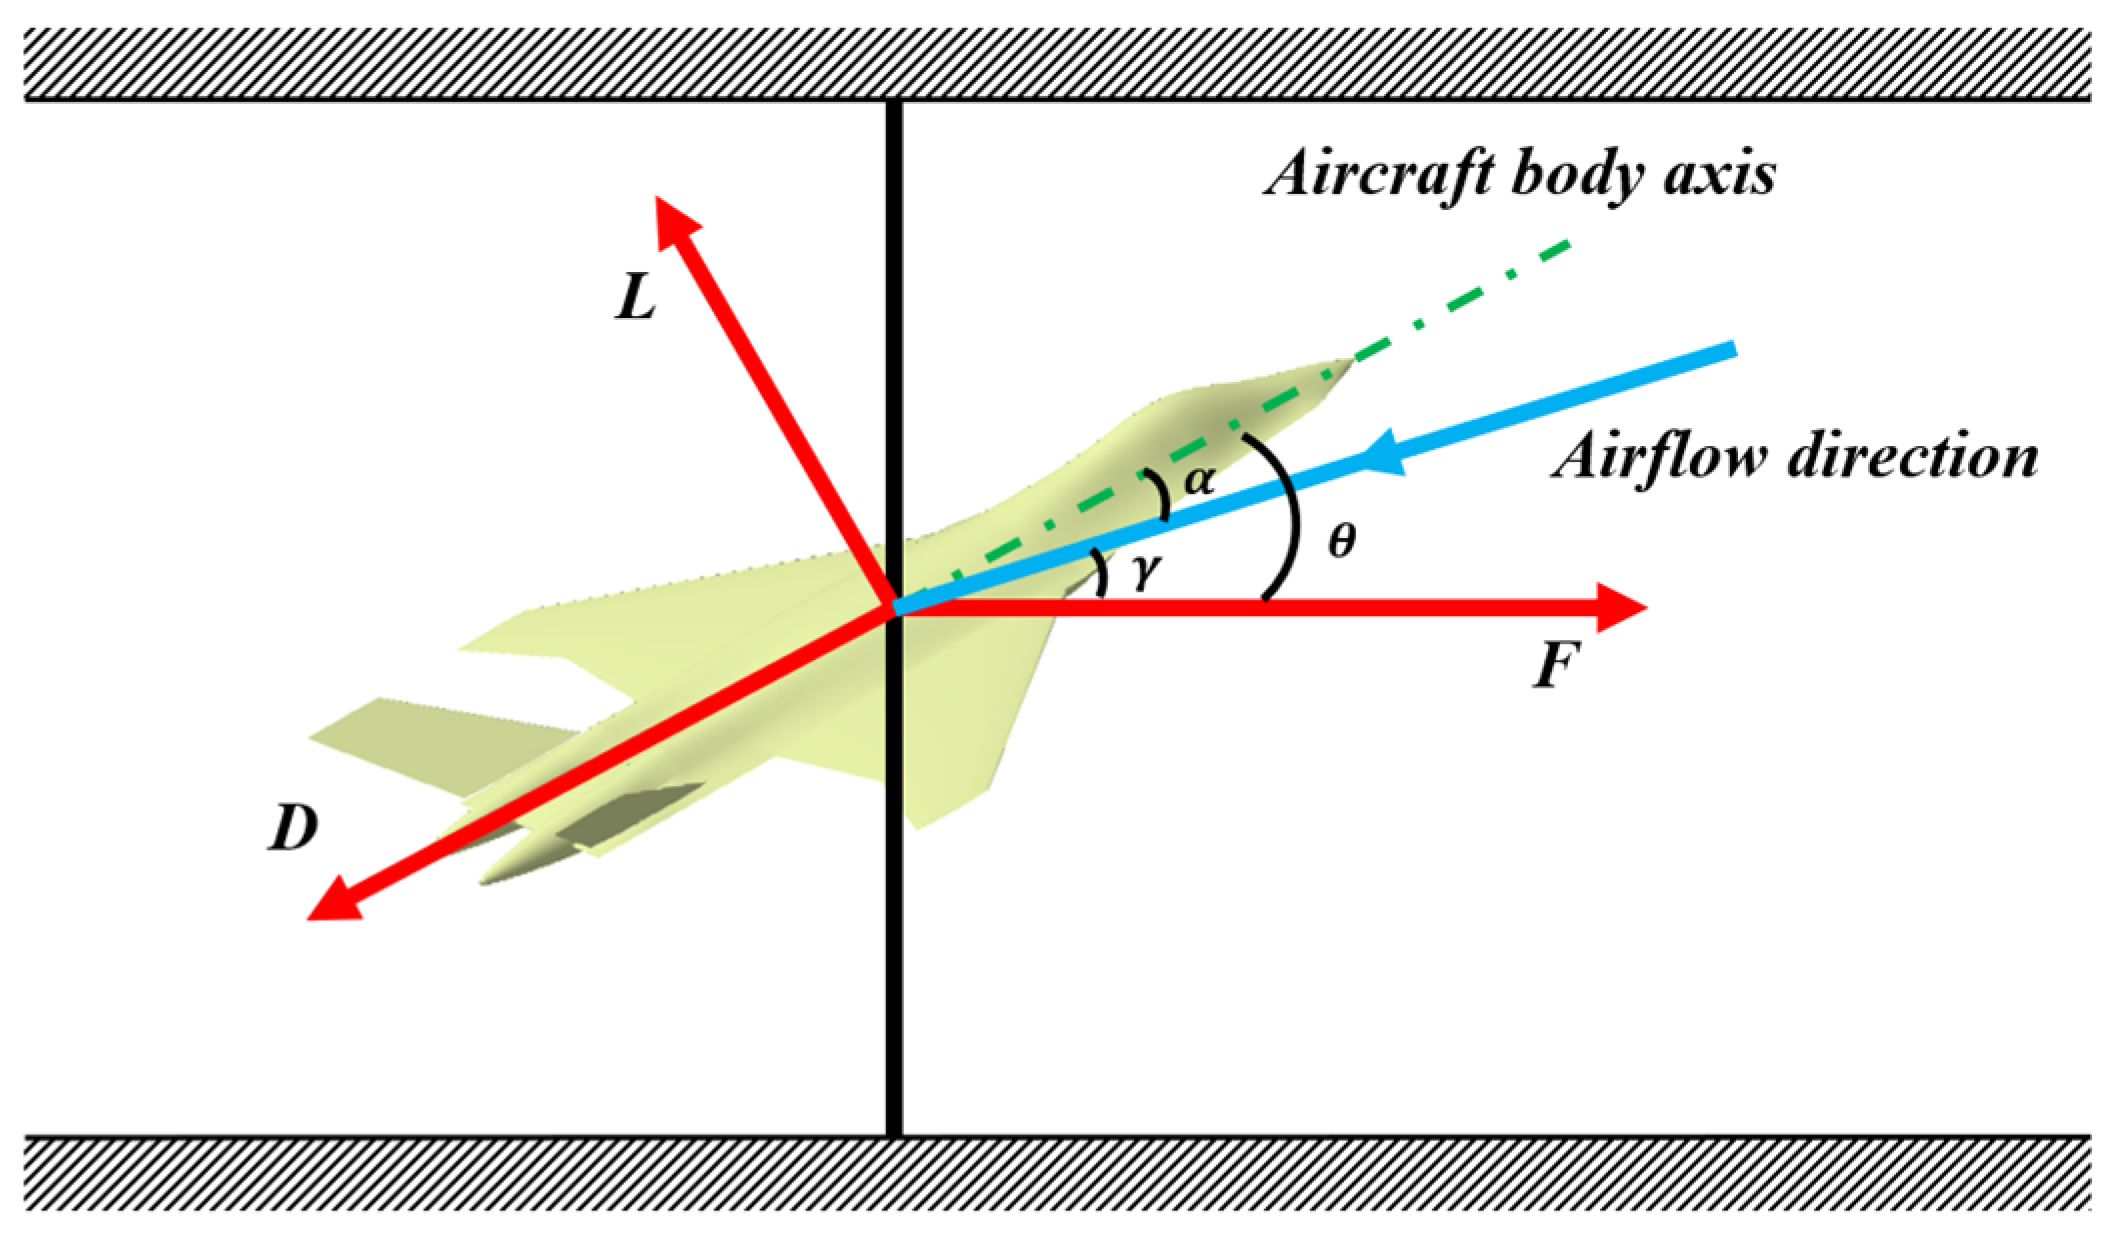
3.1. Dynamic Equation

Under the constraint of the wind tunnel support system, the force analysis of the wind tunnel model is shown in Figure 16. Based on the unsteady aircraft equations of motion for 2D flight [27], the longitudinal dynamic equations of the model are established while the longitudinal motion parameters are considered.
m d V dt = Fcos ( γ )   D     mgsin ( γ )
mVd γ dt = Fsin ( γ ) + L     mgcos ( γ )
I y dq dt = M y
d θ dt = q
dh dt = Vsin ( γ )
where
γ = θ     α
The variable F can be obtained with the analysis bellow.
The relative wind speed of the model is determined by the air velocity, which was steady during the wind tunnel test. In the ground coordinate system, the relative velocity of the model in the x direction is constant.
So
dV x dt = 0
See Figure 16,
V x = Vcos ( γ )
So
dV x dt = dV dt cos ( γ ) Vsin ( γ ) d γ dt = 0
Multiplying both sides of the equal sign of Equation (11) by cos(γ) and Equation (12) by sin(γ) at the same time and considering Equation (19), the expression of F can be obtained.
F = Dcos ( γ ) + Lsin ( γ )
The dynamic equations of the aircraft model in the wind tunnel can be obtained after the variable F is derived.

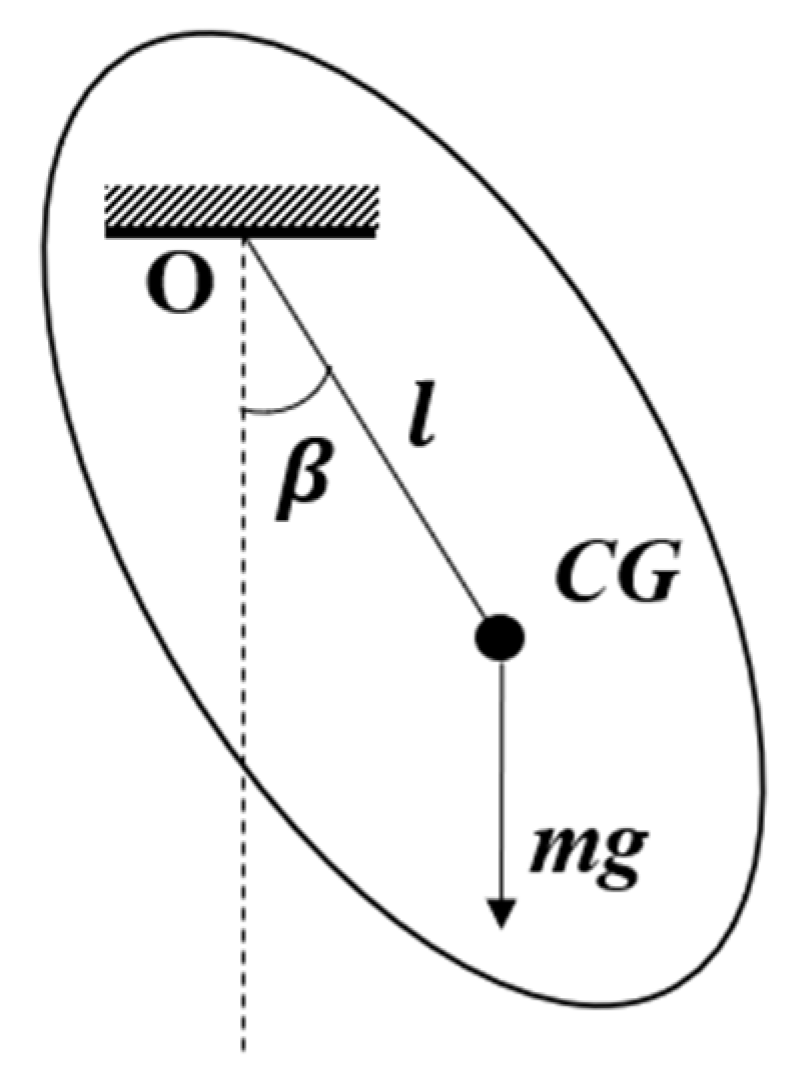
3.2. Measurement of Moment of Inertia

Before simulation, the mass and moment of inertia must be measured. The compound pendulum method [28] is used in the measurement.
According to the compound pendulum model in Figure 17, it can be recognized as harmonic vibration when the swing angle β is very small. The moment around the rotating axis O is expressed as
M O = mglsin ( β )
When β is small, it can be approximately expressed as
M O = mgl β
According to Newton’s second law of rotation
M O = I O β ¨
Then
β ¨ = ω 2 β = mgl I O β
The vibration period of the compound pendulum
T = 2 π I O mgl
Based on parallel axis theorem [29]
I O = I CG + ml 2
So
I CG = mglT 2 4 π 2 ml 2
Once the vibration period of the aircraft model is measured, the moment of inertia about CG can be obtained with Equation (27).
The moment of inertia measurement test is shown in Figure 18.

3.3. Simulation of the Flight Control Law

Based on Equations (11)–(16), the dynamic model was established in Simulink. The flight control model is shown in Figure 19. According to the air velocity in the wind tunnel, the trim angle of attack and V-tail deflection angle are calculated and set as the initial state. The angular velocity, acceleration and altitude signals were collected, and the classical PID control method was adopted to keep the model in the target attitude and height by adjusting the deflection angle of the V-tails. The proportional gain, integral gain, and differential gain are tuned manually to ensure the response speed, transform time, and stability of the control system.
The longitudinal PID controller is shown in Figure 20. The upper components form the pitch angle controller and the angular velocity signal input is used as the differential part. Similarly, the lower components form the height controller and the longitudinal velocity is taken as the differential part. The whole displayed controller in Figure 20 is used to realize the height control of the V-tail aircraft. The attitude control can be achieved by disconnecting the height control components and setting an attitude command to replace the theta control.
The simulation results are shown in Figure 21. Simulink results (a) and (c) are in good agreement with the semi-physical simulation results (b) and (d), respectively. Due to the delay of control desk measurement, the semi-physical simulation images lag behind the Simulink images by 1.8 s.

4. Wind Tunnel Test

A wind tunnel test is presented to verify the effectiveness of the flight control law. The full model aircraft assembled in the wind tunnel test section is shown in Figure 22. Three test conditions were arranged: (1) different wind speeds were set to verify the static stability of the full model aircraft when the control system is closed; (2) for attitude control, the tail deflection angle was controlled to change the pitch moment under the given wind speed, whereas the model can reach the target pitch angle and keep stable; and (3) for height control, the angle of attack was changed due to the change in pitch moment which occurs with variety of the tail deflection. Then the increment of lift force led to the ascending or descending of the model until it reached the target height.
In the present case of low wind speed and small angle of attack (i.e., the wind speed is no more than 30 m/s and the angle of attack is no more than 10°), the lift is difficult to be balanced with gravity for the present model. In order to ensure the safety and integrity of the test, a spring structure was installed in the wind tunnel to make up for the lack of lift at low wind speed and small angle of attack, see Figure 23. When the wind speed and the angle of attack reach a certain value, the lift is sufficient to support the model. At this time, it is the focus of the test to ensure that the model is stable at the target pitch angle and height under this flight state.

4.1. Test Condition 1: Static Stability Verification

A brake cylinder was installed on the support system. At the beginning of the test, the brake system was turned on and the model was fixed at the middle height of the wind tunnel test section. The tail deflection angle was set to 0° and the flight control system was closed. During the test, the model kept stable all the time. In addition, it was able to restore to stable state in a few seconds after applying manual interference. It is seen from the test phenomenon that the model has good static stability. The aircraft model reached steady state at different wind speeds (16 m/s, 20 m/s, 24 m/s, 28 m/s, and 30 m/s). Trim angles of attack at different wind speeds can be seen in Figure 24.

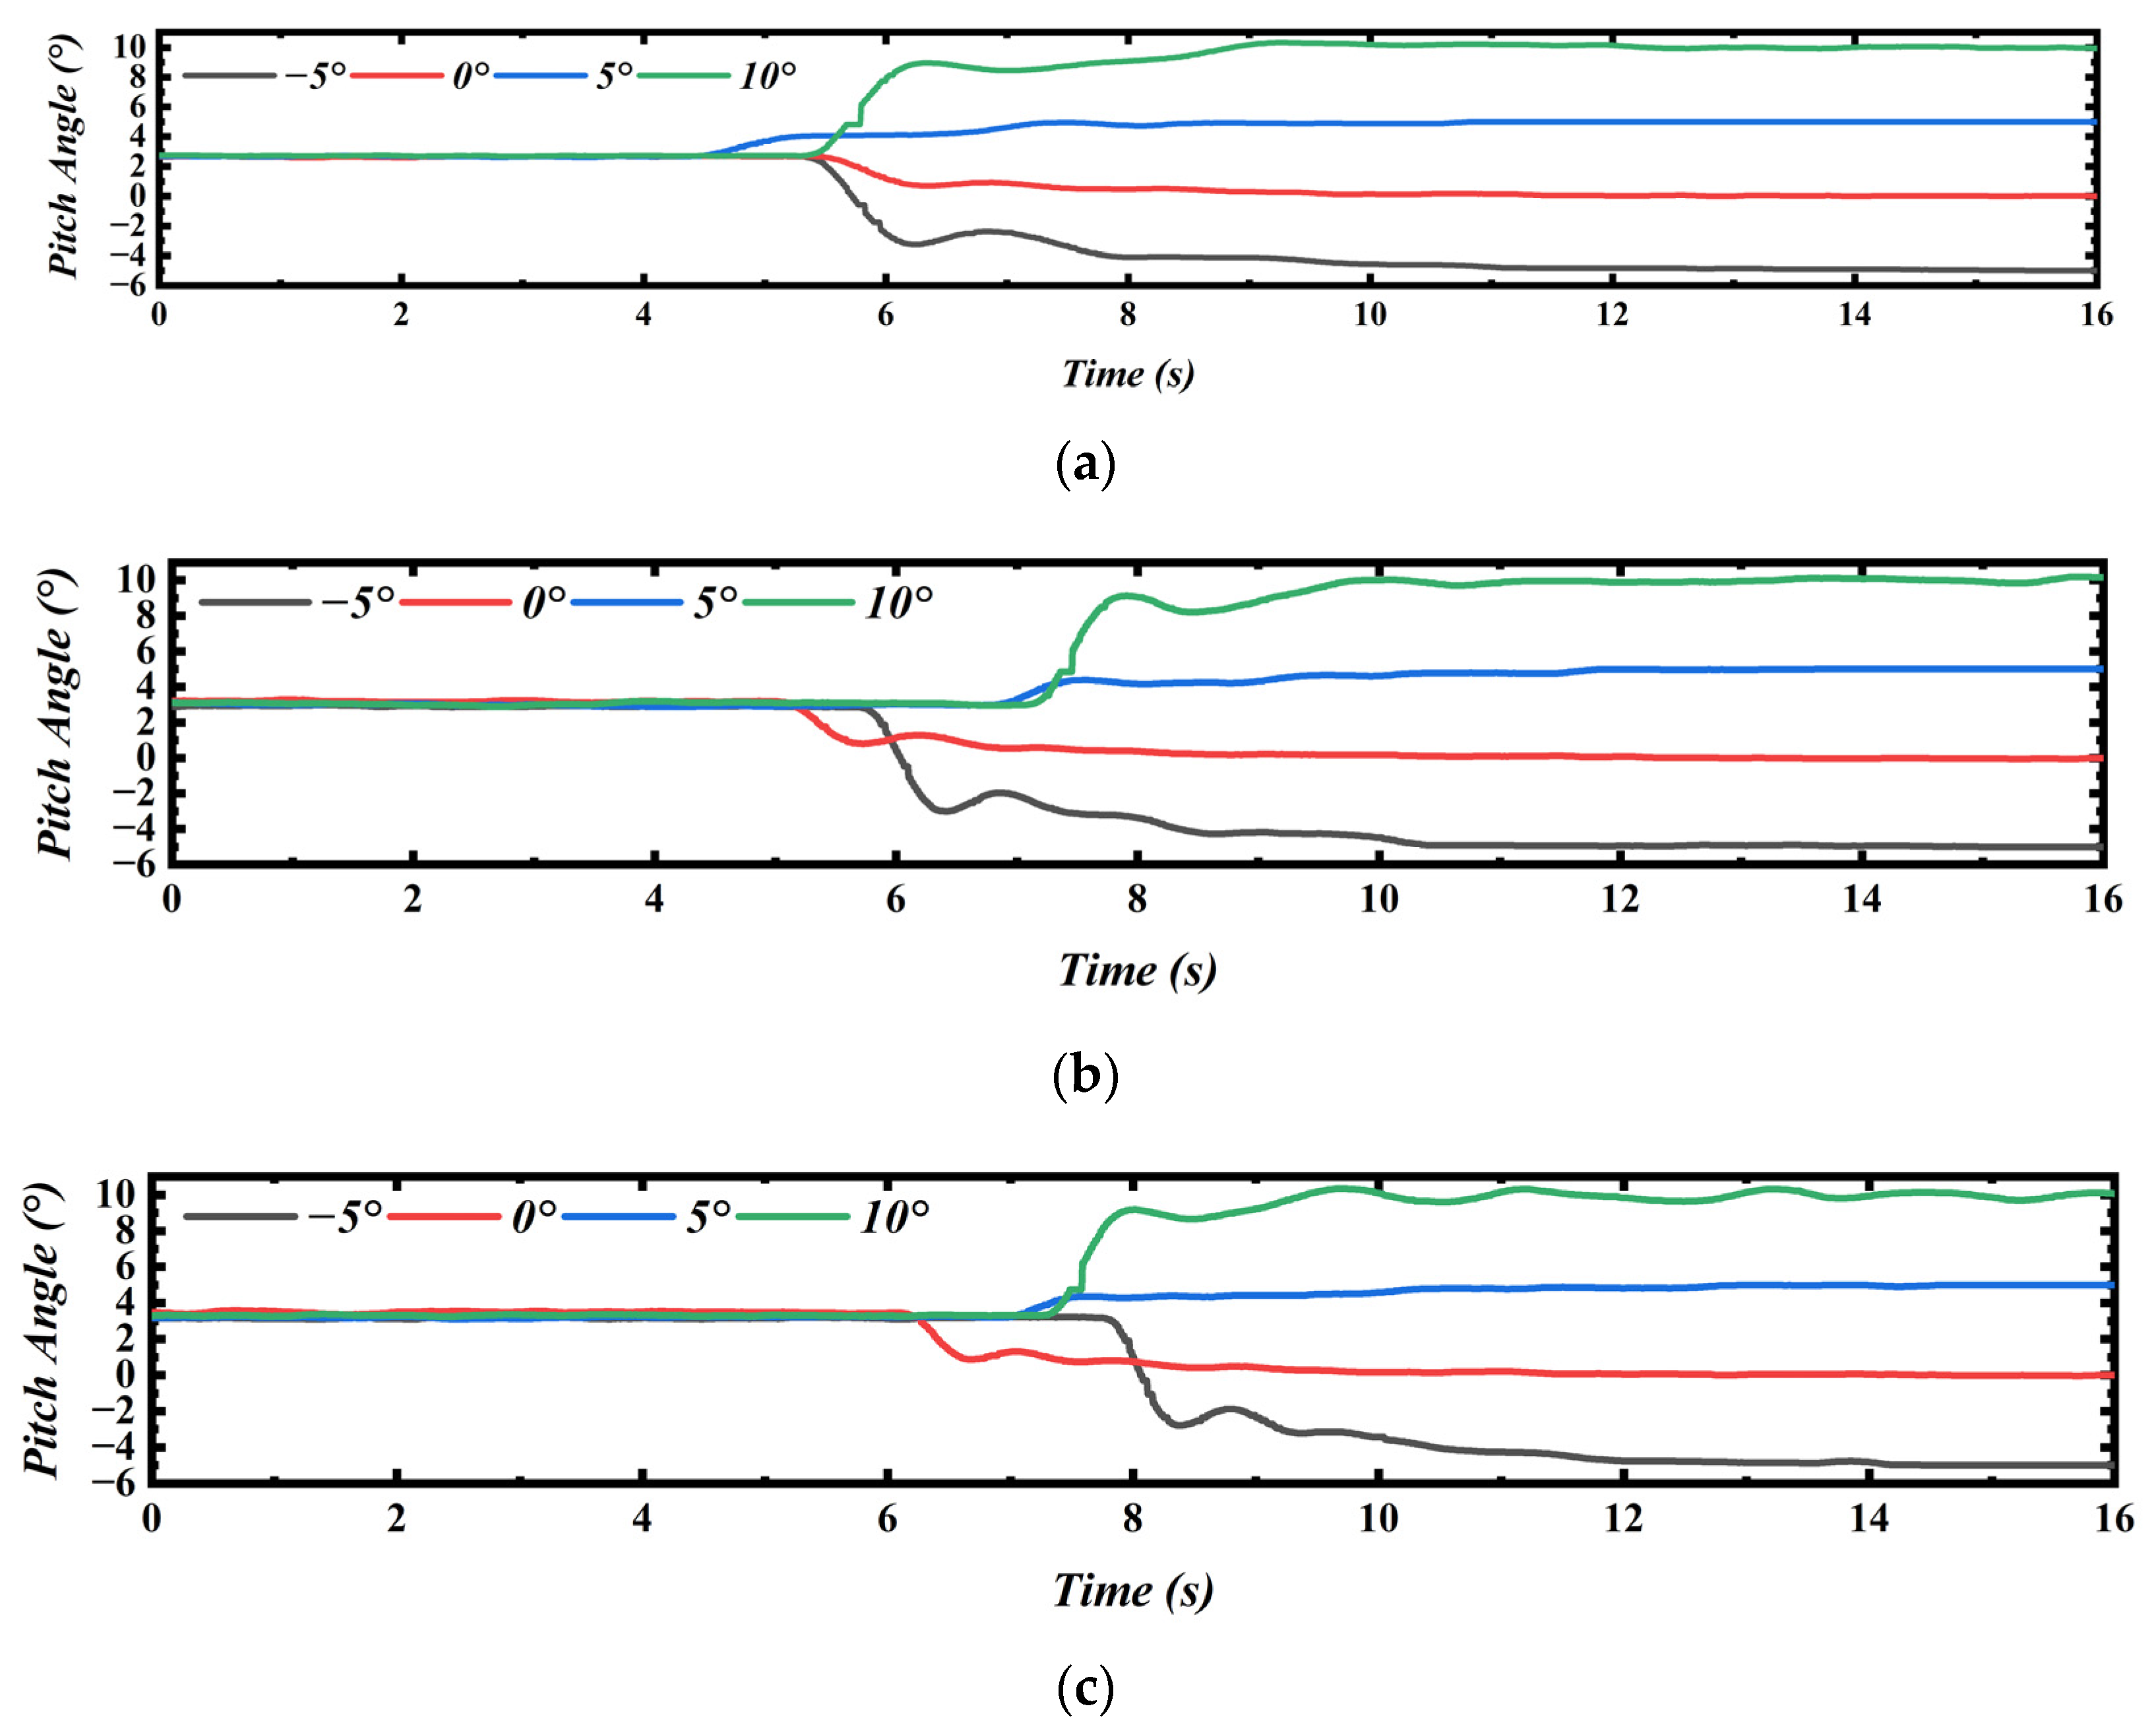
4.2. Test Condition 2: Attitude Control

The wind speeds of the attitude control test are: 16 m/s, 20 m/s, and 24 m/s. Under each wind speed, the target pitch angles were set as −5°, 0°, 5°, and 10°. The brake system was turned off and the model obtained pitch and plunge degrees of freedom at the same time. The pitch angle time history curves under different wind speeds are shown in Figure 25. Before opening the flight control system, the test model was stable at the static trim angle of attack, which was consistent with the results of test condition 1. After the target pitch angle was set and the flight control system was opened, the model reached and stabilized at the target state within 6 s. As shown in Figure 25c, the model has slight pitch oscillation after reaching the target attitude at 24 m/s and 10°. It is speculated that there are two possible reasons: (1) the stability judgment error band of the control law is set too large; and (2) at large pitch angle and height, the flow field is unstable due to the increase in blockage percentage [30].
The states of the model in the wind tunnel are shown in Figure 26 after the model reached the target pitch angle.
The sign of tail deflection angle is determined by the pitch change in the aircraft driven by it. The head up is positive and the head down is negative. The change in pitch angle is in good agreement with the change in tail deflection angle when the flight control law was opened, e.g., the results shown in Figure 27. The aerodynamic pitch moment caused the aircraft to rise and the pitch angle increased when the tail deflection angle was downward (i.e., corresponding to the value increase in Figure 27a,b presents the similar regularity when the tail deflection angle was upward). When the pitch angle reached the target value and was stable, the tail deflection angle was also stable at a certain value.

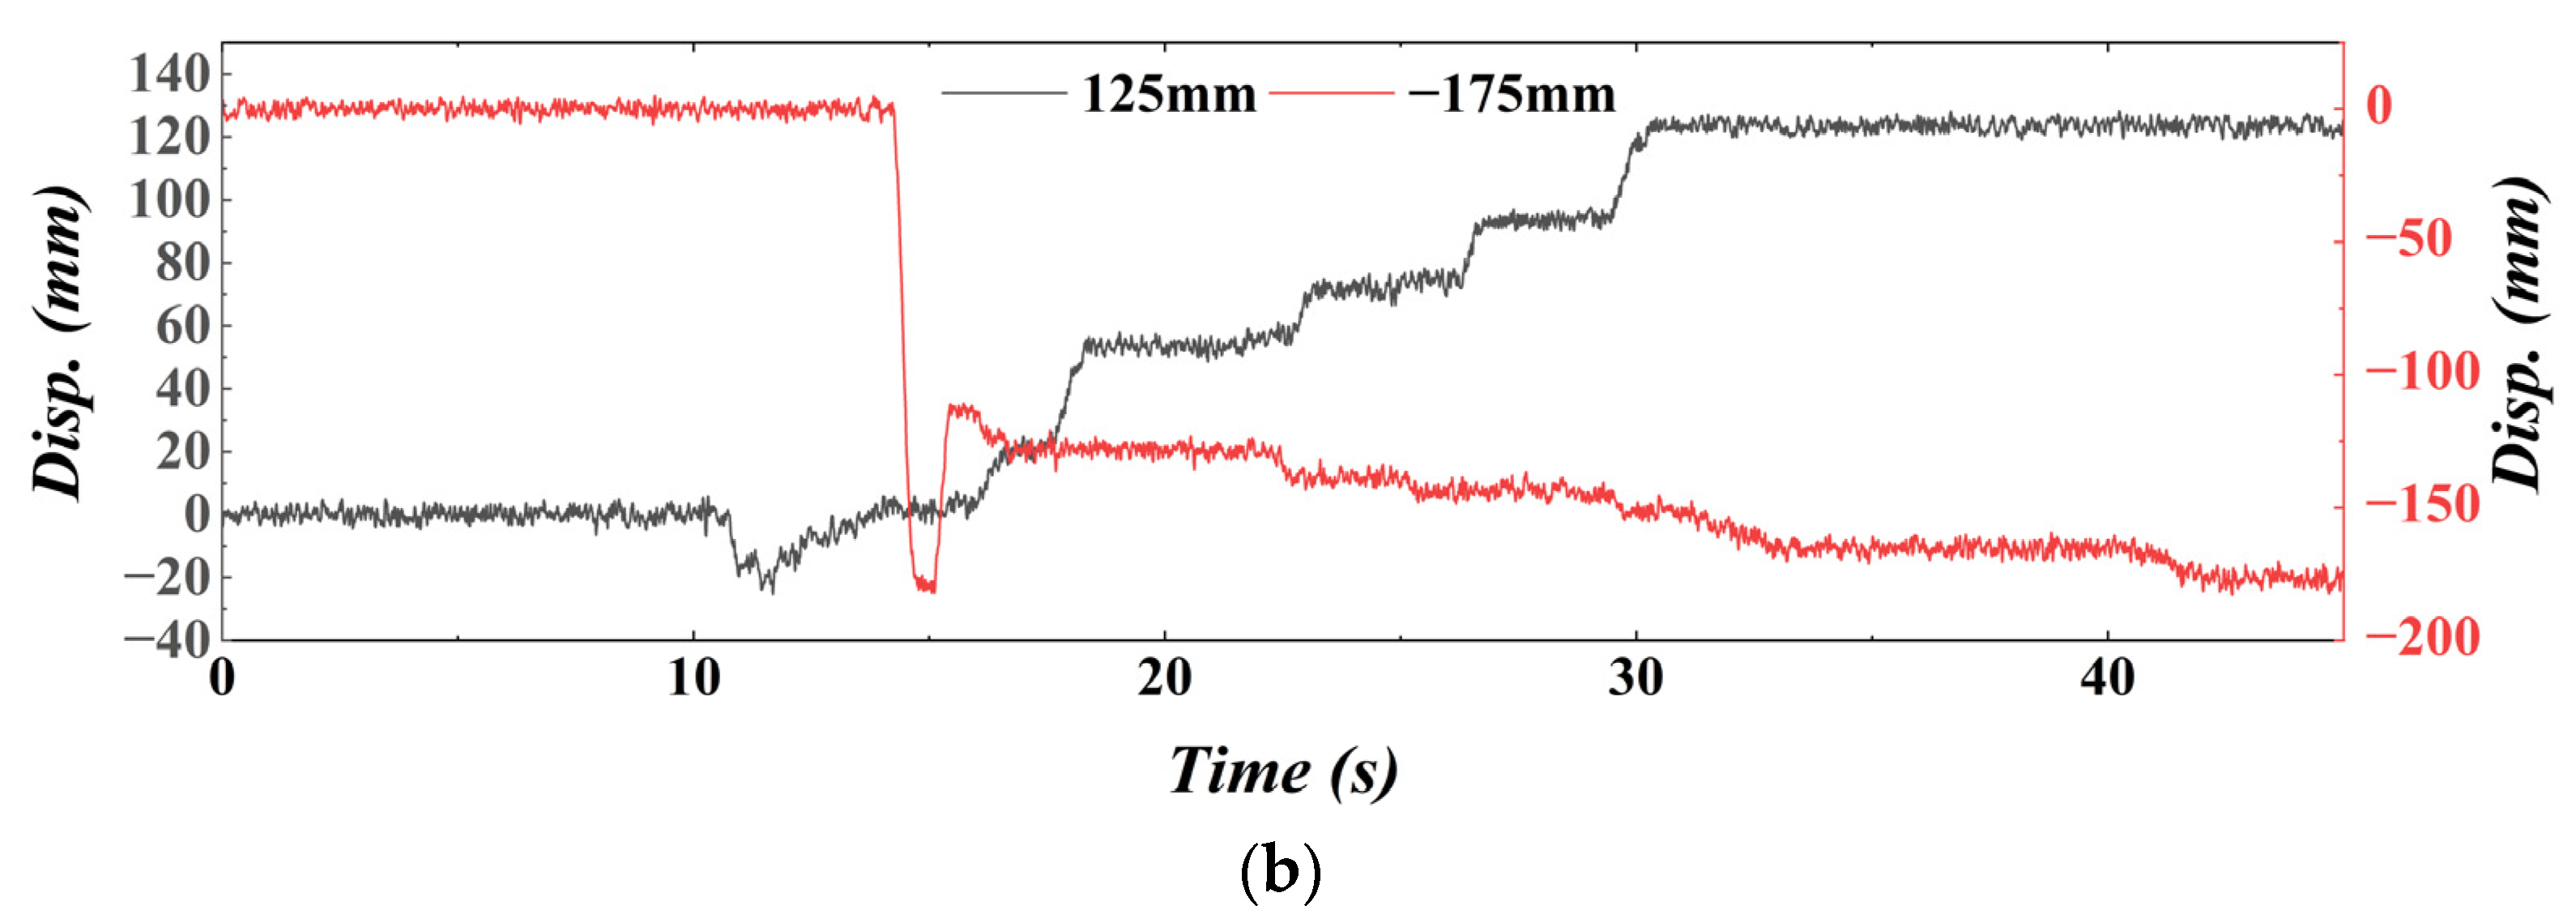
4.3. Test Condition 3: Height Control

The data curves of the height control test are shown in Figure 28. The ascending and descending tests were carried out at the wind speeds of 24 m/s and 30 m/s. The time history curves of height, pitch angle, and tail deflection angle are shown in Figure 29. The target height was set to 110 mm. The balance position under the wind speed of 24 m/s was taken as the initial position of height control. After the wind speed was stable and the model was in static equilibrium state, the target height was set to 110 mm and the height control system was opened. The pitch angle increased due to the downward deflection of the V-tails. Then the aircraft model climbed to the target height and preserved stable. The captures of the aircraft model ascending process are shown in Figure 30. According to the test results, the test auxiliary springs were completely relaxed when the wind speed was 30 m/s and the target height was 125 mm. It means that the lifting force is exactly equal to gravity at this moment. This test state truly simulated the pitch and plunge free state of the aircraft in the wind tunnel.
It is seen from Figure 28 that the height time history curves show obvious step features, which are caused by the friction between the aircraft model and the model support system. Under the given wind speed, the mutual squeezing force between the model and the support system structure increased as the pitch angle increased. The lifting force has to overcome both gravity and nonlinear friction, which lead to the step feature curves of the height. From the results, it is summarized that the support system still needs to be developed to reduce the impact of friction on the aircraft motion.
The success of height control test shows great applicable potential of the flight control law in full model wind tunnel test. The height can be controlled to keep the model in a better position to avoid the negative influence due to the increase in the blockage percentage.

5. Conclusions

In this paper, a low-speed full model aircraft was designed and manufactured based on a wind tunnel test support system with release of pitch and plunge degrees of freedom. The flight control law was designed according to the model parameters and the support system features. Three test conditions were arranged. The static stability of the aircraft model was verified with test one. The attitude control of the model was realized with test two. The pitch angle control of −5°, 0°, 5°, and 10° was investigated under the wind speed of 16 m/s, 20 m/s, and 24 m/s. The model height control was studied through test three. The model achieved an ascent of 110 mm and a descent of 70 mm at a wind speed of 24 m/s. Meanwhile, the model achieved an ascent of 125 mm and a descent of 175 mm under the wind speed of 30 m/s. In addition, the height control of the model without springs was successfully achieved.
In this research, the effectiveness of the proposed flight control law is proved by wind tunnel test. The V-tail configuration aircraft model flies in the wind tunnel with pitch and plunge degrees of freedom successfully. The target pitch angle and height can be realized efficiently.
Wind tunnel tests with release of pitch and plunge freedom are usually conducted in the research of gust load alleviation and body freedom flutter of flying wing aircrafts [31,32,33,34,35,36,37]. Half model wind tunnel tests are the mainstream due to the difficulty of full model tests. Based on the present work, the wind tunnel test fully shows the great potential of the support system in the low-speed wind tunnel test of the full model aircraft. The proposed test method can make contributions to the full model tests of the research on gust load alleviation and body freedom flutter in the future.

Author Contributions

Conceptualization, W.Q. and J.L.; Methodology, J.L., W.Q. and Y.B.; Software, J.L.; Validation, J.L. and X.X.; Investigation, J.L.; Data curation, J.L.; Writing—original draft preparation, J.L. and Y.B.; Visualization, J.L.; Supervision, Y.B. All authors have read and agreed to the published version of the manuscript.

Funding

This research received no external funding.

Data Availability Statement

Not applicable.

Conflicts of Interest

The authors declare no conflict of interest.

Nomenclature

MPitch moment relative to center of gravity
LLift force
ACAerodynamic center
XACDistance between center of gravity and aerodynamic center
M0Zero lift pitch moment (relative to aerodynamic center)
ρAir density
VAir velocity
SReference area
c ¯ Mean aerodynamic chord
CMPitch moment coefficient relative to center of gravity
CLLift force coefficient
CM0Zero lift pitch moment coefficient (relative to aerodynamic center)
A1A2B1B2Slope and intercept of fitting curve
α Angle of attack
mMass
FHorizontal reaction force
γ Climb angle
DAerodynamic drag
IyPitch moment of inertia
qPitch angular velocity
MyMoment about y-axis (pitch moment)
θ Pitch angle
hHeight
V x Component of flight relative velocity in x direction
MOMoment relative to fix point O
CGCenter of gravity
lDistance between CG and fix point O
β Swing angle of the compound pendulum
IOMoment of inertia relative to point O
β ¨ Swing angular acceleration
ω Angular frequency
ICGMoment of inertia relative to CG
TSwing period

References

  1. Gong, W.; Xia, M.; Yue, L.; Zheng, J.; Zheng, S. Numerical Investigation on Flow Features and Static Stability Characteristics of the V-Tail Aircraft. Flight Dyn. 2021, 39, 19–24. [Google Scholar] [CrossRef]
  2. Sanchez-Carmona, A.; Cuerno-Rejado, C. Vee-Tail Conceptual Design Criteria for Commercial Transport Aeroplanes. Chin. J. Aeronaut. 2019, 32, 595–610. [Google Scholar] [CrossRef]
  3. Phillips, W.F.; Hansen, A.B.; Nelson, W.M. Effects of Tail Dihedral on Static Stability. J. Aircr. 2006, 43, 1829–1837. [Google Scholar] [CrossRef]
  4. Metz, P. Flight Test of the YF-23A Advanced Tactical Fighter. In Proceedings of the Aerospace Design Conference, Irvine, CA, USA, 3–6 February 1992; American Institute of Aeronautics and Astronautics: Irvine, CA, USA, 1992. [Google Scholar]
  5. García-Hernández, L.; Cuerno-Rejado, C.; Pérez-Cortés, M. Dynamics and Failure Models for a V-Tail Remotely Piloted Aircraft System. J. Guid. Control Dyn. 2018, 41, 505–513. [Google Scholar] [CrossRef]
  6. Abzug, M.J. V-Tail Stalling at Combined Angles of Attack and Sideslip. J. Aircr. 1999, 36, 729–731. [Google Scholar] [CrossRef]
  7. Qiao, F.; Shi, J.; Qu, X.; Lyu, Y. Adaptive Back-Stepping Neural Control for an Embedded and Tiltable V-Tail Morphing Aircraft. Int. J. Control Autom. Syst. 2022, 20, 678–690. [Google Scholar] [CrossRef]
  8. Wang, L.; Zhang, N.; Liu, H.; Yue, T. Stability Characteristics and Airworthiness Requirements of Blended Wing Body Aircraft with Podded Engines. Chin. J. Aeronaut. 2022, 35, 77–86. [Google Scholar] [CrossRef]
  9. Leshikar, C.; Gosnell, S.; Gomez, E.; Moy, L.; Valasek, J. System Identification Flight Testing of Inverted V-Tail Small Unmanned Air System. In Proceedings of the AIAA SCITECH 2022 Forum, San Diego, CA, USA, 3–7 January 2022; p. 15. [Google Scholar]
  10. Jin, W.; Yang, Z.; Meng, D.; Chen, Y.; Huang, H.; Wang, Y.; He, S.; Chen, Y. Strength Desigh and Test of Advanced Fighter All-Moving Twin V-Tail Buffet. Acta Aeronaut. Astronaut. Sin. 2020, 41, 15. [Google Scholar] [CrossRef]
  11. Zhu, W. Models for Wind Tunnel Tests Based on Additive Manufacturing Technology. Prog. Aerosp. Sci. 2019, 110, 100541. [Google Scholar] [CrossRef]
  12. Fujii, K. Progress and Future Prospects of CFD in Aerospace—Wind Tunnel and Beyond. Prog. Aerosp. Sci. 2005, 41, 455–470. [Google Scholar] [CrossRef]
  13. Damljanović, D.; Vuković, Đ.; Ocokoljić, G.; Ilić, B.; Rašuo, B. Wind Tunnel Testing of ONERA-M, AGARD-B and HB-2 Standard Models at Off-Design Conditions. Aerospace 2021, 8, 275. [Google Scholar] [CrossRef]
  14. Ocokoljić, G.; Rašuo, B.; Kozić, M. Supporting System Interference on Aerodynamic Characteristics of an Aircraft Model in a Low-Speed Wind Tunnel. Aerosp. Sci. Technol. 2017, 64, 133–146. [Google Scholar] [CrossRef]
  15. Ivanco, T.G. Unique Testing Capabilities of the NASA Langley Transonic Dynamics Tunnel, an Exercise in Aeroelastic Scaling. In Proceedings of the AIAA Ground Testing Conference, San Diego, CA, USA, 24–27 June 2013; p. 23. [Google Scholar]
  16. Yang, X.; Liu, N.; Guo, C.; Zhang, Y.; Sun, J.; Zhang, G.; Yu, X.; Yu, J.; Hou, L. A Survey of Aeroelastic Wind Tunnel Test Techonlogy of Flight Vehicles. Acta Aerodyn. Sin. 2018, 36, 995–1008. [Google Scholar] [CrossRef]
  17. Raju Kulkarni, A.; La Rocca, G.; Veldhuis, L.L.M.; Eitelberg, G. Sub-Scale Flight Test Model Design: Developments, Challenges and Opportunities. Prog. Aerosp. Sci. 2022, 130, 36. [Google Scholar] [CrossRef]
  18. Gebbink, R.; Wang, G.; Zhong, M. High-Speed Wind Tunnel Test of the CAE Aerodynamic Validation Model. Chin. J. Aeronaut. 2018, 31, 439–447. [Google Scholar] [CrossRef]
  19. Tang, D.; Dowell, E.H. Effects of a Free-to-Roll Fuselage on Wing Flutter: Theory and Experiment. AIAA J. 2014, 52, 2625–2632. [Google Scholar] [CrossRef]
  20. Scott, R.C.; Allen, T.; Castelluccio, M.; Sexton, B.; Claggett, S.; Dykman, J.R.; Funk, C.; Coulson, D.; Bartels, R.E. Aeroservoelastic Wind-Tunnel Test of the SUGAR Truss Braced Wing Wind-Tunnel Model. In Proceedings of the 56th AIAA/ASCE/AHS/ASC Structures, Structural Dynamics, and Materials Conference, Kissimmee, FL, USA, 5–9 January 2015; American Institute of Aeronautics and Astronautics: Kissimmee, FL, USA, 2015. [Google Scholar]
  21. Allen, T.; Sexton, B.; Scott, M.J. SUGAR Truss Braced Wing Full Scale Aeroelastic Analysis and Dynamically Scaled Wind Tunnel Model Development. In Proceedings of the 56th AIAA/ASCE/AHS/ASC Structures, Structural Dynamics, and Materials Conference, Kissimmee, FL, USA, 5–9 January 2015; American Institute of Aeronautics and Astronautics: Kissimmee, FL, USA, 2015. [Google Scholar]
  22. Tang, J.; Wu, F.; Pu, L.; Zeng, X.; Zhang, H.; Zhang, L. Development of a Two Degrees of Freedom Support System for Full Model Gust Tests. J. Exp. Fluid Mech. 2021, 35, 94–99. [Google Scholar] [CrossRef]
  23. Gu, X.; Duc Vo, H.; Mureithi, N.W.; Laurendeau, E. Plasma Gurney Flap Flight Control at Low Angle of Attack. J. Aircr. 2022, 1–18. [Google Scholar] [CrossRef]
  24. Courtland, W.J.D.; Perkins, D.; Hage, R.E. Airplane Performance, Stability and Control. J. R. Aeronaut. Soc. 1950, 54, 607–608. [Google Scholar]
  25. Cusati, V.; Corcione, S.; Ciliberti, D.; Nicolosi, F. Design Evolution and Wind Tunnel Tests of a Three-Lifting Surface Regional Transport Aircraft. Aerospace 2022, 9, 133. [Google Scholar] [CrossRef]
  26. Zhao, D.; Lu, Z.; Zhao, H.; Li, X.Y.; Wang, B.; Liu, P. A Review of Active Control Approaches in Stabilizing Combustion Systems in Aerospace Industry. Prog. Aerosp. Sci. 2018, 35–60. [Google Scholar] [CrossRef]
  27. Jasa, J.P.; Brelje, B.J.; Gray, J.S.; Mader, C.A.; Martins, J.R.R.A. Large-Scale Path-Dependent Optimization of Supersonic Aircraft. Aerospace 2020, 7, 152. [Google Scholar] [CrossRef]
  28. Junos, M.H.; Mohd Suhadis, N.; Zihad, M.M. Experimental Determination of the Moment of Inertias of USM E-UAV. AMM 2013, 465–466, 368–372. [Google Scholar] [CrossRef]
  29. Hong, S.-I.; Hong, S.-C. Moments of Inertia of Spheres without Integration in Arbitrary Dimensions. Eur. J. Phys. 2014, 35, 025003. [Google Scholar] [CrossRef]
  30. Katz, J.; Walters, R. Effects of Large Blockage in Wind-Tunnel Testing. J. Aircr. 1995, 32, 1149–1152. [Google Scholar] [CrossRef]
  31. Lei, P.; Yu, L.; Chen, D.; Lyu, B. Influence of Flight Control Law on Body Freedom Flutter Characteristics: Experimental Study. Acta Aeronaut. Astronaut. Sin. 2021, 42, 124378. [Google Scholar] [CrossRef]
  32. Lei, P.; Lyu, B.; Yu, L.; Chen, D. Influence of Inertial Parameters on Body Freedom Flutter of Flying Wings. Acta Aerodyn. Sin. 2021, 39, 18–24. [Google Scholar]
  33. He, S.; Guo, S.; Liu, Y.; Luo, W. Passive Gust Alleviation of a Flying-Wing Aircraft by Analysis and Wind-Tunnel Test of a Scaled Model in Dynamic Similarity. Aerosp. Sci. Technol. 2021, 113, 106689. [Google Scholar] [CrossRef]
  34. Shi, P.; Liu, J.; Gu, Y.; Yang, Z.; Marzocca, P. Full-Span Flying Wing Wind Tunnel Test: A Body Freedom Flutter Study. Fluids 2020, 5, 34. [Google Scholar] [CrossRef] [Green Version]
  35. Yang, J.; Wu, Z.; Dai, Y.; Ma, C.; Yang, C. Wind Tunnel Test of Gust Alleviation Active Control for Flying Wing Configuration Aircraft. J. Beijing Univ. Aeronaut. Astronaut. 2017, 43, 184–192. [Google Scholar]
  36. Ricci, S.; De Gaspari, A.; Riccobene, L.; Fonte, F. Design and Wind Tunnel Test Validation of Gust Load Alleviation Systems. In Proceedings of the 58th AIAA/ASCE/AHS/ASC Structures, Structural Dynamics, and Materials Conference, Grapevine, TX, USA, 9–13 January 2017; American Institute of Aeronautics and Astronautics: Grapevine, TX, USA, 2017. [Google Scholar]
  37. Scott, R.; Coulson, D.; Castelluccio, M.; Heeg, J. Aeroservoelastic Wind-Tunnel Tests of a Free-Flying, Joined-Wing SensorCraft Model for Gust Load Alleviation. In Proceedings of the 52nd AIAA/ASME/ASCE/AHS/ASC Structures, Structural Dynamics and Materials Conference, Denver, CO, USA, 4–7 April 2011; American Institute of Aeronautics and Astronautics: Denver, CO, USA, 2011. [Google Scholar]
Figure 1. The design process of the aircraft model.
Aerospace 09 00792 g001
Figure 2. Aerodynamic shapes of the present aircraft.
Aerospace 09 00792 g002
Figure 3. CFD calculation process: (a) the path lines and (b) the aerodynamic coefficient iteration process.
Aerospace 09 00792 g003
Figure 4. Aerodynamic coefficients calculated by CFD: (a) lift coefficient; (b) pitch moment coefficient; and (c) hinge moment.
Aerospace 09 00792 g004
Figure 5. Force analysis of the aircraft.
Aerospace 09 00792 g005
Figure 6. The lift coefficient and pitch moment coefficient curves.
Aerospace 09 00792 g006
Figure 7. CG and AC positions of the aircraft.
Aerospace 09 00792 g007
Figure 8. Pitch moment coefficient based on the new CG.
Aerospace 09 00792 g008
Figure 9. The aircraft model installed with the wind tunnel test support system.
Aerospace 09 00792 g009
Figure 10. Structure design of the aircraft.
Aerospace 09 00792 g010
Figure 11. Structure design and assembly of the fuselage core board. The materials of the core board: ① carbon fiber; ② balsa wood; and ③ carbon fiber.
Aerospace 09 00792 g011
Figure 12. The wing structure and its joint with the fuselage.
Aerospace 09 00792 g012
Figure 13. Structure and assembly of the V-tails.
Aerospace 09 00792 g013
Figure 14. The final wind tunnel test aircraft model.
Aerospace 09 00792 g014
Figure 15. V-tail actuator and its force analysis process.
Aerospace 09 00792 g015
Figure 16. Force analysis of the aircraft installed in the present support system.
Aerospace 09 00792 g016
Figure 17. The compound pendulum.
Aerospace 09 00792 g017
Figure 18. Moment of inertia measurement test using compound pendulum method.
Aerospace 09 00792 g018
Figure 19. The flight control model.
Aerospace 09 00792 g019
Figure 20. The longitudinal control law.
Aerospace 09 00792 g020
Figure 21. Simulation results of the flight control law: (a) the height result by Simulink; (b) the height result by semi-physical simulation; (c) the pitch angle result by Simulink; and (d) the pitch angle result by semi-physical simulation.
Aerospace 09 00792 g021aAerospace 09 00792 g021b
Figure 22. The full model aircraft assembled in the wind tunnel test section.
Aerospace 09 00792 g022
Figure 23. Auxiliary springs for suspending the present model.
Aerospace 09 00792 g023
Figure 24. Trim angles of attack at different wind speeds.
Aerospace 09 00792 g024
Figure 25. Pitch angle control time history curves at different wind speeds: (a) 16 m/s; (b) 20 m/s; and (c) 24 m/s.
Aerospace 09 00792 g025
Figure 26. Captures when the model reached different target pitch angles: (a) −5°; (b) 0°; (c) 5°; and (d) 10°.
Aerospace 09 00792 g026
Figure 27. The pitch angle and tail deflection angle time history curves at wind speed 24 m/s: (a) 5° and (b) −5°.
Aerospace 09 00792 g027
Figure 28. Height time history curves at different wind speeds: (a) 24 m/s and (b) 30 m/s.
Aerospace 09 00792 g028aAerospace 09 00792 g028b
Figure 29. Height, pitch angle and tail deflection angle time history curves at wind speed 24 m/s and the target height was 110 mm.
Aerospace 09 00792 g029
Figure 30. Captures of the test when the model arose at wind speed 24 m/s to the height 110 mm.
Aerospace 09 00792 g030
Table 1. Model geometric parameters.
ParametersValue
Scale ratio8%
Length1.82 m
Wingspan1.28 m
MAC0.32 m
Dihedral angle of V-tails40°
Publisher’s Note: MDPI stays neutral with regard to jurisdictional claims in published maps and institutional affiliations.

