Article

A Novel Holistic Index for the Optimization of Composite Components and Manufacturing Processes with Regard to Quality, Life Cycle Costs and Environmental Performance

by
Christos V. Katsiropoulos
*,† and
Spiros G. Pantelakis
Laboratory of Technology & Strength of Materials, Department of Mechanical Engineering & Aeronautics, University of Patras, Panepistimioupolis Rion, 26500 Patras, Greece
*
Author to whom correspondence should be addressed.
These authors contributed equally to this work.
Aerospace 2020, 7(11), 157; https://doi.org/10.3390/aerospace7110157
Submission received: 4 September 2020 / Revised: 13 October 2020 / Accepted: 26 October 2020 / Published: 30 October 2020
(This article belongs to the Special Issue Advances in Aerospace Sciences and Technology)

Abstract

:
In the present work, a novel holistic component and process optimization index is introduced. The Index is aimed to provide a decision support tool for the optimization of aircraft composite components and manufacturing processes as well as for the selection of the appropriate manufacturing technique of a component when various techniques are considered as manufacturing options. The criteria involved in the index are quality, cost and environmental footprint functions which are considered to be interdependent. In the present concept quality is quantified through measurable technological features which are required for the component under consideration. Cost has been estimated by implementing the Activity Based Concept (ABC) using an in house developed tool. Environmental footprint is assessed by exploiting the ReCiPe method using the ‘open LCA’ software. The weight factor of each of the above criteria in the Index is calculated by using the Multi Criteria Decision (MCD) method Analytic Hierarchy Process (AHP). The Index developed has been applied to support the selection of the appropriate production technique for a typical aeronautical composite part. The alternative manufacturing options considered have been the Automated Fiber Placement (AFP) as well as the classical Autoclave manufacturing technique. By considering quality as the prevailing factor for meeting a decision the index confirms the advantage of the Autoclave process. Yet, by considering the environmental footprint and/or cost to be of equal or higher significance to quality, the implementation of the index demonstrates the clear advantage of AFP process.

Graphical Abstract

1. Introduction

The mainstream composite material type for aeronautical applications is carbon fiber reinforced epoxies. However, issues associated with their long curing cycles which lead to low production rates, the growing environmental concerns associated with their end of life treatment as well as the adoption of stricter environmental policies have turned the attention of the aeronautical industry to thermoplastic composites as a promising alternative solution [1,2].
Thermoplastic composites exhibit superior impact and chemical resistance, unlimited self-life as well as the ability of assembling sub-structures by welding and recyclability [3]. On the downside the higher processing temperatures and pressures needed for processing these materials, leading to increased energy consumption and cost, are key barriers for their wide range use for the construction of primary structures by the aeronautical industry [4]. Additionally, the deterioration of the mechanical properties of the materials during the recycling process due to the difficulties in the incorporation of the recycled fiber systems into the matrices [1,5] poses a burden for further exploiting their recyclability. Regardless whether dealing with thermosets or thermoplastics, cost and environmental footprint for producing an aircraft component are nowadays of critical concern, in addition to the non-negotiable demand for reduced weight by satisfactory quality.
In general, Life Cycle Costing (LCC) and Life Cycle Assessment (LCA) models are used individually prior manufacturing as tools either for the selection of the most suitable process among a number of candidates or for the process optimization if the manufacturing technique is already predefined. As mentioned, meeting the quality requirements of the component, in terms of predefined quality features like for example critical mechanical properties and so forth, remains a non-negotiable demand. Yet, in most cases a quality increase is associated to an increase of cost and in several cases also to an increase of environmental footprint and vice versa. Therefore quality of the component as well as the overall environmental footprint and cost of the product including component manufacturing process and End-of-Life-Cycle need to be considered already at the component design phase as component optimization interdependent objective functions.
Several studies have been conducted for evaluating separately the financial viability or the environmental footprint of structures made from composite materials [6,7,8,9,10,11,12,13,14,15,16,17,18,19,20,21,22,23,24,25]. A number of existing works are dedicated to the cost estimation analysis of the processing of structural components; manufacturing process or component quality optimization are made as independent processes [9,19,20,21,22]. In Reference [9] process simulation and cost analysis have been made during the manufacturing process of a rotor blade pitch horn by Eurocopter to justify the replacement of a manual prepreg manufacturing process by a novel, semi-automated preforming process. In Reference [22] cost modeling tools are used to estimate the manufacturing cost of automotive and aircraft components using liquid composite molding processes by giving emphasis on RTM. The works in References [23,24] include optimization methodologies which lead to a set of optimal part or/and process parameters; they reduce the total manufacturing cost and, hence, increase the cost effectiveness of the component or process under investigation.
In Reference [8], Timmis et al. evaluated the environmental footprint reduction resulted from the adoption of composite materials in aviation. The results pointed out that although carbon fiber reinforced polymers demonstrate increased environmental impact during the manufacturing and disposal phase, they represent an environmentally more friendly solution as compared to other traditional materials (i.e., aluminum) when the environmental impact is limited to the in use phase of the aircraft. Yet, this analysis is not accounting for End of Life Analysis and re-usability aspects. Duflou et al. [11] and Song et al. [6] quantified the environmental footprint of composites when they are replacing steel. It is worth noting that although steel is of great importance in automotive applications it is of rather limited use in aircraft structural applications (e.g., 7% in A350). Both latter studies demonstrated that composite materials outperformed steel due to the weight savings that they offer during the mentioned in use phase.
On the other hand, a number of existing works refers to combined LCA and LCC analyses involved for several types of materials [7,8,9,10,11,12,13,14,15,16,17,18,19,20,21,22,23,24,25,26,27,28,29,30,31,32,33,34]. However the relevant works which refer to composites remain limited. In Reference [28] the application of a Life Cycle Assessment (LCA)/Life Cycle Costing (LCC) integrated model is described for the comparison of an Anti-Glare Lamellae (AGL) currently manufactured from virgin HDPE with an alternative one made from recycled High Density Poly Ethylene (HDPE). In Reference [29] LCA studies as well as an LCC analysis were carried out for a refractory brick production and in Reference [30] the process-based cost and environmental footprint profile assessments of a green composite were made. In Reference [31] the environmental and financial credits of different waste treatment routes (disposal, incineration for energy recovery and mechanical recycling) of carbon fiber reinforced composites is investigated. The results demonstrated that the environmental benefits occurred from mechanical recycling are impaired from the severe deterioration of the mechanical properties of the fibers leading to a low market value product.
In Reference [32] the combined economic and environmental effects of substituting steel used for a car bulkhead by material alternatives which are lighter was investigated with the focus on composite materials; thus four material scenarios as well as an automated preforming technology combined with reaction injection molding had been chosen. Manufacturing and life cycle costs were derived involving a cost model and the environmental performance of each scenario was quantified using LCA according to International Standard Organization (ISO) guidelines.
In parallel, efforts have been undertaken in optimizing structural components with regard to their quality and cost by considering quality and cost as interdependent functions of the manufacturing process parameters [3,17,18,35,36,37,38,39,40,41]. In Reference [17] a concept, namely the PICANT concept, as well as the respective software for applying it, were introduced allowing for the cost estimation of a product already during the design phase by selecting the prospective manufacturing process of the product amongst various potential manufacturing processes and possible product design alternatives; it represents one of the first research efforts to optimize an aircraft structural component with regard to its quality and cost. In an early study, an APC-2 thermoplastic composite astray-like sample was produced using an infrared heated cold diaphragm forming device at laboratory scale [18]. The process was derived and optimized with regard to its quality and cost. The manufacturing of a helicopter’s canopy produced using the cold diaphragm forming technique is optimized from a financial and qualitative standpoint [35]. Furthermore, in Reference [36] the optimal process parameters of a Laser Transmission Welding system as well as the optimal heating cycle for welding thermoplastic lap joints were obtained in the form of a reference welding temperature along with an allowable process window, which meets the minimum quality requirements. The results of the study were successfully exploited by an aircraft industry to weld stiffeners on aircraft’s fuselage panel. Moreover, in References [38,39] an approach to design fuselage frames for minimum weight, as well as minimum cost is proposed.
However, despite the mentioned efforts, tools and concepts allowing for a holistic and interdependent optimization of a product with regard to quality, cost and environmental impact still need to be developed.
To this end, in the present work, a novel holistic component and process optimization Index is introduced. The Index is aimed to provide a decision support tool for the optimization of aircraft composite components and manufacturing processes as well as for the selection of the appropriate manufacturing technique of a component when various techniques are considered as manufacturing options. It should be underlined that the implementation of the proposed index is not limited to aerospace structures. The Index can be exploited for the optimization of any industrial composite component or process where Quality, Environmental footprint and Cost are of concern. The criteria involved in the Index are quality, cost and environmental footprint functions which are considered to be interdependent.

2. The Index

For the formulation of the proposed Index the underlying consideration is that quality, cost and environmental footprint are design features that need to be taken into account already at the design stage of a structure. Said features are not independent but are interrelated ones. The optimization process of a structure is understood as the effort to achieve an optimum tradeoff between quality, cost and environmental footprint by considering the entire life cycle of the component.
For the implementation of the Index quality needs to be quantified by setting measurable technological features which are required for the component under consideration. Hence, said quality features and the respective objective functions are component specific. For structural applications the selected quality features are usually evaluated through mechanical tests. The Index accounts for cradle-to-cradle Life Cycle Costing (LCC) and Life Cycle Analysis (LCA) models. Cost is estimated by implementing the Activity Based Concept (ABC) using a tool developed in-house [35]. This tool (LTSM Process Optimization Software Tool -LTSM-OPT) enables the user to carry out an optimization procedure, where the input is the process parameters as well as the allowable range of parameters variation and the output is the optimized set of parameters with regards to the manufacturing cost. Environmental footprint is assessed by exploiting the ReCiPe method [42] using open LCA software. Usually, the success of achieving high quality of a component by involving for instance the Autoclave process is compensated by the increased cost and the environmental footprint which are associated to the use of the Autoclave. To achieve an optimum balance between these contradictive design demands Multi Criteria Decision methods (MCD) [43,44,45] need to be involved. For the present Index the Multi Criteria Decision method Analytic Hierarchy Process (AHP) [46,47] has been exploited.
On the base of the above considerations a holistic Index P is introduced as:
P = K Q Q K cos t C K e n v E
where: Q is the selected quality feature or function, determined as Q = Q c a s e Q a u t o c l a v e ; Qcase refers to the quality obtained for the case under investigation and Qautoclave refers to the respective values when using an autoclave which is considered as reference point. It implies the assumption that by involving the autoclave, the properties under consideration are taking their maximum value, that is, the component has the best quality. Qcase is understood as certain mechanical or other technological properties which are significant for the structural component under consideration; apart from the mechanical properties, any other technological property which is influenced by the selection of the manufacturing process parameters and is of critical concern for the component under consideration can be defined as quality feature. The dependency of the selected properties to the component’s manufacturing process parameters are derived experimentally and formulated using appropriate mathematical expressions. Such functions may be found in [35] and a representative example is shown in Table 1.
C is the term accounting for the cost of the component and is defined as C = C c a s e C a u t o c l a v e . Ccase corresponds to the total cost estimated through the cost analysis made for the case under investigation; Cautoclave corresponds to the respective costs by using the autoclave process which is considered as reference point. The definition of the autoclave as the reference point implies the assumption that the autoclave is the most cost consuming process among the processes currently in use. Ccase and Cautoclave are functions relating the cost of the structural component under consideration to the manufacturing process parameters and are derived empirically. Such functions may be found in [7] and a representative example is shown in Table 1. C is understood as a ‘penalty’. Therefore in Equation (1) its value is deduced from the quality term value Q. The higher is the value of the ratio C c a s e C a u t o c l a v e , that is, the ratio of the cost of the manufacturing process under consideration to the cost of using the Autoclave, the higher is also the ‘penalty’ to the Index’s value.
E is the term of the Index accounting for the environmental footprint and is defined as E = E c a s e E a u t o c l a v e . Ecase stands for the sum of the most aggravating environmental factors calculated by means of an LCA tool for the case under investigation, namely E = Climate change plus Freshwater Eco toxicity plus Ionizing radiation. Eautoclave refers to the respective value of the autoclave process which is used as reference point assuming it is the most environmentally aggravating process among the processes currently in use for producing aircraft structural thermoplastic components. Ecase and Eautoclave are also functions of the manufacturing process parameters and are derived empirically. Such functions may be found in [7] and a representative example is shown in Table 1. Also E is understood as a ‘penalty’ and therefore it is also deduced from the value of quality term Q. The higher is the environmental footprint of the manufacturing process considered the higher is also the ‘penalty’.
In the example of the Table 1, Quality is defined as the shear strength of a plate. Referred quality function has been developed empirically for a plate produced by using the Diaphragm Forming Technique [35]; τ, T and t stand for the shear strength, process temperature and process time respectively. F1 is a constant which depends on material and selected process. The cost of the heating sub-process during the Diaphragm Forming Technique is estimated using the empirical cost function (Cost Estimation Relationship-CER) [35] shown in Table 1; κinf, NH, D and THPL stand for the cost of infrared lamp per hour, number of heating lamps, distance between lamp and thickness of ply, respectively. C1, C2, C3, C4 are constants which depend on material and selected process. At last, the Global Warming Potential (GWP100) which is a common index among LCA studies for evaluating the environmental footprint [4] is calculated using the environmental footprint function of Table 1; it relates the total energy of each sub-process Ei to the process time t and the process temperature T. mCO2eq stands for the mass in kg of CO2 emission that is produced from the consumption of 1 kWh of electricity.
KQ, Kenv, Kcost in Equation (1) stand for dimensionless weight factors which depend on the application and the design restrictions set and reflect the significance of each term for the overall value of the Index. To reduce subjectivity on defining the weight factors they are calculated using the Analytic Hierarchy Process (AHP) which represents a widely used Multi Criteria Decision (MCD) making methodology when a tradeoff between contradicting effects and the desirable result is of concern [44].
According to the above definitions the maximum value that the proposed index can take is 1. This value can be achieved only theoretically. The index value 1 refers to the ‘ideal’ product that would have perfect quality represented through the quality of the laminated prepreg material produced with autoclave, zero environmental footprint and zero cost. It is worth noticing that the proposed index offers the flexibility to set limitations and constraints depending on the application. For example certain quality requirements can be set through threshold values of certain properties. All manufacturing options do not satisfy these limitations are excluded regardless of their index value or the values of its terms. To sum up, the index can support two different kinds of decisions: if for manufacturing a specific component one single process is considered the index can be utilized for the instant assessment of the process parameters impact to the cost, quality and environmental footprint; thus these parameters can be adjusted accordingly such as to achieve an optimized process. Alternatively, the index can be utilized for the comparison between a number of alternative processes assuming that they are already optimized processes. The result of the comparison is the selection of the most suitable process among the existing alternatives. The proposed Index is applicable to thermoset as well as to thermoplastic composites by using the appropriate functions for the terms involved in the index. It should be noticed that as for both types of materials the Autoclave process is the most common it can be used for both as a reference.

3. Definition of the Case Study

For the validation of the introduced index two alternative manufacturing techniques will be considered as candidate processes for producing a fuselage panel, namely component 46 of the Boeing 787 Dreamliner [48], Figure 1; the main geometrical features of the component are shown in Table 2. The Index will be exploited to support the decision for the selection of the most suitable one. The first manufacturing technique considered has been the classical Autoclave. For the present case study the very promising Automated Fiber Placement (AFP) process is considered as an alternative. The AFP concept is expected to lead to reduced manufacturing time and costs and in parallel maintain a satisfactory quality as in the present study it is facilitated not only for the lay-up process but also for the in-situ consolidation process (ISC) of the material. For the sake of the present analysis the panel is assumed to be made of a carbon fiber thermoplastic composite material (APC-2/AS4), with a 65% fiber volume fraction. The total mass of the panel was considered equal to 1814 kg [48]. The resulting mass of the carbon fibers and the epoxy has been calculated to be equal to 1179.1 kg and 634.9 kg, respectively. The considered recycling scenario included pyrolysis as it is currently one of the most widely used processes for recycling composites [48].

4. Methodology

To define the terms of the Index P in Equation (1) quality, cost and environmental footprint analyses have to be made. The methodology followed for performing these analyses is described in the following chapters.

4.1. Quality Analysis

For performing the required analysis quality needs to be quantified through appropriate measurable material features which could be a single value of a material’s feature, a set of properties or a function describing the dependency of the material characteristics selected to a variety of variable manufacturing process parameters. In the present study quality is understood as the compliance with certain critical mechanical properties of the component. In this frame, for simplicity, the ILSS property has been considered to be the only critical mechanical property since it is directly related to the quality of consolidation as well as to the achieved crystallinity level of the thermoplastic materials. Using experimental data the manufacturing process parameters of the Autoclave and the AFP processes will be related to the selected critical mechanical properties to derive the required Quality Functions (QFs).

4.2. Life Cycle Costing

Unlike comparative techniques, process oriented cost models are adaptable to new processes, enable identification and quantification of the part’s cost drivers, and may be used in order to decide on improvements in manufacturing processes. In the present work, a life cycle costing model based on the principles of the Activity Based Costing (ABC) method is implemented for evaluating the total cost as well as tracking off the main contributors to the total cost. ABC is a costing method that derives the product’s cost as a sum of the costs of all activities involved to make a product. These activities may refer to a single process or to a production line. An overview of the ABC method is shown in Figure 2.
In general the ABC method consists of the following four steps [35]:
(1)
Identification of the activities or transactions that cause costs during the product development (sub-processes and main processes).
(2)
Identification of the cost drivers to each sub-process.
(3)
Assignment of costs to each sub-process via the creation of the Cost Estimation Relationships (CERs). The CERs are functions that take into account the geometrical features of a material or a product like perimeter, surface, length, shape complexity, mass, as well as the processing parameters for calculating the final cost.
(4)
Summation of the costs of sub-processes that occur to ‘make’ a product.
In ABC the costs of all work steps, with their costs for material, work, and so forth, are added to build the final cost of a product, Figure 2 [35]. This technique demands deep understanding of the process and is able to provide a meticulous insight into the total cost.
In the performed LCC costs associated with labor, material and energy were calculated. The performed cost analysis accounts also for recycling cost which was assumed to be equal to the energy cost of the recycling process.

4.3. Life Cycle Analysis

In the present work Life Cycle Analysis was made by implementing the ISO 14040:2006 [49]. ISO 14040:2006 is a commonly used tool that describes the principles for carrying out an LCA. According to the above standard LCA involves the stages shown in Figure 3. The first stage is the goal and scope definition where the purpose of the study, the system boundaries and the level of detail are defined. The second stage of the LCA is the inventory analysis where all inputs (raw materials, energy etc.) and outputs (emissions to the environment) of the system are quantified. The third stage of the LCA is the impact assessment which is a significant one as it associates the inventory data with impact categories providing additional information for a deeper understanding of a product’s environmental footprint. Finally, during the interpretation stage, the results of the analysis are summarized and discussed, as well as recommendations and decisions are made according to the initial goal of the analysis.
Based on this approach, a critical assessment of the environmental impacts for the entire life of the produced component was made by using an LCA model for conducting the analysis for the fuselage panel production and recycling; it involves the ReCiPe method [42] as well as relevant software. ReCiPe2016 provides a state-of-the-art method to convert life cycle inventories to a limited number of life cycle impact scores on midpoint and endpoint level; 17 midpoint categories and 3 endpoint categories are included in line with the global nature of many product life cycles [42].

4.4. Multi Criteria Decision—AHP Process

As mentioned above, the weight factors are defined using the Analytic Hierarchy Process (AHP) which represents a widely used Multi Criteria Decision (MCD) making methodology. The goal of MCD methods is not to prescribe the “best” decision to be chosen but to help decision makers selecting a single alternative or a short-list of acceptable alternatives that best fit to the defined needs and are coherent with defined preferences which are expressed through a finite set of conflicting criteria [45]. In the literature several MCD making methods are available (such as ELECTRE [50], AHP [51], MAUT [52]). Amongst them the Analytic Hierarchy Process (AHP) has been established as one of the most prevalent and popular ones [44]. The basic idea behind AHP is to convert subjective assessments of relative importance into a set of overall scores and weights.
In short, AHP is a method to derive ratio scales from a series of paired comparisons. The first step of AHP is to decompose the decision problem into a hierarchy of sub-problems, by arranging the relevant factors of the problem into a hierarchic structure that descends from an overall goal to criteria, sub-criteria and alternatives in successive levels, as shown in Figure 4.
Level 0 is the goal of the analysis. Level 1 is the multi criteria level that consists of several factors. The last level (level 2 in figure above) represents the alternative choices. The lines between levels indicate relationships between factors, choices and goal. As AHP is “a theory of measurement through pairwise comparisons”, it relies on the judgments of experts to derive priority scales [45]; thus every factor is paired in comparison to the others using a specific priority scale. The use of pairwise comparisons can allow decision makers to define weight coefficients and compare alternatives with relative ease.
In this context, level 1 involves a comparison matrix that corresponds to each pair-wise comparison between the factors with respect to the goal. As shown in Figure 4, each alternative ‘choice’ is connected to each ‘factor’ thus resulting to 4 comparison matrices. Each of these matrices has size 4 by 4. According to the AHP process, and based on the comparison matrices made, the weight factors are defined from Priority vectors.

4.5. Optimization

Τo optimize the process under investigation, the selected process parameters are varied so as to obtain the maximum Index value. To ensure an acceptable quality, a constraint is set and only the sets of parameters that meet this constraint are kept. The set of process parameters that results to the maximum Index is selected amongst the available combinations and the optimized process parameters are defined. The optimization process followed is shown schematically in Figure 5.

5. Results and Discussion

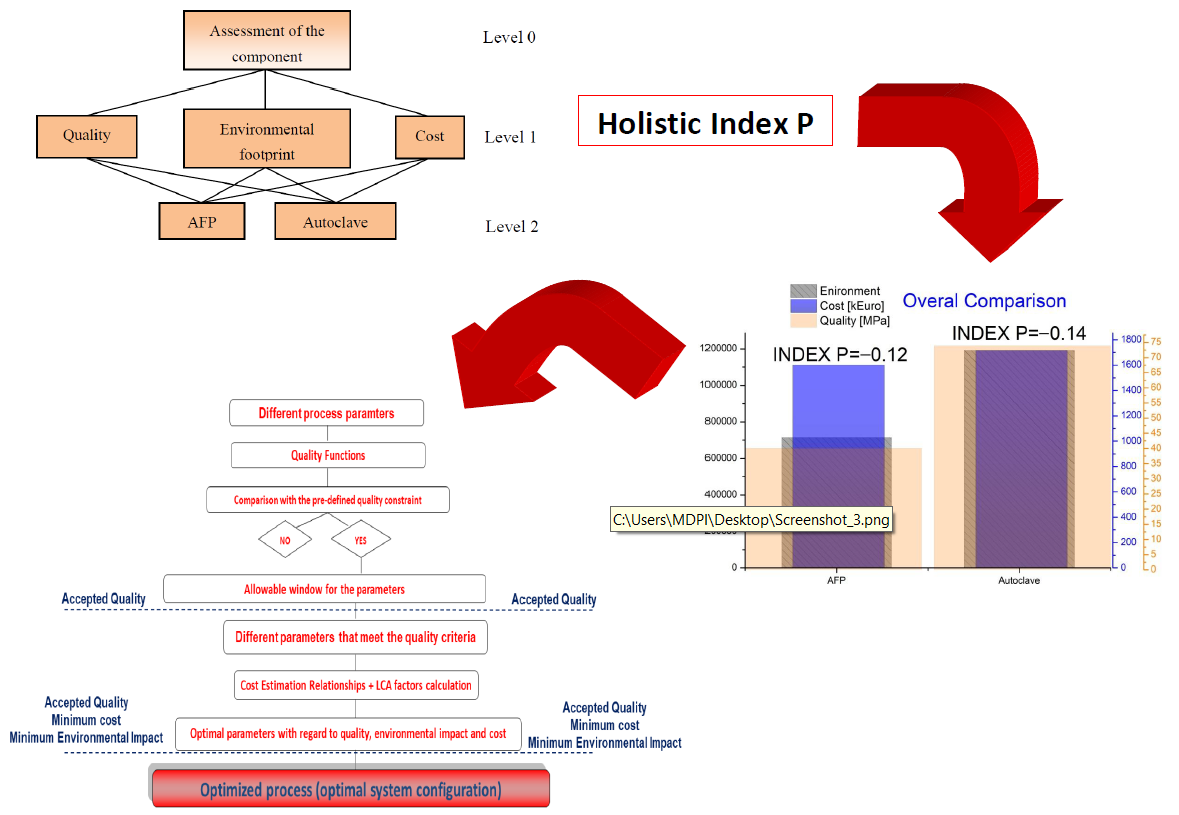
The methodology described above will be implemented to derive the Index P for the AFP and the Autoclave process respectively, so as to facilitate a decision on which of them is the most suitable for manufacturing the specific component under consideration. However, as AFP is a new process which is not optimized yet the introduced Index P will be first exploited to optimize the AFP process before comparing it to the Autoclave.

5.1. Quality Analysis

It is known that the mechanical properties of a thermoplastic composite component depend on the heating process parameters involved to manufacture the component, namely the heating temperature, the heating time, the cooling rate and so forth. These dependencies along with the design allowances of the component concerning mechanical properties set a “window” for the process parameters for achieving a component of acceptable quality. As mentioned, in this work the material investigated was PEEK/carbon. The mechanical property considered as quality feature for the fuselage panel was the Inter-Laminar Shear Strength (ILSS) as it represents a critical mechanical property for the application under consideration and is directly related to the achieved crystallinity level of the thermoplastic material. The dependency of the ILSS value on the main AFP process parameters has been investigated in [53]. These results are exploited in the present study to formulate the required Quality Function. Mentioned experimental results are shown in Table 3 [53].
To derive the Quality Function (QF), which is an equation that relates the investigated quality parameter ILSS with the selected AFP process parameters, a regression fitting analysis of the experimental data was carried out. The result of this analysis is the definition of the most appropriate mathematical expression relating the existing process data to the respective fitting coefficients. The derived QF as well as the fitting coefficients fi, f2, f3 and f4 are given in Table 4. In the equation, T stands for Nozzle temperature, r for the process rate, Fc for the compaction force and L for the distance between nozzle and the material.

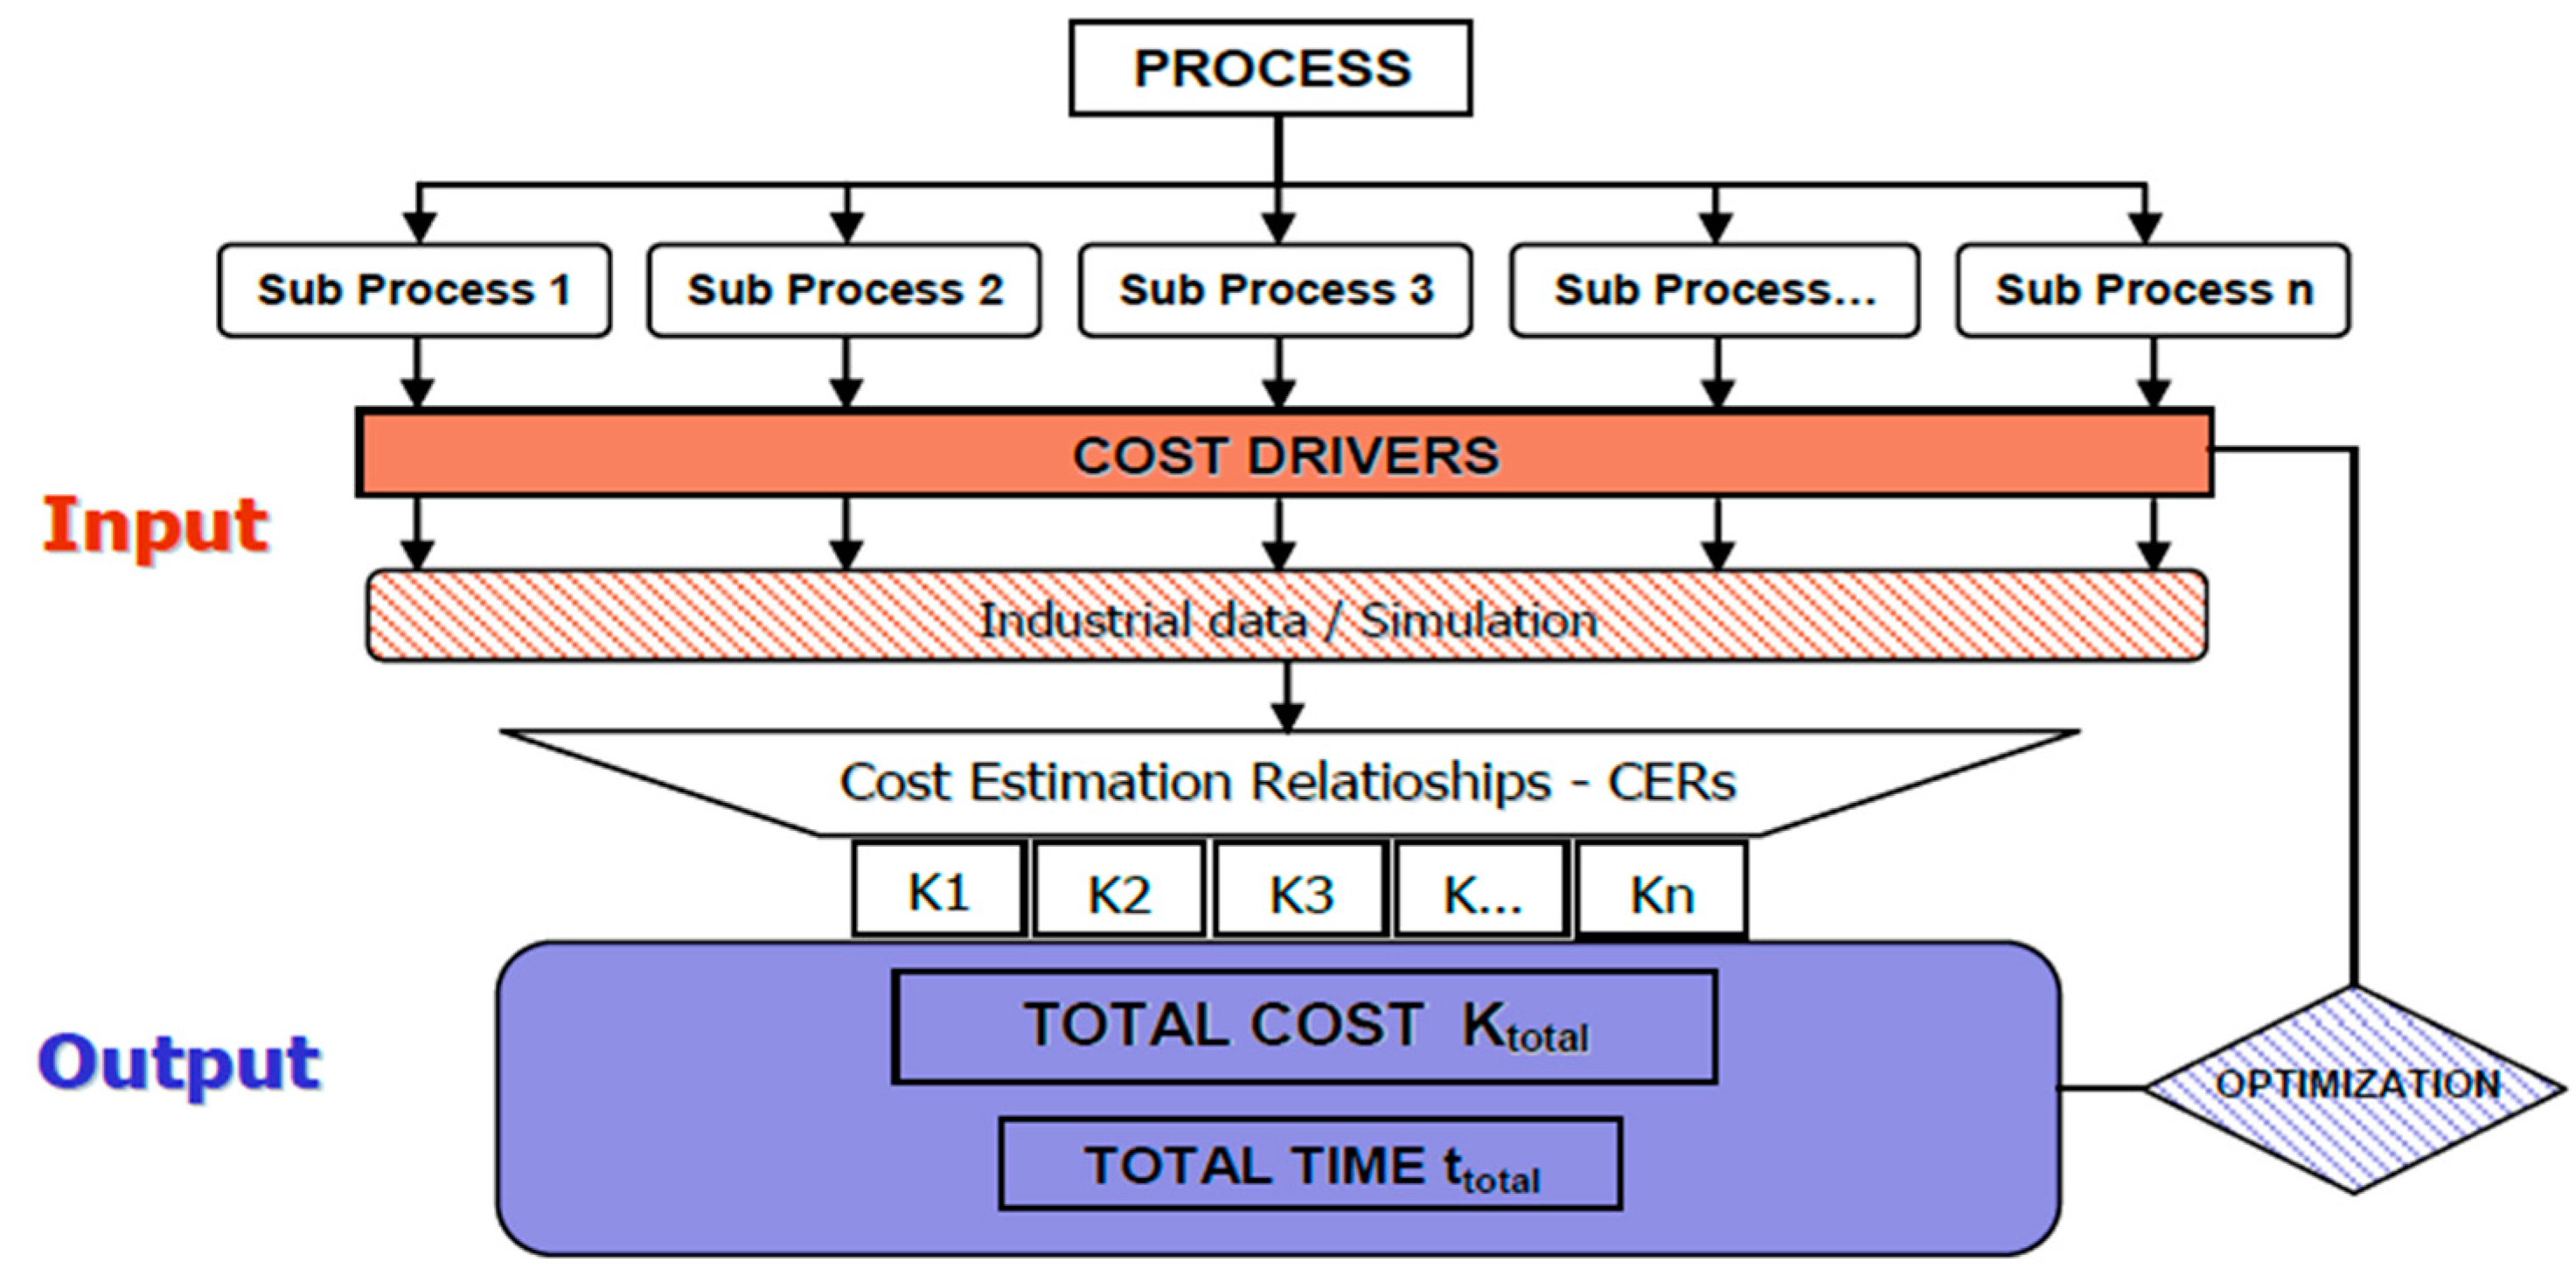
5.2. Life Cycle Costing

For performing the Life Cycle Analysis Cost Estimation relationships (CERs) relating costs to the main Cost Drivers of the process need to be formulated. The Cost Drivers have been classified to Cost Drivers related to manufacturing process parameters (Heating temperature, Lay-up Speed, Compaction Force, etc.), Labor cost of the specialized worker per hour, Material and Infrastructure cost data and the features of the component under consideration (Weight of Part, Total Part Area, Number of plies, Complexity, etc.). The Cost Drivers considered for the present analysis are summarized in Table 5.
The derived Cost Estimation relationships (CERs) for the above classes of Cost Drivers are summarized in Table 6, Table 7 and Table 8.
For the purpose of the LCC analysis the cost of 1 kWh was considered equal to 0.114 € [54] and the labor cost equal to 32.6 €/h [54]. The cost of the raw material was considered equal to 40 €/m2. Additionally, the empirical assumption of an average 15% of scrap and infra-structure material based on Reference [35] was made for all the manufacturing stages.
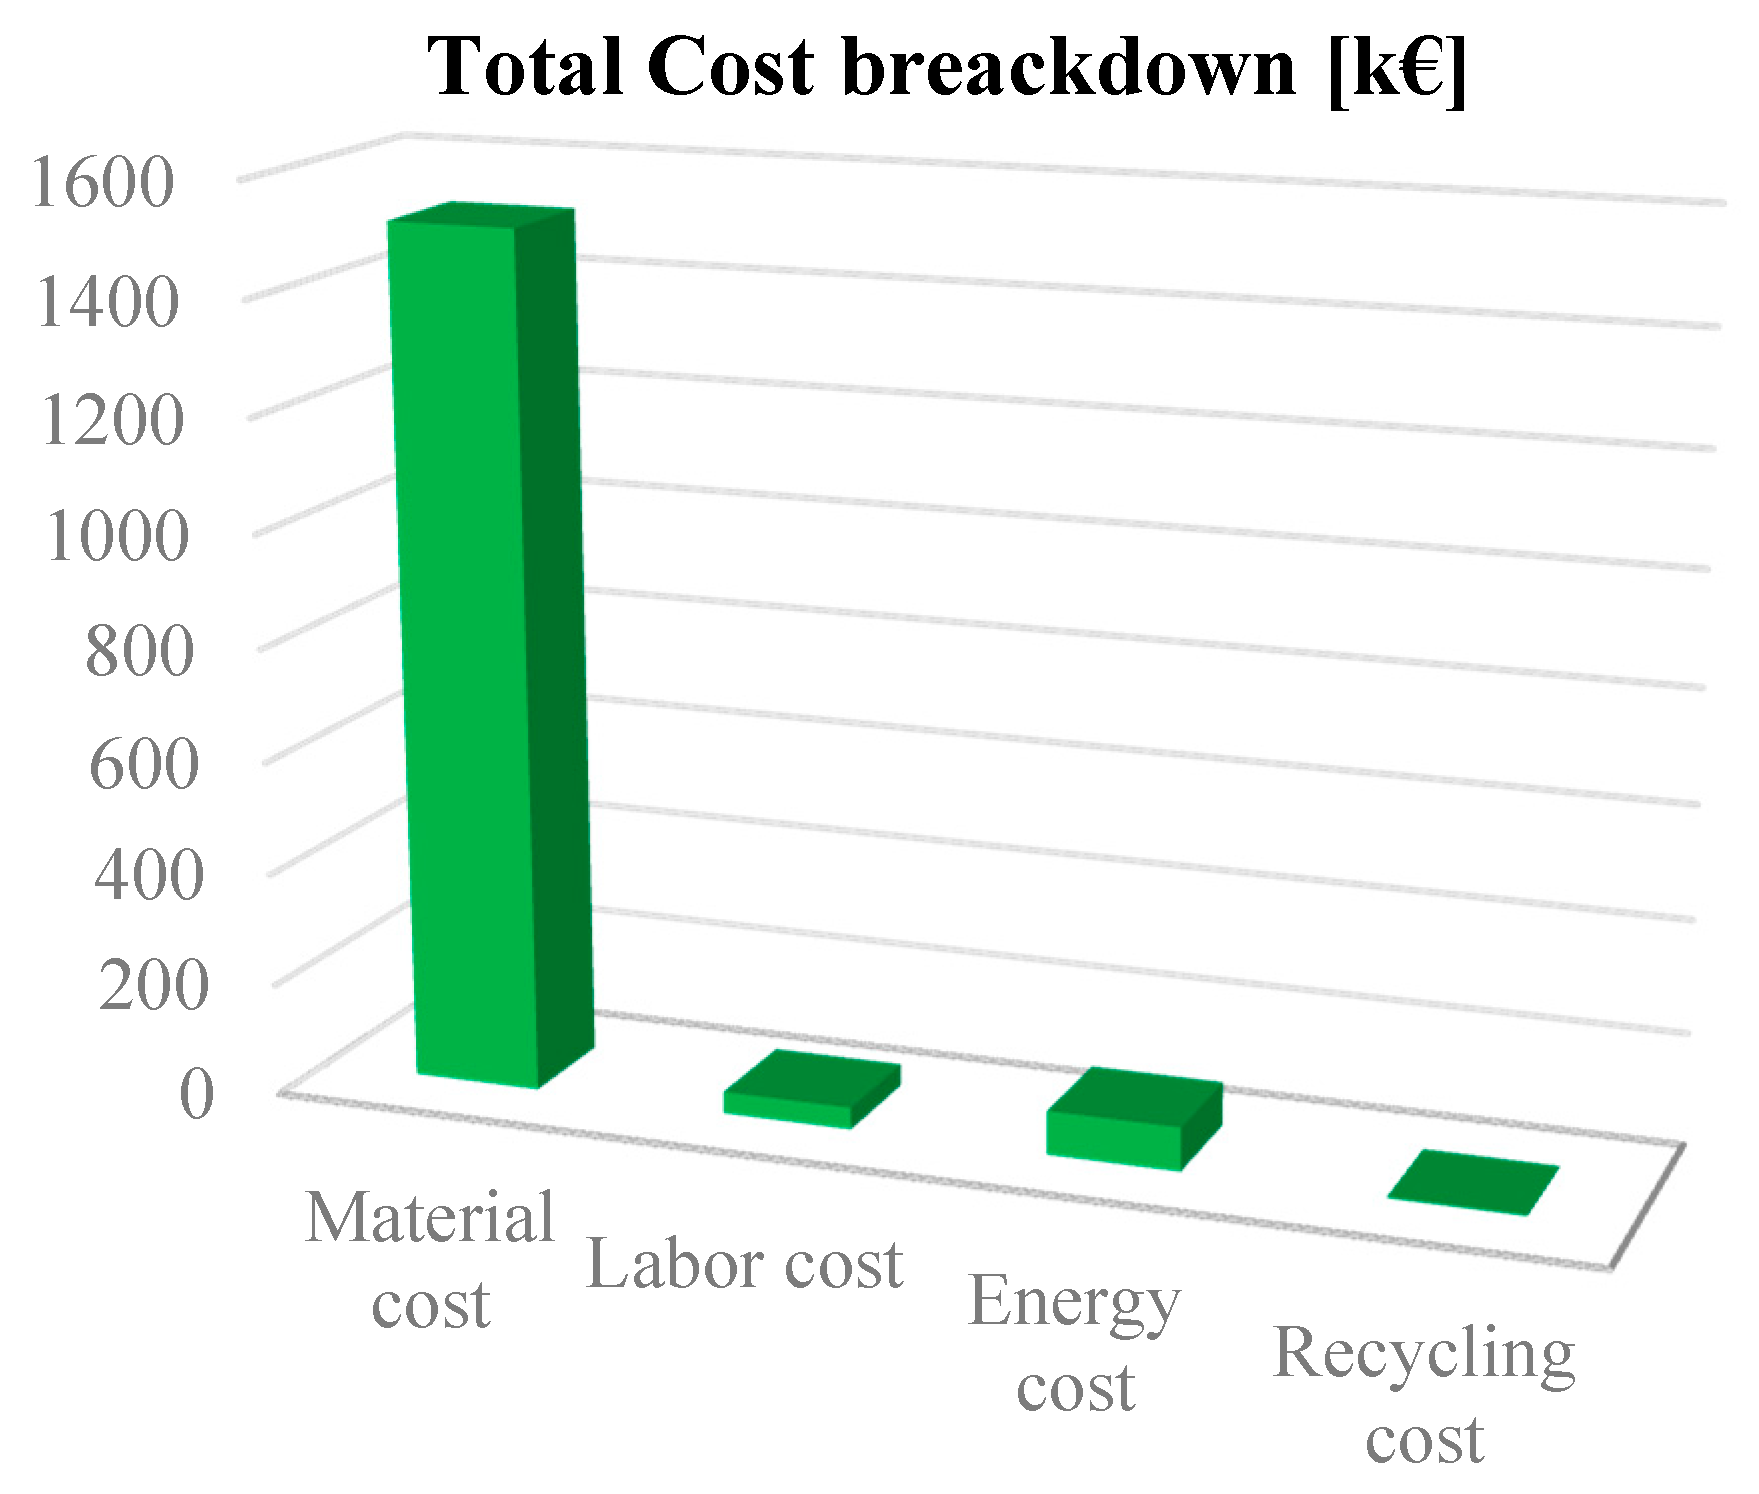
The results from the cost analysis (Figure 6) demonstrated that the main contributor to the total cost of the component is the material cost. This result is mainly due to the high raw material cost of the involved semi-crystalline thermoplastic prepreg. Labor, Energy as well as the Recycling costs are making a rather small portion of the total cost which does not exceed 20%.
It should be noticed that for the process and component under investigation, no relative learning curve data was available in order to account for the expected financial benefits of a massive production. Therefore, the equipment depreciation cost is not considered in the present analysis. The reusability potential of thermoplastics and its influence on the costing analysis has been also not accounted for. As the present analysis aims to optimize the process parameters of a certain process using in all cases the same thermoplastic material this simplification is not significant. Yet it would be crucial when comparing the environmental footprint of the component by considering thermosetting and thermoplastic composites as alternative material options.

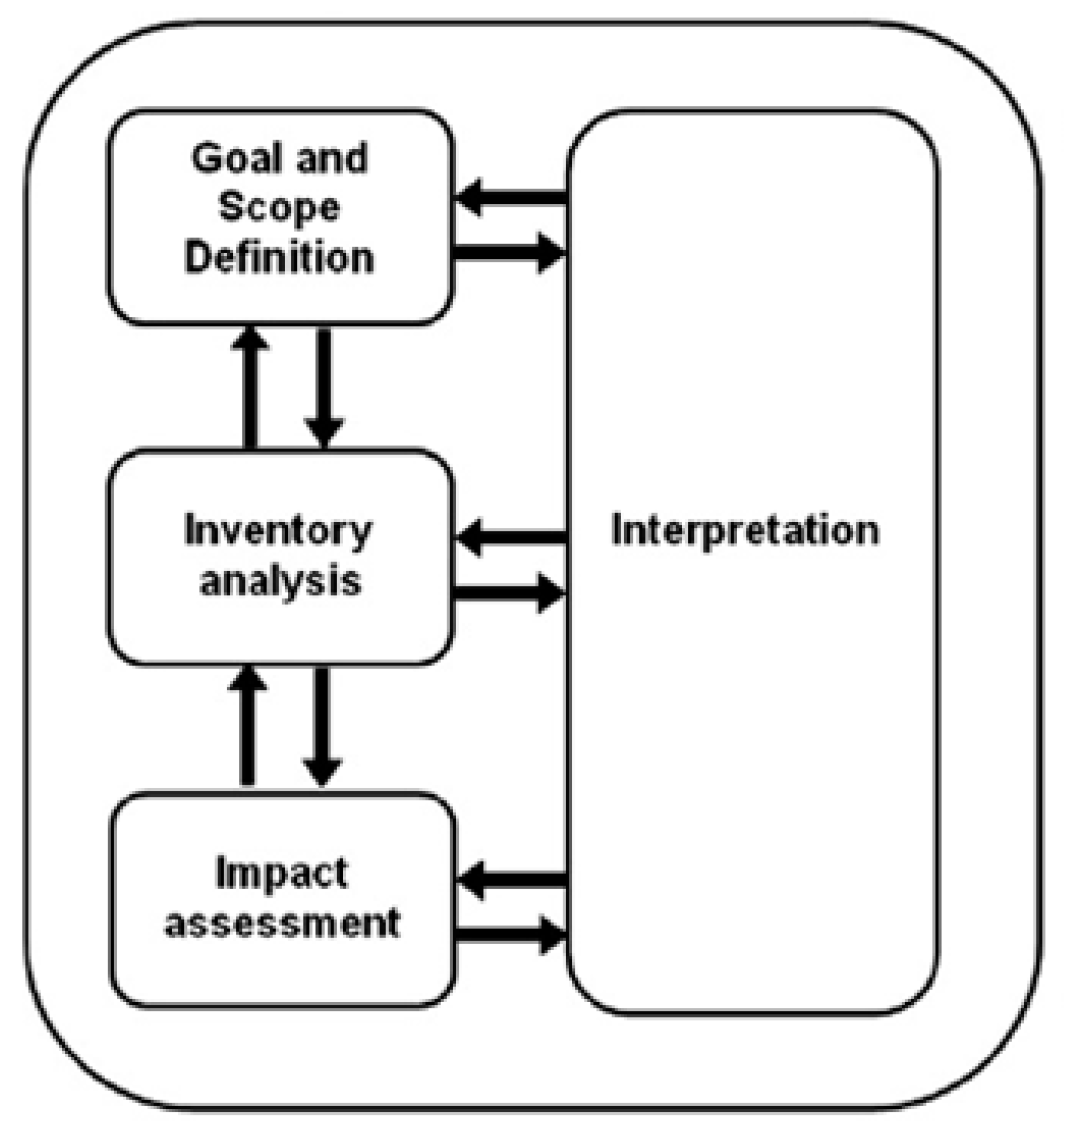
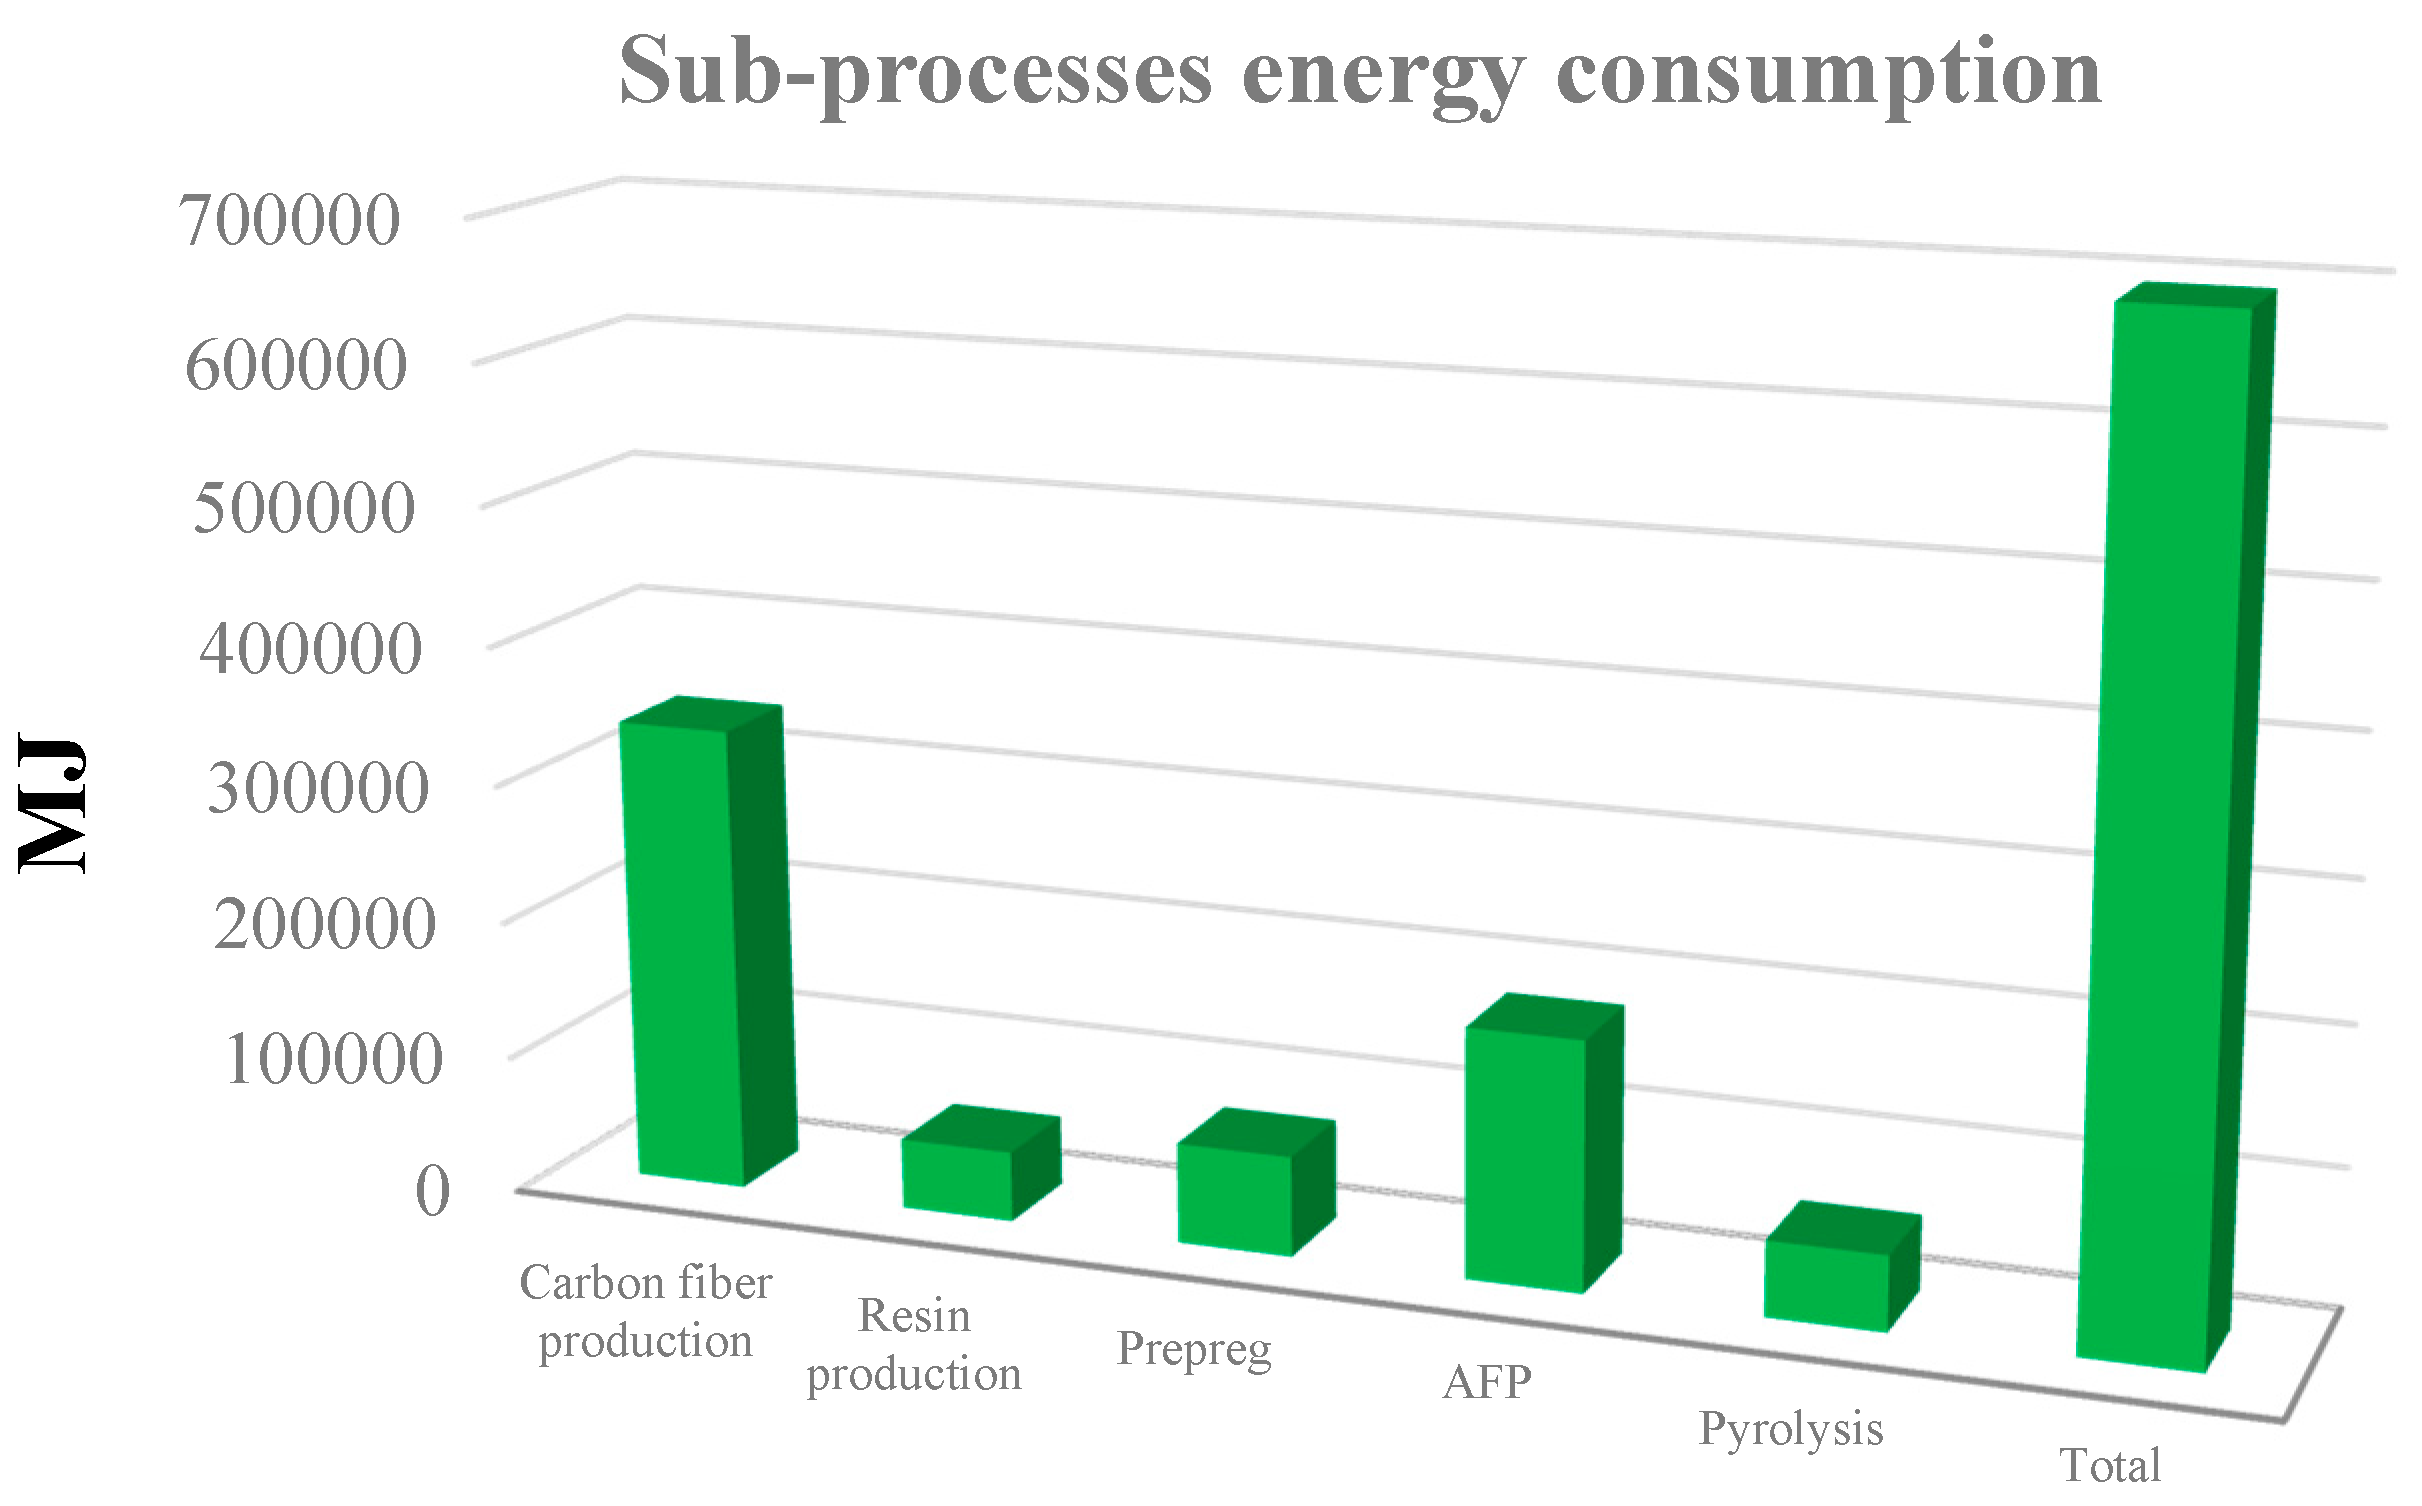
5.3. Life Cycle Analysis

For the present LCA the stages taken into consideration were: Carbon fiber production, Resin production, Prepreg production, Manufacturing (AFP) and Recycling (Pyrolysis). For each of the abovementioned stages the total energy consumption as well as a number of representative environmental midpoint impact categories used to characterize the overall environmental performance were evaluated. The categories considered are: Climate change, Ionizing radiation—human health, Land use, Ozone depletion, Resource depletion—water and Terrestrial eutrophication and so forth. The energy intensity of each process was derived from the literature [55,56,57,58] and the respective values are summarized in Table 9. The kg CO2eq produced from the consumption of 1 kWh was considered equal to 0.34 kg CO2eq/kWh [59].
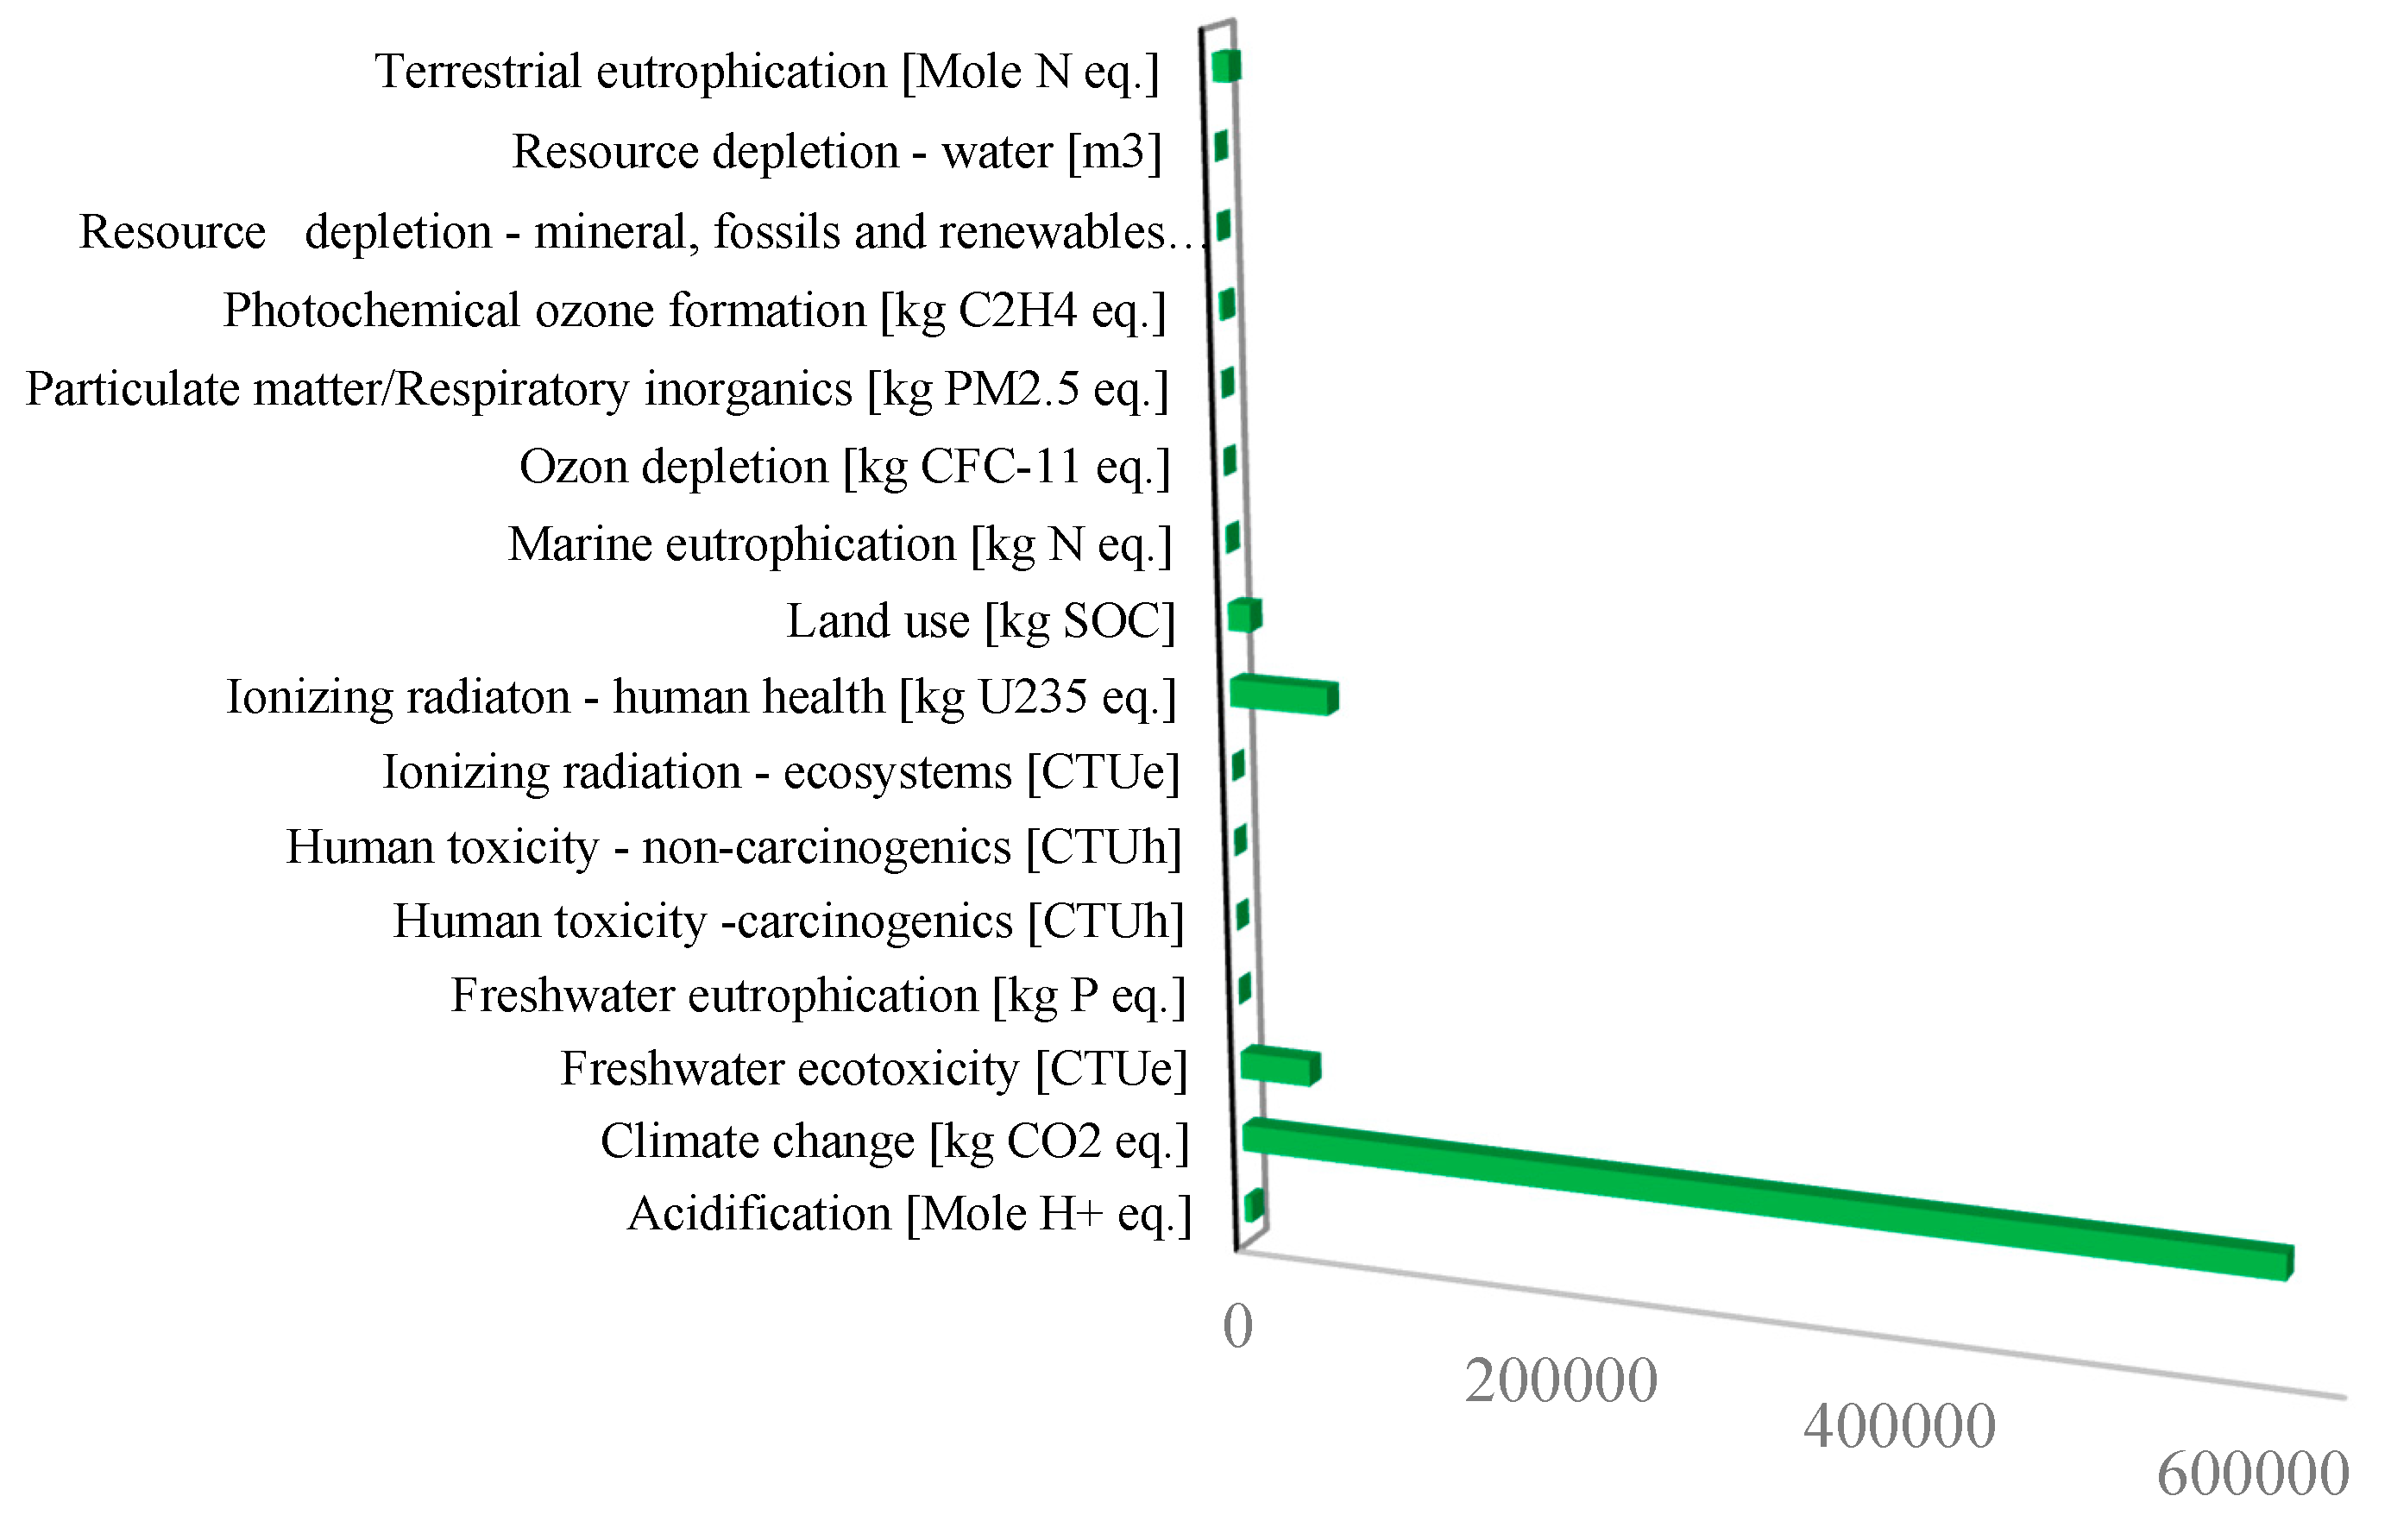
From the performed environmental analysis it turns out that the production of carbon fibers is responsible for about 50% of the total environmental impact (Figure 7); this finding is also in line with the literature [60]. It underlines the need for developing recycling processes safeguarding the quality of the carbon fibers at an acceptable footprint for the environment. The environmental impact factors are displayed in Figure 8. Their values were calculated using the Open LCA software [61]. The horizontal axis in Figure 8 refers to a variety of units which correspond to the various quantities measuring the environmental factors. The units to measure each factor are given in the bracket next to the factor on the vertical axis.

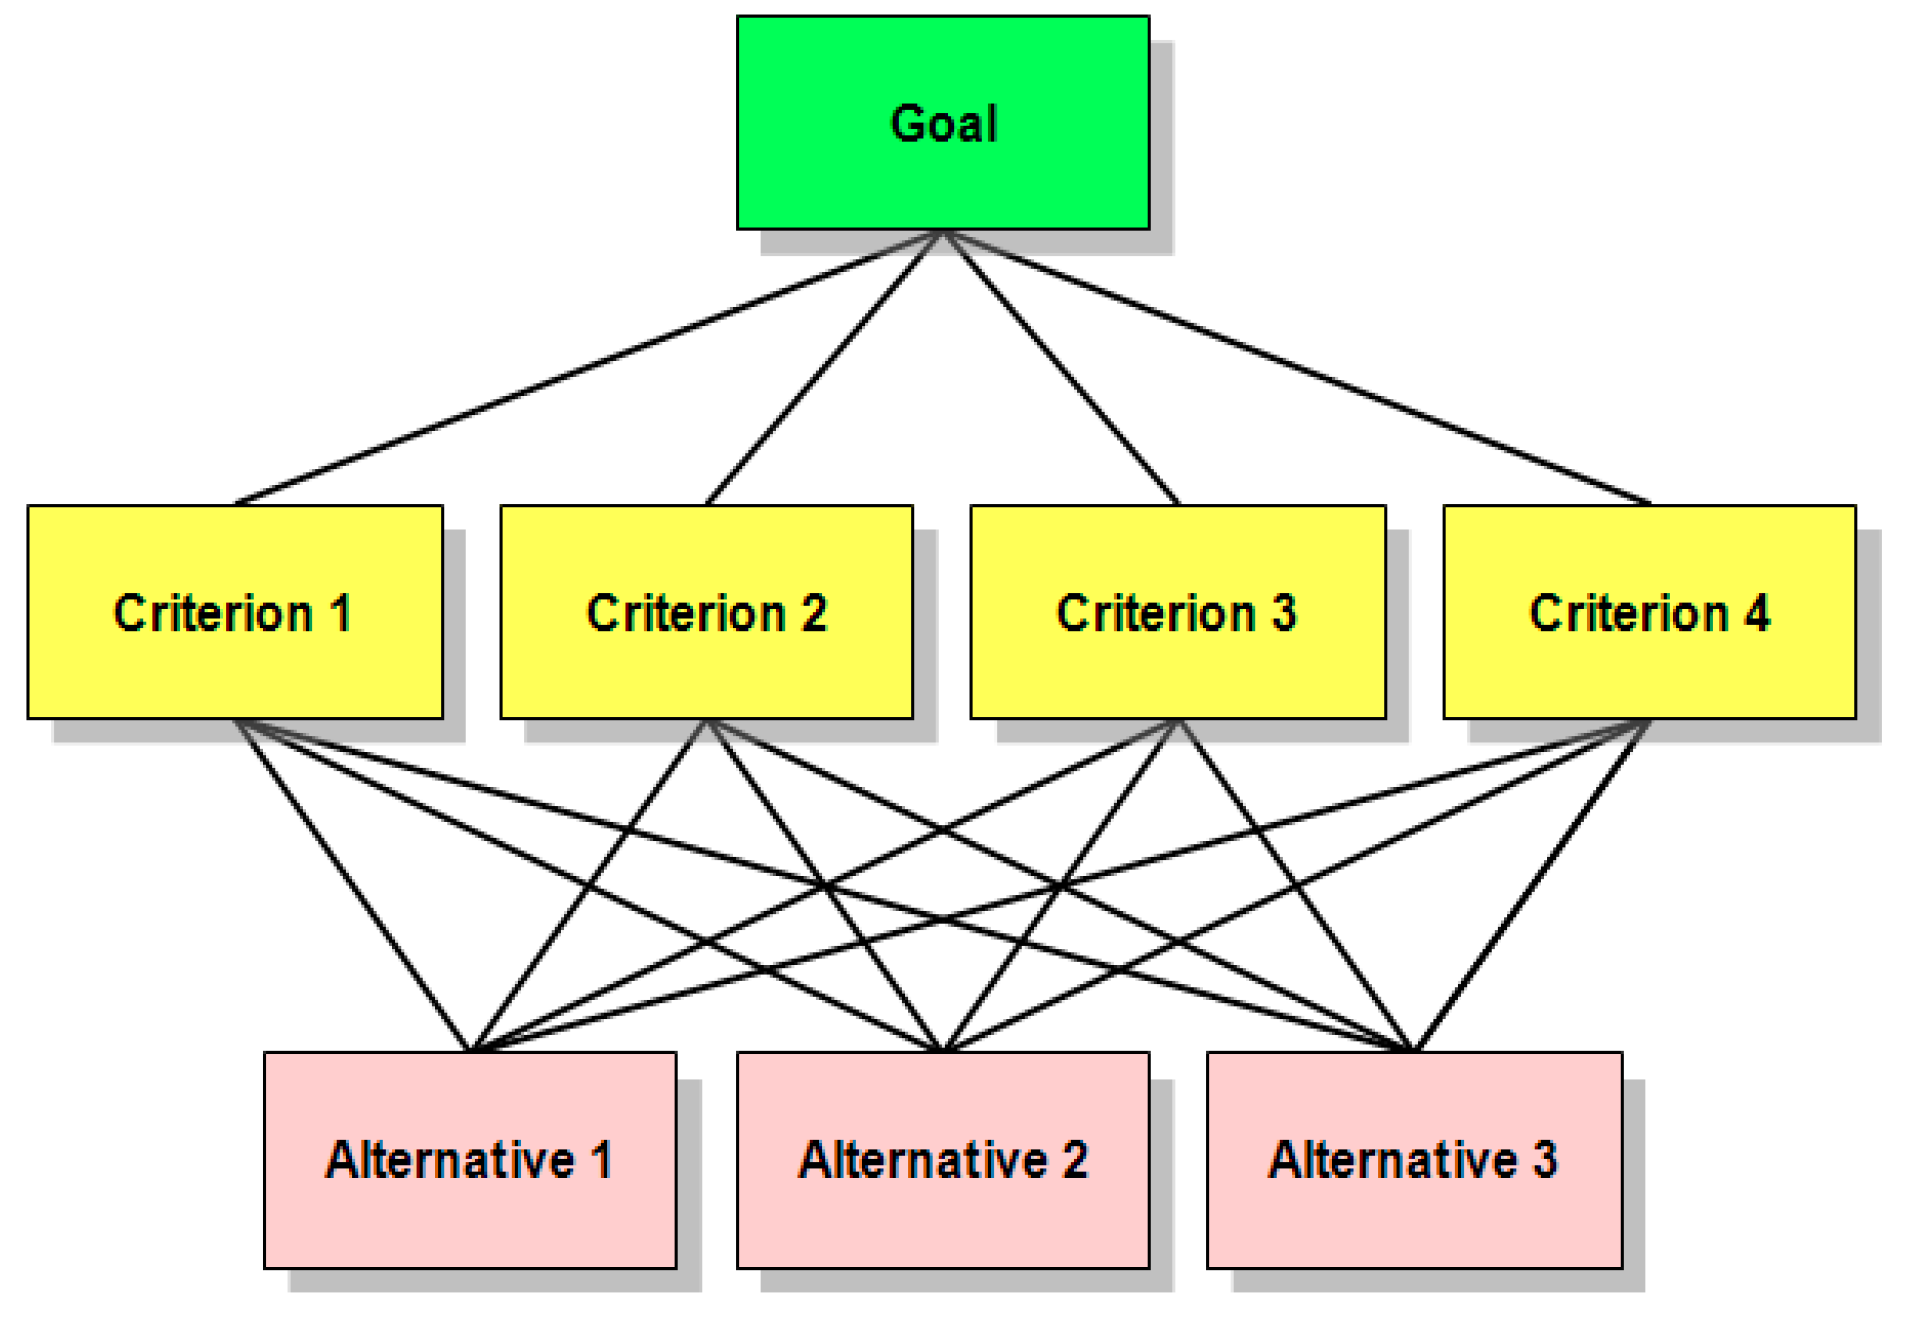
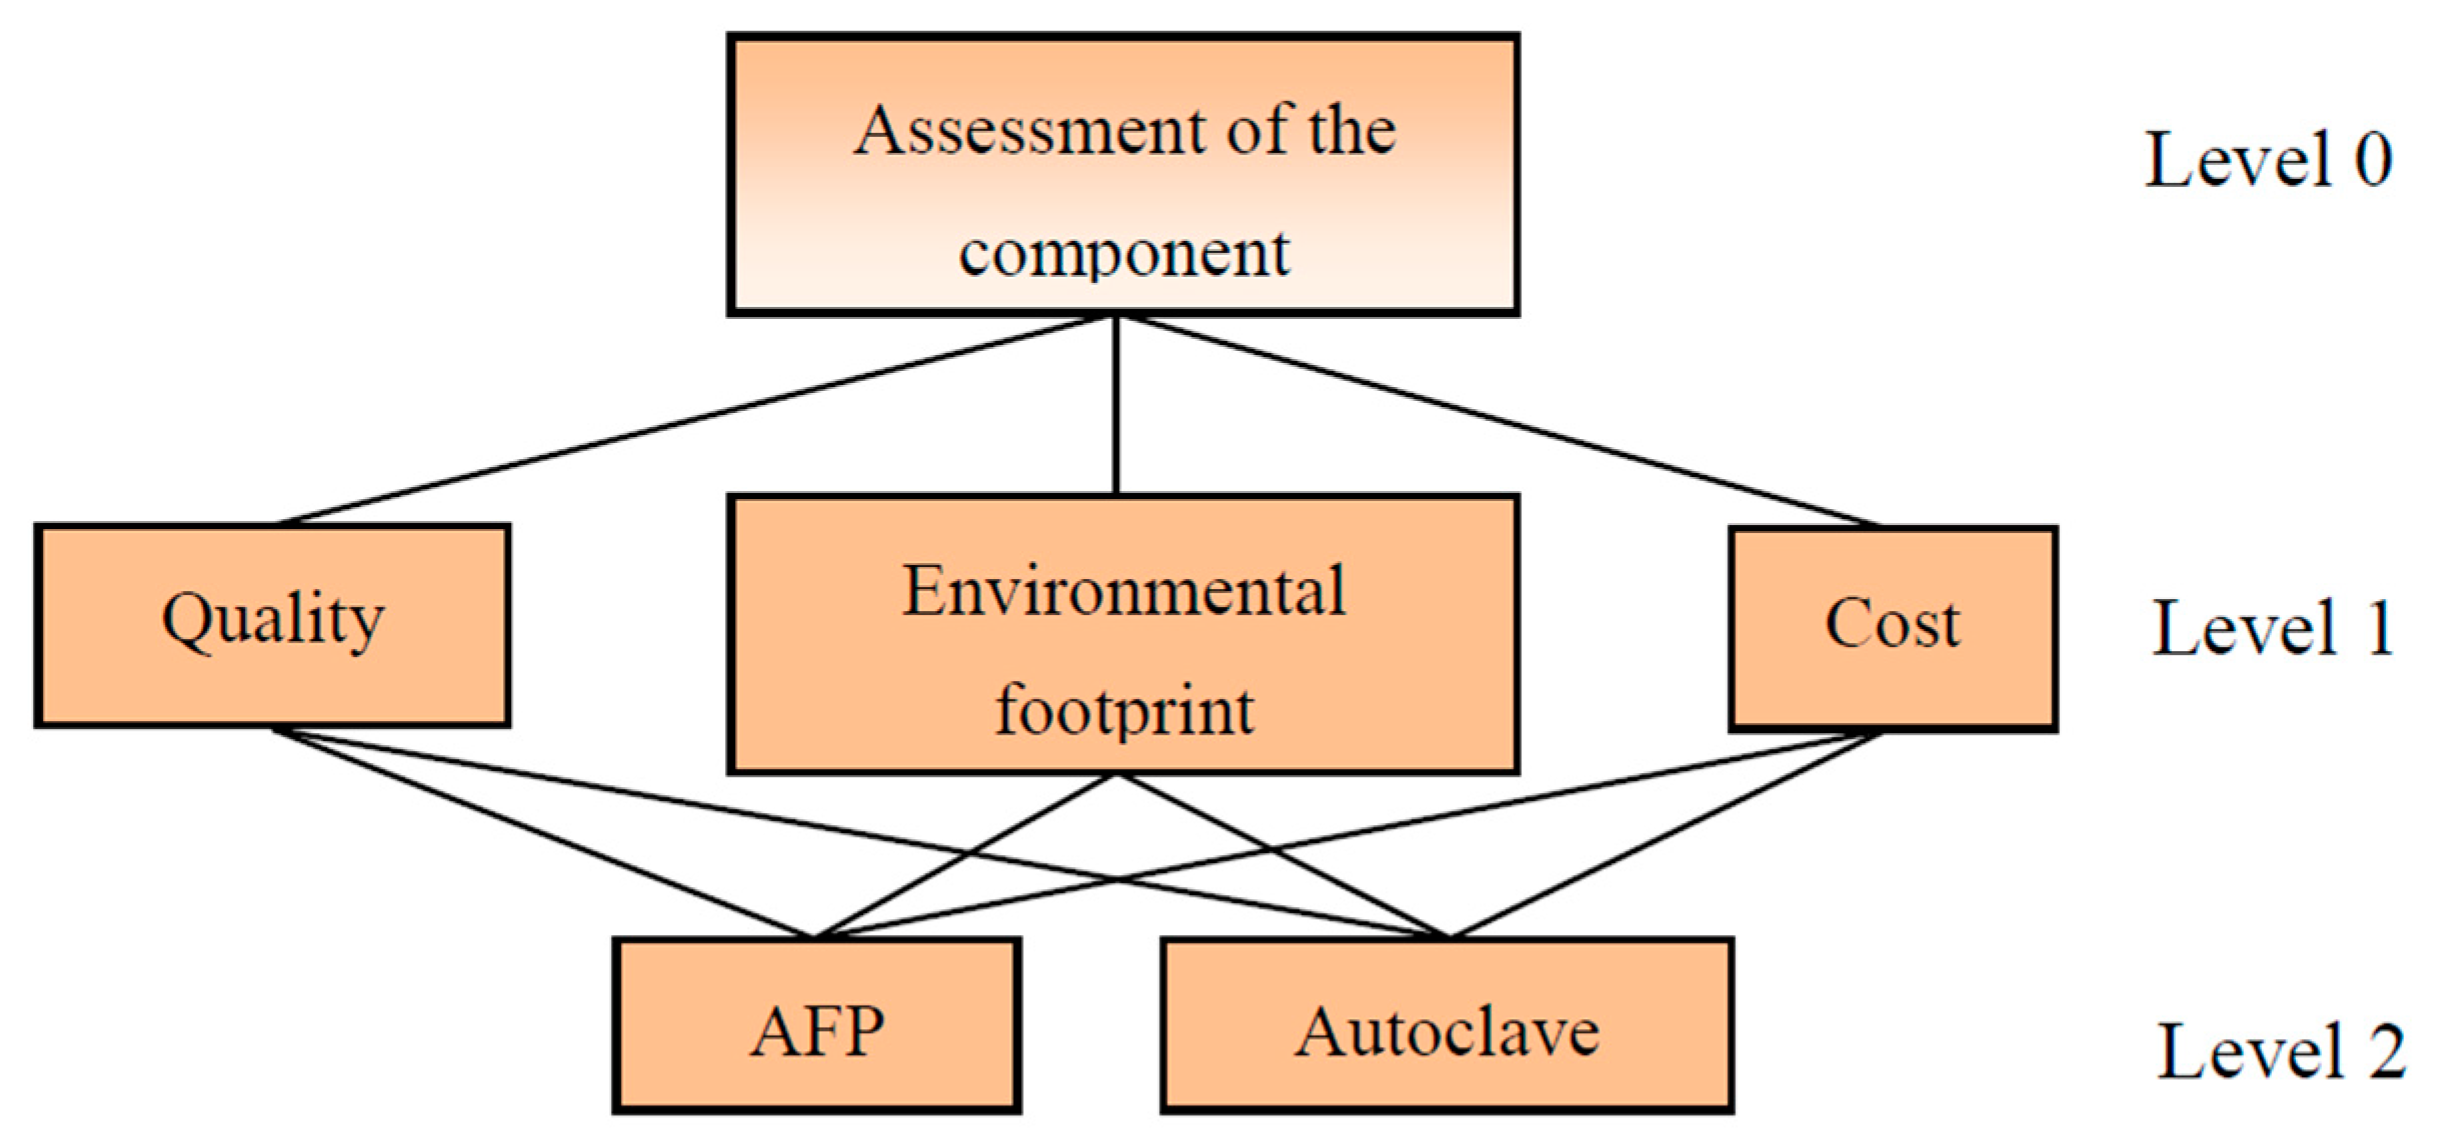
5.4. Definition of the Weight Factors

As mentioned above, the AHP process generates a weight factor for each evaluation criterion according to pairwise comparisons between the criteria. In the present AHP analysis, the following AHP network was used (Figure 9):
The first priority has been given to quality as it refers to safety. However, the Environmental footprint is accounted as equally important due to the environment concerns nowadays. In this context for the specific pairwise comparison between Quality and Environmental Footprint the quality is considered to have the same priority as compared to the Environmental footprint. Therefore, the respective weights have been both set to 1.
Accordingly, for the specific pairwise comparison between Quality and Cost the quality is considered to be much more important than the Cost; hence, the respective weights were set to 5 and 1, respectively. Moreover, the weight factors for comparing between Environmental Footprint and Cost were set to 7 and 1. Inserting the actual and reciprocal values of the weights for implementing the AHP procedure the following comparison matrix and Eigen priority vector were formulated, as shown in Table 10.
It needs to be underlined that the choice of the weights is a decision of the engineer and reflects his/her priorities. In this case the index will take negative values. This fact reveals that the process under investigation leads to severe environmental pollution which should be taken into account when meeting the decision to select the manufacturing process.
By prioritizing the need to minimize the environmental footprint, both the comparison matrix as well as the AHP priority vector would be different; they may be seen in Table 11.

5.5. Implementation of the New Holistic Index

Using the weight factors taken from Table 9, the introduced holistic Index P takes the form:
P = 0.43 Q 0.49 E 0.08 C
with:
Q = Q F Q a u t o c l a v e and QF calculated by using the Quality function in Table 3,
C = C A F P + a u t o c l a v e C a u t o c l a v e and CAFP+autoclave being the sum of the costs estimated in Section 5.2 and
E = E A F P E a u t o c l a v e , with EAFP, Eautoclave being the values of the respective environmental footprint calculated in Section 5.3. Using Equation (2) the Index P for the AFP process can be calculated.

5.6. Optimization of the AFP Process

Τo optimize the AFP process, the AFP process parameters were varied so as to obtain the maximum Index value. Τo ensure an acceptable quality, for the ILSS value the constraint to exceed 40 MPa was set.
The computed Index P as well as the calculated quality, cost and environmental footprint factors are given in Table 12. The corresponding optimized AFP process parameters are given as well.
As shown in Table 12 the Index P value calculated for the AFP process takes the value −0.12.

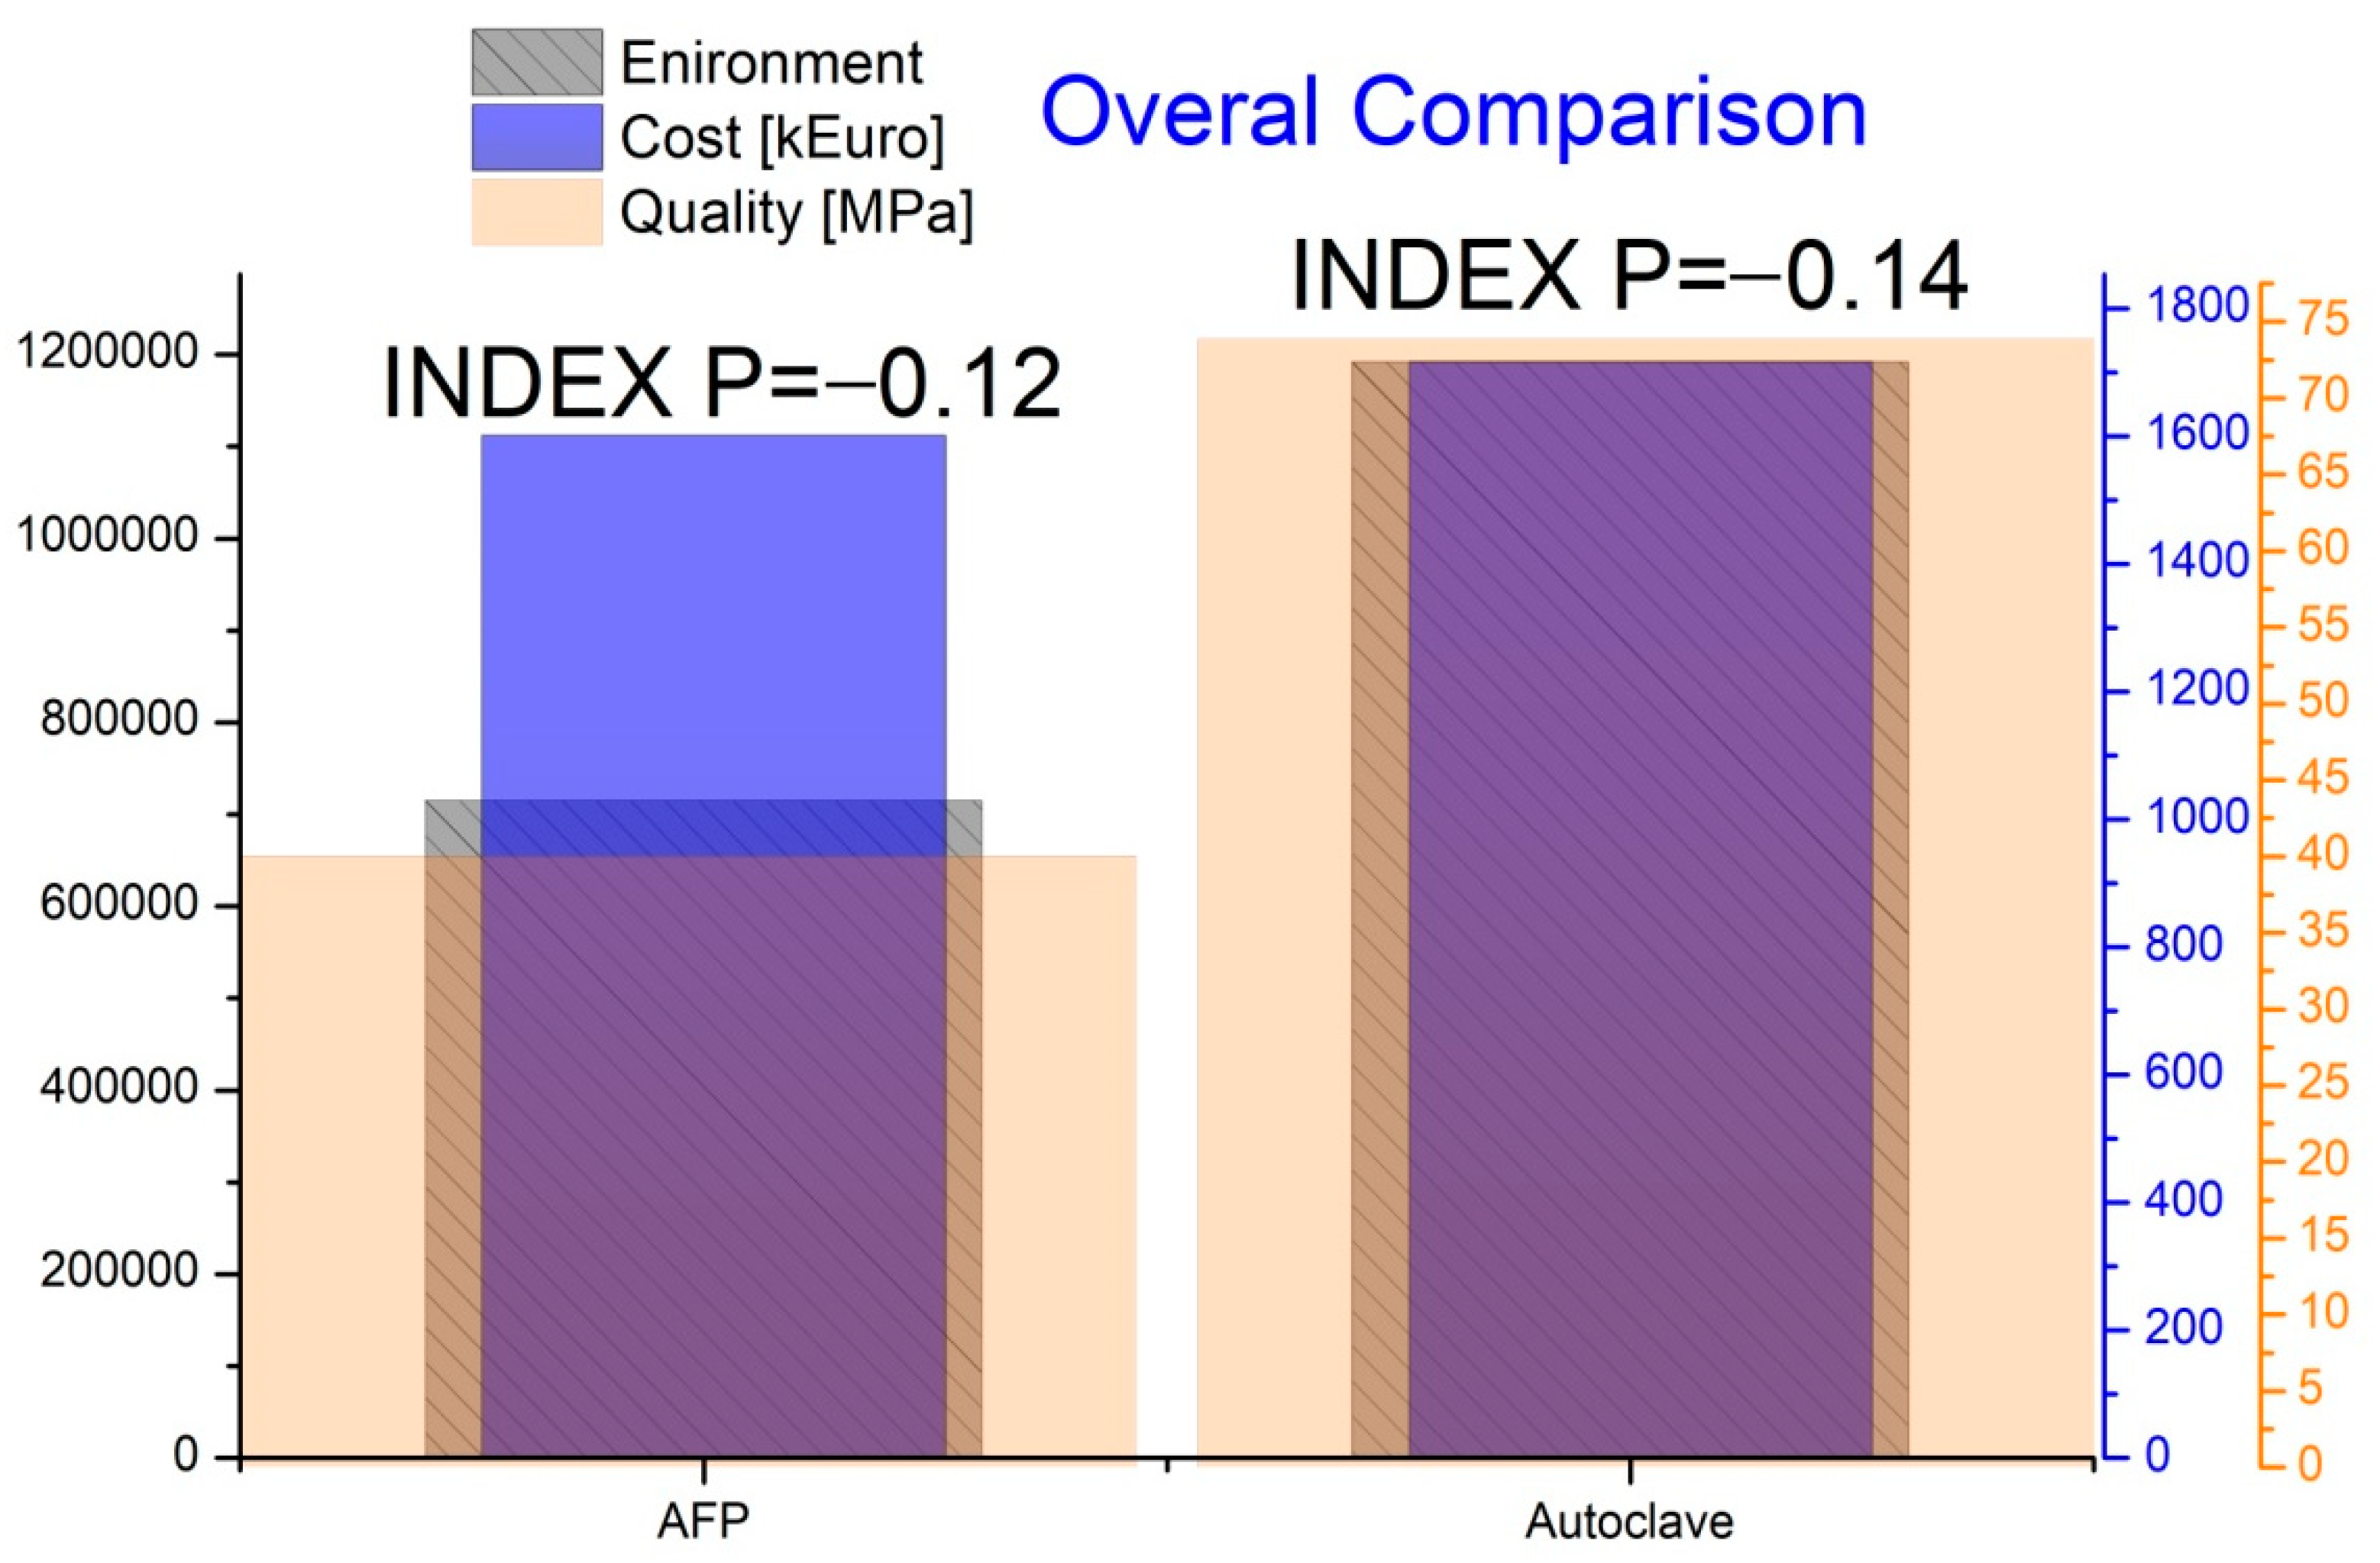
5.7. Comparison with Autoclave

To compare the AFP process to the Autoclave with regard to their suitability to manufacture the part under consideration the approach followed above for the AFP has to be repeated for the Autoclave. As the Autoclave is a process which is widely used process several parts of the above analysis such as the derivation of quality functions or Life Cycle Costing analyses are already available in the literature [4,7]. Yet, as for formulating the present Index P the Autoclave process has been taken as the reference process all terms in Eqn. 1 take by definition the value 1. In this case the Index P results as the sum of the weight factors. The Index P value calculated for the Autoclave process was −0.14, as shown in Figure 10.
The result of the comparison indicates that the optimized AFP process (p = −0.12) is a process offering the potential to replace Autoclave in a number of certain applications as it offers significant cost and environmental advantages as compared to the Autoclave. These advantages are quantified through the terms C and E, respectively in the Index (Table 10 and Figure 10). Furthermore, the analysis makes evident that the focus of research should be on improving the quality of the parts produced using the AFP process.

6. Conclusions

In this study a novel holistic process and component optimization index is introduced. The index serves as a decision support tool aiding the engineers to select the suitable manufacturing technique for a certain component and the appropriate process parameters for implementing it. The selected process parameters reflect a trade-off between quality, cost and environmental footprint of the component. The Index was validated on the case of manufacturing a fuselage panel, namely component 46 of the Boeing 787 Dreamliner. The manufacturing processes considered as alternatives have been the classical Autoclave as well as the innovative AFP process. By involving the proposed Index an advantage of the Autoclave process was demonstrated when quality is set as the most significant criterion for selecting the manufacturing process. Yet the clear cost and environmental advantages of implementing AFP were also demonstrated. The results indicate clearly that an improvement of the quality of parts produced using AFP would upgrade AFP to a process that would be competitive to the Autoclave. This finding is facilitating the identification of the focus of future research.

Author Contributions

Conceptualization, C.V.K. and S.G.P.; Data curation, C.V.K.; Methodology, C.V.K.; Supervision, S.G.P.; Writing—original draft, C.V.K.; Writing—review & editing, S.G.P. All authors have read and agreed to the published version of the manuscript.

Funding

The present work is a preliminary study performed within NHYTE project (New Hybrid Thermoplastic Composite Aerostructures manufactured by Out of Autoclave Continuous Automated Technologies, NHYTE, EU project, 2017–2020) The NHYTE project has received funding from the European Union’s Horizon 2020 research and innovation programme under grant agreement No 723309.

Conflicts of Interest

The authors declare no conflict of interest.

References

  1. Géraldine, O.; Luke, D.; Gary, L. Current status of recycling of fibre reinforced polymers: Review of technologies, reuse and resulting properties. Prog. Mater. Sci. 2015, 72, 61–99. [Google Scholar]
  2. Deng, Y. Life Cycle Assessment of Biobased Fibre-Reinforced Polymer Composites. Ph.D. Thesis, Katholieke Universiteit Leuven, Leuven, Belgium, 2014. [Google Scholar]
  3. Vaidya, U.K.; Chawla, K.K. Processing of fibre reinforced thermoplastic composites. Int. Mater. Rev. 2008, 53, 185–218. [Google Scholar] [CrossRef]
  4. Loukopoulos, A.; Katsiropoulos, C.V.; Pantelakis, S.G. Carbon and financial evaluation of an aeronautic component production using different manufacturing processes. Int. J. Struct. Integr. 2018, 10, 425–435. [Google Scholar] [CrossRef]
  5. Soraia, P.; Pinho, S. The effect of recycling on the mechanical response of carbon fibres and their composites. Compos. Struct. 2012, 94, 3669–3684. [Google Scholar]
  6. Song, Y.S.; Youn, J.R.; Gutowski, T.G. Life cycle energy analysis of fiber-reinforced composites. Compos. Part A 2009, 40, 1257–1265. [Google Scholar] [CrossRef]
  7. Katsiropoulos, C.V.; Loukopoulos, Α.; Pantelakis, S.G. Comparative environmental and cost analysis of alternative production scenarios associated with a helicopter’s canopy. Aerospace 2019, 6, 3. [Google Scholar] [CrossRef] [Green Version]
  8. Timmis, A.J.; Hodzic, A.; Koh, L.; Bonner, M.; Soutis, C.; Shafer, A.W.; Dray, L. Environmental impact assessment of aviation emission reduction through the implementation of composite materials. Int. J. Life Cycle Assess. 2015, 20, 233–243. [Google Scholar] [CrossRef] [Green Version]
  9. Weiland, F.; Weimer, C.; Dumont, F.; Katsiropoulos, C.V.; Pantelakis, S.G.; Sitaras, I.; Skordos, A.A.; Berthé, E.; de Luca, P. Process and cost modelling applied to the manufacture of a complex aerospace composite part. Plastics. Rubber Compos. 2013, 42, 427–436. [Google Scholar] [CrossRef]
  10. Bachman, J.; Hidalgo, C.; Bricout, S. Environmental analysis of innovative sustainable composites with potential use in aviation sector—A life cycle assessment review. Sci. China-Technol. Sci. 2017, 60, 1301–1317. [Google Scholar] [CrossRef] [Green Version]
  11. Duflou, J.R.; Deng, Y.; Van Acker, K.; Dewulf, W. Do fiber-reinforced polymer composites provide environmentally benign alternatives? A life-cycle-assessment-based study. Mrs Bull. 2012, 37, 374–382. [Google Scholar] [CrossRef] [Green Version]
  12. Michaud, V. Les matériaux composites-moteurs de la mobilité proper. In Proceedings of the Swiss Mobility Days Conference, Martigny, Switzerland, 20–21 October 2016. [Google Scholar]
  13. Das, S. Life cycle assessment of carbon fiber-reinforced polymer composites. Int. J. Life Cycle Assess. 2011, 16, 268–282. [Google Scholar] [CrossRef]
  14. Hueber, C.; Horejsi, K.; Schledjewski, R. Review of cost estimation: Methods and models for aerospace composite manufacturing. Adv. Manuf. Polym. Compos. Sci. 2016, 2, 1–13. [Google Scholar] [CrossRef]
  15. La Rosa, D.; Cicala, G. 14-LCA of fibre-reinforced composites, Editor(s): Subramanian Senthilkannan Muthu. In Woodhead Publishing Series in Textiles, Handbook of Life Cycle Assessment (LCA) of Textiles and Clothing; Woodhead Publishing: Cambridge, UK, 2015; pp. 301–323. [Google Scholar]
  16. Poulikidou, S.; Schneider, C.; Björklund, A.; Kazemahvazi, S.; Wennhage, P.; Zenkert, D. A material selection approach to evaluate material substitution for minimizing the life cycle environmental impact of vehicles. Mater. Des. 2015, 83, 704–712. [Google Scholar] [CrossRef] [Green Version]
  17. BRITE/EURAM II, BRE2, CT92-0169. Process in Integrated Cost Analysis Tool (PICANT); CEC Final report; CEC: Brussels, Belgium, 1995. [Google Scholar]
  18. Pantelakis, S.; Baxevani, E. Optimization of the diaphragm forming process with regard to product quality and cost. Compos. Part A 2002, 33, 459–470. [Google Scholar] [CrossRef]
  19. Schubel, P. Cost modelling in polymer composite applications: Case study—Analysis of existing and automated manufacturing processes for a large wind turbine blade. Compos. Part B Eng. 2012, 43, 953–960. [Google Scholar] [CrossRef]
  20. Zabihi, O.; Ahmadi, M.; Liu, C.; Mahmoodi, R.; Li, Q.; Naebe, M. Development of a low cost and green microwave assisted approach towards the circular carbon fibre composites. Compos. Part B Eng. 2020, 184, 107750. [Google Scholar] [CrossRef]
  21. Cheung, W.M.; Marsh, R.; Griffin, P.W.; Newnes, L.B.; Mileham, A.R.; Lanham, J.D. Towards cleaner production: A roadmap for predicting product end-of-life costs at early design concept. J. Clean. Prod. 2015, 87, 431–441. [Google Scholar] [CrossRef] [Green Version]
  22. Verrey, J.; Wakeman, M.D.; Michaud, V.; Manson, J. Manufacturing cost comparison of thermoplastic and thermoset RTM for an automotive floor pan. Compos. Part A 2006, 37, 9–22. [Google Scholar] [CrossRef]
  23. Soremekun, G.A. Genetic Algorithms for Composite Laminate Design Optimization. Master’s Thesis, Department of Engineering Science, Mechanics, Virginia Polytechnic Institute, Blacksburg, VA, USA, 1997. [Google Scholar]
  24. Schlimbach, J.; Mitschang, P. Process-based Cycle Time Estimation for the Thermoplastic Tape Placement. J. Thermoplast. Compos. Mater. 2006, 19, 507–529. [Google Scholar] [CrossRef]
  25. Lawand, L.; Panarotto, M.; Andersson, P.; Isaksson, O.; Kokkolaras, M. Dynamic Lifecycle Cost Modeling for Adaptable Design Optimization of Additively Remanufactured Aeroengine Components. Aerospace 2020, 7, 110. [Google Scholar] [CrossRef]
  26. Soares, S.; Rodrigues, R.; Finotti, A.; Vamilson, P.; Alvarenga, R. Applications of life cycle assessment and cost analysis in health care waste management. Waste Manag. 2013, 33, 175–183. [Google Scholar] [CrossRef] [PubMed]
  27. Simões Carla, L.; Costa Pinto Lígia, M.; Bernardo, C.A. Environmental and economic assessment of a road safety product made with virgin and recycled HDPE: A comparative study. J. Environ. Manag. 2013, 114, 209–215. [Google Scholar] [CrossRef]
  28. Petrillo, A.; Fabio, D.F.; Elio, J.; Claudio, A.; Giovanna, M.M.; Lavadera, L.A. Life cycle assessment (LCA) and life cycle cost (LCC) analysis model for a stand-alone hybrid renewable energy system. Renew. Energy 2016, 95, 337–355. [Google Scholar] [CrossRef]
  29. Aysun, O.; Zerrin, G.; Gülden, T.; Levent, K.; Melike, M.; Müfide, B.; Alpagut, K. Life Cycle Assessment and Life Cycle Cost Analysis of Magnesia Spinel Brick Production. Sustainability 2016, 8, 662. [Google Scholar]
  30. Koronis, G.; Arlindo, S. Green Composites Reinforced with Plant-Based Fabrics: Cost and Eco-Impact Assessment. J. Compos. Sci. 2018, 2, 8. [Google Scholar] [CrossRef] [Green Version]
  31. Li, X.; Bai, R.; McKechnie, J. Environmental and financial performance of mechanical recycling of carbon fibre reinforced polymers and comparison with conventional disposal routes. J. Clean. Prod. 2015, 127, 451–460. [Google Scholar] [CrossRef]
  32. Witik, R.A.; Payet, J.; Michaud, V.; Ludwig, C.; Månson, J.A. Assessing the life cycle costs and environmental performance of lightweight materials in automobile applications. Compos. Part A 2011, 42, 1694–1709. [Google Scholar] [CrossRef]
  33. Xian, Y.; Yang, K.; Wang, K.; Wei, Y.-M.; Huang, Z. Cost-environment efficiency analysis of construction industry in China: A materials balance approach. J. Clean. Prod. 2019, 221, 457–468. [Google Scholar] [CrossRef]
  34. Mahmood, A.; Tsavdaridis, K. Life cycle assessment (LCA) and cost (LCC) studies of lightweight composite flooring systems. J. Build. Eng. 2018, 20, 624–633. [Google Scholar]
  35. Pantelakis, S.G.; Katsiropoulos, C.V.; Labeas, G.; Sibois, H. A concept to optimize quality and cost in thermoplastic composite components applied to the production of helicopter canopies. Compos. Part A 2009, 40, 595–606. [Google Scholar] [CrossRef]
  36. Katsiropoulos, C.V.; Moraitis, G.; Labeas, G.; Pantelakis, S.G. Optimisation of laser welding process for thermoplastic composite materials with regard to component quality and cost. Plast. Rubber Compos. 2009, 38, 153–161. [Google Scholar] [CrossRef]
  37. Katsiropoulos, C.V.; Pantelakis, S.G. An overall assessment of a new adhesive bonding process for composite materials, with regard to quality and cost. Plast. Rubber Compos. 2016, 45, 22–30. [Google Scholar] [CrossRef]
  38. Kassapoglou, C. Simultaneous cost and weight minimization of composite-stiffened panels under compression and shear. Compos. Part A 1997, 28, 419–435. [Google Scholar] [CrossRef]
  39. Kassapoglou, C. Minimum cost and weight design of fuselage frames Part A: Design constraints and manufacturing process characteristics. Compos. Part A 1999, 30, 887–894. [Google Scholar] [CrossRef]
  40. Yildiz, S.; Suleman, A. Cost analysis of variable stiffness composite structures with application to a wind turbine blade. Compos. Struct. 2018, 203, 681–695. [Google Scholar]
  41. James, M.; Edward, B.; Richard, P.; Collings, E.; Kerry, K. A performance versus cost analysis of prepreg carbon fibre epoxy energy absorption structures. Compos. Struct. 2015, 124, 206–213. [Google Scholar]
  42. Huijbregts, M.A.; Steinmann, Z.J.; Elshout, P.M.; Stam, G.; Verones, F.; Vieira, M.; Zijp, M.; Hollander, A.; van Zelm, R. ReCiPe2016: A harmonised life cycle impact assessment method at midpoint and endpoint level. Int. J. Life Cycle Assess. 2017, 22, 138–147. [Google Scholar] [CrossRef]
  43. Brito, T.B.; dos Santos Silva, R.C.; Botter, R.C.; Pereira, N.N.; Medina, A.C. Discrete event simulation combined with multi-criteria decision analysis applied to steel plant logistics system planning. In Proceedings of the Winter Simulation Conference, Baltimore, MD, USA, 5–8 December 2010; pp. 2126–2137. [Google Scholar]
  44. Oliveira, M.; Fontes, D.B.; Pereira, M.T. Multicriteria Decision Making: A Case Study in the Automobile Industry. J. Ann. Manag. Sci. 2014, 3, 109–128. [Google Scholar] [CrossRef] [Green Version]
  45. Mark, V.; Patrick, H. An Analysis of Multi-Criteria Decision Making Methods. Int. J. Oper. Res. 2013, 10, 56–66. [Google Scholar]
  46. Saaty, R.W. The analytic hierarchy process-what it is and how it is used. Math. Model. 1987, 9, 161–176. [Google Scholar] [CrossRef] [Green Version]
  47. Saaty, T.L. The Analytic Hierarchy Process; McGraw-Hill: New York, NY, USA, 1980. [Google Scholar]
  48. Baker, D.; Mooney, D. Boeing 787–8 Design Certification and Manufacturing Systems Review; Federal Aviation Administration: Washington, DC, USA, 2014.
  49. The International Standards Organisation. Environmental Management—Life Cycle Assessment—Principles and Framework; ISO 14040; The International Standards Organisation: Geneva, Switzerland, 2006. [Google Scholar]
  50. Roy, B. The outranking approach and the foundations of ELECTRE methods. Theory Decis. 1991, 31, 49–73. [Google Scholar] [CrossRef]
  51. Saaty, T. Decision making with the analytic hierarchy process. Int. J. Serv. Sci. 2008, 1, 83–98. [Google Scholar] [CrossRef] [Green Version]
  52. Keeney, R.; Fishburn, P. Seven independence concepts and continuous multi attribute utility functions. J. Math. Psychol. 1974, 11, 294–327. [Google Scholar]
  53. Cai, X.; Shadmehri, F.; Hojjati, M.; Chen, J.; Hoa, S.V. Determination of optimum process conditions for processing AS4/APC-2 thermoplastic composites by automated fiber placement. In Proceedings of the SAMPE International Symposium and Exhibition—Emerging Opportunities: Materials and Process Solutions, Baltimore, MD, USA, 21–24 May 1996. [Google Scholar]
  54. Available online: ec.europa.eu (accessed on 15 March 2019).
  55. Liddell, H.; Dollinger, C.; Fisher, A.; Carpenter, A.; Brueske, S.; Cresko, J. Bandwidth Study on Energy Use and Potential Energy Saving Opportunities in US Carbon Fiber Reinforced Polymer Manufacturing; Report number: DOE/EE-1662; U.S. Department of Energy: Washingto, DC, USA, 2017.
  56. Suzuki, T.; Takahashi, J. Prediction of energy intensity of carbon fiber reinforced plastics for mass-produced passenger cars. In Proceedings of the 9th Japan International SAMPE Symposium, Tokyo, Japan, 29 November–2 December 2005; pp. 14–19. [Google Scholar]
  57. Howarth, J.; Mareddy, S.S.R.; Mativenga, P.T. Energy intensity and environmental analysis of mechanical recycling of carbon fibre composite. J. Clean. Prod. 2014, 81, 46–50. [Google Scholar] [CrossRef]
  58. Job, S.; Leeke, G.; Mativenga, P.T.; Oliveux, G.; Pickering, S.; Shuaib, N.A. Composites Recycling: Where Are We Now? Composites UK Ltd.: Berkhamsted, UK, 2016. [Google Scholar]
  59. Available online: www.electricitymap.org (accessed on 9 April 2019).
  60. O’Reilly, C.; Göransson, P.; Funazaki, A.; Suzuki, T.; Edlund, S.; Gunnarsson, C.; Lundow, J.; Cerin, P.; Cameron, C.; Wennhage, P.; et al. Life cycle energy optimisation: A proposed methodology for integrating environmental considerations early in the vehicle engineering design process. J. Clean. Prod. 2016, 135, 750–759. [Google Scholar] [CrossRef]
  61. Ciroth, A. ICT for environment in life cycle applications openLCA—A new open source software for life cycle assessment. Int. J. Life Cycle Assess. 2007, 12, 209–210. [Google Scholar] [CrossRef]
Figure 1. A fuselage panel (a) Section 46 of Boeing 787 Dreamliner (b) case study of the work [48].
Aerospace 07 00157 g001
Figure 2. Activity Based Concept (ABC) concept loop [35].
Aerospace 07 00157 g002
Figure 3. Outline of Life Cycle Assessment (LCA) according to ISO 14040:2006 [49].
Aerospace 07 00157 g003
Figure 4. Flow chart of the Analytic Hierarchy Process (AHP) methodology.
Aerospace 07 00157 g004
Figure 5. Flow chart of the optimization process.
Aerospace 07 00157 g005
Figure 6. Total Life Cycle Costing (LCC) for the fuselage panel entire life.
Aerospace 07 00157 g006
Figure 7. Total energy consumption per piece.
Aerospace 07 00157 g007
Figure 8. Environmental impact factors calculated per piece.
Aerospace 07 00157 g008
Figure 9. AHP network for the fuselage panel production.
Aerospace 07 00157 g009
Figure 10. Comparison of the Quality, Cost and the Environmental footprint terms of the Index P for the AFP and Autoclave processes.
Aerospace 07 00157 g010
Table 1. Examples of objective functions of Quality, Cost and Environmental footprint.
Q u a l i t y = τ m a x =   F 1 T 2687 t 0.21 .
C o s t = κ inf e ( C 1 N H + C 2 D + C 3 T H P L + C 4 )
E n v i r . f o o t p r int = G W P 100 = E i m C O 2 e q k W h
Table 2. Main geometrical features of the component under investigation.
Component Characteristics
Area [m2]365.78
Perimeter [m]92.84
Weight [Kg]1814
Table 3. Experimental results for the Automated Fiber Placement (AFP) process [53].
Test Cases Process Parameters Quality Feature
Nozzle Temperature T [°C] Process Rate r [mm/s] Compaction Force Fc [kg] Nozzle Location L [mm] Inter-Laminar Shear Strength ILSS [MPa]
C-190025.43011.3843.89
C-290050.84017.7744.99
C-390076.25021.6231.33
C-492525.44021.6247.51
C-592550.85011.3842.78
C-692576.23017.7739.91
C-795025.45017.7734.76
C-895050.83021.6241.44
C-995076.24011.3841.93
Table 4. The Quality Function (QF) derived for the AFP process.
Quality Feature Quality Function-QF [MPa]Fitting Coefficients
Inter-laminar shear strength ILSS ILSS = 73.88 + f1·T + f2·r + f3·Fc + f4·L f1 = −0.0138
f2 = −0.085
f3 = −0.2727
f4 = −0.2906
Table 5. Part, Process, Material and Infrastructure related Cost Drivers.
Class of Cost DriversCost DriverCost Driver’s Abbreviation and Unit
Manufacturing ProcessHeating TemperatureT [oC]
Compaction forceFc [kgr/]
Lay up speed (process rate)r [mm/s]
Distance between the material and the heating sourceL [mm]
LaborCost of the specialized worker per hourkw (€/h)
Material and InfrastructureCost of the prepregkpr (€/m2)
Cost of the infrastructure material (cleaning agent, releasing agent, AFP consumables)kinf (€/kgr)
Component’s FeaturesTotal part areaPAA [m2]
Weight of partWP [kg]
Perimeter of partPAP [m]
Number of pliesN [/]
Complexitycmp
Table 6. Cost Estimation relationships (CERs) for manufacturing and recycling cost.
Specific Sup-Process CostCER
Manufacturing KM = kkwh∗Total necessary energy [f(T, r, Fc, L)]
Recycling Krecycling = kkwh∗Total pyrolysis energy
Table 7. CERs for labor cost.
ActivityCER
Clean the MoldKcm = kw∗0.05∗2∗PAA
Application of the Release AgentKra = kw∗0.01∗PAA
Lay upKlayup=kw∗tlayup (tlayup=8 min for the first 2, 4 min for the rest)
DemoldingKde = kw∗0.05∗PAA
Cost of the ReworkKrw = kw∗0.25∗PAP
Cost of the NDT InspectionKins = kw∗(0.1∗PAA∗cmp + 0.5)
Cost of the Dimension MeasurementKdim = kw∗0.05∗cmp∗PAA
Cost of the StorageKst = kw∗(0.01∗WP + 0.16∗PAP)
Table 8. CERs for Material and Infrastructure cost.
MaterialCER
Infrastructure MaterialKinf = 1,1∗kinf∗PAA
Raw MaterialKtotal = N∗kpr
Table 9. Energy intensity of each sub-process.
Sub-ProcessEnergy Intensity
Carbon fiber production 286 [MJ/kg]
Epoxy production 80 [MJ/kg]
Prepreg40 [MJ/kg]
AFP 50 [kW/h]
Pyrolysis 30 [MJ/kg]
Table 10. Paired comparison matrix level 1 by equally prioritizing Quality and Env.Footprint (left) and the derived normalized Eigen vector (AHP priority vector) (right).
Paired Comparison MatrixEigen Vector
CriteriaQualityEnv. FootprintCostCriteriaWeight Factor
Quality1.001.005.00Quality43%
Env. footprint1.001.007.00Env. footprint49%
Cost0.200.141.00Cost8%
Sum2.202.1413.00Sum100%
By implementing the AHP procedure the weight factors were computed to: Quality: KQ = 0.43, Environmental Footprint: KE = 0.49, Cost: KC = 0.08.
Table 11. Paired comparison matrix level 1 by prioritizing to minimize the Environmental footprint (left) and the derived normalized Eigen vector (AHP priority vector) (right).
Paired Comparison MatrixEigen Vector
CriteriaQualityEnv. FootprintCostCriteriaWeight Factor
Quality1.000.140.33Quality10%
Env. Footprint5.001.005.00Env. footprint69%
Cost3.000.141.00Cost21%
Sum9.001.286.33Sum100%
For this case and by implementing the AHP procedure the new weight factors that were computed are: Quality: KQ = 0.1, Environmental Footprint: KE = 0.69, Cost: KC = 0.21.
Table 12. Optimized AFP process parameters and corresponding Quality, Cost and Environmental factors.
IndexP−0.12
Environment Ε∑env715,254
Cost CCost [k€]1601.27
Quality QILSS [MPa]40.011
AFP Process parametersNozzle temperature T [oC] 880
Process rate r [mm/s] 66.5
Compaction Force Fc [kg] 47
Nozzle location L [mm] 11.2
Publisher’s Note: MDPI stays neutral with regard to jurisdictional claims in published maps and institutional affiliations.

