1. Introduction
The emerging need to integrate Unmanned Aircraft Systems (UAS) traffic in the existing airspace bears notable challenges in terms of increased traffic density and complexity in low-altitude airspace [
1,
2]. In 2012, the Federal Aviation Administration’s (FAA) Modernization and Reform Act prompted research into the field of managing small UAS (sUAS) as civilian demand for these systems had grown significantly [
3]. This initiative was pertinent to urban operations [
4,
5,
6] and set foundations for successive research efforts in this field.
In 2016, the FAA released Part 107, an addition to Title 14 of the Code of Federal Regulations (14 CFR), allowing routine sUAS operations in the National Airspace System (NAS) [
7]. To date, UAS operations have largely been segregated from manned aircraft. In instances where operations spanned controlled airspace, separation from other aircraft has been ensured procedurally through an approval-seeking process with aviation authorities, and visually by the remote pilot in charge. Current regulations allow Visual Line of Sight (VLOS) operations within both segregated and unsegregated airspace (subject to a lengthy risk assessment process). However, large scale VLOS and autonomous Beyond VLOS (BVLOS) operations are not allowed within low altitude airspace. To prevent interference with manned aircraft, sUAS operations are limited to the open space below 400 ft (122 m) above ground level. However, with the rapid growth of civilian UAS use-cases and operations, it is evident that a dedicated infrastructural framework is required as traffic volumes scale up. The UAS Traffic Management (UTM) concept proposed and spearheaded by NASA aims to provide a framework for safely and efficiently managing the demand and complexity of future operations [
8].
The UTM framework proposed and demonstrated through various trials intends to support and enhance UAS operations in both VLOS and BVLOS modalities [
9,
10]. The UTM project is structured into four distinct phases or Technical Capability Levels (TCL). The progression of the project is characterized by increasing scenario complexity and required specific autonomous capabilities [
6,
11]. Each new TCL extends the capabilities of the previous TCL, with each sequential phase supporting a larger range of UAS from remotely piloted vehicles to fully autonomous UAS. Each capability is targeted to specific types of applications, geographical areas, and use cases that represent certain risk levels. TCL4 is characterized by complex operations in densely populated urban areas and Urban Air Mobility (UAM). The benefits of UAS and manned/unmanned operations within these dense built-up areas are being captured by the NASA Advanced Air Mobility (AAM) working groups, which have already identified numerous public and commercial use-cases [
12]. However, several challenges must be addressed to fully realise these benefits. These include Beyond Line-Of-Sight (BLOS) operations, large-scale contingency management, in-flight deconfliction and trajectory conformance monitoring. These new challenges and the safety-critical nature of urban operations will necessarily impose stringent requirements on the infrastructure supporting UTM operations. Some of the open gaps include airspace design, navigation/surveillance infrastructure, communication networks and traffic control/management [
13]. In particular, the co-design of coherent airspace structures and efficient sectorisation strategies remains an open research question, with no standardized criteria forming the basis for partitioning the future urban/suburban airspace into functioning operational structures.
Airspace sectorisation is a key factor in managing air traffic complexity, human operator workload, and demand-capacity balance [
14]. In terms of capacity modelling, demand prediction and demand-capacity balance, a large body of research is available pertaining manned aircraft and conventional Air Traffic Management (ATM) [
14,
15,
16,
17,
18,
19]. Recent developments include the dynamic morphing of airspace sectors to mitigate the disruptions associated with capacity saturation [
20]. However, owing to the difference in operational complexity, traffic volumes, fleet mixes, and supporting infrastructure, it is readily apparent that airspace design and sectorisation strategies for conventional air traffic are inapplicable in their current form to the UAS/UAM traffic management problem. While various sectorisation concepts and models have been proposed in the literature, as of today, none has been standardized or even agreed upon to cover the whole spectrum of UTM operations.
The doctrine applied in this paper is that the required separation of UTM traffic and subsequently, the airspace management strategy should be a direct consequence of the infrastructure supporting the operation, as originally argued in [
14]. These include the hardware and software systems operating in the air (avionics systems) and on the ground (traffic management systems) as well as the personnel exercising oversight and control over the operations. This leverages the opportunity to adopt some of the existing frameworks that have been applied or recommended for conventional air traffic. In particular, the concept of Performance-Based Operations (PBO), and more specifically Performance Based Navigation (PBN), proves suitable in safely accommodating the highly dynamic nature of operations as envisaged under the UTM framework. The key contribution of this paper is a novel UTM airspace model for urban areas designed to enhance the safety and efficiency of traffic spacing and to maximise exploitation of the airspace resources (capacity). The urban airspace model proposed here is specifically conceived to accommodate a high diversity in performance and operational characteristics of different UAM/UAS platforms. The airspace design and sectorization strategies are centred on the discretization of the airspace into elementary three-dimensional (3D) cells. The dimension of each cell is a function of the performance of the infrastructure supporting a given airspace region. As a consequence, the airspace structure and sector volumes are driven by the dynamically varying performance of the separation services provided. In this paper, particular emphasis is given to navigation performance, as it also affects other systems. However, the presented framework is generally applicable to the entire set of Communication, Navigation and Surveillance (CNS) systems deployed and available in a given scenario. For verification purposes, the presented models are applied to realistic UTM/UAM scenarios, including an urban canyon given the significant challenges this poses to navigation and cooperative surveillance performance. In particular, a sensitivity analysis of airspace sector capacity is performed considering the computational complexity of trajectory planning/re-planning and communication overheads associated with sector handovers.
This paper builds upon the revisited Dynamic Airspace Management (DAM) concept introduced in [
14] and presents some significant evolutions from the initial concept introduced in [
21], which are aimed to support an advanced management of low-altitude traffic exploiting high levels of autonomy, for which new human-machine interaction strategies are being developed [
22]. The paper is structured as follows:
Section 2 presents a review of prior work in airspace design and partitioning strategies and the Concept of Operations (CONOPS) for UAS/UAM operations. The proposed airspace model is presented in
Section 3. This includes the strategy to discretise the airspace and generate sectors, along with the algorithmic implementation of the model.
Section 4 applies the proposed model to two verification case studies.
Section 5 provides the conclusions of this study and future research directions.
2. UTM Airspace Design and Operational Concepts
Airspace structure design is an important aspect of UAM/UAS integration and to date remains an open research gap in the literature. Although lessons learned in conventional ATM are useful, many of its solutions cannot be scaled down and directly applied to the local management of UAM and UAS [
12].
Table 1 summarizes the main airspace structure concepts that have been proposed in the literature so far. Four concepts are readily discernible: full mix, layers, zones and tubes. These are described in detail in [
23,
24]. In the full mix concept, the airspace is essentially unstructured, with vehicles using a direct route between their origin and destination, with optimised flight altitudes and velocities to minimise fuel burn and other related costs. In the layered concept, the airspace is divided into sections stacked on top of each other. Each layer is typically dedicated to a type of aerial vehicle and a specific heading. The zone concept divides the airspace into different regions on the basis of a set of criteria. This typically includes risk exposure to people and property. Lastly, tube-based airspace structures are centred on fixed corridors; vehicles must follow a common speed limit, thus ensuring safe separation and minimizing conflicts. The so-called “stacked-layer” concept is also gaining traction, with one proposal to split each layer into so-called sky lanes in urban centres that mimic the organisation of streets [
13]. Each lane is essentially a corridor that encompasses a reference nominal trajectory with sufficient buffers to account for potential off-nominal situations. The separation assurance from other vehicles and static obstacles is maintained by onboard autonomous systems and/or remote pilots. The flow of traffic is essentially managed by offline or online design/redesign of the lanes. Situations in which lanes intersect are managed by a time-based prioritization for each lane, conceptually similar to how traffic lights are applied to road traffic. Another layered airspace concept which is analogous to road traffic is presented in [
25,
26], where roundabouts are used at the junction of multiple sky lanes, in place of time-based separations.
The zone concept has also been proposed in the literature as a means of dividing the airspace into operational volumes. In several proposals in the literature, the division is typically performed on the basis of the level of risk exposure to the general public. Alternatively, the division can also be performed on the basis of the services provided, and on the level of overall system performance required to support a given category of operation. Access to a particular zone is then contingent on the UAS meeting the level of system performance stipulated for that zone. This mirrors the implementation of PBN for manned aircraft, wherein the employed navigation systems are required to meet a certain level of performance depending on the region and phase of flight. In fact, PBN has been endorsed by NASA [
29], as a potentially viable concept to adopt and apply to the airspace structuring problem in the UTM context. This is also emphasised in the NASA AAM initiative [
30]. Navigation performance for UAS can vary to a greater extent than manned aircraft.
Most UAS navigation systems employ a Global Navigation Satellite System (GNSS) receiver as the primary source of positioning in a global frame. This is typically supplemented by fusion with other sensors including inertial sensors, visual sensors and lidar to obtain a full navigation state estimate. The achievable performance is dependent on the individual sensor characteristics as well as the employed fusion algorithm. Performance is also dependent on environmental characteristics that are different from those encountered in manned aircraft operations.
For example, GNSS performance is highly degraded in urban environments owing to signal multipath and obscuration relative to conventional manned aircraft operations. Therefore, greater reliance on augmentation with visual sensors and intelligent fusion algorithms is necessary.
A successful adaptation of PBN to the UTM context would support this widely varying performance. Further, the PBN concept can be extended more generally to include not only navigation performance but also (as a minimum), communication and surveillance performance. PBN would then be one element of the broader concept of Performance-Based Operations (PBO). However, there has been limited investigation so far into this line of research. Duchamp V. [
27] presents a PBN-inspired approach using graph algorithm to separate UAS traffic into different levels; congested city zones are divided into a larger number of layers and in contrast, low-density airspace is structured with a lower resolution. In [
31], the airspace was partitioned into so-called ‘airboxes’ considering communication performance.
2.1. Urban UAM/UAS Operational Concept
For On-demand Passenger Air Transportation (OPAT), Nneji et al. [
32] present a CONOPS that is conceptually similar to current aviation practice, with the pilot taking on the responsibilities of pre-takeoff checks, communication with ATC and post-landing checks. This type of CONOPS is currently gaining traction and industry interest [
33]. This forms the foundation on which more advanced concepts such as “Revolutionary Vehicle Autonomy” (RVA) and “Evolutionary Vehicle Autonomy” (EVA) are based [
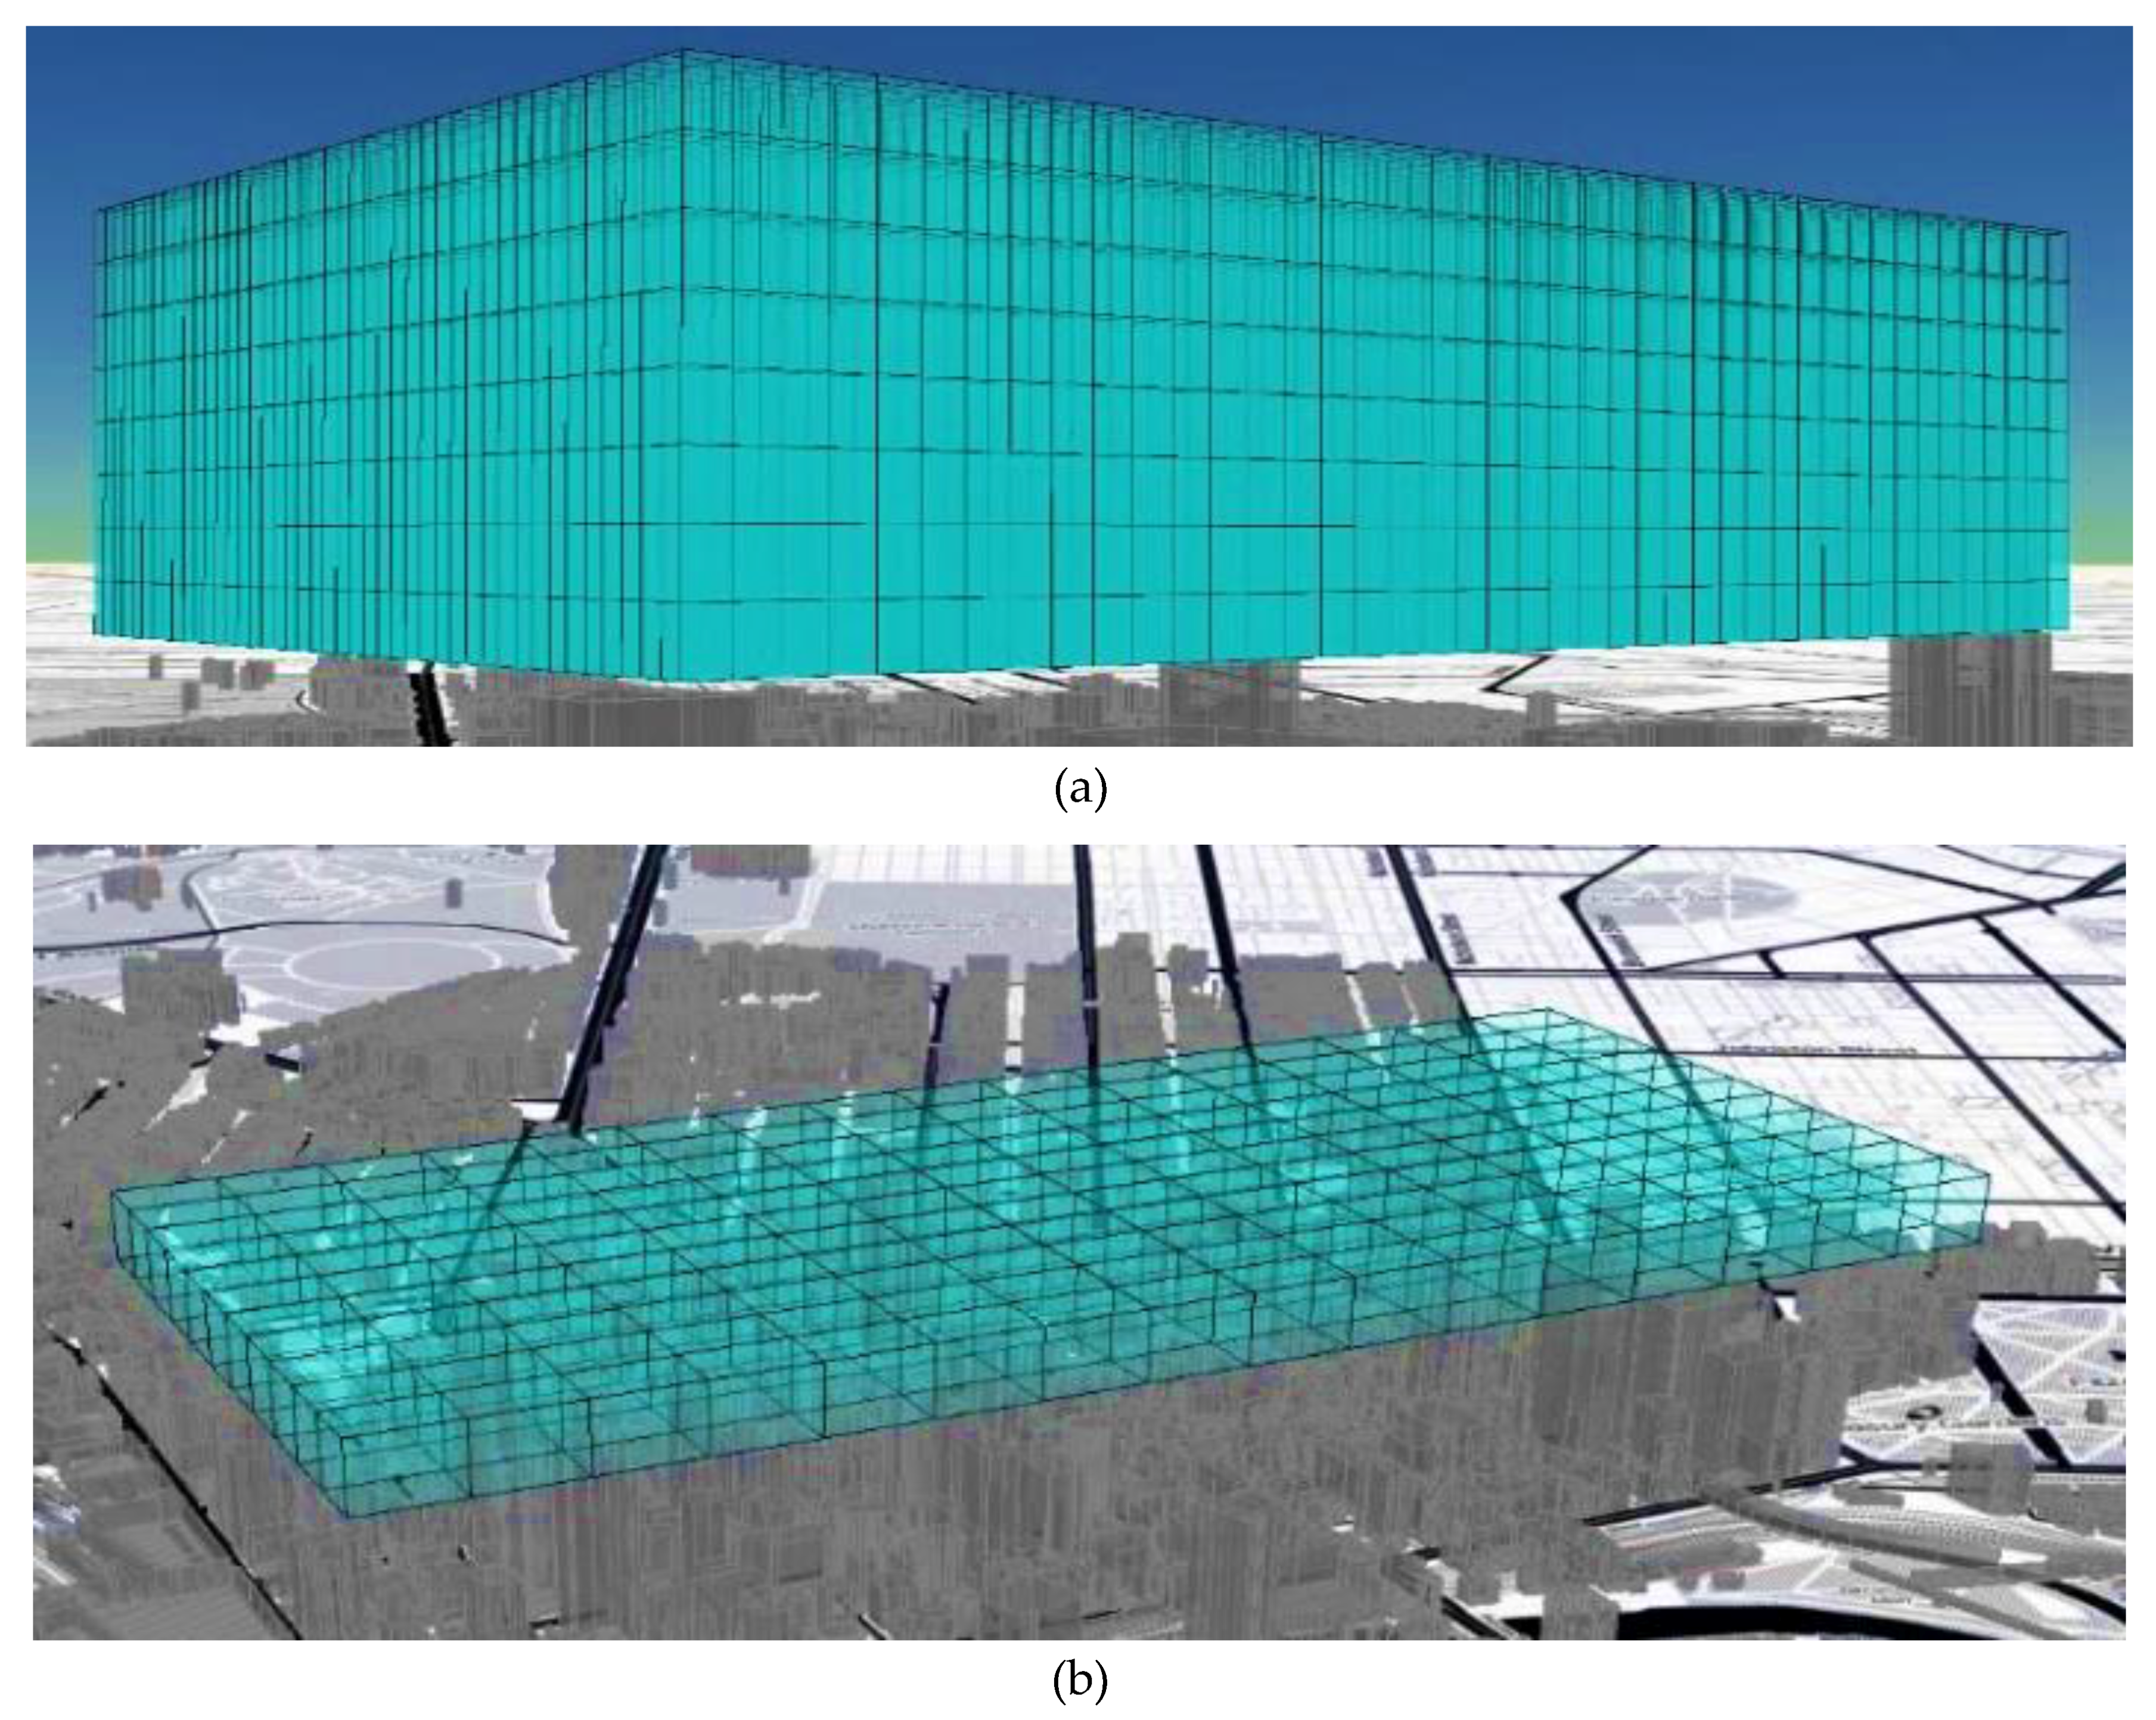
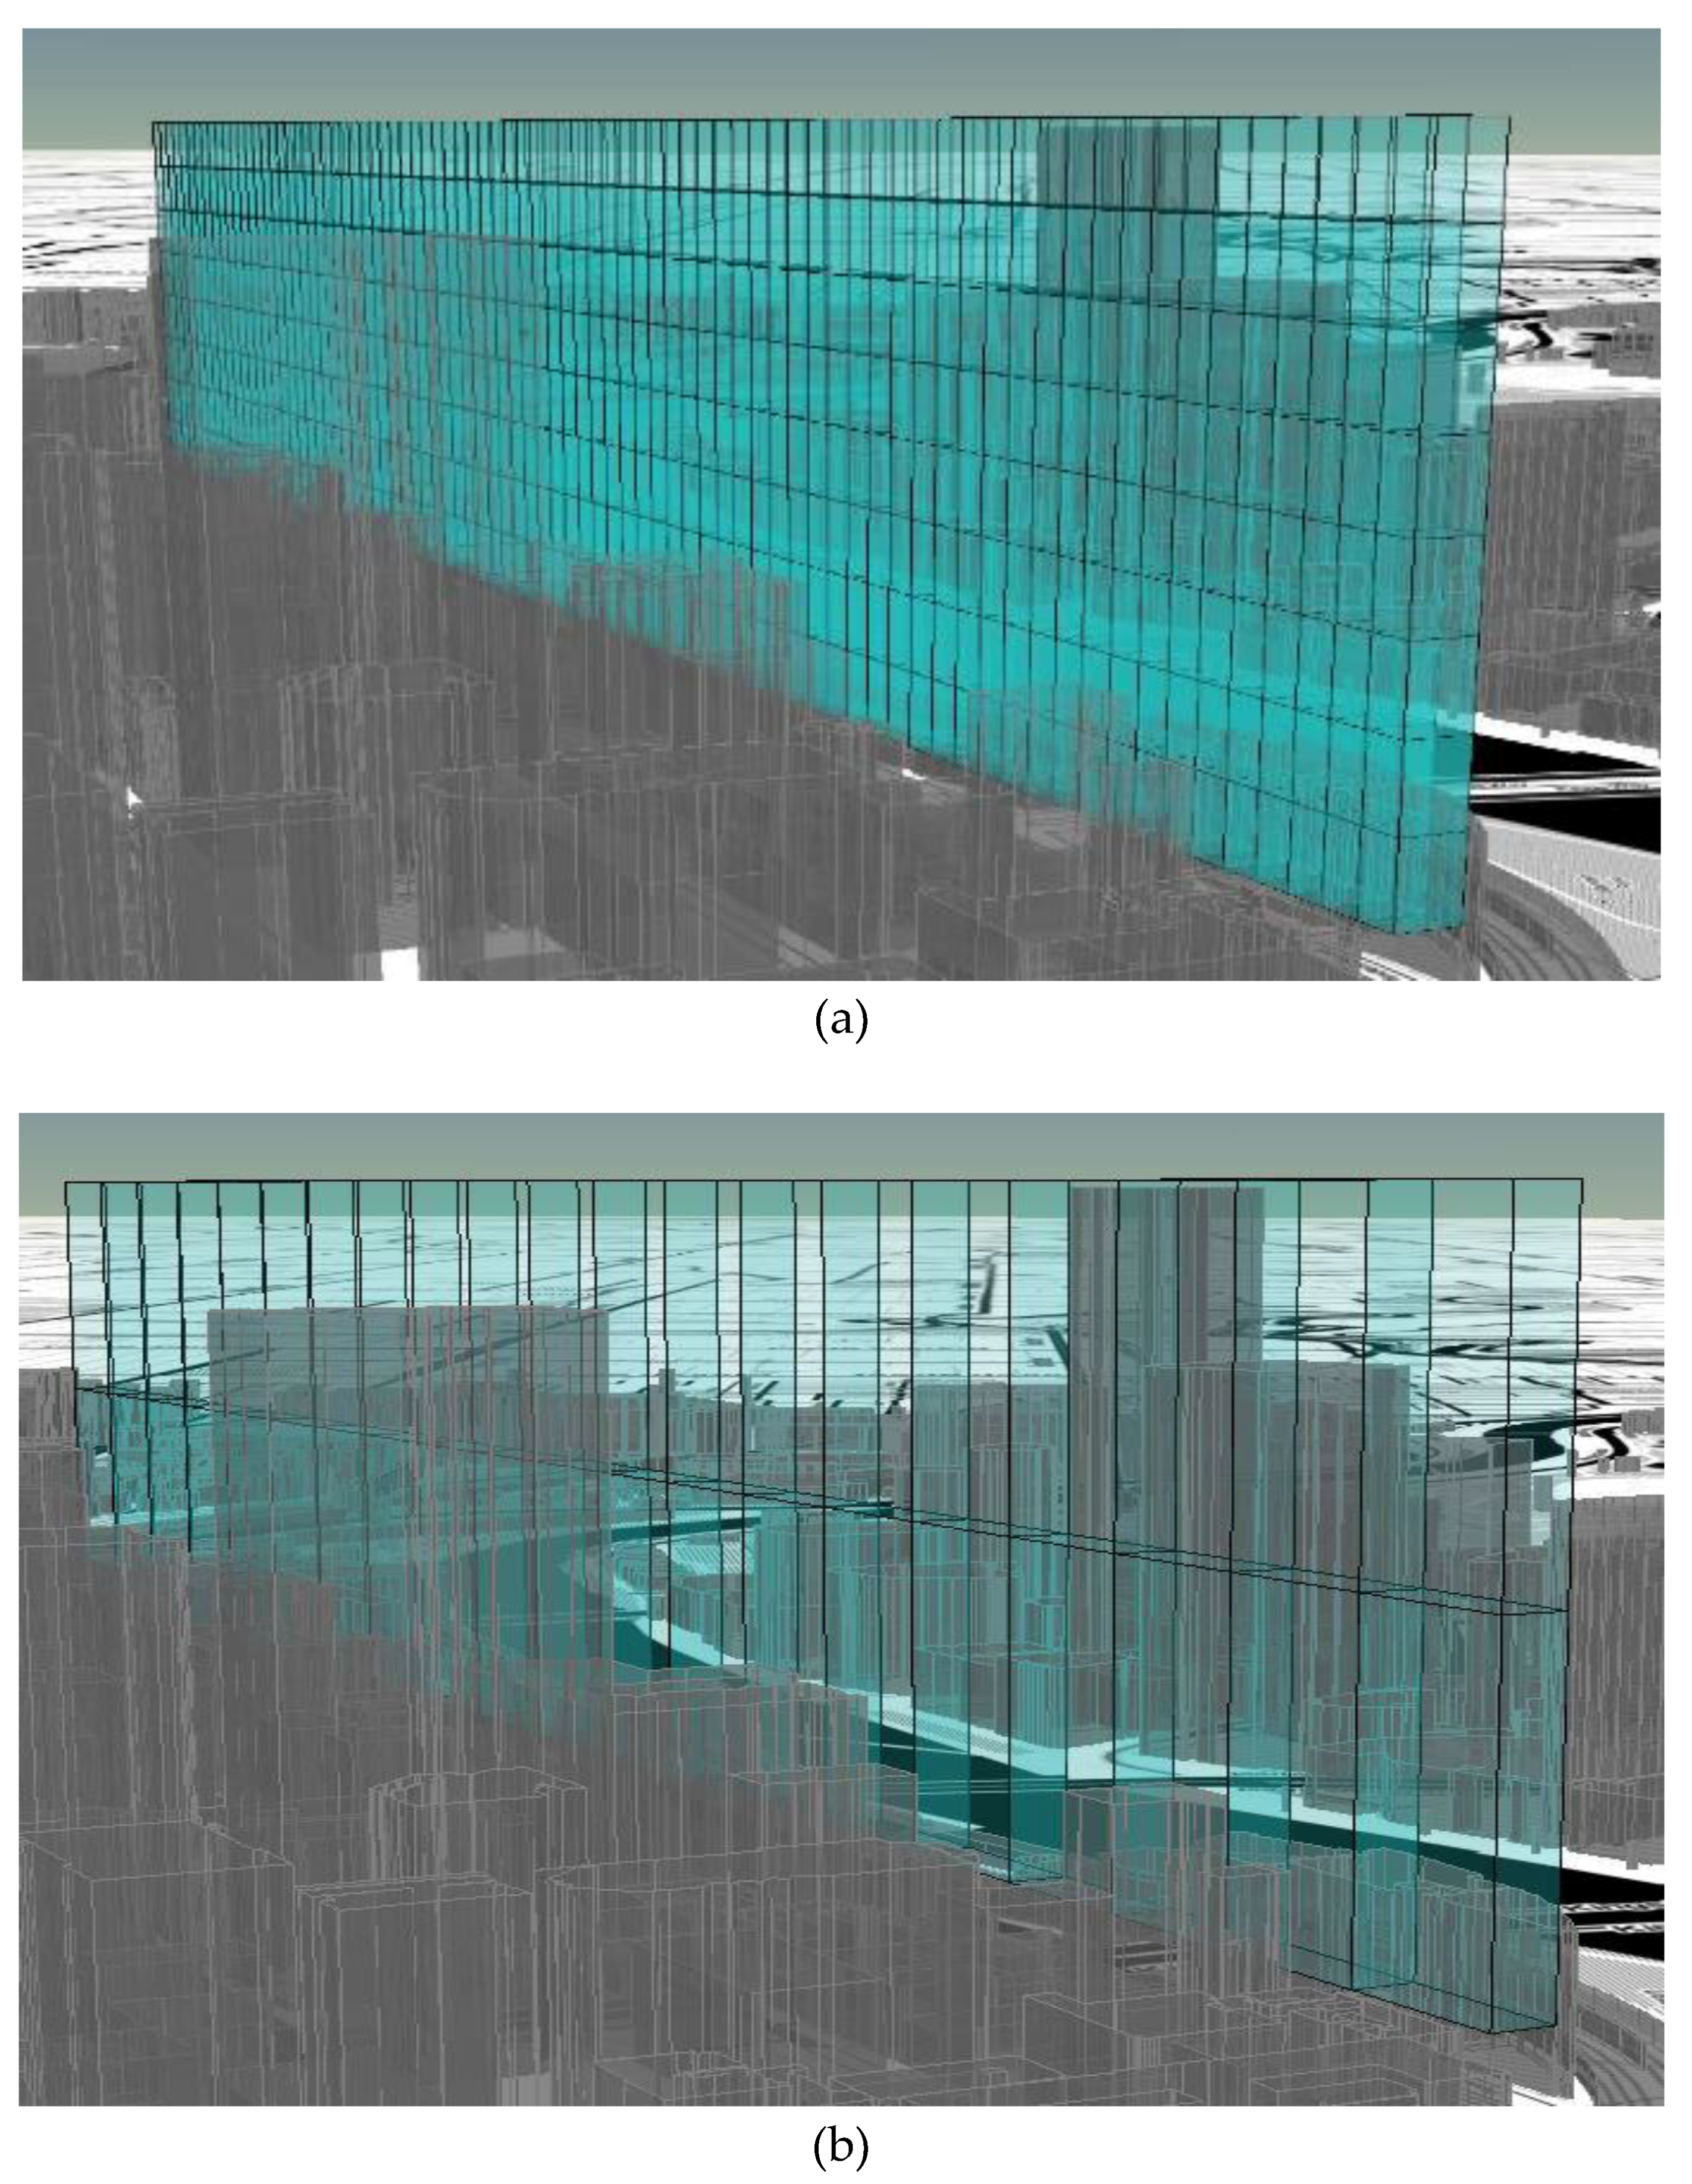
32]. Two representative operational cases are described in this section: flight over skyline (UAM air-taxi operations) and flight below skyline (UAS delivery operations). These two cases are also addressed in the verification studies presented in
Section 4. For UAM traffic, it is recommended to adapt helicopter routes by bounded the trajectories as corridors [
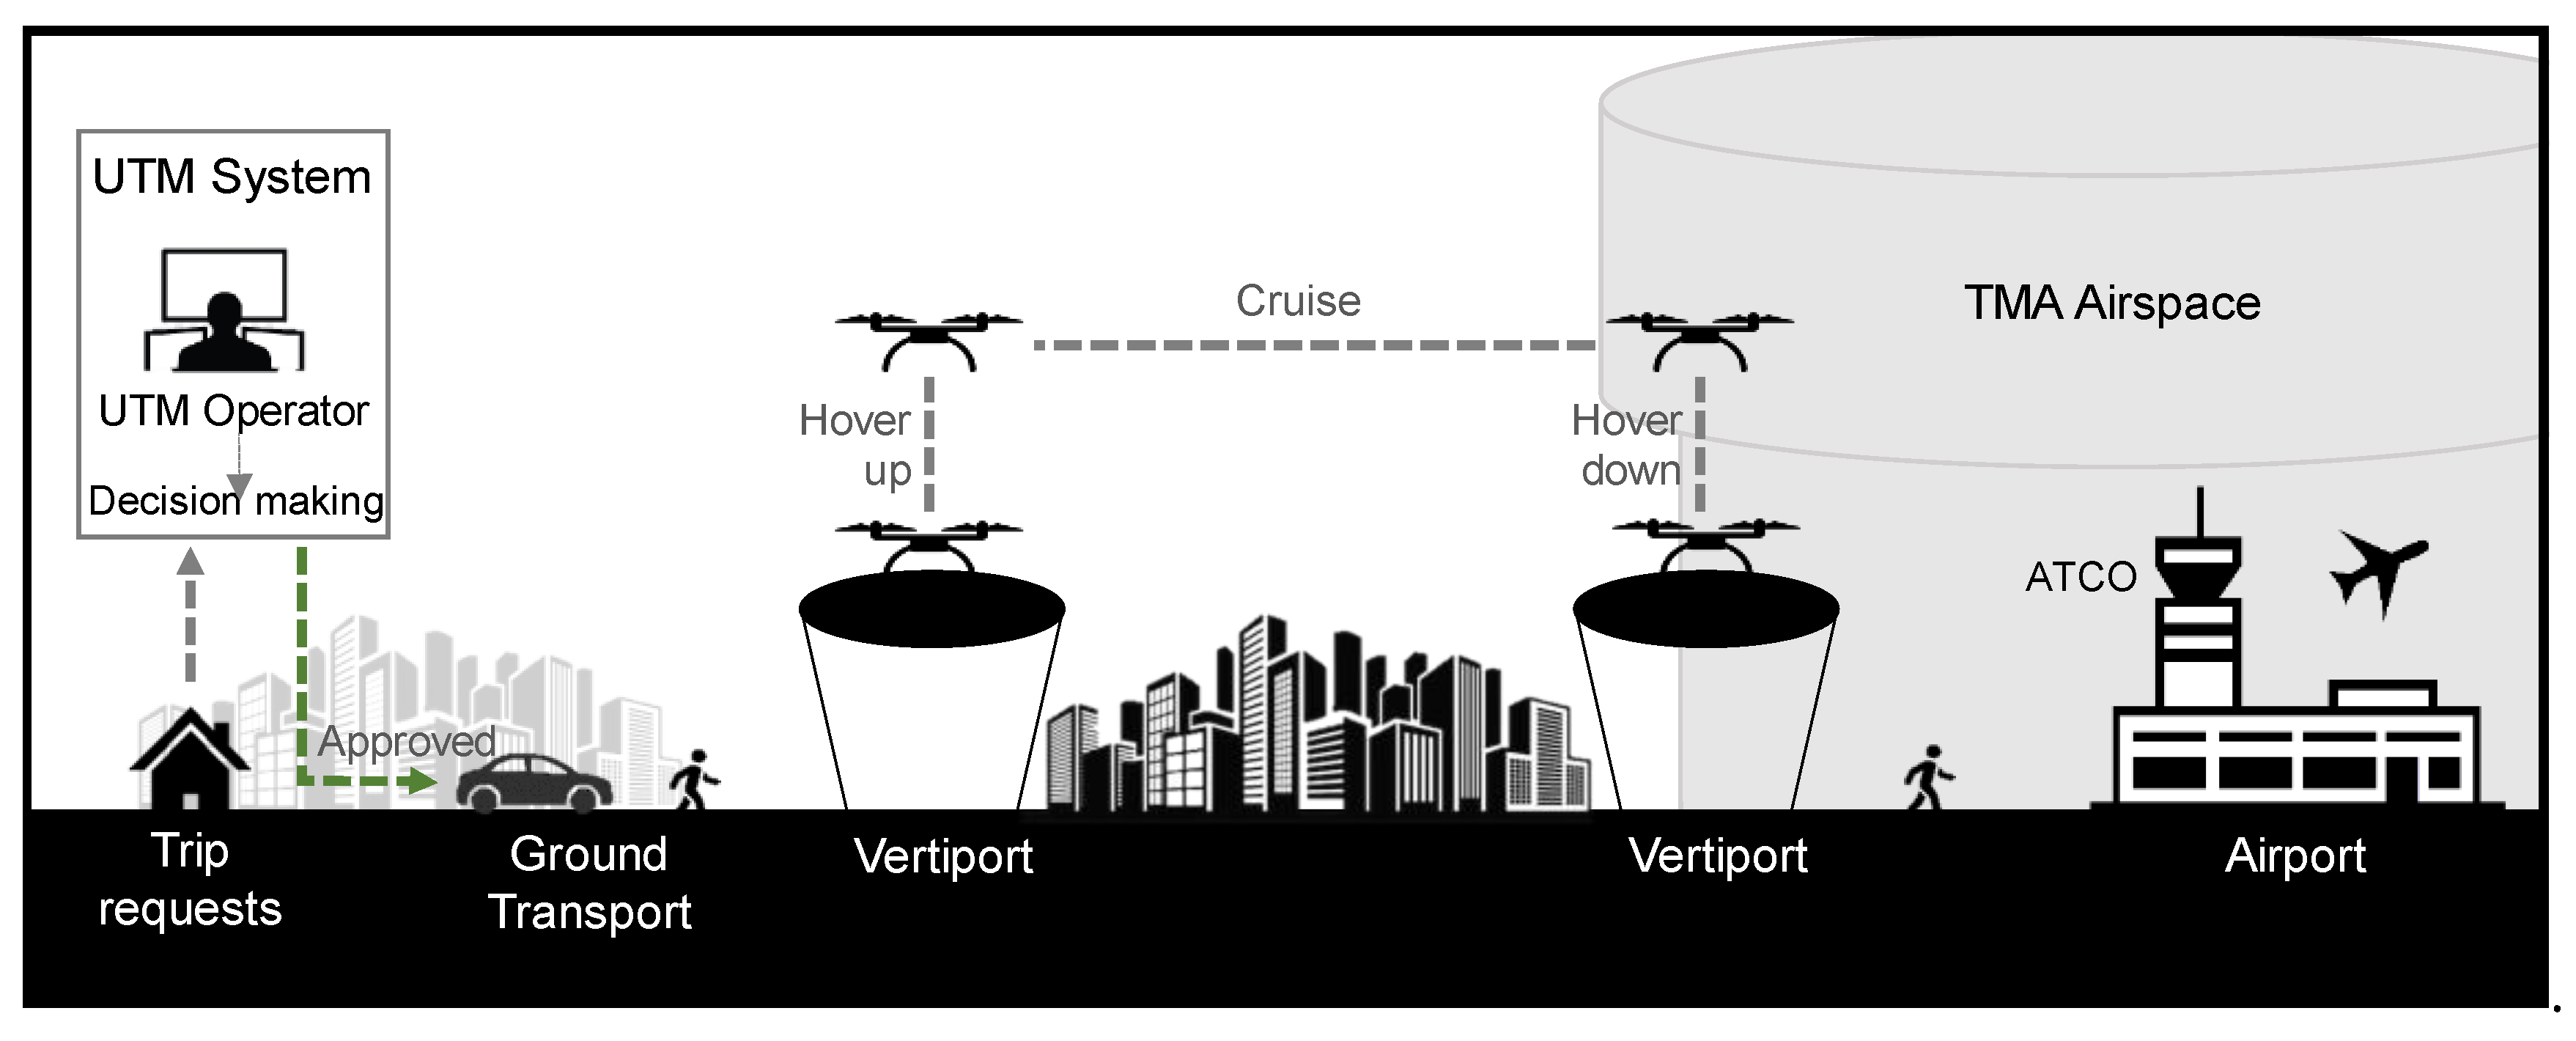
34]. However, simply adapting current helicopter routes will not respond to the current demands for Mobility-as-a-Service (MAAS). Hence, in the foreseeable future, it is expected that the user will be able to submit a request by only specifying the intended departure and arrival points. The system will then calculate the most suitable route to accomplish this service. Under these proposed concepts, the flight trajectory will be autonomously calculated and evaluated by its governing UTM system, allowing for minimal human intervention. This is conceptually illustrated in
Figure 1. The operation starts when the passenger submits a request for a trip through a UTM service supplier interface. The UTM system with a UTM operator in the loop generates an intended route considering factors such as airspace capacity, traffic management, weather, time efficiency, etc. After the intended routes are confirmed, the passenger boards the UAM platform, and the mission is executed autonomously. The flight can span multiple regions with differing safety objectives and supporting infrastructure e.g., a flight can span the airspace over suburban, urban and airport regions. Emergency scenarios call for the provision of system features that allow human operators to initiate and execute contingency measures leading to a safe and rapid recovery [
32].
For UAS-based delivery operations, the envisaged CONOPs is as follows:
Phase 1—the remote pilot submits the intended mission profile to the UTM Service Supplier (USS) and requests clearance to access the intended operational airspace and execute the mission;
Phase 2—The USS checks for conflict with other operations, and assesses whether the UAS and its corresponding support infrastructure meets the minimum required performance requirements for the intended operational airspace; Upon clearance of these checks, the submitted request is approved;
Phase 3—The UAS takes-off and climbs to its cruise altitude;
Phase 4—When the UAS is enroute to the delivery location, system performance is monitored and potential threats are assessed by both remote pilot and onboard/ground-based autonomous systems;
Phase 5—Upon arrival at the delivery location, the remote pilot confirms a clearance to land through UTM service, which also triggers a notification to the customer;
Phase 6—The UAS delivers the package. This can be accomplished in different ways. A cable and tether mechanism is typically employed;
Phase 7—The customer retrieves the parcel;
Phase 8—The remote pilot guides the unmanned aircraft back to base, again subject to a conflict check and clearance from the UTM service
Human operators are required to be in the loop for assuring safety, especially during emergency procedures. However, during nominal conditions, the high level of automation allows the operator(s) to take on a strategic management role, with most low-level (and increasingly high-level) tasks being performed autonomously.
3. Urban Airspace Model
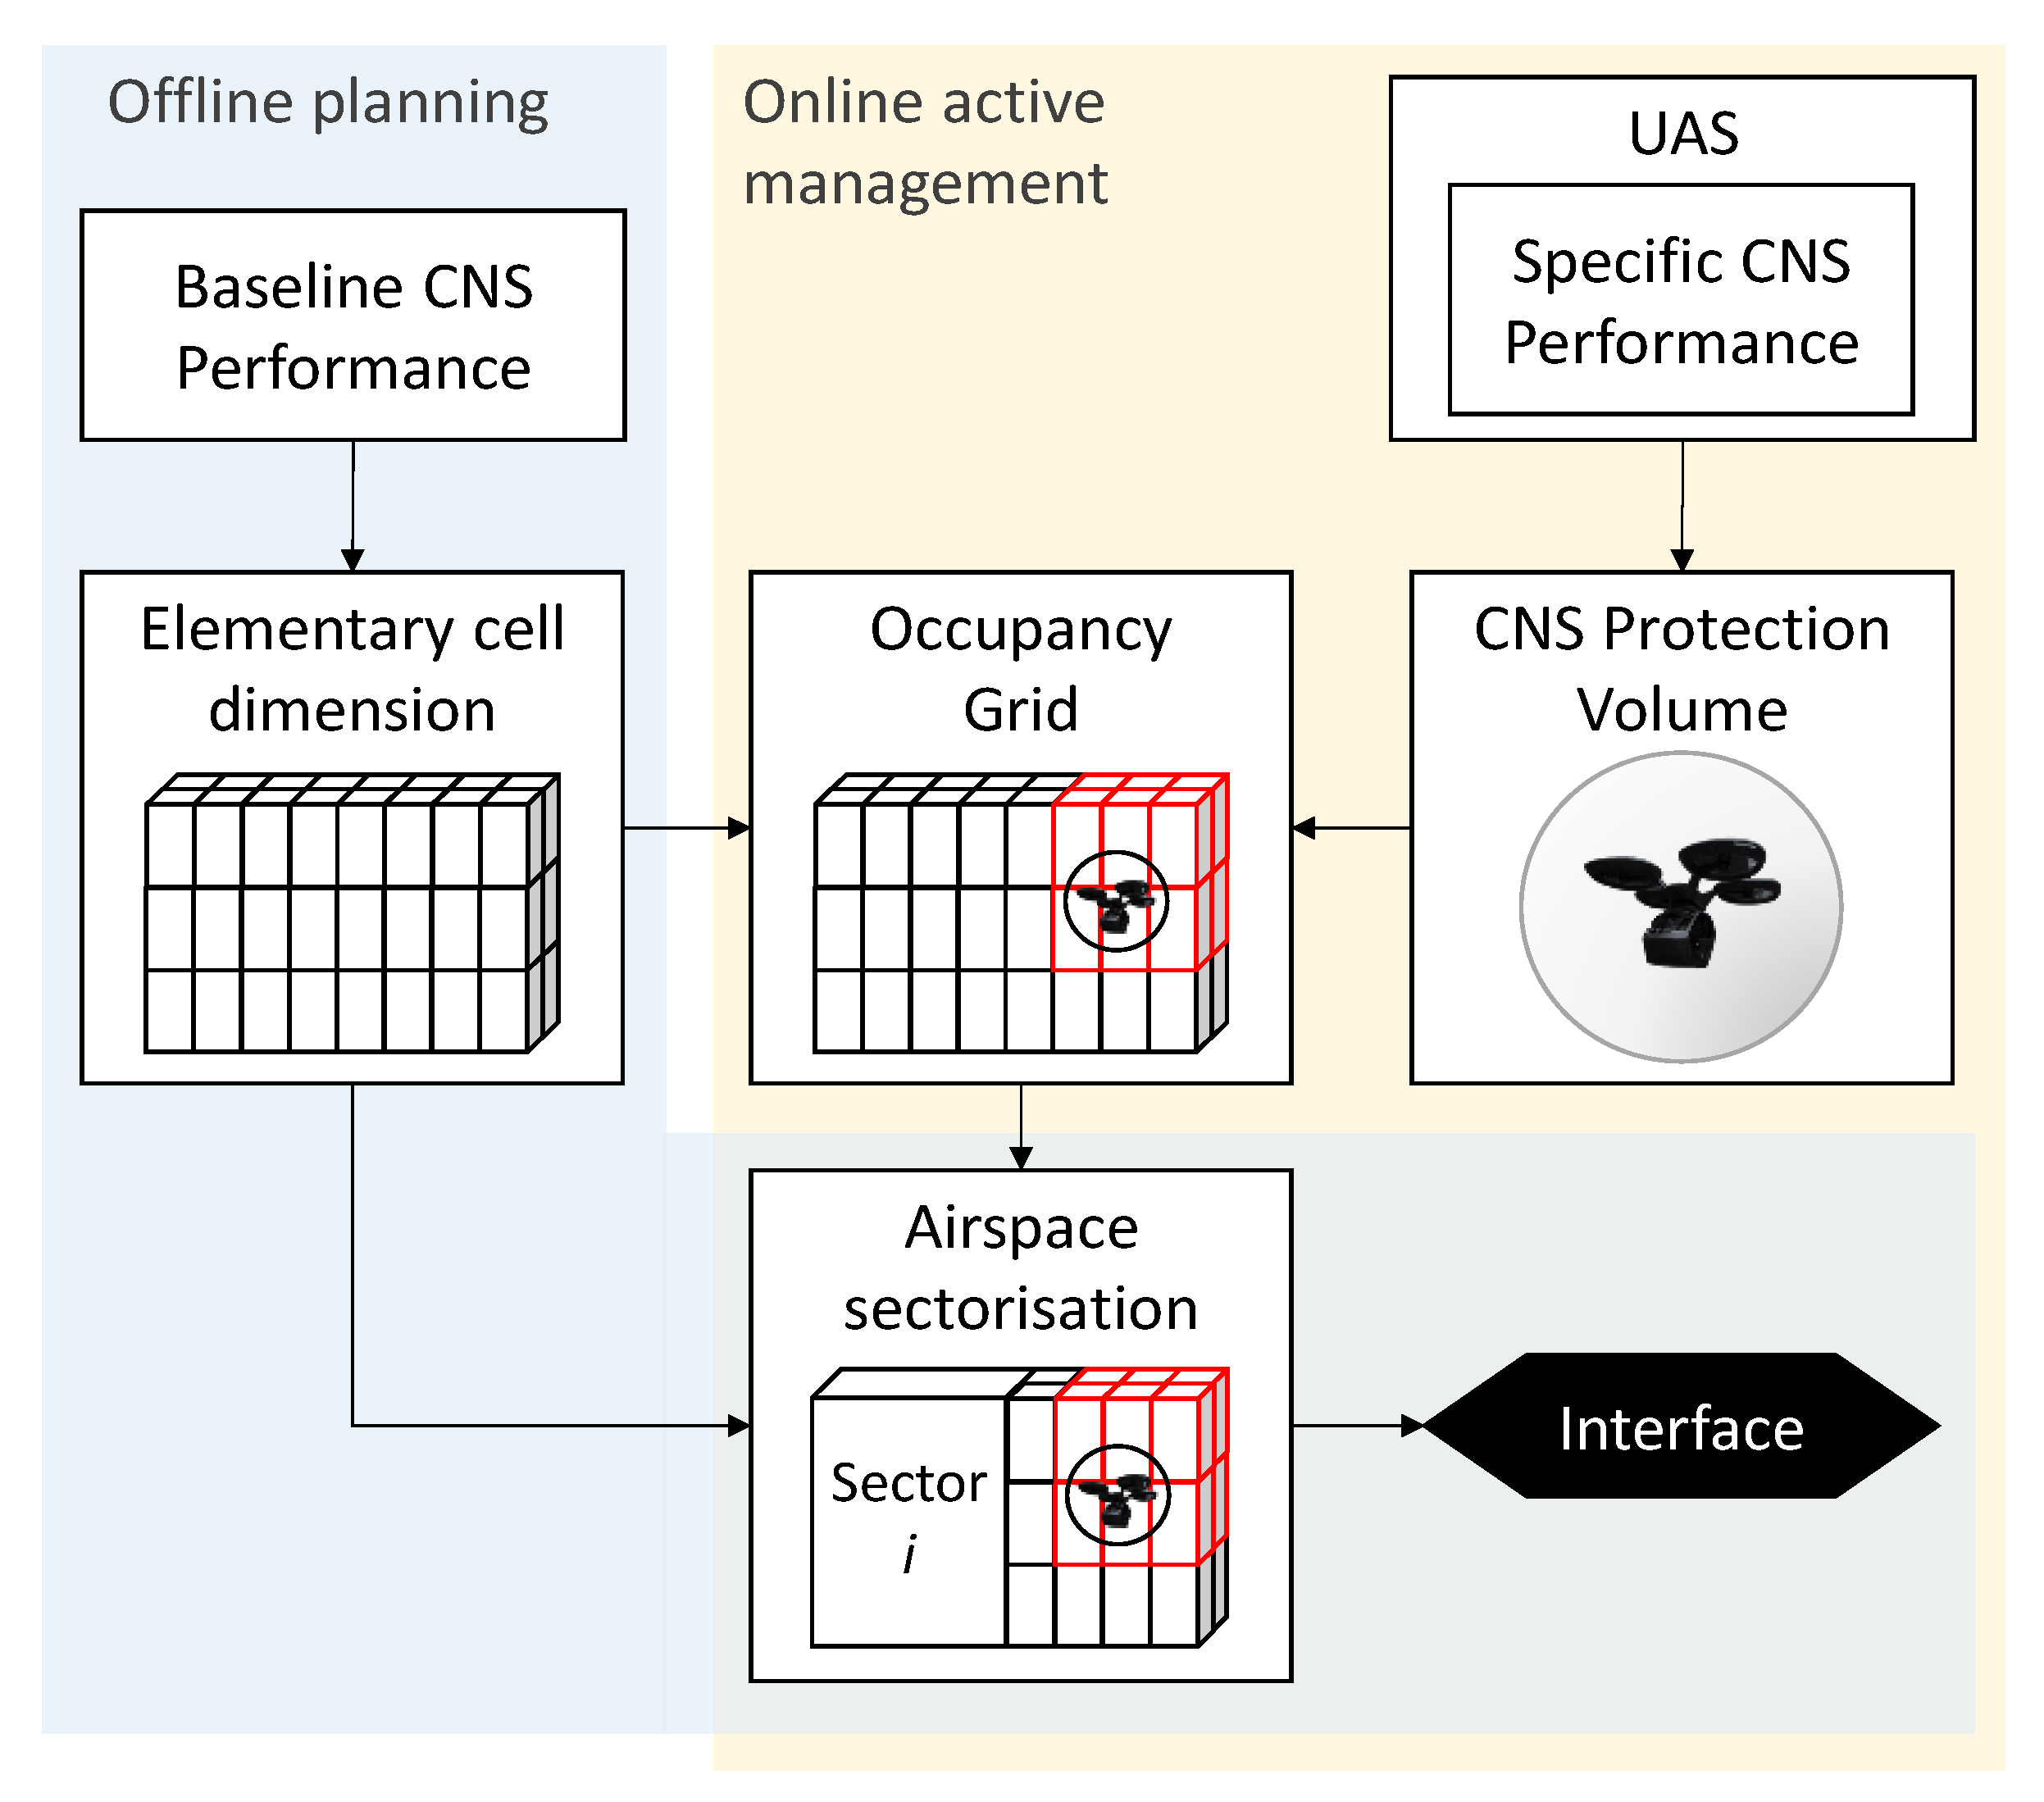
The proposed performance-based airspace model is conceptually illustrated in
Figure 2. The model is underpinned by a two-stage approach. During the offline planning stage, the reference grid is generated as a set of
elementary cells according to the baseline CNS performance. In our approach, the elementary cells are parameterized as cuboids with a square base, but the methodology could easily be extended to other 3D shapes. The length (
), width (
) and height (
) of the cuboidal cells are formulated as a function of the expected baseline CNS performance for the region:
where
are the set of performance metrics for communication, navigation, and surveillance respectively. A summary of applicable metrics which quantify the CNS performance is provided in
Table 2. The model is applied in two timeframes: offline planning and online airspace management.
For communication systems in aviation applications, one measure of performance is the latency in staging an intervention due to human operator and equipment limitations. These are typically not measured in real-time but are determined apriori either analytically, or more frequently, using experimental data.
For navigation systems, under the PBN framework, performance is quantified using four metrics [
35]:
Accuracy
Integrity
Continuity
Availability
System accuracy requirements are specified as an upper bound on position error, which is the difference between the estimated position and the actual position. Navigation state estimators typically output the standard deviation of the computed position solution as a measure of confidence. A 2σ value which bounds approximately 95% of the navigation errors is taken as an online indicator of accuracy. Integrity is a measure of trust that can be placed in the correctness of the positioning solution supplied by the navigation system. Integrity includes the ability of a system to provide timely and valid warnings to the user (alerts) when the system must not be used for the intended phase of flight. To ensure integrity in practice, the standard deviation of the computed position solution is inflated by a requisite factor to bound all but a small fraction of errors (corresponding to an ‘integrity’ risk or maximum allowable probability that the solution is out of bounds). The inflation also accounts for the maximum allowable false alarm rate of the system, which dictates the continuity of the system. Continuity is a measure of reliability that ensures that the system will perform nominally without interruption for a given mission segment. Availability is the proportion of the overall mission time for which the navigation system meets accuracy, integrity and continuity requirements. For GNSS, the well-known Dilution of Precision (DOP) factors are also used as an easily obtained online measure of performance.
For surveillance systems, as in the case of navigation, state estimators used in radar such as the Extended Kalman Filter or other recursive algorithms output the standard deviation of tracking error. As in the case of navigation, this metric can be inflated to bind a required fraction of the error.
In the online stage, the specific CNS performance of each UAS is estimated and used to generate a virtual protection volume bounding the vehicle. This volume is the
CNS protection volume, which comprises the combined uncertainty of the CNS infrastructure supporting the UAS. This represents a protected volumetric bound which should not be breached by any obstacle to ensure a sufficient margin for Separation Assurance and Collision Avoidance (SA/CA). The methodology to generate the individual components of this volume is presented in
Section 3.2.
An occupancy grid can successively be derived from the set of elementary cells and from the active CNS protection volumes. Cells that are contained within and on the boundary of the protection volume correspond to occupied space and the remaining cells correspond to unoccupied space. This is also illustrated in
Figure 2.
The occupancy grid supports the demand-capacity balancing by not just considering the number of aircraft simultaneously active in a region, which was the traditional approach for human-centric ATM, but also their specific CNS performance, which supports more automated and autonomous SA/CA concepts.
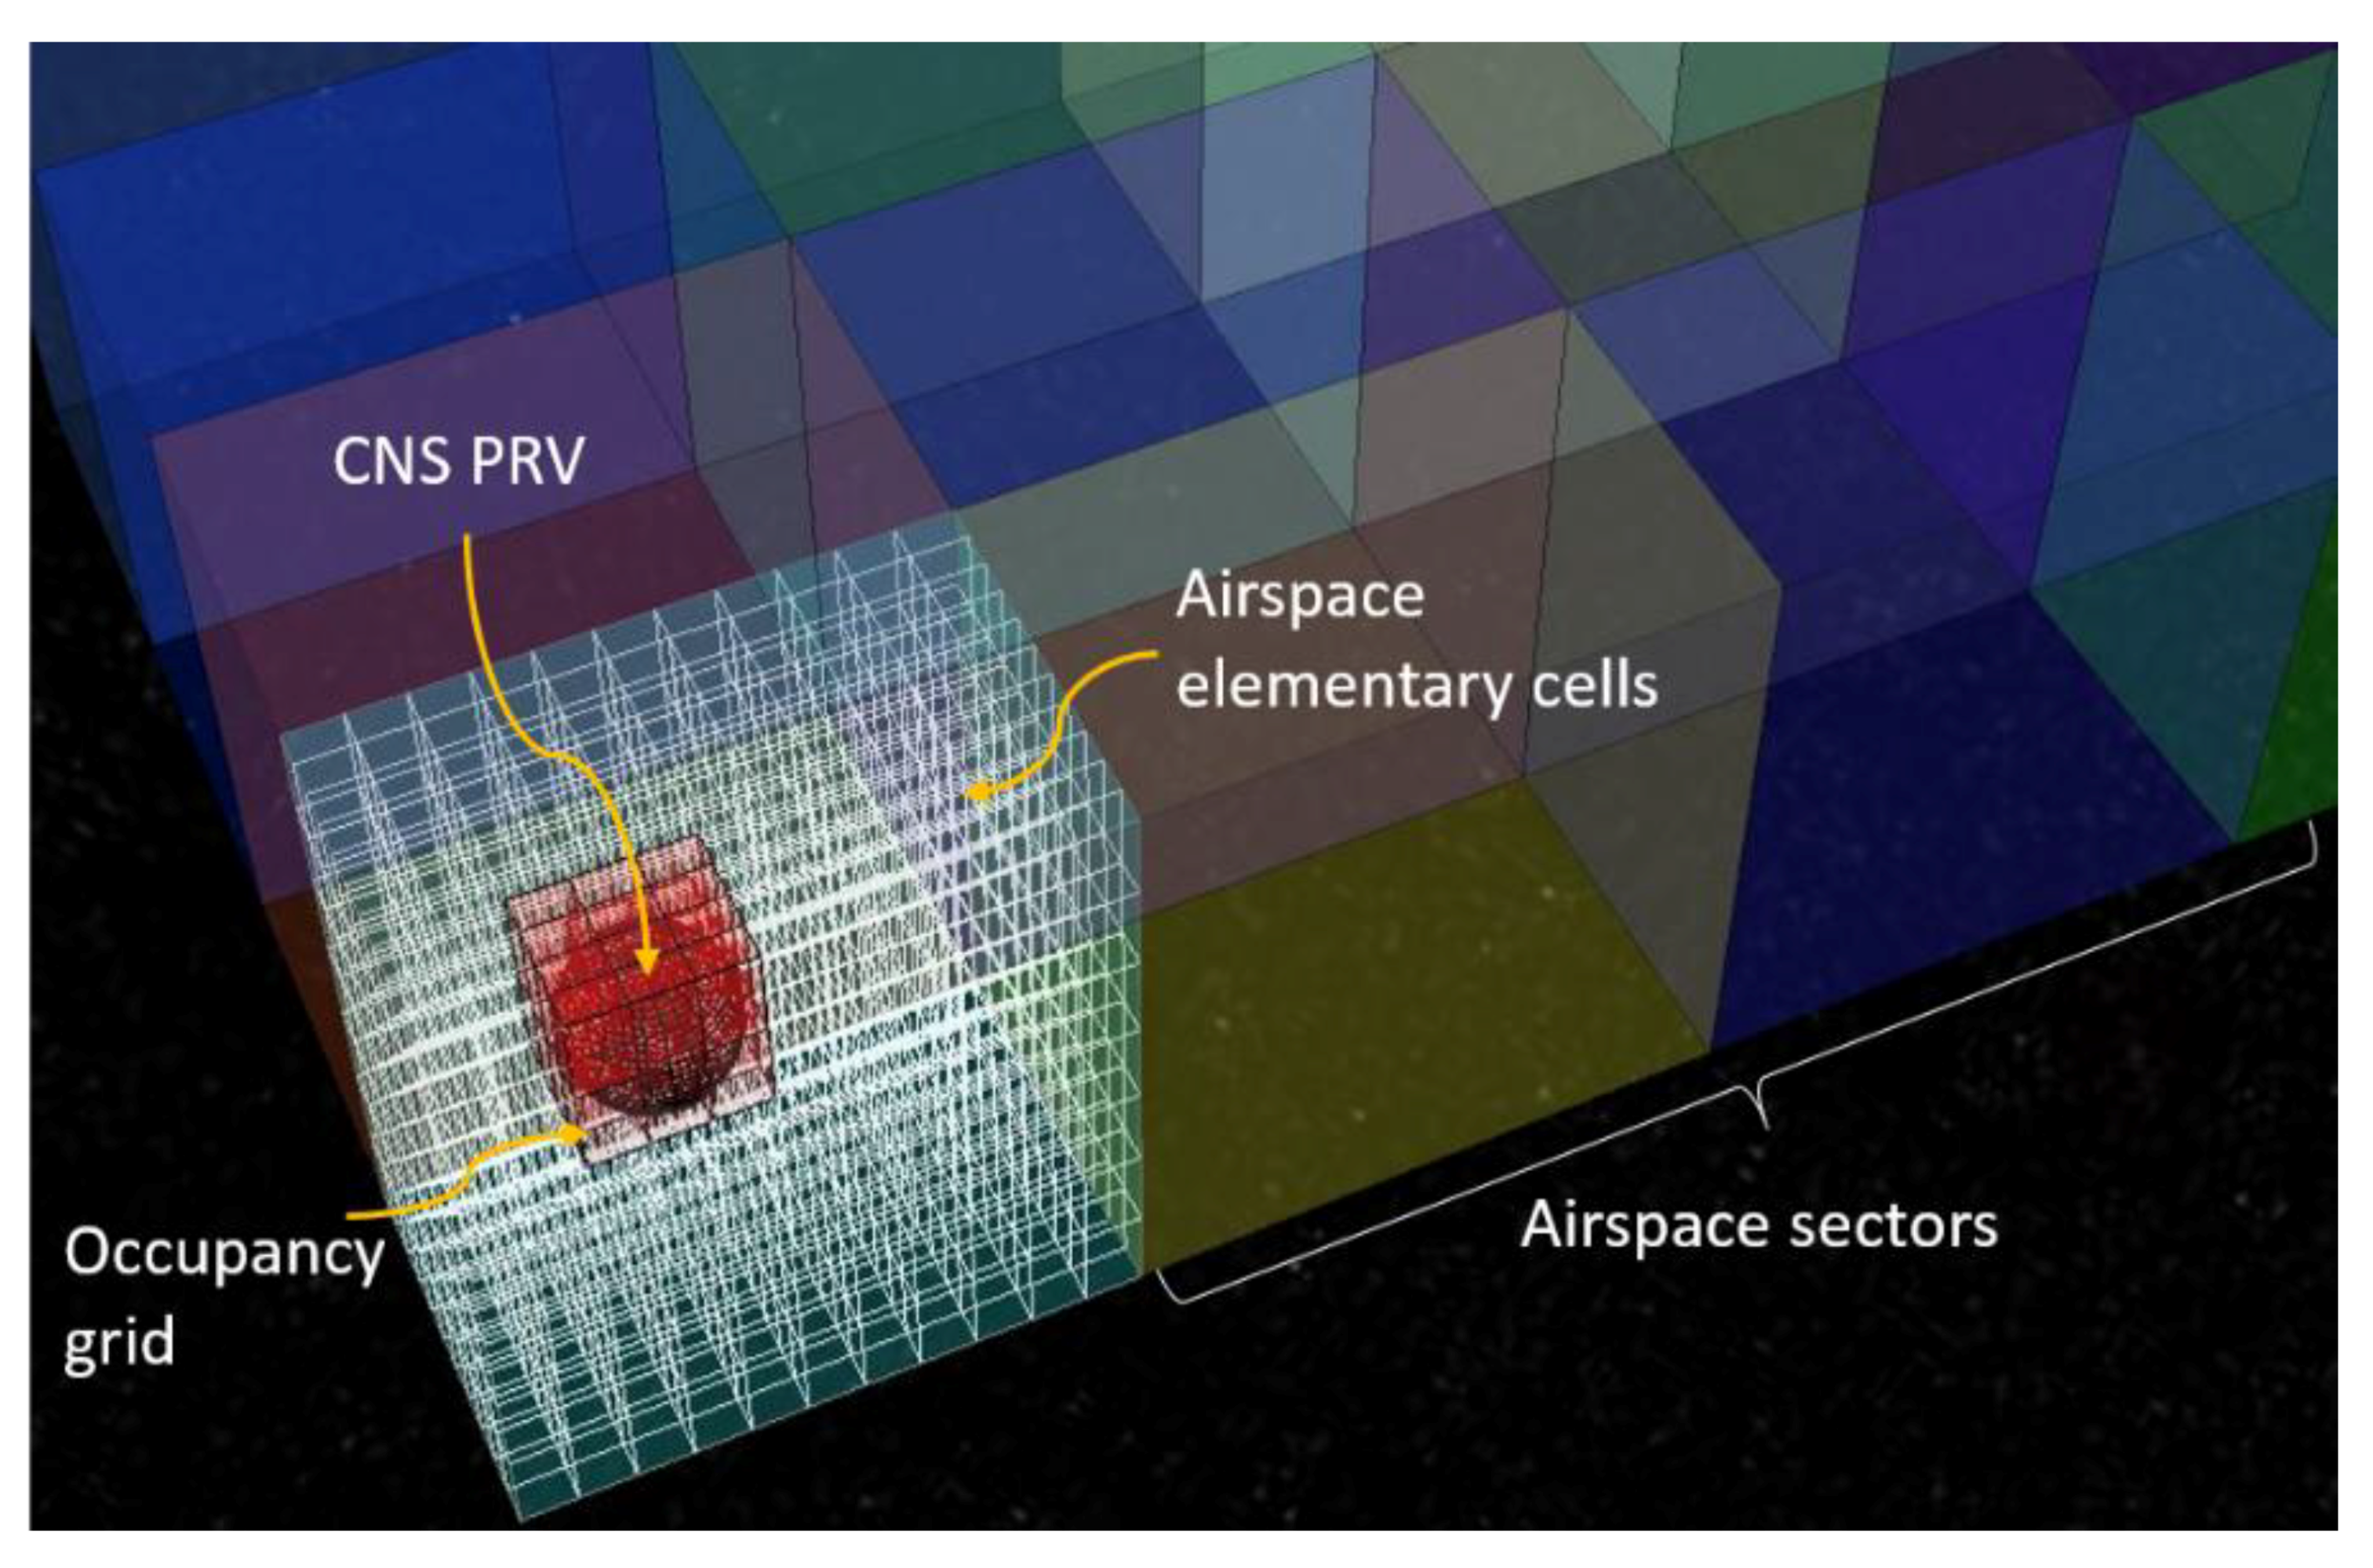
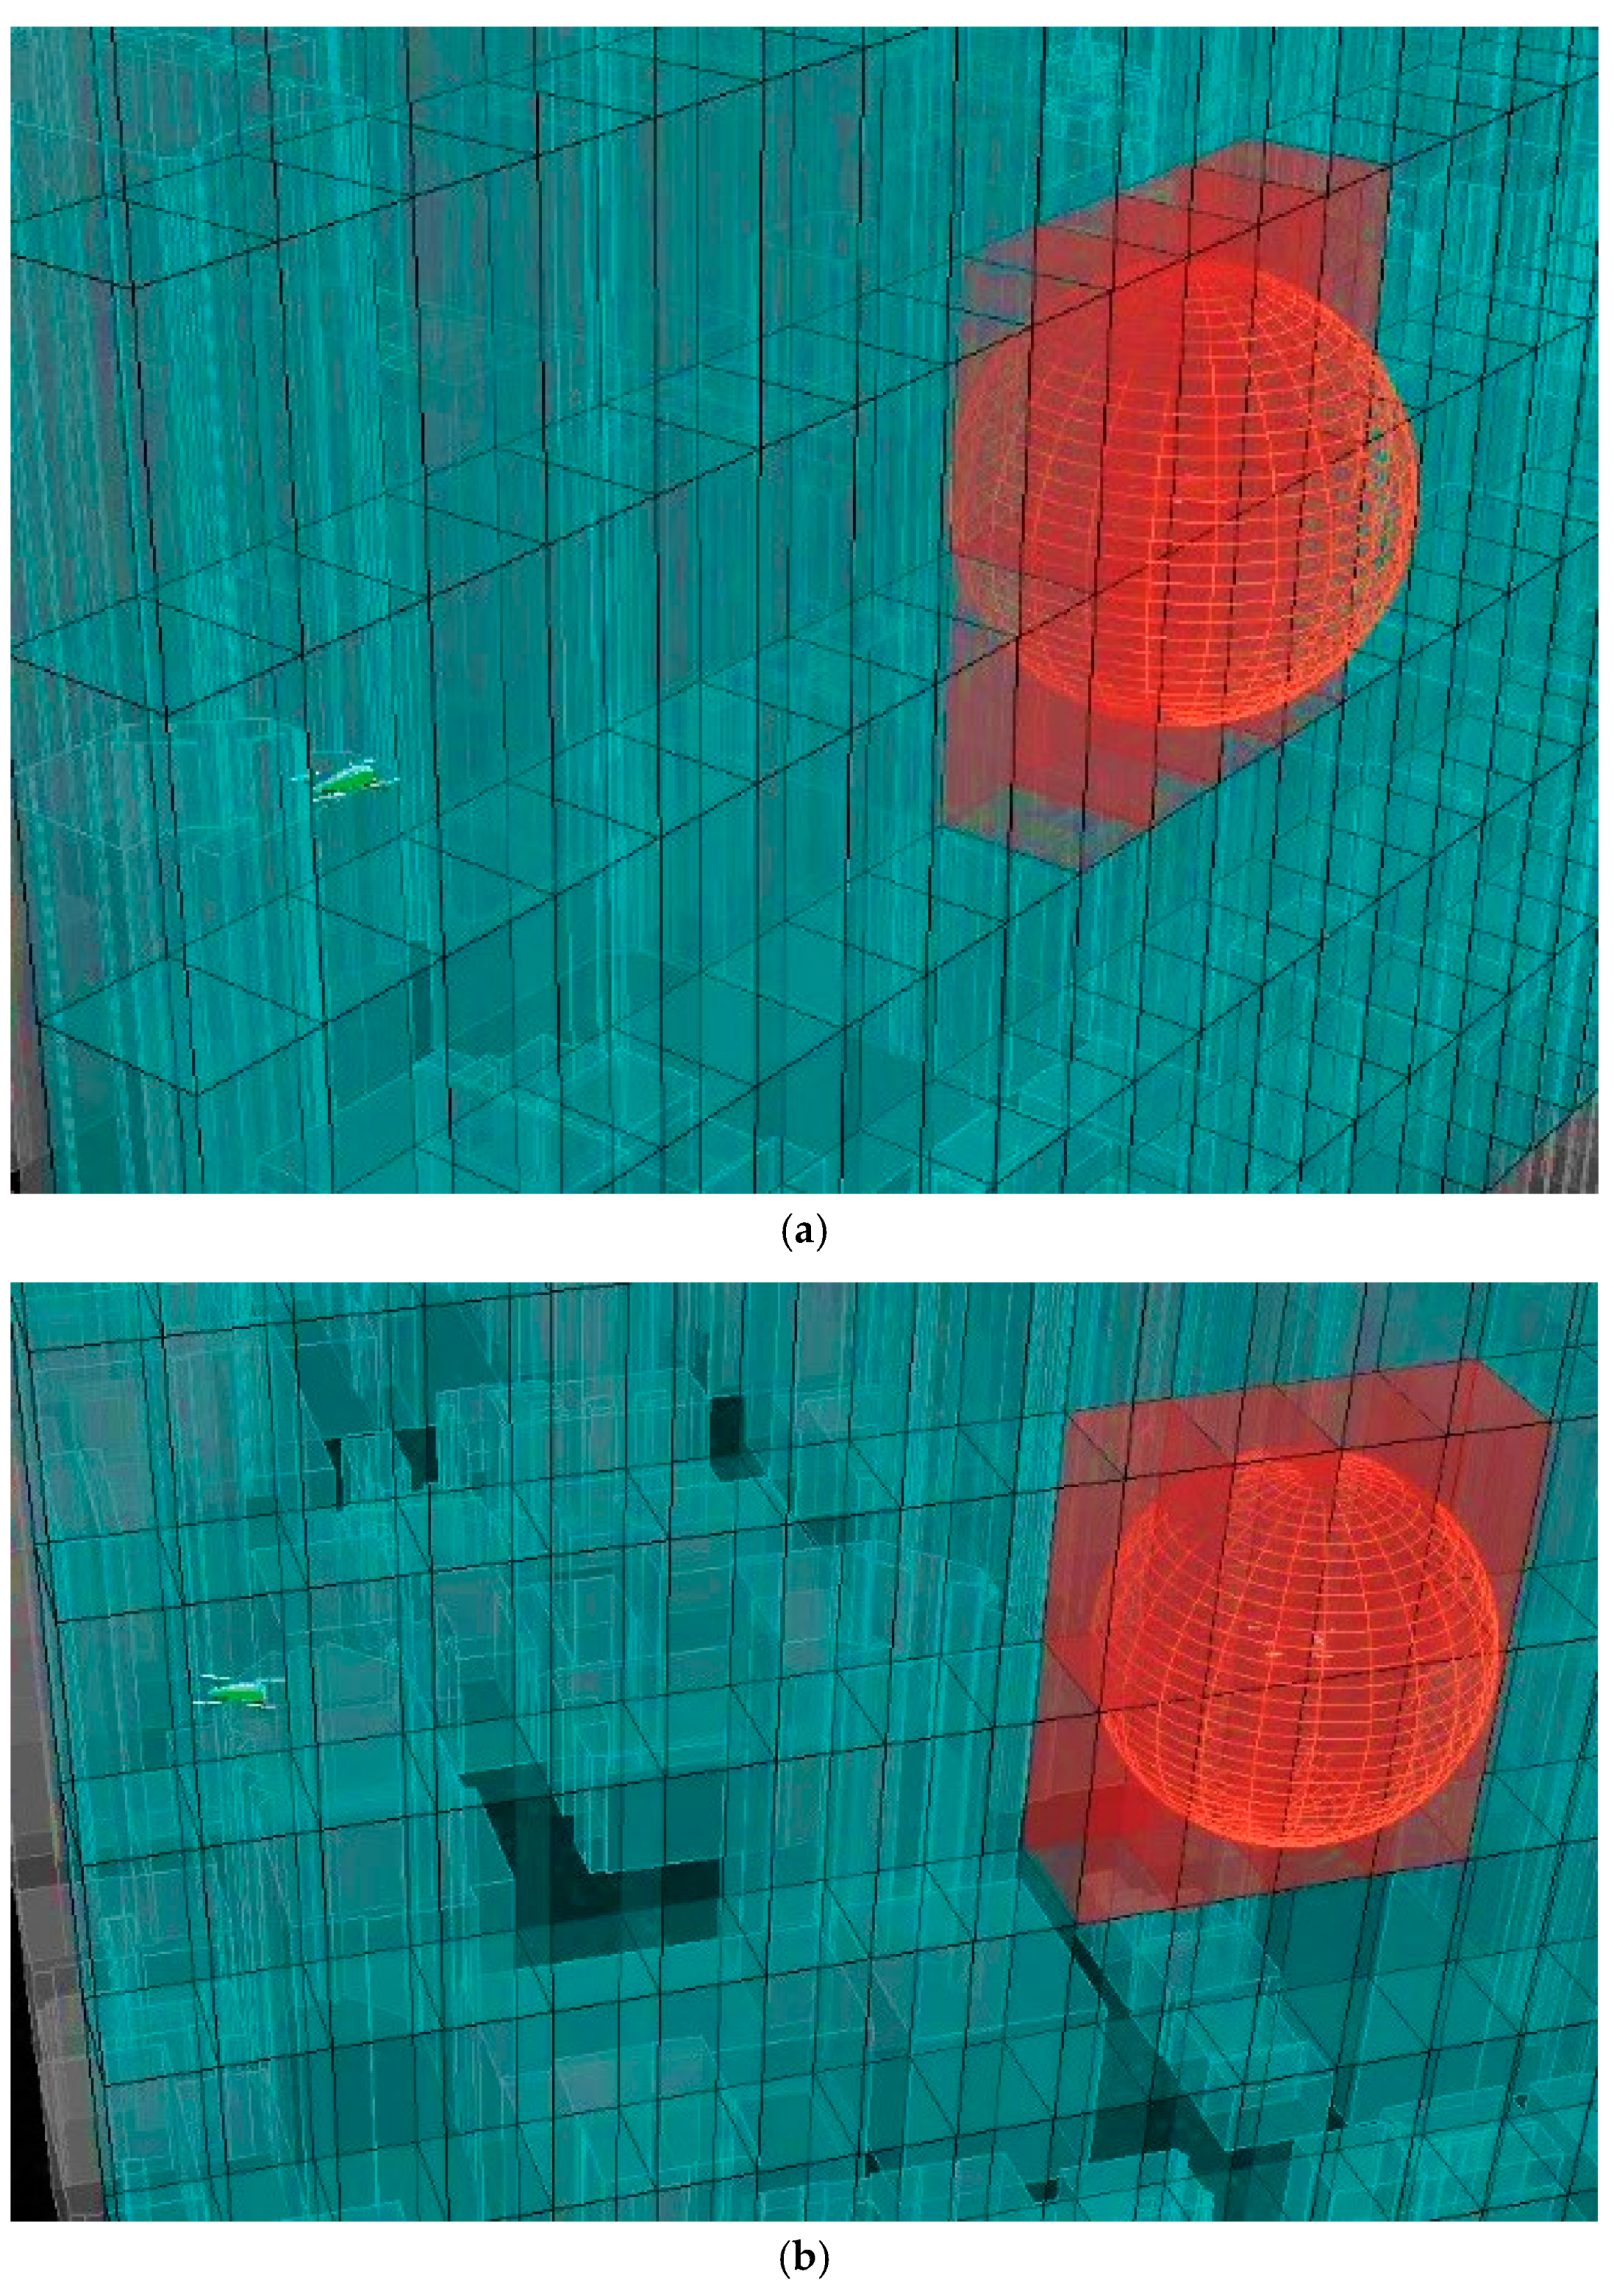
Airspace sectors are then generated as clusters of elementary cells to support efficient management of traffic across the urban region. These sectors need to consist of an optimal number of elementary cells to balance the traffic complexity and the communication overhead due to sector handovers. All the elements of this performance-based airspace model i.e., elementary cells, CNS protection volume, occupancy grid and airspace sectors are visualised in
Figure 3. The following sections introduce the underpinning theoretical framework and mathematical models for all these entities. However, the CNS protection volumes will be addressed up front as they form the theoretical basis upon which the overall framework and the elementary cells were defined.
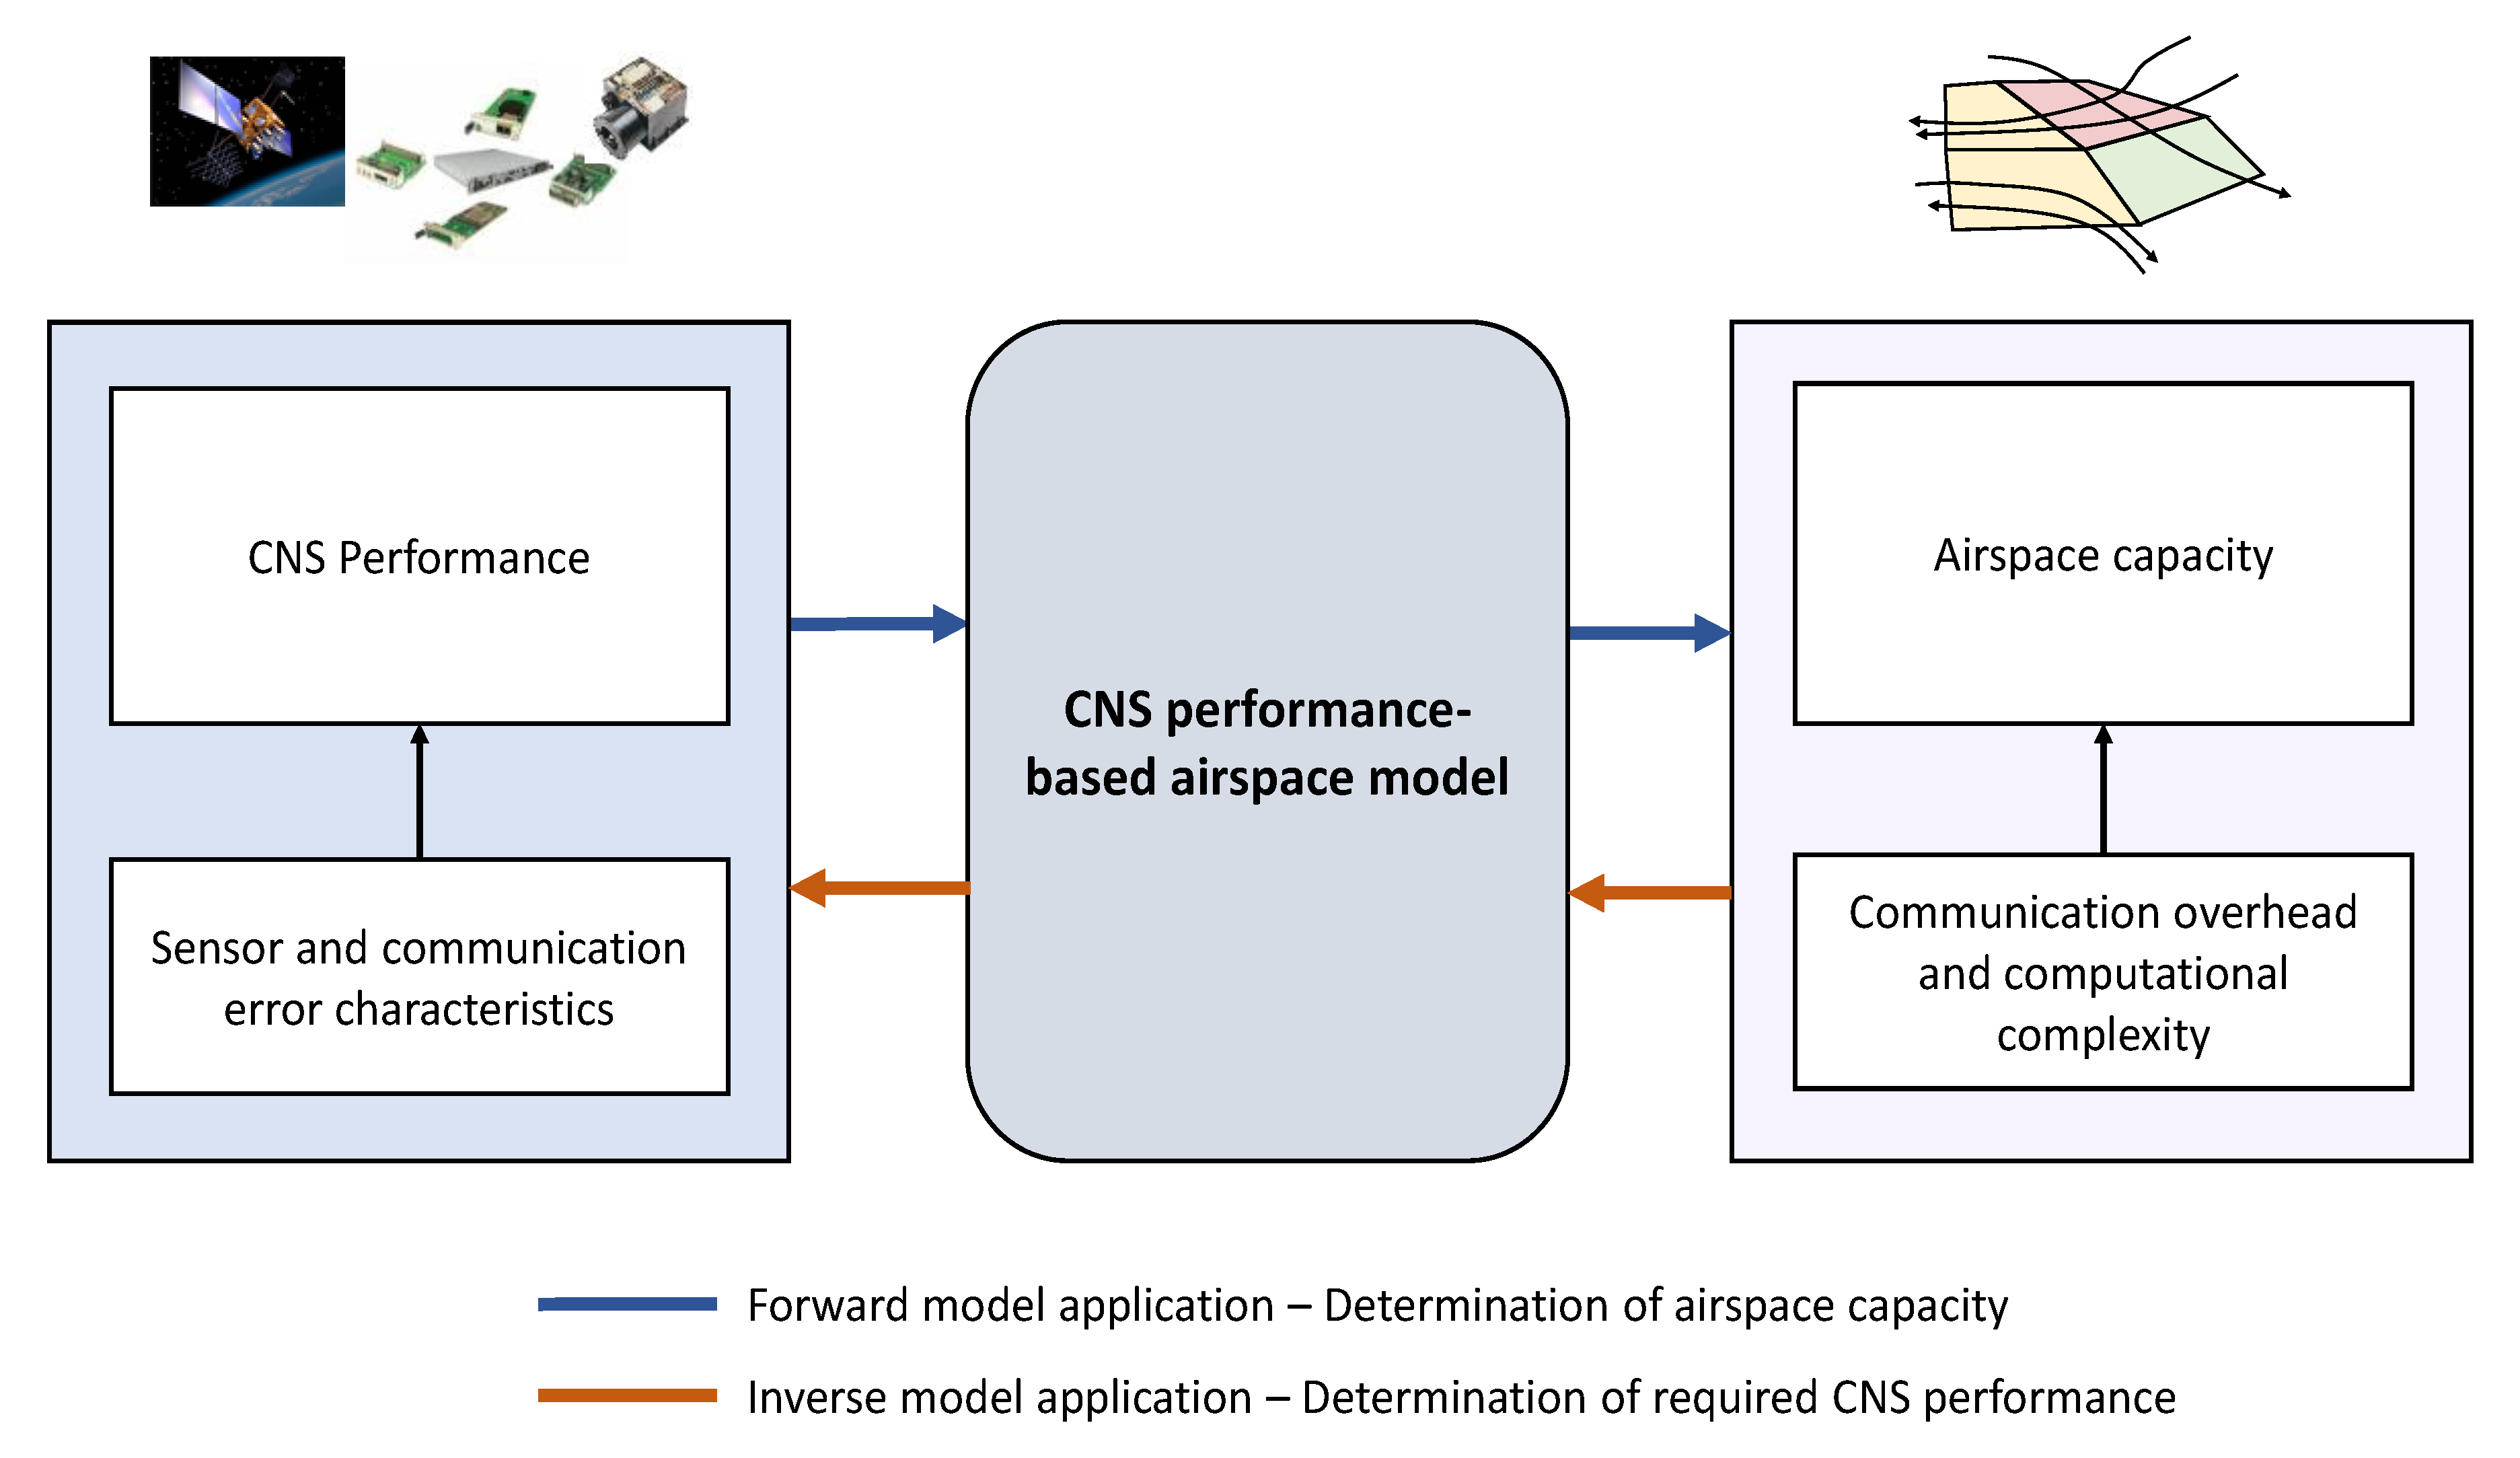
This airspace model provides the flexibility for implementation in the planning stage of three different operational timeframes: offline, pre-tactical online and tactical online. The proposed airspace model can be applied to achieve different goals. In particular, the airspace capacity can be determined based on the performance of the CNS systems supporting the operations or, alternatively, the model can be applied to evaluate the CNS performance requirements to be enforced given a desired airspace capacity target. This two-way approach is conceptually illustrated in
Figure 4.
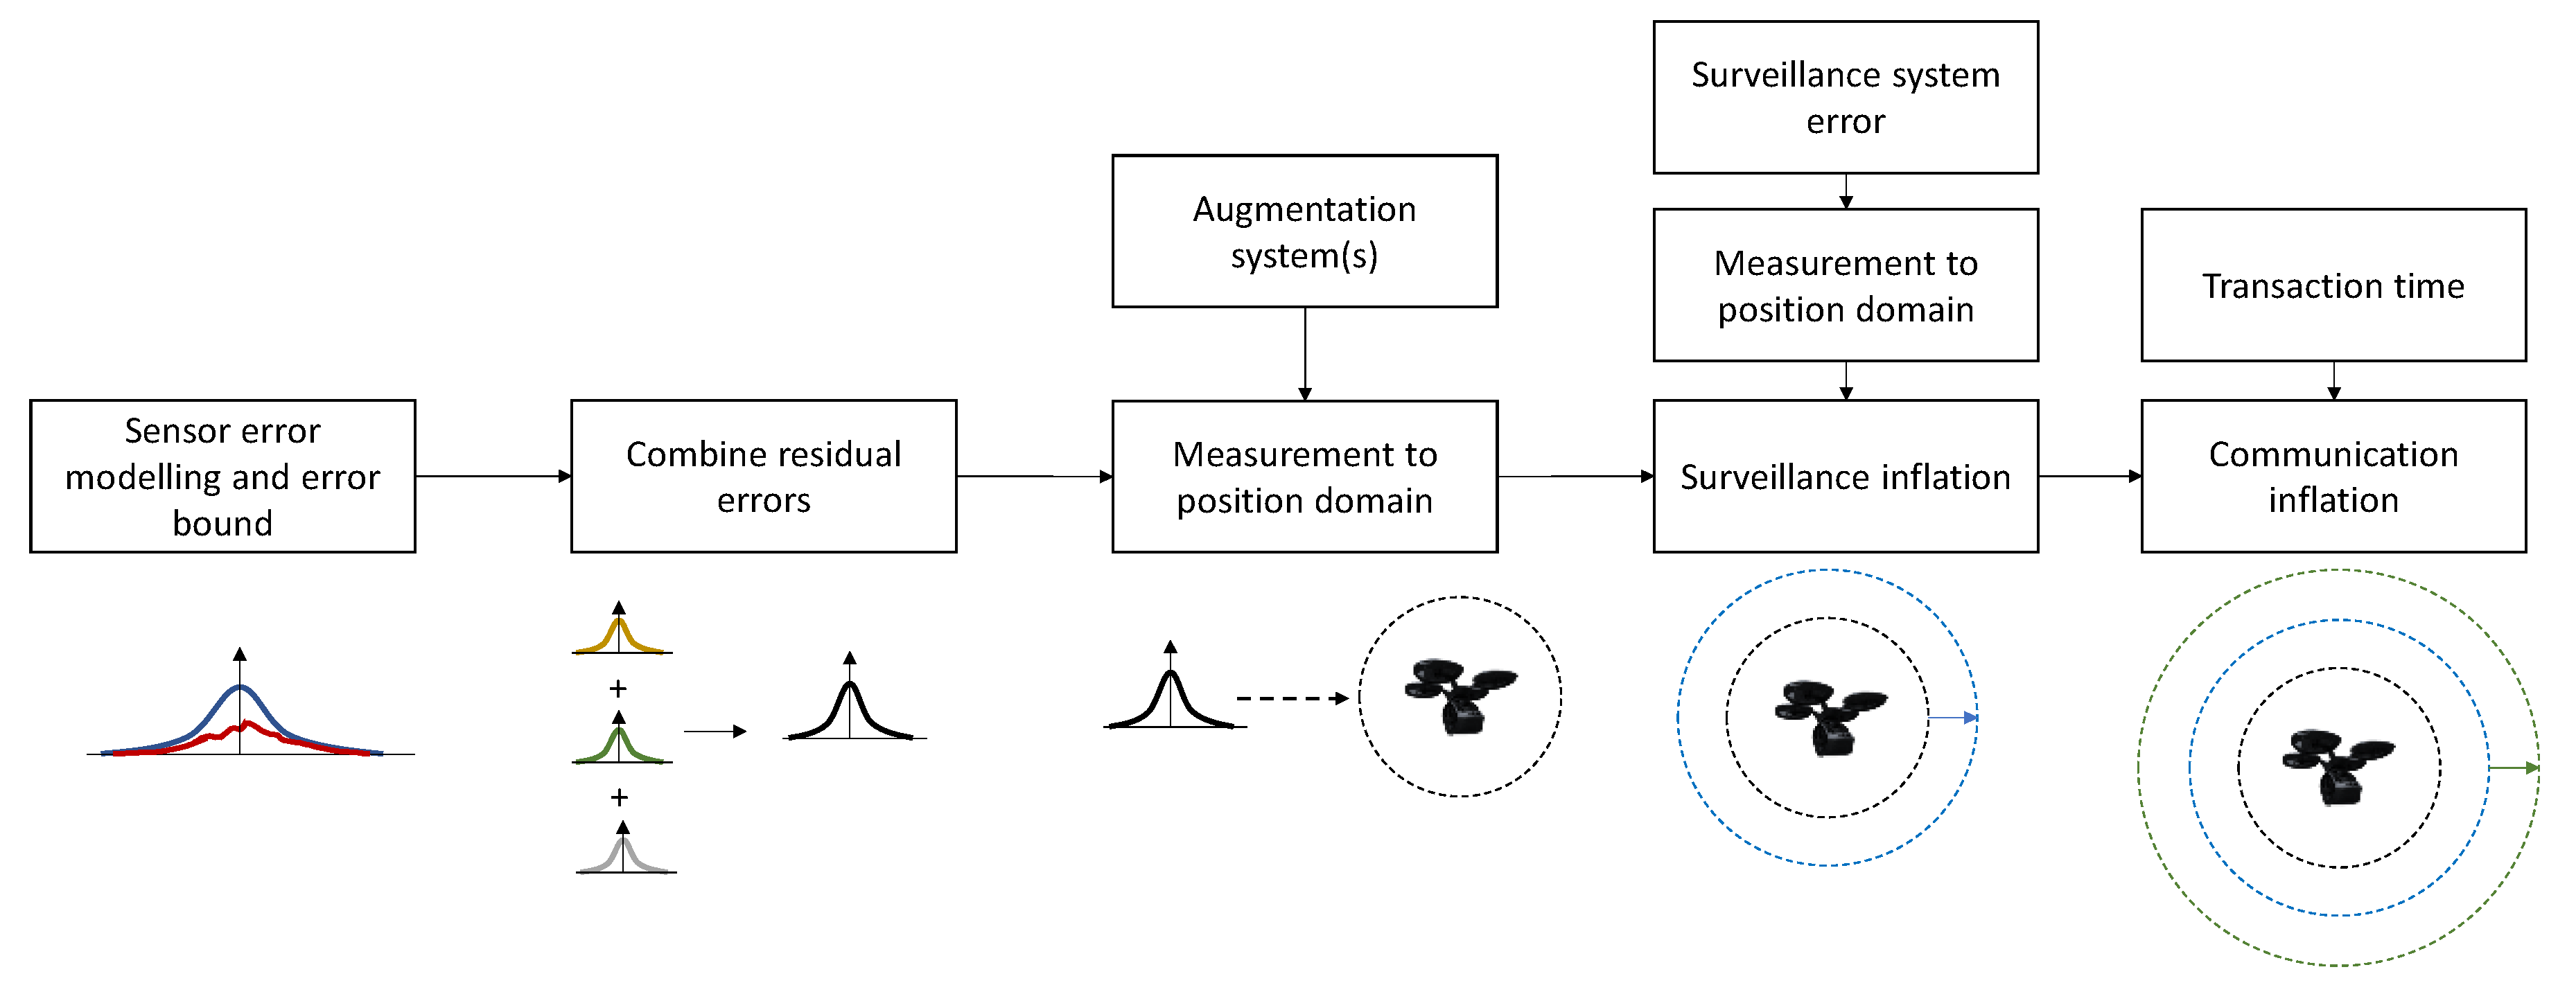
3.1. CNS Risk Protection Volume Generation
This sub-section covers the generation of the CNS risk protection volume. The methodology as illustrated in
Figure 5 is adopted from the approach introduced in [
36], which is used for solving the autonomous Detect-and-Avoid (DAA) problem.
The navigation component of the volume is generated by developing a sensor measurement model that accounts for both nominal and off-nominal performance of the sensors utilized by the UAS. These typically include a GNSS receiver, inertial sensors, visual sensors and altimeter.
The distributions characterizing these errors from these sensors can be, in theory, completely arbitrary. However, the long-standing practise for certifying systems in aviation has been to replace the true arbitrary distributions with a simpler distribution. This simpler distribution, called the overbounding distribution, must be such that it overestimates the true error by a small margin (Since this is preferable to underestimation of the true error, which would constitute hazardously misleading information).
Navigation systems in aviation have conventionally been modelled as Gaussian distributions. The use of Gaussian distributions has been the basis for the design of all algorithms in safety-of-life GNSS-based systems, including SBAS and GBAS. In GNSS for instance, the characterization of positioning errors as Gaussians are well documented in current standards [
37].
Replacing the expected distribution by the overbounding Gaussian distribution is necessary for at least two reasons. First, an arbitrary distribution would require an amount of data too large to be sent through typically low bandwidth channels between different participants in the encounter whereas a Gaussian is described by only two parameters (a mean value and standard deviation). Second, combining different error sources is accomplished through convolution of distributions. Computing the convolution of many error sources characterized by arbitrary distributions is likely to be prohibitive. However, Gaussian convolutions are simple to perform. The residual error from each error source is combined and the resulting Gaussian distribution is a conservative error budget of the sensor measurements. The conservative sensor errors are then translated from the sensor measurement domain to the aircraft position domain and the Gaussian sphere bounding this position error distribution is the navigation protection volume.A similar process is adopted for the surveillance sensor(s) involved in the scenario. Worst-case sensor measurement error overbounds are translated to the position domain and constitute the surveillance layer of the risk protection volume.
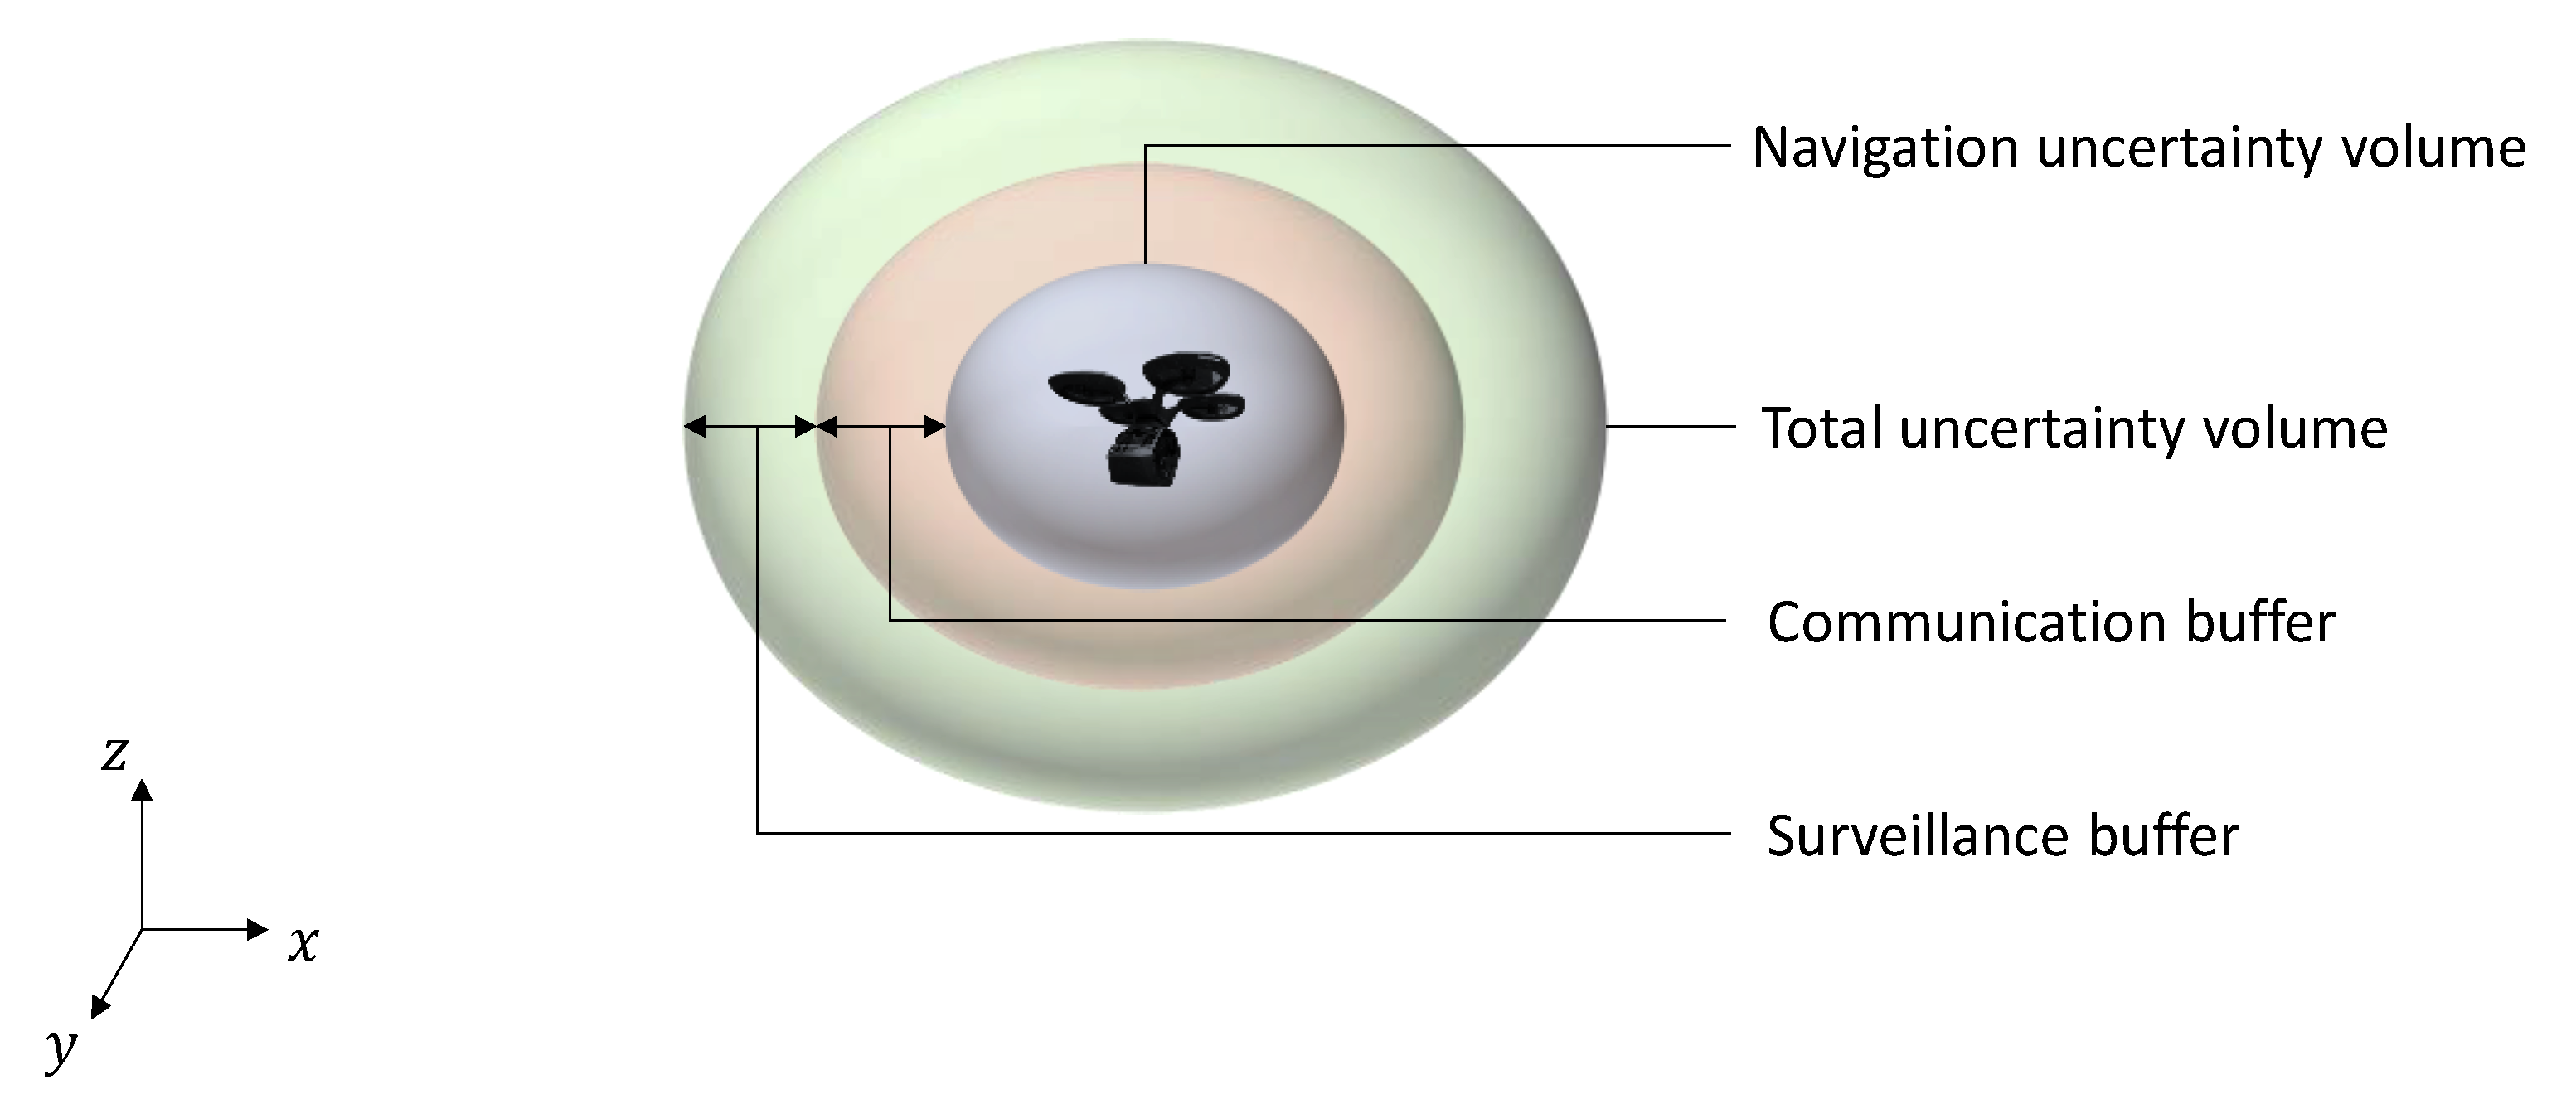
The communication layer is essentially a buffer which accounts for the transaction time taken to conduct a manoeuvre to maintain separation or avoid a collision. As detailed in
Figure 5, this transaction time depends on a combination of human and technical factors. The overall risk protection volume is illustrated in
Figure 6.
In addition to CNS performance, the volume can also be inflated to account for operational and environmental factors such as relative aircraft dynamics and wake turbulence [
36].
3.1.1. Navigation Uncertainty
GNSS range measurement accuracy is well described by aviation standards [
38], with Gaussian overbound distributions accounting for various sources of measurement error. These include:
Satellite Clock and Ephemeris Errors ()
Ionospheric Residual Error ()
Tropospheric Residual Error ()
Thermal noise and interferences ()
Multipath ()
The User Equivalent Range Error (UERE)
is the root sum square of these independent error sources:
In addition to the errors in range measurement, accuracy is also dependent on the geometry of the satellites relative to the receiver. The effect of geometry on the accuracy of the solution is parameterized through a number of scalar factors termed the Dilution of Precision (DOP). The Position Dilution of Precision (PDOP) is the most commonly used factor and is presented in greater detail in [
39]. The navigation position error is expressed in Equation (3), showing the relation of
and PDOP. The maximum errors are chosen to capture the worst performance, representing the conservative case. The covariance matrix of the navigation position uncertainty is presented in Equation (4).
In general, the components of
are well described by long-standing models in the literature that conservatively bound the error [
39]. The only exception is the multipath error component
, which is a site-dependent source of error that is difficult to model. However, recent work in the domain is focussing on developing conservative multipath models for UAM given a terrain map and satellite ephemerides [
40]. Threshold values on the positioning uncertainty are standardized in conventional aviation operations through so-called ‘Alert Limits’ [
41]. These specify the maximum allowable positioning uncertainty. Since no standards are currently defined for UAM navigation systems, this value is conservatively bounded based on urban canyon width dimensions (since this represents the most stringent performance requirements for UAM use-cases). Therefore, the navigation performance is declared insufficient for
, where
is the smallest canyon width being traversed for a given planned operation (e.g., this corresponds to
= 25 m for most Australian city centres).
3.1.2. Surveillance Inflations
As anticipated in
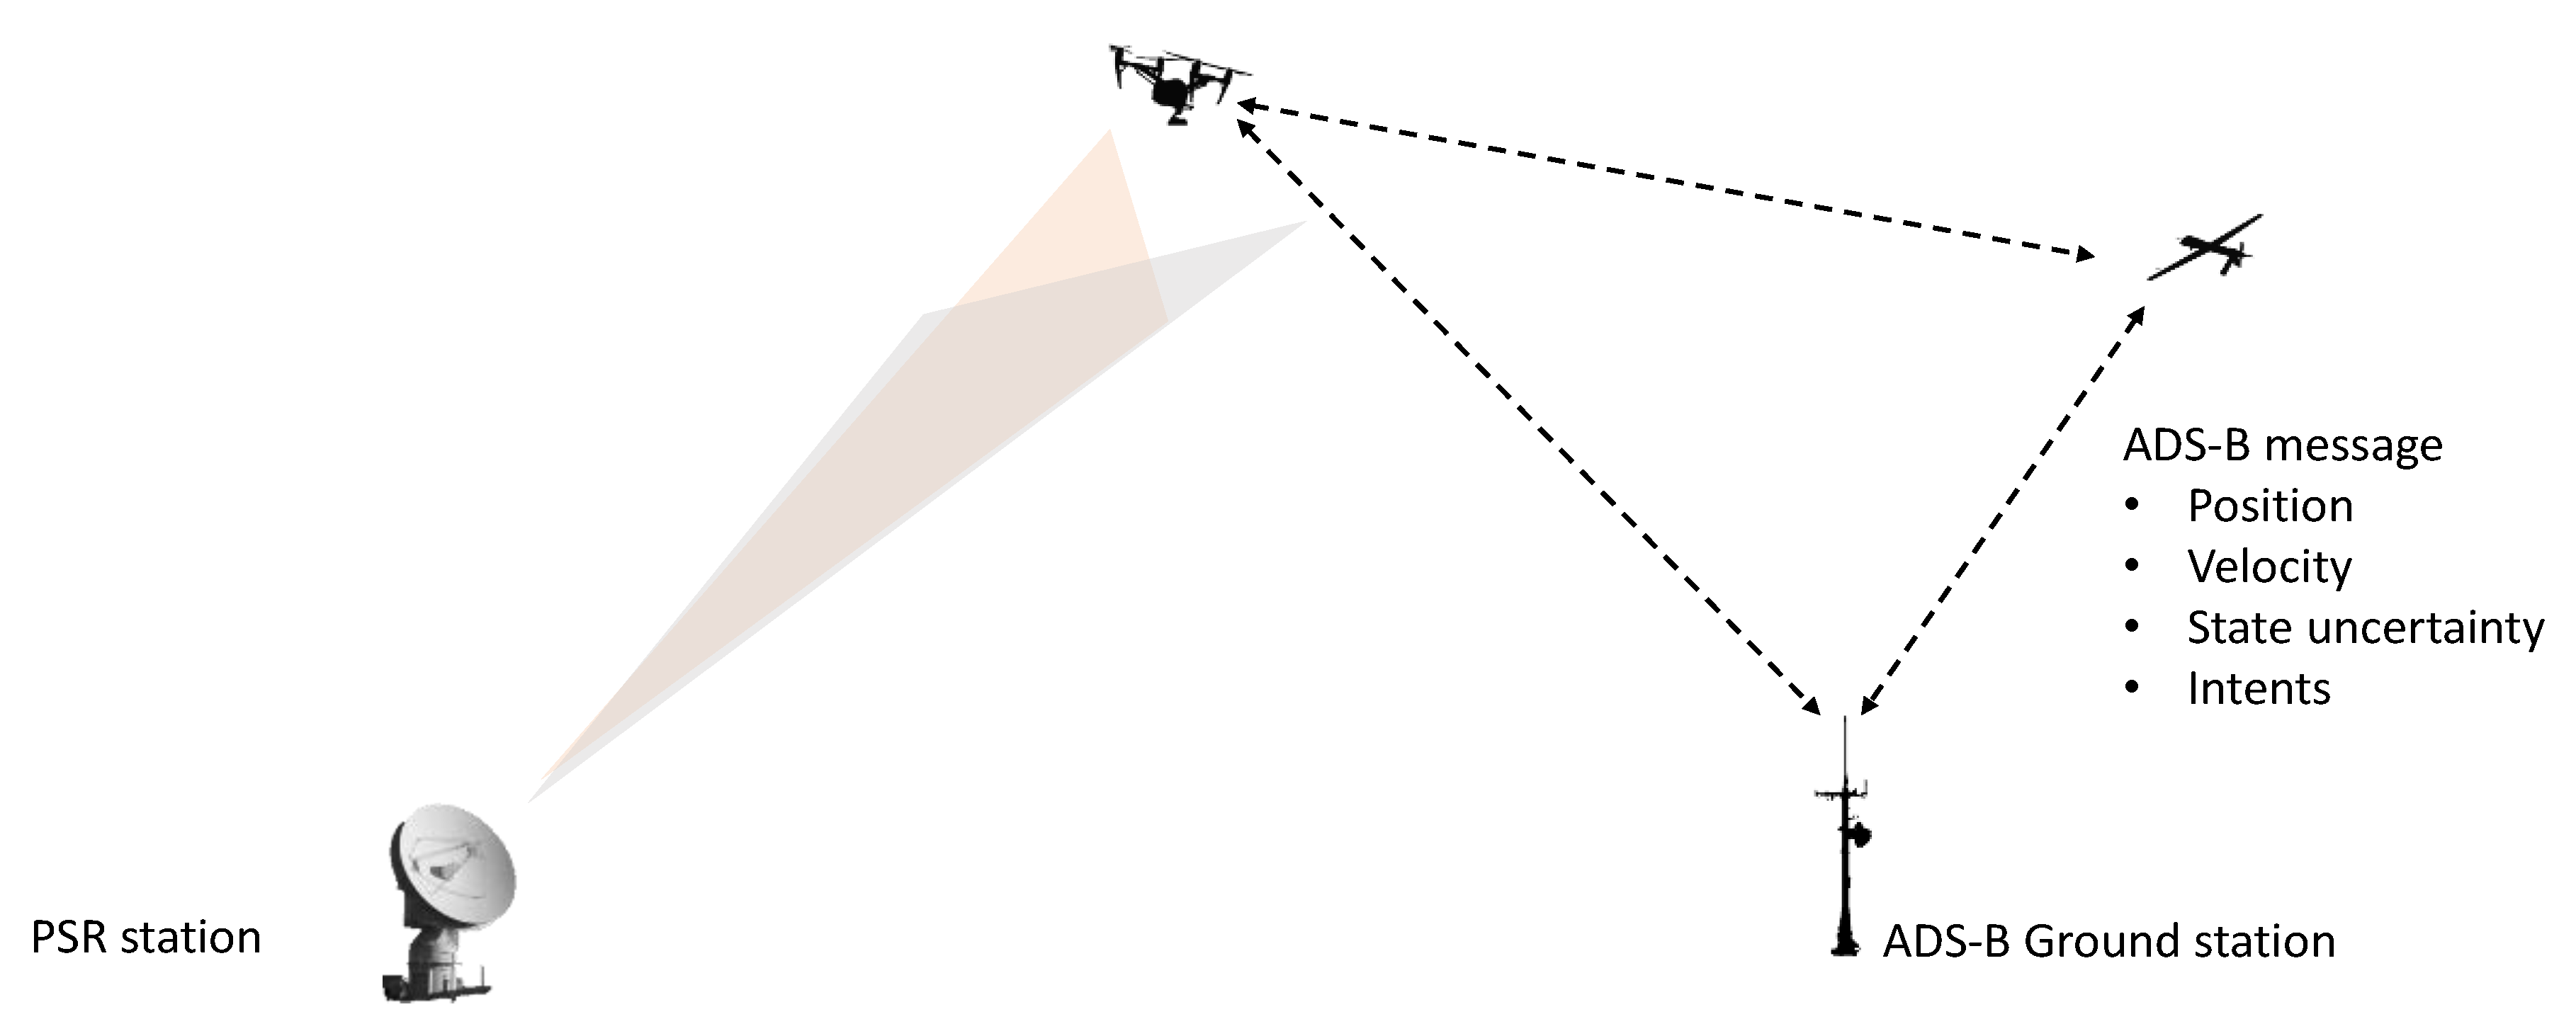
Table 2, the uncertainty in the position of a detected intruder aircraft is dependent on two factors. First, the error in localizing the aircraft, and second, the latency between such detection and the position estimate in a downstream separation assurance system. A conventional surveillance scenario is illustrated in
Figure 7. When Primary Surveillance Radar (PSR) is utilized, the estimated range, azimuth and elevation to the intruder aircraft is used to compute its position in a cartesian reference frame. Assuming the reference geometry depicted in
Figure 7, target state vector information is measured relative to the radar site in a spherical coordinate system in range, elevation and azimuth (
respectively). The measurements in each of the elements are prone to an SNR dependent random range measurement error, which can be calculated as:
where
is waveform bandwidth,
is the speed of light and signal to noise ratio
. Radar angular measurements are commonly made using monopulse receive antennas that provide a difference pattern characterized by a deep null on boresight. The difference pattern formed by these beams may be used to measure the target angular position with a single signal transmission. The measurement accuracy in each angular coordinate is characterized by the RMS of the SNR dependent random angular measurement error, angular bias, and random measurement error. As with the range error, we assume angular error to be normally distributed:
As with the range errors, the SNR dependent error dominates the radar angle error:
where:
is the radar beamwidth in the angular coordinates and
is the monopulse pattern difference slope. The tracking covariance is then:
Errors in these measurements propagate to the Cartesian position uncertainty. A more detailed treatment of these errors and the resulting ellipsoid is presented in [
42]. On the other hand, when ADS-B is employed as the primary means of surveillance, the accuracy of localizing the intruder aircraft is closely related to GNSS performance. In addition, the tracking uncertainty ellipsoid must also account for the error due to latency. The total tracking uncertainty
is then:
where
is the uncertainty in GNSS-estimated position, and
is the uncertainty due to communication latency.
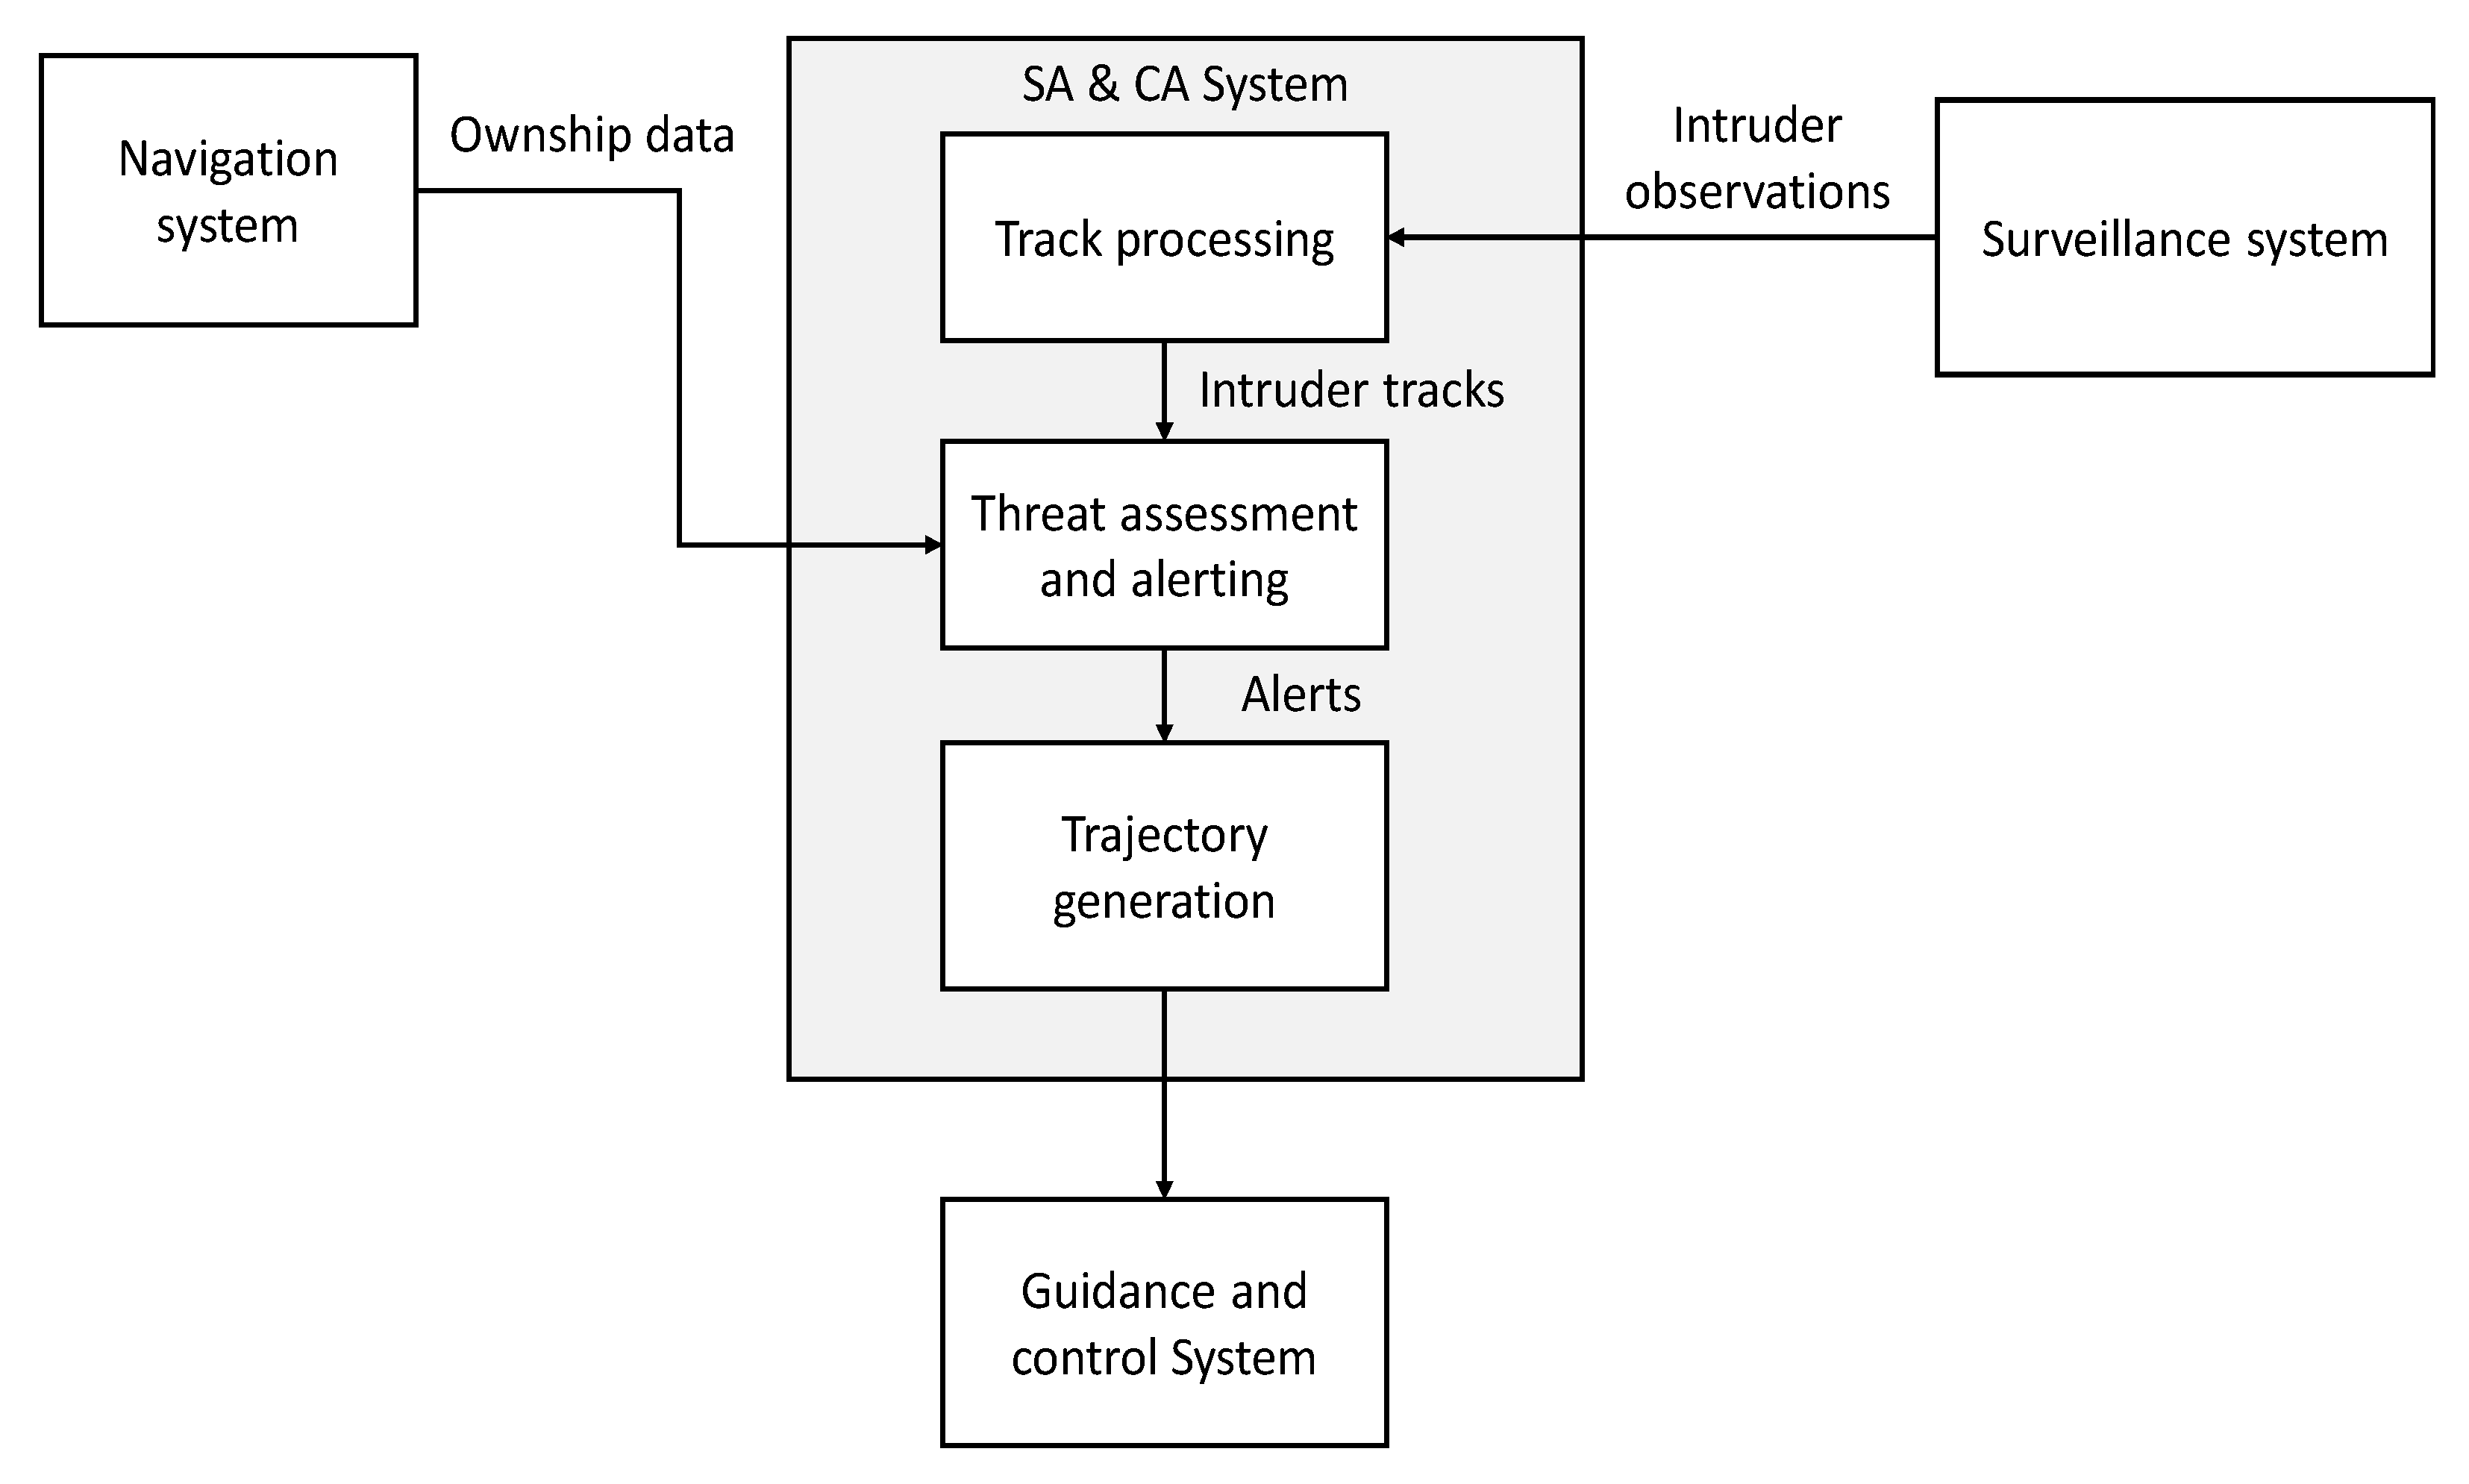
The overall latency of a SA/CA procedure depends not only on the surveillance latency but also on the time required to assess a collision threat and to generate and execute a resolution. In conventional operations, these tasks would have been performed by the pilot and ATC operator. In the UTM context, however, the bulk of these tasks are assumed to be performed autonomously, with manual intervention required only in emergency conditions.
The total deconfliction time (
) is the result of the sequential tasks illustrated in
Figure 8, which includes the time taken to process the tracks of intruder aircraft, assess potential collision threats, generate avoidance trajectories and execute them.
3.1.3. Total CNS Protection Volume in a Cooperative ADS-B Encounter
The volume generation process is illustrated here for a scenario in which ADS-B is used to monitor an intruder aircraft. The volume in this instance bounds the GNSS error. This is then inflated to account for the effect of latency. The radius of the protection volume
are then computed as:
where
is the variance in the GNSS solution;
and
are the estimated velocity and deconfliction time;
and
are the standard deviations in the estimated velocity and deconfliction time respectively. The term in the square parentheses [.] is the translation of the ADS-B latency from the temporal to the spatial domain. This term is obtained by applying the law of propagation of uncertainty to compute the distance covered by the vehicle over the duration of the SA/CA interval. This requires the uncertainty in the estimated velocity and in the estimated deconfliction time. This term essentially bounds the distance covered by the vehicle over the duration of the latency.
is an inflation factor specifying the number of standard deviations to expand the volume. This is chosen as
= 3 i.e., a 3
or 99.7% bound. It is a commonly followed practice to employ a recursive state estimator such as the Extended Kalman Filter (EKF) as the GNSS navigation filter, to process GNSS pseudoranges and obtain a position solution. Both
and
are inherent outputs of the GNSS EKF.
can be obtained by fitting an overbounding Gaussian distribution to empirical data of system computational times.
3.2. Performance-Based Elementary Cell Dimensions
The proposed performance-based urban airspace model is intended to enhance not only safety and efficiency but also ease UTM operator’s interpretability by using CNS performance as the main driver in airspace structure design, determining spacing, sector dimensions and capacity altogether, while also supporting an intuitive visualisation. Therefore, as previously indicated, the elementary cell dimensions shall be parameterized as functions of the CNS performance for a given airspace region. The reference UAS equipage is assumed as follows:
Within the scope of this study, the elementary cell dimensions are defined as a function of GNSS performance. GNSS is in fact not only the most widely employed source of absolute positioning for UAS operations but, as recognised by ICAO, GNSS is also the key element of all Communications, Navigation, and Surveillance/ATM (CNS/ATM) systems [
44].
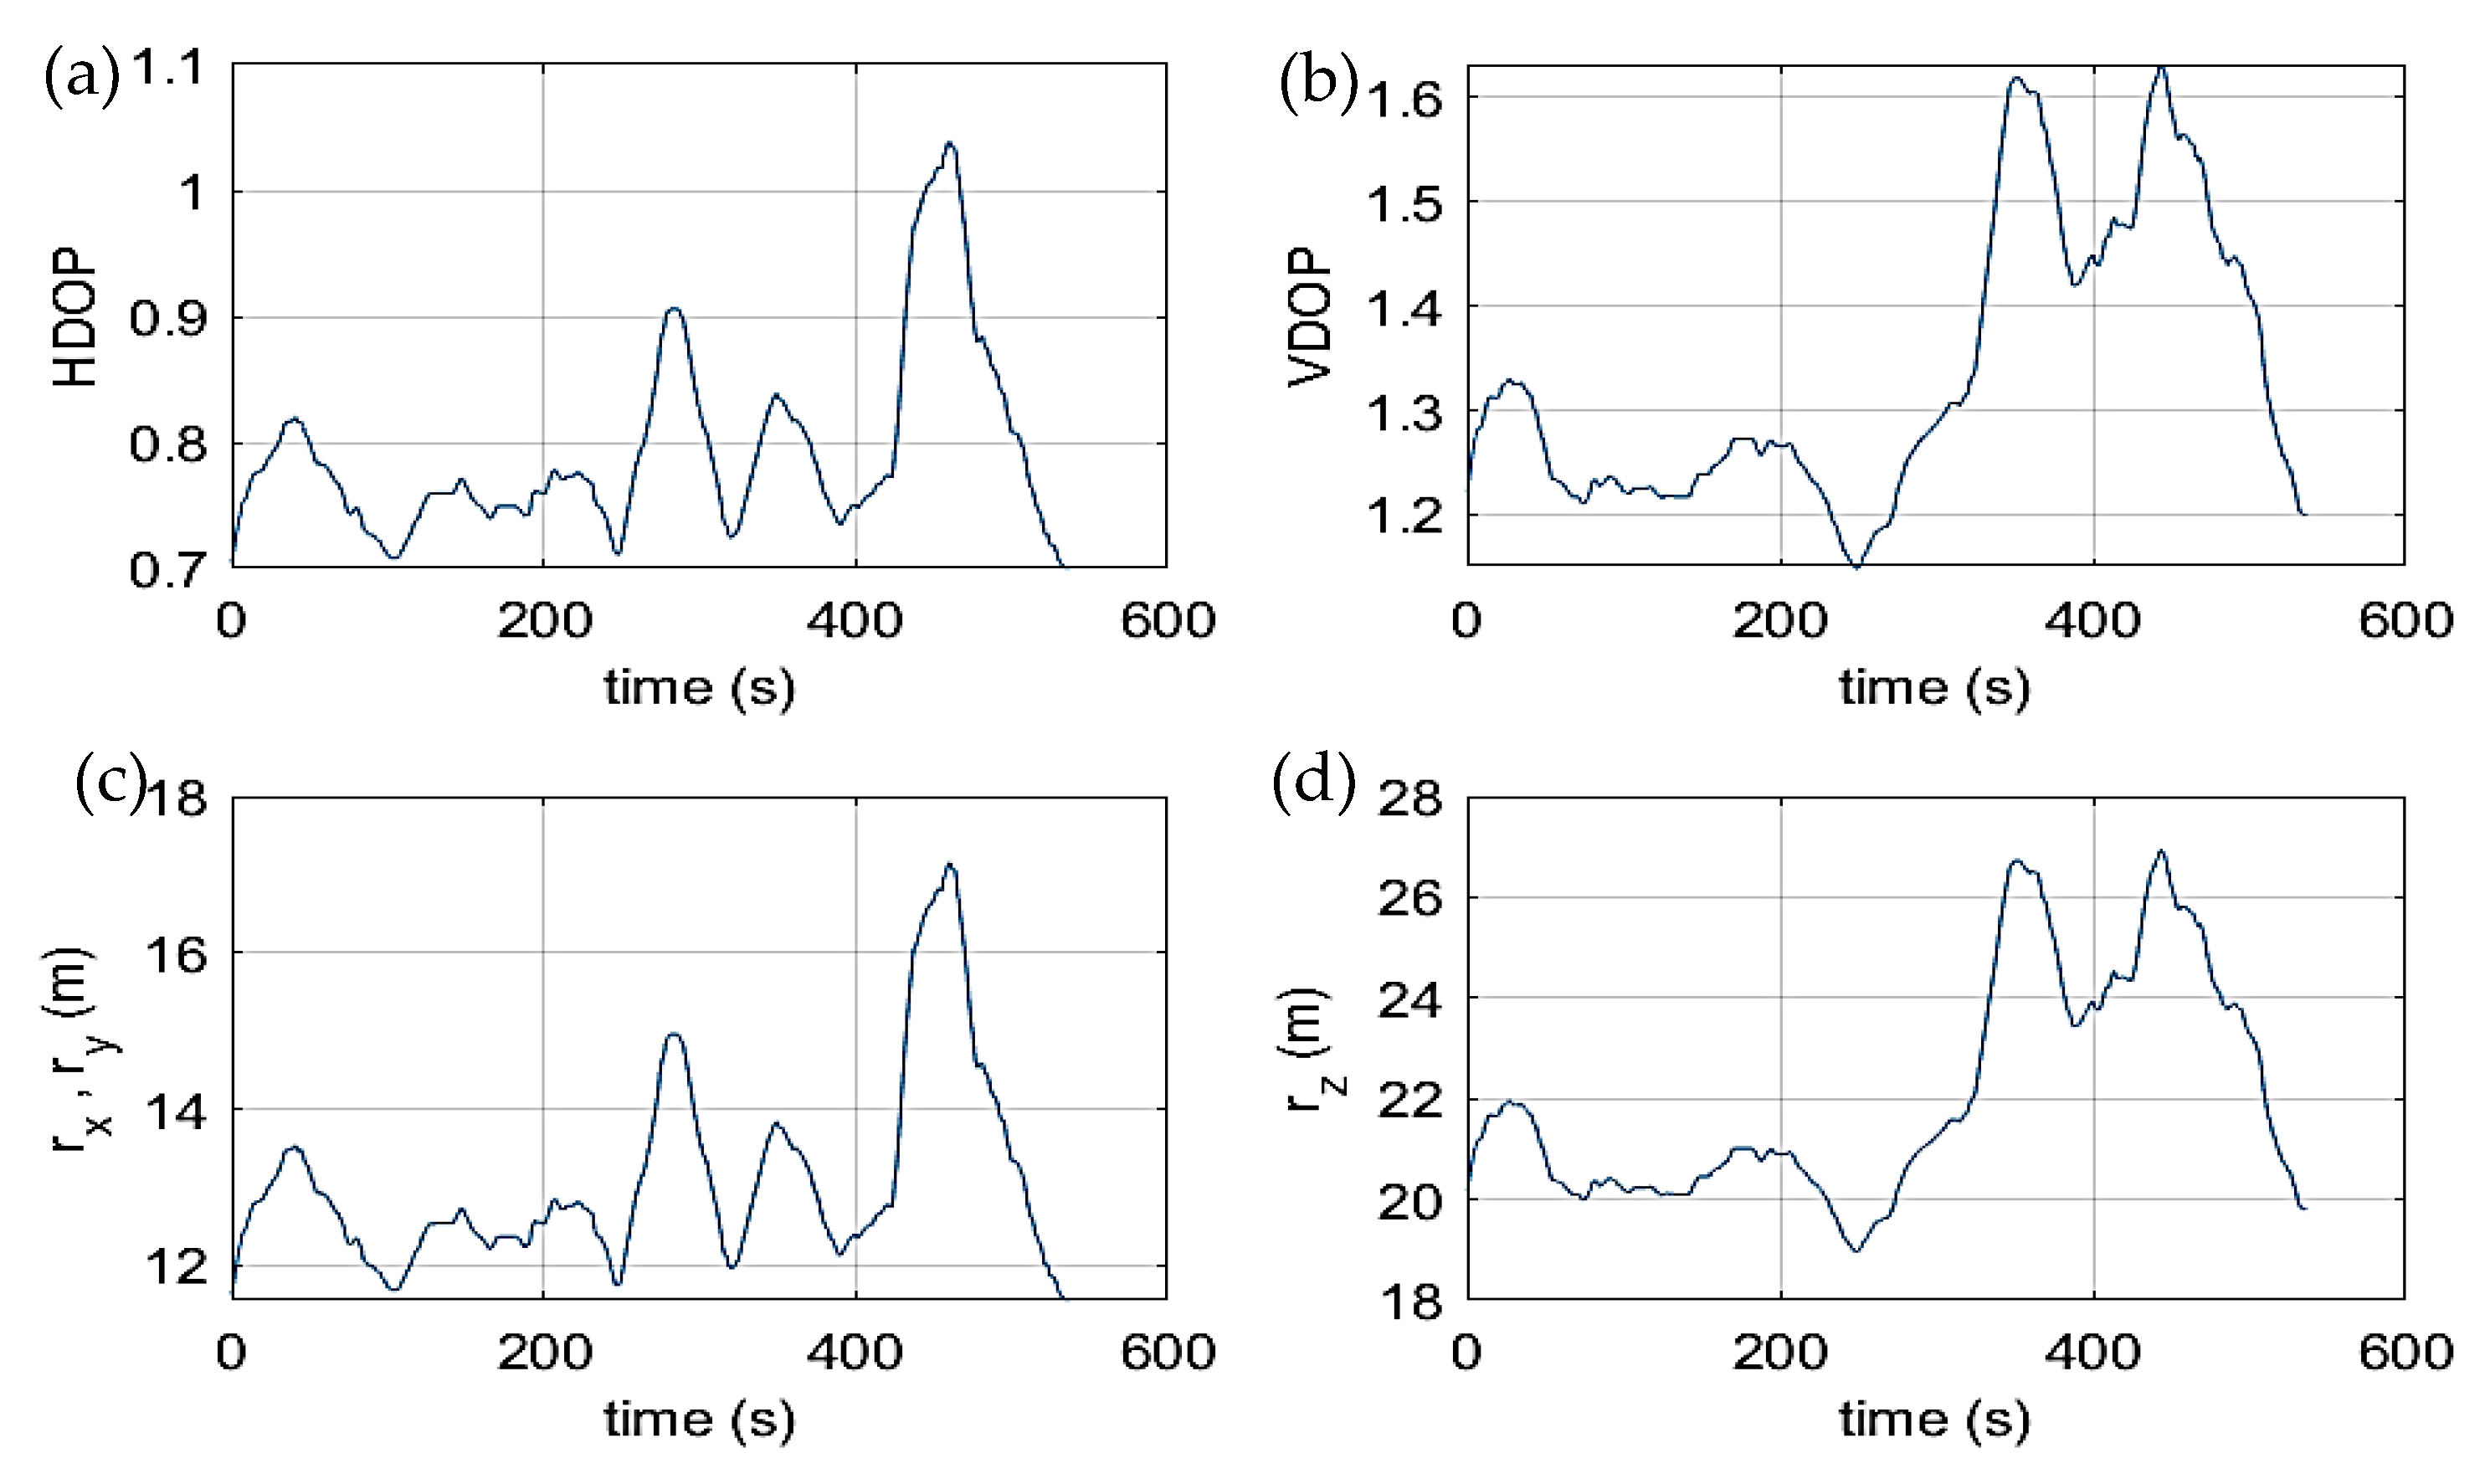
The elementary cell dimension is set as a 3
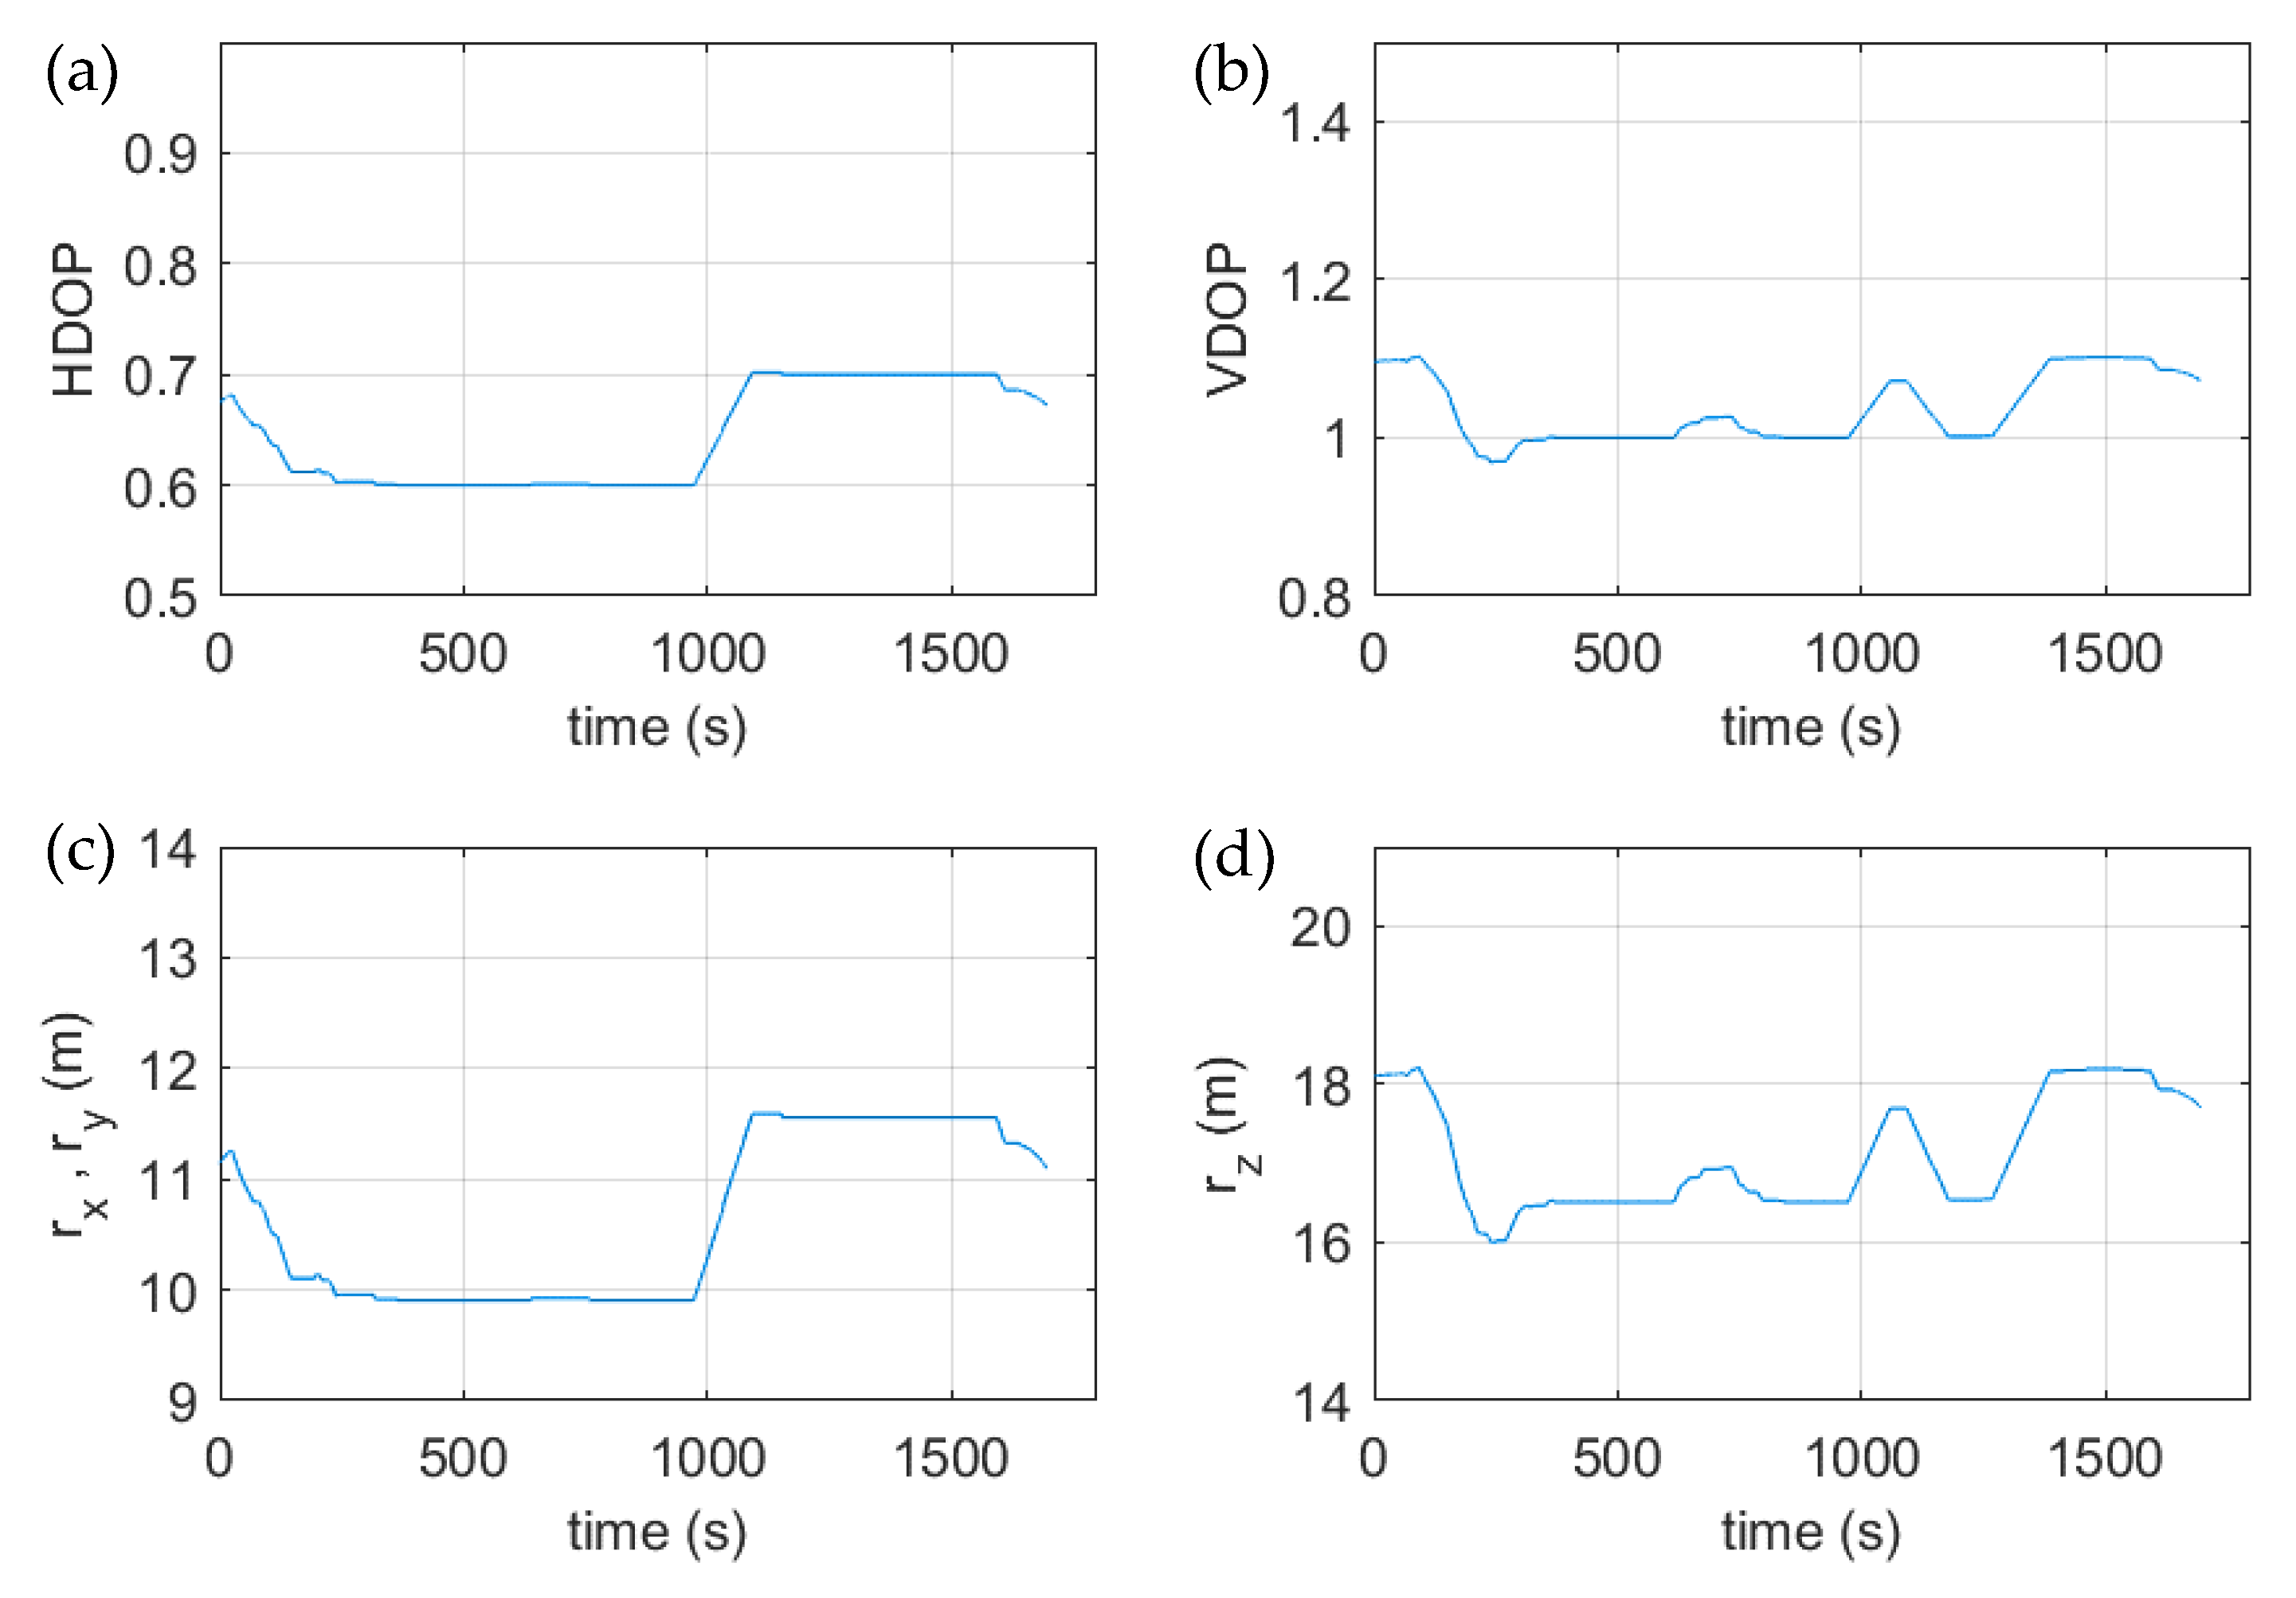
(99.7%) bound on GNSS positioning errors, accounting for errors in pseudorange and unfavourable satellite geometry over the intended operational airspace region. The uncertainty in horizontal and vertical positioning is related to the pseudorange error and DOP as:
where HDOP is the Horizontal Dilution of Precision; VDOP is the Vertical Dilution of Precision;
is the User Equivalent Range Error (m) as described by Equation (2) The elementary cell dimensions are then set as:
In order to calculate the DOP factor, the line-of-sight vector between the receiver and the satellites in the Earth-Centered Earth-Fixed (ECEF) coordinate system needs to be determined. This is readily obtained from the ephemera of the GNSS satellites. The elevation (
) and azimuth (
) of each satellite in the NED coordinate system is then:
where
,
,
are the Down, East, and North components of the line-of-sight unit vector respectively.
The geometric matrix is a concatenation of each of the visible satellite elevations and azimuths:
The Local-navigation-frame Cofactor Matrix is then:
The HDOP and VDOP factors are calculated as:
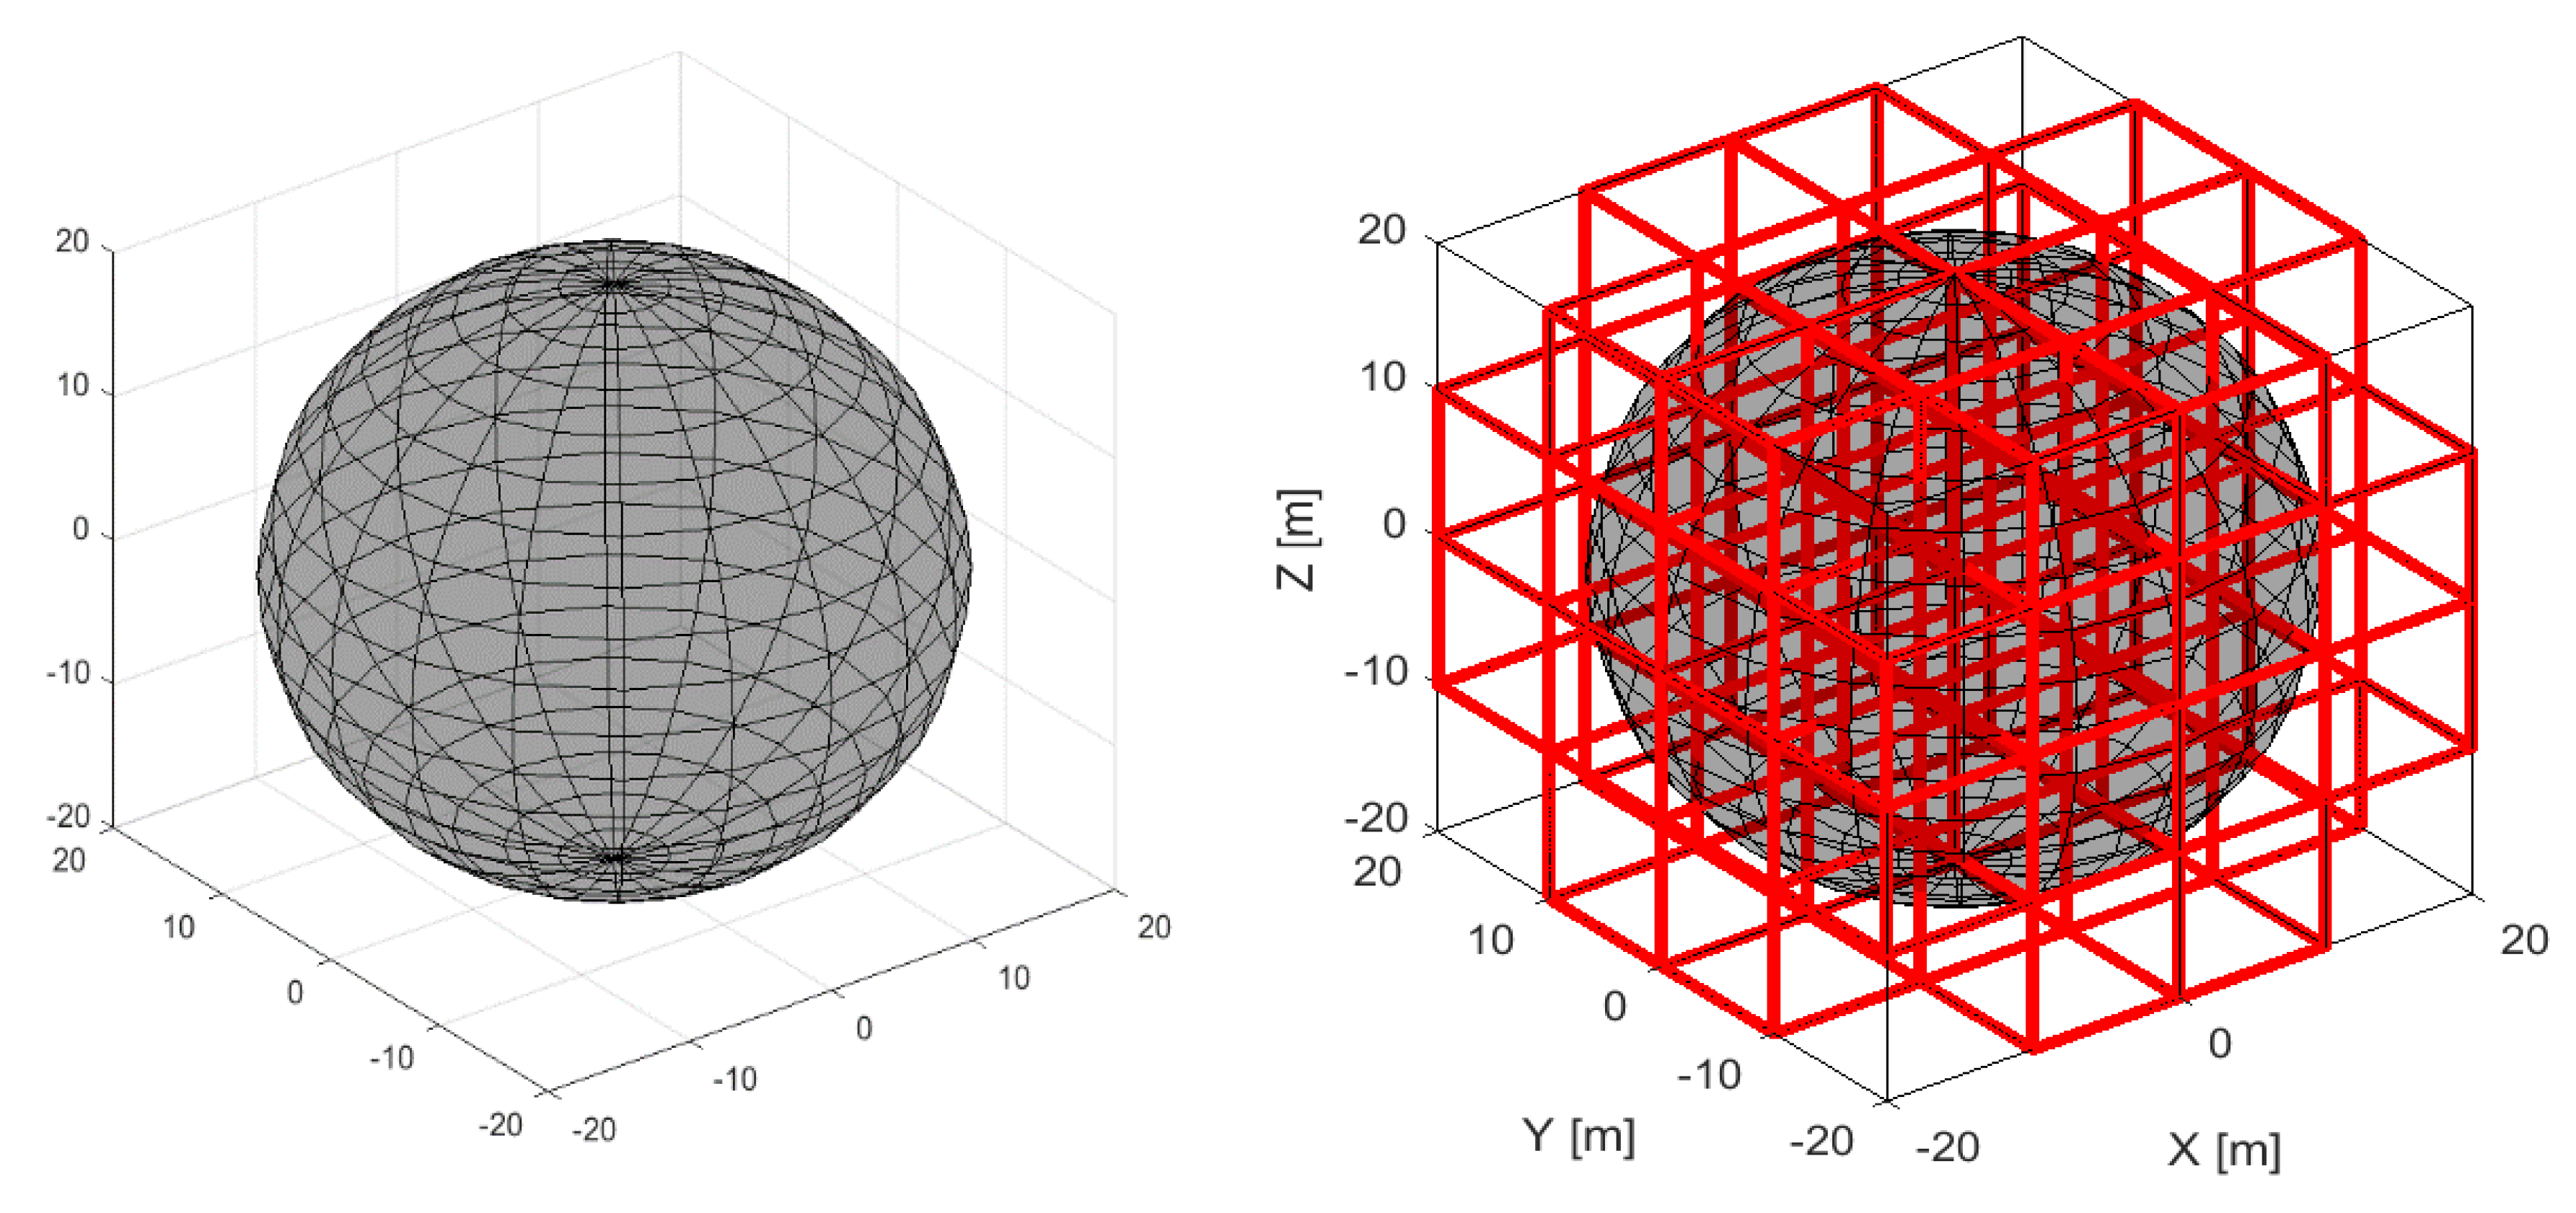
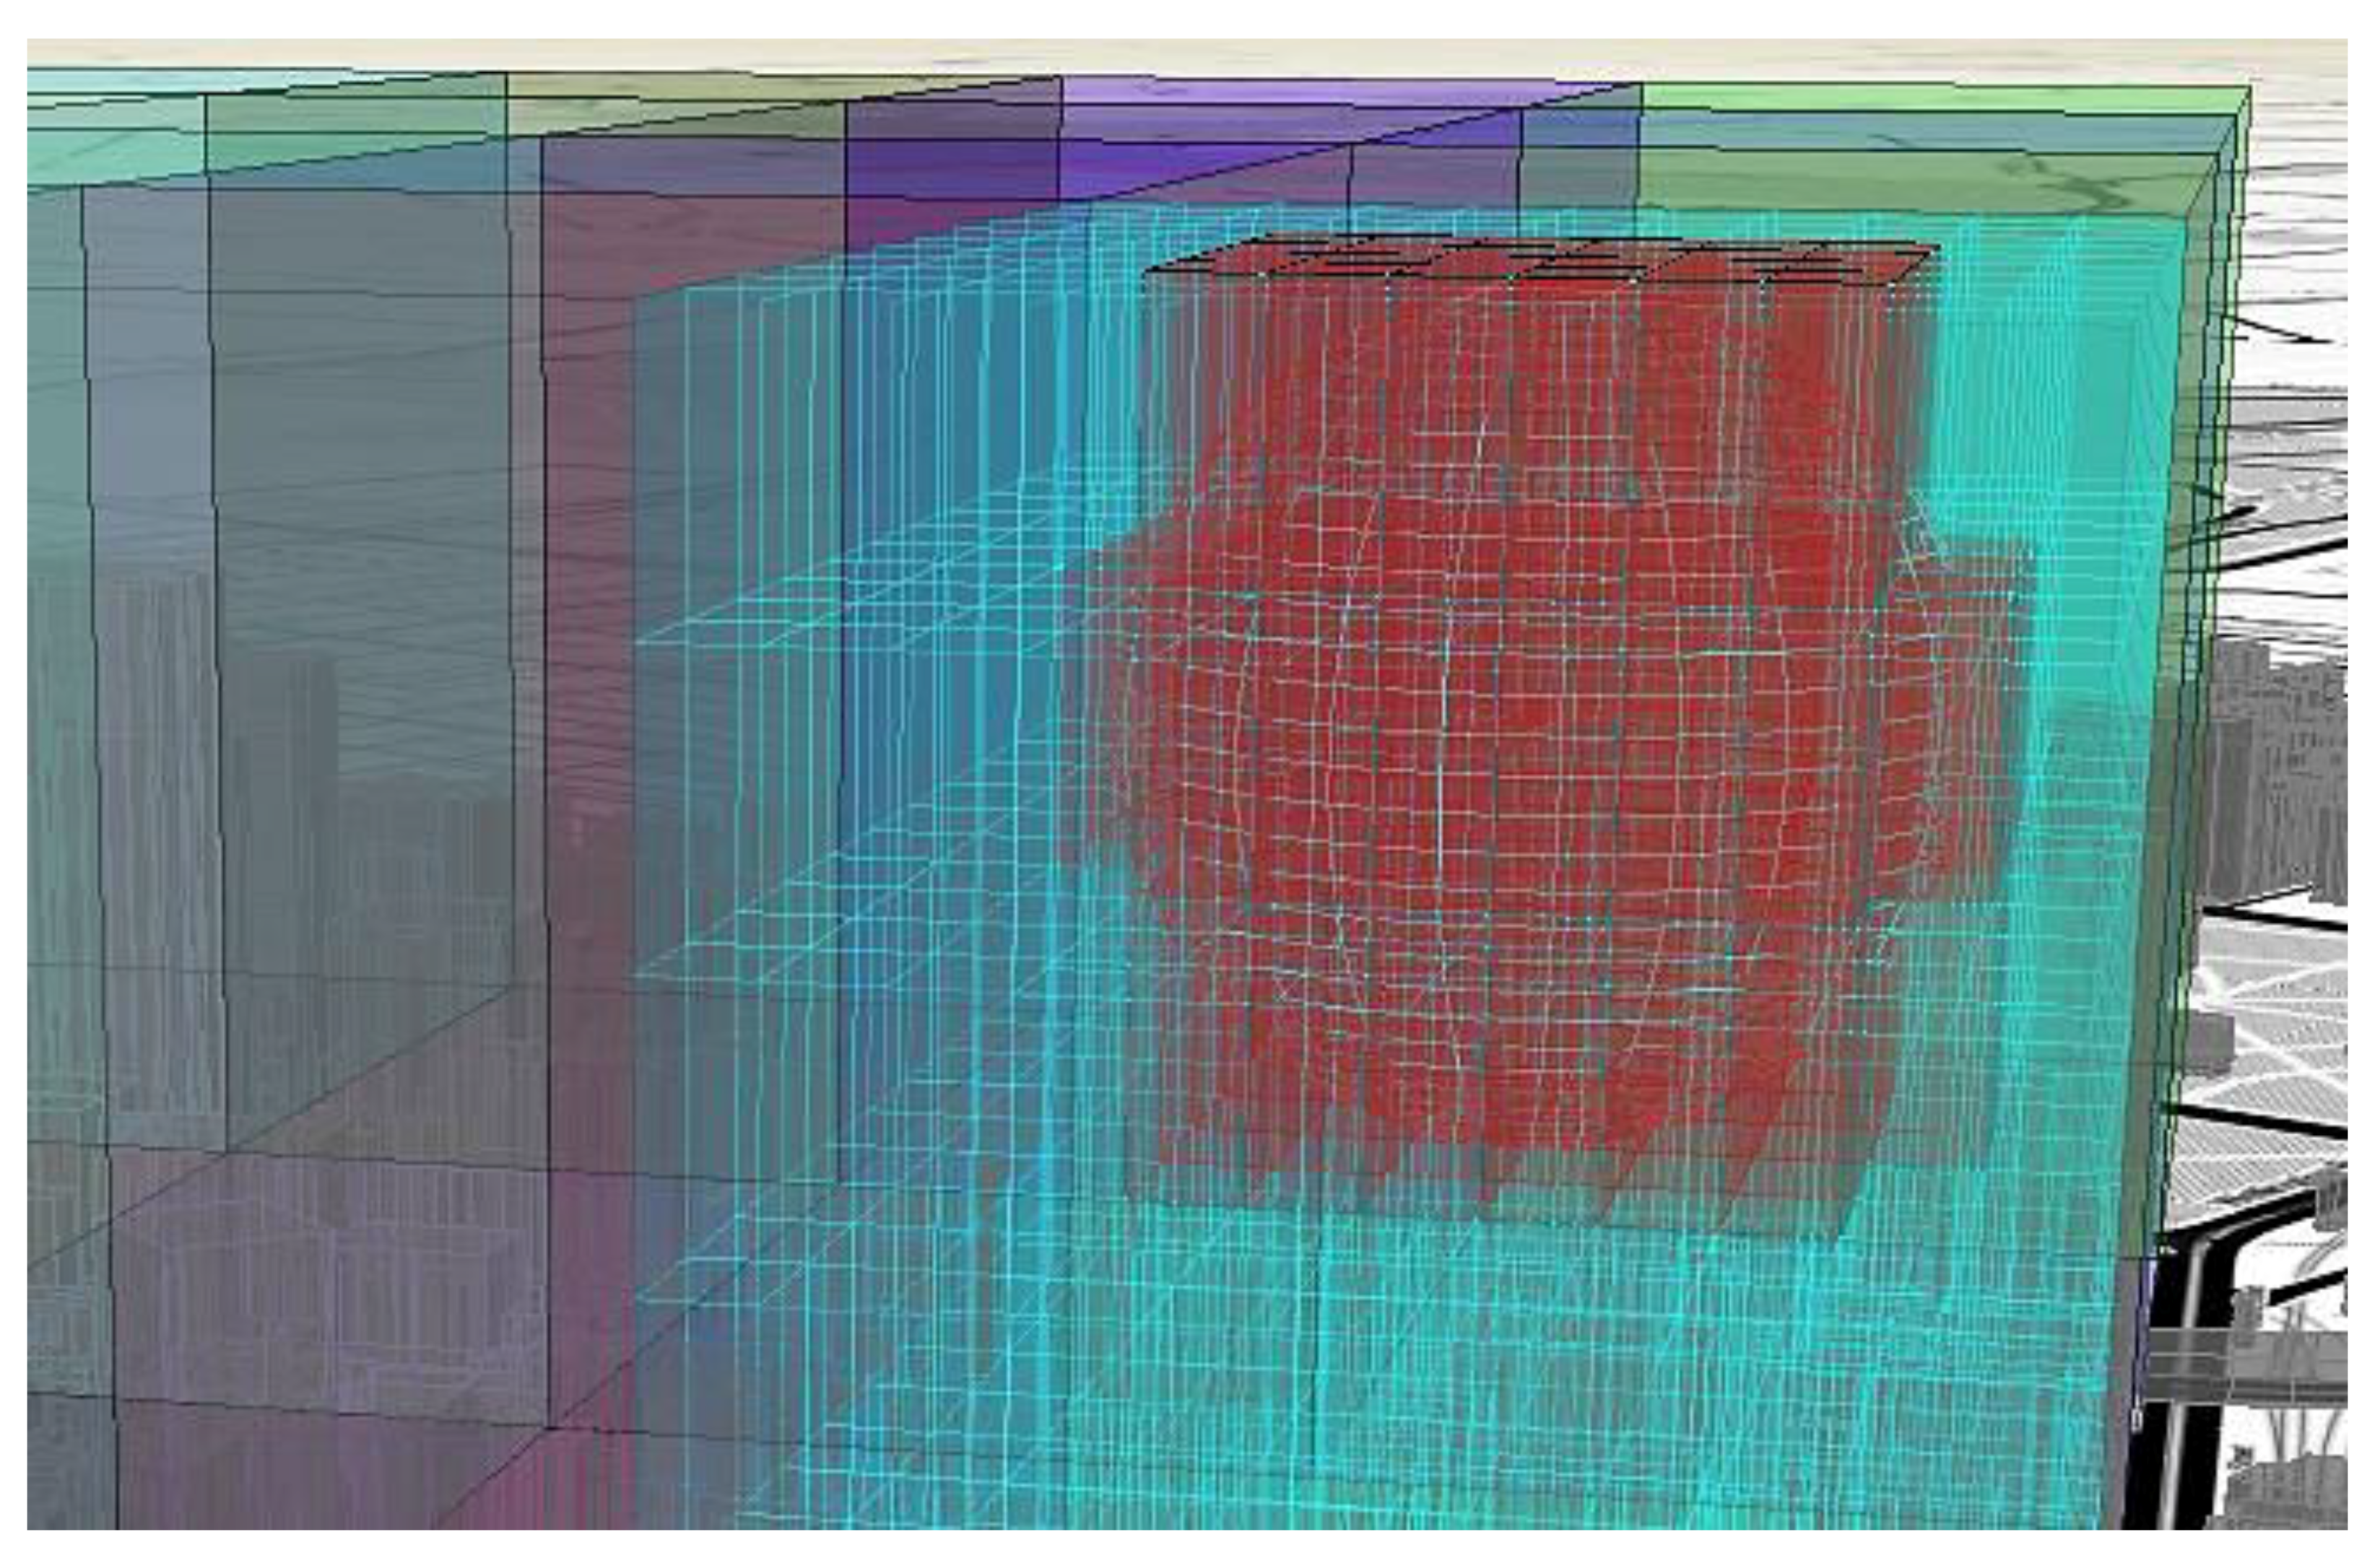
3.3. Occupancy Grid
To facilitate ATM/UTM system processing and enhanced capability to balance airspace demand and capacity dynamically, the occupancy grid concept is proposed to approximate the volumetric demand. A grid of elementary cells is constructed for the entire urban region adopting the models in
Section 3.2. The CNS protection volumes around each active aircraft are then superimposed to the grid as illustrated in
Figure 9. An elementary cell is designated as occupied when it contains at least one point of the CNS protection volume bounding each aircraft. Each occupied cell, therefore, is a result of the demand placed on the airspace by virtue of the CNS performance. For visualisation purposes, occupied and free elementary cells are designated different colours (red and grey respectively).
The occupancy grid approach allows for a rapid assessment of the occupied space against the overall free space. A count performed over the cells supports the calculation of the theoretical remaining capacity to service the airspace with the given CNS infrastructure.
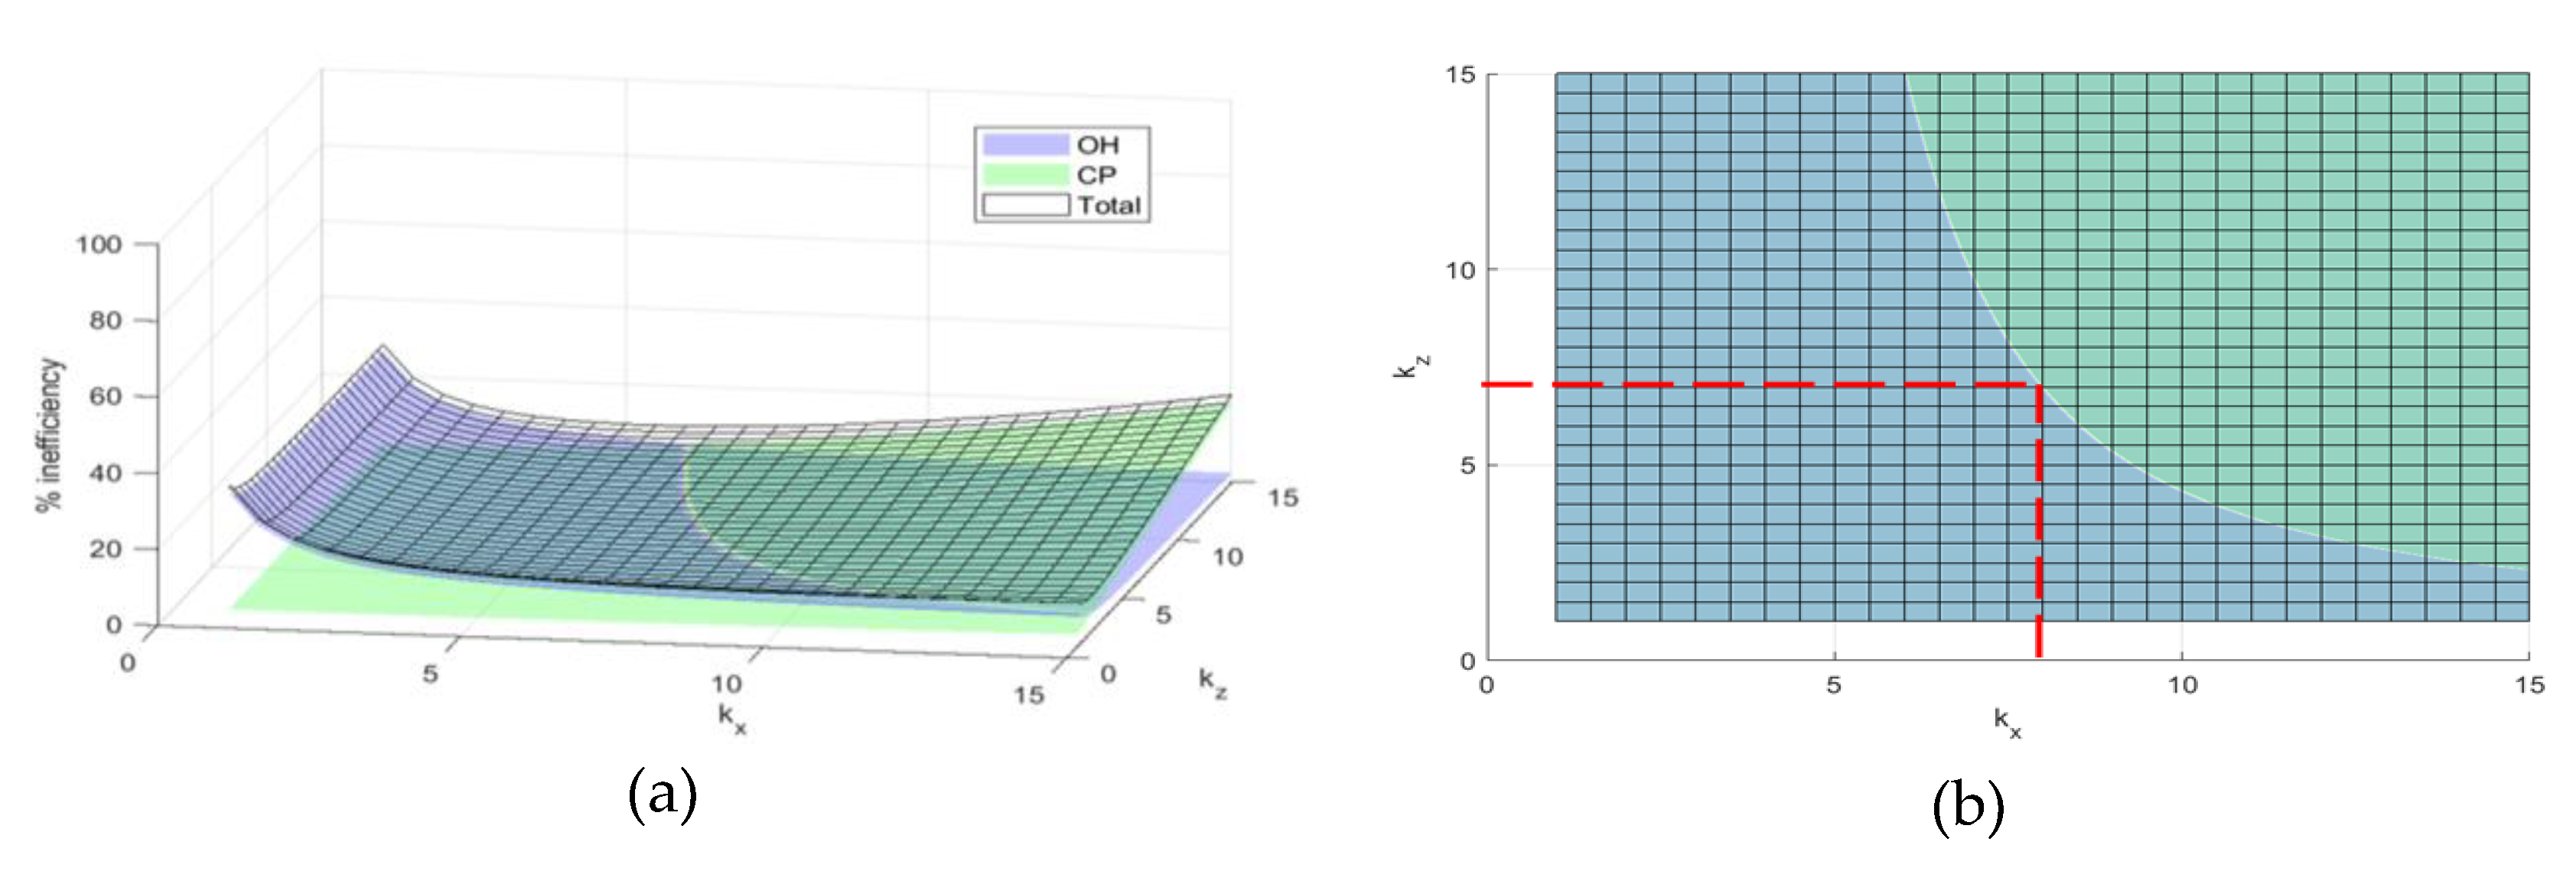
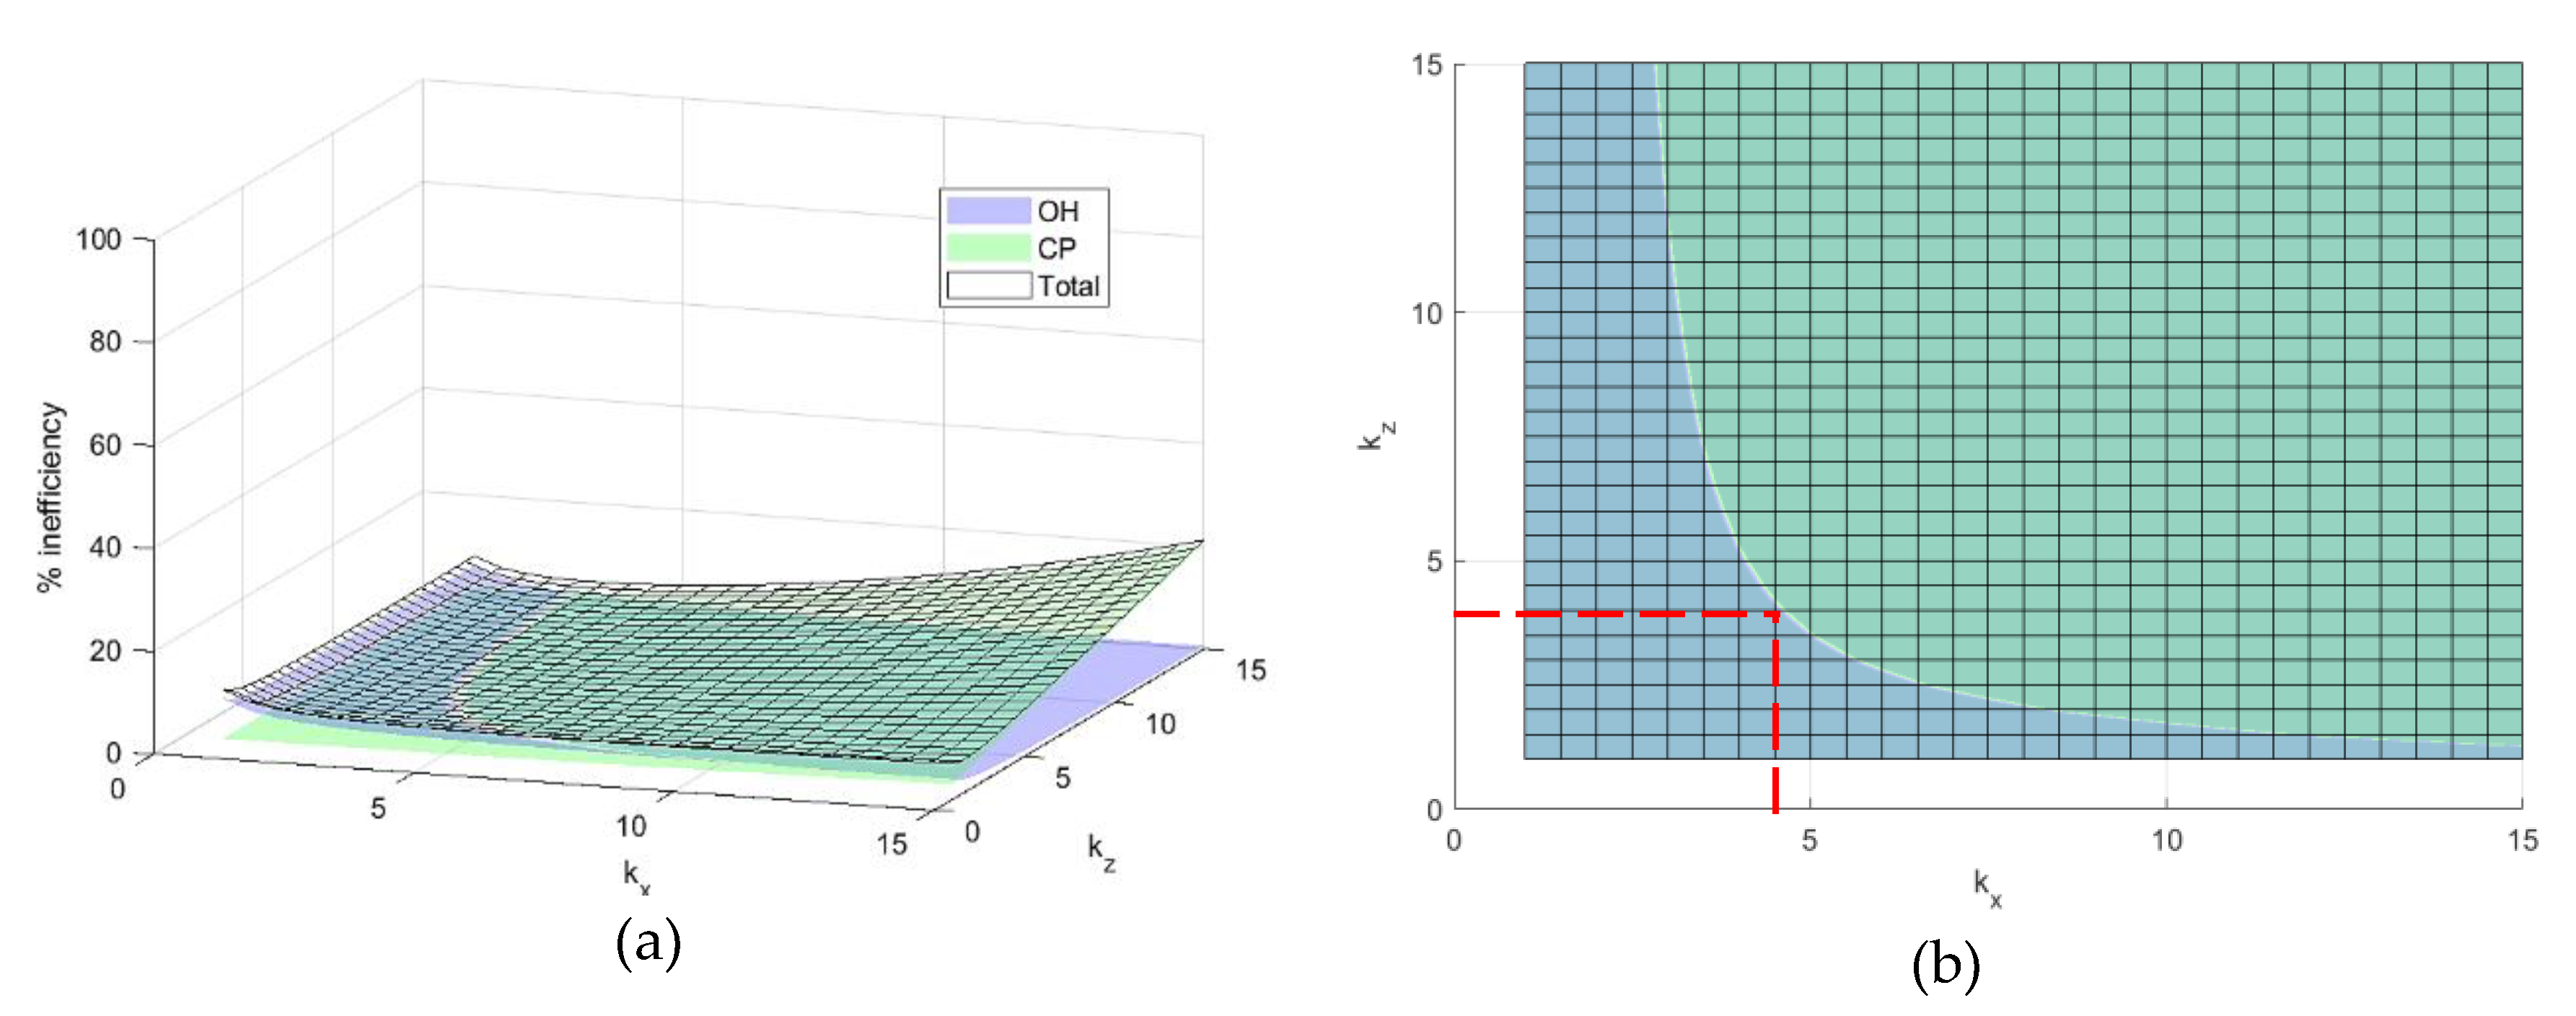
3.4. Airspace Sectorisation
A sectorization scheme based on the previously defined elementary cells is proposed here, which optimally balances computational complexity and communication overheads.
A UAS operation spanning multiple sectors requires a handover to be performed at each sector boundary. The number of cells allocated to a given sector is determined so as to optimize two key factors: the communication overhead required to perform all the required handovers for all involved traffic (which increase proportionally with the density of sectors), and the computational complexity associated with computing an avoidance volume and avoidance trajectory (which increases proportionally with sector dimensions).
The communication overhead is parameterized as a dimensionless factor which is a function of the time required to perform a ‘handshake’ or to establish a link between the UAS and the UTM operator, and the average time spent in each sector:
where
is the handshake time (s);
is the average horizontal velocity of the vehicle over a sector (m/s);
is the average vertical velocity of the vehicle (m/s);
is the average horizontal distance covered in a sector (m);
is the average horizontal distance covered in a sector (m).
Equation (22) essentially represents the proportion of time spent in establishing a handover communication link between sectors. The sector horizontal and vertical dimensions are by definition set as multiples of the elementary cell dimensions. Thus,
and
are calculated from the multiplication of elementary cell numbers (
) and elementary cell dimension (
):
where:
The computational complexity is approximated as a factor that captures the proportion of time spent in generating avoidance volumes and avoidance trajectories as well as the maximum potential number of aircraft simultaneously in the sector, which as a worst case can be assumed equal to the number of elementary cells in each sector:
where CD is the computational demand (s); CoP is the available computing capacity (s);
is time to generate avoidance volume;
is time to generate trajectory; n is the number of elementary cells in a sector.
5. Conclusions and Future Research
The envisioned spread of Urban Air Mobility (UAM) and low altitude UAS services prompts the need to introduce new airspace structures and classifications, particularly in dense urban and suburban areas. This paper presented a new approach to the design of urban airspace based on the combined performance of avionics systems and supporting traffic management infrastructure. In particular, the airspace was discretized into fundamental volume elements (elementary cells) as a function of the Communication, Navigation and Surveillance (CNS) systems performance and a dedicated study was presented exploring the relevance of Global Navigation Satellite System (GNSS) performance to both aircraft navigation and Automatic Dependent Surveillance-Broadcast (ADS-B) cooperative surveillance. Additionally, the paper introduced a methodology to determine the optimal sector dimension as a combination of multiple elementary cells, considering on one hand the traffic complexity, and on the other hand the overheads due to sector handovers. The proposed airspace structuring methodology was then verified in two simulation case studies that utilized representative GNSS measurements gathered from an urban measurement campaign. The case studies showed that the performance-based discretization is numerically feasible and, based on the conservative assumptions and the principles adopted, it promotes operational safety while at the same time maximising the efficiency of airspace resource exploitation, particularly by efficiently accommodating unmanned aircraft with diverse avionics equipment. It is expected that the progressive transition from an RNP-based formulation to a full CNS performance-based approach, including other parameters from the communication system (e.g., signal to noise ratio, bit error rate, etc.), will offer significant benefits in all planning and operational UTM timeframes from strategic offline to tactical online scenarios. In this perspective, the proposed airspace sectorisation concept will contribute significantly to enhance decision support for demand-capacity balancing and dynamic airspace management in low-level ATM operations. Future work will also investigate the synergies between the proposed concept and adaptive/cognitive forms of Human–Machine Interfaces and Interactions (HMI2) to enhance the cooperation between human operators and the increasingly automated (and trusted autonomous) system functions required in the UTM operational context. Application of directional volume inflations (as opposed to the conservative omnidirectional inflations adopted in this paper) to account for factors such as aircraft relative dynamics, weather effects, wake turbulence and downwash will also be investigated.

 ,
, 


