Article

Fixed-Wing UAV Attitude Estimation Using Single Antenna GPS Signal Strength Measurements

1
Department of Mechanical and Aerospace Engineering, West Virginia University, Morgantown, WV 26506, USA
2
Division of Engineering, Pennsylvania State University, Reading, PA 19610, USA
*
Author to whom correspondence should be addressed.
Aerospace 2016, 3(2), 14; https://doi.org/10.3390/aerospace3020014
Submission received: 5 April 2016 / Revised: 5 May 2016 / Accepted: 10 May 2016 / Published: 13 May 2016
(This article belongs to the Collection Unmanned Aerial Systems)

Abstract

:
This article considers a novel approach to using global positioning system (GPS) signal strength readings and estimated velocity vector for estimating the attitude of a small fixed-wing unmanned aerial vehicle (UAV). This approach has the benefit being able to estimate full position, velocity and attitude states of a UAV using only the data from a single GPS receiver and antenna. Two different approaches for utilizing GPS signal strength within measurement updates for UAV attitude in a nonlinear Kalman filter are discussed and assessed using recorded UAV flight data. Comparisons of UAV pitch and roll estimates against measurements from a high-grade mechanical gyroscope are used to show that approximately 5° error with respect to both mean and standard-deviation on both axes is achievable.

Graphical Abstract

1. Introduction

The ability to estimate an aircraft’s full position, velocity and attitude (PVA) state vector using only a single global positioning system (GPS) antenna and receiver has several benefits. For example, an important potential use of GPS signal strength based attitude estimation on unmanned aerial vehicles (UAVs) is to provide an information source to warn a user if a GPS receiver is under a spoofing attack, such as those that have been demonstrated on small UAVs [1]. In this context, the ability to map GPS signal strength to attitude, or conversely, predict the expected signal strength given an known UAV attitude (e.g., from an inertial measurement unit (IMU) ) would provide an additional layer of information for authenticating GPS signals. That is, a GPS spoofer would not be able to have the a priori knowledge of the UAVs attitude dynamics, and therefore would not be able to spoof the sensitivity to GPS signal strength to receiver antenna attitude. Furthermore, for many applications, GPS-only attitude estimates could eliminate the need for carrying and integrating an IMU within the navigation system. That said, it is important to acknowledge that IMU systems have become extremely lightweight and cost-effective for integration with GPS on small UAV navigation systems [2,3,4]. However, the availability of GPS-only based attitude estimates double be used as an additional information source within a fault-tolerant estimation algorithm, such as Gu. et al. 2016 [5]. Finally, as an additional update source, when properly fused with other sensors, this could help improve the accuracy and robustness of the overall navigation system. A single sensor that offers a non-drifting PVA solution is attractive for many reasons.
For use in spacecraft applications, GPS signal-to-noise ratio (SNR) or signal strength readings have been used to provide coarse attitude estimates. For example, Axerad and Behre used data from the GPS Metrology (GPS-MET) mission to show that 3°–10° attitude estimation performance is achievable [6]. Additionally, Wang et al. [7] report 15° satellite attitude estimation performance. Likewise, Lightsey and Masden [8] proposed the use of GPS signal strength from multiple antennas as an alternative to traditional carrier-phase based attitude determination. More recently, GPS SNR-based attitude estimation approaches have been suggested and evaluated as a low-power option for small-satellite platforms. For example, Ang et al. proposed that GPS signal strength for coarse attitude should be combined with magnetometers to improve attitude performance from magnetometers alone during periods in which the spacecraft is in eclipse and sun-sensor readings are unavailable [9].
Despite the promising results for Earth orbiting satellites, GPS signal strength based attitude estimation approaches have not been evaluated for use aerial vehicles, such as fixed-wing UAVs. While the overall concept remains similar for the UAV attitude application, adopting these methods to aerial platforms requires some additional considerations that should be detailed and evaluated experimentally. First, for the case of fixed-wing aerial vehicles, the GPS signals must traverse the Earth’s neutral atmosphere, while this is not case for the satellite applications. Similarly, for aerial platforms, low elevation satellites experience more significant multipath effects due to reflections from the Earth surface [10]. These issues may require some additional considerations when designing the estimation algorithm. Another important difference for the UAV application is that because fixed-wing UAVs can also estimate the heading and pitch angles from the GPS velocity vector, this should be leveraged. Because of these considerations, this paper performs an experimental study on the use GPS signal strength measurements for the attitude estimation of a small fixed-wing UAV. As such, the main contributions of this paper are the description of algorithm formulations that use of GPS signal strengths for UAV attitude estimation, as well as the subsequent experimental evaluation of their performance. This will allow others to consider the use of GPS signal strength for attitude in other aerial vehicle applications.
The rest of this paper is organized as follows. Section 2 discusses the approaches for relating GPS signal strength to attitude, Section 3 discussed the experimental set-up which includes a description of the West Virginia University Phastball UAV research platform. Finally, Section 4 shows the result of the calibration process and the attitude estimation performance of the approaches considered and Section 5 summarizes the findings.

2. Methodology

2.1. Satellite Elevation Angle with Respect to Antenna Bore-Sight, α

The key to observing attitude from GPS signal strength is that the receiver’s antenna gain profile is not perfectly uniform. Because of this, the signal strength drops as the angle of the satellites location goes away from the bore-sight. In this paper, we refer to this angle as the satellite’s elevation with respect to the antenna bore-sight, and we denote it with α. This α-angle is similar to the traditional satellite elevation angle, however, it takes into account the rotation due to changes in attitude. To determine α, first, the vector that defines the location of the satellite with respect to the location of the aircraft as defined in Earth-Centered-Earth-Fixed (ECEF) coordinate to the vehicle’s body-axis coordinate system, which is determine using the GPS receiver solution for position and the satellite ephemeris, must be transformed to the UAV’s body-axis. This transformation is shown in Equation (1):
R b , u k = C n b C e n R e , u k
where R is the cartesian vector of the relative position vector of the satellite with respect to the UAV, the subscript b denotes the body-axis, the subscript e denotes the ECEF coordinate system, the superscript k denotes a satellite index and the subscript u refers to the user-platform, UAV. The transformation matrix, C n b , defines the transformation from a locally-level navigation frame to the UAV body-axis, and is defined in terms of three Euler angles: ϕ-roll, θ-pitch, ψ-yaw, as shown in Equation (2) [11]:
C n b ( ϕ , θ , ψ ) = c ( θ ) c ( ψ ) - c ( θ ) s ( ψ ) s ( θ ) c ( ϕ ) s ( ψ ) + s ( ϕ ) s ( θ ) c ( ψ ) c ( ϕ ) c ( ψ ) - s ( ϕ ) s ( θ ) s ( ψ ) - s ( ϕ ) c ( θ ) s ( ϕ ) s ( ψ ) - c ( ϕ ) s ( θ ) c ( ψ ) s ( ϕ ) c ( ψ ) + c ( ϕ ) s ( θ ) s ( ψ ) c ( ϕ ) c ( θ )
where c(·) represents the cosine function and s(·) represents the sing function. The transformation matrix, C e n , defines the transformation from the ECEF frame to a locally-level navigation frame, and is defined in terms of the latitude, Φ, and the longitude, λ, of the aircraft as shown in Equation (3).
C e n ( Φ , λ ) = - s ( Φ ) c ( λ ) - s ( Φ ) s ( λ ) c ( Φ ) - s ( λ ) c ( λ ) 0 - c ( Φ ) c ( λ ) c ( Φ ) s ( λ ) - s ( Φ )
Once the relative position of the satellite with respect to the UAV is represented in the UAV’s body-frame coordinates, the satellite elevation with respect to antenna bore-sight angle is calculated using the tangent inverse as shown in Equation (4).
α = a t a n - R b , u ( 3 ) | | R b , u ( 1 ) R b , u ( 2 ) | | 2
where R b , u ( · ) indicates an element of the R b , u vector and | | · | | 2 indicates the L 2 norm. Note that the negative sign in Equation (4) is due to the fact that within the UAV’s body-frame, the positive axis is down, whereas we want to represent the vertical component with up as positive.

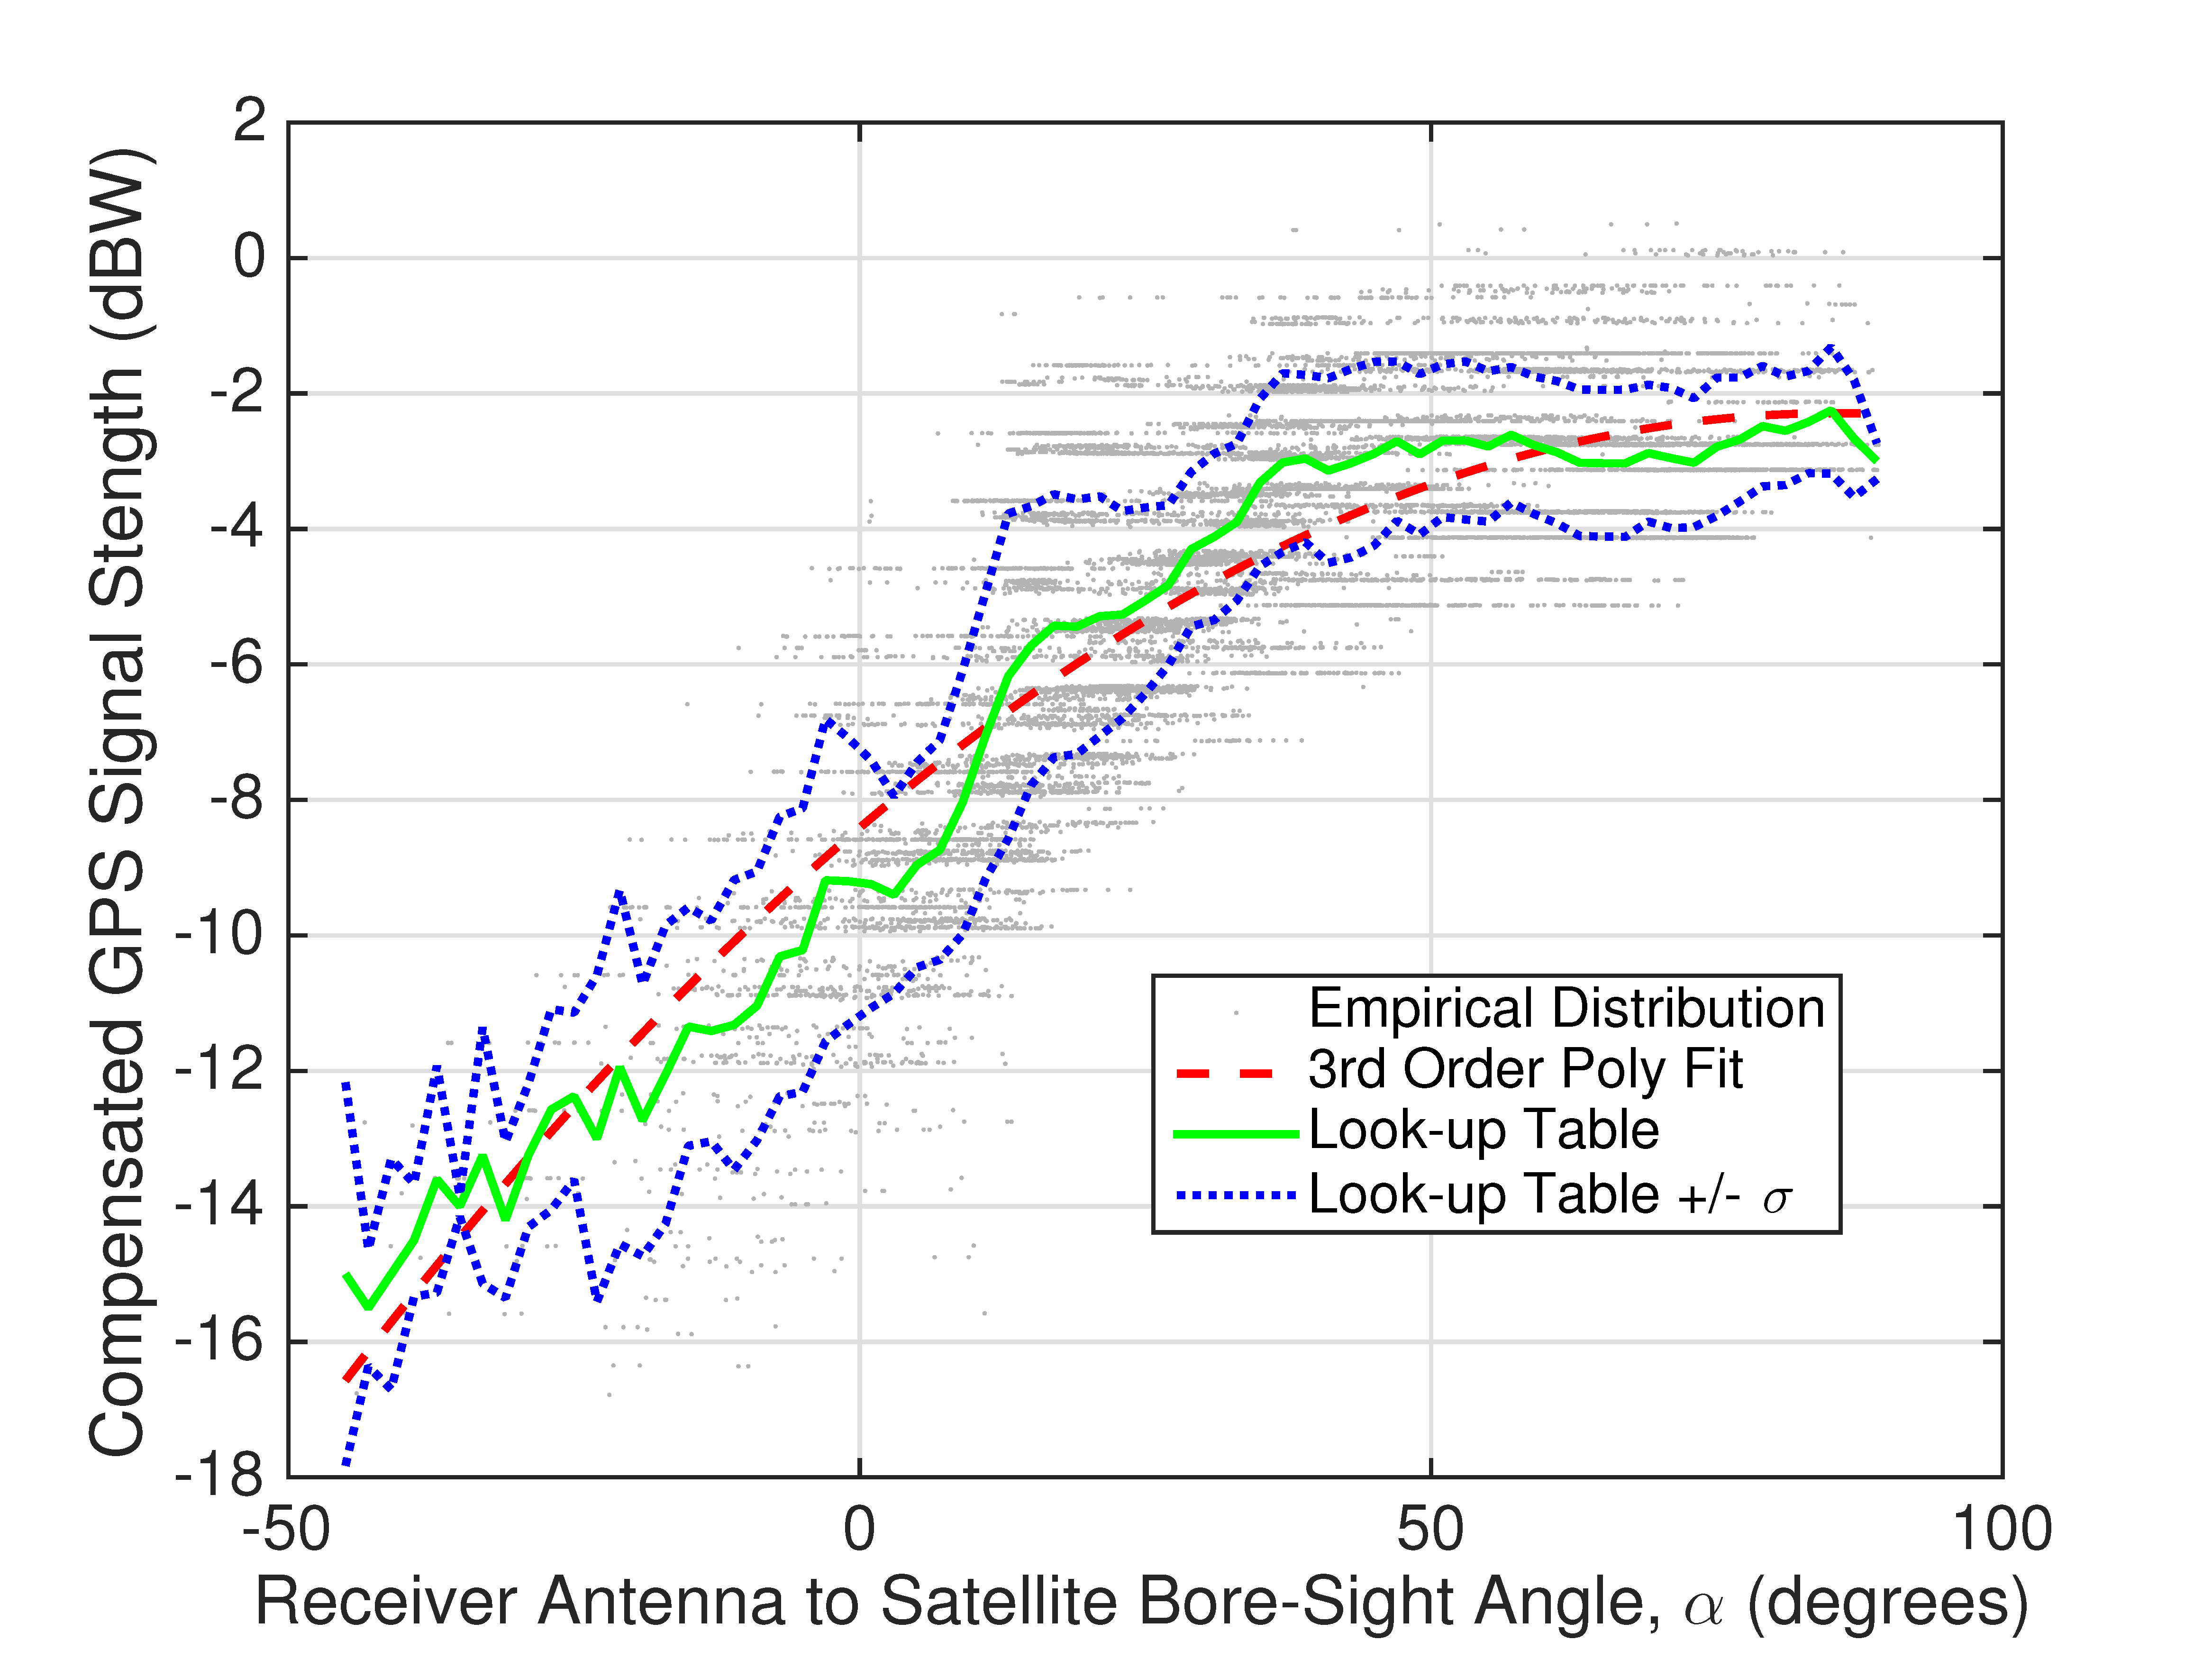
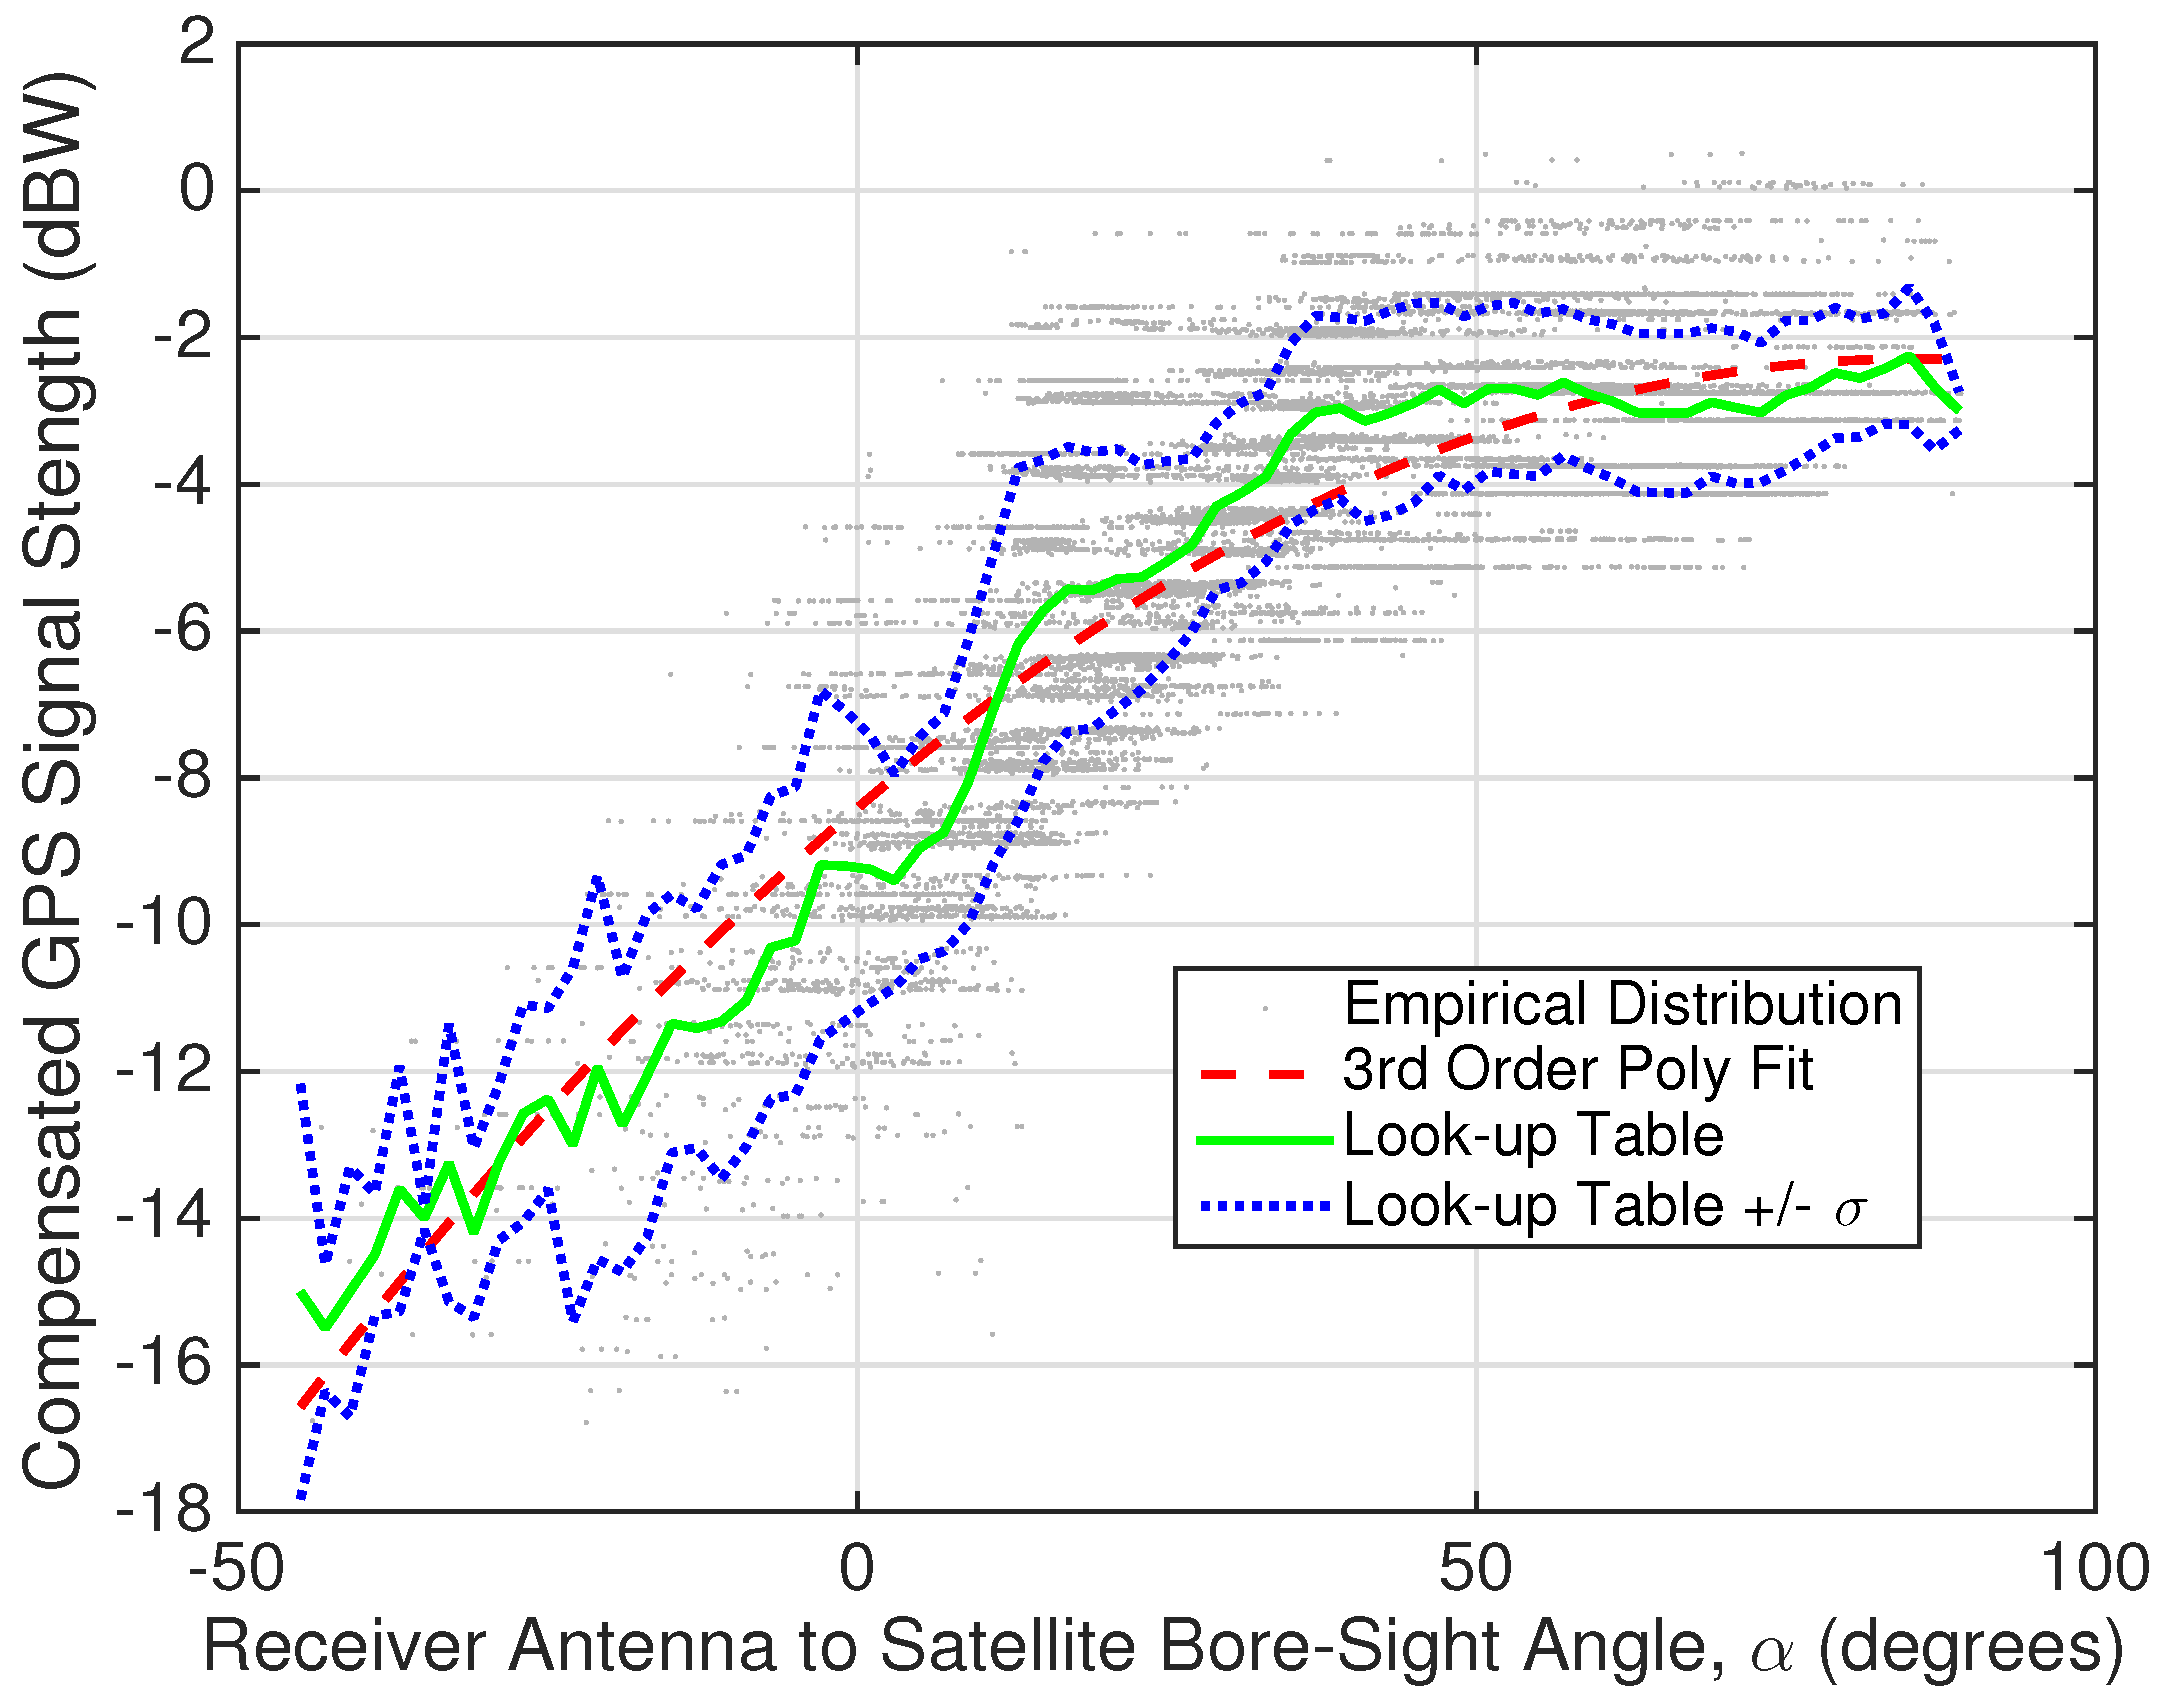
2.2. GPS Signal Strength to α Mapping

This section discusses methods developing an empirical calibration of the satellite’s elevation with respect to the UAV GPS receiver antenna’s bore-sight vector to GPS signal strength. As was described in the previous section, α is dependent on the platform’s Euler angles, as such, an empirical model GPS signal strength as a function of α can be used as an observation model for updating the UAV’s attitude estimates. In order to develop an empirical calibration model, a data set in which the UAV attitude is known (e.g., directly measured or from GPS/Inertial Navigation System (GPS/INS) sensor fusion [3]) is required, once this calibration has been completed, attitude can be estimated directly from GPS signal strength.

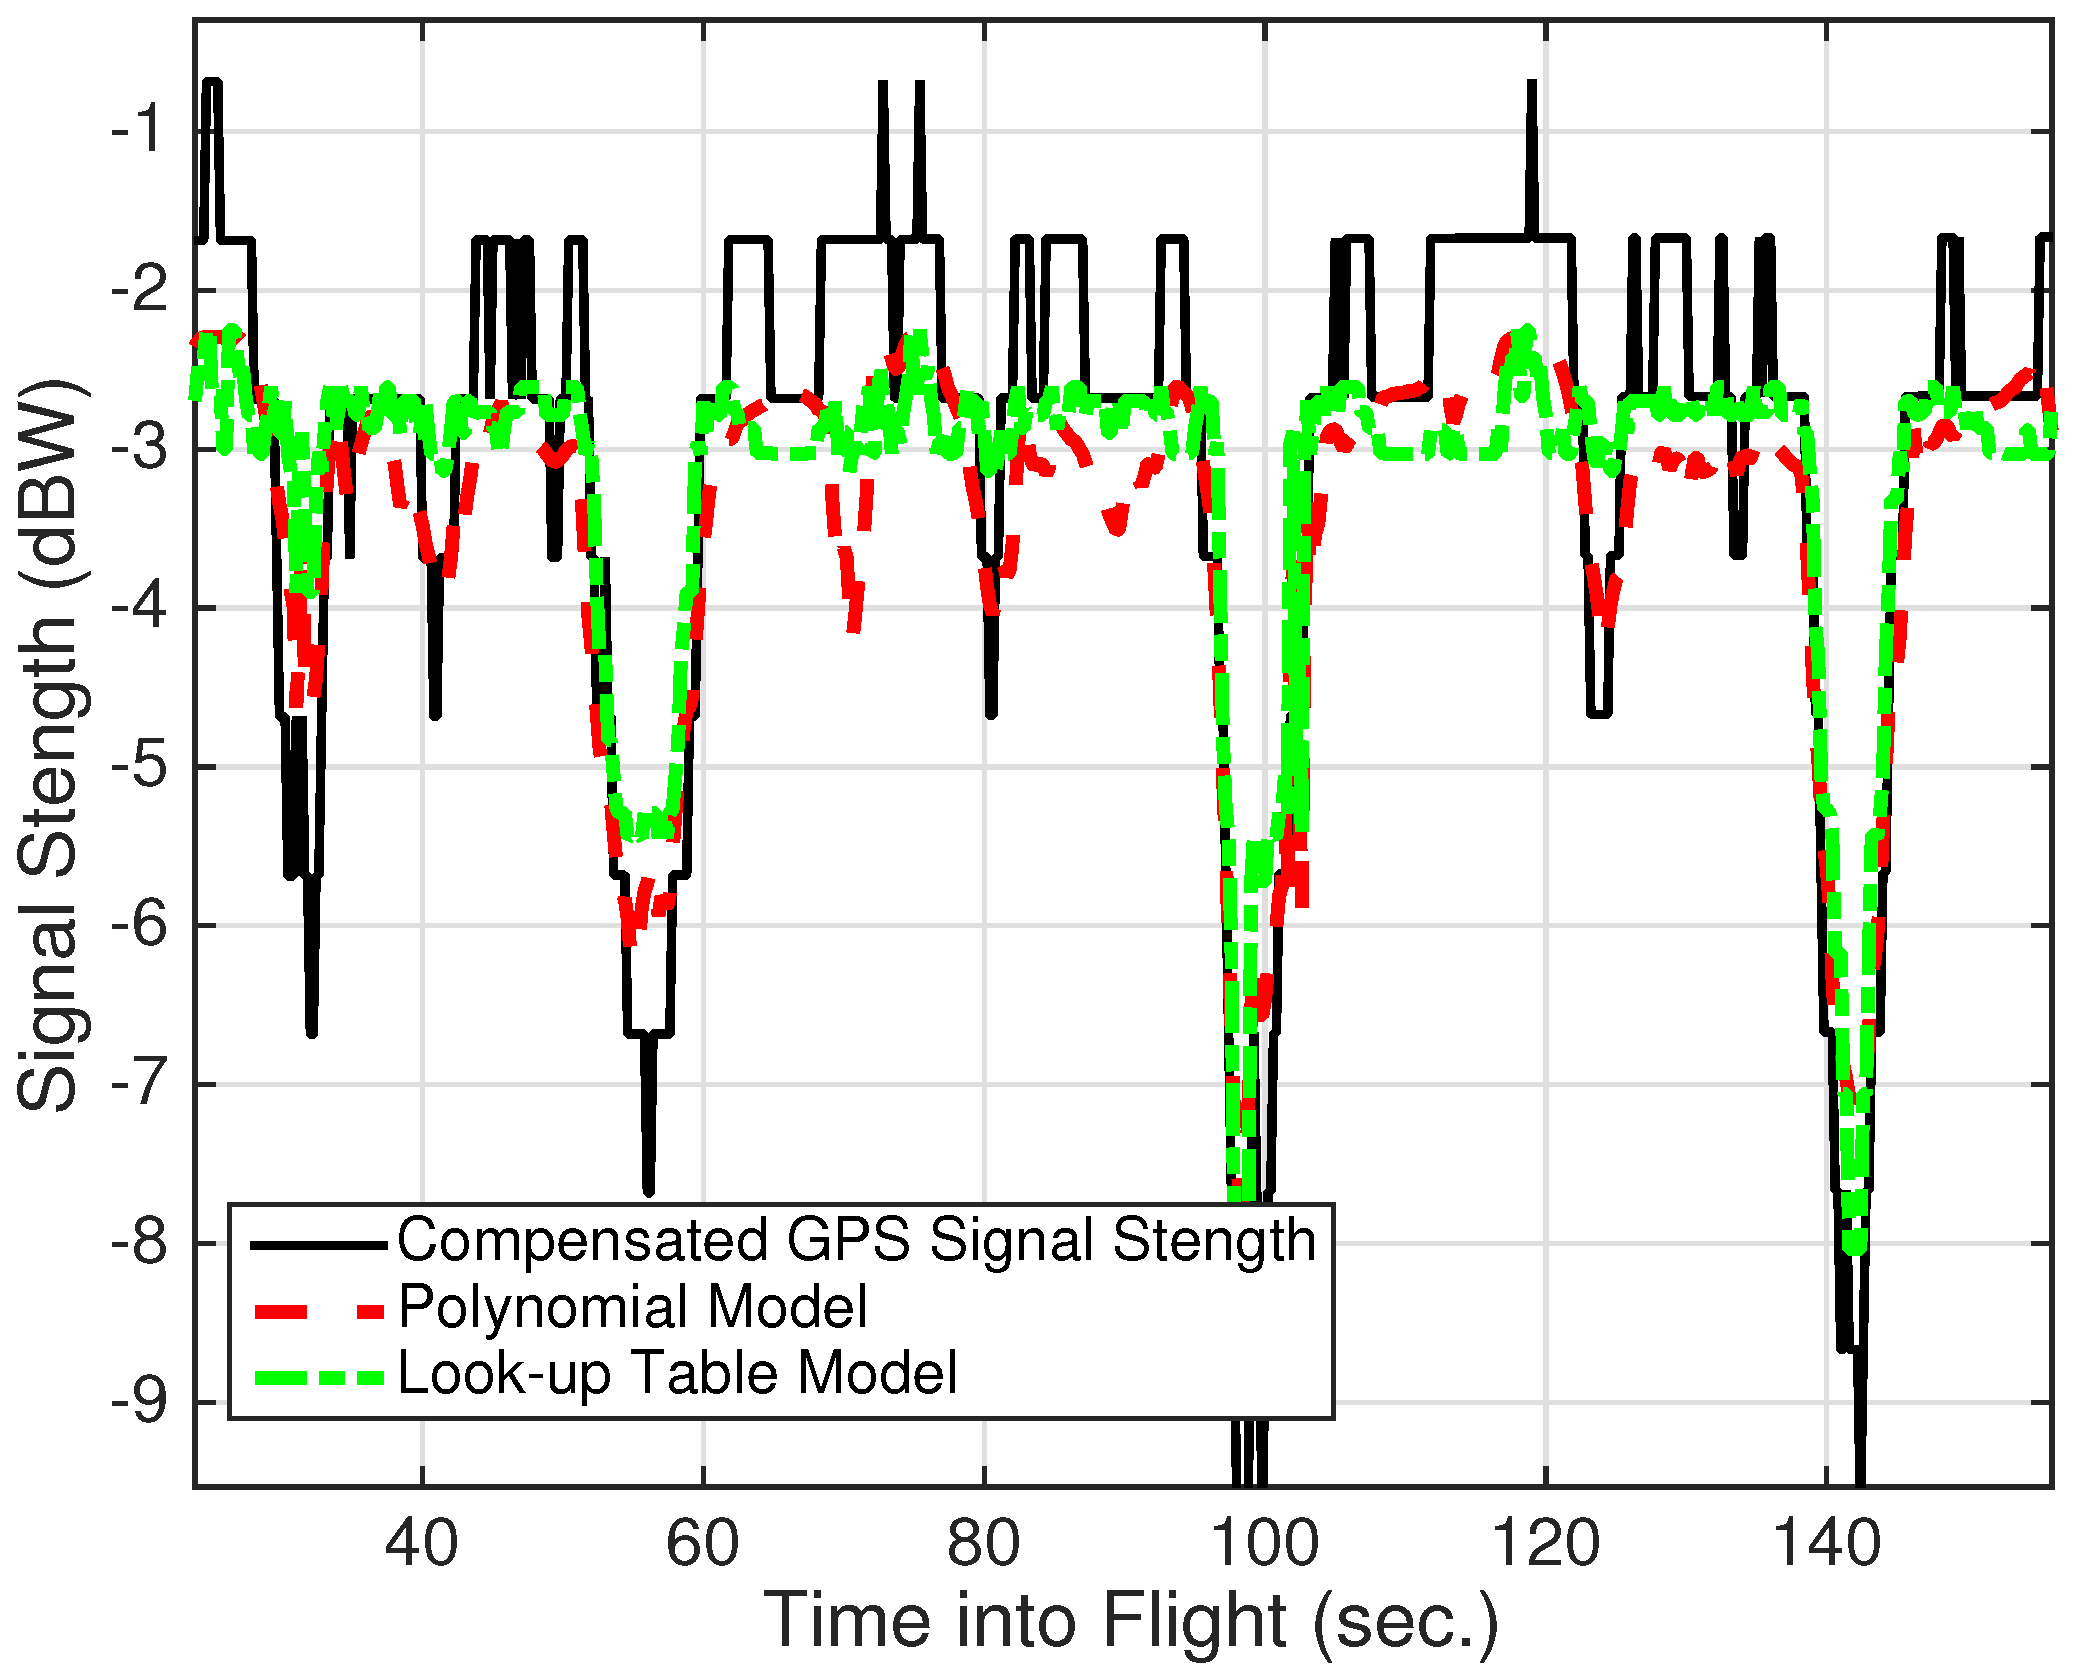
2.3. Compensating GPS Signal Strength Measurements for Known Effects

In order to only leave the UAV attitude dependent signal within the GPS signal strength measurements, it is important to pre-process these values in order to model and compensate for other known contributors to changes in the signal strength readings [6]. Of these effects, the largest contributor is the space loss that occurs due to the signal traversing the ≥20,000 km orbital altitude of the GPS constellation [10]. The space loss can be modeled as a function of the distance between the UAV and the GPS satellite [6] as provided in Equation (5).
S L u k ( d B w ) = 20 l o g 10 ( | | R e , u k | | 2 )
Next, it is important to model the non-uniformity of the GPS transmission antenna gain. In particular, the GPS transmission antenna is tailored such that the amount of energy is approximately equal across the visible surface of the Earth [10]. As such, there is slightly more antenna gain (i.e., 2.5 dB [6]) for satellites that in the horizon with respect to the user’s position on the surface of the Earth. For highest accuracy, a look-up table of each GPS satellite’s unique transmitter gain profile can be implemented as in Axelrad and Behre [6]. However, for simplicity, in this study, a simple sinusoidal loss function is adopted [10], as shown in Equation (6) .
T G u k ( d B w ) = 2 . 5 s i n ( π - e l . u k )
where e l . u k represents the elevation angle to the satellite from the user’s location independent of the antenna’s orientation. As shown in Equation (7), e l . u k is calculated in a similar manner as α, but without considering the C n b transformation.
R n , u k = C e n R e , u k
with e l . u k then determined using Equation (8).
e l . = a t a n - R n , u ( 3 ) | | R n , u ( 1 ) R n , u ( 2 ) | | 2
Finally, as signal strengths are typically reported in terms of a ratio C / N o ( d B w / H z ) with respect to an assumed noise density, in order to get a number closer to zero, one can add the assumed noise density, as defined in Equation (9) , to measurements in order to have them explicitly represent receive power [12].
N o ( d B w / H z ) = 10 l o g 10 ( K T )
where K is the Boltzmann constant ( 1 . 38 × 10 - 23 J/K) and T is the assumed noise temperature (290 Kelvin), such that N o = –204 dBw/Hz [12]. Note that, for this application, considering Equation (9) is optional as it is constant term that will purely shift the signal strength measurements and will yield no impact to the functional dependency on α or satellite location.

2.4. Look-up Table Calibration

The first approach described models the compensated signal strength as a function of α in the form of a look-up table. This is the primary approach adopted by Axelrad and Behre [6] for the application of satellite attitude estimation. To apply this method, a flight with known UAV position and attitude is used to derive α and the signal strength values are compensated for known non UAV attitude effects as discussed in the previous section. Then, the measurements are simply grouped into bins of α, such that a mean and standard deviation of compensated signal strength measurements can be calculated for each bin can be stored for future use. This approach has the benefit of not only mapping α to signal strength, but also providing standard deviation values per each table bin that are then used as measurement noise variance to make a measurement-error covariance matrix, R m e a s .

2.5. Polynomial Fit Calibration

The second approach considered in this study employs a polynomial fit instead of a look-up table. With this a approach, the coefficients of a third order polynomial are determined using least square regression to the data. In our case, a third order polynomial was chosen simply because higher order polynomial fits yielded coefficients for the higher order terms that were nearly zero. For the polynomial fit, the standard deviation of the data residuals of the fit are used to define measurement-error variance.

2.6. Elevation Dependent Weighting of Signal Strength Observations

As mentioned in the introduction, for UAVs that are at relatively low altitudes, it is well known in GPS estimation filtering that low-elevation measurements are of lower quality due to the increased presence of Earth surface multipath reflections and from traversing more of the neutral atmosphere. Additionally, at lower elevation angles, the distance between the UAV and GPS satellite is significantly increased, which will amplify any error in the space loss model in Equation (5) as well increase the attenuation due to the signal traversing more of the Earth’s troposphere, whose day-to-day wet delay variations are uncertain. Finally, for the same reasons, a sudden change in signal strength for a relatively high-elevation satellite intuitively yields more information about changes in UAV attitude. Due to these reasons, a technique explored in this study is to weight the compensated GPS signal strength measurements by the satellite elevation angle using a sinusoid weighting models as shown in Equation (10).
R ( j , j ) m e a s = 1 s i n ( e l . u j ) R ( j , j ) m e a s
where R ( j , j ) represents an element of the filter’s measurement error-covariance matrix that corresponds to the j t h GPS signal strength measurement. Additional details on the Kalman filter implementation are discussed in Section 2.8. In this study, estimation performances with and without sinusoidal weighting are considered.

2.7. Process Model for UAV Attitude and GPS Heading

Another important distinction between the UAV attitude estimation application and previous satellite attitude estimation studies is the selection of the process model for attitude and the fact that the GPS estimated velocity vector is available to reduce the problem. If one were to employ GPS signal strength attitude in a multi-sensor fusion context, the attitude process model is where additional sensors such as an IMU could be added. However, in this study, the focus is to consider the case in which only GPS information is available for attitude estimation. Therefore, the process model for estimating attitude is simply a random-walk model that uses subjective judgment to assign process noise levels. This process model was selected as it represents a worst-case for an attitude estimator’s ability to predict attitude, and therefore helps to establish an upper bound of the expected estimation performance of the approaches considered. As such, the discrete process model for the UAV attitude used in the paper is offered by Equation (11).
ϕ j + 1 θ j + 1 ψ j + 1 = ϕ j θ j ψ j + w ϕ w θ w ψ
where w ϕ was selected to be 7 d e g . s , w θ was selected to be 1 d e g . s , and w ψ was selected to be 3 d e g . s and the process model is applies at 10 Hz. These values were chosen by simply evaluating the maximum change of each attitude state over between 10 Hz sampling steps. That is, typically, the amplitude of the change in the pitch angle of a UAV is smaller than the amplitude in the change of the roll for a fixed-wing UAV doing a coordinated turn.
In addition, because it is a safe assumption for fixed-wing UAVs that the vehicle is always moving with some velocity, and that GPS position and velocity estimates are readily available for our application, an estimate of the UAV’s yaw angle is available by assuming it to be coincident with the GPS derived heading angle, Ψ G P S ψ , where GPS heading with respect to due North is determined using GPS velocity as shown in Equation (12).
Ψ G P S = a t a n 2 ( V E G P S , V N G P S )
where a t a n 2 ( · , · ) is the four-quadrant tangent inverse and V E , N G P S are the GPS velocity components in the East and North directions, respectively. Furthermore, using GPS heading, a GPS “psuedo-pitch”, Θ G P S θ , can be isolated and inferred using only the GPS velocity vector, where Θ G P S is defined as shown in Equation (13):
Θ G P S = a t a n V U G P S | | [ V E G P S , V N G P S ] | 2
where V U G P S is the velocity in the vertical direction with respect to a locally-level geodetic frame. Equation (13) is derived by first breaking C n b (θ,ϕ,ψ) of Equation (2) into three sequential rotation matrices C n b (θ,ϕ,ψ)=R(ϕ)R(θ)R(ψ). Then, using Ψ G P S , the rotation through R(ψ) is done first, allowing θ to be isolated, which is the result shown in Equation (13). This is an approach similar to the acceleration vector attitude estimation (AVAE) strategy that we derived in previous work [3]. Note that this approach does not consider the Coriolis terms that are present due to fact that C ˙ n b 0 , but nonetheless, in practice, Θ G P S yields a very good approximation of θ. Because of the presented algorithms use of the GPS velocity vector, it is only relevant for UAVs that are in-flight. That is, before and after take-off, whenever there is little or no velocity of the UAV, heading and “psuedo-pitch” estimates will not be observable using GPS velocity. Further, this is not applicable to platforms that “hover” in place, such as quad-rotors.

2.8. Nonlinear Kalman Filter

Using the process model and observational models described in the previous sections, a nonlinear Kalman filter can be employed to estimate the UAV attitude directly from GPS signal strength measurements. In this study, the specific estimator chosen is an unscented Kalman filter (UKF) [13,14]. The UKF is ideal for this application primarily because it does not require any analytical linearization of the observation models, but instead uses a statistically sampled set of sigma points to perform a weighted least squares regression to linearize the measurement model about the current filter state. By not requiring an estimator that linearizes the analytical form of the measurement model, the update strategy can easily employ a look-up-table. For brevity, the specific details for implementing a UKF are not reviewed in this paper, but can be found in many good references such as the textbooks by Simon 2006 [15] or Crassidis and Junkins [16].
To offer clarity with respect to the presented filter implementation, the models that have been detailed in the previous section are summarized here with respect to their corresponding elements of the nonlinear Kalman filter framework. These include: state vector, x, measurement vector z, output vector, y, process model f, observation model h, as well as, the process noise Q and measurement noise R covariance assumptions used within the implementations that is presented. These terms make up the Kalman Filter’s classic predictor-corrector structure, over discrete-time index k and are related to one another when considering the process-model,
x k | k - 1 = f ( x k - 1 | k - 1 , u k , w k )
and the measurement-update, or state correction, which is conducted by using the predicted states to model the observed measurements:
y k | k - 1 = h ( x k | k - 1 , d k , v k )
where the process-noise, w k , is assumed to be distributed w k N ( 0 , Q ) and the measurement-noise, v k , is assumed to be distributed v k N ( 0 , R ) . The process-model f allows for the possibility of a system input, u, and the observation model, h allows for a system input d.
The state vector in the presented formulation consists of the UAV attitude, x = [ ϕ , θ , ψ ] T , and the process model f is discussed in Section 2.7. That is, in the presented algorithm, which considers the use of GPS information alone, no additional sensor information (e.g., from an Inertial Measurement Unit, Dynamic Model, Magnetometers, etc.) is offered to predict the UAV attitude. As such, a random walk process that models the uncertainty attributed to accepting the previous epoch’s best estimate as the current epoch’s attitude is used. This process is driven by the assumed process noise covariance, which is parameterized as listed in Section 2.7, with the following structure:
Q = w ϕ 2 0 0 0 w θ 2 0 0 0 w ψ 2
The filter’s measurement vector, z , consists of all of the GPS signal strength measurements after compensating them for knows effects as discussed in Section 2.3, for satellites 1 to N and the GPS estimates of heading and pitch, z = [ S S 1 , , S S N , Ψ G P S , Θ G P S ] T . For this measurement vector, the observational models, h S S of the signal strength measurements consists of the modeled signal strength values that come from either the polynomial fit or the look up table approach. These models are a function of the antenna bore-site angle, which was shown to be a nonlinear function of the UAV attitude in Section 2.1. For the GPS heading and pitch measurement updates, the observation models simply extracts the predicted yaw or pitch angle from the predicted state vector respectively, that is h Ψ G P S = [ 0 , 0 , 1 ] and h Θ G P S = [ 0 , 1 , 0 ] . Finally, to model the uncertainty of these measurements, the measurement-error covariance, R, where for GPS signal strength readings, depending on the approach used the assumed error-variance for each measurements is either from the standard deviation of the polynomial fit or the sample standard deviation of the look-up table model. Further, as discussed in Section 2.6, GPS satellite elevation deponent scaling of the assumed measurement variance is considered in order to compensation of poor low-elevation measurements. Finally, for the GPS-based heading and pitch estimates, 3°of uncertainty is assumed. Similar to the process-noise covariance matrix, these values make up a diagonal measurement-error covariance matrix, as shown in Equation (17).
R = d i a g v S S 1 2 , , v S S N 2 , v Ψ G P S 2 , v Θ G P S 2

3. Experimental Set-up

The experimental UAV used for this study is West Virginia University’s (WVU’s) Red Phastball Platform as shown in Figure 1, The Red Phastball is primarily used for sensor fusion research [17,18,19] and its avionics package [20] was updated for this study to include a Novatel OEM-615® dual-frequency GPS/Globalnaya Navigazionnaya Sputnikovaya Sistema (GLONASS) receiver, in which GPS pseudorange, carrier-phase and signal strength measurements were recorded at a rate of 10 Hz. In addition, for use in signal strength calibration and as pitch and roll reference solutions, the Red Phastball flew a Goodrich VG34® mechanical vertical gyroscope and the analog pitch and roll measurements were recorded using a micro-controller with a sampling rate of 50 Hz. In order to synchronize the GPS and gyroscope’s attitude measurements, the GPS receiver’s pulse per second (PPS) signal was recorded as an analog signal at a rate of 50 Hz using the same micro-controller that was used to recorded the vertical gyroscope measurements. The VG34® reports an absolute attitude within 0.1° of the true vertical.
It is important to mention that the flight test conducted for this study took place at WVU’s Jackson’s Mill flight testing facility, which is an open air-field located in a valley will small hills nearby. As such, signal blockages and their associated drops in GPS signal strength that occur due to the topography of the local environment, such as manmade buildings (e.g., urban canyon problem ), are not considered in this work.

4. Results

For experimental results, the output of calibration procedure is first presented followed by an analysis of attitude estimation performance using the various approaches discussed in Section 2.

4.1. Calibration Model

To illustrate the calibration approaches, a plot of all of the empirical readings and the two calibration curves in shown in Figure 2.
As shown in Figure 2, as one would intuitively expect, the closer α is to the zenith direction (i.e., α of 90 ), the higher the received signal strength reading. Furthermore, Figure 2 illustrates that the polynomial fit approximates the distribution reasonably well, and that the standard deviations of the look-up table suggest similar levels of uncertainty across all values of α. To offer additional insight, using the known UAV attitude, the calibration models are used to predict the received signal strength based on the known α for a single satellite, GPS Pseudorandom Noise Number (PRN) 6, as shown in Figure 3.
Figure 3 shows that both models do a good job of capturing the information of the reduction in signal strength as a function of attitude. This is due to the fact that over this timescale of a few minutes, only changes in the UAV attitude will change α, as e l . u k and R e , u k will remain more or less constant when considering the fact that the satellites are ≥20,000 km away and have an orbital period of 12 h. The result of Figure 3 would be the end product for authentication, if this information were used to detect the presence of spoof GPS signals. Note that the approach taken in the paper elected was to perform calibration offline, but for applications that have an Inertial Navigation System, this calibration could be performed online during the initial portion of a flight.

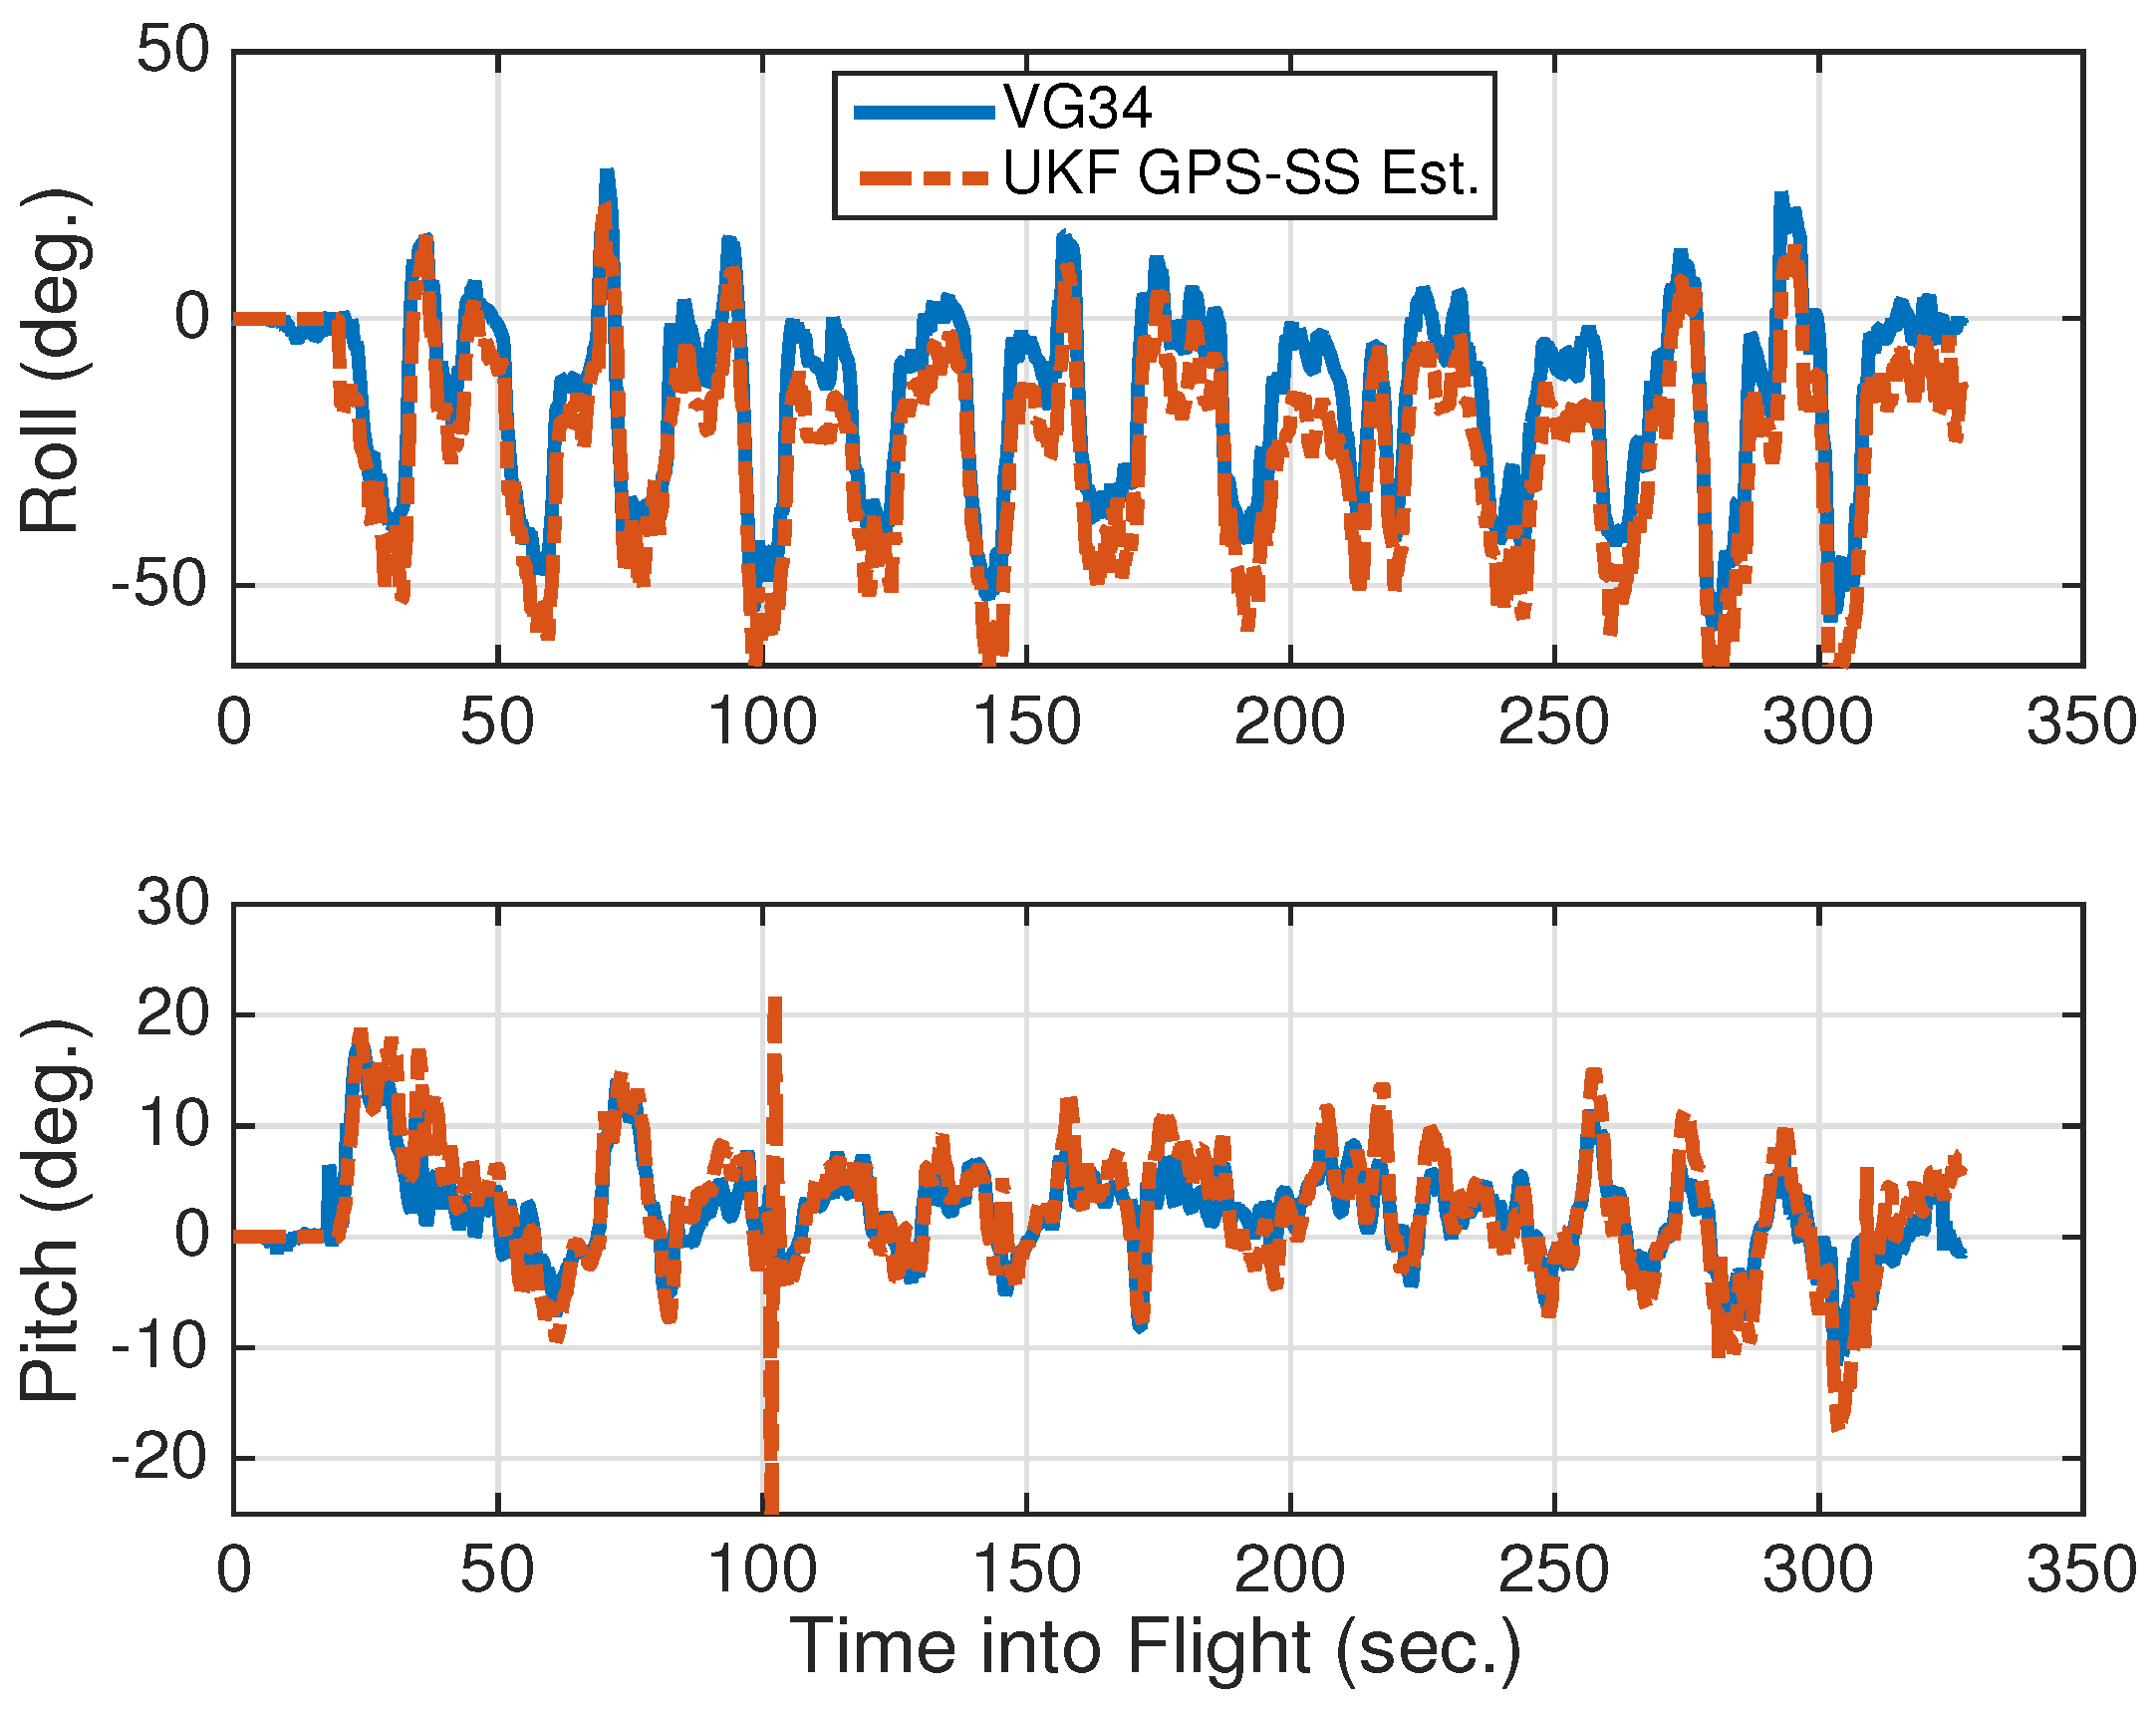
4.2. Attitude Estimation

Finally, using the calibration model for GPS signal strength as a function of α, the performance of an estimator’s ability to estimate UAV attitude based off of GPS signal strength is considered. In total, four processing strategies are considered. These include both calibration approaches with and without the use of elevation dependent observation weighting. For labeling the results figures and tables, these approaches are denoted as follows:
  • Poly-Flat: Using the polynomial model without elevation dependent weighting.
  • Poly-ElvDep: Using the polynomial model with elevation dependent weighting.
  • LUT-Flat: Using the look-up table model without elevation dependent weighting.
  • LUT-ElvDep: Using the look-up table model with elevation dependent weighting.
Table 1 lists the mean and standard deviation estimation errors over the entire flight test for the four approaches with respect to the Goodrich VG34® mechanical vertical gyroscope as a reference attitude.
As indicated in Table 1, attitude estimates with precision of better than 5° is obtainable using GPS information alone on a fixed-wing UAV. Pitch estimates are near zero mean, however a bias remains in the roll estimates. In addition, it is apparent that the use of elevation dependent weighting slightly increases the accuracy of the estimator. Furthermore, the higher fidelity of the look-up table calibration model approach yields slightly more accurate estimates, however, for roll, the polynomial approach yielded slightly smoother estimates. For reference, Figure 4 shows the estimates of polynomial calibration model with the use of elevation dependent weighing against the gyroscope reference values for pitch and roll angles.
While roll estimation is less accurate than pitch, it has no a priori information available from the GPS velocity vector, so this is expected. Furthermore, considering that the signal amplitude for roll is much large than for pitch (i.e., 60° for roll vs. 20 for pitch), the relative percentage errors are comparable.

5. Conclusions

This paper considered UAV attitude estimation based upon GPS signal strength measurements that are compensated for known losses. This has the benefit of GPS alone being used for a full position, velocity, attitude (PVA) state estimator. Alternatively, it could be incorporated into a navigation system to improve robustness, offer fault-tolerance, serve as a back-up solution, or assist in the detection of malicious GPS signal spoofing. The approach leverages the fact that abrupt changes in attitude will lead to loss or gain of signal strength depending on the relative orientation of a satellite’s location and the antenna bore-sight angle, but does not consider the impact of GPS signal strength changes that could be induced due to the local environment such as buildings, foliage, etc. Two calibration approaches were considered along with elevation dependent measurement weighting. The experimental UAV flight data analysis demonstrates that attitude estimates with a coarseness of around 5° are achievable using only GPS signal strength measurements. While the level of attitude estimation accuracy when using GPS information alone was determined to be coarse in comparison to other state of the art methods, this work assessed its standalone performance using fixed-wing UAV flight data with the motivation that this technique has the potential to be an important building block for incorporation within an GPS anti-spoofing defense or a fault-tolerant multi-sensor fusion navigation system. Future work will asses if the availability of additional signal strength observations from multi-constellation Global Navigation Satellite System (GNSS) can further reduce the roll estimation error.

Acknowledgments

This research was partially supported by the USA National Geospatial Intelligence Agency Academic Research Program (NARP) grant # HM0476-15-1-0004. Approved for public release case # 16-259.

Author Contributions

Jason Gross designed and implemented the attitude estimation strategies considered and performed the data analysis; Jason Gross and Yu Gu performed the UAV flight experiments and configured the data acquisition payload; Matthew Rhudy and Yu Gu consulted on the design of the attitude estimation strategies. All authors contributed to writing the paper.

Conflicts of Interest

The authors declare no conflict of interest.

Abbreviations

The following abbreviations are used in this manuscript:
ECEF
Earth Centered Earth Fixed
GLONASS
Globalnaya Navigazionnaya Sputnikovaya Sistema
GPS
Global Positioning System
GPS-MET
GPS Metrology Mission
IMU
Inertial Measurement Unit
PPS
Pulse Per Second
PVA
Position, Velocity, Attitude
SNR
Signal to Noise Ration
UAV
Unmanned Aerial Vehicle
UKF
Unscented Kalman Filter
VG34
Vertical Gyro Model Number 34
WVU
West Virginia University

References

  1. Kerns, A.J.; Shepard, D.P.; Bhatti, J.A.; Humphreys, T.E. Unmanned aircraft capture and control via GPS spoofing. J. Field Robot. 2014, 31, 617–636. [Google Scholar] [CrossRef]
  2. Petritoli, E.; Giagnacovo, T.; Leccese, F. Lightweight GNSS/IRS integrated navigation system for UAV vehicles. In Metrology for Aerospace (MetroAeroSpace); IEEE: Benevento, Italy, 2014; pp. 56–61. [Google Scholar]
  3. Gross, J.N.; Gu, Y.; Rhudy, M.B.; Gururajan, S.; Napolitano, M.R. Flight-test evaluation of sensor fusion algorithms for attitude estimation. IEEE Trans. Aerosp. Electron. Syst. 2012, 48, 2128–2139. [Google Scholar] [CrossRef]
  4. Petritoli, E.; Leccese, F. Improvement of altitude precision in indoor and urban canyon navigation for small flying vehicles. In Metrology for Aerospace (MetroAeroSpace); IEEE: Rome, Italy, 2015; pp. 56–60. [Google Scholar]
  5. Gu, Y.; Gross, J.N.; Rhudy, M.B.; Lassak, K. A Fault-Tolerant Multiple Sensor Fusion Approach Applied to UAV Attitude Estimation. Int. J. Aerosp. Eng. 2016, 2016, 6217428. [Google Scholar] [CrossRef]
  6. Axelrad, P.; Behre, C.P. Satellite attitude determination based on GPS signal-to-noise ratio. Proc. IEEE 1999, 87, 133–144. [Google Scholar] [CrossRef]
  7. Wang, C.; Walker, R.A.; Moody, M.P. An Improved Single Antenna Attitude System Based on GPS Signal Strength. In Proceedings of the AIAA Guidance, Navigation, and Control Conference and Exhibit, San Francisco, CA, USA, 15–18 August 2005.
  8. Lightsey, E.G.; Madsen, J. Three-axis attitude determination using global positioning system signal strength measurements. J. Guid. Control Dyn. 2003, 26, 304–310. [Google Scholar] [CrossRef]
  9. Ang, P.; Roth, N.; Bonin, G.; Zee, R.E. Global Navigation Satellite System Based Coarse Attitude Determination on Small Satellites. In Proceedings of the 29th Annual AIAA/USU Conference on Small Satellites, Technical Session X: Advanced Technologies II, SSC15-X-5, Logan, UT, USA, 8–13 August 2015.
  10. Misra, P.; Enge, P. Global Positioning System: Signals, Measurements and Performance Second Edition; Ganga-Jamuna Press: Lincoln, MA, USA, 2006. [Google Scholar]
  11. Stevens, B.L.; Lewis, F.L. Aircraft Control and Simulation; John Wiley & Sons: Hoboken, NJ, USA, 2003. [Google Scholar]
  12. Joseph, A. GNSS Solutions: Measuring GNSS Signal Strength. Inside GNSS Eng. Solut. Glob. Navig. Satell. Syst. Community 2010, 5, 20–25. [Google Scholar]
  13. Julier, S.J.; Uhlmann, J.K. New extension of the Kalman filter to nonlinear systems. Proc. SPIE 1997, 3068. [Google Scholar] [CrossRef]
  14. Wan, E.A.; van der Merwe, R. The unscented Kalman filter for nonlinear estimation. In Proceedings of the Adaptive Systems for Signal Processing, Communications, and Control Symposium 2000. AS-SPCC. The IEEE 2000, 1–4 October 2000; Lake Louise, AB, Canada; pp. 153–158.
  15. Simon, D. Optimal State Estimation: Kalman, H Infinity, and Nonlinear Approaches; John Wiley & Sons: Hoboken, NJ, USA, 2006. [Google Scholar]
  16. Crassidis, J.L.; Junkins, J.L. Optimal Estimation of Dynamic Systems; CRC Press: Boca Raton, FL, USA, 2011. [Google Scholar]
  17. Rhudy, M.B.; Gu, Y.; Chao, H.; Gross, J.N. Unmanned Aerial Vehicle Navigation Using Wide-Field Optical Flow and Inertial Sensors. J. Robot. 2015, 501, 251379. [Google Scholar] [CrossRef]
  18. Rhudy, M.; Gross, J.; Gu, Y.; Napolitano, M.R. Fusion of GPS and redundant IMU data for attitude estimation. In Proceedings of the AIAA Guidance, Navigation, and Control Conference, Minneapolis, MN, USA, 13–16 August 2012.
  19. Gross, J.N. Sensor Fusion Based Fault-Tolerant Attitude Estimation Solutions for Small Unmanned Aerial Vehicles. Ph.D. Thesis, West Virginia University, 2011. [Google Scholar]
  20. Gu, Y.; Gross, J.; Barchesky, F.; Chao, H.; Napolitano, M. Avionic Design for a Sub-Scale Fault Tolerant Flight Control Test-Bed. In Recent Advances in Aircraft Technology; Agarwal, R., Ed.; InTech: Rijeka, Croatia, 2012; pp. 499–522. [Google Scholar]
Figure 1. West Virginia University’s Red Phastball research unmanned aerial vehicle (UAV).
Aerospace 03 00014 g001
Figure 2. Empirical curve and calibration curves determined for mapping global positioning system (GPS) signal strength measurements to the antenna bore-sight angle, α.
Aerospace 03 00014 g002
Figure 3. Example of calibration model for GPS PRN 6, which is at an elevation angle of 40° during this UAV flight.
Aerospace 03 00014 g003
Figure 4. Comparison of GPS signal strength based attitude estimate and mechanical gyroscope measurements. Note that pitch and roll are plotted on different scales.
Aerospace 03 00014 g004
Table 1. Mean and standard deviation attitude estimation performance of the GPS signal strength based attitude estimates.
StrategyRollPitch
μ  (°) σ  (°) μ  (°)σ (°)
Poly-Flat–10.45.62.64.1
Poly-ElvDep–9.34.30.53.0
LUT-Flat–8.27.6–0.33.2
LUT-ElvDep–7.07.3–1.12.7

