


State-of-Charge Estimation of Batteries for Hybrid Urban Air Mobility

Abstract
:1. Introduction
2. Prior Studies on Model-Based State Estimation

| Ref. | Battery Model | State Estimator | Test Profile | Range of SOC [%] | Amount of Bias [mA] | Notes |
|---|---|---|---|---|---|---|
| [5] | Thevenin | AEKF, AUKF, PF | - | 30–50 | - | Adaptive EKF, Adaptive UKF |
| [8] | Thevenin | KF, EKF | - | 0–100 | 1000 | |
| [9] | Thevenin | EKF, UKF | FUDS, Artemis | 50~90 | 100 | |
| [10] | Thevenin | KF, EKF, DEKF | - | 40~100 | 12.5, 25 | Dual EKF |
| [11] | Thevenin | EKF, DEKF | UDDS, NYCC, BCDC | 10~100 | 10, 20 | |
| [12] | Thevenin | AEKF | UDDS, HWFET, SFTP, NYCC, LA92 (combined) | 0–100 | 113.5 | Adaptive EKF |
| [13] | ESC | UKF | - | - | 500 | |
| [14] | Combined, Simple, Hysteresis, ESC | EKF | UDDS | 10~90 | - | |
| [15] | Rint, RC, Thevenin, PNGV | EKF | HPPC, DST, FUDS | 20~100 | - | |
| [16] | Thevenin, ESC | EKF, SVSF | UDDS | 10~100 | - | Smooth variable structure filter |
| [17] | Thevenin | EKF, UKF, ASRUKF | Constant, Pulse, DST | 40~100 | - | Adaptive square root UKF |
| [18] | Thevenin | LPVS | Asymmetrical pulse | 10~90 | - | Linear parameter varying system |
| [19] | PNGV | EKF | HPPC | 10~80 | - | |
| [20] | PNGV | AEKF | HPPC | - | - | Adaptive EKF |
| [21] | ESC | EKF, MMAE, MMAE + EKF | Constant | 0~100 | - | Multiple model adaptive estimation |
| [22] | RC | SMO | Random current | 0~100 | - | |
| [23] | Thevenin | KF | Random current | 10~100 | - | |
| [24] | Thevenin | KF, EKF | Constant | 10~100 | - | |
| [25] | Thevenin | EKF, AUKF | UDDS, FTP, HWFET, NEDC, NYCC | 0~100 | - | Adaptive UKF |
| [26] | Thevenin | HEKF | DST, NEDC, FUDS | 10~100 | - | H-infinity UKF |
| [27] | RC | ALO | FUDS | 10~90 | - | Adaptive LO |
| [28] | Thevenin | PF | Pulse | 10~100 | - | |
| [29] | RC, Thevenin | AGSMO | UDDS | 50~100 | - | Adaptive gain SMO |
3. LIB Cell Testing
3.1. Test Profile
3.2. Experiment Setup
3.3. Test Data
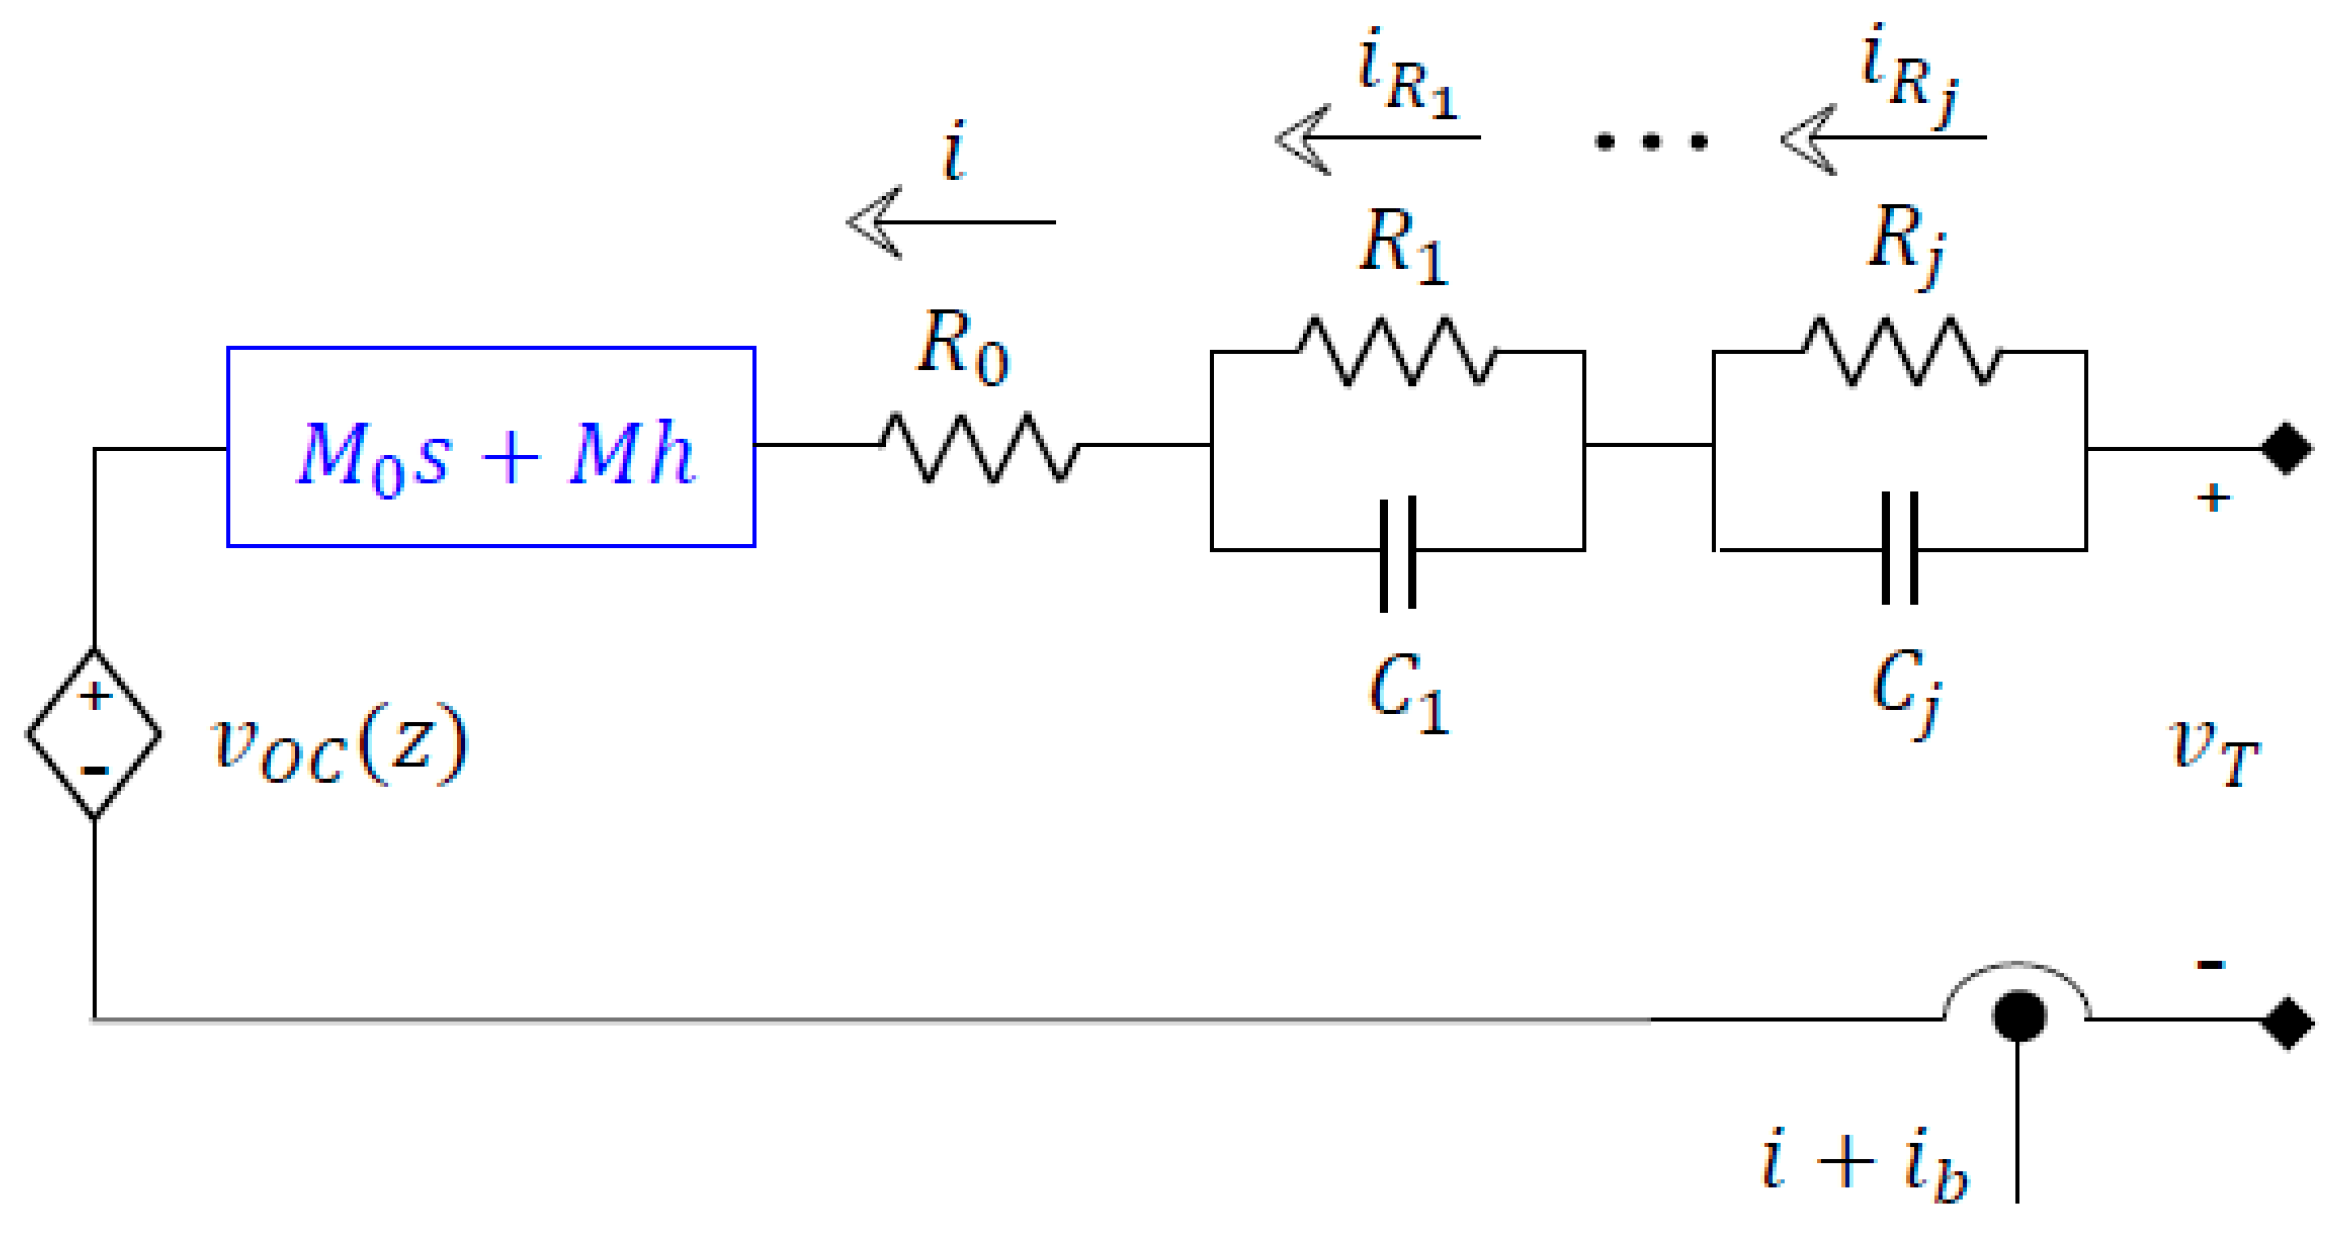
4. Framework for Model-Based State Estimation
5. Results
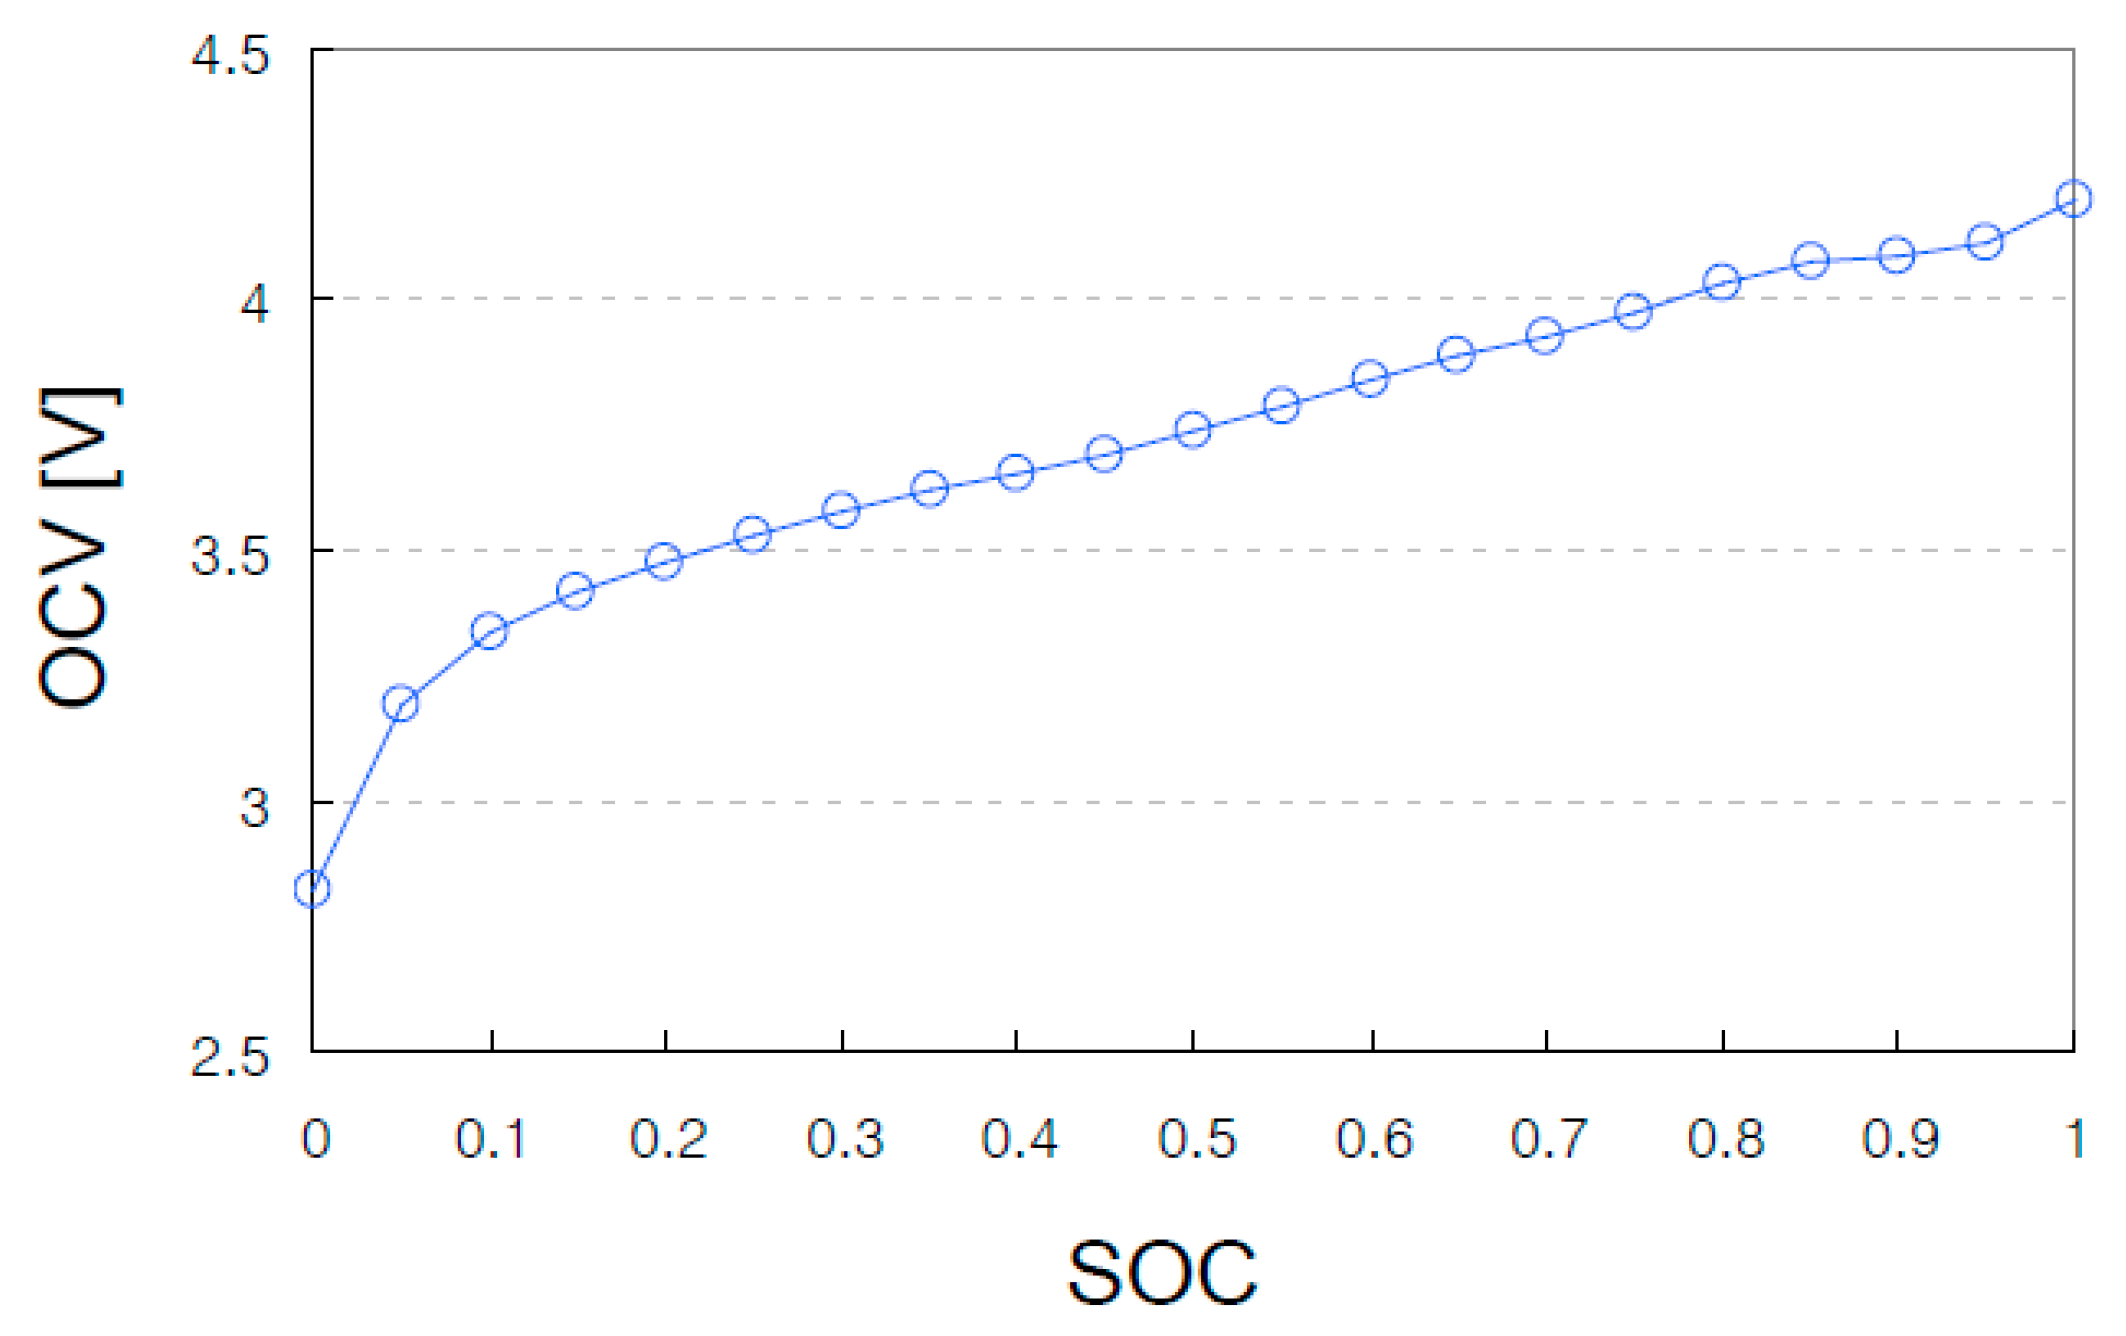
5.1. Model Parameters Identification
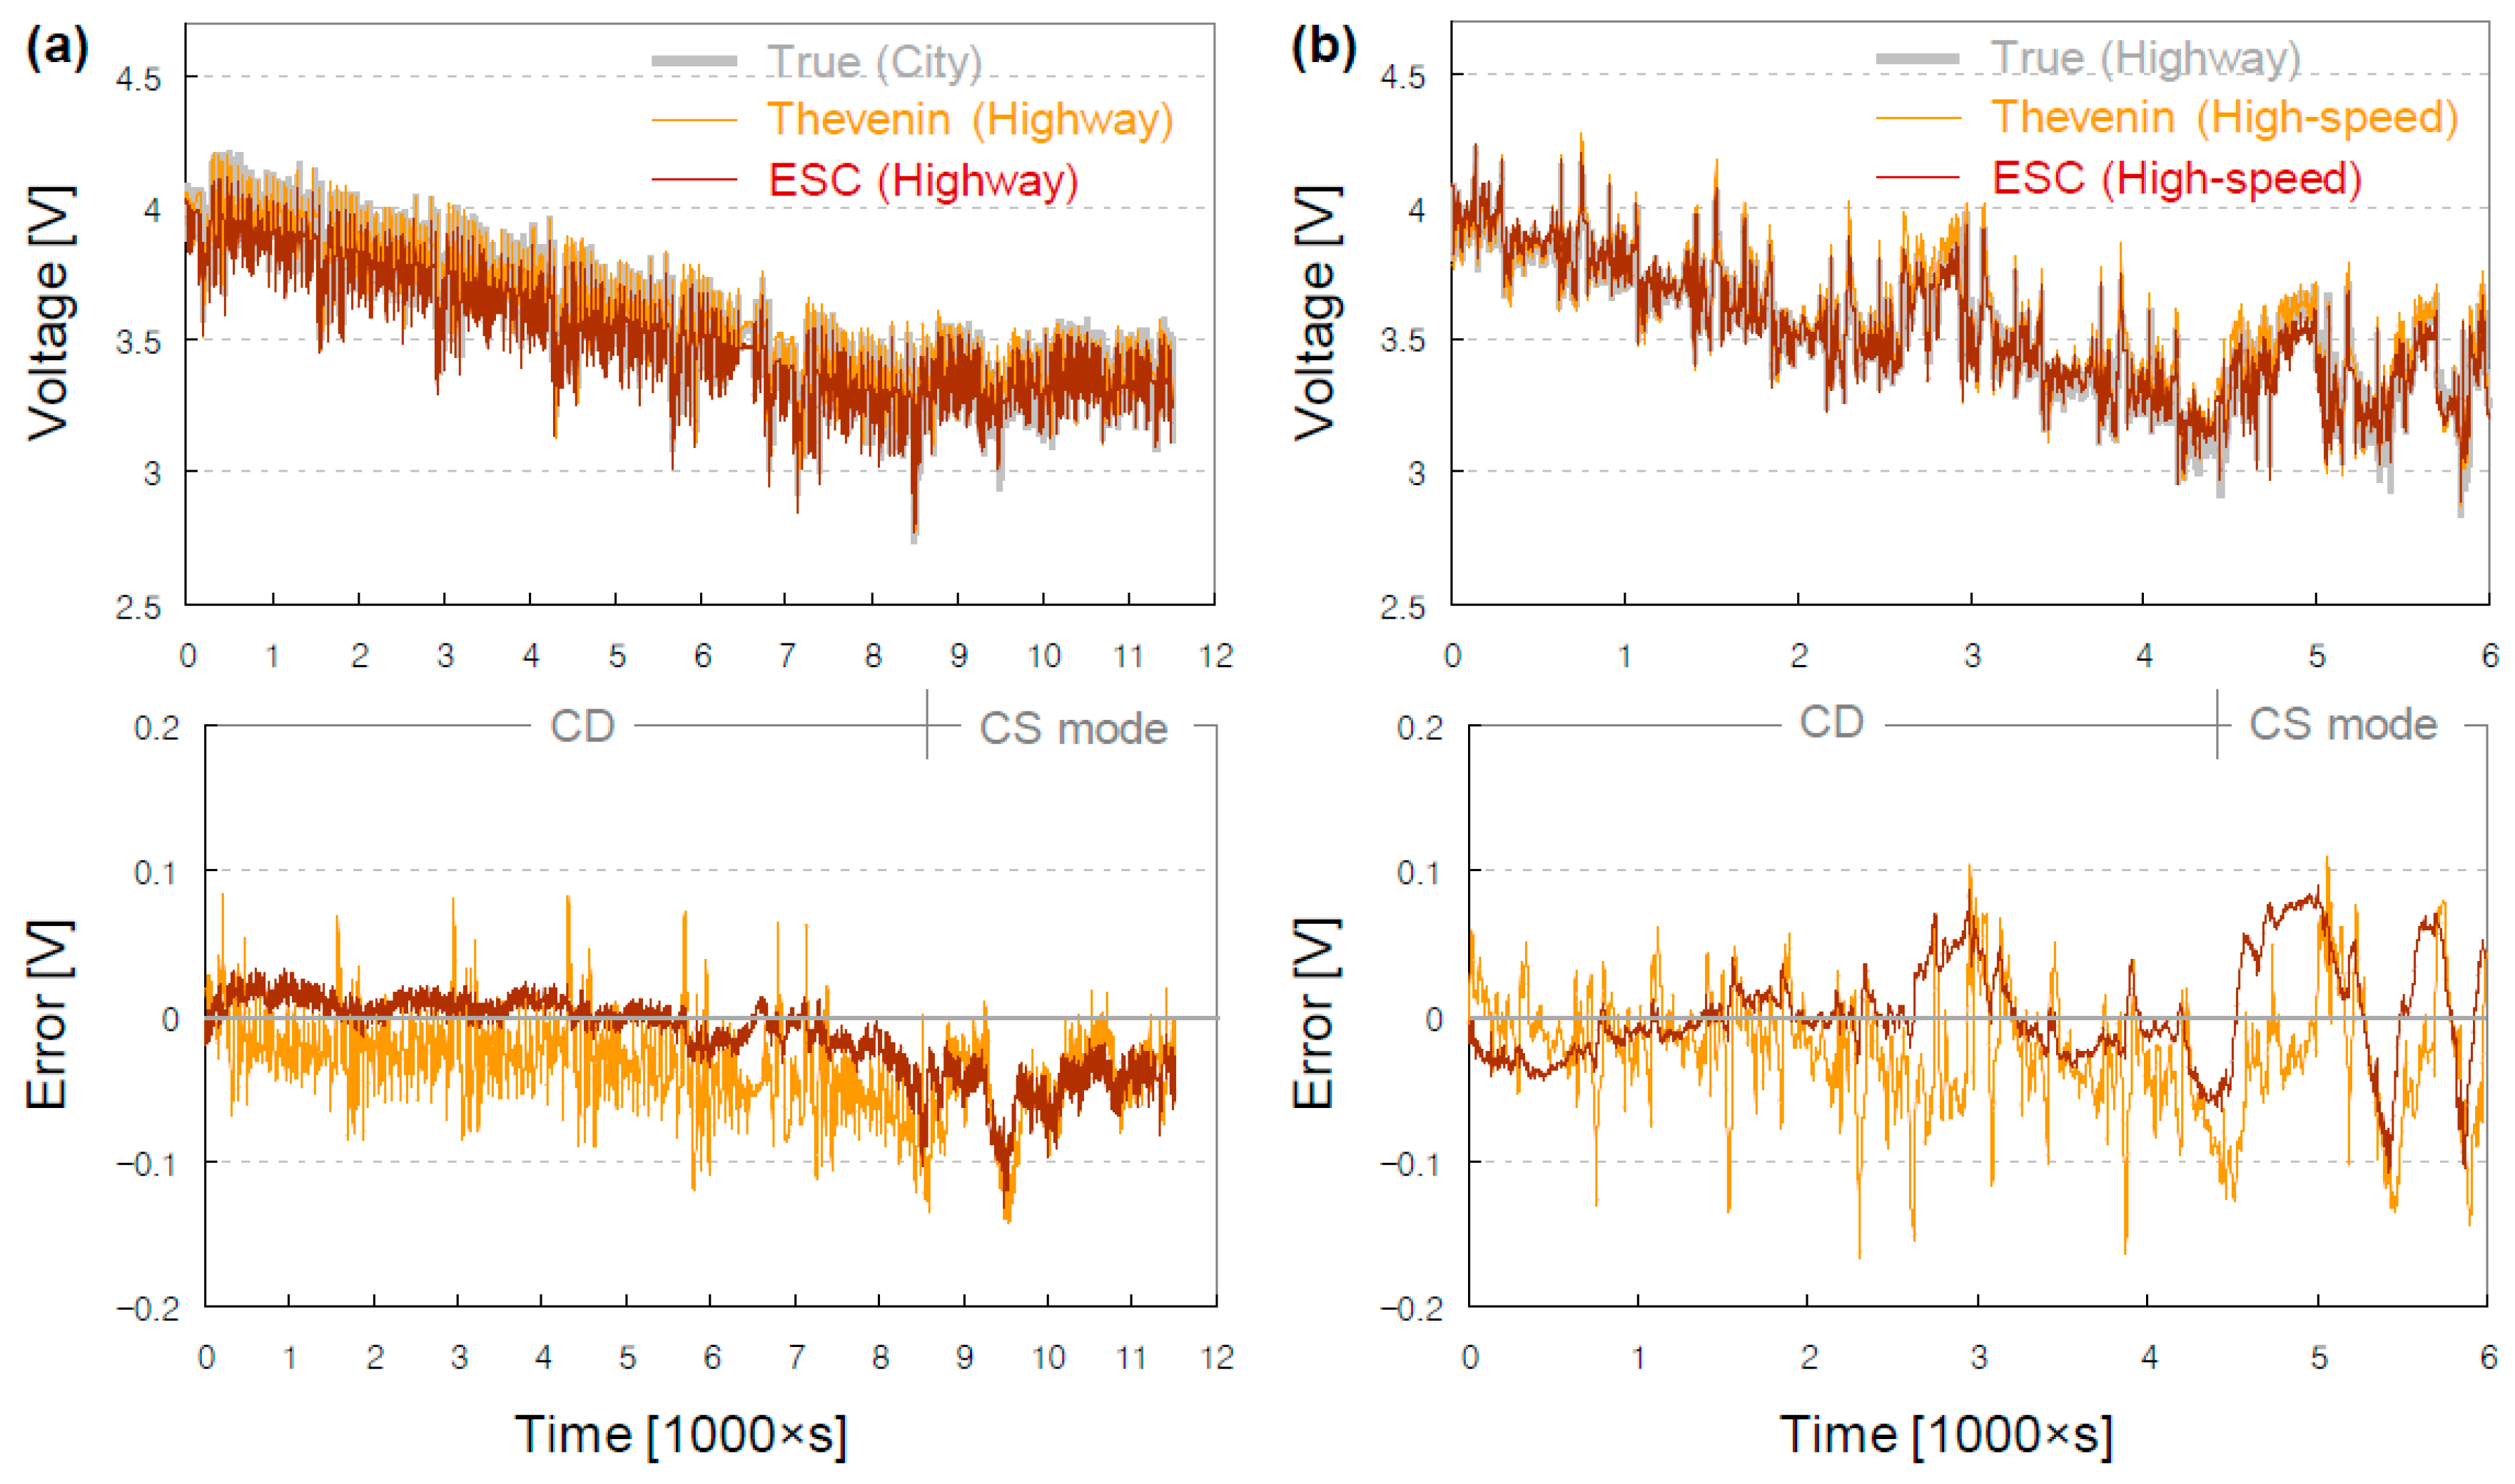
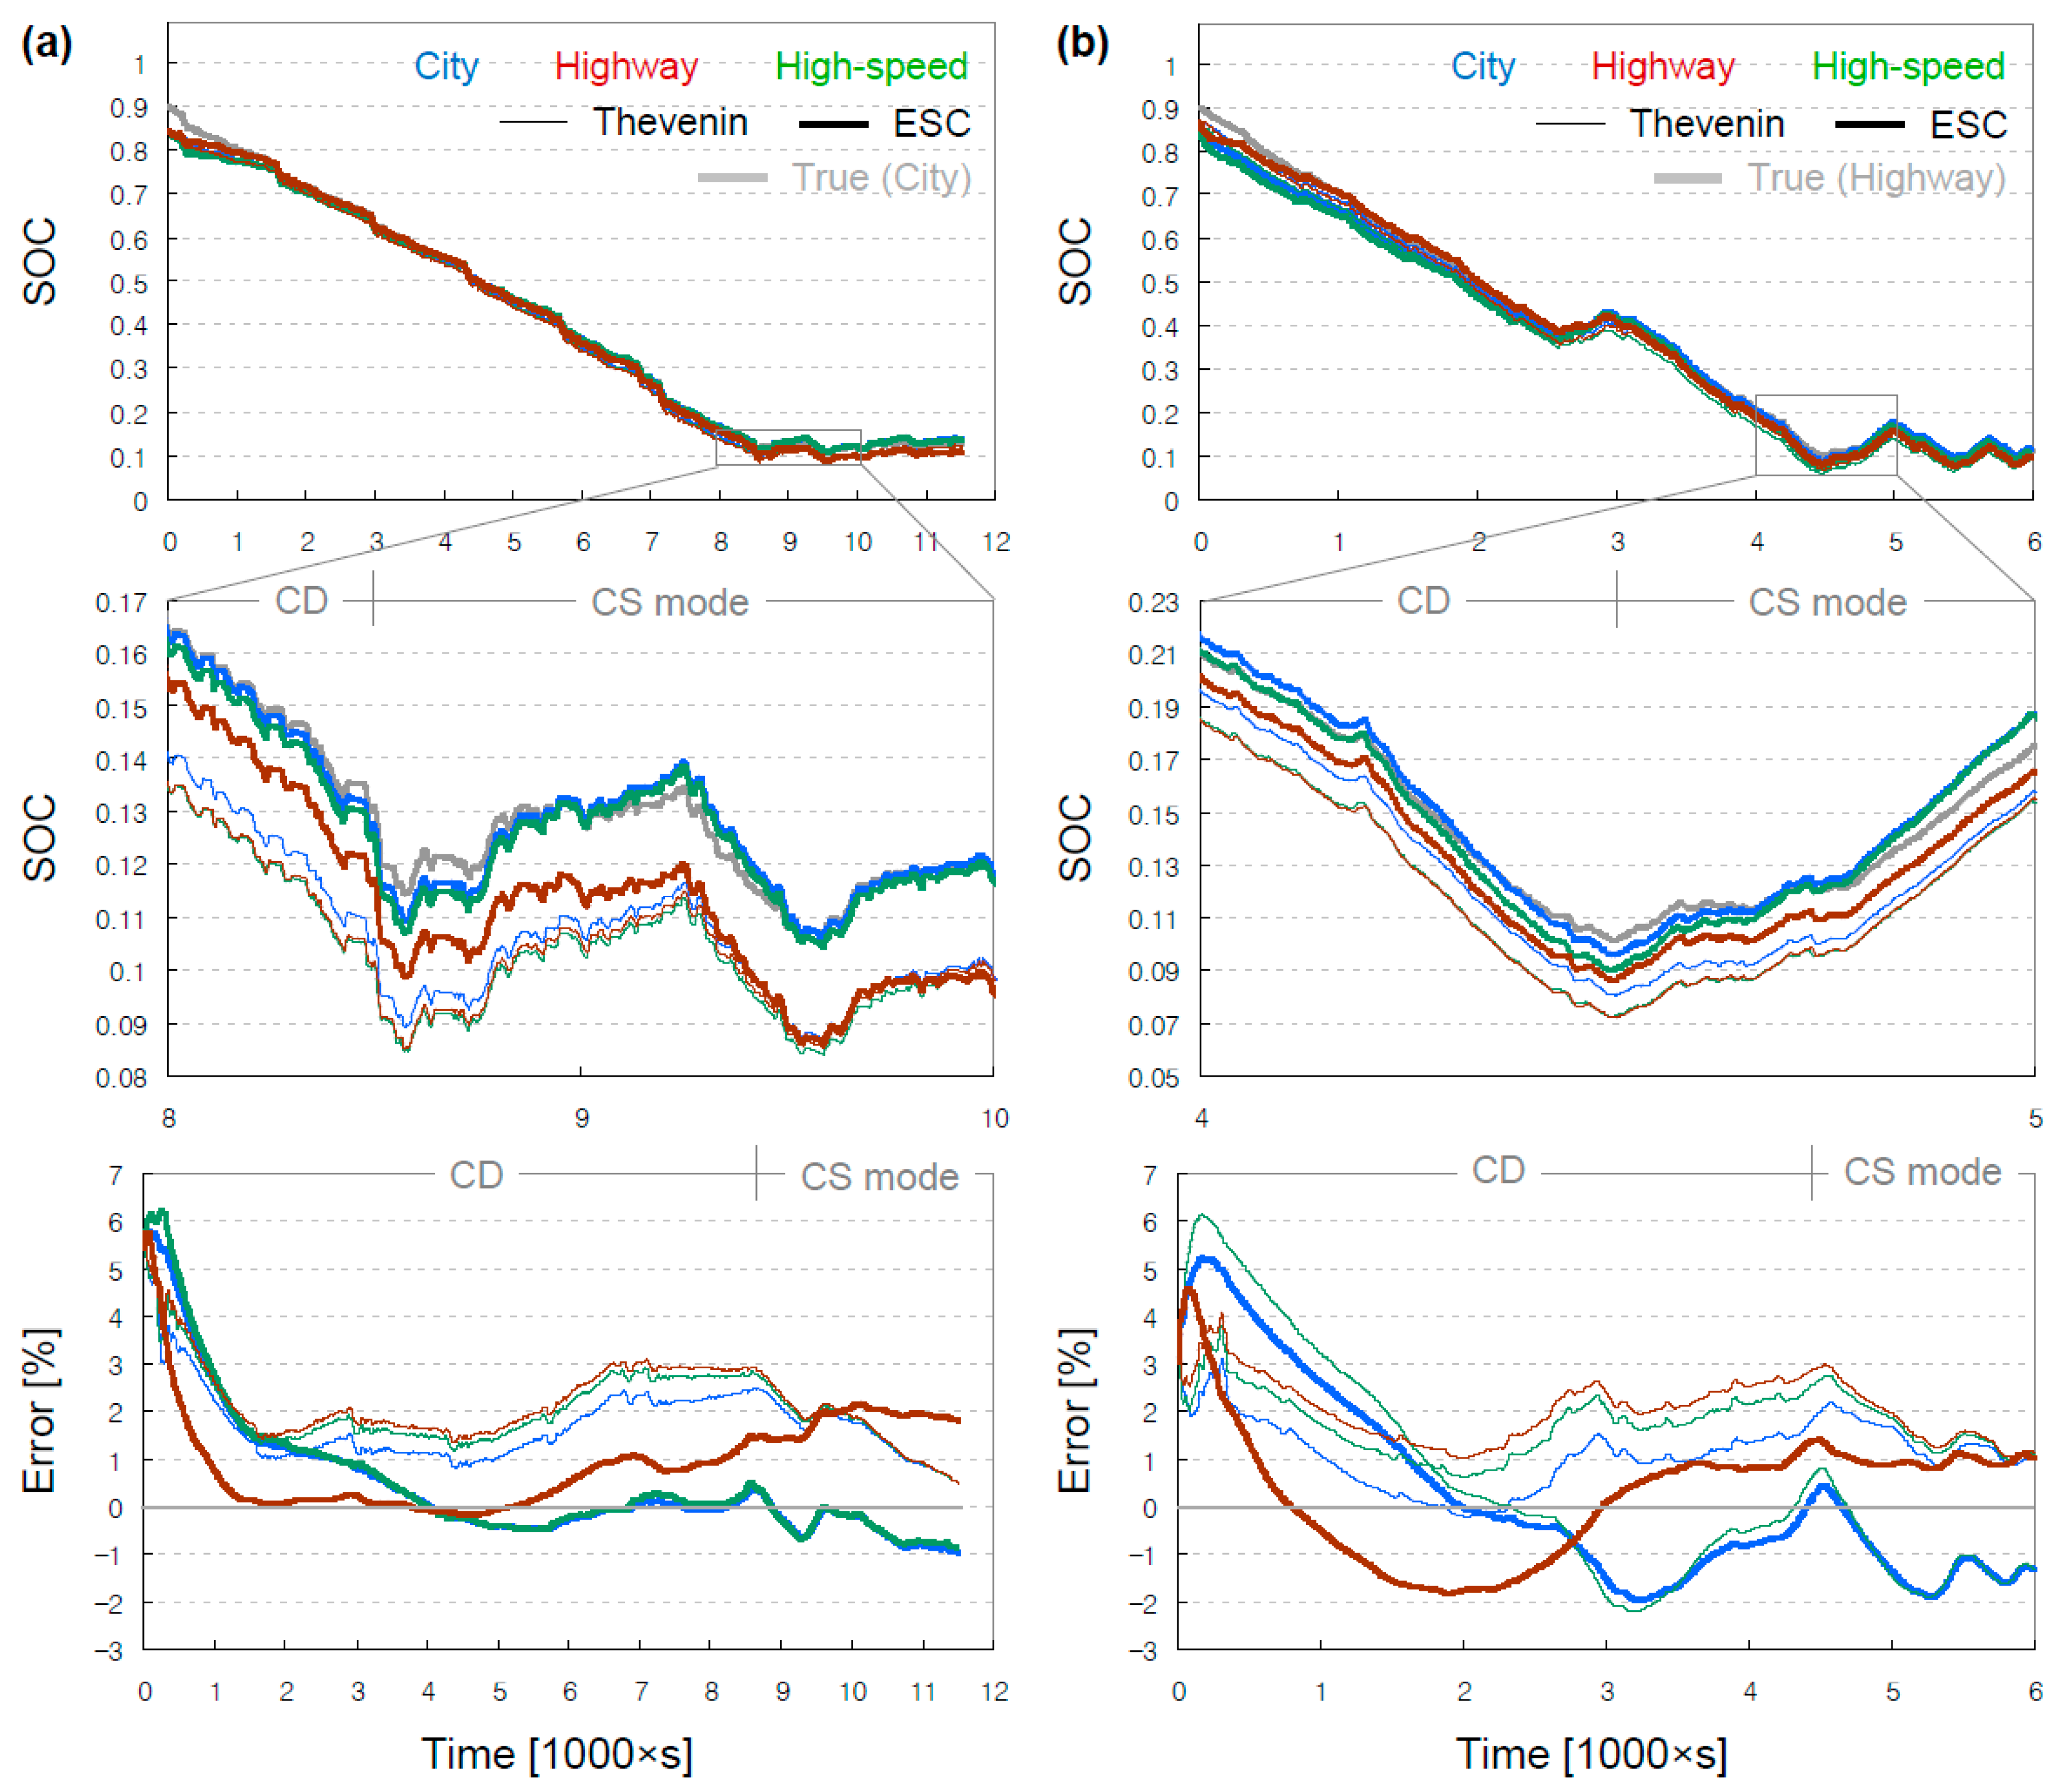
5.2. SOC Estimation
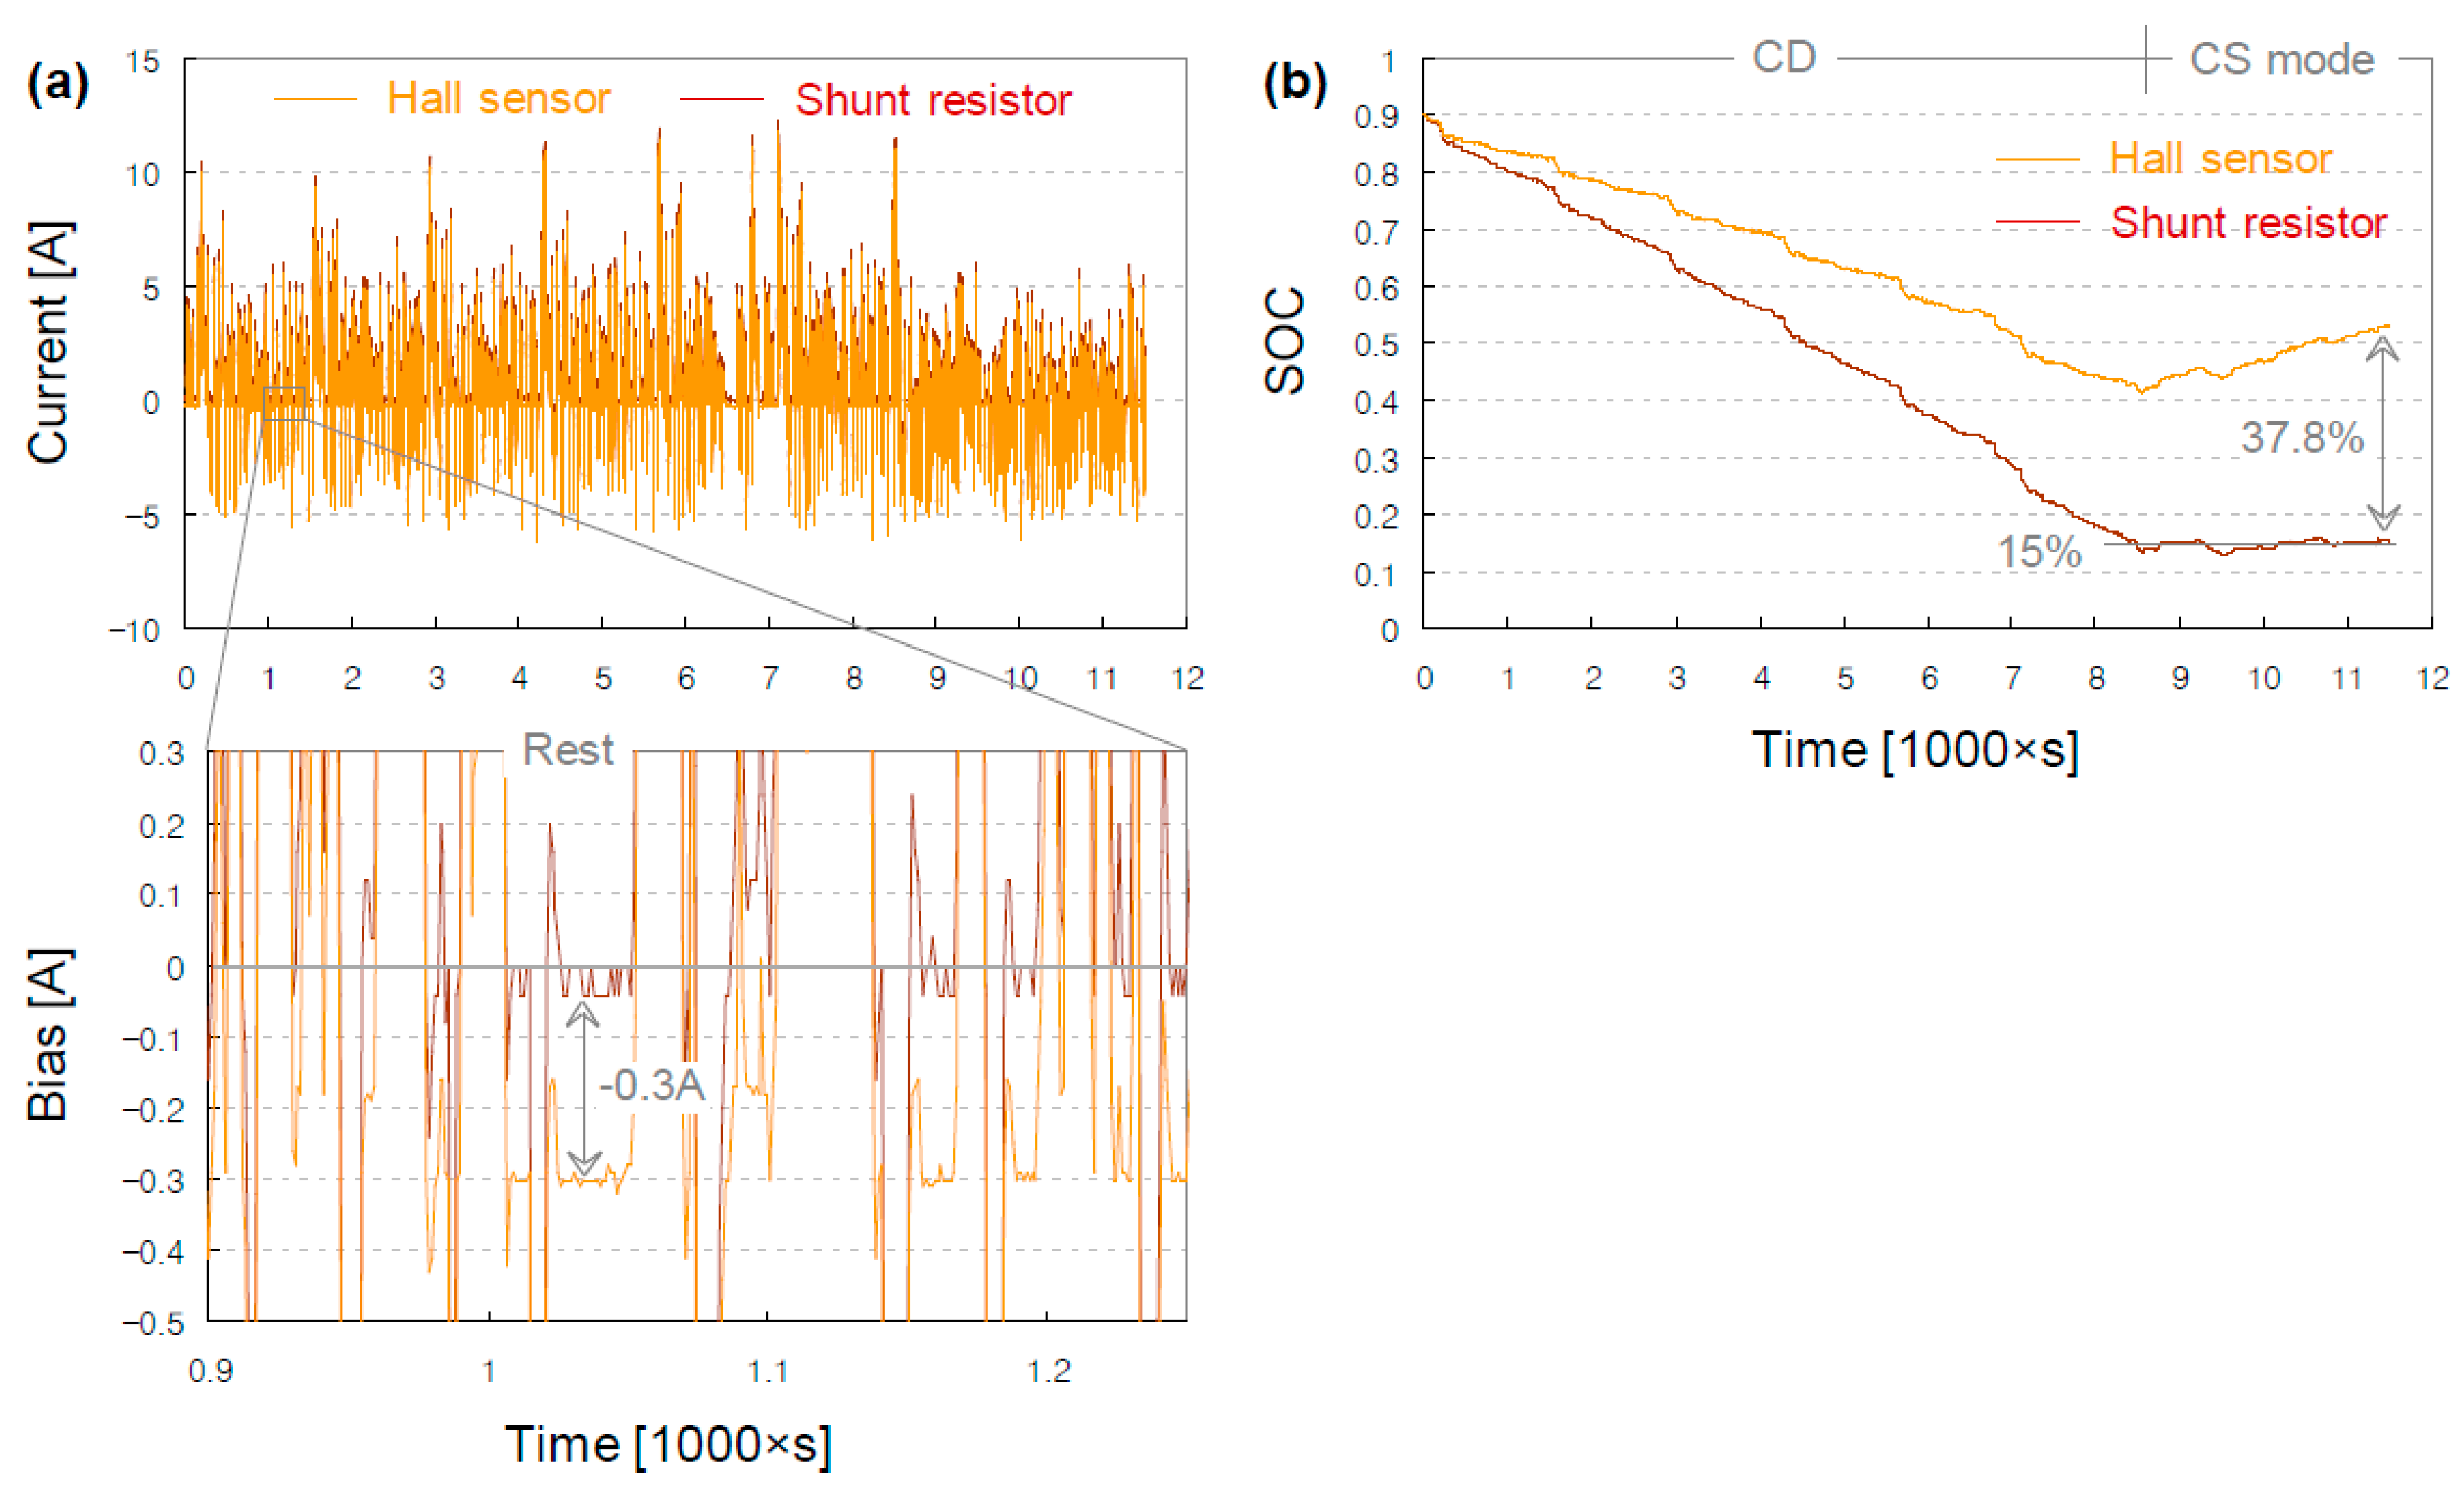
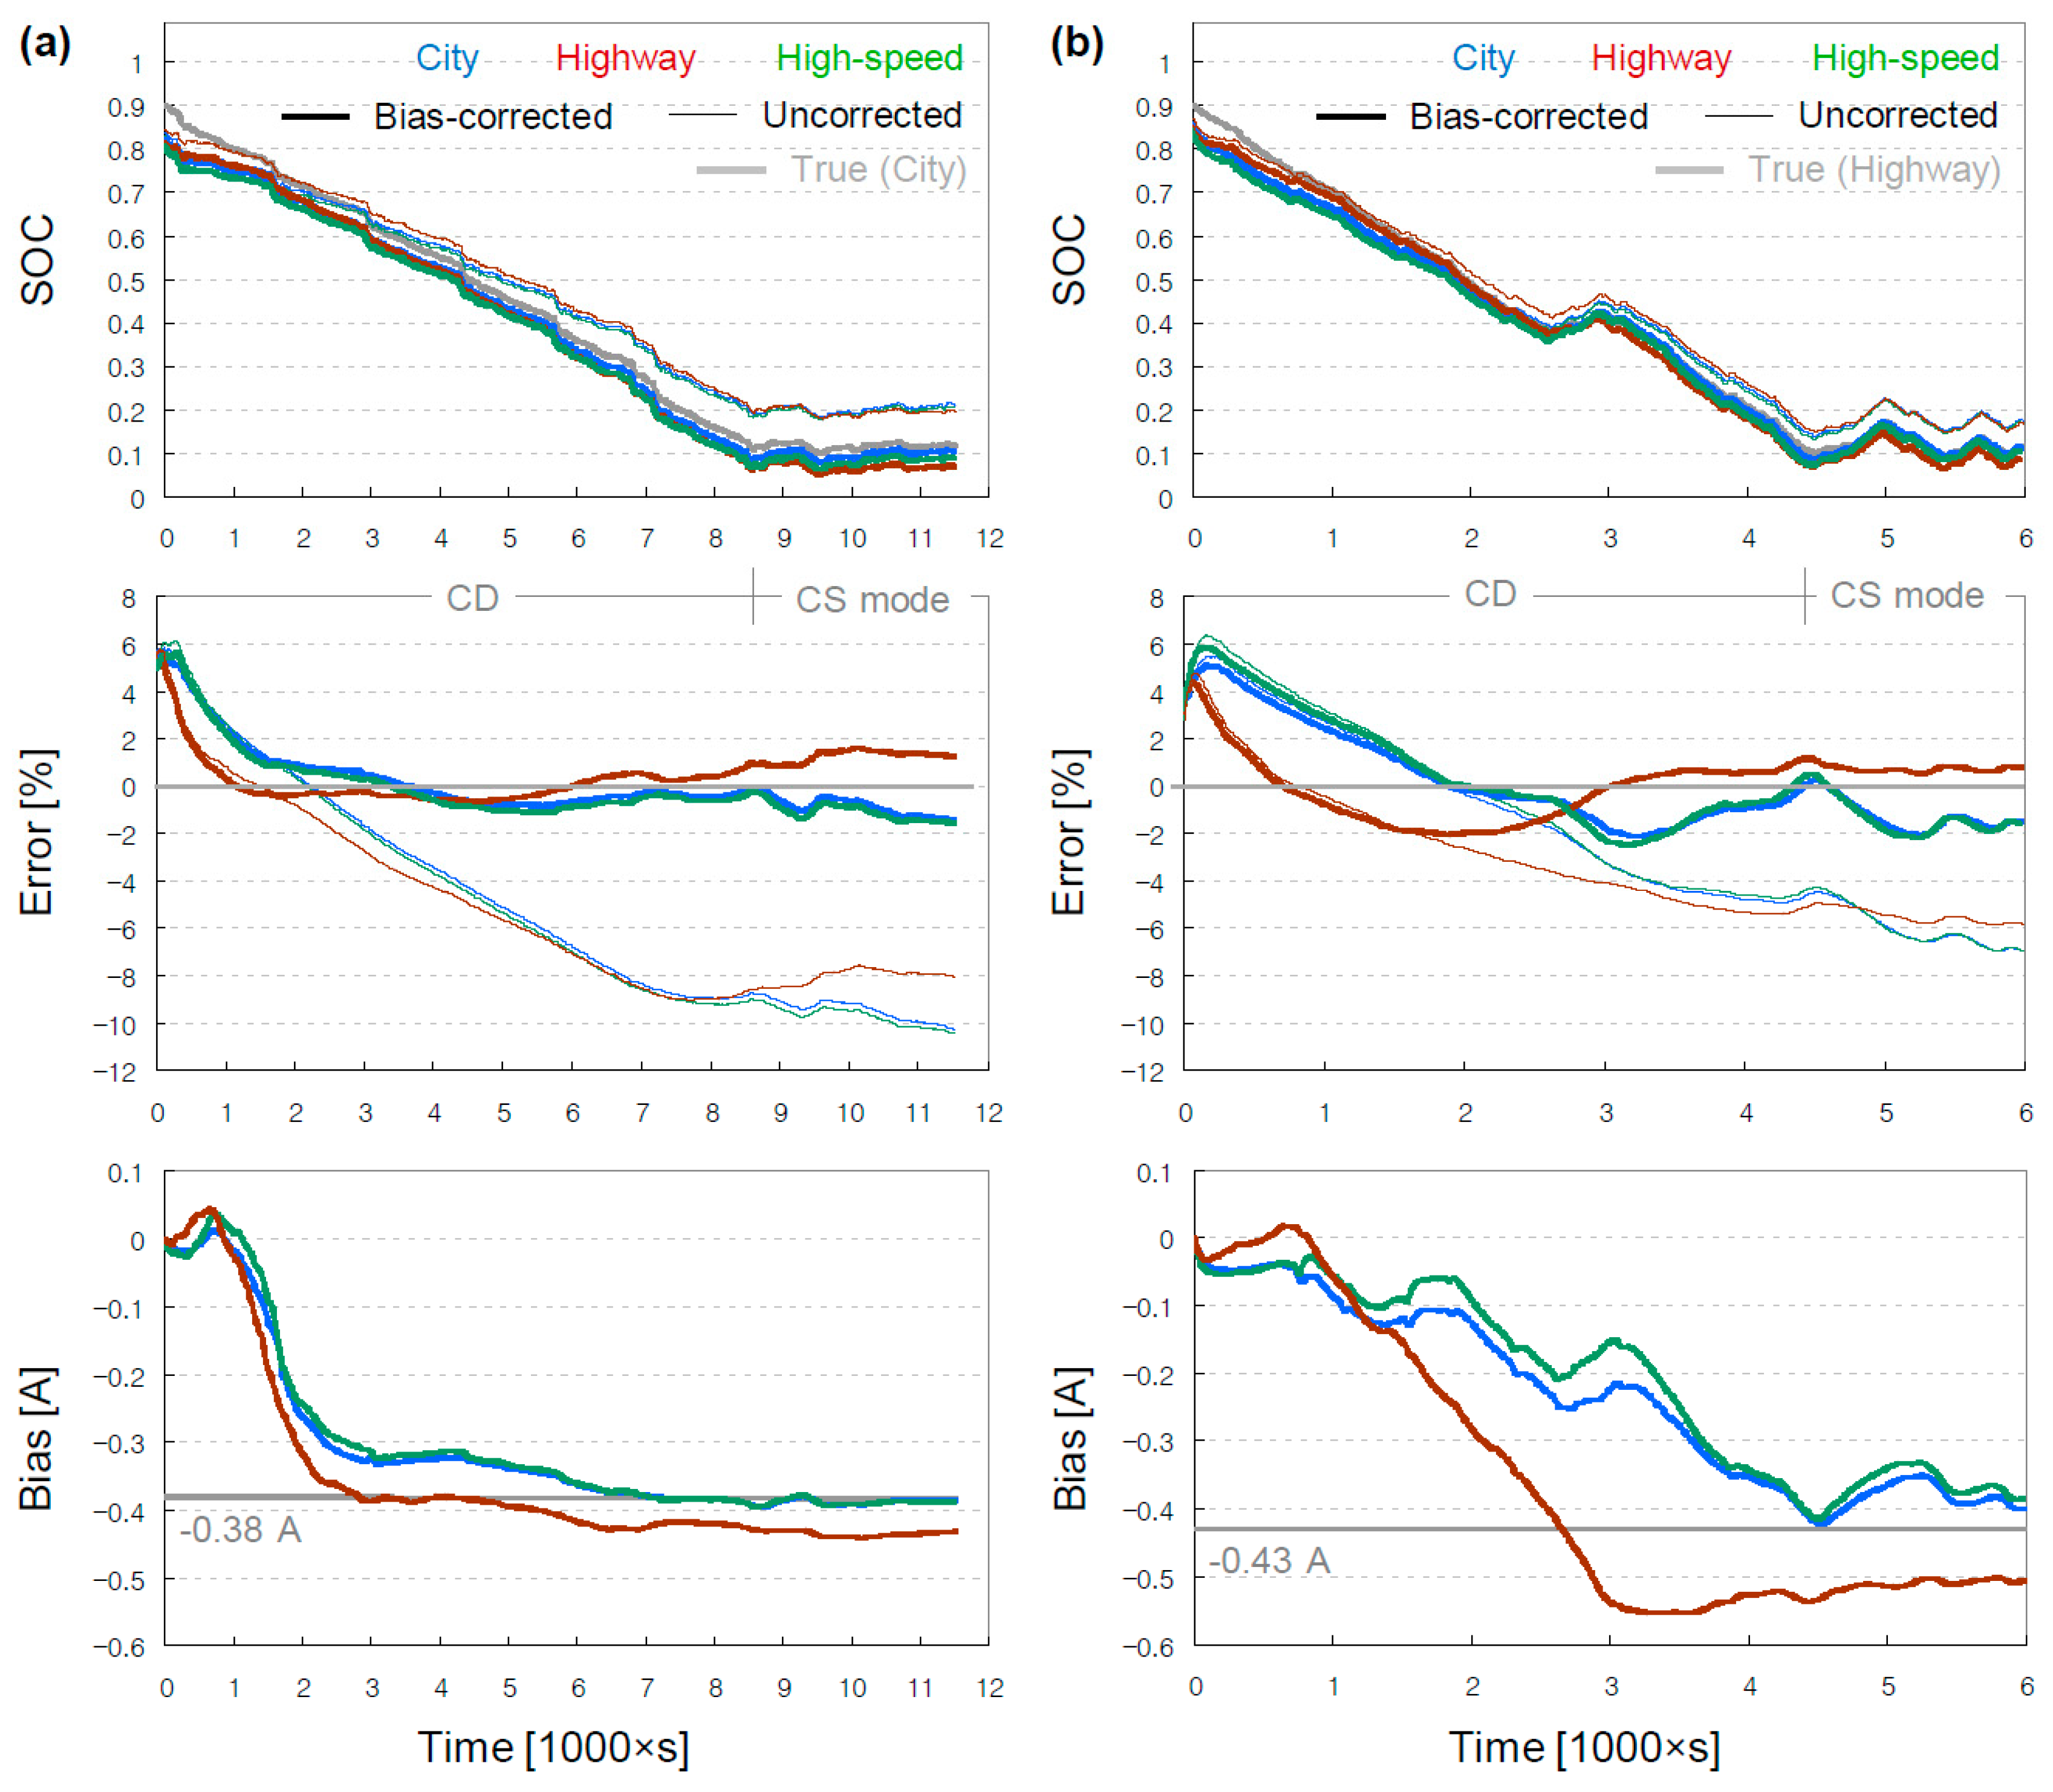
5.3. Current Sensor Bias Correction
6. Conclusions
Author Contributions
Funding
Conflicts of Interest
Appendix A
References
- Ding, Y.; Cano, Z.P.; Yu, A.; Lu, J.; Chen, Z. Automotive Li-ion batteries: Current status and future perspectives. Electrochem. Energy Rev. 2019, 2, 1–28. [Google Scholar] [CrossRef]
- Mauler, L.; Duffner, F.; Zeier, W.G.; Leker, J. Battery cost forecasting: A review of methods and results with an outlook to 2050. Energy Environ. Sci. 2021, 14, 4712–4739. [Google Scholar] [CrossRef]
- EASA Certifies Electric Aircraft, First Type Certification for Fully Electric Plane World-Wide. Available online: https://www.easa.europa.eu/newsroom-and-events/press-releases/easa-certifies-electric-aircraft-first-type-certification-fully (accessed on 20 February 2023).
- Batteries Systems and BMS. Available online: https://www.pipistrel-aircraft.com/products/other-products/batteries-systems-and-bms (accessed on 20 February 2023).
- Mansour, I.; Frisk, E.; Jemni, A.; Krysander, M.; Liouane, N. State of charge estimation accuracy in charge sustainable mode of hybrid electric vehicles. IFAC-Pap. 2017, 50, 2158–2163. [Google Scholar] [CrossRef]
- Zhang, S.; Zhang, J. Optimal state-of-charge value for charge-sustaining mode of plug-in hybrid electric vehicles. IEEE Access 2020, 8, 187959–187964. [Google Scholar] [CrossRef]
- Sohn, J.; Sunwoo, M.; Min, K.; Shin, J.; Han, M. Power management strategy for the 48 V mild hybrid electric vehicle based on the charge-sustaining control. Int. J. Automot. Technol. 2019, 20, 37–49. [Google Scholar] [CrossRef]
- Malysz, P.; Gu, R.; Ye, J.; Yang, H.; Emadi, A. State-of-charge and state-of-health estimation with state constraints and current sensor bias correction for electrified powertrain vehicle batteries. IET Electr. Syst. Transp. 2016, 6, 136–144. [Google Scholar] [CrossRef]
- Zhao, S.; Duncan, S.R.; Howey, D.A. Observability analysis and state estimation of lithium-ion batteries in the presence of sensor biases. IEEE Trans. Control Syst. Technol. 2016, 25, 326–333. [Google Scholar] [CrossRef] [Green Version]
- Al-Gabalawy, M.; Hosny, N.S.; Dawson, J.A.; Omar, A.I. State of charge estimation of a Li-ion battery based on extended Kalman filtering and sensor bias. Int. J. Energy Res. 2021, 45, 6708–6726. [Google Scholar] [CrossRef]
- Bhattacharyya, H.S.; Choudhury, A.B.; Chanda, C.K. On-road estimation of state of charge of lithium-ion battery by extended and dual extended Kalman filter considering sensor bias. Int. J. Energy Res. 2022, 46, 15182–15197. [Google Scholar] [CrossRef]
- He, J.; Feng, D.; Hu, C.; Wei, Z.; Yan, F. Two-layer online state-of-charge estimation of lithium-ion battery with current sensor bias correction. Int. J. Energy Res. 2019, 43, 3837–3852. [Google Scholar] [CrossRef]
- Nguyen Van, C.; Nguyen Vinh, T. SOC estimation of the lithium-ion battery pack using a sigma point Kalman filter based on a cell’s second order dynamic model. Appl. Sci. 2020, 10, 1896–1912. [Google Scholar] [CrossRef] [Green Version]
- Plett, G.L. Extended Kalman filtering for battery management systems of LiPB-based HEV battery packs: Part 3. State and parameter estimation. J. Power Sources 2004, 134, 277–292. [Google Scholar] [CrossRef]
- He, H.; Xiong, R.; Fan, J. Evaluation of lithium-ion battery equivalent circuit models for state of charge estimation by an experimental approach. Energies 2011, 4, 582–598. [Google Scholar] [CrossRef]
- Farag, M.; Fleckenstein, M.; Habibi, S.R. Li-ion battery SOC estimation using non-linear estimation strategies based on equivalent circuit models. SAE Int. 2014, 1, 1–11. [Google Scholar]
- Kai, W.; Xiao, F.; Jinbo, P.; Jun, R.; Chongxiong, D.; Liwei, L. State of charge (SOC) estimation of lithium-ion battery based on adaptive square root unscented kalman filter. Int. J. Electrochem. Sci. 2020, 15, 9499–9516. [Google Scholar] [CrossRef]
- Hu, Y.; Yurkovich, S. Battery cell state-of-charge estimation using linear parameter varying system techniques. J. Power Sources 2012, 198, 338–350. [Google Scholar] [CrossRef]
- Huang, Z.; Fang, Y.; Xu, J. Soc estimation of li-ion battery based on improved ekf algorithm. Int. J. Automot. Technol. 2021, 22, 335–340. [Google Scholar] [CrossRef]
- Guo, Y.; Zhao, Z.; Huang, L. SoC estimation of lithium battery based on AEKF algorithm. Energy Procedia 2017, 105, 4146–4152. [Google Scholar] [CrossRef]
- Su, J.; Strandt, A.; Schneider, S.; Yaz, E.; Josse, F. Improved State of Charge Estimation of Lithium-ion Battery cells. In Proceedings of the 2021 European Control Conference (ECC), Virtual Conference, 29 June–2 July 2021. [Google Scholar]
- Kim, D.; Koo, K.; Jeong, J.J.; Goh, T.; Kim, S.W. Second-order discrete-time sliding mode observer for state of charge determination based on a dynamic resistance li-ion battery model. Energies 2013, 6, 5538–5551. [Google Scholar] [CrossRef] [Green Version]
- Spagnol, P.; Rossi, S.; Savaresi, S.M. Kalman filter SoC estimation for Li-ion batteries. In Proceedings of the 2011 IEEE International Conference on Control Applications (CCA), Denver, CO, USA, 28–30 September 2011. [Google Scholar]
- Lin, X. Analytic derivation of battery SOC estimation error under sensor noises. IFAC-Pap. 2017, 50, 2175–2180. [Google Scholar] [CrossRef]
- Meng, J.; Stroe, D.I.; Ricco, M.; Luo, G.; Teodorescu, R. A simplified model-based state-of-charge estimation approach for lithium-ion battery with dynamic linear model. IEEE Trans. Ind. Electron 2018, 66, 7717–7727. [Google Scholar] [CrossRef] [Green Version]
- Zhao, L.; Liu, Z.; Ji, G. Lithium-ion battery state of charge estimation with model parameters adaptation using H∞ extended Kalman filter. Control Eng. Pract. 2018, 81, 114–128. [Google Scholar] [CrossRef]
- Hu, X.; Sun, F.; Zou, Y. Estimation of state of charge of a lithium-ion battery pack for electric vehicles using an adaptive Luenberger observer. Energies 2010, 3, 1586–1603. [Google Scholar] [CrossRef]
- Jiani, D.; Youyi, W.; Changyun, W. Li-ion battery SOC estimation using particle filter based on an equivalent circuit model. In Proceedings of the 2013 10th IEEE International Conference on Control and Automation (ICCA), Hangzhou, China, 12–14 June 2013. [Google Scholar]
- Koirala, N.; He, F.; Shen, W. Comparison of two battery equivalent circuit models for state of charge estimation in electric vehicles. In Proceedings of the 2015 IEEE 10th Conference on Industrial Electronics and Applications (ICIEA), Auckland, New Zealand, 15–17 June 2015. [Google Scholar]
- DHAB V2. Available online: https://www.lem.com/en/product-list/dhab-s145 (accessed on 20 February 2023).
- Yokogawa 2215 Series Shunts. Available online: https://www.tek-ac.com/product/dcs/yokogawa-dcs/shunt/yokogawa-2215-series-shunts (accessed on 20 February 2023).
- Lecture Notes and Recordings for ECE4710/5710: Modeling, Simulation, and Identification of Battery Dynamics. Available online: http://mocha-java.uccs.edu/ECE5710/index.html (accessed on 20 February 2023).
- Viberg, M. Subspace methods in system identification. IFAC Proc. Vol. 1994, 27, 1–12. [Google Scholar] [CrossRef]
- lsqnonneg. Available online: https://mathworks.com/help/matlab/ref/lsqnonneg.html (accessed on 20 February 2023).
- Extended Kalman Filter. Available online: https://en.wikipedia.org/wiki/Extended_Kalman_filter (accessed on 20 February 2023).


| Hall Sensor | Shunt Resistor | |
|---|---|---|
| Model | LEM DHAB S/145 | YOKOGAWA 2215-09 |
| Input | 200 A (Channel 2) | 20 A |
| Output | 2 V | 50 mV |
| Sensitivity | 10 mV/A | 2.5 mV/A |
| Accuracy | 3.3% | 0.2% |
| Retail Price | $35/ea | $150/ea |
| Dimension (L × W × H) | 52.75 × 48.5 × 24 mm | 700 × 310 × 390 mm |
| Externals |  |  |
| Ref. | [30] | [31] |
| Stage | Task | Output |
|---|---|---|
| 1.1 | Dynamic test | |
| 1.2 | Static test | |
| 2.1 | Model formulation | |
| 2.2 | Model parameter identification | |
| 3.1 | Filter parameter tuning | |
| 3.2 | State estimation |
| Ohmic | Polarization | Hysteresis Parameters | |||||
|---|---|---|---|---|---|---|---|
| [ohm] | [s] | [s] | [mV] | [mV] | |||
| City | Thevenin | 0.0401 | 1.2148 | 14.4792 | - | - | - |
| ESC | 0.0396 | 1.2148 | 14.4792 | 109.5078 | 0 | 2.0179 | |
| Highway | Thevenin | 0.0379 | 0.6056 | 9.2996 | - | - | - |
| ESC | 0.0397 | 0.6056 | 9.2996 | 91.0749 | 4.292 | 29.2975 | |
| High-speed | Thevenin | 0.0404 | 0.3567 | 8.1987 | - | - | - |
| ESC | 0.0394 | 0.3567 | 8.1987 | 114.2882 | 0 | 2.5376 | |
| RMSEs [mV] | ||||||||
|---|---|---|---|---|---|---|---|---|
| City | Highway | High-Speed | ||||||
| CD | CS | Overall | CD | CS | Overall | CD | ||
| City | Thevenin | 37.96 | 54.69 | 42.98 | 34.32 | 56 | 42.79 | 27.54 |
| ESC | 11.3 | 26.14 | 16.54 | 19.6 | 45.23 | 30.63 | 11.68 | |
| Highway | Thevenin | 42.49 | 55.95 | 46.4 | 38.87 | 59.28 | 46.68 | 34.93 |
| ESC | 14.96 | 48.67 | 28.04 | 15.63 | 31.37 | 22.16 | 14.99 | |
| High-speed | Thevenin | 43.78 | 56.44 | 47.42 | 40.73 | 60.94 | 48.42 | 35.6 |
| ESC | 13.14 | 27.87 | 18.19 | 24.02 | 51.24 | 35.5 | 12.83 | |
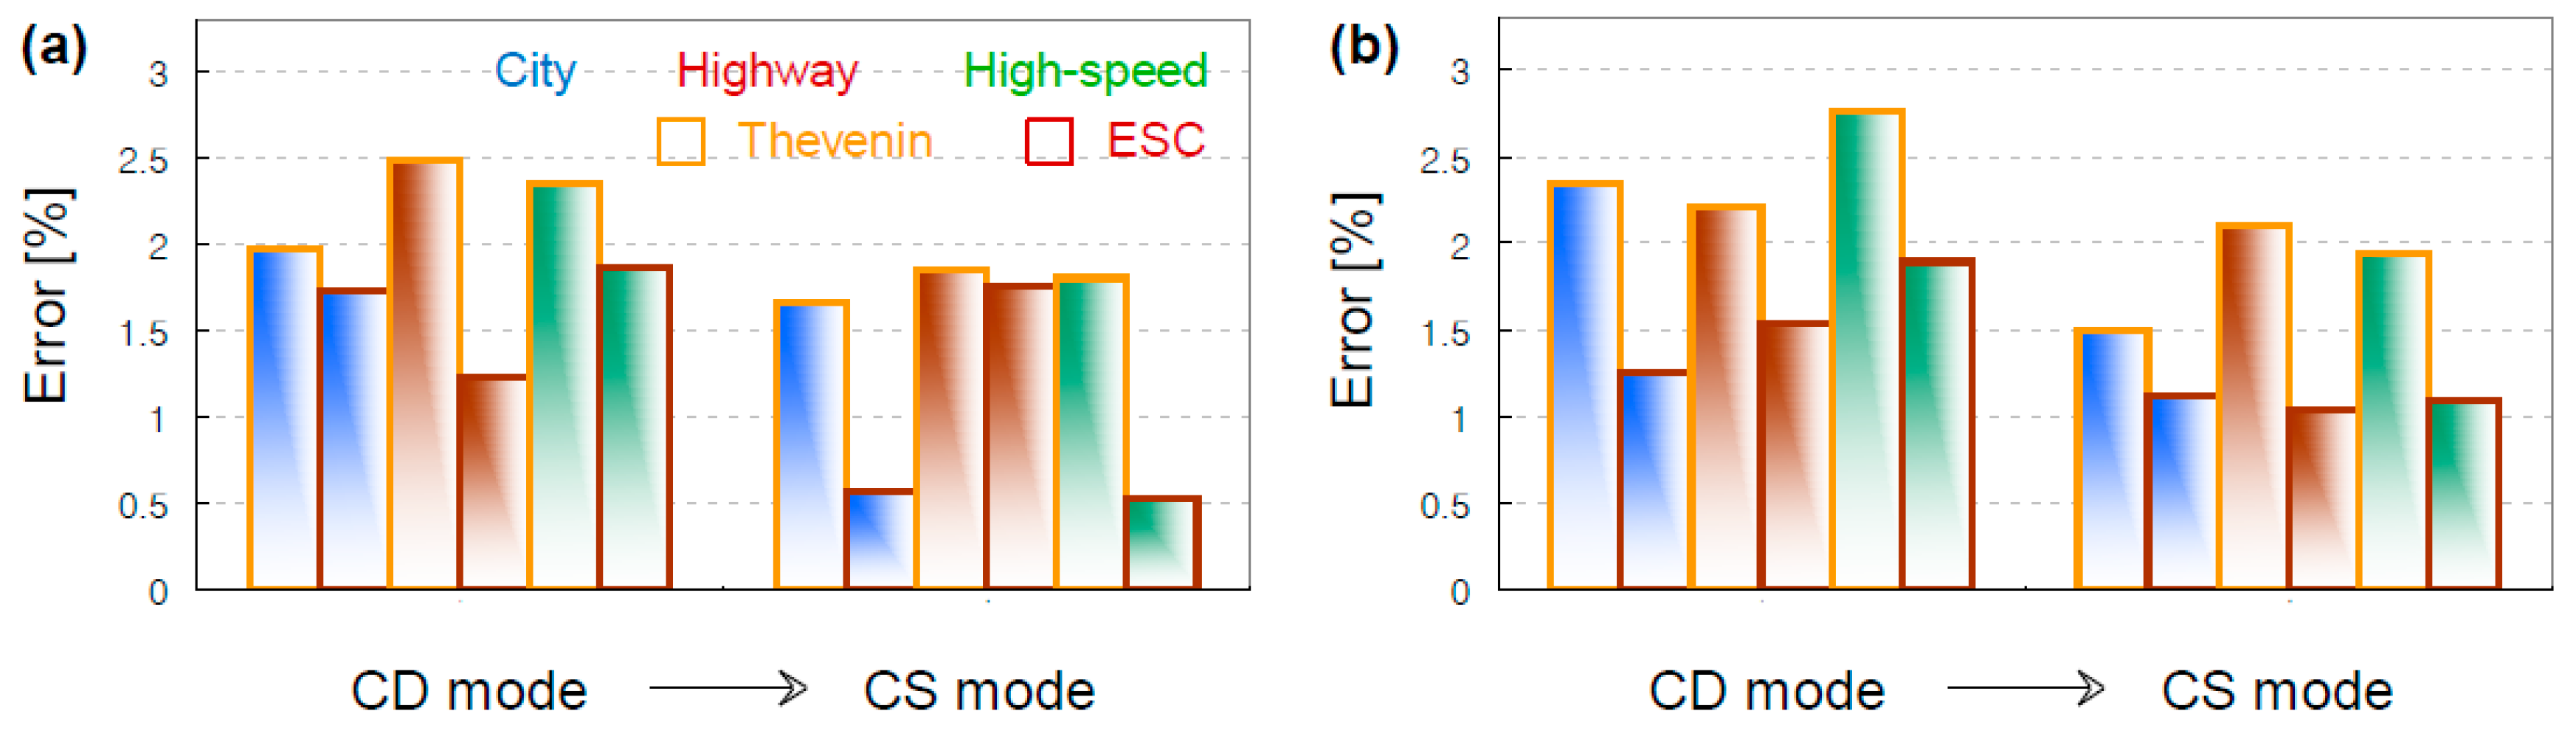
| RMSEs [%] | |||||||
|---|---|---|---|---|---|---|---|
| City | Highway | ||||||
| CD | CS | Overall | CD | CS | Overall | ||
| City | Thevenin | 1.975 | 1.665 | 1.899 | 2.344 | 1.498 | 2.021 |
| ESC | 1.732 | 0.56 | 1.515 | 1.253 | 1.123 | 1.34 | |
| Highway | Thevenin | 2.492 | 1.85 | 2.341 | 2.208 | 2.101 | 2.173 |
| ESC | 1.231 | 1.751 | 1.412 | 1.534 | 1.036 | 1.388 | |
| High-speed | Thevenin | 2.344 | 1.804 | 2.215 | 2.768 | 1.946 | 2.237 |
| ESC | 1.861 | 0.521 | 1.621 | 1.897 | 1.094 | 1.914 | |
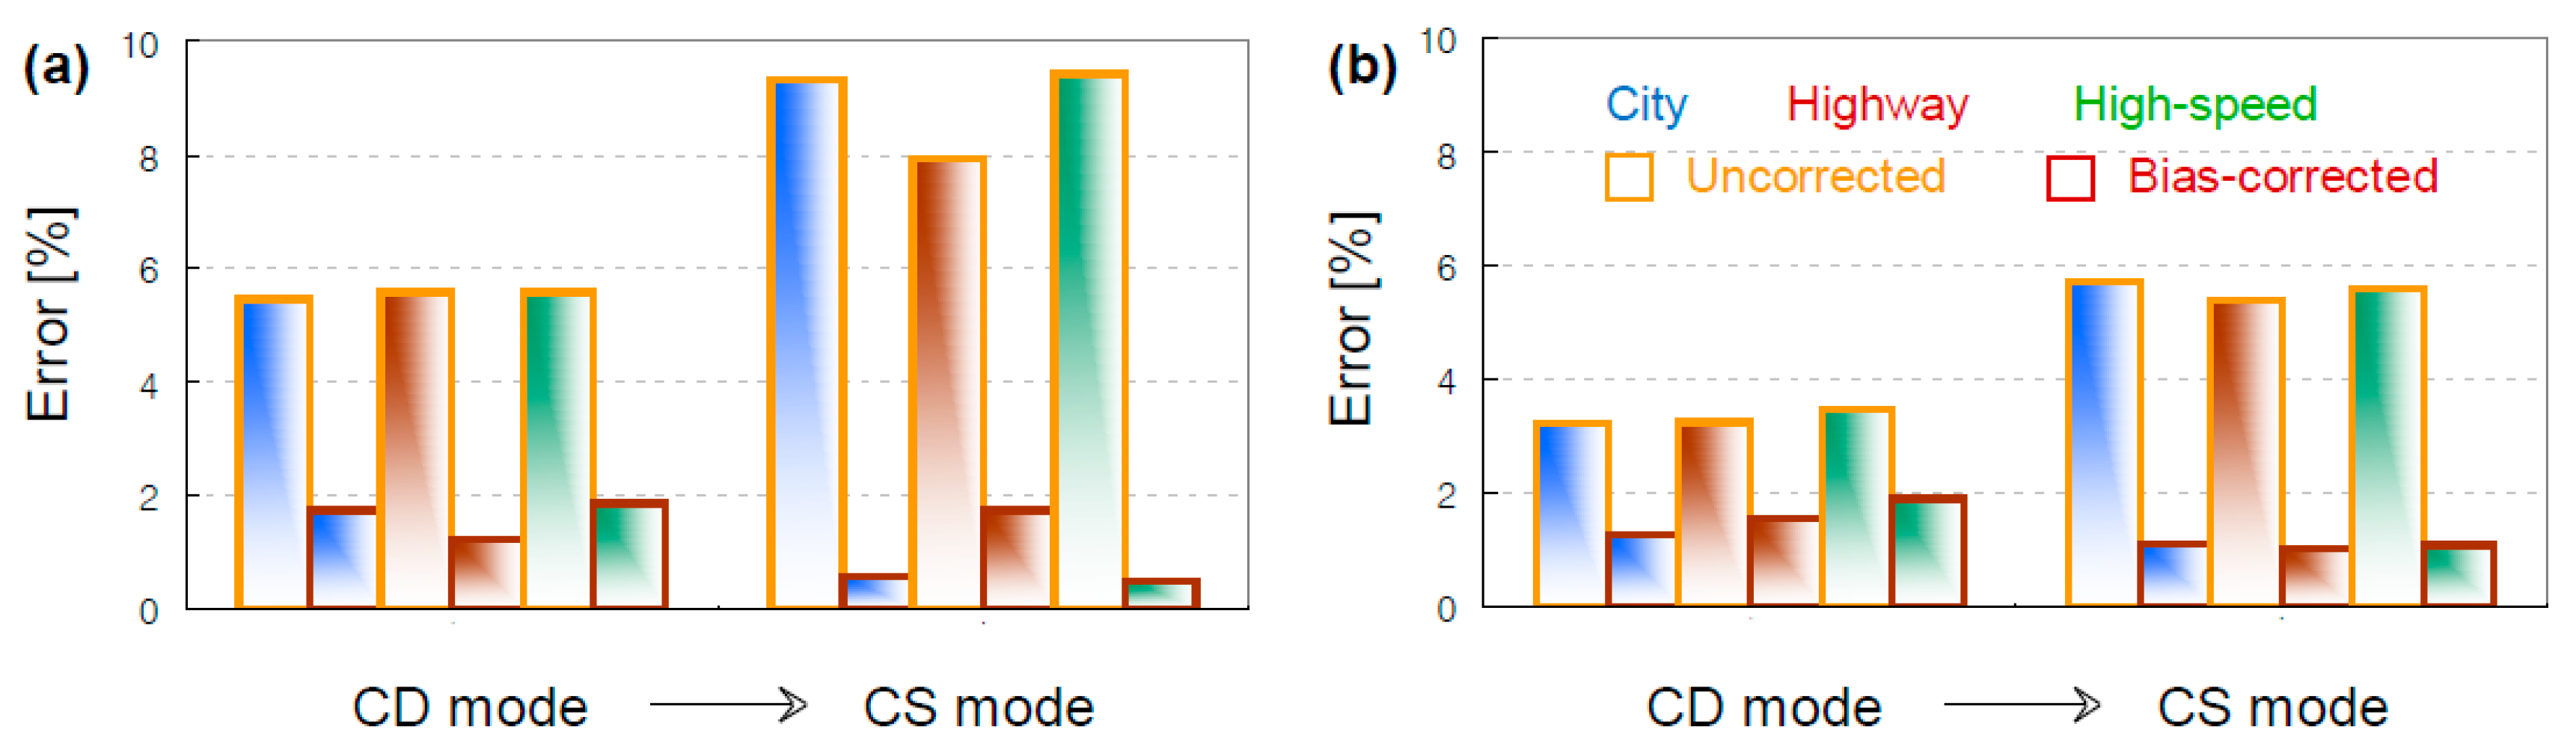
| RMSEs [%] | |||||||
|---|---|---|---|---|---|---|---|
| City | Highway | ||||||
| CD | CS | Overall | CD | CS | Overall | ||
| City | Uncorrected | 5.469 | 9.307 | 6.692 | 3.207 | 5.71 | 4.21 |
| Bias-corrected | 1.732 | 0.56 | 1.515 | 1.253 | 1.123 | 1.34 | |
| Highway | Uncorrected | 5.594 | 7.933 | 6.292 | 3.252 | 5.379 | 4.086 |
| Bias-corrected | 1.231 | 1.751 | 1.412 | 1.534 | 1.036 | 1.388 | |
| High-speed | Uncorrected | 5.574 | 9.427 | 6.79 | 3.441 | 5.581 | 4.275 |
| Bias-corrected | 1.861 | 0.521 | 1.621 | 1.897 | 1.094 | 1.914 | |
Disclaimer/Publisher’s Note: The statements, opinions and data contained in all publications are solely those of the individual author(s) and contributor(s) and not of MDPI and/or the editor(s). MDPI and/or the editor(s) disclaim responsibility for any injury to people or property resulting from any ideas, methods, instructions or products referred to in the content. |
© 2023 by the authors. Licensee MDPI, Basel, Switzerland. This article is an open access article distributed under the terms and conditions of the Creative Commons Attribution (CC BY) license (https://creativecommons.org/licenses/by/4.0/).
Share and Cite
Yoo, M.Y.; Lee, J.H.; Choi, J.-H.; Huh, J.S.; Sung, W. State-of-Charge Estimation of Batteries for Hybrid Urban Air Mobility. Aerospace 2023, 10, 550. https://doi.org/10.3390/aerospace10060550
Yoo MY, Lee JH, Choi J-H, Huh JS, Sung W. State-of-Charge Estimation of Batteries for Hybrid Urban Air Mobility. Aerospace. 2023; 10(6):550. https://doi.org/10.3390/aerospace10060550
Chicago/Turabian StyleYoo, Min Young, Jung Heon Lee, Joo-Ho Choi, Jae Sung Huh, and Woosuk Sung. 2023. "State-of-Charge Estimation of Batteries for Hybrid Urban Air Mobility" Aerospace 10, no. 6: 550. https://doi.org/10.3390/aerospace10060550