Article

A Method for Constructing Health Indicators of the Engine Bleed Air System Using Multi-Level Feature Extraction

1
Key Lab of Civil Aircraft Airworthiness Technology, Tianjin 300300, China
2
Institute of Technology and Innovation, Civil Aviation University of China, Tianjin 300300, China
3
Xiamen Municipal Smart City Technology Co., Xiamen 361008, China
4
College of Electronic Information and Automation, Civil Aviation University of China, Tianjin 300300, China
*
Author to whom correspondence should be addressed.
These authors contributed equally to this work.
Aerospace 2023, 10(7), 645; https://doi.org/10.3390/aerospace10070645
Submission received: 15 June 2023 / Revised: 9 July 2023 / Accepted: 12 July 2023 / Published: 18 July 2023

Abstract

:
Traditional methods are unable to effectively assess the health status of engine bleed air systems. To address the limitation, this paper proposes a methodology for constructing health indicators using multi-level feature extraction. First, this approach involves data-level feature extraction from Quick Access Recorder (QAR) data and employs a method of significance compensation to process the QAR data. Second, through unsupervised learning, the ResNet Deep Autoencoder (RDAE) is utilized to do the feature-level feature extraction from the processed data. This can solve the problem of lacking annotated data and obtain the health indicators of the engine bleed air system. Third, the method was experimented on one year of QAR data from a specific airline company. The results demonstrate that the RDAE approach achieves the best performance in constructing health indicators for the system. It achieves a miss rate of 0.0523 for the duct pressure of 5th stage bleed, reducing the miss rate by 0.2810 compared to Kernel Principal Component Analysis (KPCA). It also achieves a miss rate of 0 for the pre-cooler outlet temperature, reducing the miss rate by 0.0035 compared to the Deep Autoencoder (DAE). The results indicate that the proposed method provides a more effective assessment of the health status of the engine bleed air system.

1. Introduction

The engine bleed air system is a vital component that provides air to various aircraft systems. It plays a crucial role in maintaining optimal cabin pressure and temperature during flight, ensuring the safety, comfort, and proper functioning of both passengers and crew members, as well as multiple onboard equipment. The functions of the engine bleed air system include: supplying compressed air, maintaining cabin pressure, controlling cabin temperature, providing environmental control. Aircraft manufacturers and airlines place significant importance on the design, maintenance, and monitoring of the engine bleed air system to ensure its stable and reliable performance [1,2].
The engine bleed air system has a high failure rate during actual aircraft operation, and troubleshooting by maintenance personnel often relies on manuals, resulting in high time costs and low efficiency. With the emergence of PHM (Prognostics and Health Management) technology, the maintenance approach has shifted from post-maintenance to condition-based maintenance, significantly reducing time and maintenance costs while improving maintenance efficiency [3,4]. Additionally, aircraft are equipped with data recorders, such as the commonly used QAR (Quick Access Recorder), making data-driven PHM techniques the mainstream approach. However, flight data presents challenges with its large volume and high dimensionality, making traditional data-driven fault diagnosis methods inadequate to meet the requirements [5,6].
For data-driven methods, data preprocessing and feature extraction have a significant impact on the effectiveness of deep learning in PHM applications. Actual QAR data presents challenges such as high dimensionality, inconsistent lengths, and lack of annotation, making it difficult to extract meaningful features. However, feature extraction is the first crucial step in building effective deep learning models [7,8]. Therefore, in the data processing and feature extraction stages, it is important to consider the characteristics of the system and the data itself and adopt targeted approaches to achieve effective state assessment [9,10].
In recent years, numerous studies have emerged that apply deep learning to aircraft health management. For instance, Reference [11] proposed a novel one-dimensional multi-channel convolutional neural network (1DMCCNN) for diagnosing fault patterns. It extracts fault signals by constructing a landing gear hydraulic system using normal and fault models, and the inputs the extracted signals as multi-channel data into the convolutional neural network. The network used in the fault classification experiments achieves significantly higher accuracy compared to traditional machine learning algorithms. In Reference [12], a particle swarm optimization hybrid fruit fly algorithm is employed to optimize the backpropagation neural network, effectively addressing the issues of weight and bias in the network. This optimization approach yields high performance in diagnosing faults in the rudder system. Reference [13] utilizes an improved extreme learning machine to establish a novel fault diagnosis model for a commercial aircraft’s elevator system. Additionally, Kernel Principal Component Analysis (KPCA) is employed to reduce the dimensionality of the aircraft fault data, thereby enhancing the diagnostic accuracy of the model. These studies demonstrate that applying deep learning techniques to aircraft health management can yield promising results.
Furthermore, in the context of the engine bleed air system, there are also several notable research works. For instance, Reference [14] focuses on the fault detection of commercial aircraft bleed air systems and proposes a fault detection method using a multi-cycle data feature multiple linear regression model. Reference [15] presents a multivariate state estimation technique based on a dynamic process memory matrix to provide early warning for fault risks in the bleed air system. Reference [16] models multiple components of the engine bleed air system and predicts the failure rates of these components using neural networks. The study verifies that neural networks exhibit superior predictive performance compared to Weibull models.
However, most of these studies rely on simulated data to conduct their research due to the challenges associated with real aircraft operational data. These challenges include a scarcity of fault data relative to normal data and a lack of annotations, which make it difficult to establish effective deep learning algorithm models. In the context of the bleed air system, models mentioned above exhibit weaker learning capabilities in handling complex data features. There is relatively limited research available on the application of deep learning techniques to health management. Furthermore, the utilization of unsupervised learning to address the issue of data lacking annotations in real-world scenarios has been relatively limited in previous studies. Unsupervised learning offers several advantages in handling unannotated data without the need for manual labeling, which significantly reduces time costs [17]. This aligns well with the characteristic of flight data lacking annotations. Additionally, unsupervised learning can automatically extract features and uncover underlying patterns within the data [18], facilitating the exploration of latent patterns and hidden information within flight data.
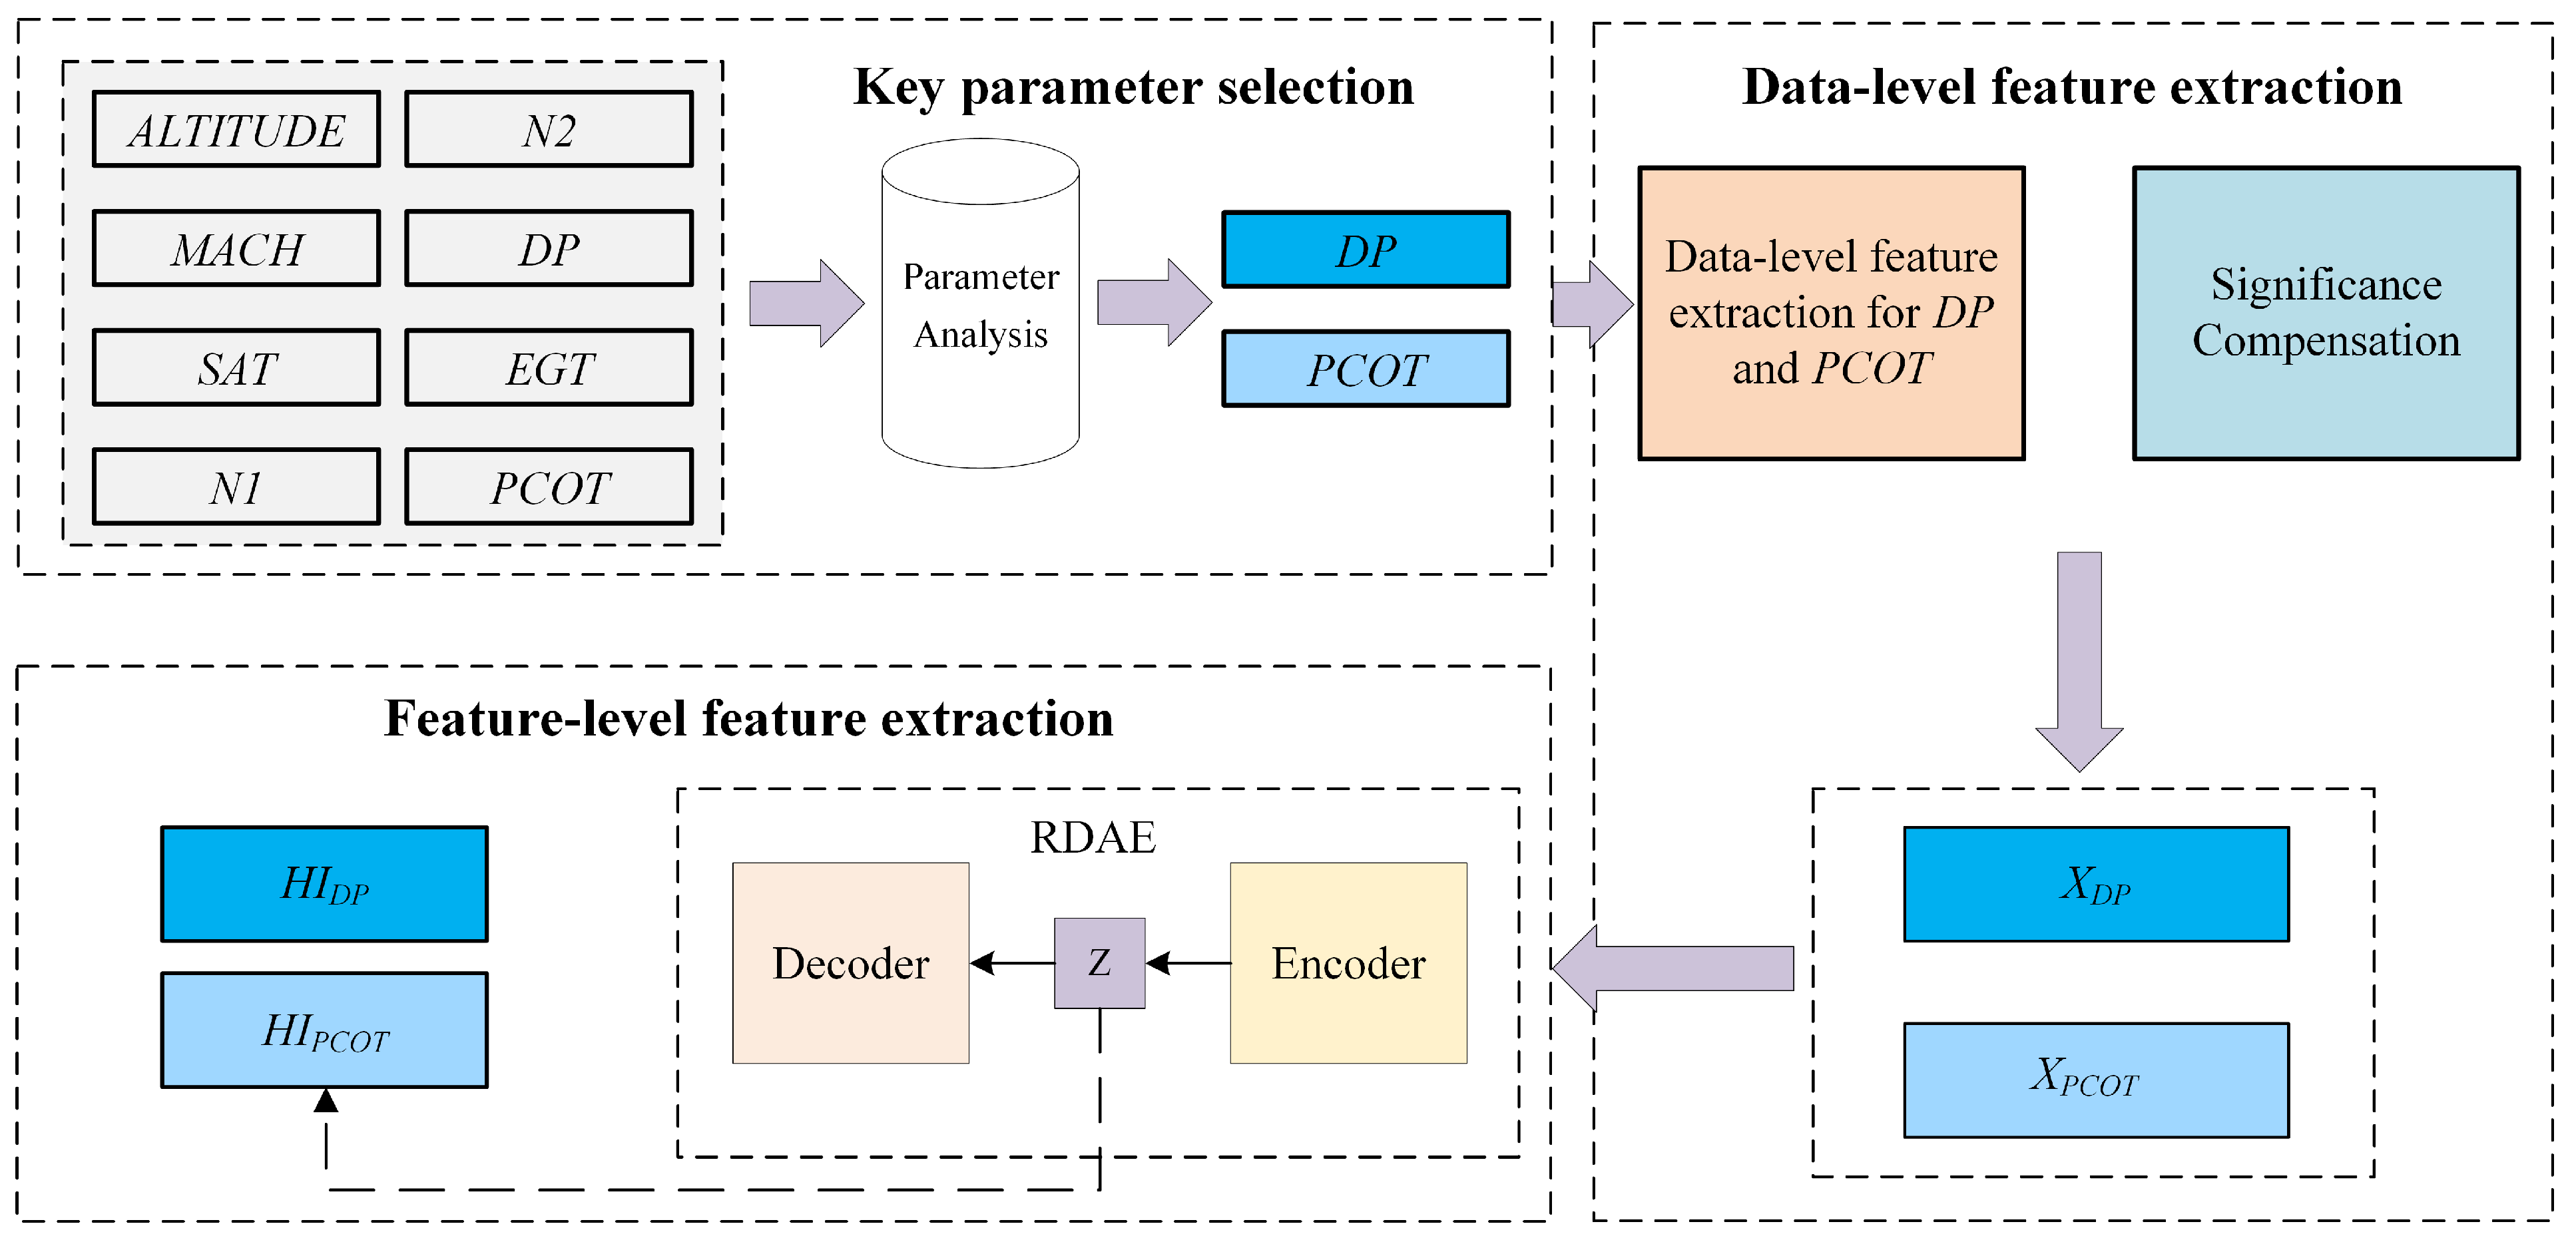
Therefore, to address the aforementioned issues present in actual flight data, we propose a method for constructing health indicator of the engine bleed system based on multi-level feature extraction. The study utilizes Quick Access Recorder (QAR) data as the basis for experimental research. The proposed method does not require annotated data. Instead, it involves data-level feature extraction by extracting statistical features of the duct pressure of 5th stage bleed and the bleed air temperature from the QAR data. Second, it involves feature-level feature extraction where unsupervised learning is employed using RDAE to map the data-level features. The method enables effective evaluation of the health status of the engine bleed air system.
The main contributions of this paper are summarized as follows:
1.
To address the challenge of assessing the operational status of engine bleed air systems, we propose a multi-level feature extraction approach for constructing HIs (Health Indicators) that quantify the health status of the engine bleed air system based on data collected from each flight cycle.
2.
In the process of constructing health indicators for the engine bleed air system, we solve the issue of varying cycle lengths in the flight data. We introduce a data-level feature extraction method that transforms the original QAR data, which has unequal cycle lengths, into samples of equal length with consistent feature spaces. Additionally, we apply significant compensation to certain elements within the samples to highlight their numerical features.
3.
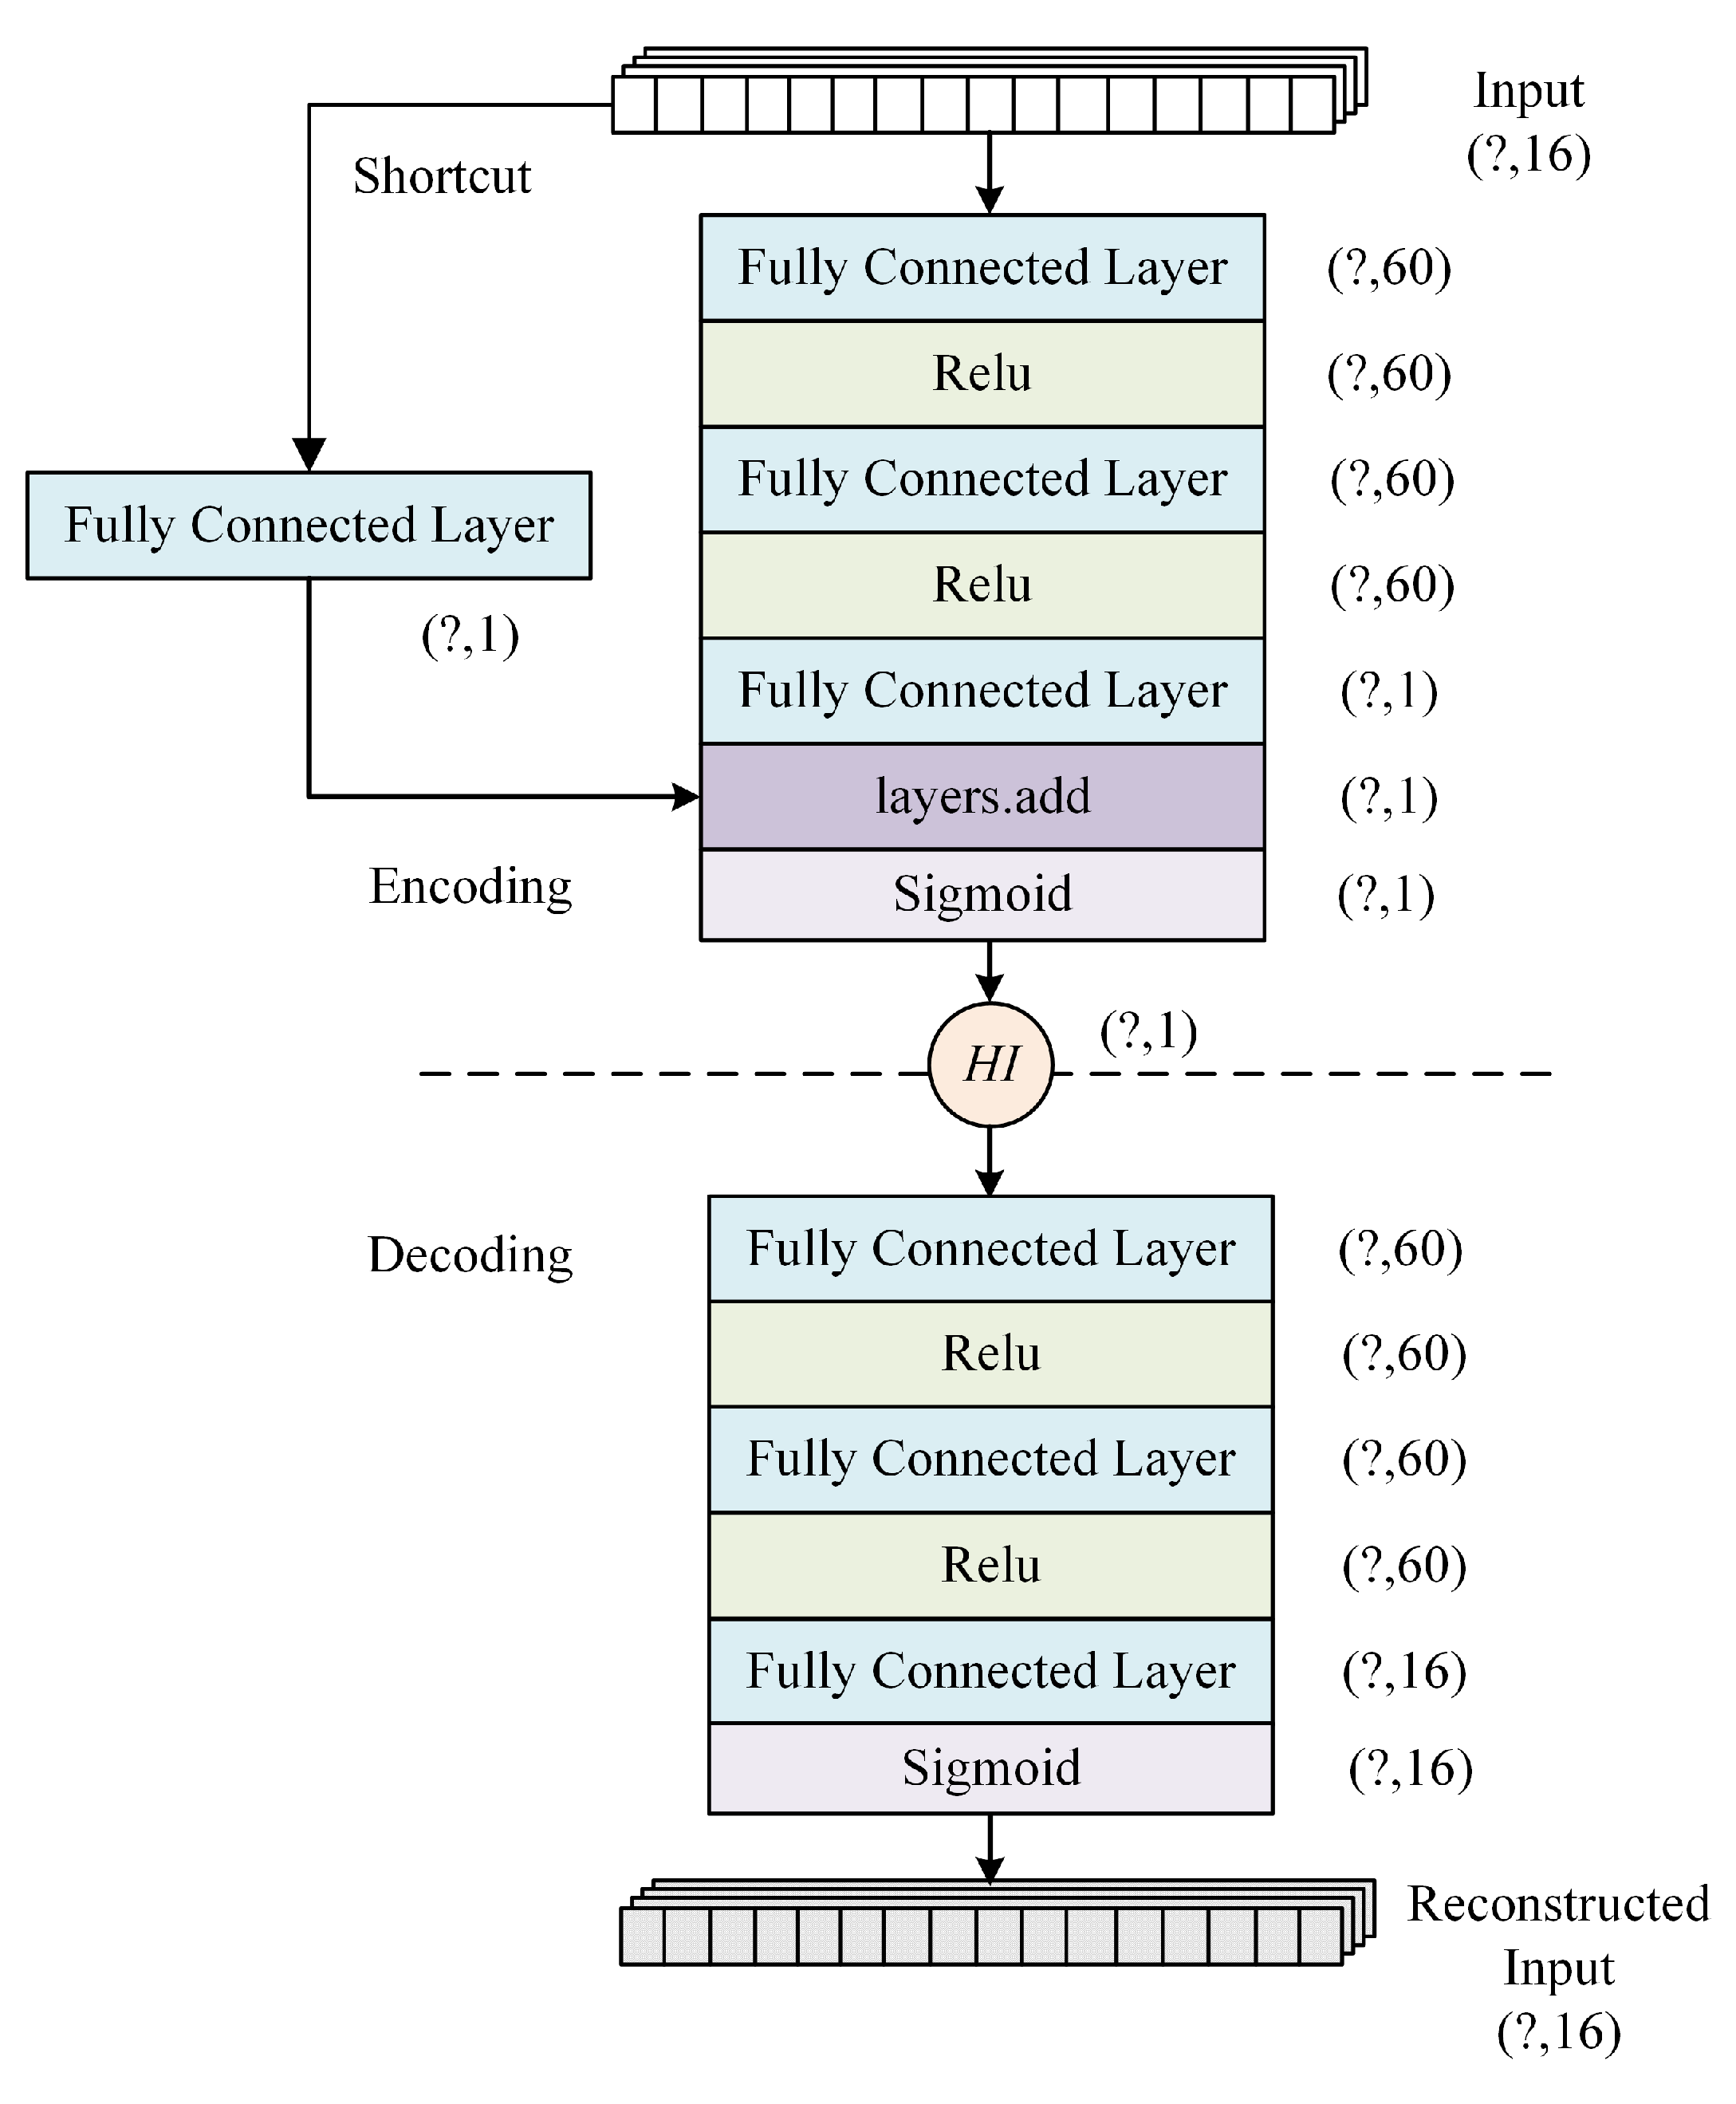
Considering the unannotated nature of actual flight data, we propose an enhanced approach named RDAE (ResNet Deep Autoencoder). RDAE is based on the autoencoder algorithm and aims to extract features from preprocessed data using unsupervised learning. The effectiveness of the proposed methods was validated through experiments conducted on one year of QAR data from a specific airline company.
The remainder of this paper is organized as follows. Section 2 presents the methodology part of the proposed framework, including key parameter selection, data-level features extraction and feature-level feature extraction. Section 3 describes our experimental results and analysis, as well as the comparison results with other methods. Section 4 offers our conclusion.

2. Methodology

The construction method for health indicators based on multi-level feature extraction is illustrated in Figure 1. It primarily consists of three steps: key parameter selection, data-level feature extraction, and feature-level feature extraction. These steps aim to transform each flight cycle data into a HI (Health Indicator), enabling the quantification of the engine bleed air system’s health status.

2.1. Key Parameter Selection

This study utilizes the Quick Access Recorder (QAR) data from a airline’s Boeing 737 fleet over one year as the underlying data support for experiments. There are several continuous parameters associated with the engine bleed air system, as shown in Figure 1. These parameters include A L T I T U D E , M A C H , S A T (Static Ambient Temperature), N 1 , N 2 , D P (Duct Pressure of 5th stage bleed), E G T (Exhaust Gas Temperature), P C O T (Pre-Cooler Outlet Temperature), and more. Taking into account the expertise of the airline company’s specialists, we have selected D P and P C O T as the fundamental parameters for calculating the health indicators of the engine bleed air system.
D P (Duct Pressure of 5th stage bleed) is the bleed air pressure provided by the 5th stage of the high-pressure compressor. During normal operation, 5th stage bleed is used to drive various systems, such as pneumatic source, air conditioning, and pressurization systems. P C O T (Pre-Cooler Outlet Temperature) refers to the temperature of the air leaving the pre-cooler unit. The pre-cooler is a heat exchanger and is responsible for cooling the compressed air before it is distributed to various aircraft systems. D P and P C O T are both critical parameters for monitoring and assessing the health status of the bleed air system.

2.2. Data-Level Feature Extraction

To address the issue of varying lengths in flight cycle data generated during aircraft flight, this study employs dataset feature extraction to extract data-level features from D P and P C O T . The process of extracting data-level features is illustrated in the as Algorithm 1.
Algorithm 1 Data-level feature extraction from D P and P C O T
Input: 
D P or P C O T ;
Output: 
X D P or X P C O T ;
 1:
Find the number of rows k and columns m of X D P or X P C O T ;
 2:
Initial X D P or X P C O T , sorted in chronological order;
 3:
repeat
 4:
  Initial empty Queue 1;
 5:
  Initial empty Queue 2;
 6:
  Read a column of data by column index j;
 7:
  repeat
 8:
    Read a row of data by row index i;
 9:
    if The basic conditions are met then Place P C O T value in Queue 2;
 10:
    end if
 11:
    if The basic conditions are met and D P value is a duct pressure of 5th stage then Place D P in Queue 2;
 12:
    end if
 13:
     i = i + 1 ;
 14:
  until  i = k 1 .
 15:
  if Queue 2 is not empty then
 16:
    Find each characteristic for Queue 2;
 17:
    Splice all the feature, get the feature vectors;
 18:
    Put the feature vector into Queue 1;
 19:
    Place Queue 1 in i row of X D P or X P C O T ;
 20:
  end if
 21:
   j = j + 1 ;
 22:
until  j = m 1 .
Before starting the data-level feature extraction for D P or P C O T , the QAR data for the Boeing 737 fleet for one year needs to be sorted in chronological order. An empty Queue 1 is then established to store the feature vectors for each flight cycle. Next, using a loop, the feature information is extracted for each flight cycle, and before the feature extraction, an empty Queue 2 is created to store the D P or P C O T values for each flight cycle.
1.
Determine whether each row of data in each flight cycle satisfies the basic conditions. The basic conditions include both engine start valves closed, APU bleed valve closed, engine anti-ice valves and wing anti-ice valves closed, and left and right isolation valves open.
2.
If each row of data in the flight cycle satisfies the basic conditions, determine the stage of the bleed air and check if it satisfies the criteria for the D P . If it satisfies the criteria, add the current D P to Queue 2. Because D P involves multi-level bleed air pressures (such as 5th stage, 9th stage, etc.), the same pressure value represents different meanings at different stages. Therefore, it requires judgment. However, P C O T is a temperature value generated by a single sensor, so it does not require any judgment and can be directly placed into Queue 2.
3.
After scanning each row of data in the flight cycle, Queue 2 contains the collection of D P or P C O T values for that flight cycle.
4.
If Queue 2 is not empty, perform feature calculations on Queue 2. The calculations can include finding the maximum, minimum, and average values of queue 2, as well as determining the number of elements in different pressure ranges for detecting abnormal D P or P C O T values. The number of elements in each range represents the frequency of occurrence within the range, and since the QAR data has a sampling frequency of 1 Hz, the occurrence value is equal to the time duration.
The aforementioned statistical quantities represent the extracted features. After completing the feature extraction for each flight cycle, we obtain a k×m-dimensional matrix X (Queue 1), consisting of m D P or P C O T features for k consecutive flight cycles.
X = { x 0 , x 1 , · · · , x i , · · · , x m 1 } R k × m
In the Equation (1), X represents the feature matrix of either D P or P C O T . It consists of k×m-dimensional vectors, denoted as x i . The Table 1 illustrates the division criteria for D P and the information represented by the index positions of the pressure feature vectors generated for each flight cycle. In the table, there are 163 abnormal pressure intervals for duct pressure of 5th stage bleed D P . During the normal regulation phase, the pressure ranges from 34 psi to 50 psi. The omitted parameters include f 30 32 , f 28 30 , f 26 28 , f 24 26 , f 22 24 , f 18 22 , f 14 18 . During takeoff and climb, the duct pressure of 5th stage bleed may be slightly higher, so the high-pressure threshold is set at 53 psi. A 5th stage bleed air pressure of 22 psi during descent indicates a significant performance decline in the related components. Due to the comprehensive consideration of airline costs, the high-pressure threshold is set at 22 psi. When the pressure is below 10 psi, it is considered the highest level of abnormality, indicating a lack of bleed air.
In Table 2, the values represent the pre-cooler outlet temperature P C O T during each flight cycle. According to service bulletins of Boeing and relevant manuals, if the temperature exceeds 450 °F, it can be considered as an elevated bleed air temperature. However, in practical operations, airlines may adjust the alarm threshold flexibly due to the lower benefits of detecting early-stage performance degradation with higher sensitivity. Therefore, in this case, the threshold for abnormal pre-cooler outlet temperature is set at 455 °F to ensure that the distribution of samples tends to be consistent when there is no significant performance decline observed.
In Figure 2, during the 826th flight cycle, the frequency spent with duct pressure of 5th stage bleed D P ranging from 32 to 34 psi is 3139 occurrences, and the minimum D P is above 28 psi. On the other hand, during the 828th flight cycle, the frequency of the D P dropping below 10 psi is 850 occurrences. Clearly, the severity of the anomaly in the 828th cycle is higher. 3139 is much larger than 850. However, if we input these two vectors into the feature extraction model, the model may erroneously perceive the 826th flight cycle to be in a relatively worse health state and map it to an unreasonable probability distribution. This hinders the effective application of the multi-level feature extraction approach.
Therefore, after achieving consistency in the value range of multidimensional numerical data, it is necessary to consider additional preprocessing steps to enable the model to perform a more reasonable feature mapping of the feature vectors. In this regard, emphasis is given to the numerical features of elements representing severe abnormalities, compensating for the saliency of these features. The method for D P is illustrated in Algorithm 2, and the method for P C O T is illustrated in Algorithm 3.
Algorithm 2 The method for D P
Input: 
X D P ;
Output: 
X D P ;
 1:
Initial i = 0 j = 3 ;
 2:
Find the number of rows k and columns m of X D P ;
 3:
repeat
 4:
  Read X D P by row index;
 5:
  repeat
 6:
    Read X D P by column index;
 7:
    if  X D P i , m 2 30 then Assign X D P i , j = 30 ;
 8:
    else The value of X D P i , j remains unchanged;
 9:
    end if
 10:
     j = j + 1 ;
 11:
  until  j = m 1
 12:
  if  X D P i , m 2 30 then Assign X D P i , 6 : ( m 3 ) = 30 ;
 13:
  else if  X D P i , m 1 30 then Assign X D P i , 6 : ( m 2 ) = 30 ;
 14:
  else X D P i , j = X D P i , j ;
 15:
  end if
 16:
   i = i + 1 ;
 17:
until  i = k 1 .
Algorithm 3 The method for P C O T
Input: 
X P C O T ;
Output: 
X P C O T
 1:
Initial i = 0 , j = 2 ;
 2:
Find the number of rows k and columns m of X P C O T ;
 3:
repeat
 4:
  Read X P C O T by row index;
 5:
  repeat
 6:
    Read each column of X P C O T by column index;
 7:
    if  X P C O T i , j 60 then Assign X P C O T i , j = 60 ;
 8:
    else The value of X P C O T i , j remains unchanged;
 9:
    end if
 10:
     j = j + 1 ;
 11:
  until  j = m 1
 12:
  if  X P C O T i , m 1 60 then Assign X P C O T i , 2 : ( m 2 ) = 60 ;
 13:
  else The value of X P C O T i , j remains unchanged;
 14:
  end if
 15:
until  i = k 1 .

2.3. Feature-Level Feature Extraction

Feature-level feature extraction is mainly achieved by using the ResNet Deep Autoencoder (RDAE) which is an improved architecture of the autoencoder (AE). The AE and RDAE both consist of two main components: the encoder and decoder, as shown in the Figure 1. The encoder’s main function is to “encode” the input high-dimensional samples ( X D P and X P C O T ) by mapping them to a lower-dimensional representation. At the same time, it is also necessary to obtain the hidden vector ( H I D P and H I P C O T ). The main function of the decoder is to “decode” the hidden vector and reconstruct the original samples by upsampling the hidden vector.
The RDAE in this paper adopts unsupervised learning, where both the input and output are unannotated samples. During the training process, the model extracts features from the original samples and aims to minimize the difference between the reconstructed samples and the original samples by adjusting the network parameters. Mean squared error ( M S E ) is used as a measure of the difference between the original samples and the original samples in the model training process. The formula for M S E is as Equation (2):
M S E = 1 k i = 1 k x i x ^ i
In Equation (2), k represents the number of samples, x i represents the i-th original sample vector, and x ^ i represents the i-th reconstructed sample vector.
RDAE is a variant of the AE architecture that incorporates residual connections inspired by Residual Neural Networks (ResNets). The term “Shortcut” in Figure 3 refers to a direct connection that adds the input to the output of a layer, also known as the “residual” connection. This connection addresses the issue of vanishing gradients and enhance the network’s learning capability and performance. In our approach, we adopt an add-type ResNet structure, where the input layer is connected to subsequent layers through shortcut connections, allowing the feature information to be combined. We employ a fully connected layer to create the shortcut connection, enabling the input data to undergo an identity mapping for HI calculation. This approach helps prevent performance degradation that may occur when stacking deeper layers in the network.
The Figure 3 illustrates the model structure of RDAE for constructing the health indicators of D P and P C O T . In the encoder part, each row of the feature matrix is treated as a sample, with each sample represented by a 16-dimensional vector. The training samples are fed into the network in batches for iteration. Initially, the fully connected layer transforms the sample shape to (?, 60), followed by the “Relu” activation function for non-linear operations. Then, another fully connected layer with the “Relu” activation function is applied, resulting in a sample shape of (?, 60). Subsequently, the feature information obtained after passing through the fully connected layer is combined with the sample shape obtained from the add-type connection, resulting in a shape of (?, 1). Finally, the “Sigmoid” activation function is applied to generate the health indicator (HI). The decoder part follows a similar structure to the main path of the encoder, with the exception of the sample size setting.
During the health indicator construction experiment, the visualized health indicators mapped from the feature matrix trained by the model are first analyzed. Then, the miss rate is used as an evaluation metric to assess the performance of various models, including RDAE, classic Deep Autoencoder (DAE) [19], and Kernel Principal Component Analysis (KPCA) [20], in constructing health indicators.

3. Results and Discussion

In this study, the QAR data from a Boeing 737 fleet of an airline company for one year was used as the experimental dataset. Each aircraft in the dataset recorded fault data from the engine bleed air system, providing maintenance segments as well as several preceding normal flight segments. Additionally, considering that the dual-engine bleed air systems operate independently, the dataset was divided based on the left and right engine data to allow the model to learn the distinctive features of system degradation. Each sample in the dataset corresponds to the data from a single engine’s flight cycle. After data preprocessing, the experimental dataset consists of 2474 samples.
Following the experimental method described in Section 2, multi-level feature extraction was performed on the data to construct health indicators for each flight cycle. Additionally, to obtain better HI values corresponding to a good health status, performance baselines are set in the region of HI. This allowed for the separation of normal and abnormal samples. According to the discussion in Section 2 regarding Table 1 and Table 2, the performance baselines were determined based on Boeing’s service bulletins and considering the cost requirements of the airlines. For D P , the normal range is 34–50 psi. Taking into consideration that the engine thrust during takeoff phase can cause a slight deviation, it is possible for the pressure to slightly exceed the specified range. Therefore, the range is set at 34–53 psi. The baseline is determined by the maximum and minimum values of all the samples within this range. Similarly, for P C O T , the maximum temperature is set at 455 °F. The lower bound of the baseline is determined by all the samples with temperatures that have not exceeded this range. If the calculated HI falls below this baseline, it indicates that the temperature has exceeded 455 °F. The HI curves with baseline annotations are shown in Figure 4 and Figure 5.
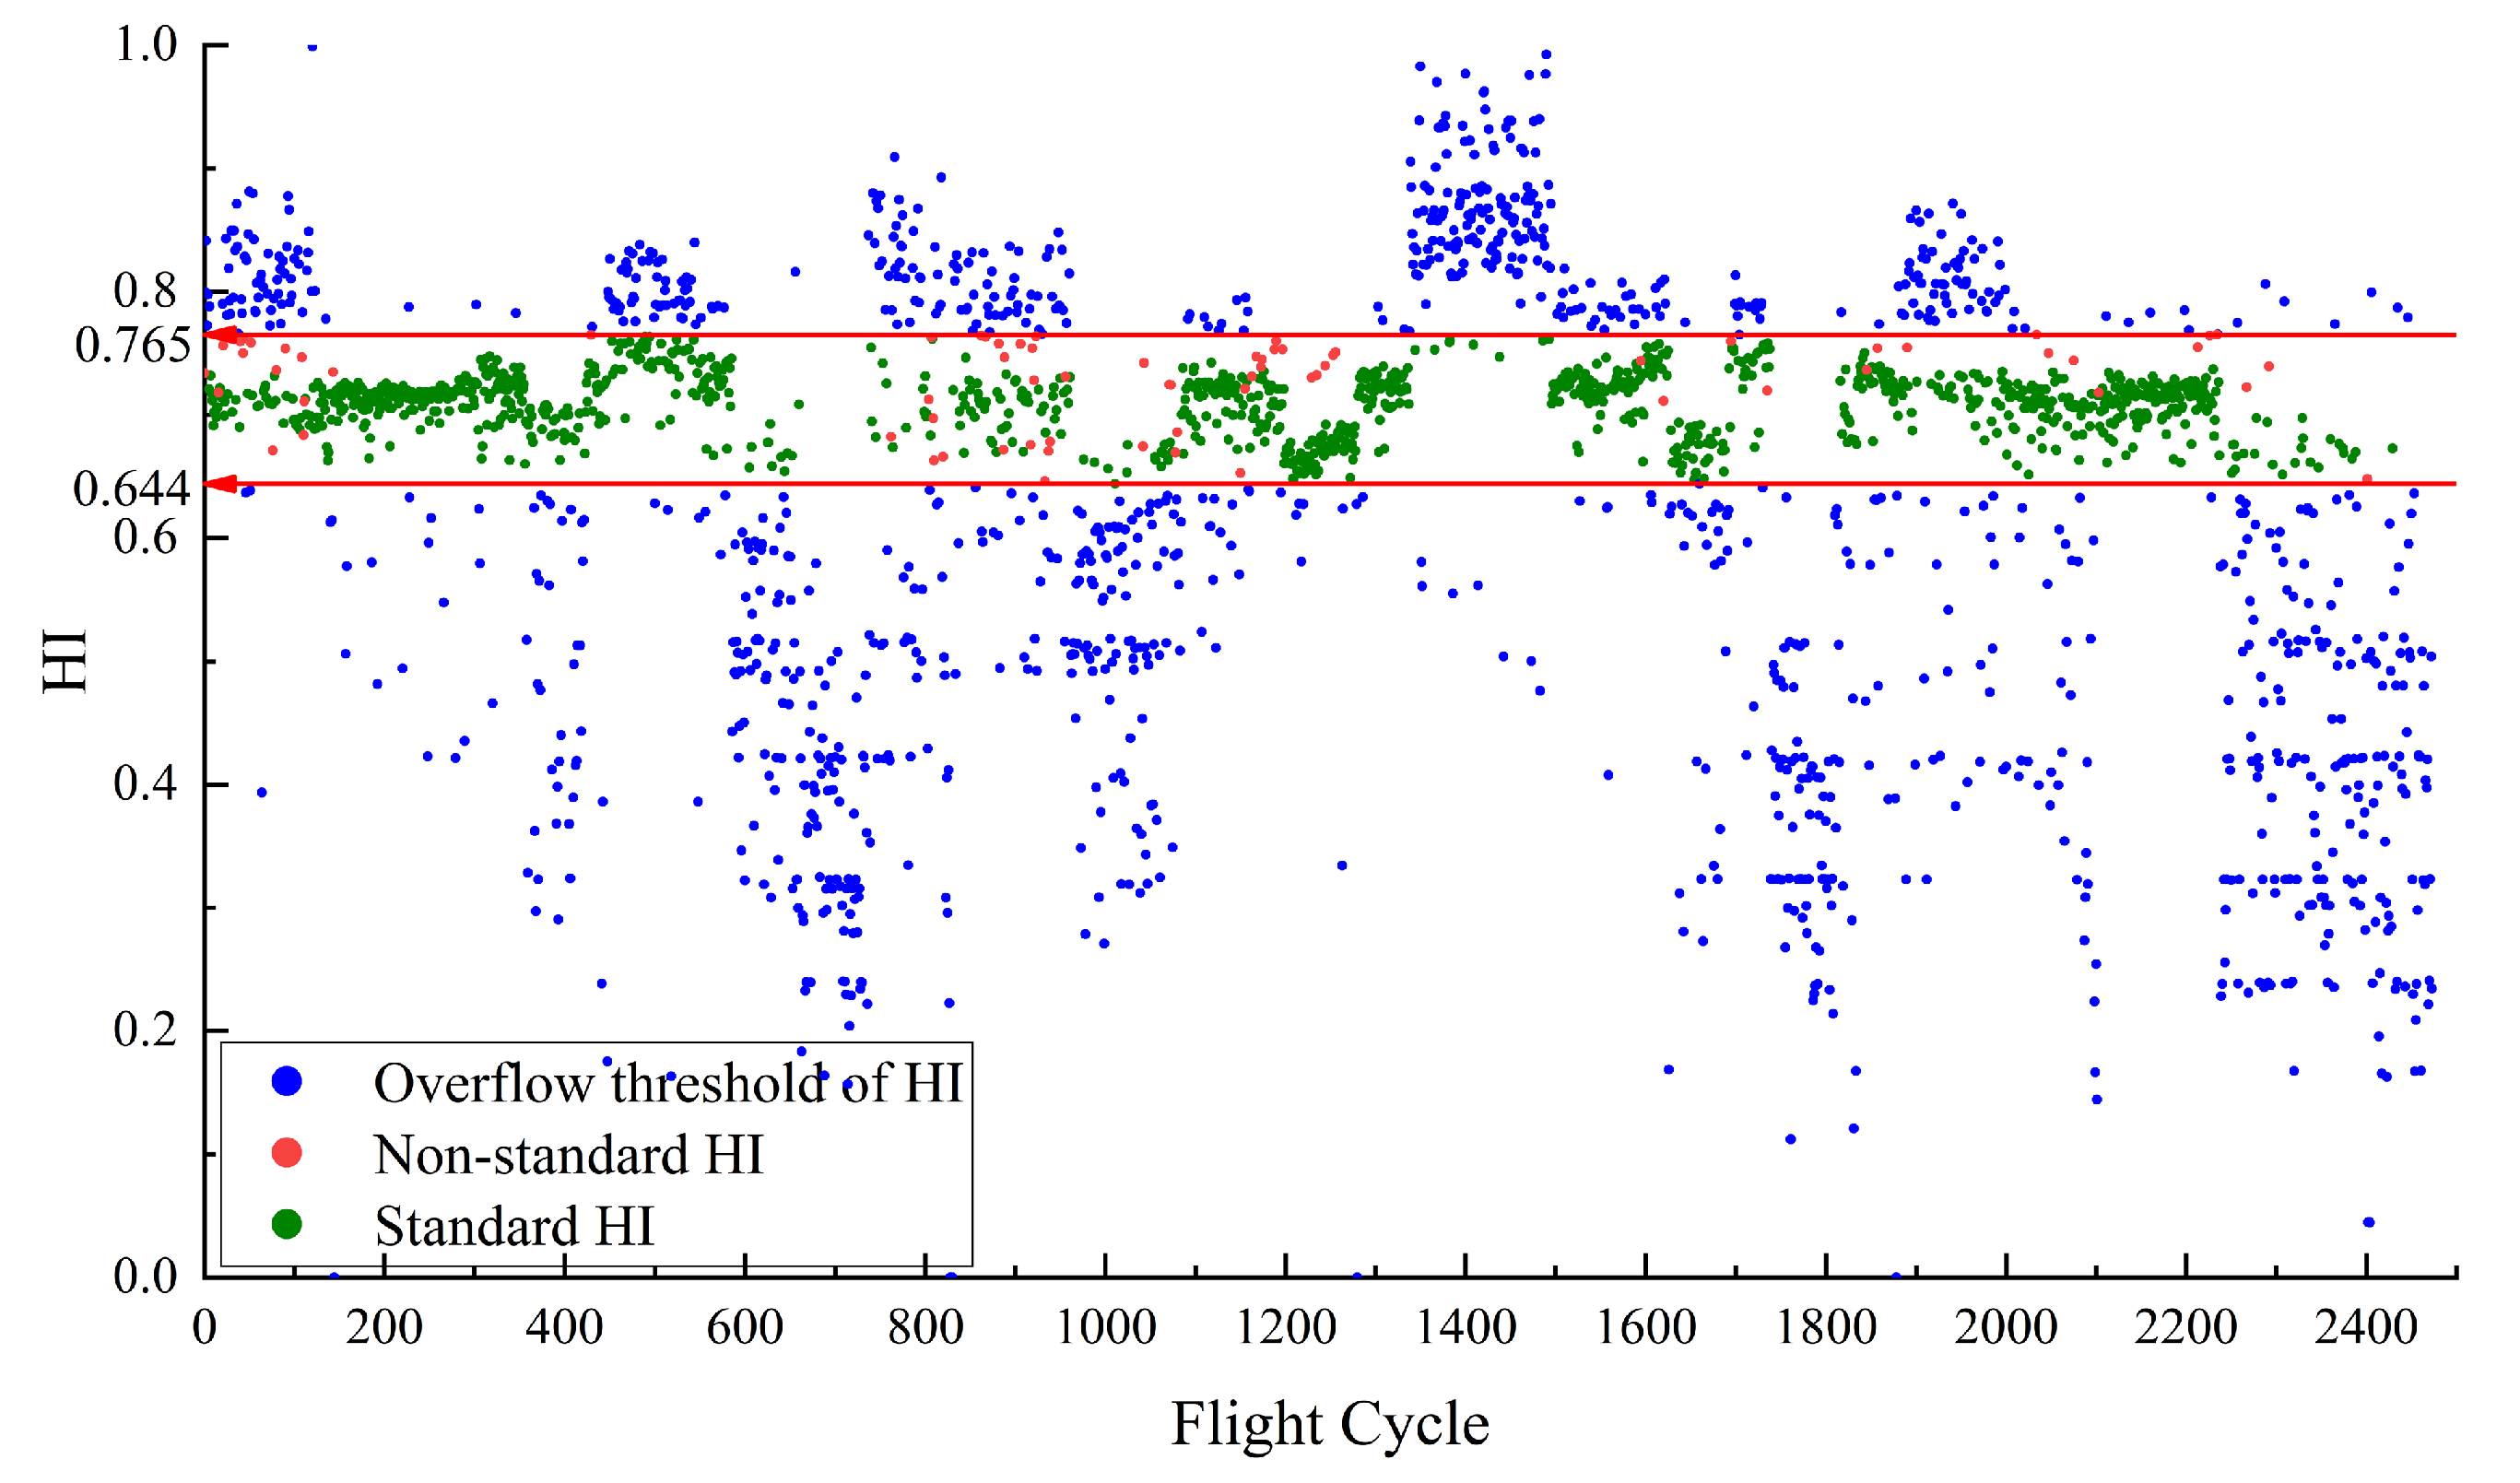
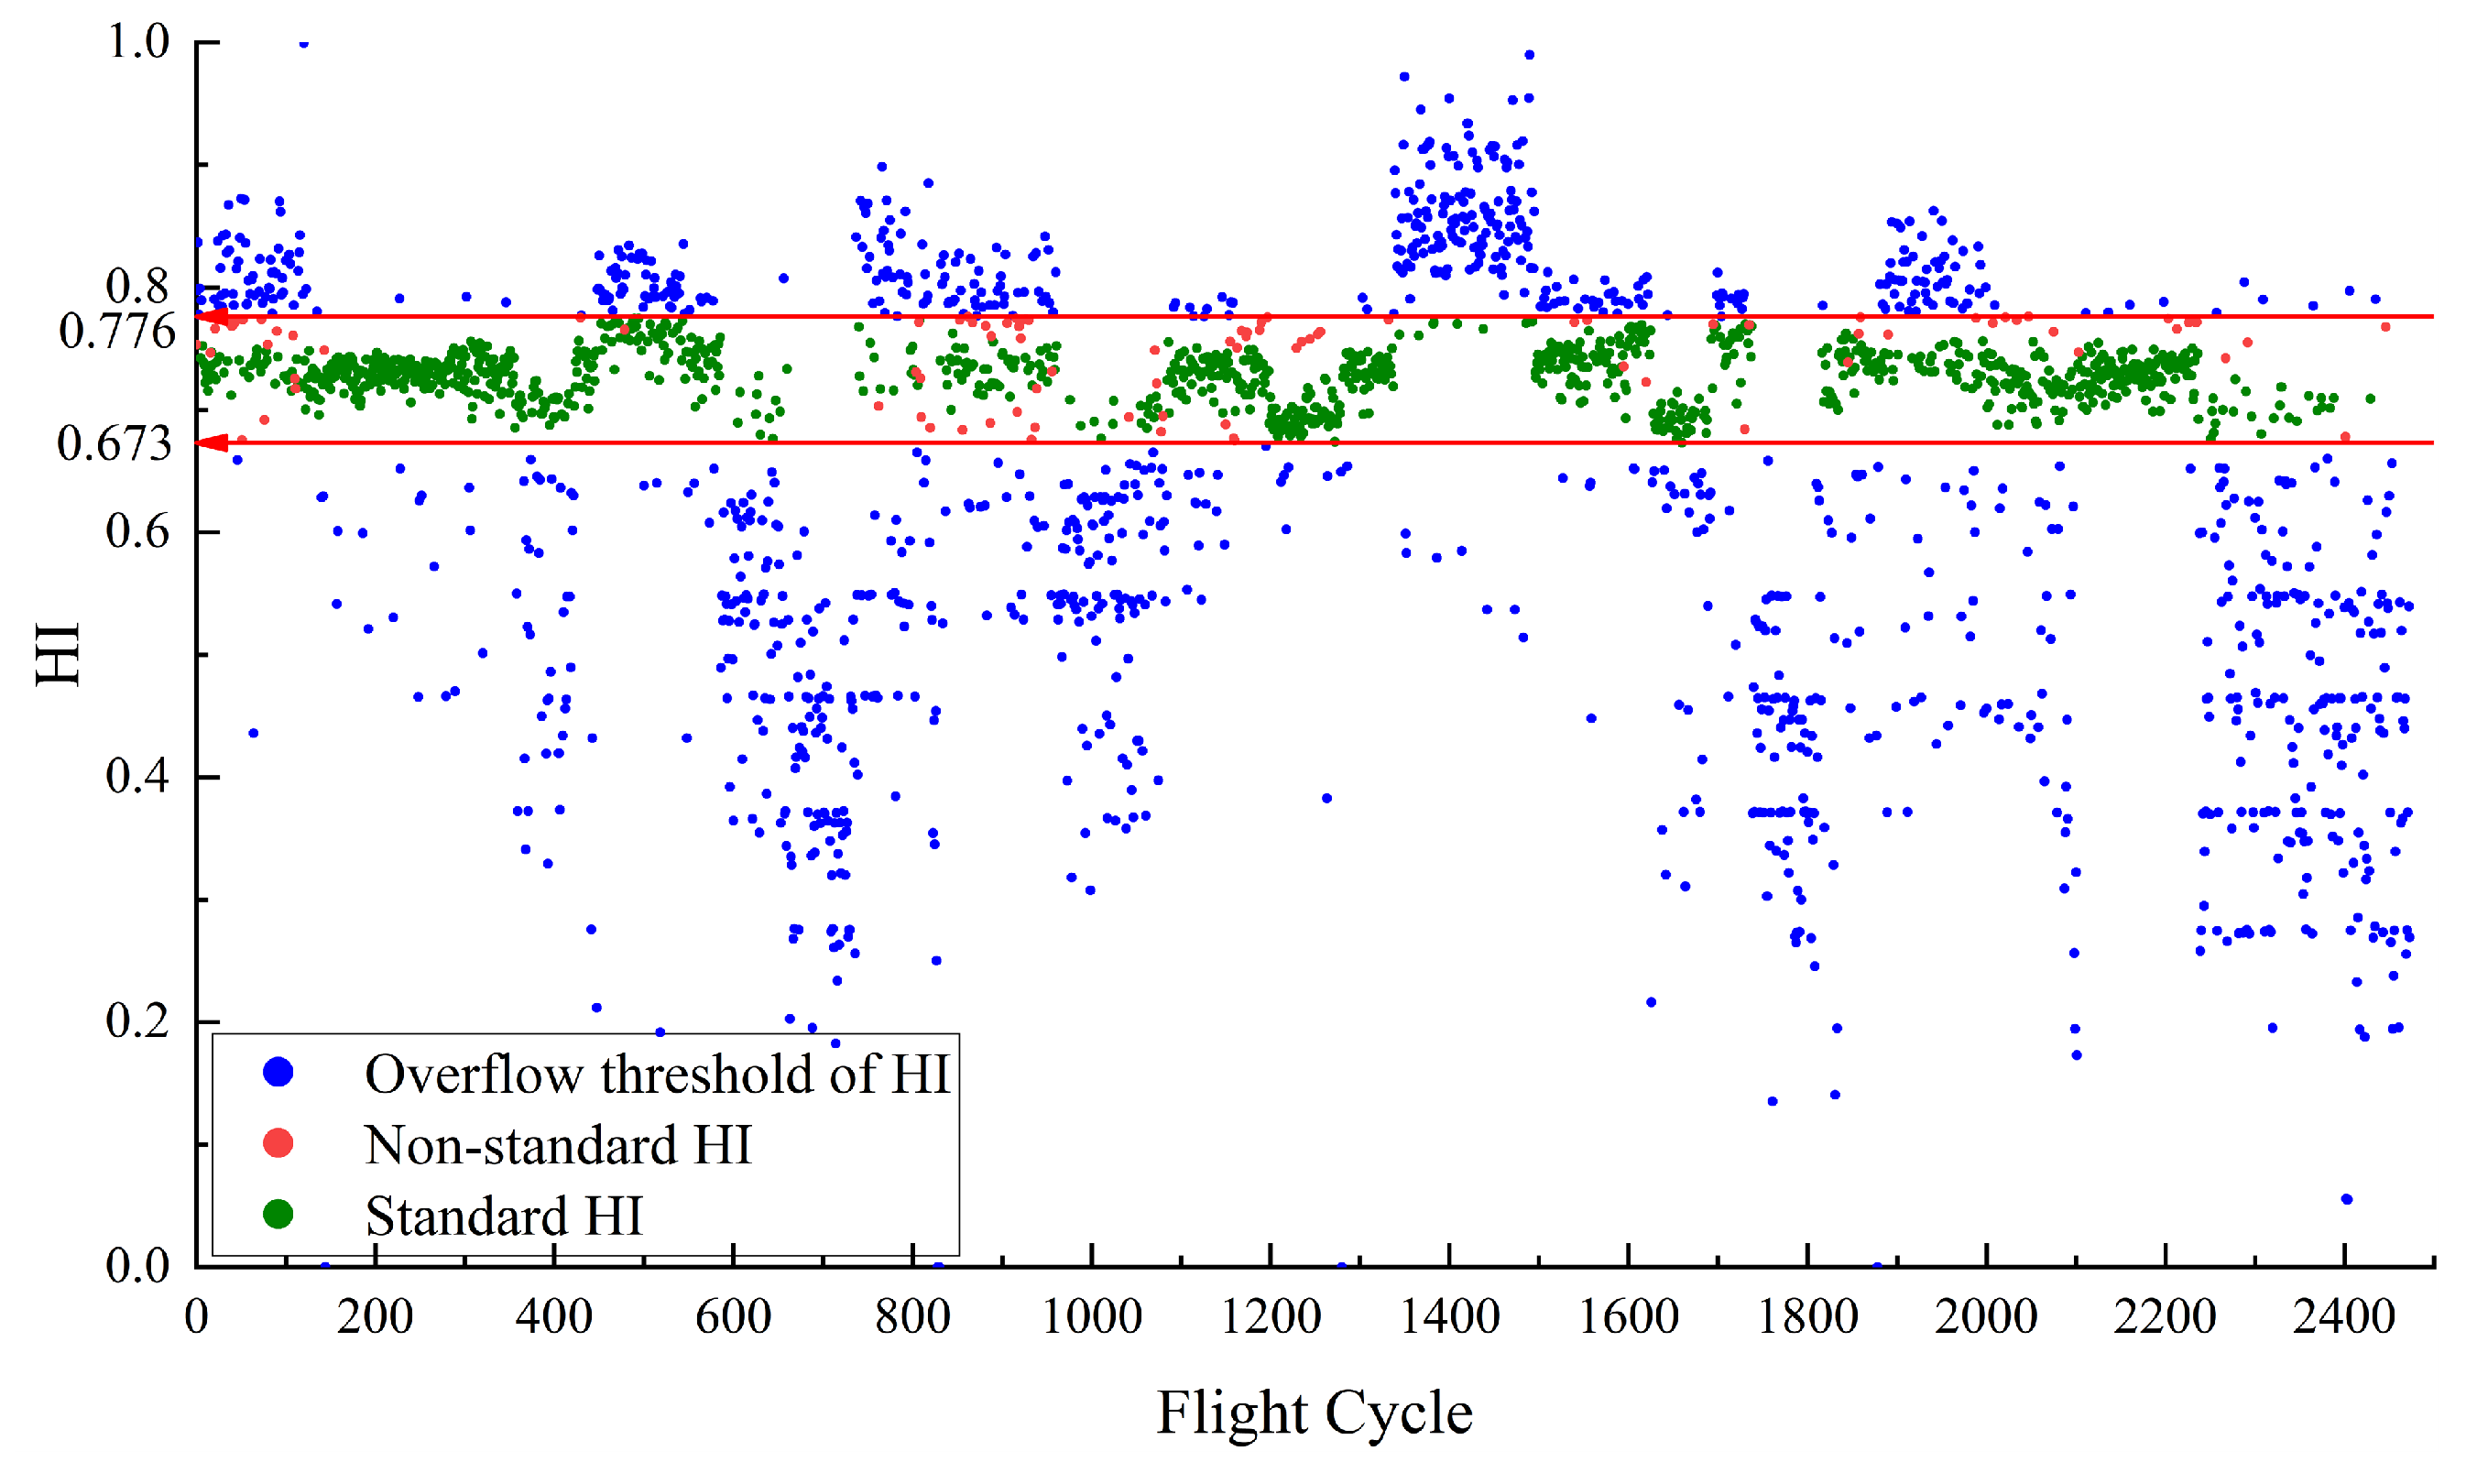
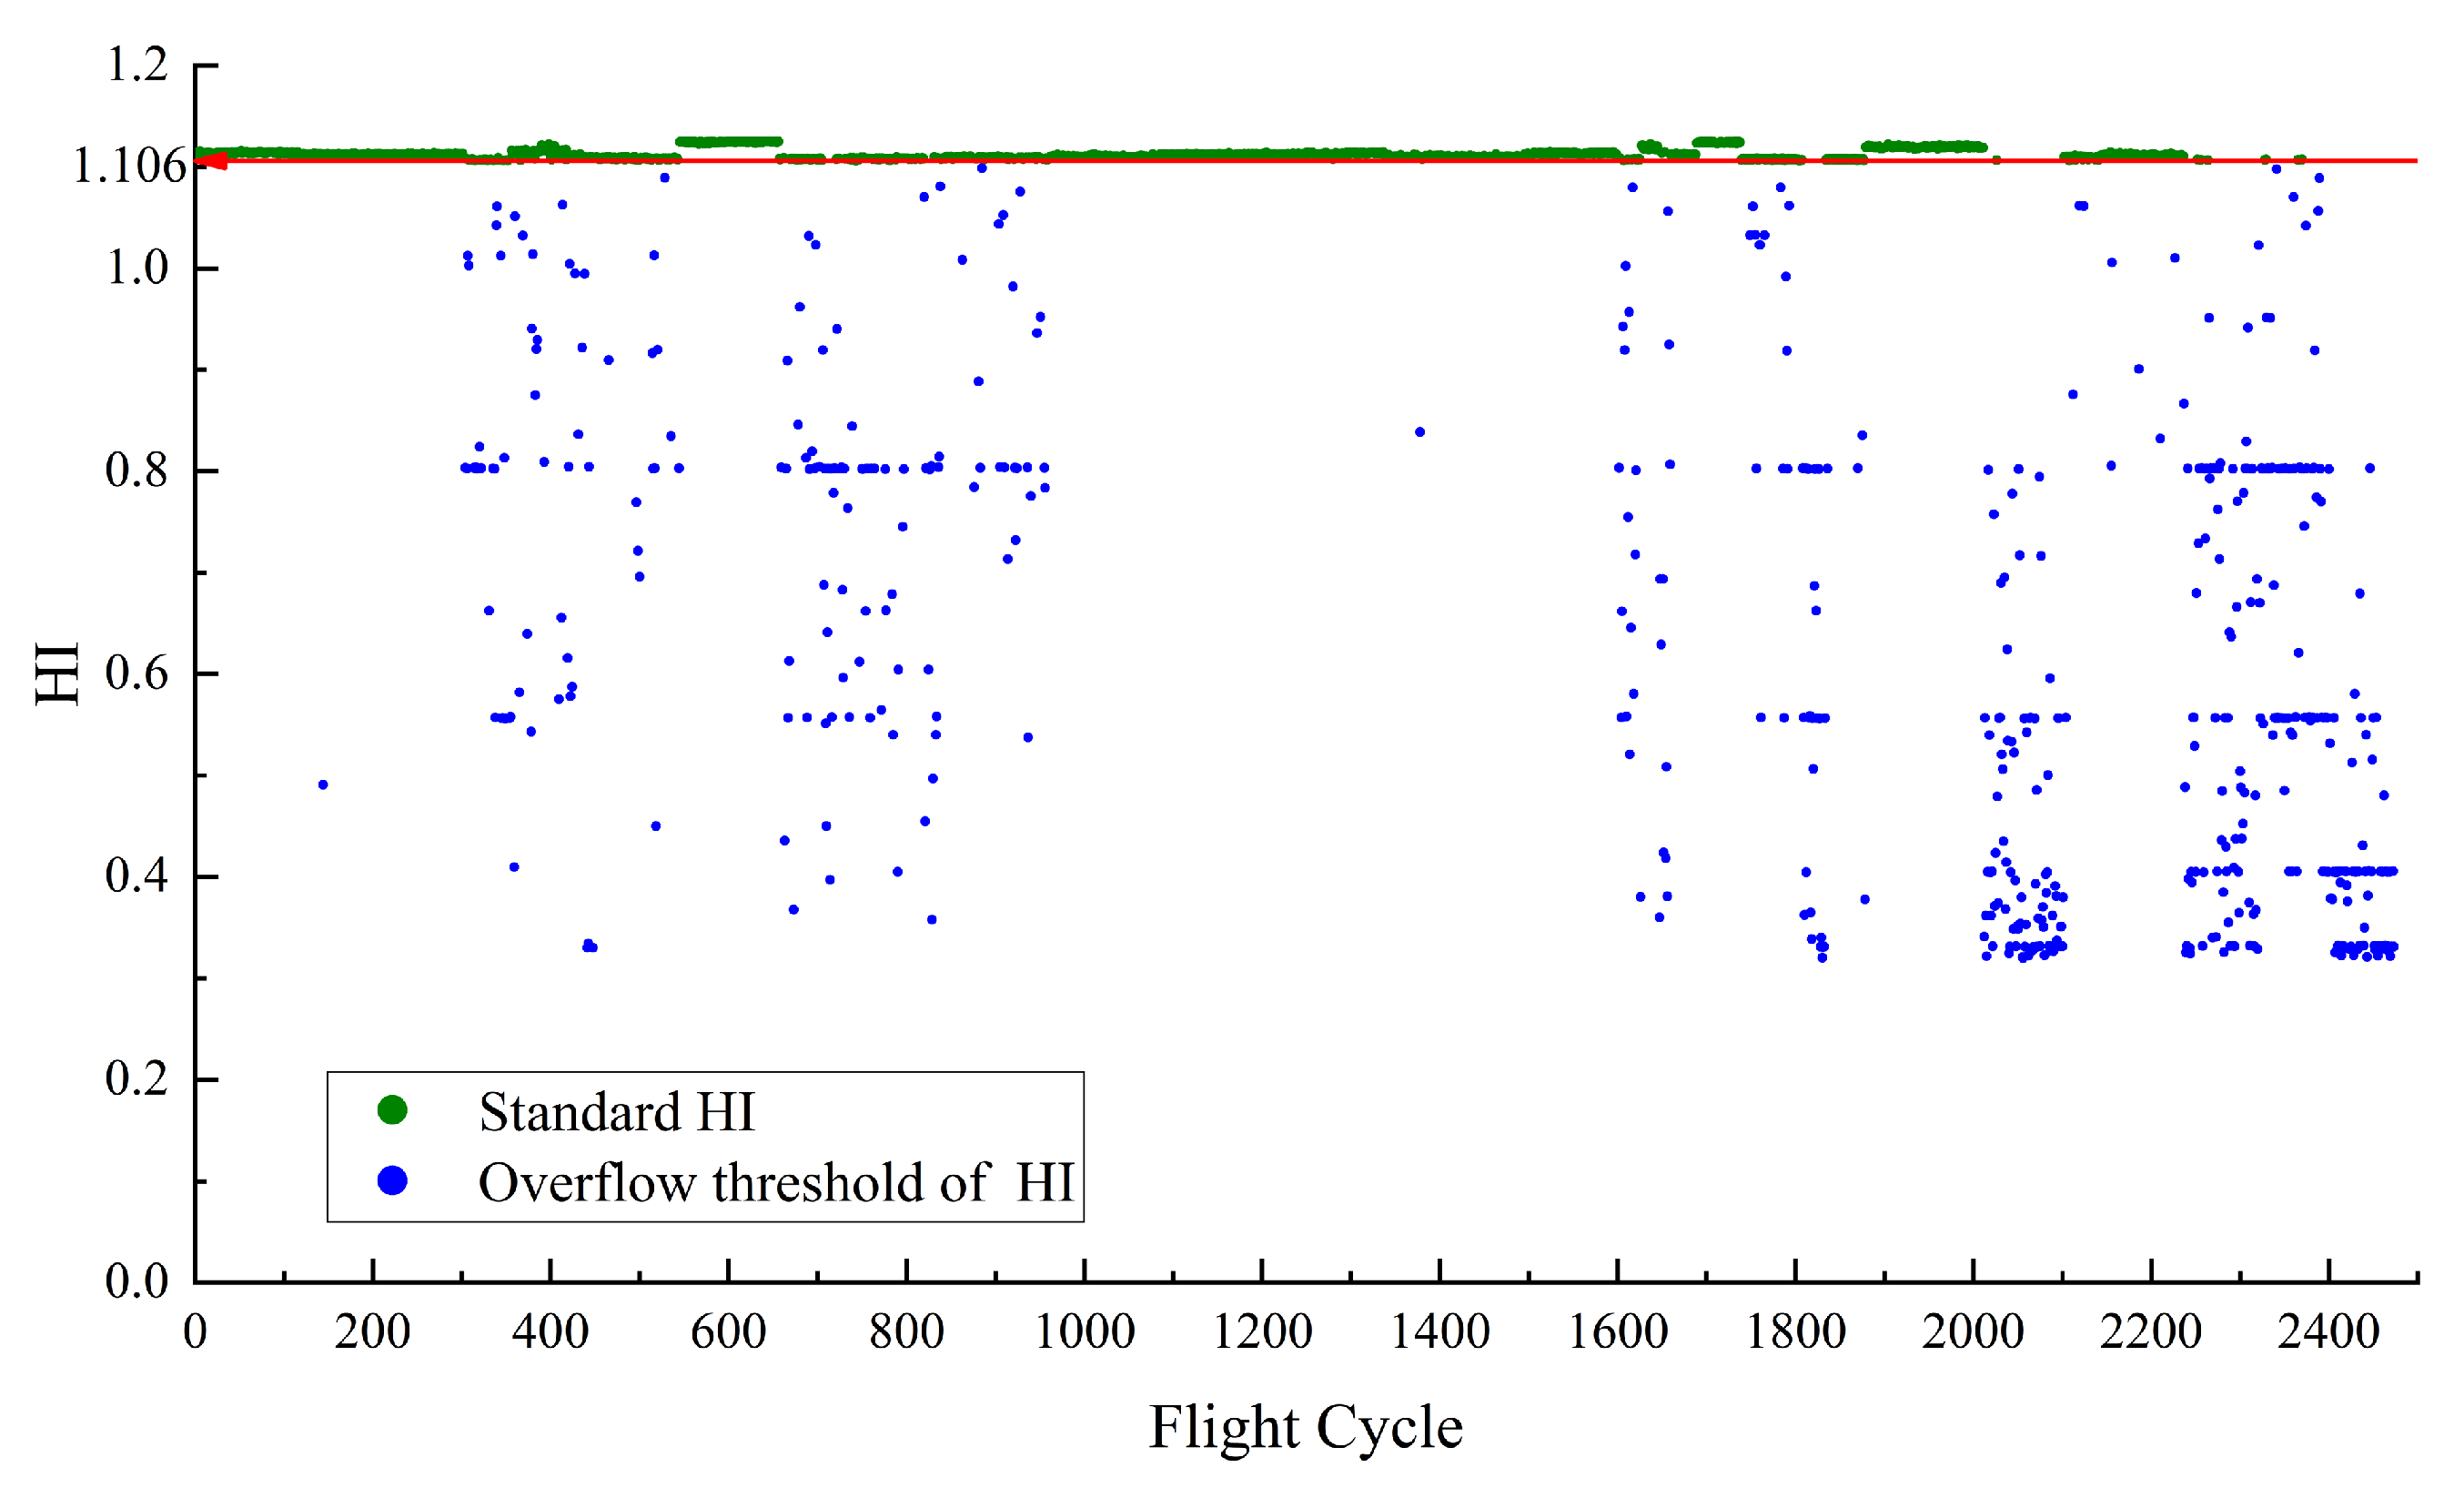
Figure 4 illustrates the HI for D P constructed using RDAE. The red line in Figure 4 represents the performance baseline, with a HI threshold range of [0.644, 0.765]. The green points indicate the normal samples that satisfy the maximum and minimum values of D P . sample points that satisfy 53 > D P 34 are considered as normal sample points. Their corresponding HI values are defined as the standard HI, which are in HI range of [0.644, 0.765]. Figure 4 illustrates that due to the baseline [0.644, 0.765], the green points and blue points are effectively separated. However, there are some red points within the baseline. The red points are defined as non-standard HI, indicating samples that do not meet the normal feature conditions but fall within the baseline boundary. There are no red points which means all abnormal points are separated.
The presence of some red points within the baseline range in Figure 4 can be attributed to the different mechanism for mapping data features and setting threshold values. The red points correspond to D P that exceed the experimentally set threshold values. However, the extracted data features by the model are complex and do not solely represent the magnitude of D P . As a result, these samples are mistakenly mapped within the baseline range.
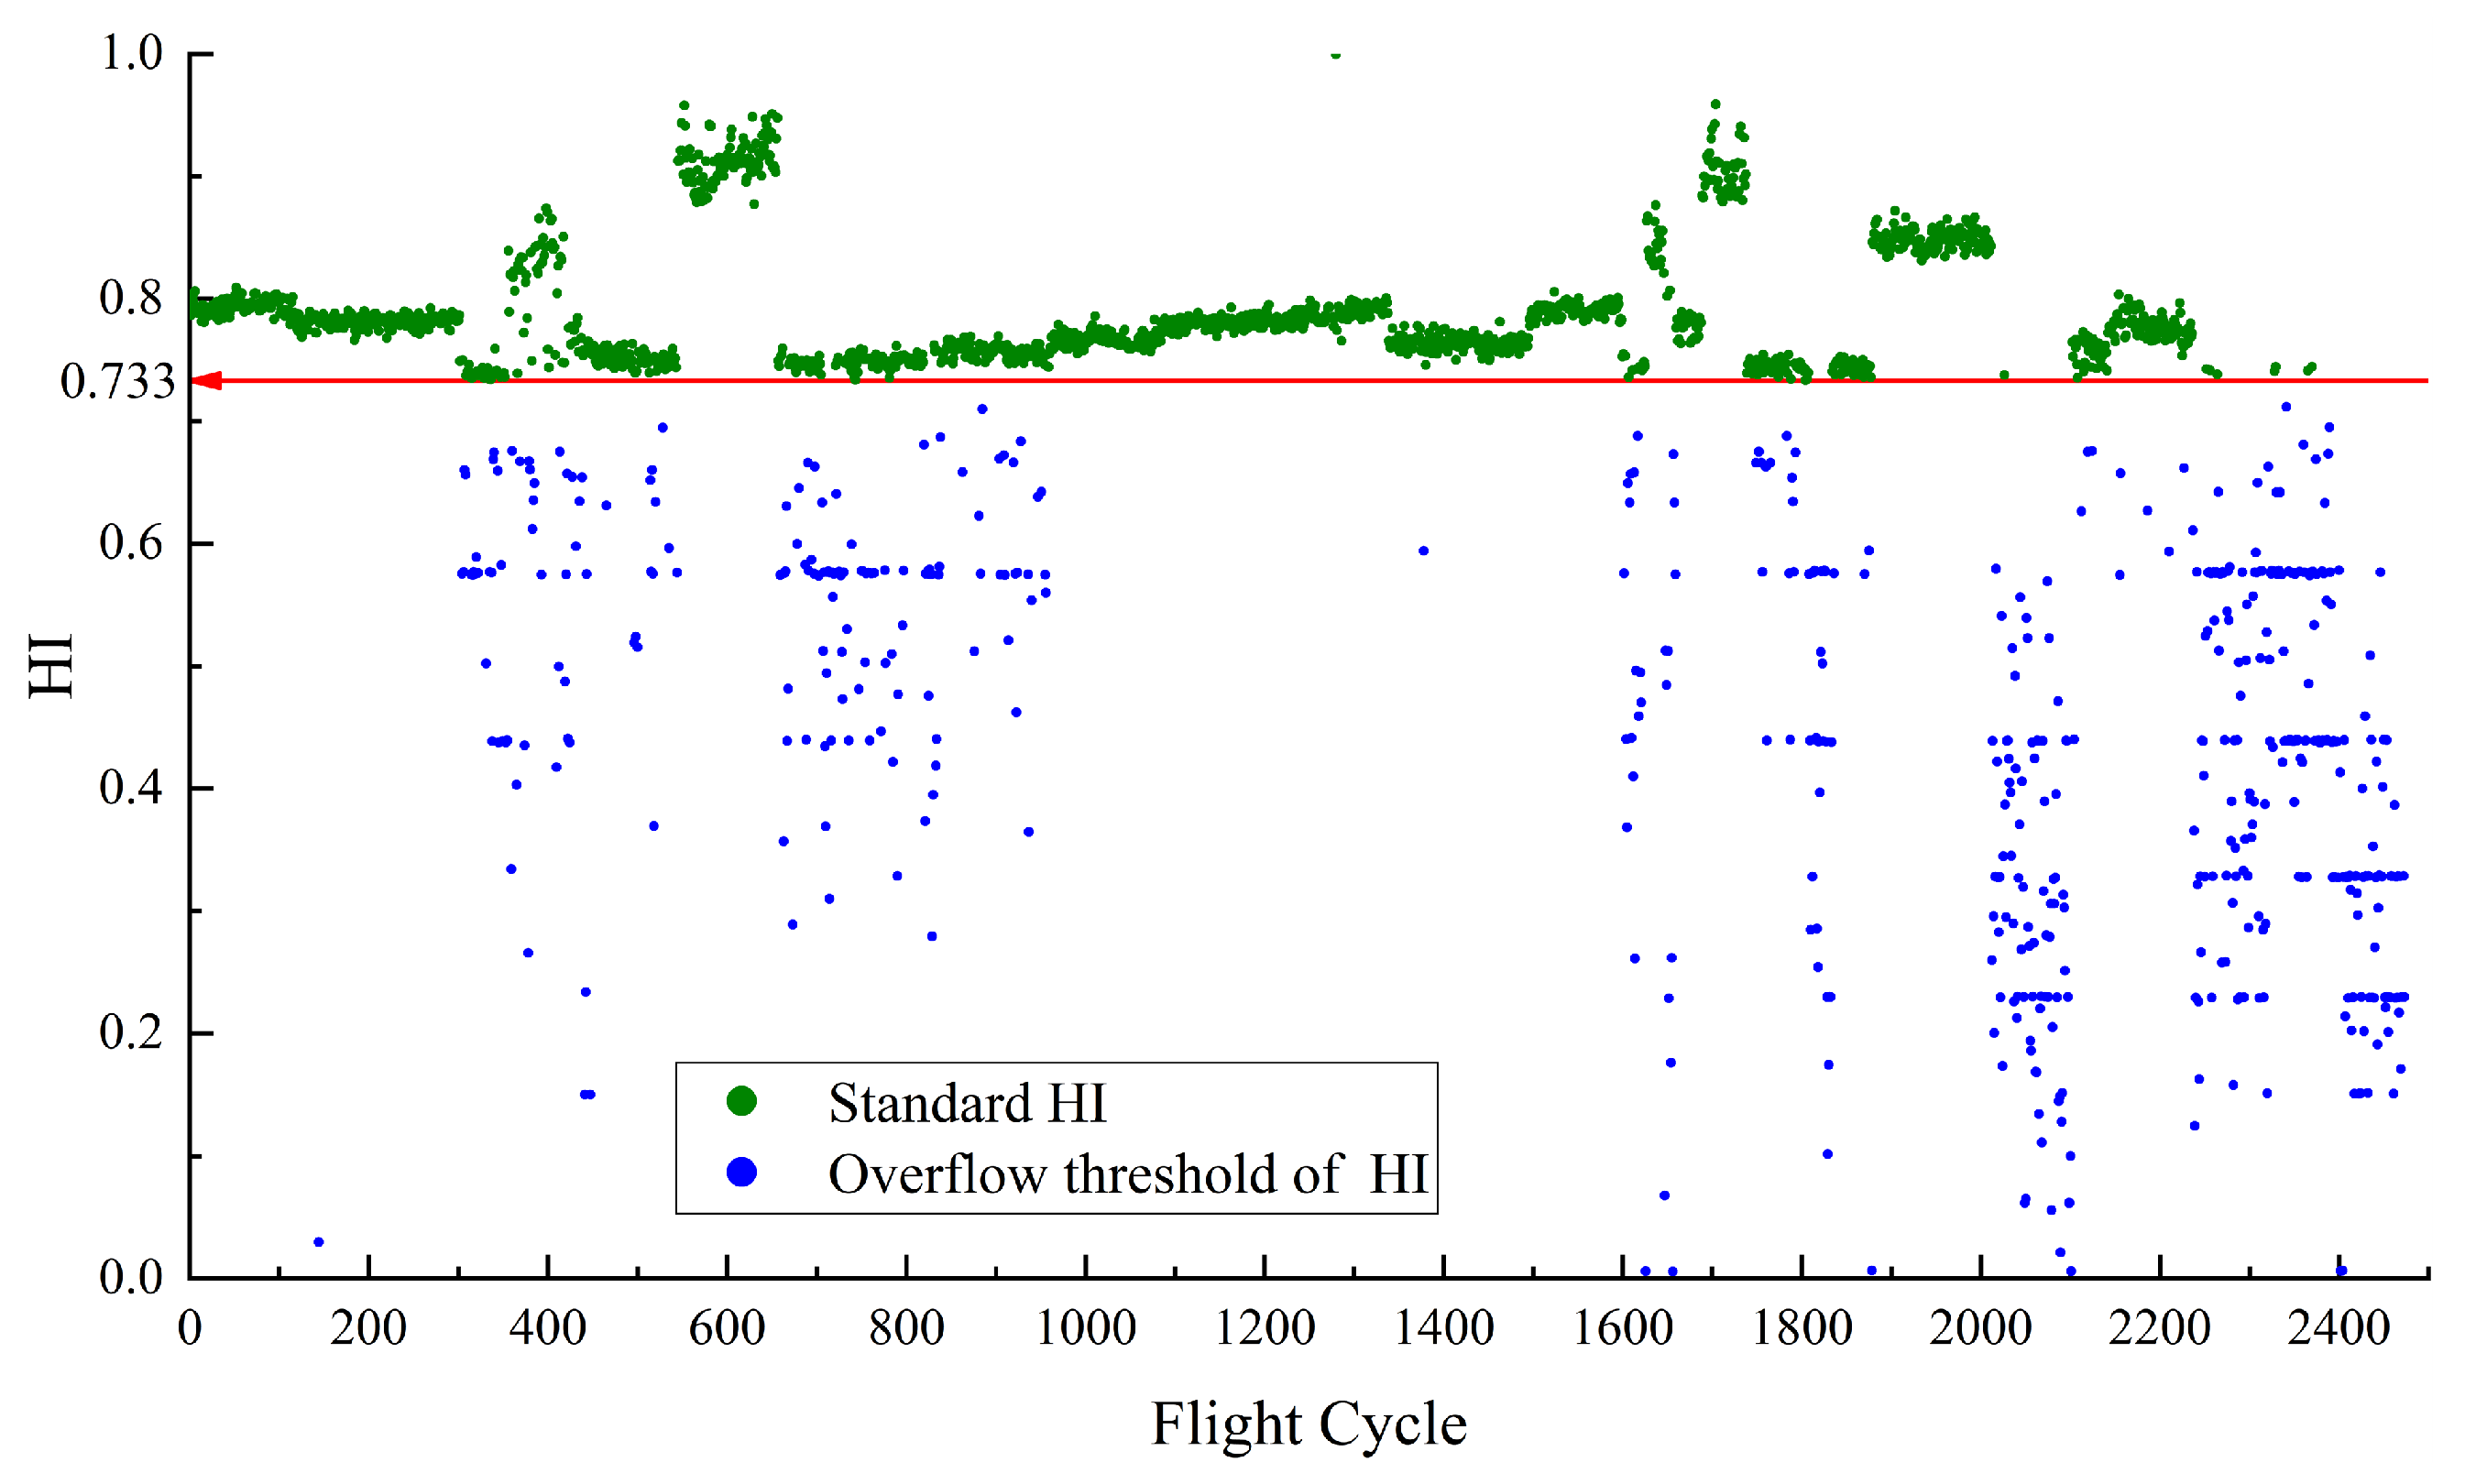
Figure 5 depicts the HI for P C O T constructed using RDAE. In the calculation of HI, if the P C O T temperature is higher, the resulting HI value is smaller. Therefore, the upper limit value of temperature corresponds to the lower limit value of HI. The red line in the Figure 5 represents the performance baseline, with a HI lower limit of 0.733. The normal sample points for this case are determined by selecting the samples that satisfy P C O T 455 . Their corresponding HI values are defined as the standard HI, which are the points above the baseline 0.733. As the performance anomaly detection is focused on high temperatures, no upper limit is specified for the HI of P C O T . The red points represent non-standard HI samples that do not meet the normal feature conditions but fall within the baseline threshold. There are no red points which means all abnormal points are separated.
Once the health indicators are constructed, it becomes easy to distinguish between normal and abnormal values for D P and P C O T . For D P , the baseline is defined as a range. When the calculated HI based on D P falls within this range, it can be considered as normal. For P C O T , the baseline is a lower limit. When the calculated HI based on P C O T is above this value, it can be considered as normal. This provides a relatively intuitive evaluation indicator, HI, which is concise and effective. The graph also shows some points where the actual values exceed the limits but the calculated HI still falls within the baseline range. The proportion of these points is known as the miss rate, which is an important metric for evaluating HI construction algorithms.
In addition, we also used the classical Deep Autoencoder (DAE) and Kernel Principal Component Analysis (KPCA) as comparative models to validate the performance of the health indicator construction in this paper. The HIs constructed by DAE are shown in Figure 6 and 
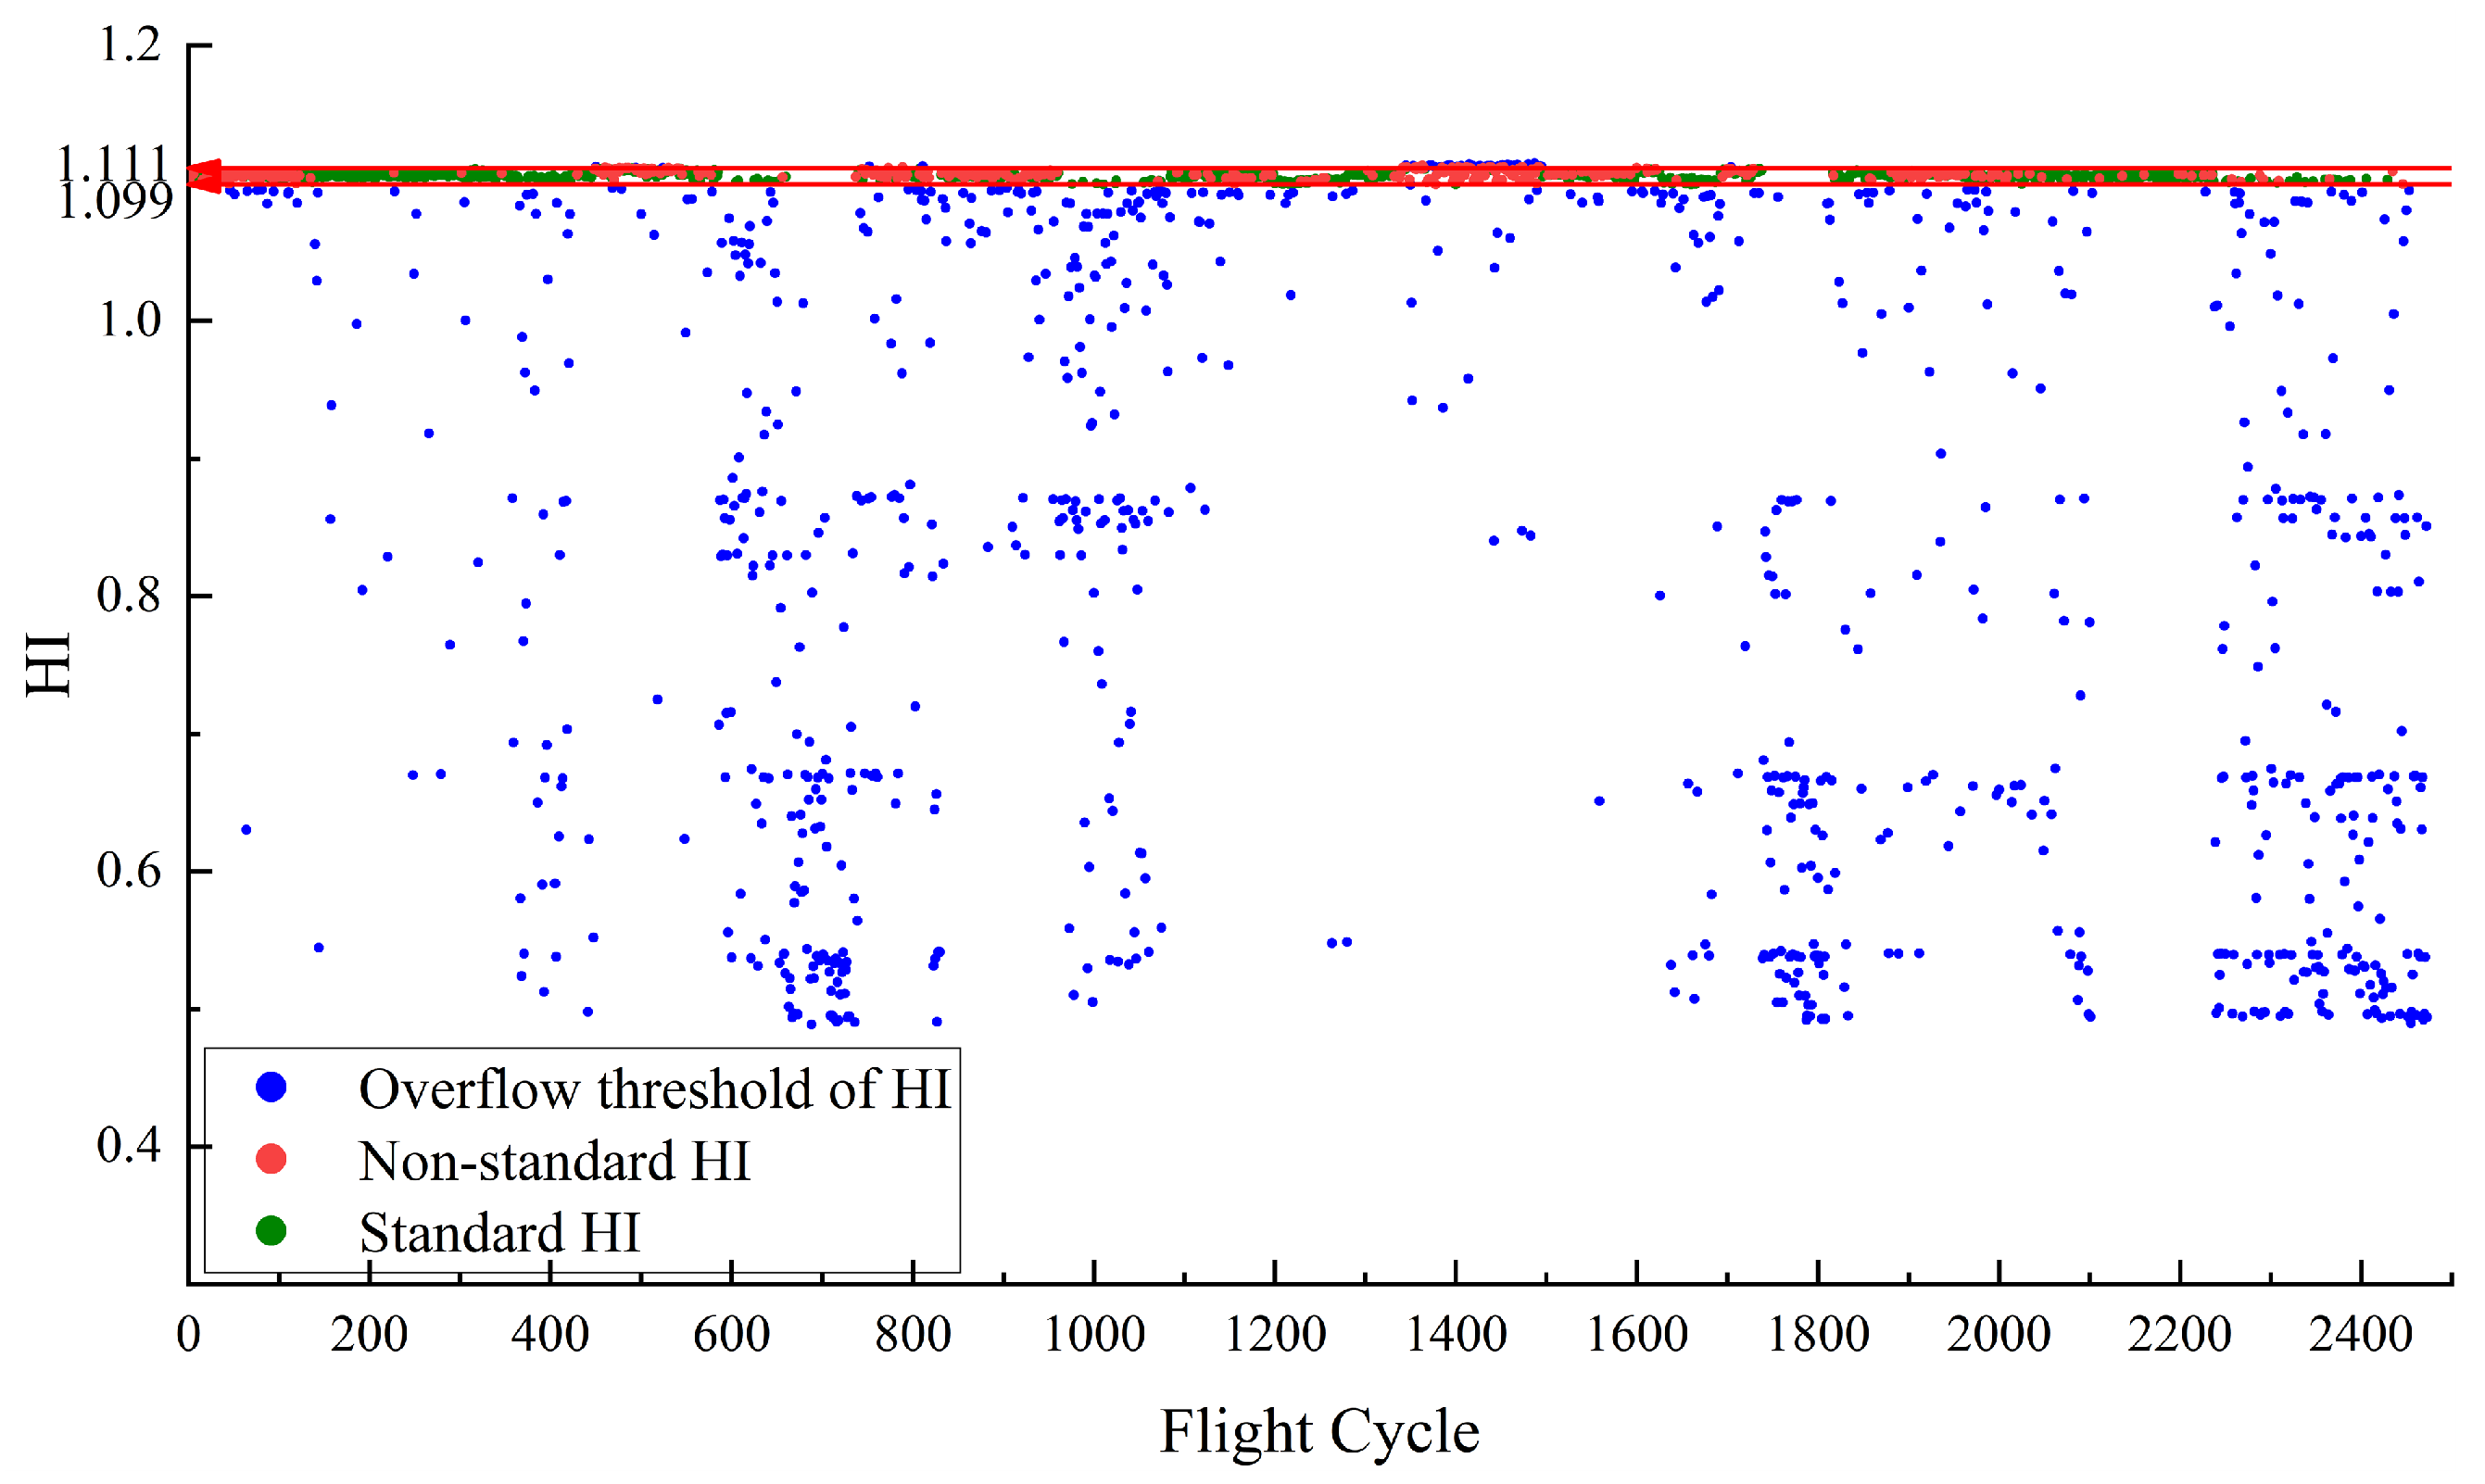
Figure 7, respectively. The HIs constructed by KPCA are shown in Figure 8 and Figure 9, respectively.
By comparing Figure 4, Figure 6 and Figure 8, RDAE has learned the distribution of data-level features more effectively than KPCA. Through RDAE feature mapping, the health status of the system for each flight cycle can be quantitatively evaluated.
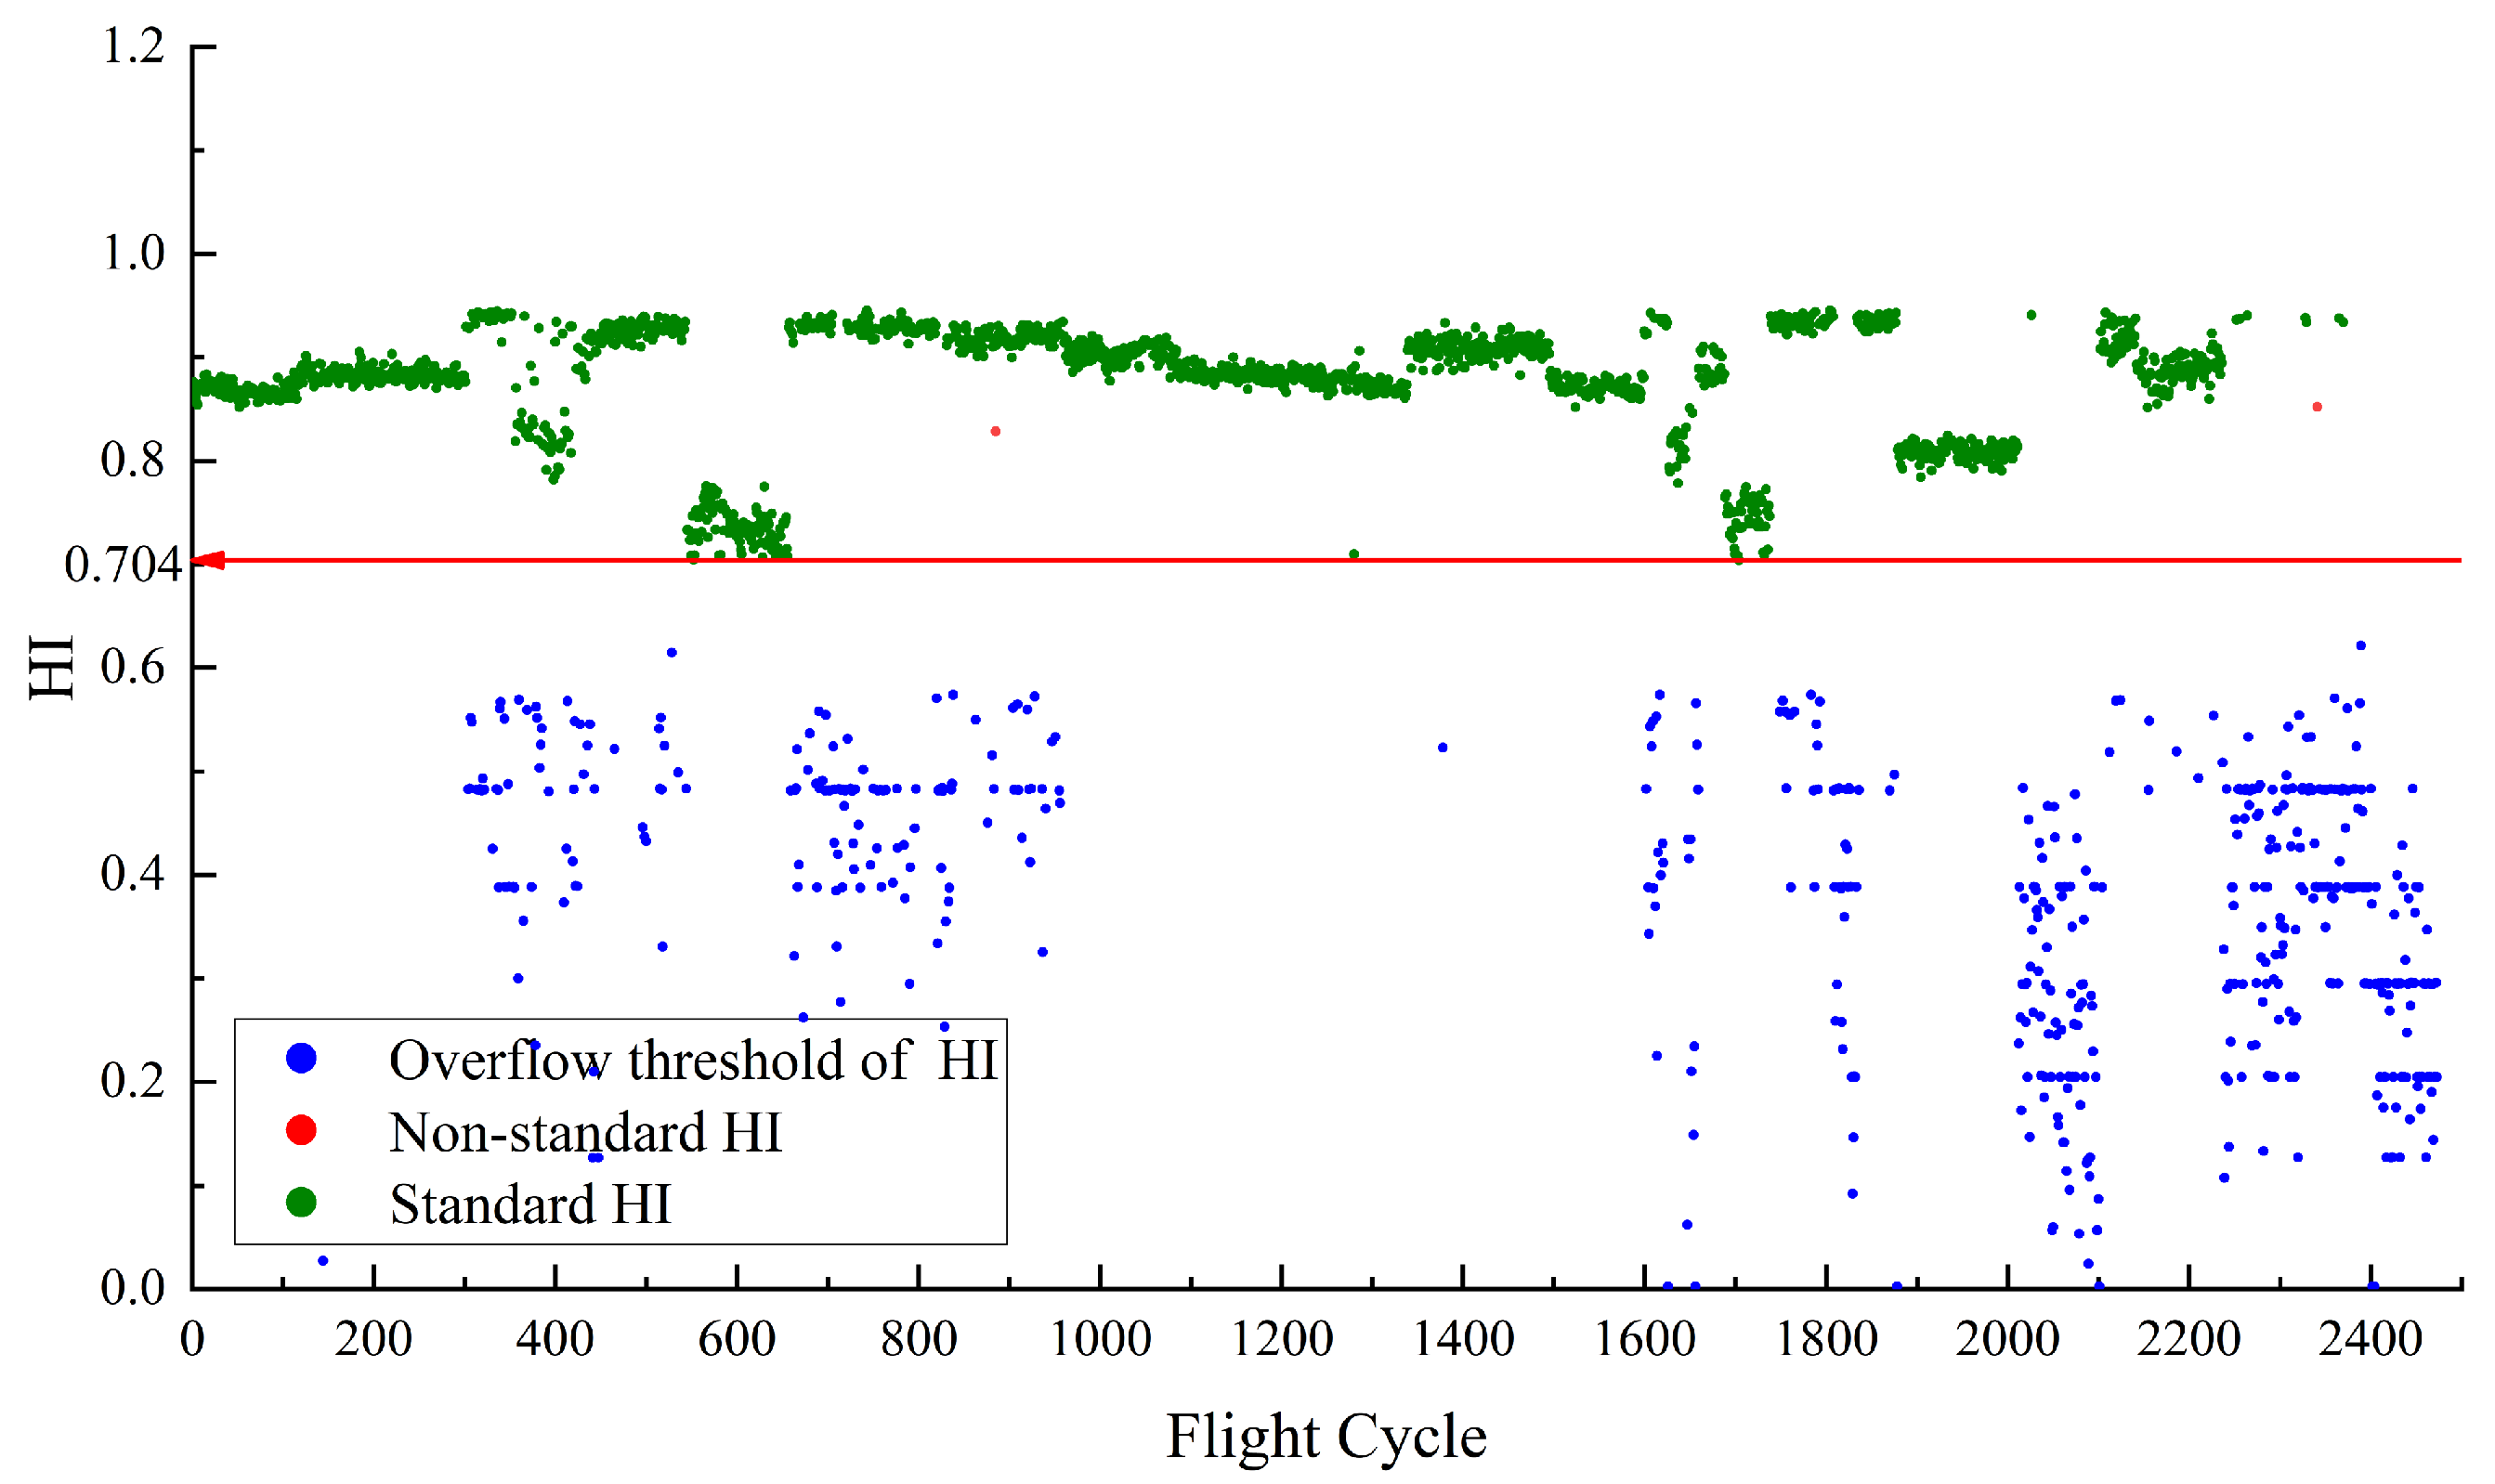
 Figure 6 shows The D P HI constructed by DAE has a higher number of non-standard HIs compared to RDAE, indicating slightly weaker separation performance between normal and abnormal samples. However, Figure 8 shows that there is a significant number of non-standard HIs within the baseline constructed by KPCA. This can introduce interference in the analysis of system performance in practical engineering.
Figure 5, Figure 7 and Figure 9 reveal the performance differences among the three models in constructing the HI for P C O T . It is important to note that in Figure 7, there are non-standard HIs present in the points constructed by DAE, indicating its relatively inferior performance in separating normal and abnormal samples compared to RDAE and KPCA. Although KPCA has constructed an HI curve with almost no non-standard HIs within the baseline, the distribution is not sufficiently uniform. The overall curve in the early stage of performance degradation is too flat, which hinders the prediction model from fully learning the characteristics of HI variations.
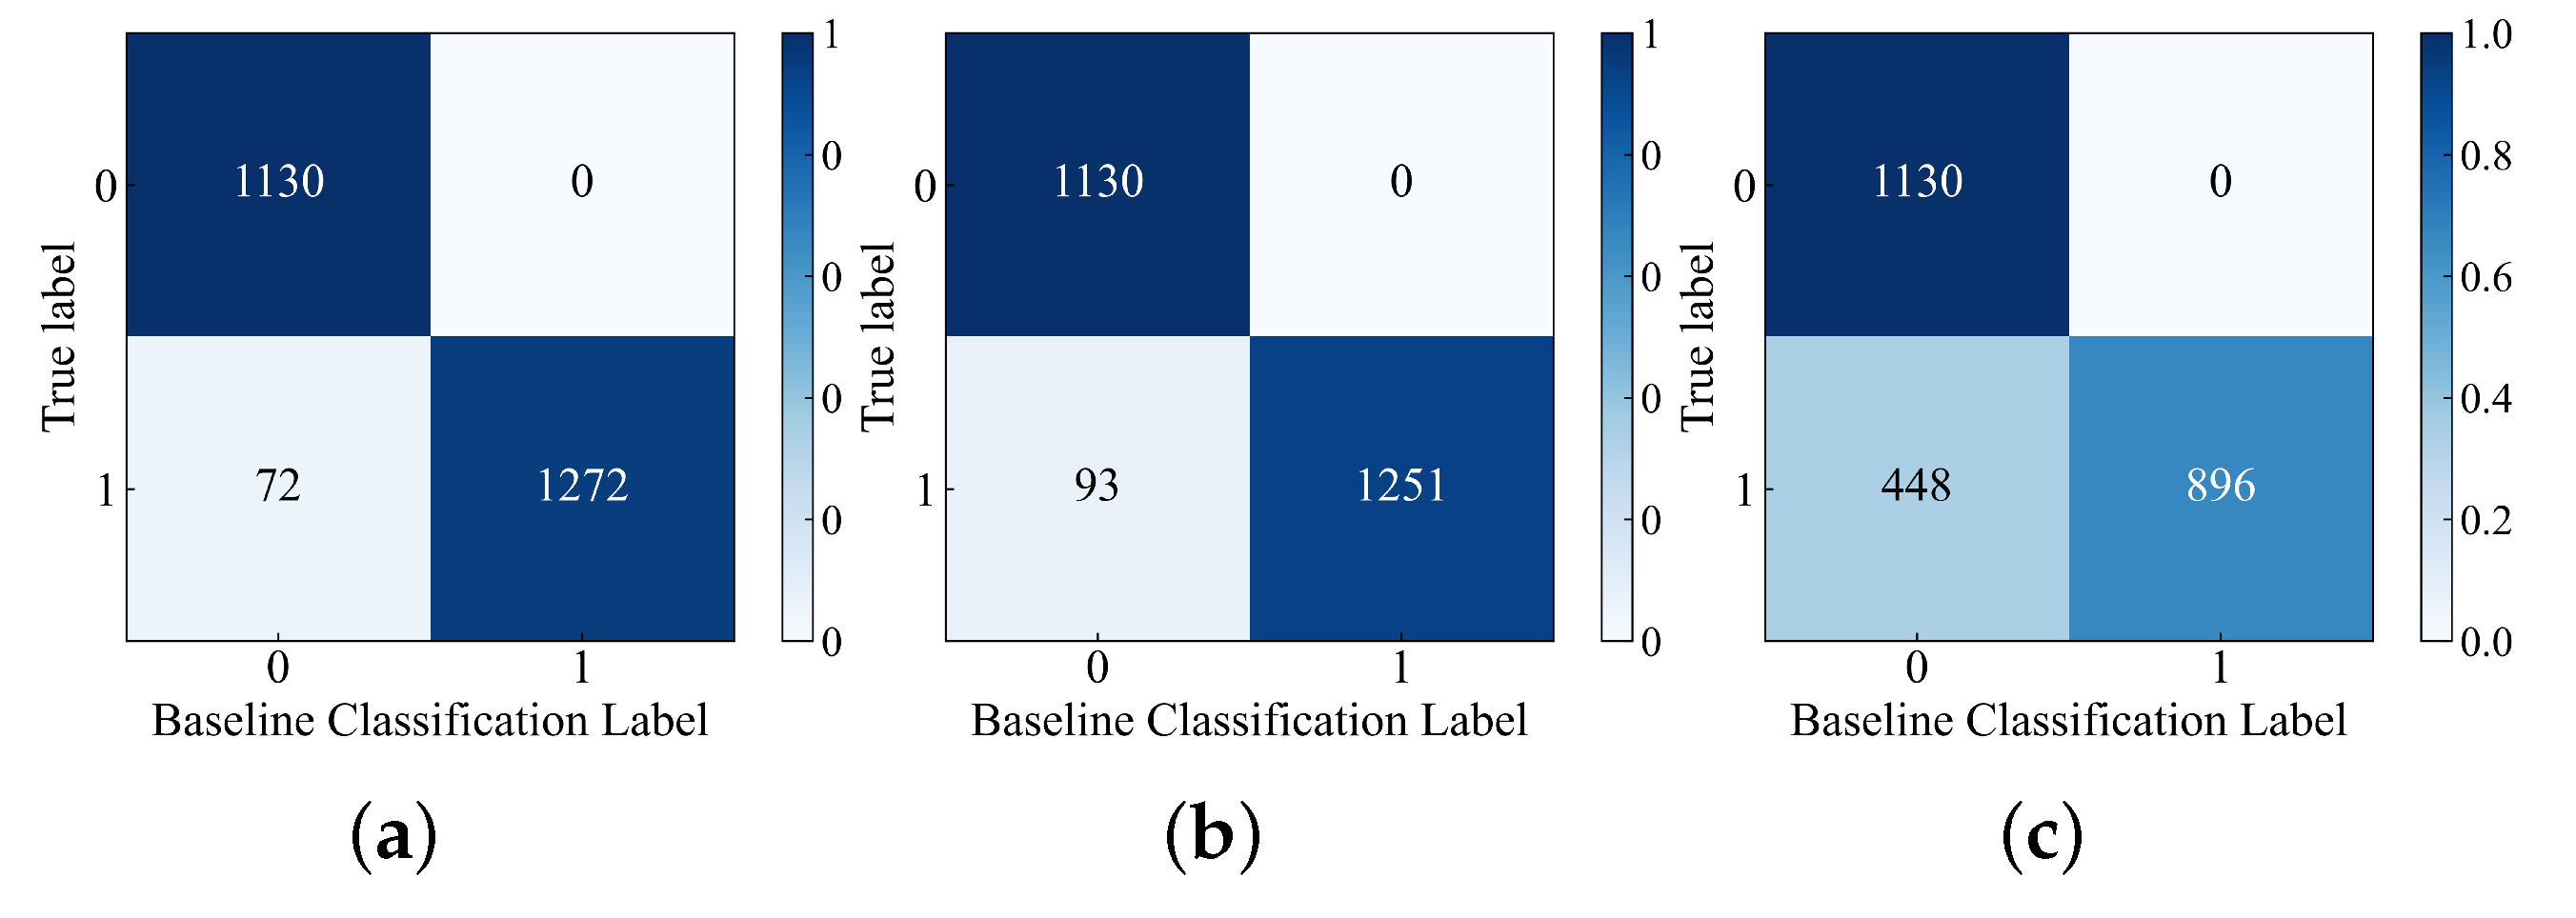
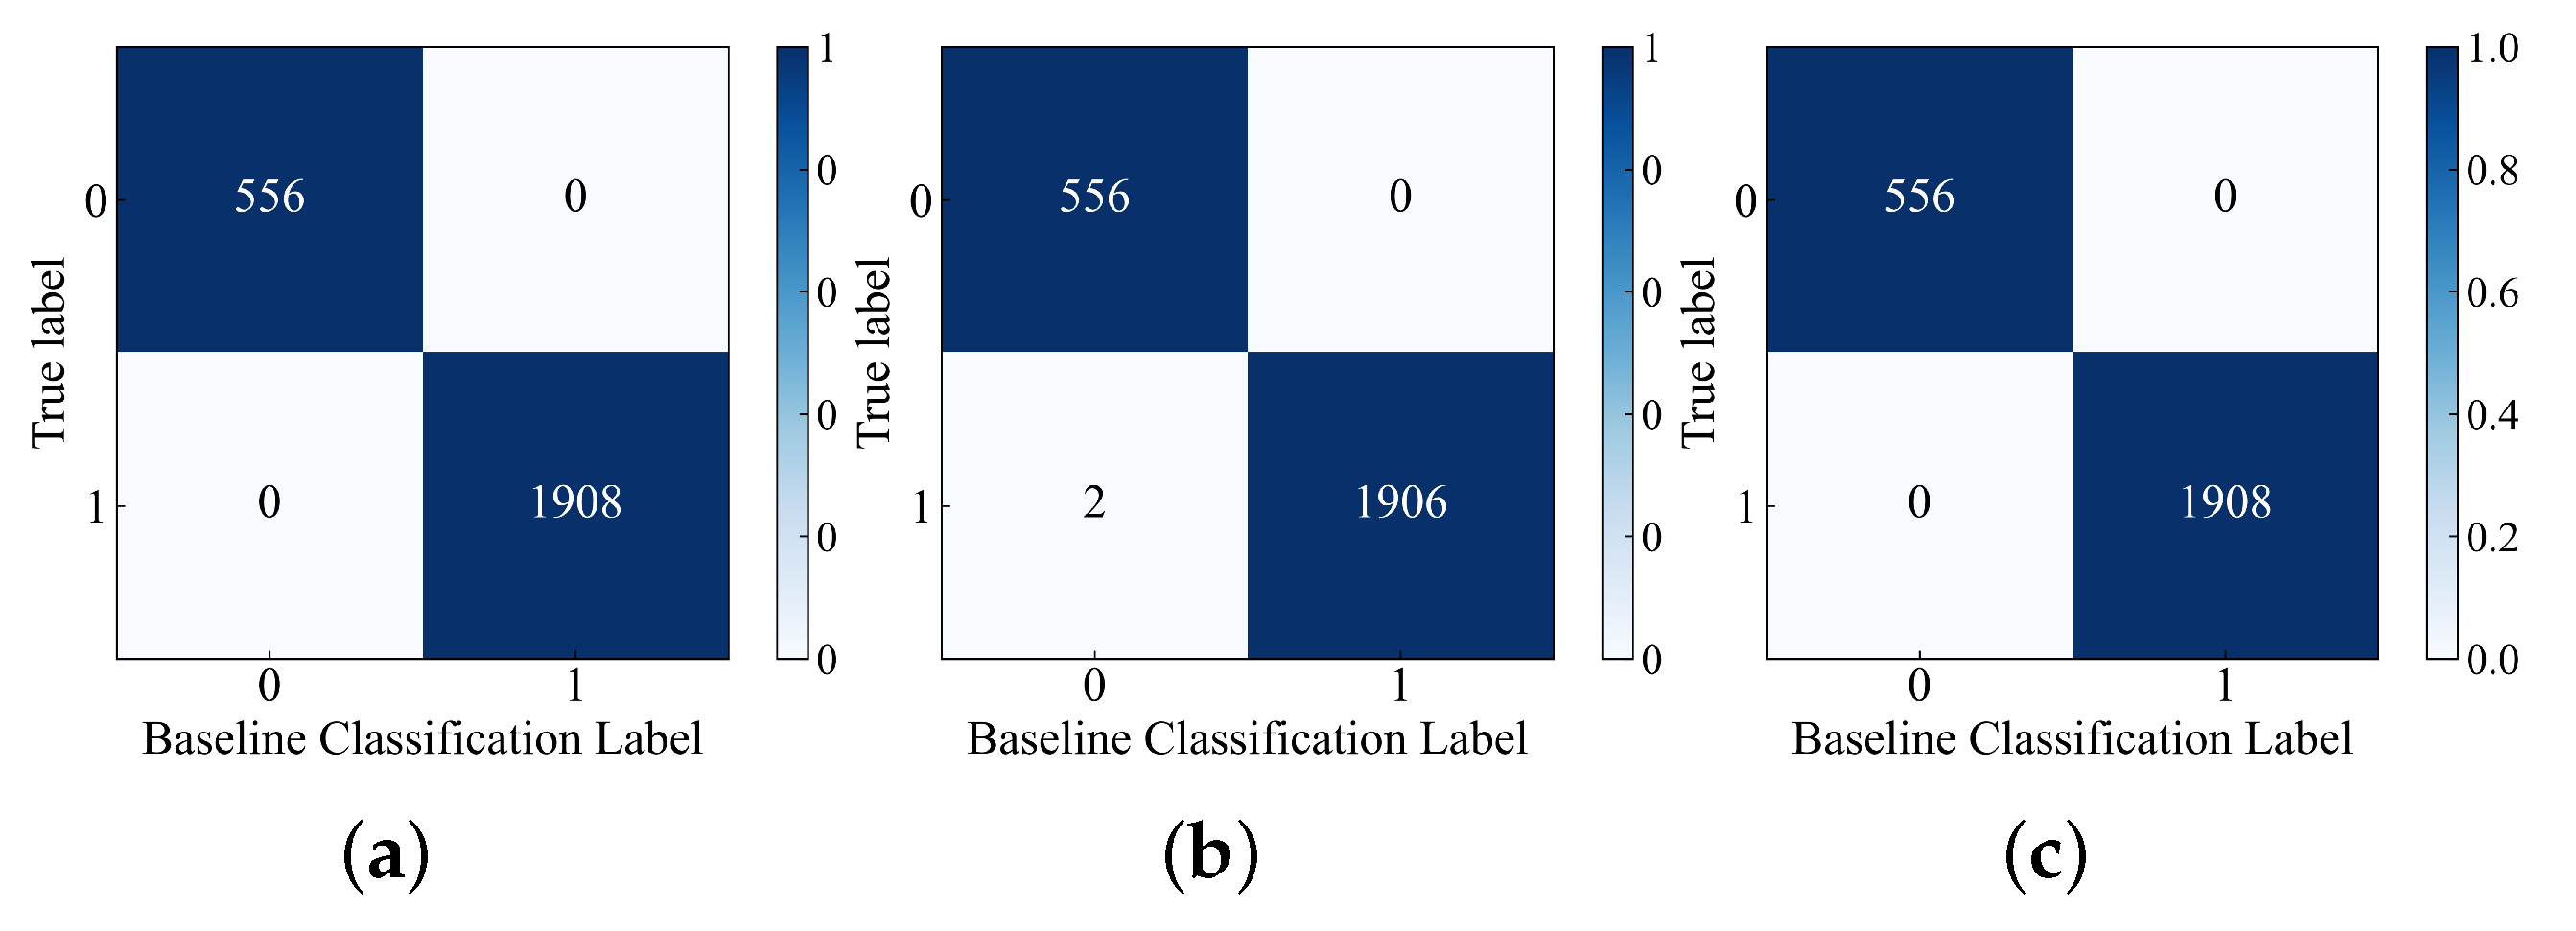
To visually assess the performance of the HI construction models in separating normal and abnormal samples, the results obtained from Figure 4, Figure 5, Figure 6, Figure 7, Figure 8 and 
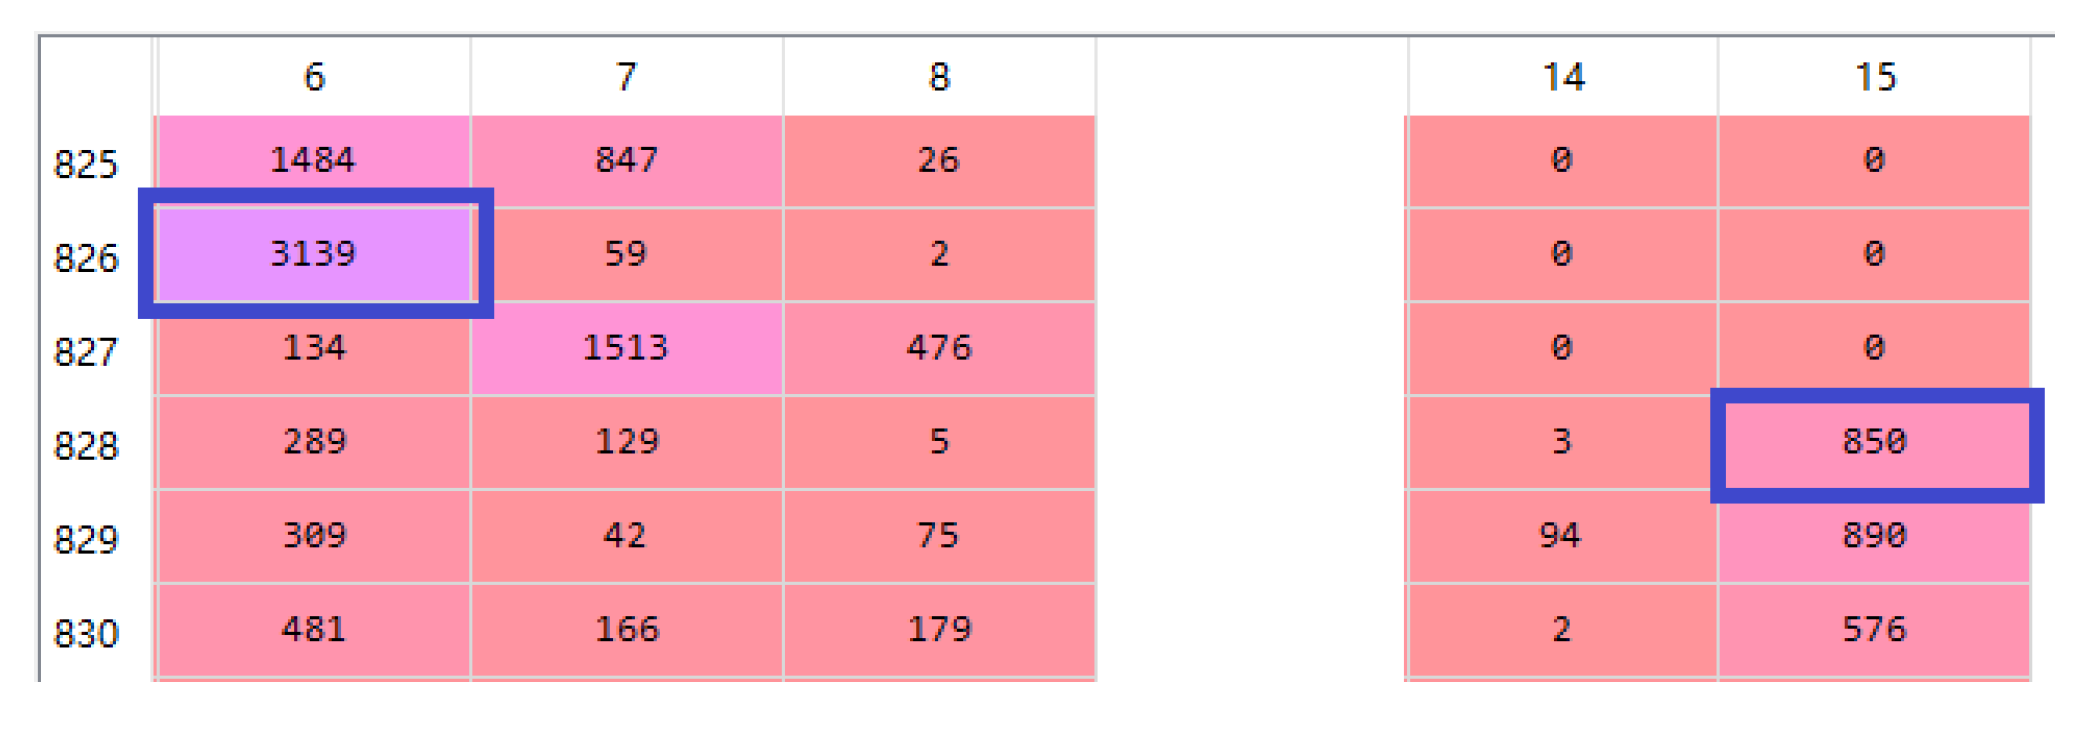
Figure 9 were visualized using confusion matrix plots, as shown in Figure 10 and Figure 11. In Figure 10 and Figure 11, the label “0” represents normal samples, and the label “1” represents abnormal samples. The confusion matrix represents the cases of classification errors. For example, in Figure 10a, the true label “0” is classified into baseline classification label “0” and “1” with counts of 1130 and 0 respectively. Similarly, the true label “1” is classified into baseline classification label “0” and “1” with counts of 72 and 1272 respectively. The meanings of the remaining figures are also similar.
Since the baselines in Figure 4, Figure 5, Figure 6, Figure 7, Figure 8 and Figure 9 are set based on the HI values of normal samples, there are no cases in Figure 10 and Figure 11 where label “0” is misclassified as label “1”. In Figure 10a, the number of cases where label “1” is misclassified as label “0” is the lowest compared to Figure 10b,c, indicating that the RDAE model has the strongest performance in separating normal and abnormal samples. In Figure 11, both Figure 11a,c plots have no misclassifications. Therefore, it can be concluded that the RDAE model has the best performance.
Additionally, this study compares the miss rate (Equation (3)) [21] as an evaluation metric to quantify the performance of the HI construction models in separating normal and abnormal samples. The results are shown in Table 2.
M = N i n N a b
In Equation (3), M is the miss rate. N i n represents the number of abnormal samples that fall within the baseline threshold. N a b represents the total number of abnormal samples. According to Table 3, the miss rate of RDAE for D P is 0.0523, indicating that it can correctly identify 94.77% of abnormal HI in the batch of flight cycles. The RDAE model achieves a miss rate of 0.00% for P C O T , meaning it can identify all abnormal samples in the batch. DAE exhibits weaker performance in separating normal and abnormal samples, while KPCA has a high miss rate of 33.33% for D P . It is evident that RDAE outperforms the other two models in terms of the miss rate, demonstrating superior performance in separating normal and abnormal samples for both D P and P C O T .

4. Conclusions

This study addresses the challenge of assessing the health status of the engine bleed air system. It utilizes QAR data as experimental support, and proposes a multi-level feature extraction method to construct health indicators for the system. First, the original QAR data undergoes data-level feature extraction to compress the uneven-length and unannotated data into consistent-length feature vectors that can represent performance anomalies. Second, the RDAE, employing unsupervised learning, performs feature-level feature extraction on the feature vectors to obtain a subset of features in the hidden space, which is used to construct health indicators for the D P and P C O T . Finally, in the HI construction experiment, the separation performance of the HI curves between normal and abnormal samples is compared, and it is found that RDAE demonstrates better performance in constructing health indicators.
The method we propose offers valuable insights into assessing the health status of the engine bleed air system and enables preventive maintenance strategies. By providing a decision-making framework for proactive maintenance, our method empowers airlines to effectively manage the engine bleed air system. Furthermore, our approach establishes a foundation for regression prediction of the system’s health status, allowing for early detection of potential issues and optimization of maintenance schedules. This ultimately helps airlines reduce operational costs and ensure long-term fleet reliability.

Author Contributions

Conceptualization, Z.D., X.C. (Xidan Cao) and F.H.; Methodology, Z.D. and X.C. (Xidan Cao); Software, X.C. (Xidan Cao) and F.H.; Validation, Z.D. and X.C. (Xidan Cao); Investigation, P.W.; Resources, X.C. (Xidan Cao) and F.H.; Data curation, X.C. (Xidan Cao); Writing—original draft, Z.D., X.C. (Xidan Cao), F.H. and P.W.; Writing—review & editing, Z.D., F.H. and X.C. (Xi Chen); Visualization, X.C. (Xi Chen); Supervision, P.W.; Project administration, P.W.; Funding acquisition, L.D. All authors have read and agreed to the published version of the manuscript.

Funding

This work was supported in part by the Supported by the Open Fund of Key Laboratory of Civil Aircraft Airworthiness Technology SH2021111905, in part by the Fundamental Research Funds for the Central Universities under Grant 3122022QD07, in part by the Fundamental Research Funds for the Central Universities under Grant 3122022044.

Informed Consent Statement

Informed consent was obtained from all subjects involved in the study.

Data Availability Statement

Data sharing not applicable.

Conflicts of Interest

The authors declare no conflict of interest.

References

  1. Shang, L.; Liu, G. Sensor and actuator fault detection and isolation for a high performance aircraft engine bleed air temperature control system. IEEE Trans. Control Syst. Technol. 2011, 19, 1260–1268. [Google Scholar] [CrossRef]
  2. Jianzhong, S.; Fangyuan, W.; Shungang, N. Aircraft air conditioning system health state estimation and prediction for predictive maintenance. Chin. J. Aeronaut. 2020, 33, 947–955. [Google Scholar]
  3. Saxena, A.; Goebel, K.; Simon, D.; Eklund, N. Damage Propagation Modeling for Aircraft Engine Run-to-Failure Simulation. In Proceedings of the 2008 International Conference on Prognostics and Health Management, Denver, CO, USA, 6–9 October 2008; IEEE: Piscataway, NJ, USA, 2008. [Google Scholar]
  4. Wu, Y.; Yuan, M.; Dong, S.; Lin, L.; Liu, Y. Remaining useful life estimation of engineered systems using vanilla LSTM neural networks. Neurocomputing 2018, 275, 167–179. [Google Scholar] [CrossRef]
  5. Guo, Y.; Sun, Y.; He, Y.; Du, F.; Su, S.; Peng, C. A Data-Driven Integrated Safety Risk Warning Model Based on Deep Learning for Civil Aircraft. IEEE Trans. Aerosp. Electron. Syst. 2023, 59, 1707–1719. [Google Scholar] [CrossRef]
  6. Lan, C.E.; Kaiyuan, W.; Jiang, Y. Flight Characteristics Analysis Based on QAR Data of a Jet Transport during Landing at a High-altitude Airport. Chin. J. Aeronaut. 2012, 25, 13–24. [Google Scholar] [CrossRef] [Green Version]
  7. Zou, F. Review of aero-engine defect detection technology. In Proceedings of the 2020 IEEE 4th Information Technology, Networking, Electronic and Automation Control Conference (ITNEC), Chongqing, China, 12–14 June 2020; Volume 1, pp. 1524–1527. [Google Scholar]
  8. Zhao, R.; Yan, R.; Chen, Z.; Mao, K.; Wang, P.; Gao, R.X. Deep learning and its applications to machine health monitoring. Mech. Syst. Signal Process. 2019, 115, 213–237. [Google Scholar] [CrossRef]
  9. Gui, G.; Liu, F.; Sun, J.; Yang, J.; Zhou, Z.; Zhao, D. Flight delay prediction based on aviation big data and machine learning. IEEE Trans. Veh. Technol. 2019, 69, 140–150. [Google Scholar] [CrossRef]
  10. He, K.; Zhang, X.; Ren, S.; Sun, J. Deep residual learning for image recognition. In Proceedings of the IEEE Conference on Computer Vision and Pattern Recognition, Las Vegas, NV, USA, 27–30 June 2016; pp. 770–778. [Google Scholar]
  11. Li, B.; Zhao, Y.P.; Chen, Y.B. Unilateral alignment transfer neural network for fault diagnosis of aircraft engine. Aerosp. Sci. Technol. 2021, 118, 107031. [Google Scholar] [CrossRef]
  12. Qin, H.; Yang, R.; Guo, C.; Wang, W. Fault diagnosis of electric rudder system using PSOFOA-BP neural network. Measurement 2021, 186, 110058. [Google Scholar] [CrossRef]
  13. Zhang, P.; Zhang, D.; Duan, Z.; Chen, Y. Application of IDE-ELM in fault diagnosis of civil aircraft steering system. Electron. Opt. Control 2020, 27, 97–101. [Google Scholar]
  14. Liang, K.; Zuo, H.; Sun, J.; Wang, R. Application of multiple linear regression to fault diagnosis of bleed air system. J. Beijing Univ. Aeronaut. Astronaut. 2015, 41, 1651. [Google Scholar]
  15. Su, S.; Sun, Y.; Li, L.; Peng, C.; Zhang, H.; Zhang, T. Risk Warning for Aircraft Bleed Air System with Multivariate State Estimation Technique. J. Aerosp. Inf. Syst. 2022, 19, 550–564. [Google Scholar] [CrossRef]
  16. Al-Wadiee, W. Failure Forecast of Boeing 737 Bleed Air System Using Artificial Neural Networks. Ph.D. Thesis, King Fahd University of Petroleum and Minerals, Dhahran, Saudi Arabia, 2011. [Google Scholar]
  17. Bengio, Y.; Courville, A.; Vincent, P. Representation learning: A review and new perspectives. IEEE Trans. Pattern Anal. Mach. Intell. 2013, 35, 1798–1828. [Google Scholar] [CrossRef] [PubMed] [Green Version]
  18. Hastie, T.; Tibshirani, R.; Friedman, J.H.; Friedman, J.H. The Elements of Statistical Learning: Data Mining, Inference, and Prediction, 2nd ed.; Springer: New York, NY, USA, 2008. [Google Scholar]
  19. Yue, C.; Zhao, Y. An improved aeroservoelastic modeling approach for state-space gust analysis. J. Fluids Struct. 2020, 99, 103148. [Google Scholar] [CrossRef]
  20. Lim, H.J.; Kim, M.K.; Sohn, H.; Park, C.Y. Impedance based damage detection under varying temperature and loading conditions. NDT E Int. 2011, 44, 740–750. [Google Scholar] [CrossRef]
  21. Li, R.; Verhagen, W.J.C.; Curran, R. A systematic methodology for Prognostic and Health Management system architecture definition. Reliab. Eng. Syst. Saf. 2020, 193, 106598. [Google Scholar] [CrossRef]
Figure 1. Framework for Multi-level Feature Extraction.
Aerospace 10 00645 g001
Figure 2. Part of the Feature Matrix of D P .
Aerospace 10 00645 g002
Figure 3. Feature-level feature extraction from D P and P C O T .
Aerospace 10 00645 g003
Figure 4. HI of D P with Performance Baseline constructed by RDAE.
Aerospace 10 00645 g004
Figure 5. HI of P C O T with Performance Baseline constructed by RDAE.
Aerospace 10 00645 g005
Figure 6. HI of D P with Performance Baseline constructed by DAE.
Aerospace 10 00645 g006
Figure 7. HI of P C O T with Performance Baseline constructed by DAE.
Aerospace 10 00645 g007
Figure 8. HI of D P with Performance Baseline constructed by KPCA.
Aerospace 10 00645 g008
Figure 9. HI of P C O T with Performance Baseline constructed by KPCA.
Aerospace 10 00645 g009
Figure 10. Confusion Matrix of HI for D P . (a) RDAE. (b) DAE. (c) KPCA.
Aerospace 10 00645 g010
Figure 11. Confusion Matrix of HI for P C O T . (a) RDAE. (b) DAE. (c) KPCA.
Aerospace 10 00645 g011
Table 1. D P (Duct Pressure of 5th stage bleed) features.
NameColumn IndicesThe MeaningsUnits
D P m a x 0The maximum value of D P .psi
D P m i n 1The minimum value of D P .psi
D P m e a n 2The mean value of D P .psi
f 60 70 3The number of occurrences when 70 > D P 60 .-
f 55 60 4The number of occurrences when 60 > D P 55 .-
f 53 55 5The number of occurrences when 55 > D P 53 .-
f 32 34 6The number of occurrences when 34 > D P 32 .-
f 10 14 14The number of occurrences when 14 > D P 10 .-
f 0 10 15The number of occurrences when 10 > D P 0 .-
Table 2. P C O T (Pre-Cooler Outlet Temperature) features.
NameColumn IndicesThe MeaningsUnits
P C O T m a x 0The maximum value of P C O T .°F
P C O T m e a n 1The mean value of P C O T .°F
t 455 460 2The number of occurrences when 460 > P C O T 455 .-
t 460 465 3The number of occurrences when 465 > P C O T 460 .-
t 465 470 4The number of occurrences when 470 > P C O T 465 .-
t 470 475 4The number of occurrences when 475 > P C O T 470 .-
t 475 480 5The number of occurrences when 480 > P C O T 475 .-
t 480 485 6The number of occurrences when 485 > P C O T 480 .-
t 485 490 7The number of occurrences when 490 > P C O T 485 .-
Table 3. Miss Rate of HI Constructing Models.
Model M ( DP ) M ( PCOT )
RDAE0.05230.0000
DAE0.06920.0035
KPCA0.33330.0000
Disclaimer/Publisher’s Note: The statements, opinions and data contained in all publications are solely those of the individual author(s) and contributor(s) and not of MDPI and/or the editor(s). MDPI and/or the editor(s) disclaim responsibility for any injury to people or property resulting from any ideas, methods, instructions or products referred to in the content.

