Article

Mechanism Underlying the Effect of Self-Circulating Casings with Different Circumferential Coverage Ratios on the Aerodynamic Performance of a Transonic Centrifugal Compressor

1
School of Power and Energy, Northwestern Polytechnical University, Xi’an 710072, China
2
Xi’an Aerospace Propulsion Institute, Xi’an 710199, China
*
Author to whom correspondence should be addressed.
Aerospace 2023, 10(3), 312; https://doi.org/10.3390/aerospace10030312
Submission received: 16 January 2023 / Revised: 28 February 2023 / Accepted: 8 March 2023 / Published: 22 March 2023
(This article belongs to the Special Issue Thermal Fluid Dynamics and Control in Aerospace)

Abstract

:
The aim of this research was to explore the mechanisms underlying the effect of self-circulating casing treatment with different circumferential coverage ratios on the aerodynamic performance of a transonic centrifugal compressor. A three-dimensional unsteady numerical simulation was carried out on a Krain impeller. The circumferential coverage ratios of the self-circulating casings were set to 36%, 54%, 72% and 90%, respectively. The numerical results showed that the Stall Margin Improvement (SMI) increased with the increase in circumferential coverage ratios. The self-circulating casing with a 90% circumferential coverage ratio exhibited the highest SMI at 20.22%. Internal flow field analysis showed that the self-circulating casing treatment improved the compressor stability by sucking the low-speed flow in the blade tip passage and restraining the leakage vortexes breaking, which caused flow blockage. The compressor performance was improved at most of the operating points, and the improvement increased with increase in circumferential coverage ratio. The improvement in compressor performance was mainly attributed to reduction in the area of the high relative total pressure loss in the blade tip passage and significant decrease in the flow loss by the self-circulating casings.

1. Introduction

Centrifugal compressors have several advantages such as compact structure, high single-stage total pressure ratio, low cost and long service life, thus they are widely used in technical fields such as aerospace, ship and energy power [1,2]. The internal flow of centrifugal compressors is a complex process. An unstable flow occurs under low mass flow rate conditions and the compressor performance is reduced by the unstable flows. Therefore, expanding the stable working range of the centrifugal compressor is imperative in improving impeller technology [3].
Casing treatment is an effective way to improve compressor performance and stability. Casing treatment mainly involves slot casing treatment, blade tip injection and self-circulating casing treatment [4]. Previous findings show that slot casing treatment can effectively extend the compressor stable working range, but it reduces the compressor efficiency. Self-circulating casing treatment effectively improves the compressor stability, reduces the compressor efficiency loss and even improves the compressor efficiency. Therefore, self-circulating casing treatment has been widely explored in improving compressor efficiency and stability [5].
Fisher [6] conducted an experimental study on a centrifugal compressor and the results showed that the self-circulating casing treatment expanded the compressor’s stable working range and slightly increased the compressor’s adiabatic efficiency. Hunziker et al. [7] conducted a numerical study and the findings indicated that the self-circulating casing treatment sucked the clearance leakage flow near the suction port, and airflows discharged from the inject port reduced the Mach number and incidence angle of the incoming flow at the blade tip, thus widening the compressor’s stable working range. Several numerical and experimental studies have been conducted on a high-speed centrifugal compressor [8,9,10]. The results of these studies showed that the unsteady flows inside the compressor were caused by the vortexes which were attributed to the tip leakage flow and the backflow, and the self-circulating casing eliminated the backflows near the throat of the blade tip passage. Tamaki [11] installed small blades in the self-circulating casing to generate vortexes at the compressor inlet, and the self-circulating casing treatment significantly improved the compressor stability margin. Jung [12] reported that the position and width of suction port of the self-circulating casing were key variables that affected the ability of the self-circulating casing to improve the compressor stability. The compressor’s stable working range was gradually extended by the backward movement of the suction port’s position and increase in the port width. Semlitsch [13] performed numerical studies using the LES method. The results showed that the self-circulating casing increased the compressor’s stable working range because part of flows in the compressor returned to the compressor upstream along the self-circulating casing passage under small mass flow rate conditions.
Zheng [14] conducted numerical simulations on a centrifugal compressor and verified the findings through experiments. The results showed that the trajectory of the clearance leakage flow in the blade tip passage was blocked and the flow angle was reduced at the compressor inlet due to the suction effect of the self-circulating casing. Xu [15,16] performed a numerical study on a semi-open centrifugal compressor and the findings indicated that the gas discharged from the inject port increased the local mass flow rate and flow angle, thus the self-circulating casing treatment delayed occurrence of the stall. Kang [17] carried out a numerical study on a single-stage subsonic centrifugal compressor and the results showed that the self-circulating casing sucked the leakage flow and low-energy flows at the blade tip and improved the flow blockage in the blade tip passage.
Cao (2017) [18] conducted a numerical study on a transonic centrifugal compressor and reported that the self-circulating casing bled the partial airflows in the impeller passage and returned them to the compressor inlet, which delayed the change in the compressor inlet incidence angle and the development of shock. Gan [19] performed a numerical simulation on a high-speed centrifugal compressor and reported that the self-circulating casing treatment improved the stall margin of the centrifugal compressor by 6% and decreased the compressor efficiency by 0.5% under the design’s mass flow rate conditions. Shang [20] reported that the axial distance, angle and diameter of the suction/inject port determined the flow velocity through the suction/inject port, the impact of the backflow on the main flow and the mass flow of the backflow.
Several studies have been conducted on centrifugal compressors with the self-circulating casing treatment. The effect of the self-circulating casing treatment in improving the internal flow of centrifugal compressors, the mechanisms of improving the compressor stability and the size and position of the self-circulating casing suction and inject port have been extensively explored. However, only a few studies have been conducted on the effect of the circumferential coverage ratio of self-circulating casing on the aerodynamic performance of centrifugal compressors. In addition, most previous studies have only been conducted with the self-circulating casing inject sections placed vertical to the casing line [14,15,17,18,20]. In this study, the design of the self-circulating casing inject section was based on a previous study by our research team [21] and the “Coanda Lines” were used to ensure that the gas flowed along the wall of the self-circulating casing while reducing the flow losses. This study sought to explore the effect of the circumferential coverage ratio of the self-circulating casing on the centrifugal compressor’s aerodynamic performance. Four research schemes on the self-circulating casing treatment with circumferential coverage ratios of 36%, 54%, 72% and 90% were designed with a Krain impeller as the research object, and unsteady numerical simulations were performed. The unsteady calculation results on the performance curves and internal flow details were compared to reveal the flow mechanisms underlying the effect of the circumferential coverage ratio of the self-circulating casing on the compressor’s aerodynamic performance.

2. Model Design and Numerical Simulation

2.1. Model Design

The research object in this study was a transonic centrifugal impeller SRV2-O with splitter blades. A schematic representation of the SRV2-O impeller is presented in Figure 1. The design parameters of the impeller were derived from a previous study [22]. Table 1 shows the basic design parameters of the SRV2-O. Krain (1995) conducted experimental studies on this type of impeller, and then performed numerical simulations in 2002. The numerical calculation results were in agreement with the experimental results [23]. The shape of the impeller was disclosed, which provided a reference for subsequent studies on this centrifugal impeller.
Thirteen self-circulating casings were uniformly arranged in the compressor along the circumferential direction. The number of self-circulating casings was the same as the number of mainstream passages. The geometric structure of the self-circulating casing is shown in Figure 2, where “m” represents the axial distance of the inject port, “k” represents the axial distance between the inject port trailing edge and the mainstream blade leading edge, “z” represents the axial distance between the suction port leading edge and the mainstream blade leading edge, “x” represents the axial distance of the suction port and “α” and “β” represent the air injection and suction angle of self-circulating casing, respectively. Geometric parameters of the self-circulating casing are presented in Table 2.
Four schemes of self-circulating casing treatment were designed with different circumferential coverage ratios of 36%, 54%, 72% and 90%, whereas the other geometric parameters of the self-circulating casing were the same. The circumferential coverage ratio is defined as the ratio of the circumferential angle covered by the self-circulating casing to 360°. The three-dimensional structures of the self-circulating casings with the circumferential coverage ratios of 36% and 72% are presented in Figure 3. “SRC” means the self-circulating casing, “C” represents the circumferential coverage ratio and the corresponding number represents the specific values of the circumferential coverage ratio (for example, “SRCC0.36” denotes the self-circulating casing with a circumferential coverage ratio of 36%).

2.2. Numerical Simulations

The grids were generated using the IGG/Autogrid5 module in NUMECA-16.1 software. The impeller passages adopted the O4H grid topology, and the butterfly grid was utilized for the blade tip clearance. The H-grid topology was adopted for the inlet and outlet extension sections and the self-circulating casing. The parameter “y+” was maintained at a value less than 10, whereby “y+” was related to the distance between the grid first layer and the solid wall. In the numerical simulation, the inlet extension section and the self-circulating casing were configured as the static blocks, and the rotor and diffuser passages were set as the rotating blocks. Two “sliding-block” structures with H-type grid topology were added between the rotor blade tip and the self-circulating structure, and the full non-matching method was applied at the R-S interface to achieve high accuracy of the flow field data transfer between the rotating blocks and the stationary blocks where the self-circulating casing was located. The diagram of computed domain grid is shown in Figure 4.
The single-passage unsteady numerical simulations were carried out using the Fine-Turbo in NUMECA software. Full three-dimensional Reynolds time-averaged Navier–Stokes equations were numerically computed. Spalart–Allmaras was selected as the turbulence model. The spatial discretization adopted an upwind Total Variation Diminishing (TVD) scheme with second-order accuracy, and the CFL number was set as 3. The implicit double time-stepping method was used for time discretization in the unsteady numerical simulations. A total of 30 physical time steps were configured for each rotor passage, and the virtual time step in each physical time step was set to 20. The inlet boundary conditions were configured as follows: the total pressure was set to 101,325 Pa, the total temperature was 288.15 K, the air was sucked axially and the outward annular wall and the blade surface were adiabatic and un-sliding. The uniform initial field was adopted with an initial temperature of 288.15 K and a pressure of 300,000 Pa. The average static pressure was determined at the outlet, and the compressor performance curve was obtained by continuously increasing the outlet pressure.

2.3. Numerical Validation

Validation of the grid-independence and the turbulence model were carried out to verify the accuracy of the numerical simulation method. The steady numerical calculation results, the experimental data [22] and numerical simulation results [23] reported by Krain were evaluated and compared. Previous findings indicate that the blockage mass flow rate obtained in the experiment was approximately 2.864 kg/s [24]. The blockage mass flow rate obtained by Krain in the numerical calculation was 5–10% higher than that obtained through the experiments. In this study, the blockage mass flow rate in the numerical calculation was 3.03 kg/s, and the error with the experimental data was 5.7%, which is within the allowable error range [24].
The compressor performance curves were compared with the experimental data by generating 930,000, 1.3 million and 2.2 million grids. The central spatial discretization format and the Second-Order Upwind format were used in the validation. The Spalart–Allmaras and the k-Ɛ turbulence model were selected for comparison with the experimental data. The abscissa of the performance curves’ graphs represents the ratio of calculated mass flow rate to blockage mass flow rate, and the ordinate represents the compressor’s total pressure ratio and isentropic efficiency, respectively. The terms “Central” and “Upwind” used in the curves represent the central spatial discretization format and the Second-Order Upwind differential format, respectively, “0.93 m”, “1.3 m” and “2.2 m” represent the 930,000, 1.3 million and 2.2 million grids, respectively, and “S-A” and “K-E” represent the Spalart–Allmaras and the k-Ɛ turbulence model, respectively. In addition, “Exp” represents the experimental results [22] and “Krain cal” represents the numerical calculation results by Krain et al. [23].
The comparison of the compressor’s performance curves under different turbulence models is presented in Figure 5. The results showed that the difference in compressor total pressure curves between the S-A and the k-Ɛ turbulence model was not significant (Figure 5). The compressor efficiency curves of the k-Ɛ turbulence model were highly consistent with the experimental data compared with that of the S-A model. The maximum relative error in efficiency was only 1.9%, but the stalling mass flow rate was markedly bigger relative to that of the S-A model.
The compressor performance curves generated under different differential formats are shown in Figure 6. The total pressure ratio curves for the central spatial discretization format and the Second-Order Upwind format were similar under the same 930,000 grids and S-A turbulence model conditions. However, the efficiency curves for the Second-Order Upwind format were consistent with the experimental data, with a maximum relative error of approximately 3.4%. The calculated stalling mass flow rate for the Second-Order Upwind format was consistent with the experimental data.
The compressor performance curves generated under different grid numbers are shown in Figure 7. The findings indicated that there was no significant difference in the total pressure ratio curves obtained under the different grid numbers (Figure 7). However, under the high mass flow rate conditions, the compressor efficiency curves with the 1.3 million grids number were more consistent with the experimental data compared with the curves generated under the other two grids. Therefore, 1.3 million was selected as the number of grids for the subsequent numerical simulations. A difference was observed between the experimental results and the simulation results obtained with 1.3 million grids. The total pressure for the simulation was higher, and the isentropic efficiency was lower than that obtained from the experiment. The difference was observed mainly because the average total pressure obtained at the outlet was applied as the outlet total pressure in the numerical simulations, whereas the total outlet pressure in the experiment was calculated from the determined outlet total temperature, mass flow rate, wall static pressure and an assumed blockage coefficient. As a result, the compressor performance obtained for the experiment was mainly dependent on the measurement accuracy of the average static pressure and the estimated blockage coefficient. However, the significant variation in static pressure between the hub and the casing lowers the measurement accuracy of the average static pressure, resulting in a discrepancy in the experimental and numerical simulation outlet total pressure.
The positions of the experimental laser measurement planes in the compressor passage are shown in Figure 8. In Figure 9, the relative Mach number distributions on the different planes were compared between the experimental data and the simulation results under the design’s mass flow rate conditions to further verify the accuracy and feasibility of the numerical simulation performed in this study.
The numerical results on the pressure surface side on plane “−1” were consistent with the experimental results (Figure 9a,b). The relative Mach number in the passage gradually increased with an increase in the blade height. Notably, some inconsistencies were observed between the numerical results and the experimental results at midspan and the upper right area of plane “−1”. The errors can be attributed to the choice of turbulence model and the discrete format used in the numerical simulation. The secondary flows may be inconsistent between the experimental procedures and the numerical simulation.
The relative Mach number distribution trend and the specific values of calculation results on plane “4” and plane “10” were consistent with the experimental results (Figure 9c–f). However, the specific value of the relative Mach number at the blade tip was lower and the low-speed area was larger for the numerical simulation than values obtained from the experiments. The error may have resulted because the laser measurement used in the experiment did not accurately reflect the distribution of the tip leakage flow. In addition, a low-velocity area was caused by the tip leakage flow.
The meridional velocities on plane “10” were shown and the results showed that the distribution of the meridional velocities under the numerical simulations was consistent with the distribution obtained through the experiment (Figure 10).
In summary, the results showed that the numerical simulations with the Second Order Upwind format using the S-A turbulence model accurately predicted the performance and exhibited the internal flow parameters of the Krain impeller. The numerical calculation method used in this study was accurate as shown by the high consistency with the experimental results. Therefore, the subsequent studies conducted in this study were based on this numerical method.

3. Simulation Results and Discussion

3.1. Compressor Performance Analysis

The performance curves of the compressor with different casing parameters are presented in 
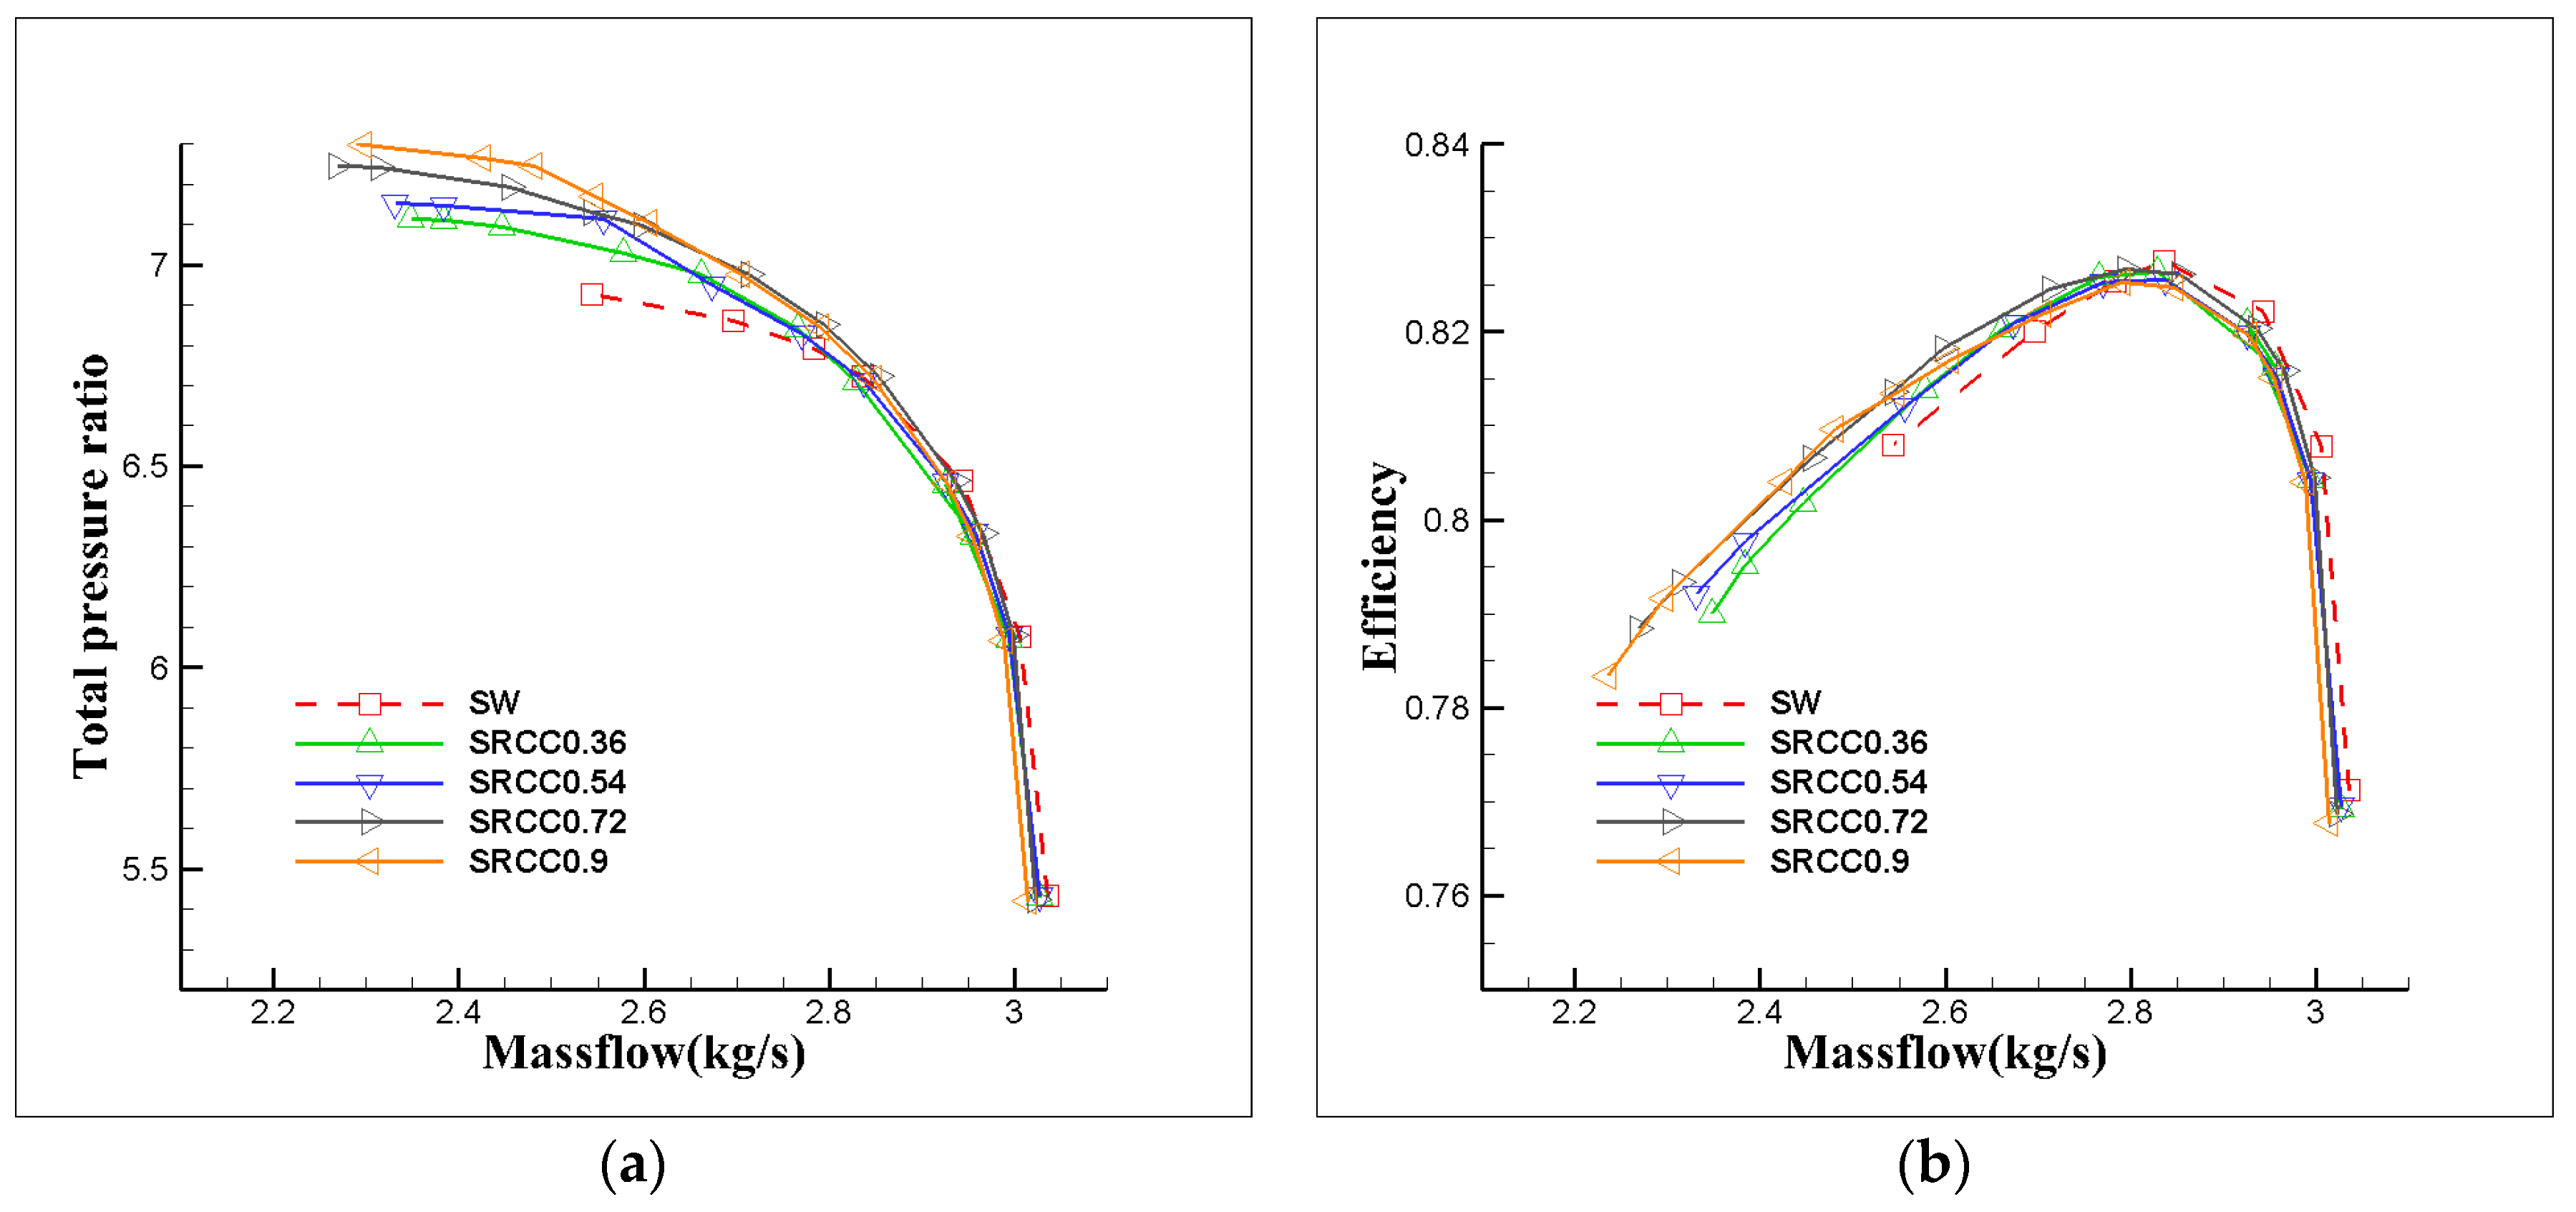
Figure 11. The abscissa represents the mass flow rate, and the ordinate represents the compressor’s total pressure ratio and efficiency. In the curves, “sw” represents the solid-wall casing, and the other symbols are provided above. Analysis of the compressor performance curves showed that the compressor’s near-stall mass flow rate was reduced after application of the self-circulating casing treatment, and the compressor stability was increased to varying degrees. A higher circumferential coverage ratio was correlated with a lower compressor near-stall mass flow rate. The total pressure ratios of the compressor with the self-circulating casing treatment were higher compared with the total pressure ratios for the solid-walled casing under the small and medium mass flow rate conditions (Figure 11a). Self-circulating casing treatments with different circumferential coverage ratios increased the impeller’s pressure-boosting capacity. Notably, the impeller’s pressure-boosting capacity increased with an increase in circumferential coverage ratio under the small mass flow rate conditions. All four self-circulating casing treatments effectively improved the compressor’s isentropic efficiency under the small and medium mass flow rate conditions (Figure 11b). The efficiency curves of the SRCC0.72 and SRCC0.9 designs almost overlapped under the small mass flow rate conditions. These findings indicate that the compressor efficiency increases with increase in circumferential coverage ratio under the small mass flow rate conditions.
Stall Margin Improvement (SMI) and Peak Efficiency Improvement (PEI) were introduced in this study for a precise quantitative analysis. The SMI and PEI were expressed as follows:
S M I = ( π S R C , s t a l l * π s w , s t a l l * × M s w , s t a l l * π S R C , s t a l l * 1 ) × 100 %
P E I = η S R C , p e a k * η s w , p e a k * η s w , p e a k * × 100 %
where “ π * ” represents the compressor total pressure ratio, “ M ” represents the mass flow rate and “ η * ” represents the compressor isentropic efficiency. The subscripts “stall” and “peak” represent the near-stall condition and the peak efficiency condition, respectively. The specific values of the SMI and PEI of the four research schemes are presented in Table 3.
The self-circulating casing treatments with 36%, 54%, 72% and 90% circumferential coverage ratios generated an SMI of 11.26%, 12.67%, 18.05% and 20.22% and a PEI of −0.13%, −0.23%, −0.17% and −0.27%, respectively (Table 2). Quantitative analysis showed that the SMI gradually increased as the circumferential coverage ratio increased and the self-circulating casing’s ability to expand compressor stability also gradually increased. However, the difference in SMI between the 36% and 54% circumferential coverage ratios was not significant. Analysis of the compressor peak efficiency showed that the PEIs generated by different self-circulating casing treatments were all negative, and the compressor peak efficiency decreased slightly with a change in the self-circulating casing treatments.

3.2. Comparative Analysis of the Compressor Internal Flow

Analyses were conducted to explore the internal flow of the compressor at the near-stall point under the different casing configurations, and the following content is shown using time-averaged results of the unsteady calculation.
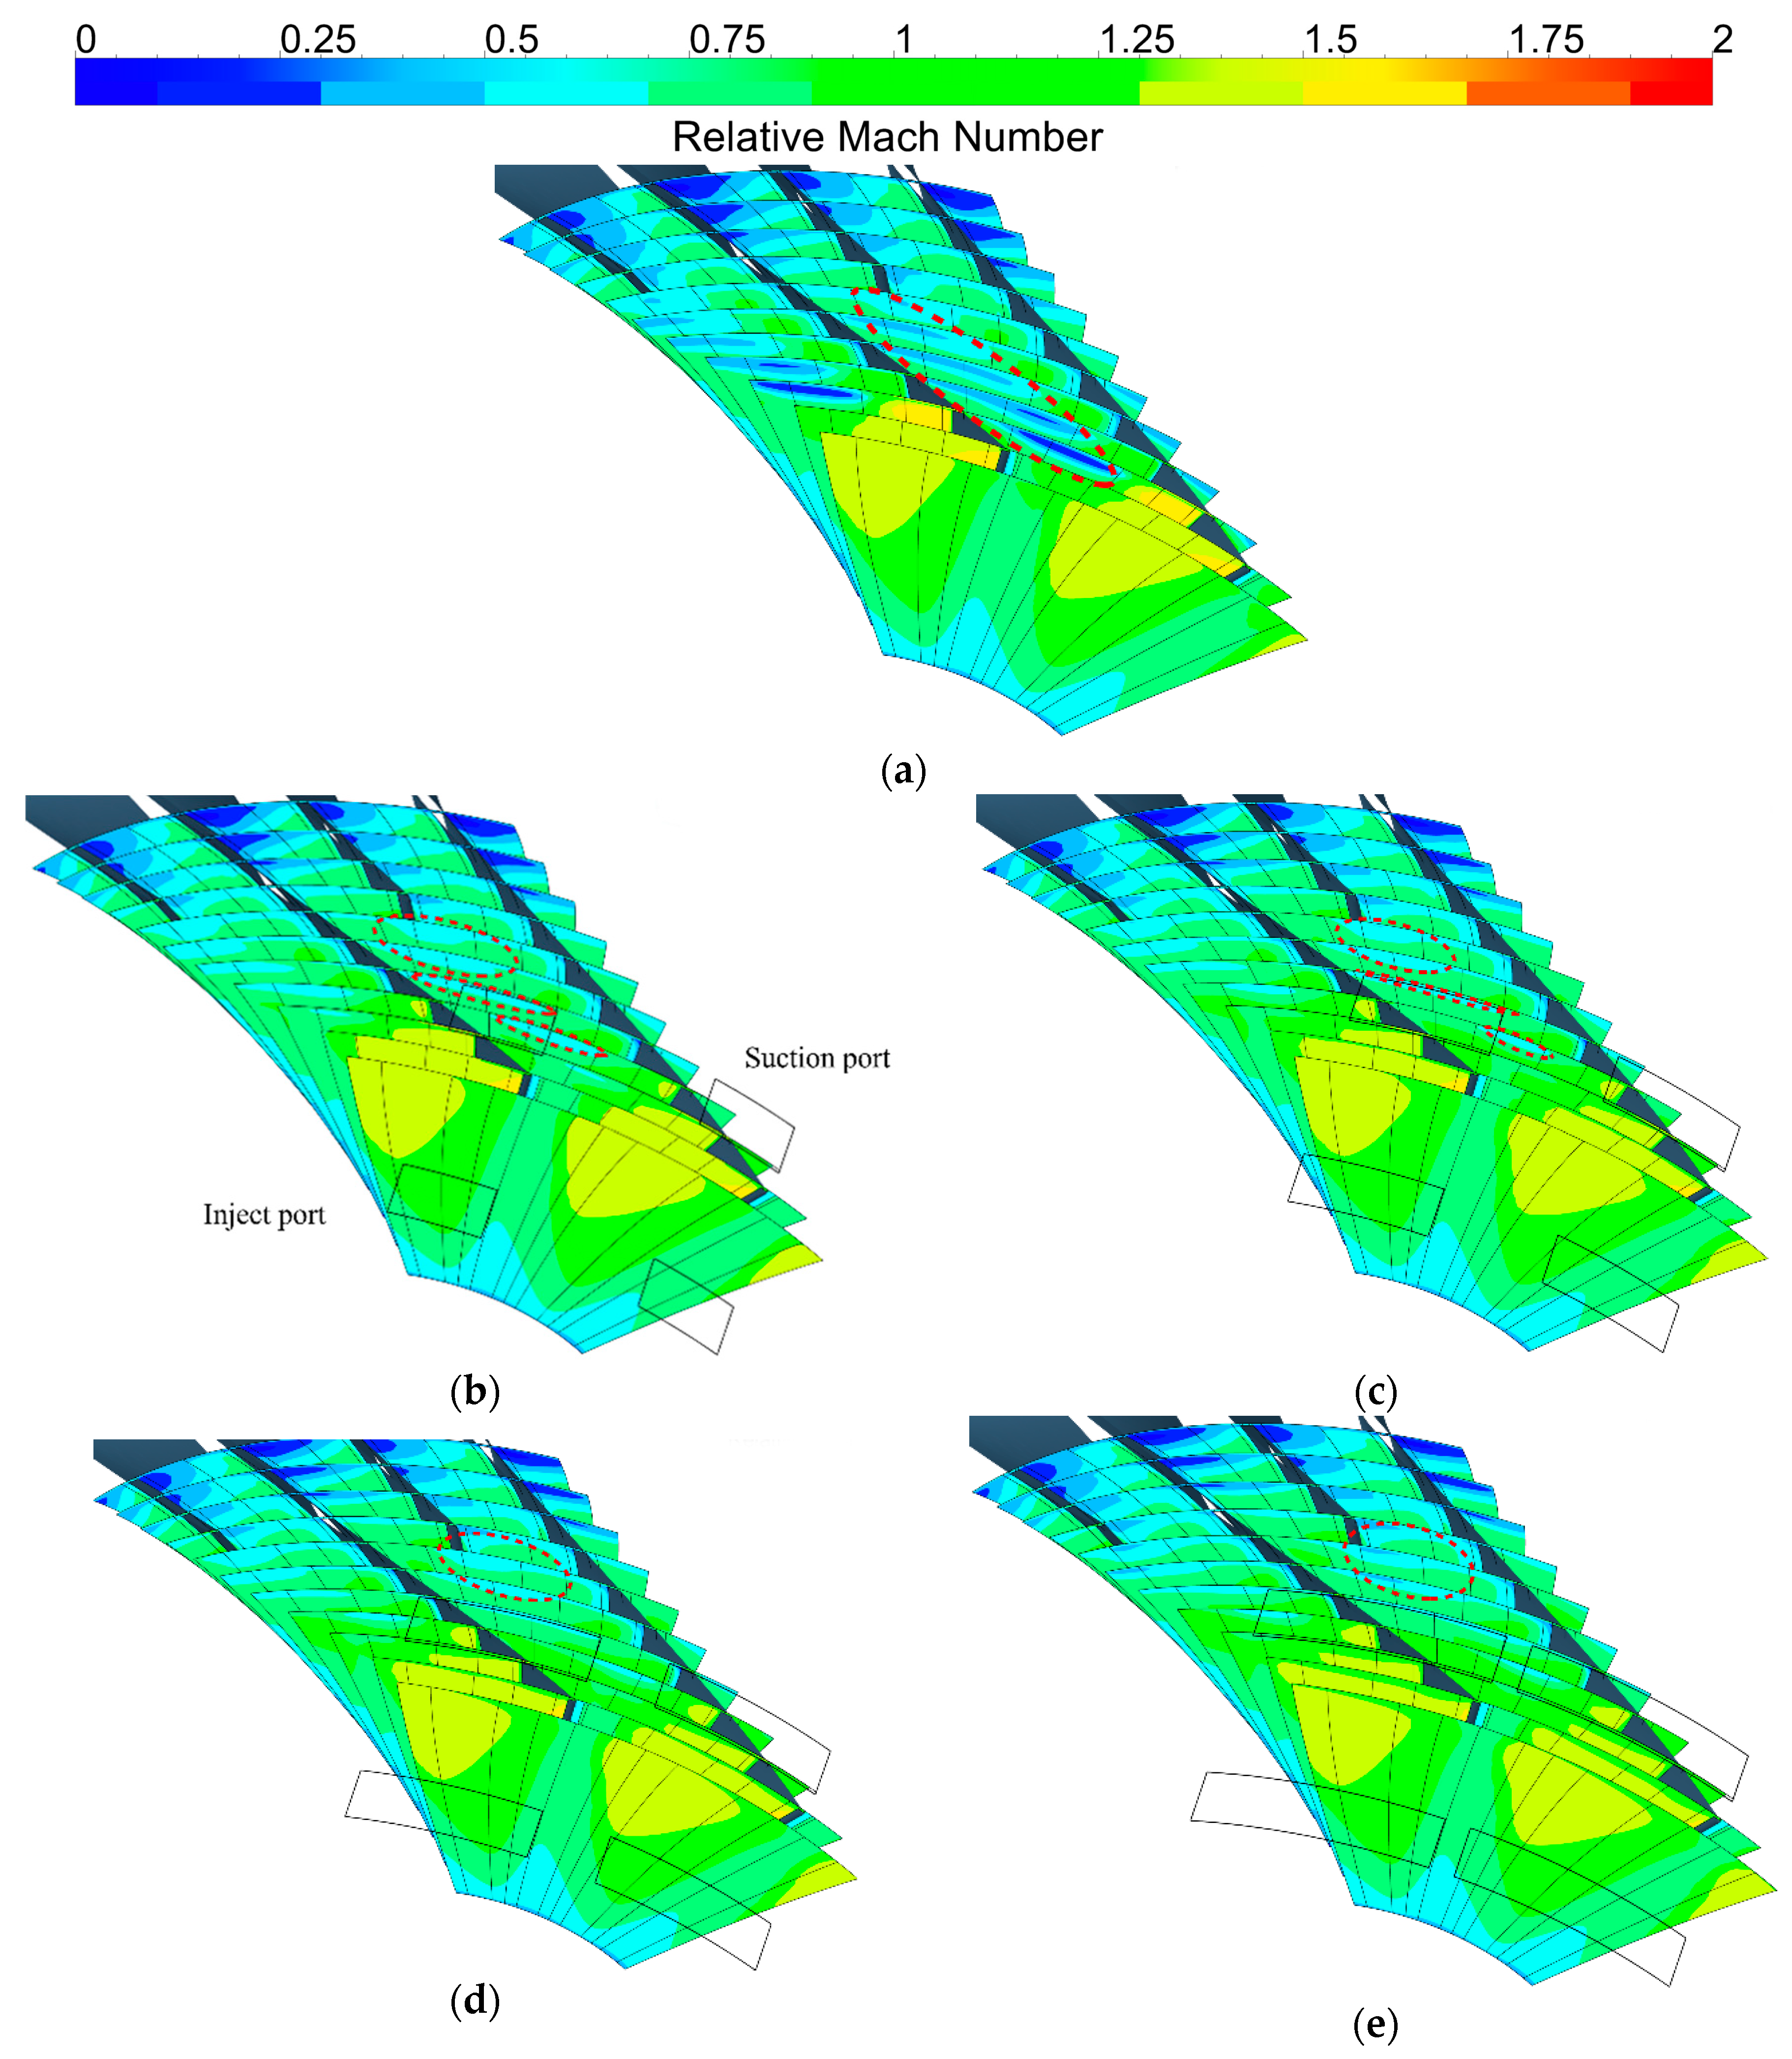
The relative Mach number contours of different research schemes on the sliced planes are shown in Figure 12. These planes, which are perpendicular to the Z axis, are located in the compressor passage, and the spacing is the same for every two adjacent planes. A large low Mach number area surrounded by the red dashed line was observed in the blade tip passage under the near-stall point. The flow velocity is low in this region, resulting in flow blockage in the blade tip passage. The results for the solid-wall casing with self-circulating casing treatments showed that all Mach number areas with a value below 0.25 disappeared, and only low Mach number areas with values more than 0.3 and less than 0.75 were observed in the mainstream blade passage. The self-circulating casing treatment significantly improved the low Mach number area and expanded the flow area in the mainstream blade passage. However, self-circulating casing treatment did not significantly suppress the low-energy areas in the splitter blade passage. Analysis of the ability of the different self-circulating casing treatments to reduce the blocked flow area revealed that the low-speed area gradually decreased from the 36% to the 72% circumferential coverage ratio, but the difference between the 72% and the 90% coverage ratio was not significant for this configuration.
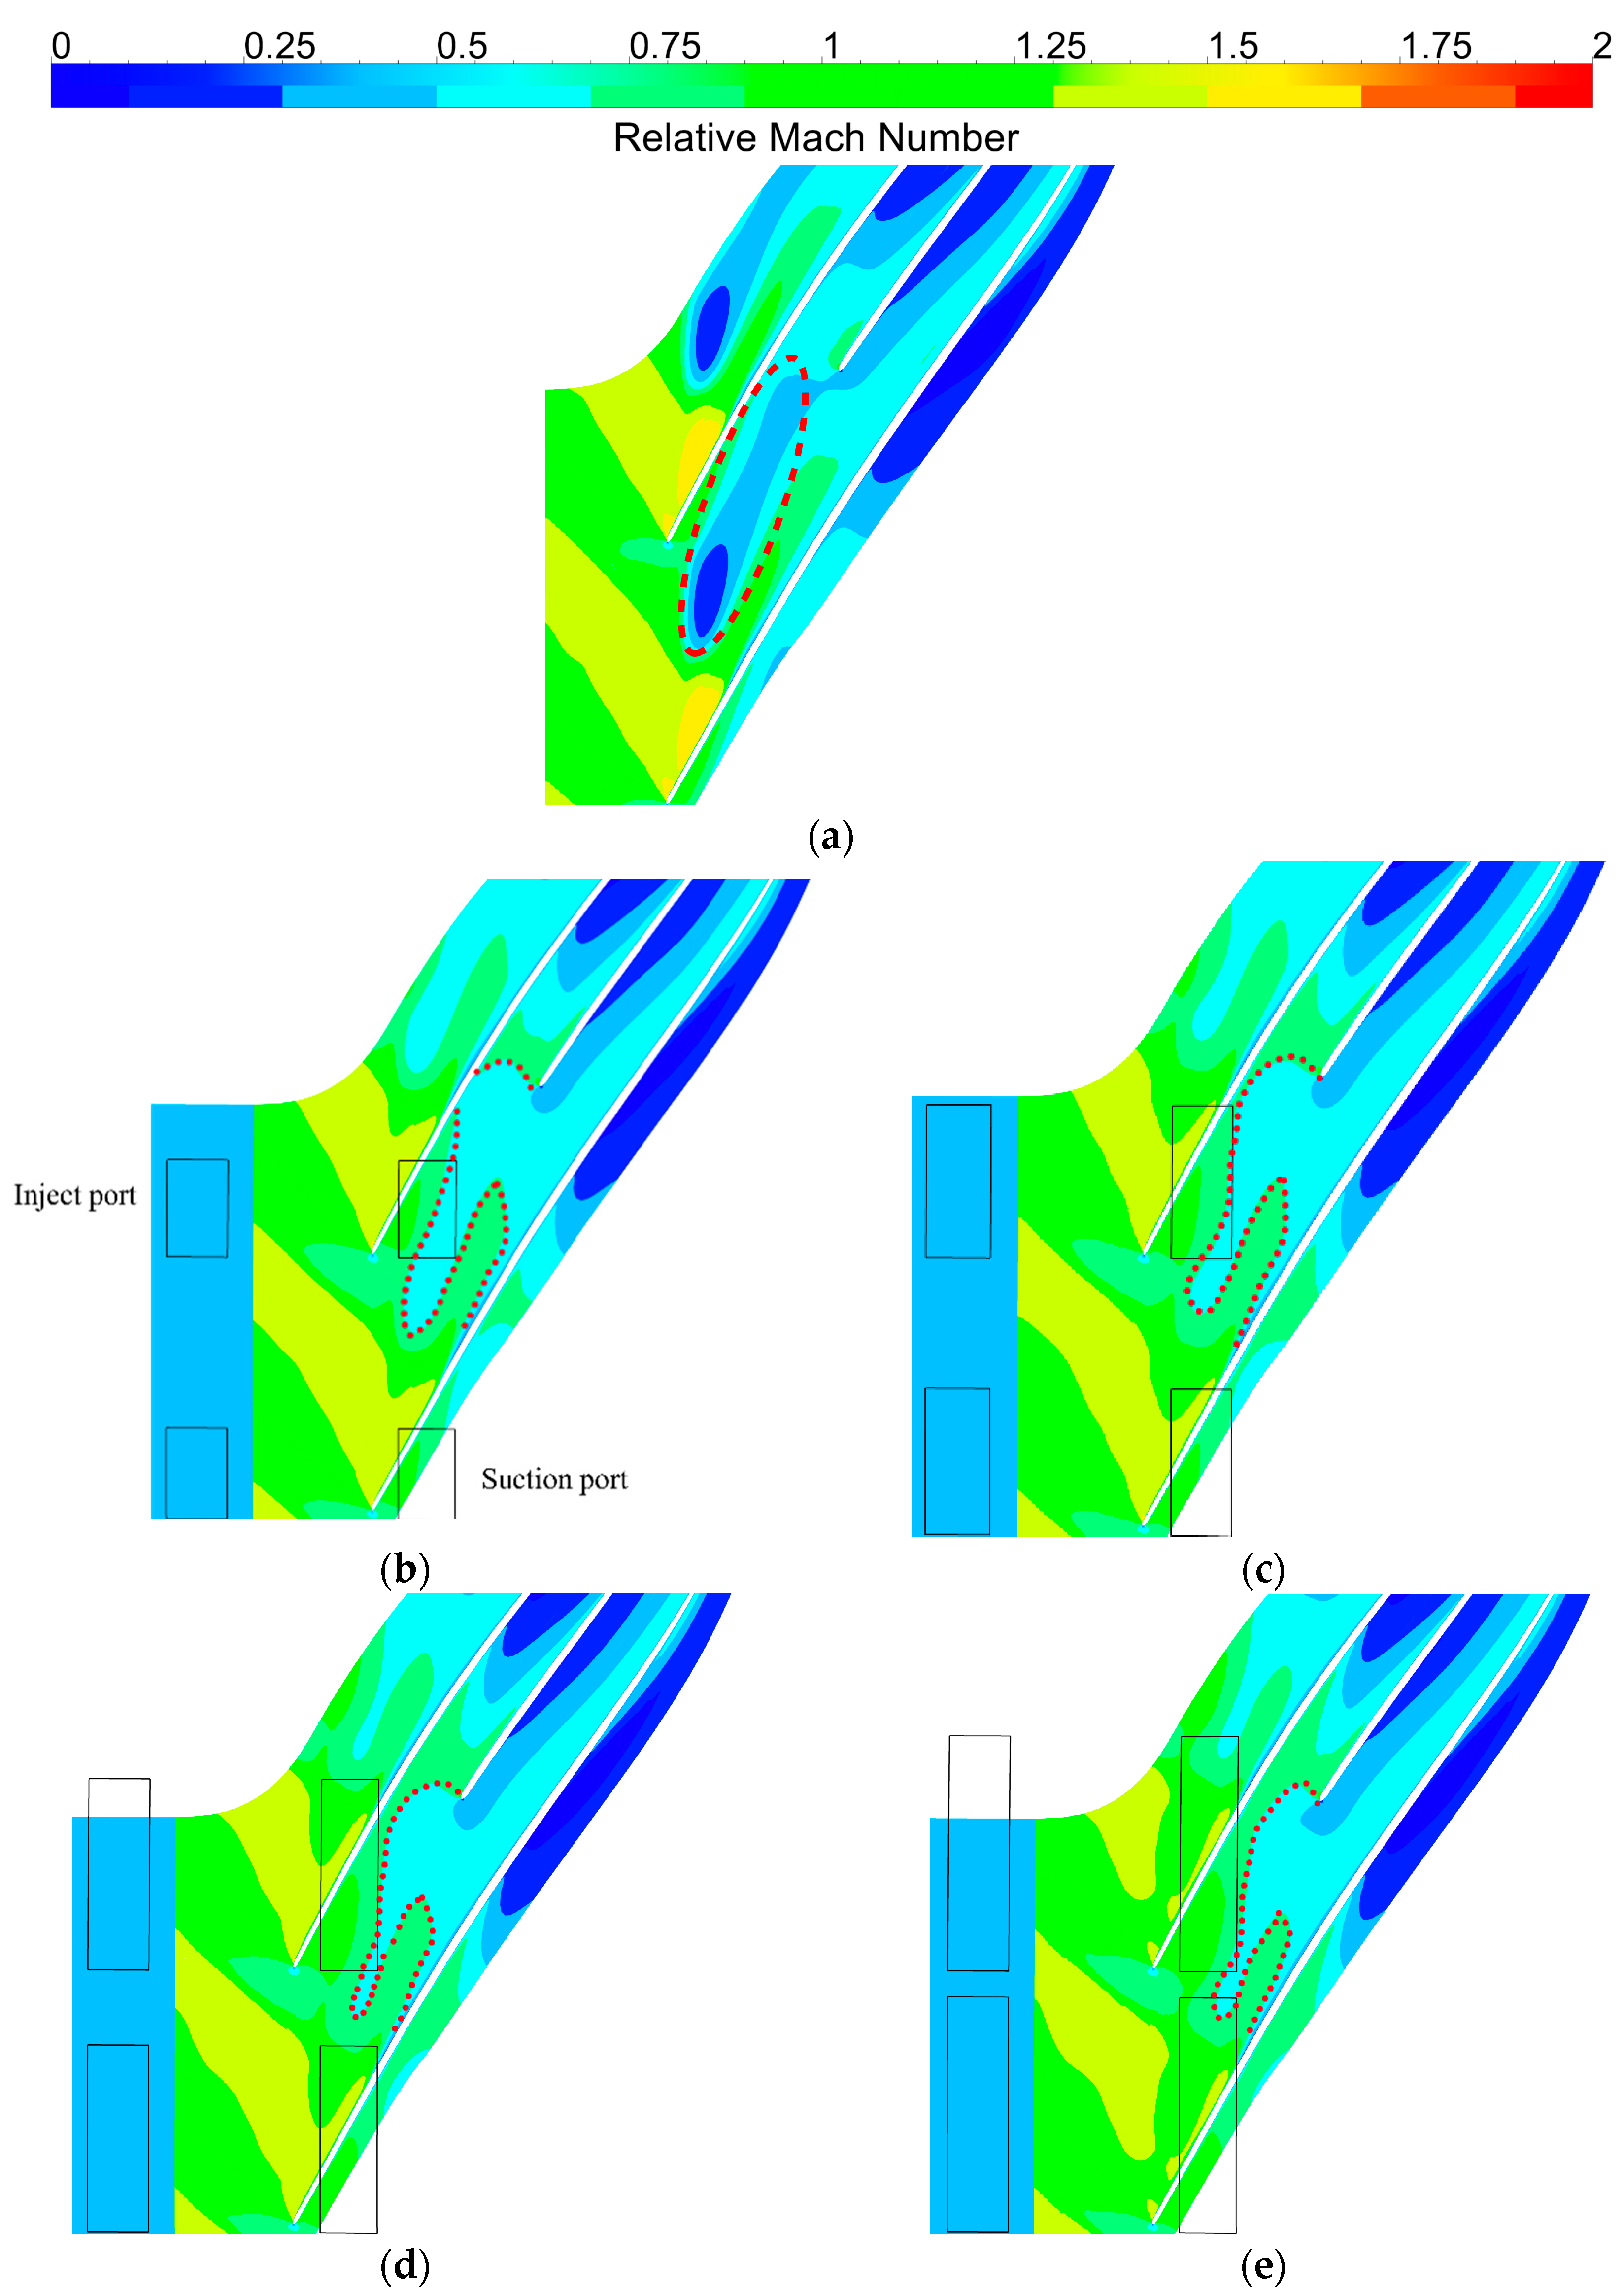
The relative Mach number distribution under different schemes of 96% blade span was explored to evaluate the effect of the different self-circulating casing treatments on the flow blockage in the blade tip passage (Figure 13). The findings showed that most of the area of passage exhibited low-speed flows under the near-stall point, and the flow area in this passage was markedly reduced (Figure 13a). This finding is consistent with the previous result in Figure 12. The results showed that all the self-circulating casing treatments with the different circumferential coverage ratios improved the flow blockage in the blade tip passage (Figure 13b–d). The flow area and the distance between the blade pressure surface and the boundary of the low Mach number area marked by the dashed red line gradually increased with an increase in circumferential coverage ratio. This finding indicated that the inhibition of the self-circulating casing treatments to the low-energy flow was proportional to the circumferential coverage ratio.
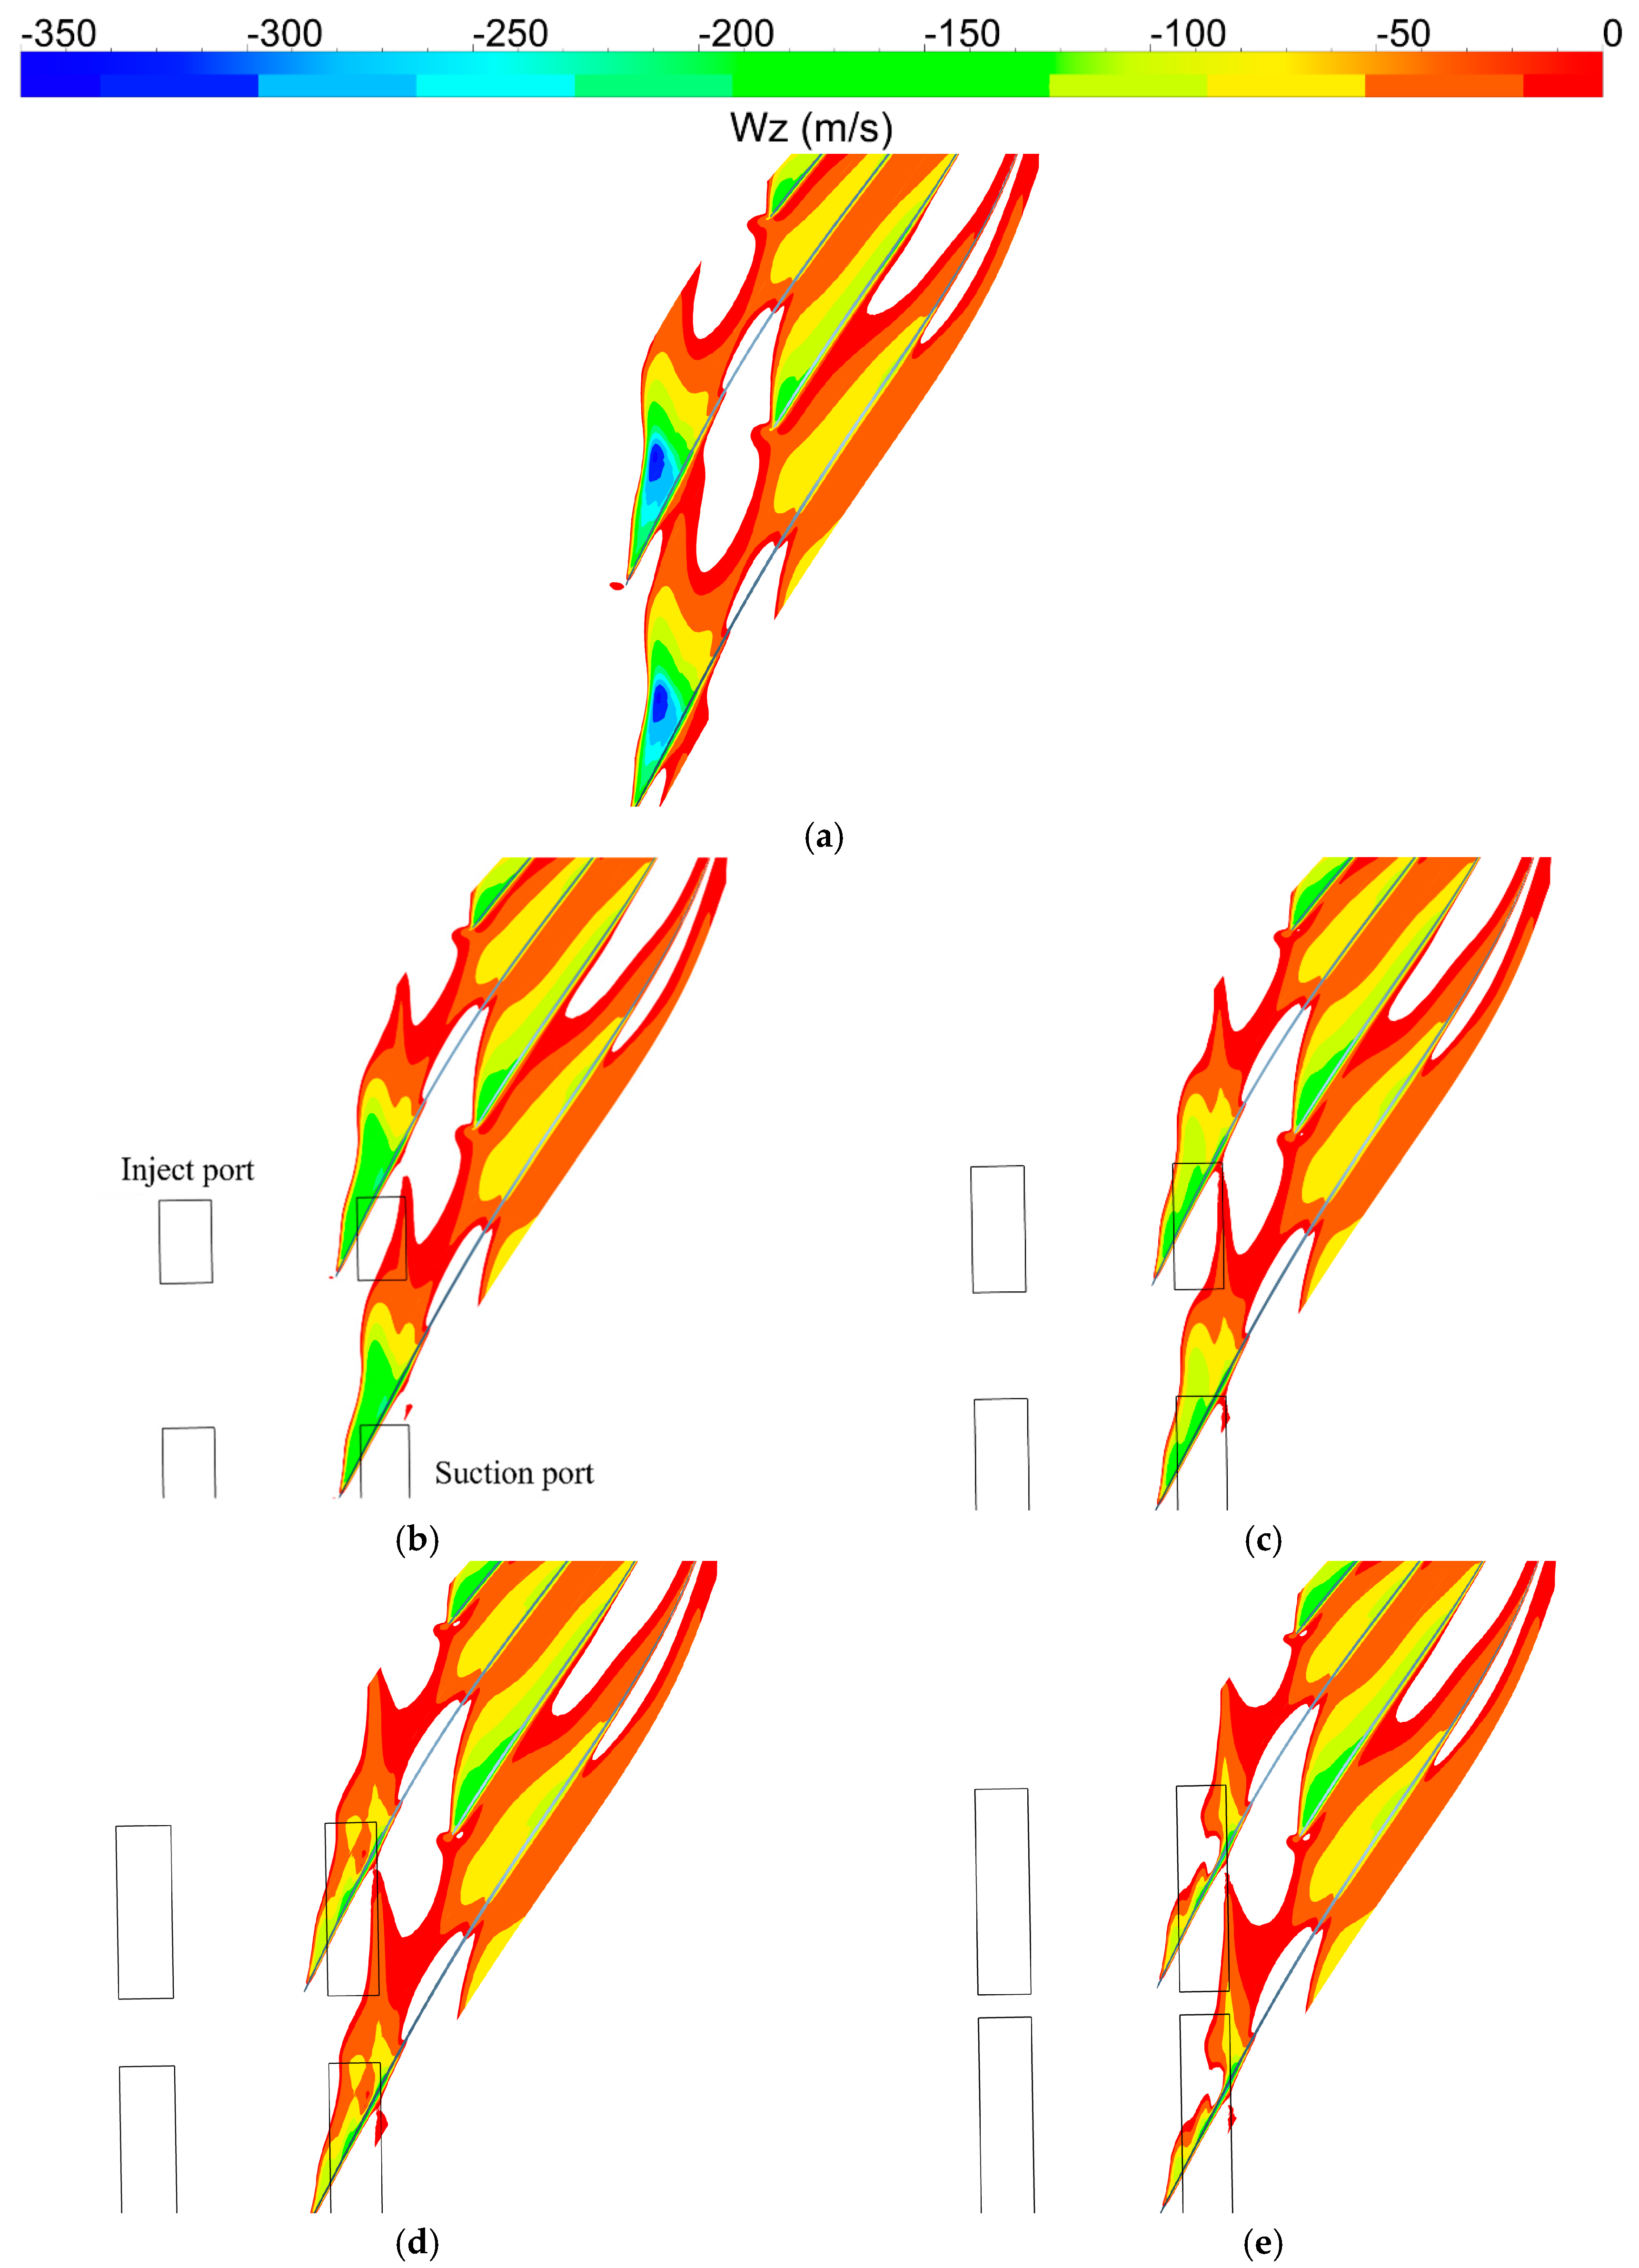
The axial velocity distribution at 50% τ (“τ” represents the clearance height of mainstream blade leading edge at the blade tip) was explored to further indicate the improvements of the self-circulating casing treatments on the flow blockage in the blade tip passage (Figure 14). The findings indicated the presence of blockages in the passage when the axial speed w z was negative. The backflow area was significantly reduced after application of the self-circulating casing treatments, implying that the flow area was significantly increased. The backflow area reduced with an increase in circumferential coverage ratio of the self-circulating treatments. The backflow area was smallest in the SRCC0.9 design compared with the other configurations. Analysis showed that the backflow area was not evident under the suction port of the self-circulating casing. These findings indicate that the ability of the self-circulating casing treatment to restrain the flow blockage increased with an increase in the circumferential coverage ratio.
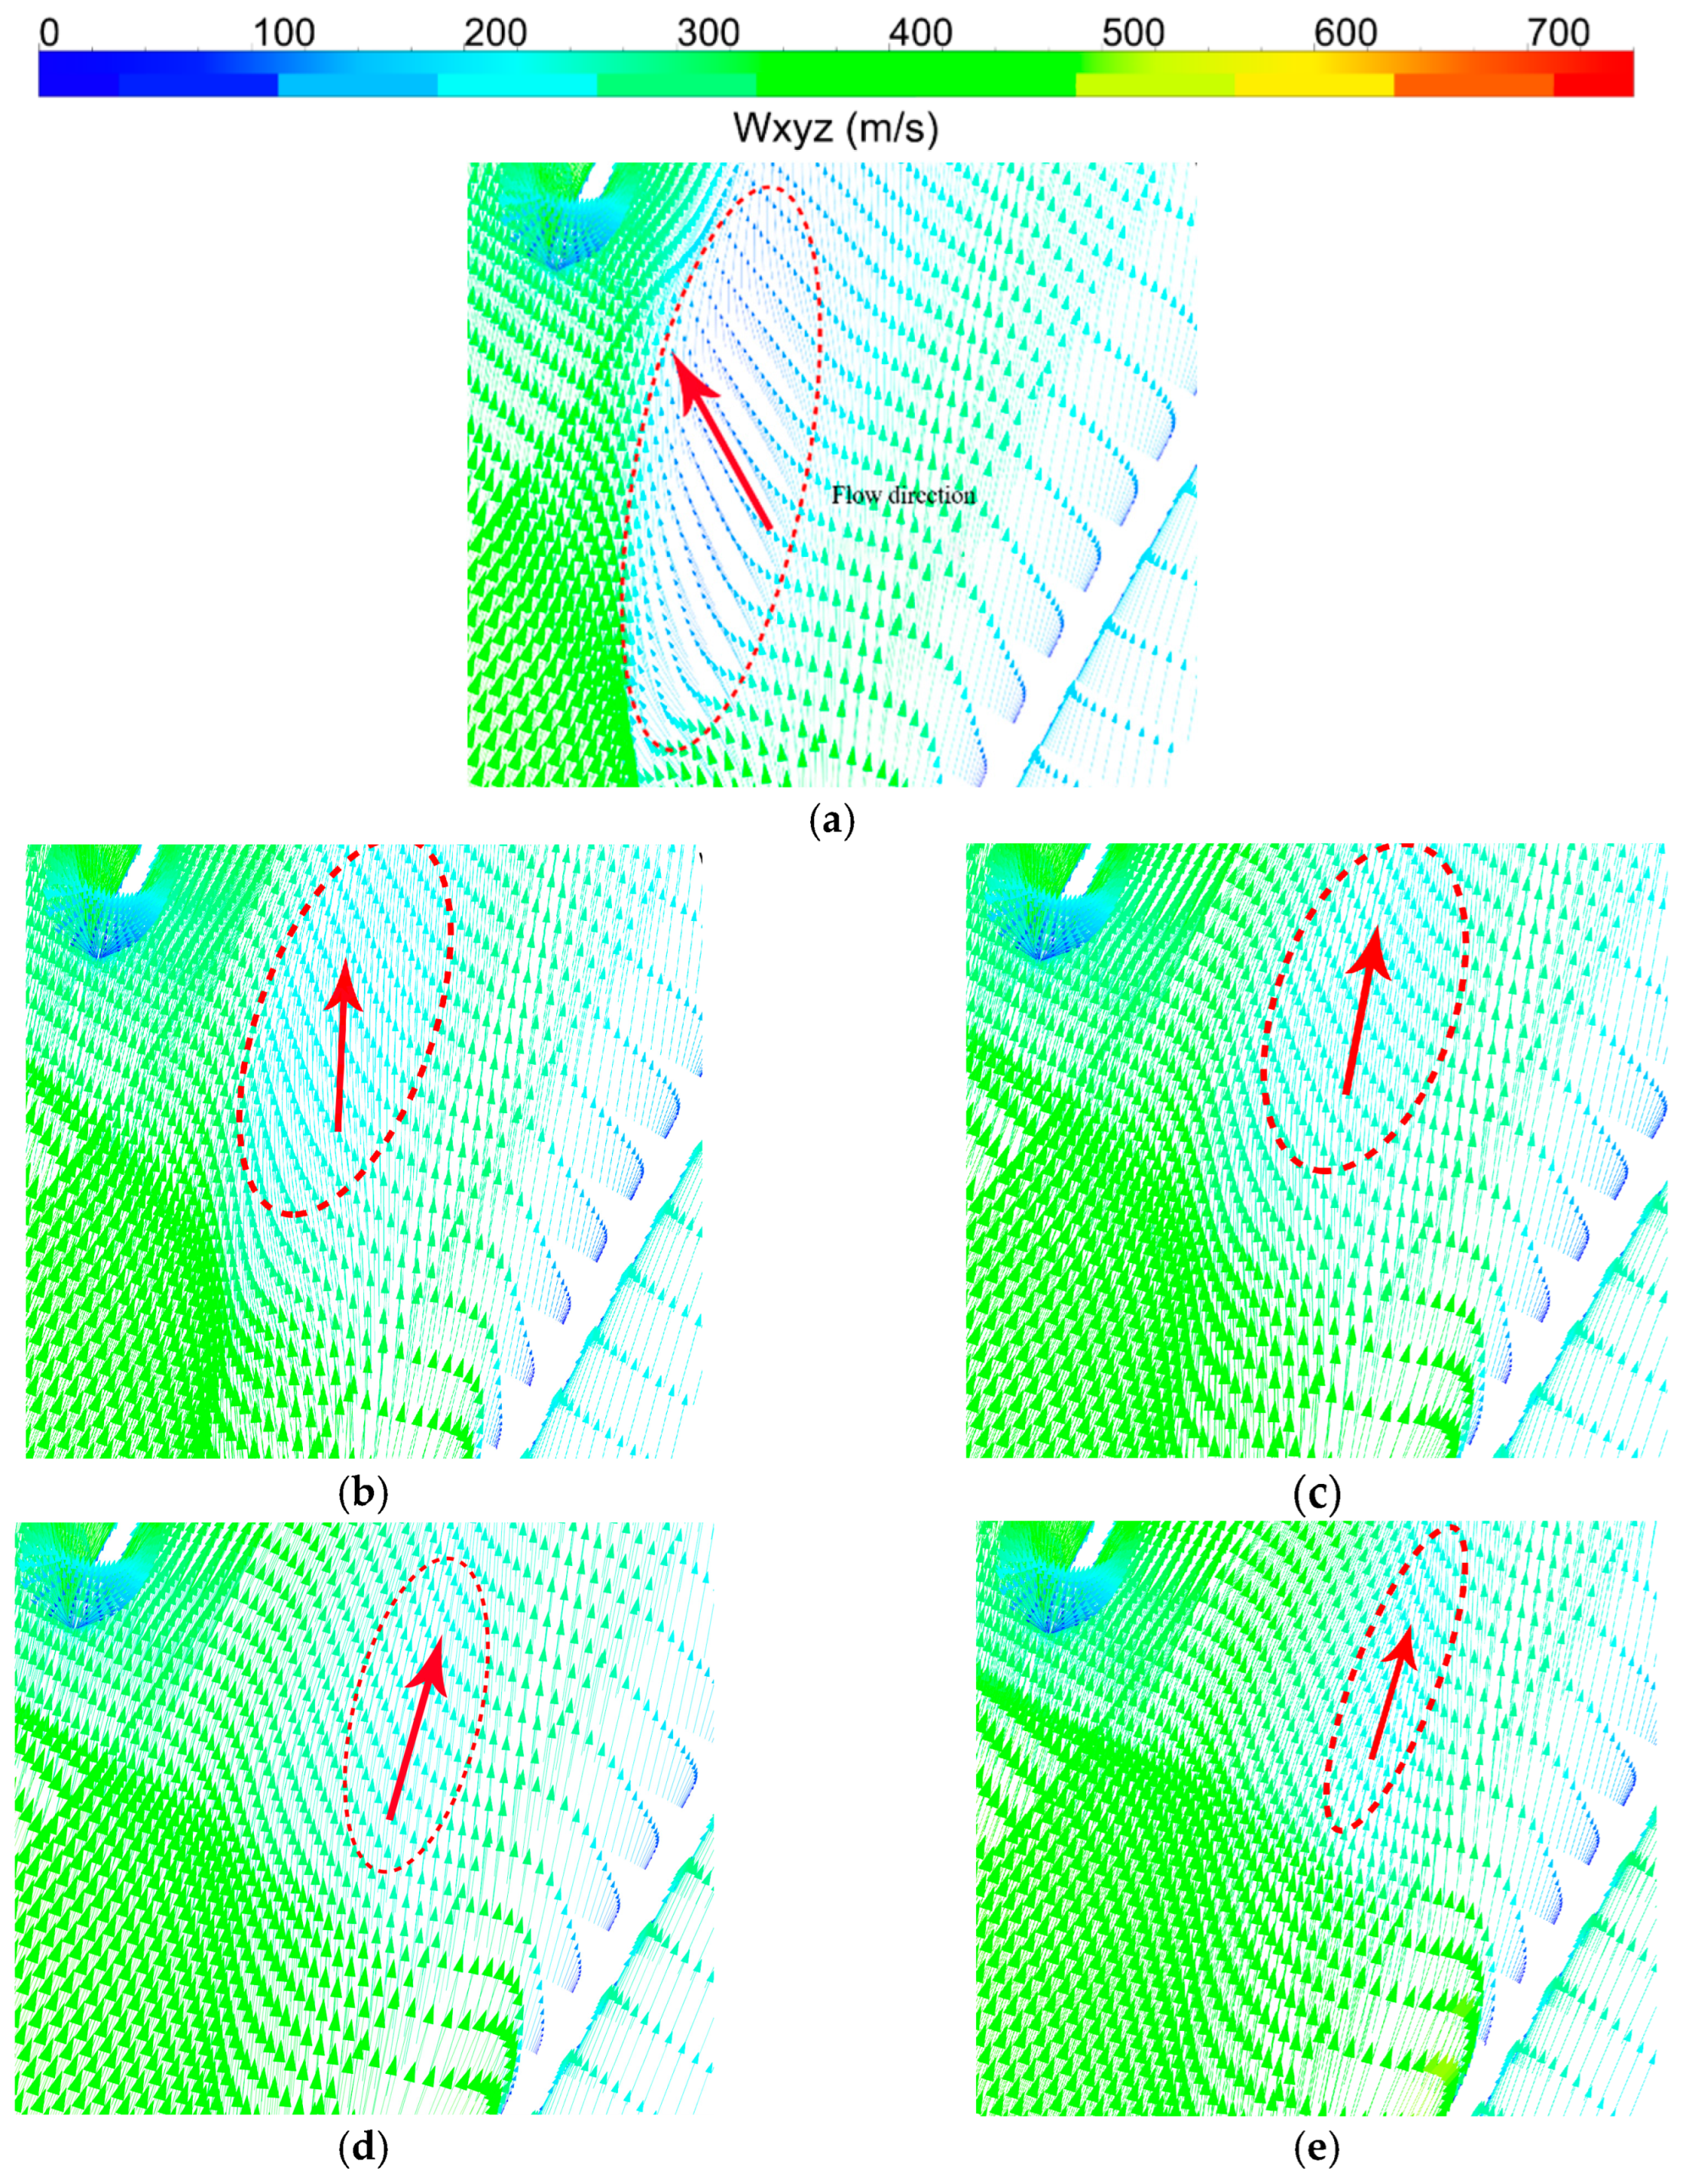
The relative velocity vector of the airflow of different structure casings at 98% blade span was evaluated (Figure 15). A large low-speed flow area surrounded by the dashed red line in the mainstream blade passage was observed under the near-stall point. The red arrow represents the flow direction under the near-stall point. The area of low-speed flow between the blade suction surface and the adjacent blade pressure surface in the mainstream blade passage was significantly suppressed, and the angle between the flow direction and the blade suction surface was reduced after application of self-circulating magazine treatment. The self-circulating casing treatment played a significant role in improving the compressor internal flow. Analysis of the different self-circulating casing treatments showed the presence of a large low-speed flow area in the passage in SRCC0.36 and the flow direction was at an angle to the blade suction surface, whereas the flow directions of the other self-circulating casing treatments were along the blade suction surface. The low-speed flow area and the angle between the flow direction and the blade suction surface decreased with an increase in circumferential coverage ratio.
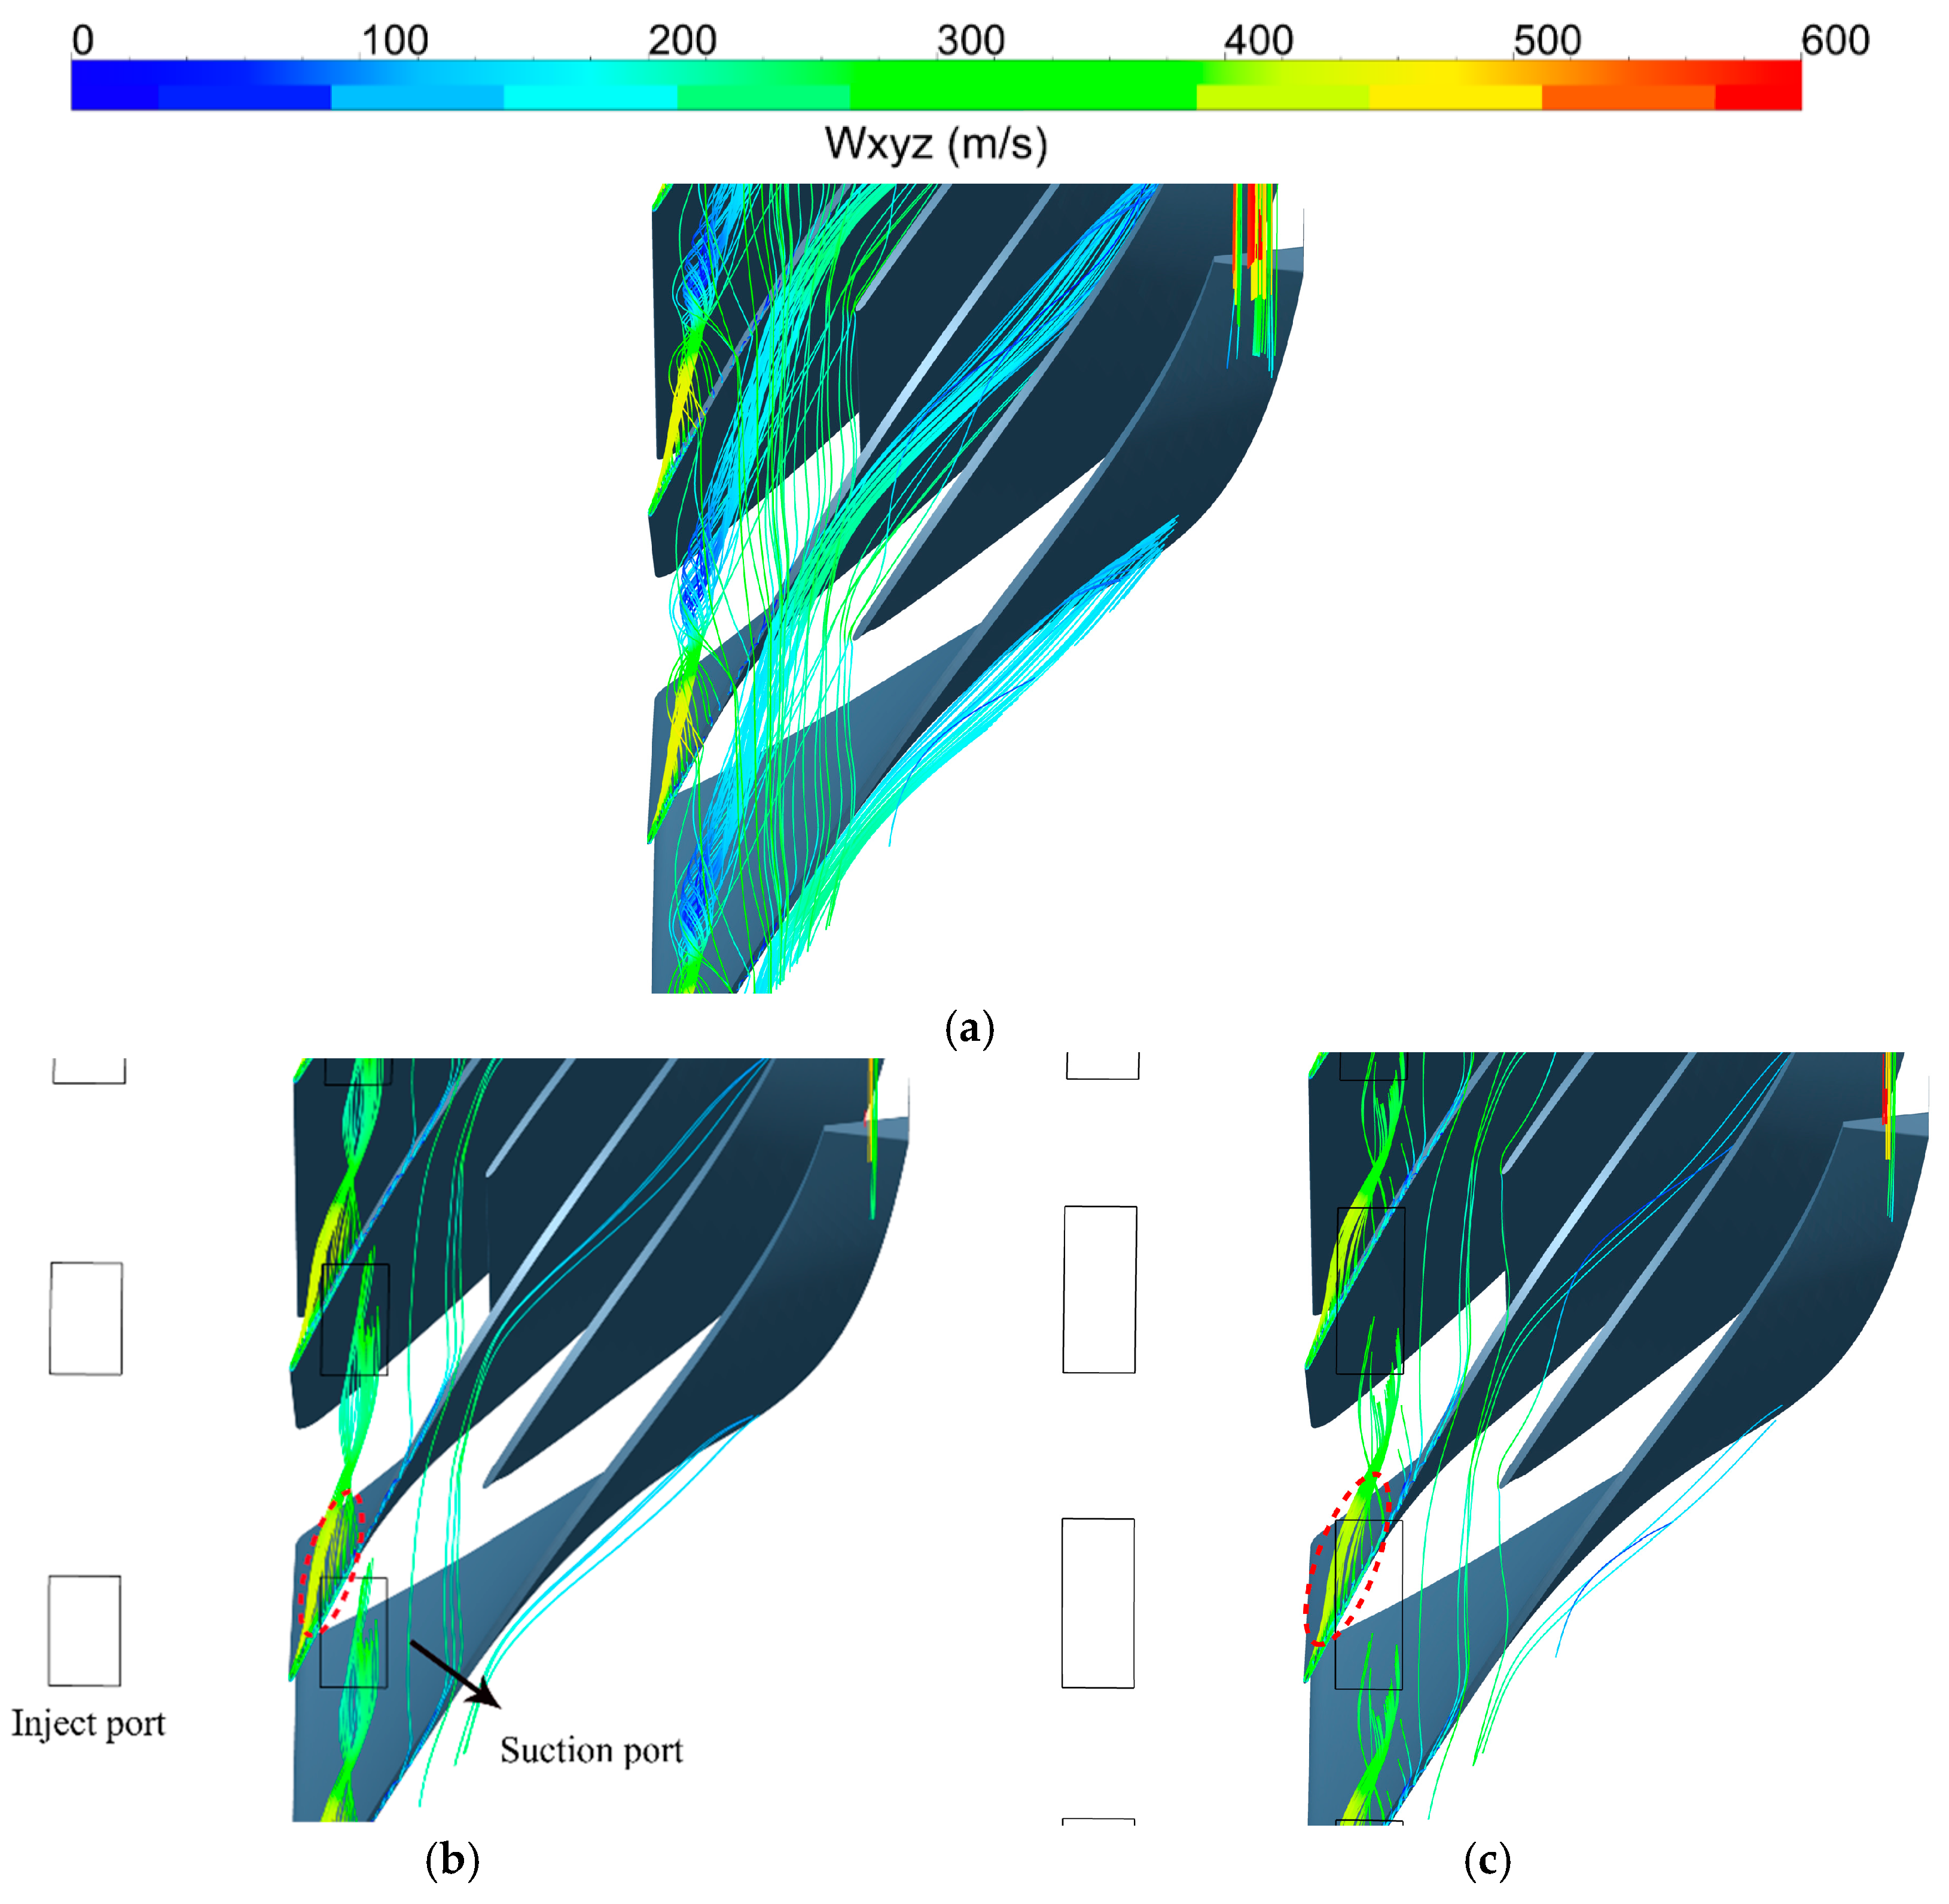
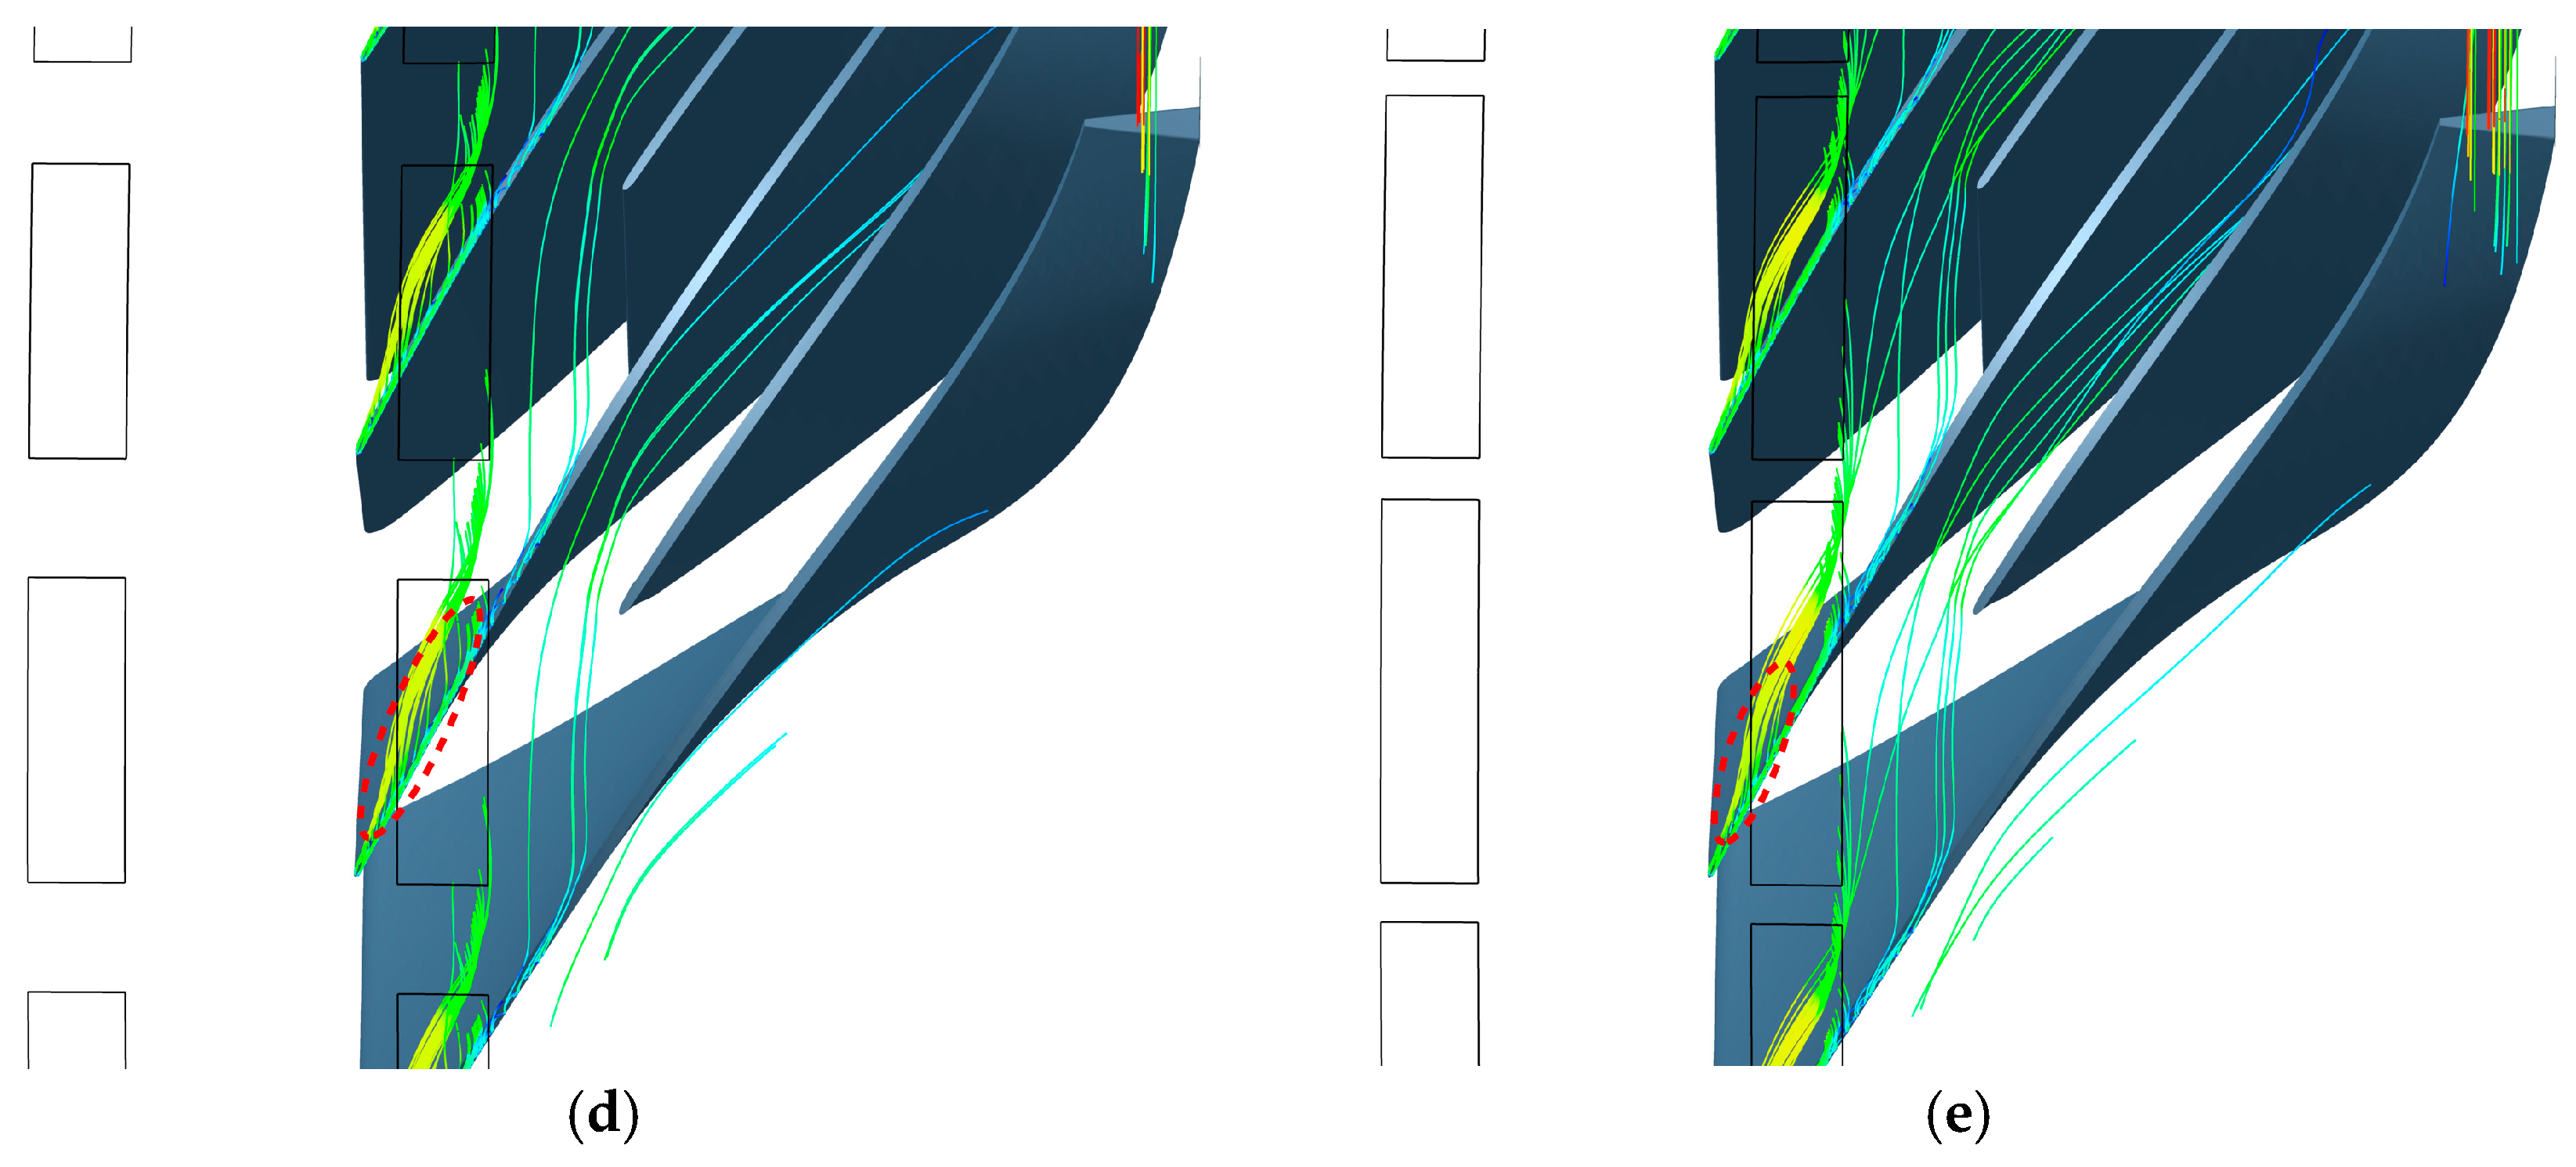
The leakage flow lines’ distribution in the blade tip passage was evaluated to further illustrate the mechanism underlying the increase in the compressor internal flow by the self-circulating casing (Figure 16). The lower-speed leakage flows fill with the blade tip passage formed by the mainstream blades and the mainstream/splitter blades under the near-stall point. The leakage flow velocity rapidly decreased after the shock at the mainstream passage inlet. The leakage flows became distorted and swollen at the inlet. The leakage flows were interrupted below the suction port by the suction of the self-circulating casing. The area and intensity of the leakage flows sharply decreased downstream of the suction port, and the expansion and development of the leakage flows were effectively suppressed. The low-energy area created after the shock was also eliminated. Analysis of the different self-circulating casing treatments showed that the leakage flow lines from the mainstream blade gap became progressively less dense at the blade tip, as indicated by the red dashed line in Figure 16. The leakage flow distribution area gradually decreased under the suction port from the 36% to the 90% circumferential coverage ratio. The effect on suppressing the development of leakage flows towards adjacent blades increased with an increase in circumferential coverage ratio. The results showed that SRCC0.9 had the greatest inhibiting effect on the leakage flows, and the circumferential development of leakage flows had been completely sucked for this configuration.
The parameter of dimensionless helicity was introduced in this study to evaluate the expansion and fragmentation of the leakage vortexes at the blade tip. Dimensionless helicity is expressed as follows:
H n = W ξ | W | | ξ |
where “ W ” represents the relative velocity vector and “ ξ ” represents the vortex vector. H n denotes the tightness of the leakage flow lines around the core of the leakage vortexes, and the value of H n is close to 1 (the range of H n is −1 to 1). A sudden change in the value of the H n (for example, from 1 to −1) often indicates the expansion and fragmentation of the leakage vortexes. The contours of H n for different casings at the 98% blade span are presented in Figure 17. The results showed an abrupt change in H n value at the mainstream passage inlet under the solid-wall casing, indicating that the leakage vortexes were broken at this location, and the resulting low-speed flows caused blockage in the passage. The self-circulating casings with the 36% and 54% circumferential coverage ratios did not eliminate the break-up of the leakage vortexes, and an abrupt change in value was observed at the passage inlet for these configurations. However, the sudden change in value disappeared under the self-circulating casing treatment with the 72% and 90% circumferential coverage ratios, and these treatments effectively inhibited the break-up of the leakage vortexes.
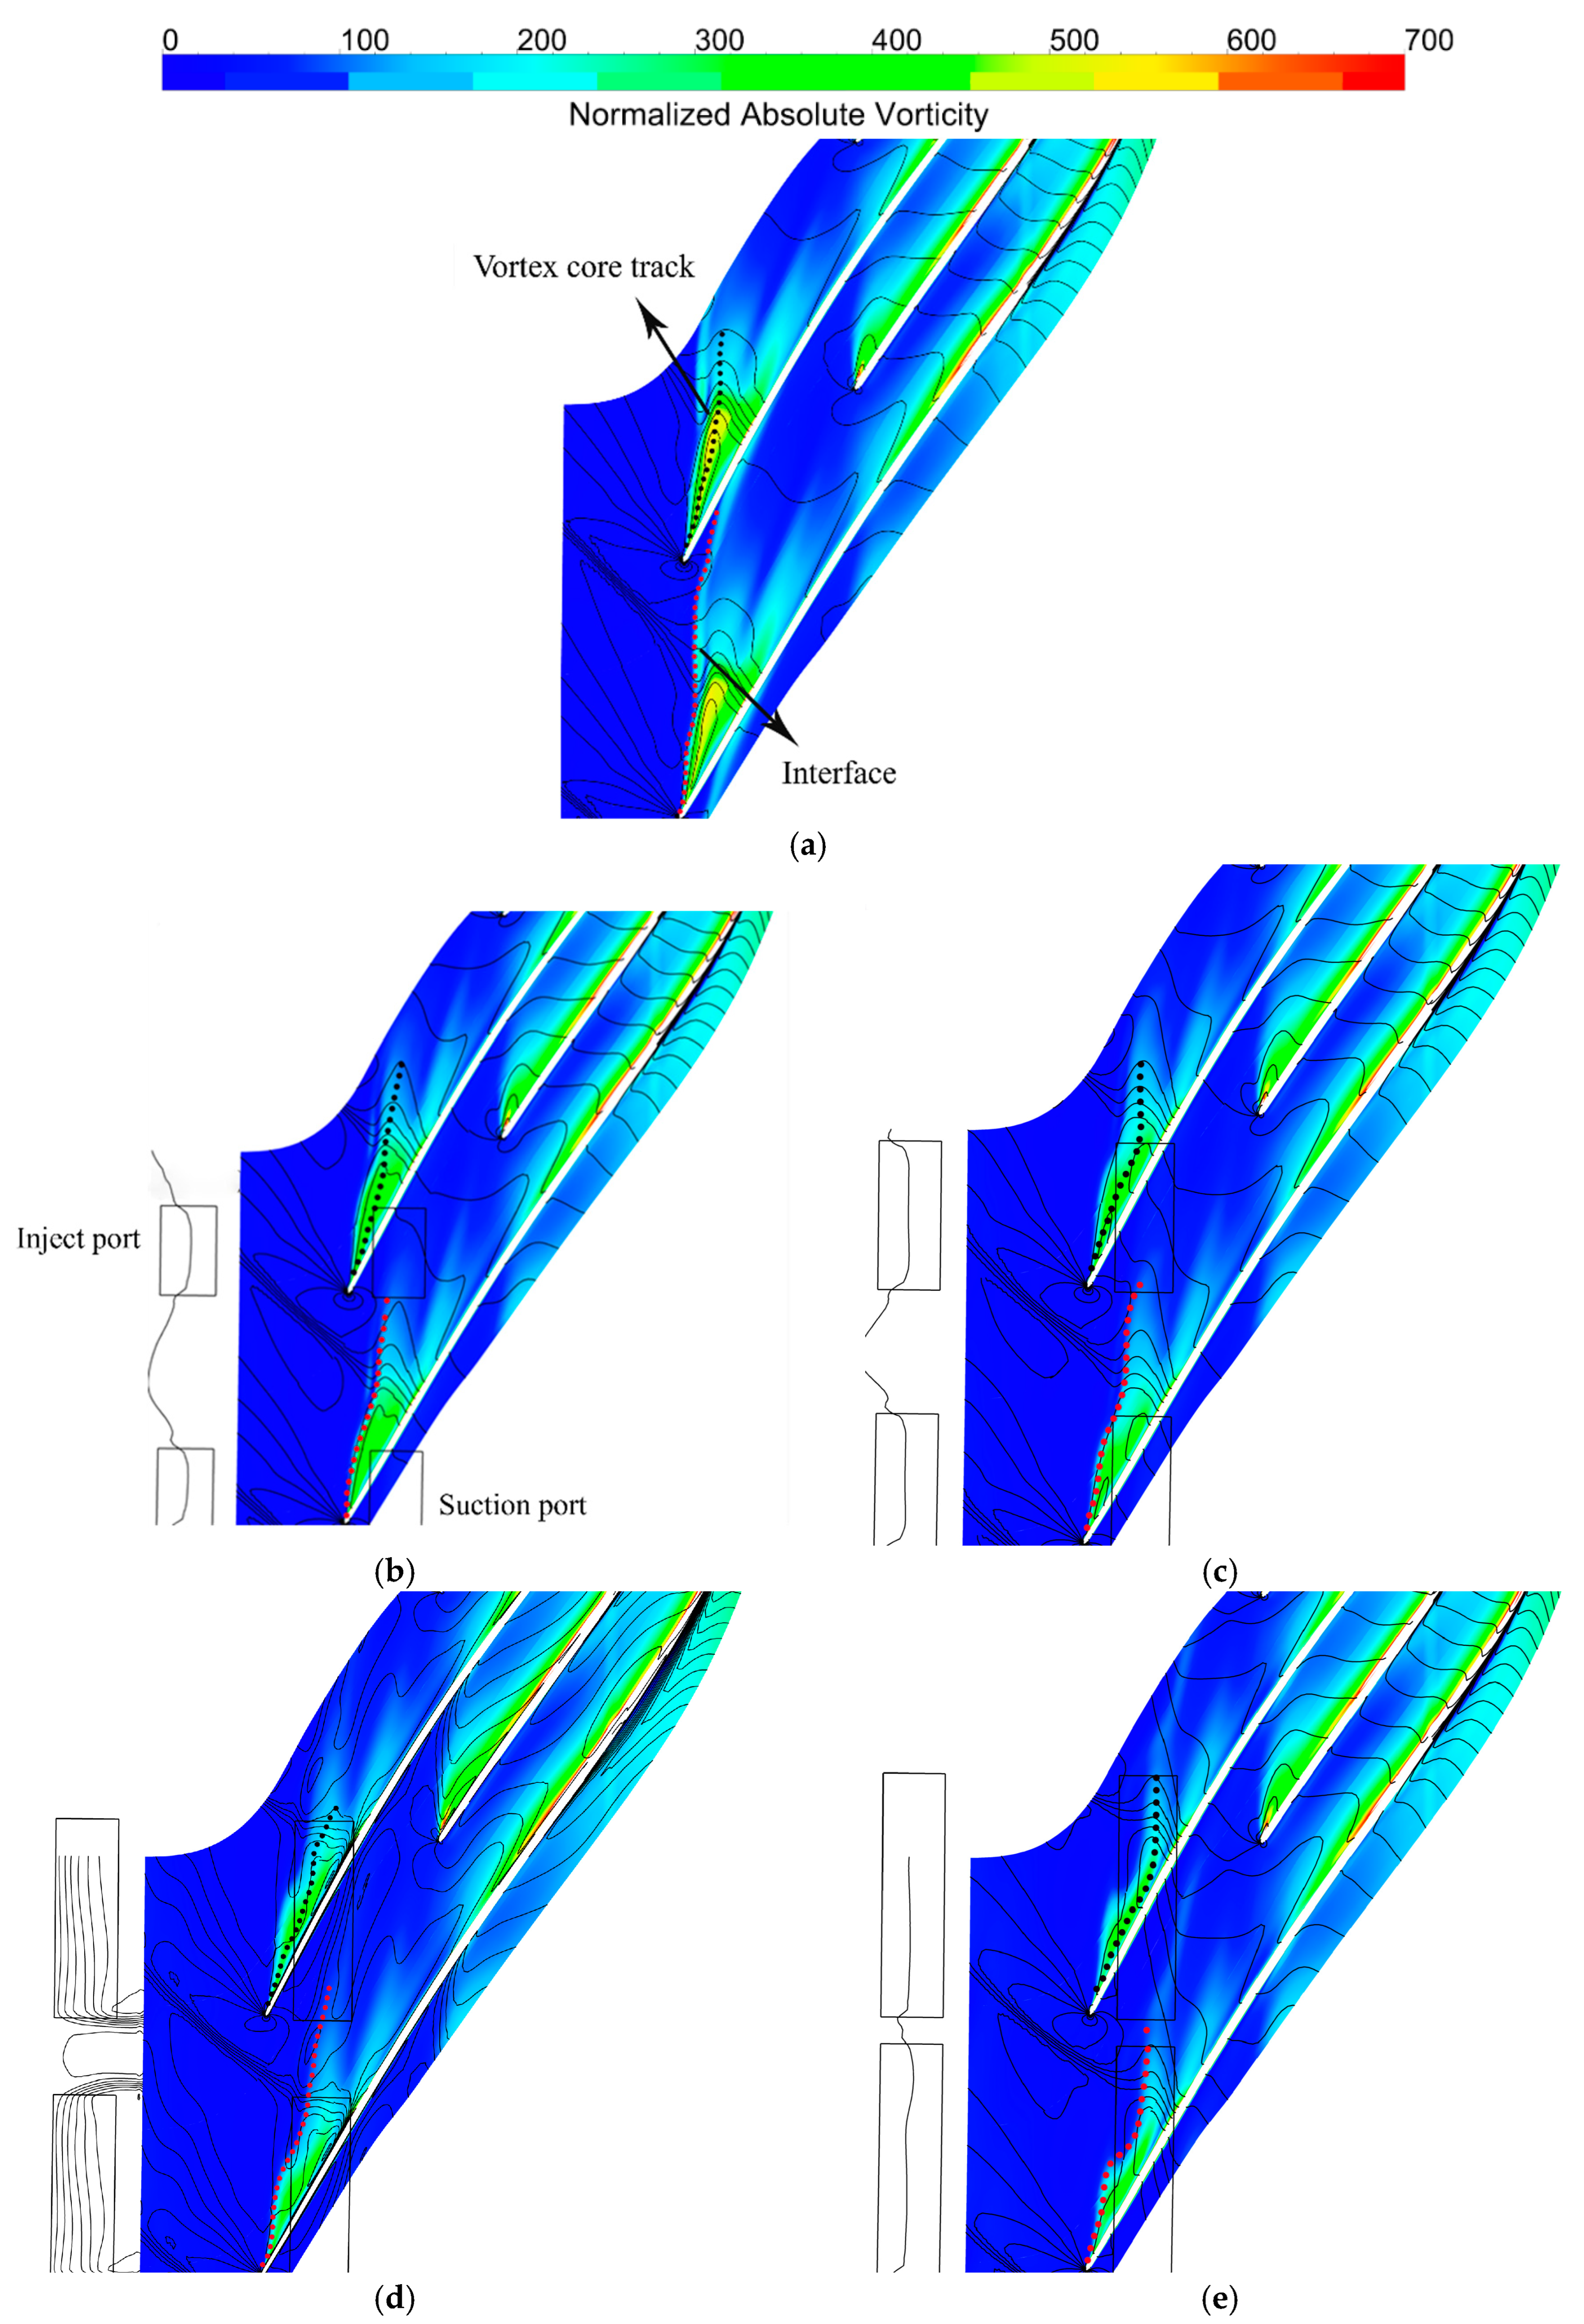
The absolute vorticity contours, static pressure isoline distribution, the track of the vortex core and the interface between mainstream and leakage flow were explored at the 98% blade span (Figure 18). The dashed black lines represent the track of the vortex core, and the dashed red lines represent the interface. The results indicate that the interface between the mainstream and the leakage flow almost fully blocked the front of the entire mainstream passage, and the vortex core track developed from the blade suction surface to the adjacent blade pressure surface. The interface between mainstream and leakage flow and the vortex core track at the blade tip leading edge deflect towards the blade suction surface, and the flow in the blade tip passage was improved after application of the self-circulation casing treatments. Notably, the self-circulating casing treatment with different circumferential coverage ratios had different effects on the vortex core track and interface between mainstream and leakage flow. The difference between SRCC0.36 and SRCC0.54 was not significant for the interface. However, a significant difference in the vortex core track was observed between SRCC0.36 and SRCC0.54. The vortex core track was more inclined to the suction surface in SRCC0.54 than in SRCC0.36. However, the effects of SRCC0.36 and SRCC0.54 on the vortex core track and the interface were not as effective as those observed for SRCC0.72 and SRCC0.9. The results showed that SRCC0.72 did not present a significant difference in the vortex core track compared with that of SRCC0.9. However, the interface was more inclined to the blade suction surface, and the flow area in the mainstream passage was larger in SRCC0.9 compared with SRCC0.72. In summary, the effects of the self-circulating casing treatment on the vortex core track and the mainstream/leakage flow interface were directly proportional to the circumferential coverage ratio.
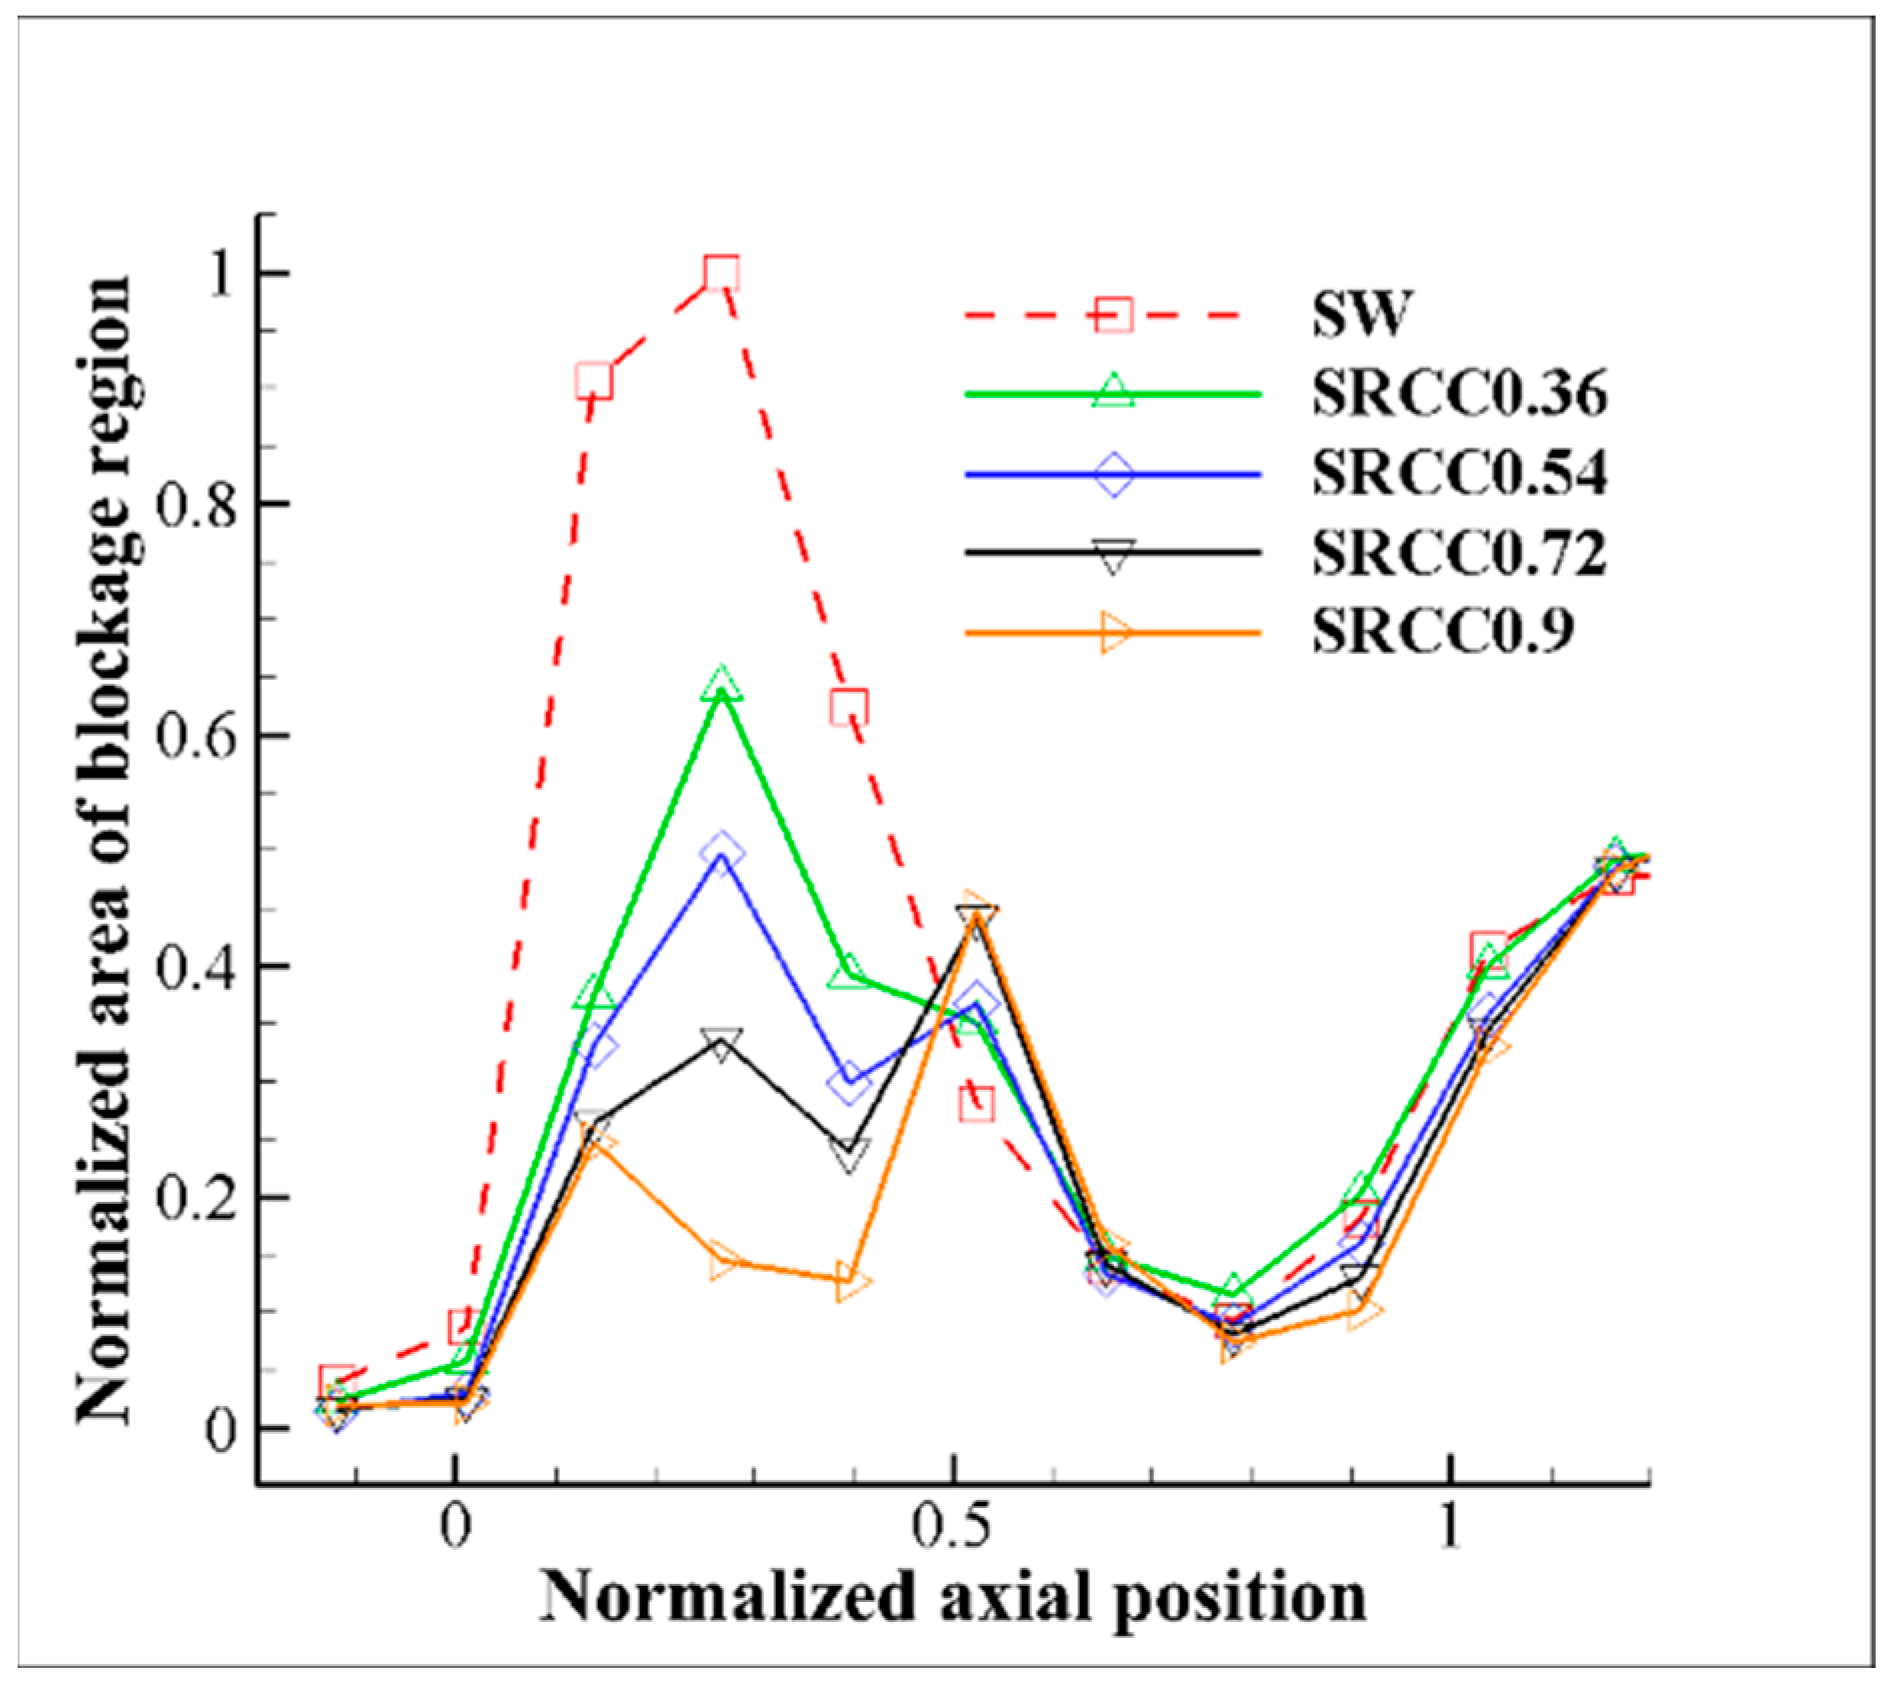
The relative blockage area distribution curves along the axial direction were generated to quantitatively evaluate the improvements in blockage in the blade tip passage by the four self-circulating casings (Figure 19). The horizontal axis represents the axial relative position of the blade tip passage, whereby 0–1 represents the passage from the mainstream blade leading edge to the splitter blade leading edge, and a value greater than 1 denotes the splitter blade passage. The vertical axis represents the relative blockage area. The self-circulating casing treatments effectively reduced the blockage area in the blade tip passage in most axial position ranges, especially in the 0 to 0.5 range compared with the solid-wall casing. A larger circumferential coverage ratio was correlated with a smaller blockage area and a higher ability of the self-circulating casing to improve the flow in the blade tip passage. The blockage area in the splitter blade passage was also improved by the various self-circulating casing treatments to varying degrees. These findings indicate that the self-circulating casing treatments improved the blockage in the mainstream blade passage and reduced the blockage in the splitter blade passage, which explains why the self-circulating casing treatment significantly improved the compressor’s stability.
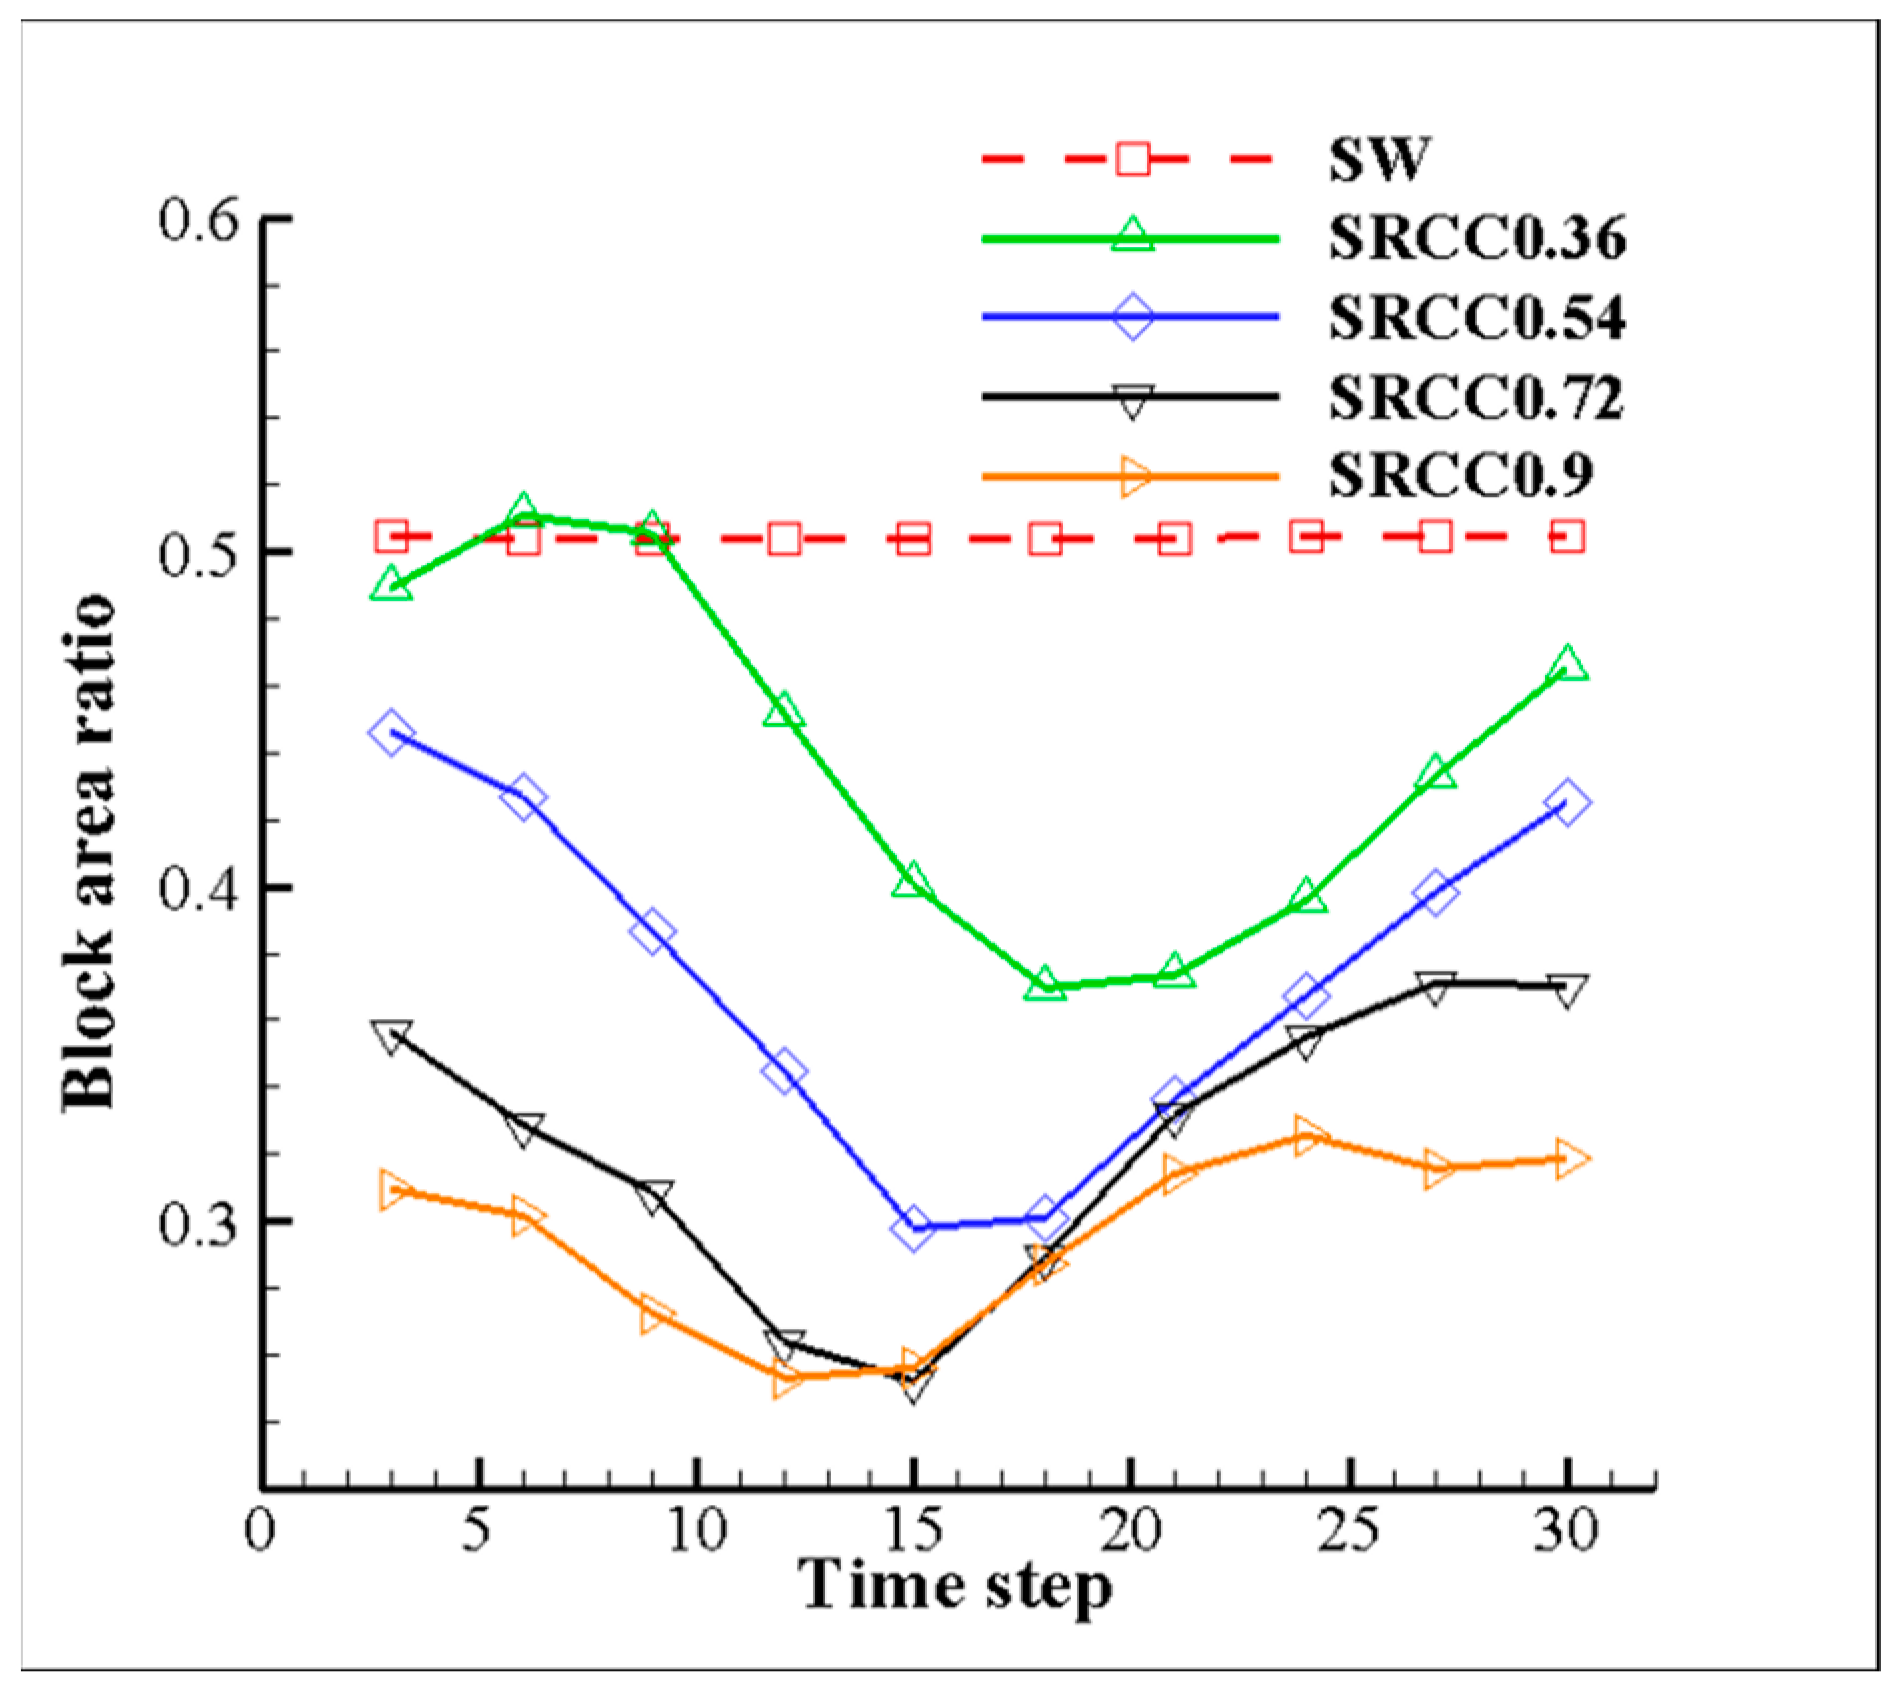
The changes in the blockage ratio of different self-circulating casings in the blade tip passage were determined over a complete period at 50% τ (Figure 20). The blockage ratio is expressed as follows:
B R = A b A × 100 %
where “A” represents the selected plane area and “ A b ” represents the area with negative relative axial velocity on the selected plane. The results showed that the blockage ratios of the different self-circulating casings changed over time at 50% τ (Figure 20). Notably, the blockage area at the blade tip was smaller than the solid-wall casing under the near-stall point after application of the self-circulating casing treatment. The blockage ratio decreased with increase in circumferential coverage ratio, and the minimum occurrence time decreased. The research schemes with high circumferential coverage ratio exhibited a blockage ratio less than that of the low circumferential coverage ratio at all times, which is highly consistent with the results reported in 
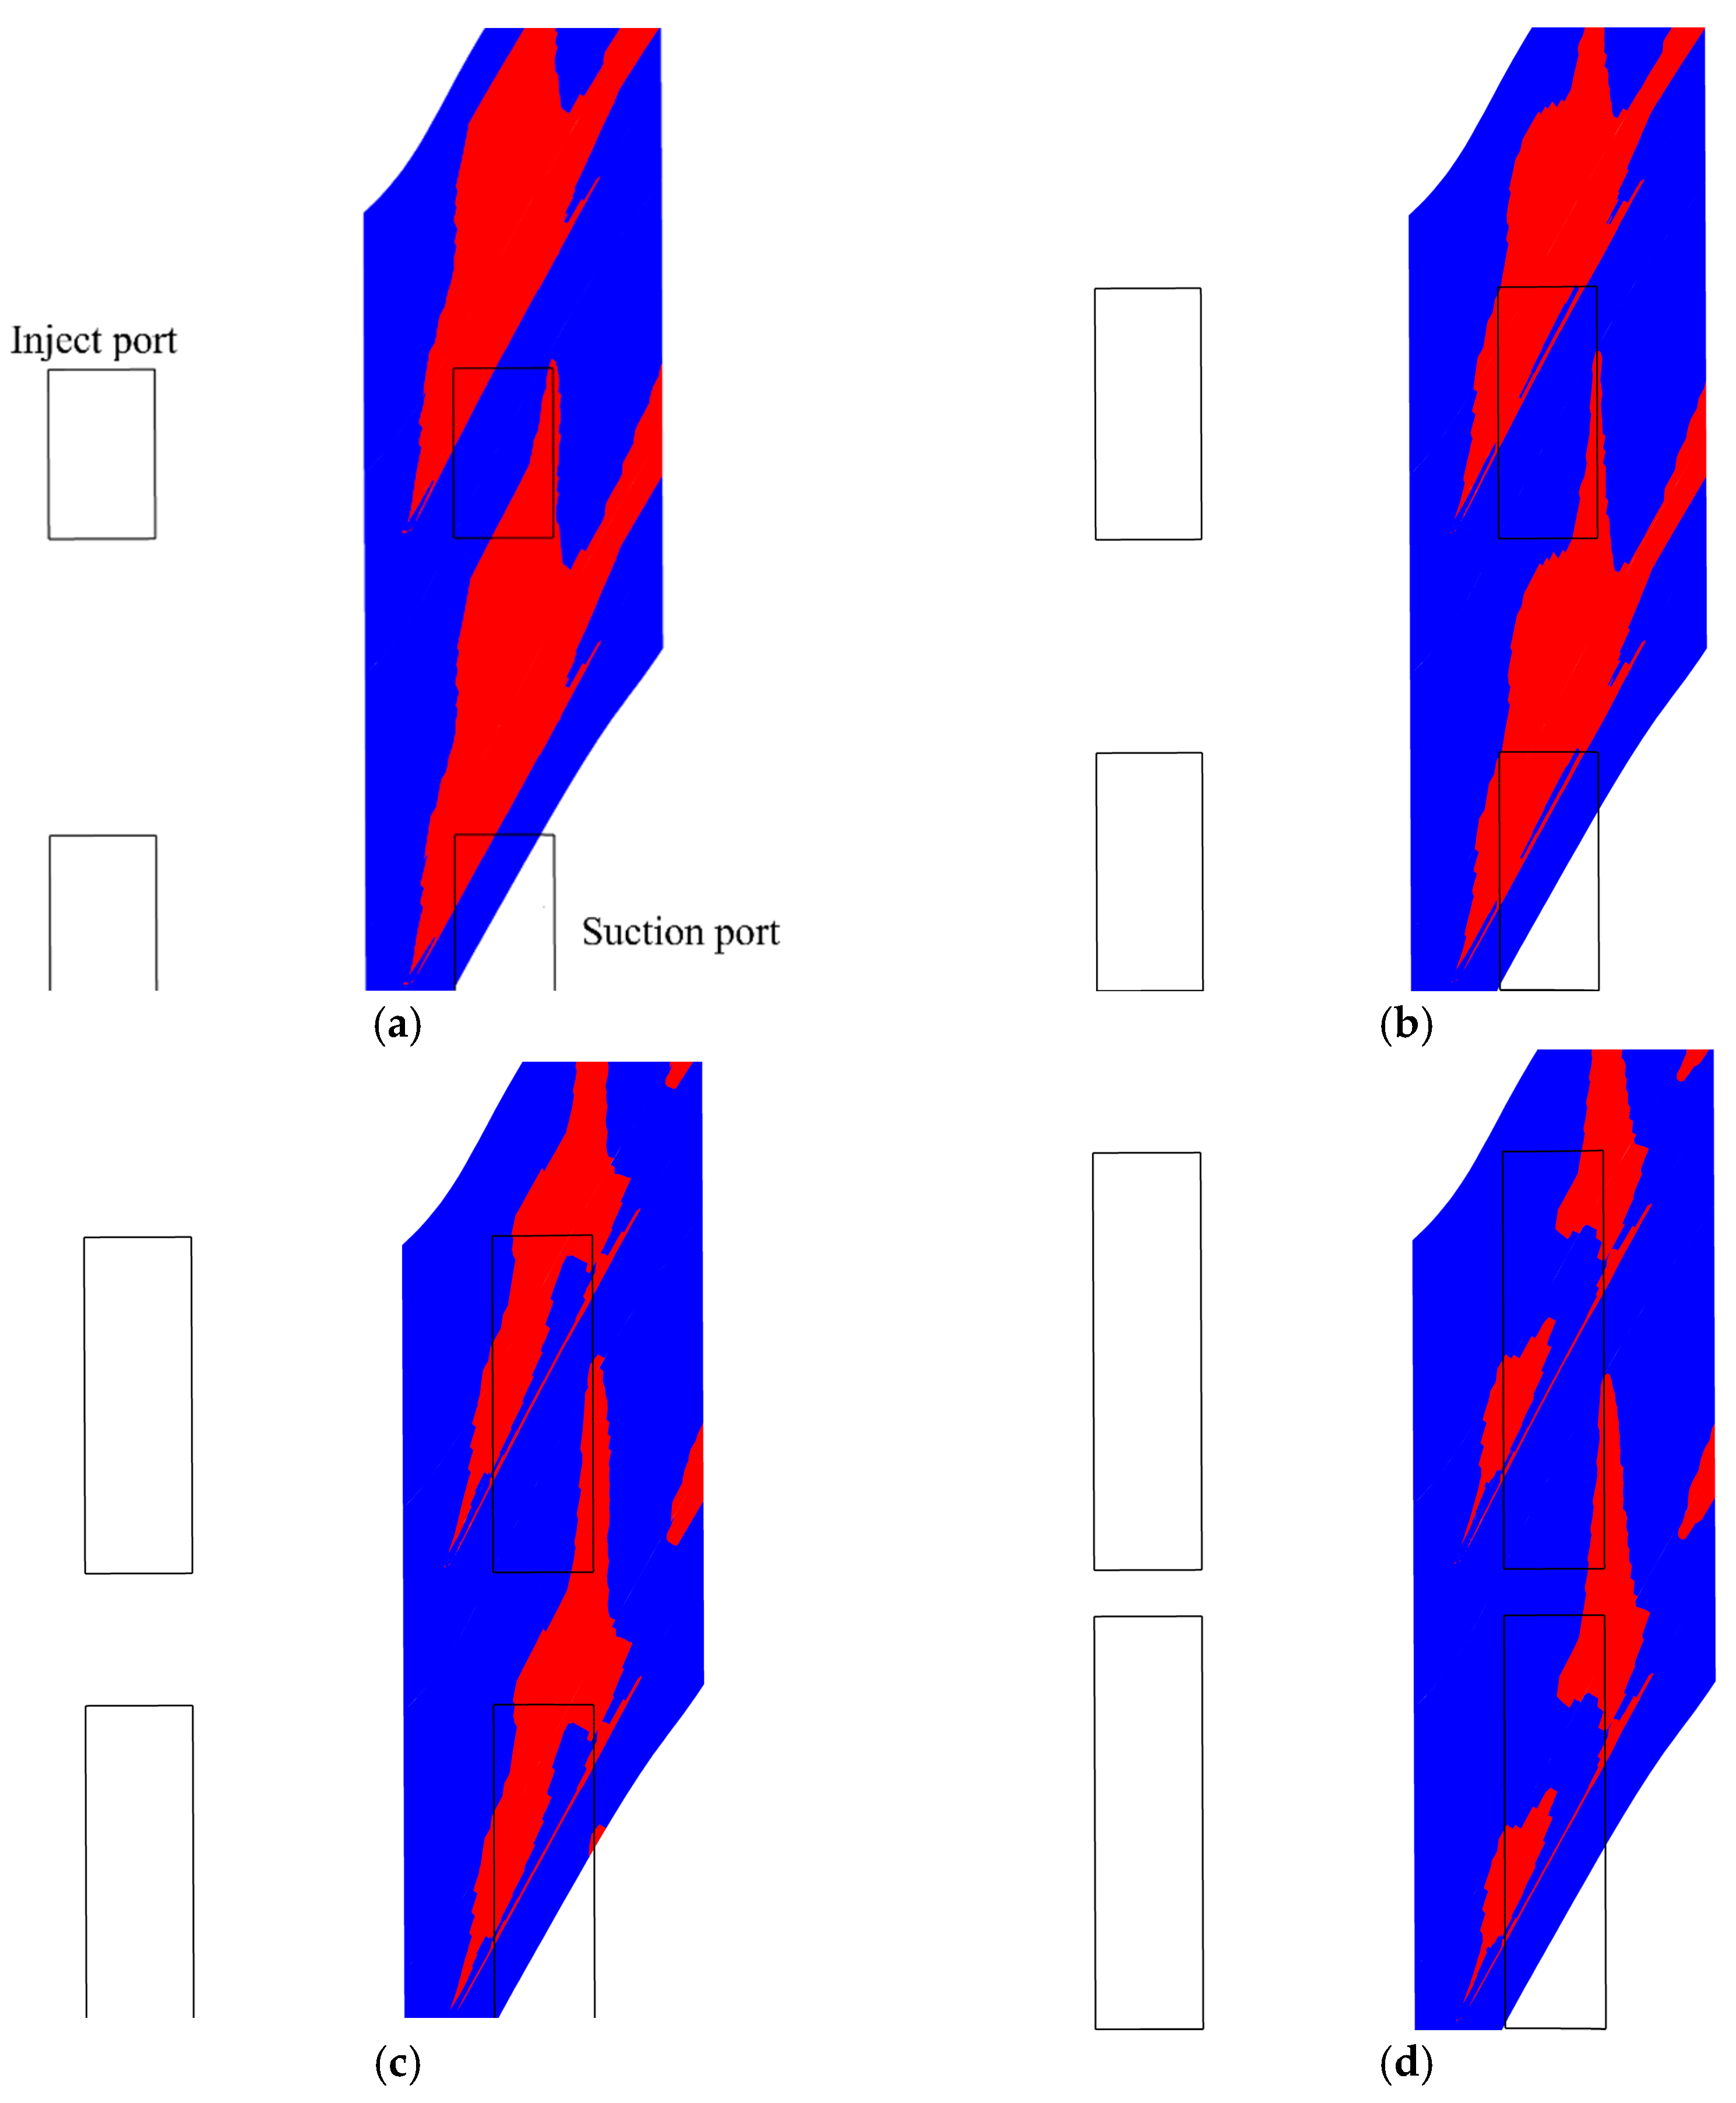
Figure 19. The unsteady time average of the blockage distributions was determined for the different casings at 99% blade span to further evaluate the blockage ratios in the blade tip passage for the four self-circulating casing treatments (Figure 21). The red region represents the area in which W z was negative. The contours indicate that the blockage area in the blade tip passage decreased with an increase in the circumferential coverage ratio, indicating that the qualitative analysis results were highly consistent with the quantitative results presented in Figure 20.
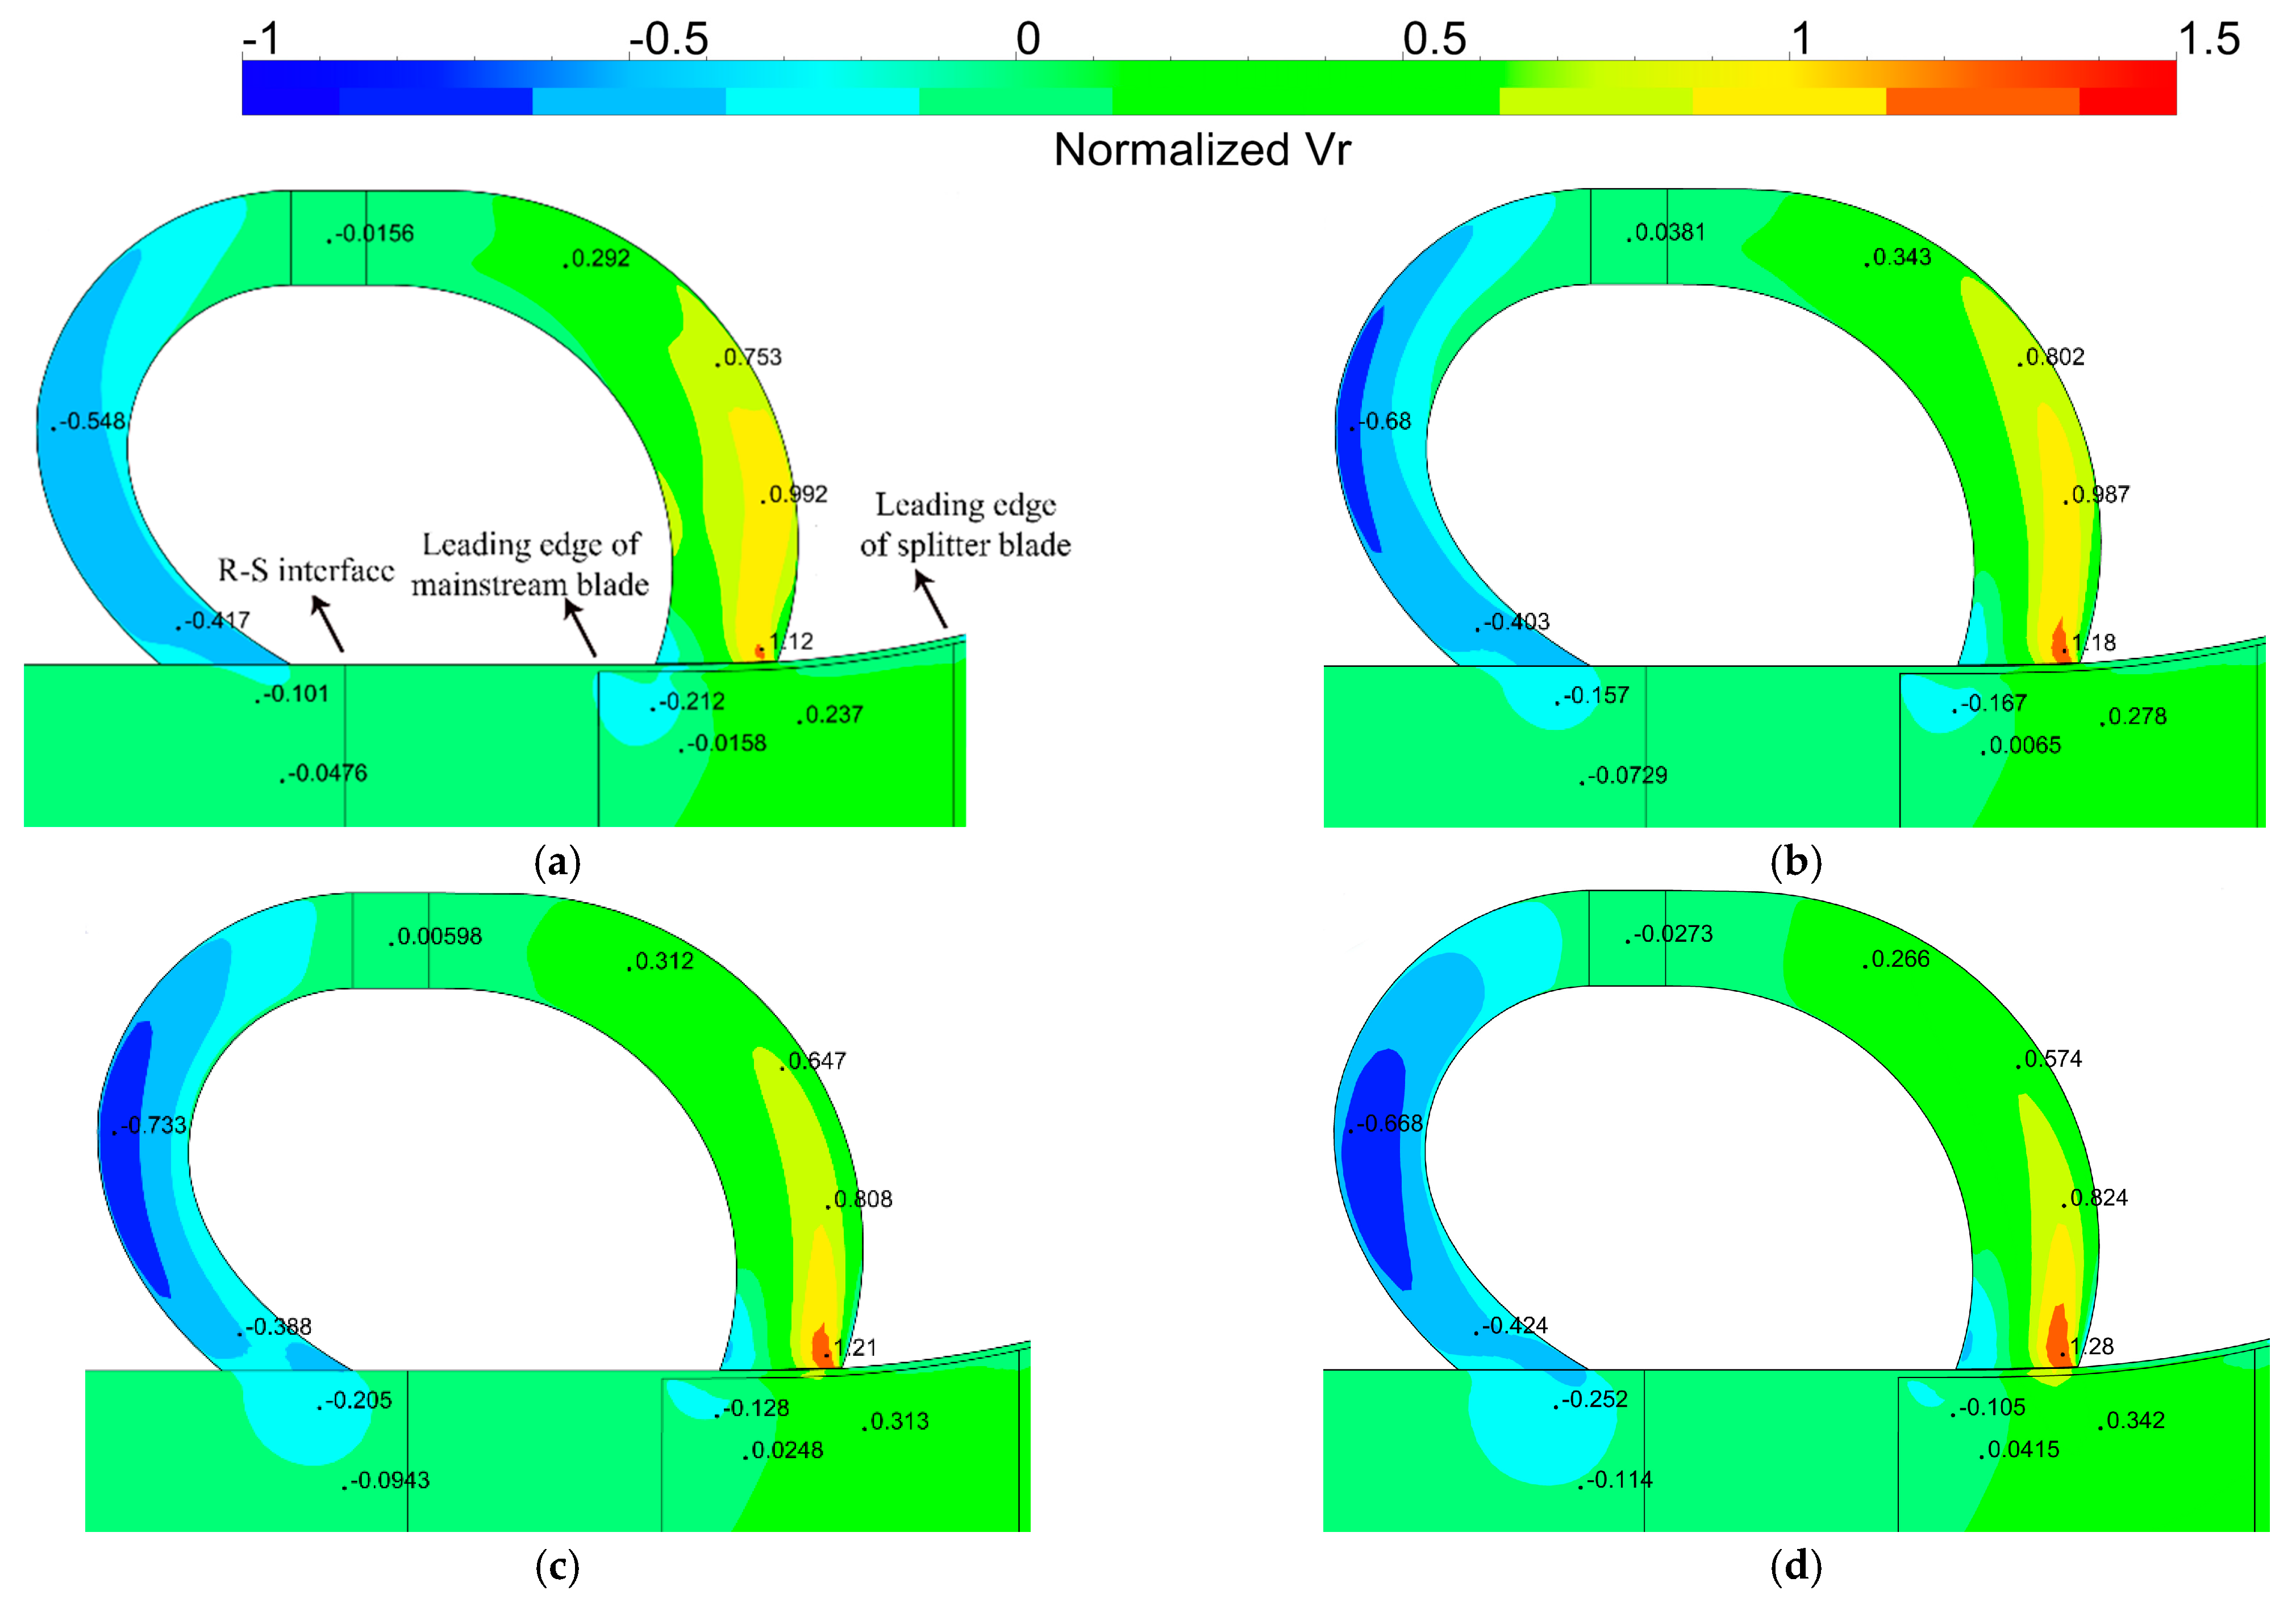
The meridional dimensionless radial velocity contours in and under four self-circulating casings were determined (Figure 22). The radial velocity selected in contours represented the circumferential average value of unsteady time-average simulation results, and the dimensionless radial velocity was equal to the ratio of the local radial velocity to the average axial velocity at the inlet. The numbers in the contours show the dimensionless radial velocity value at that location, and a positive value indicates an upward direction. The results showed that the absolute dimensionless radial velocities at the suction and inject port of four self-circulation casings were relatively large. The red area with the largest absolute value of radial velocity increased with an increase in the circumferential coverage ratio, indicating that the upward radial velocity at the suction port was proportional to the circumferential coverage ratio. The blue area corresponds to the downward radial velocity at the inject port, and a larger area indicates a greater and more extensive downward radial velocity. The contours show that the downward radial velocity at the inject section increased with an increase in the circumferential coverage ratio, and the area had a positive effect. The downward radial velocity area under the inject port increased with an increase in the circumferential coverage ratio, implying that a larger circumferential coverage ratio was correlated with a large velocity and the area occupied by the jet.
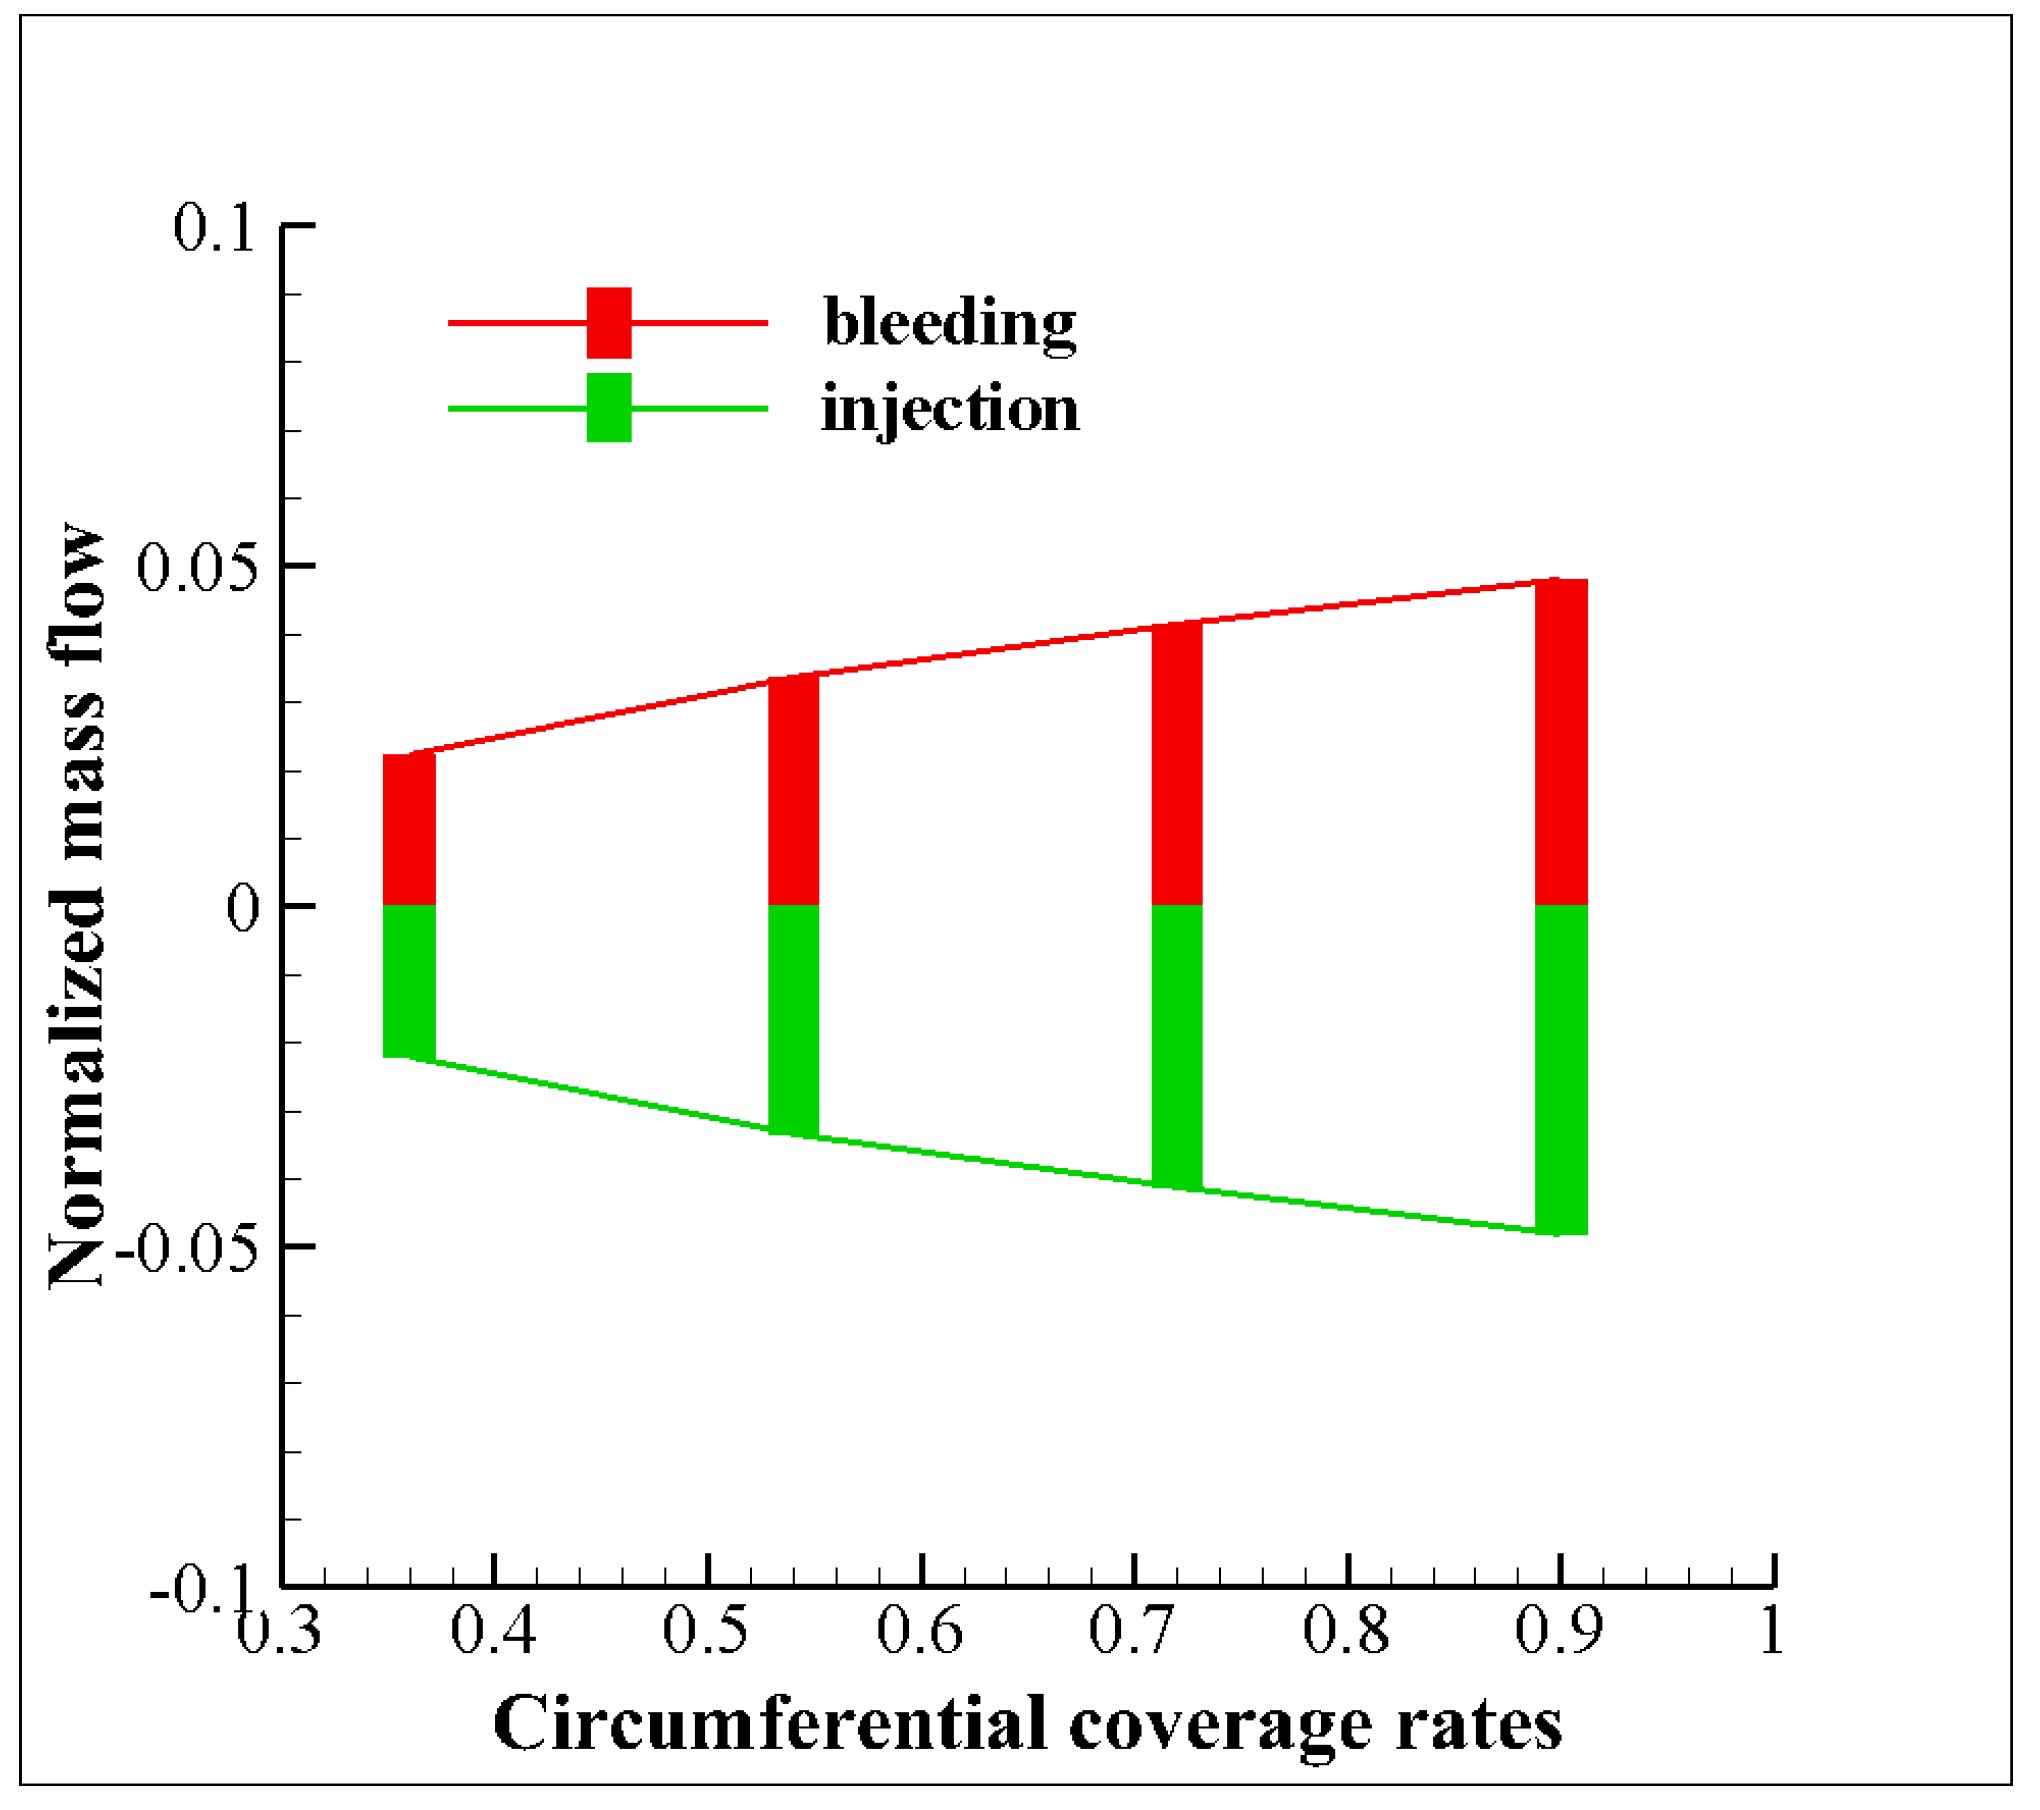
A histogram of the dimensionless mass flow rate at the suction and inject port of the self-circulating casings was generated under different circumferential coverage ratios (Figure 23). The abscissa represents the circumferential coverage ratio, and the ordinate represents the dimensionless suction and inject mass flow rate based on the compressor design mass flow rate. The results showed that a large circumferential coverage ratio was correlated with a large mass flow rate through the suction and inject port of the self-circulating casings. The gas from the inject port flowed into the compressor mainstream, which increased the compressor’s inlet mass flow rate and delayed the occurrence of a stall.
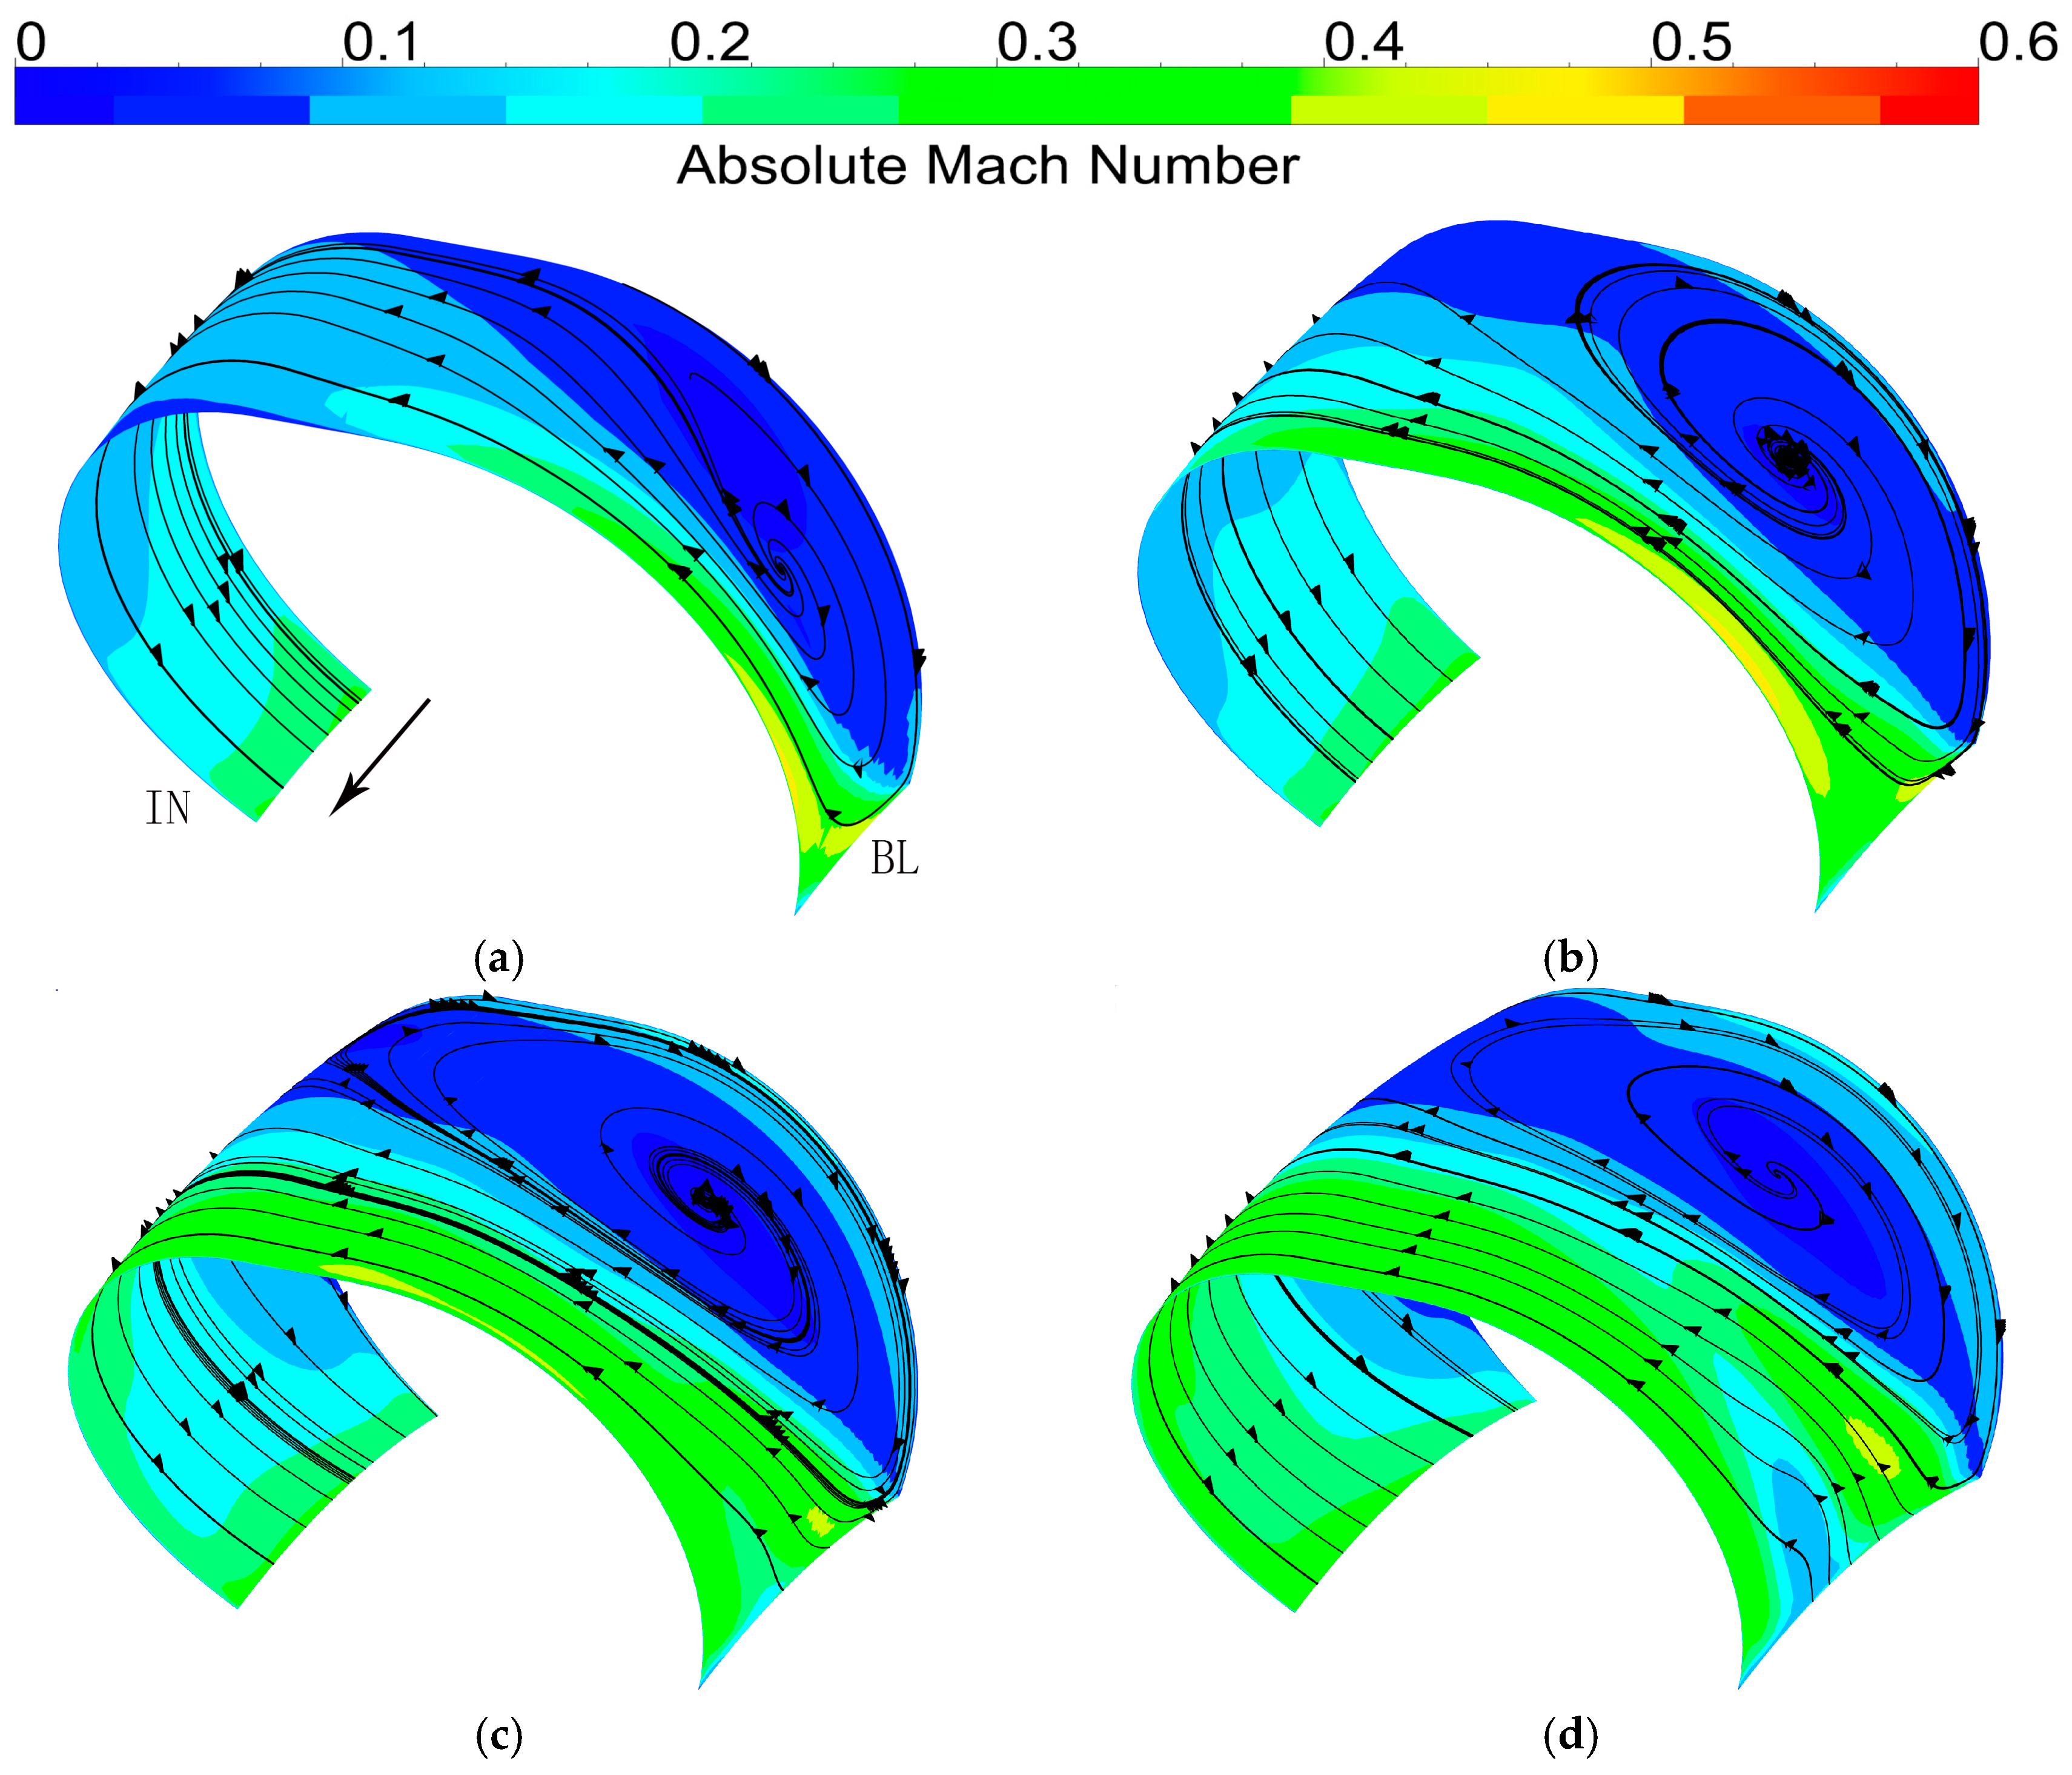
The absolute Mach number and streamline distribution in the self-circulating casing were determined and are presented in Figure 24. The circumferential section with the same radial height was selected for the different self-circulating casings. The arrow in the figure represents the impeller rotation direction. “BL” and “IN” represent the inject port section and suction port section, respectively. Analysis showed that increase in the circumferential coverage ratio increased the high Mach number area in the self-circulating casing, implying that a high circumferential coverage ratio significantly enhanced the flow in the self-circulating casing. This explains why the mass flow rate through the self-circulating casing increased with an increase in the circumferential coverage ratio. The airflow movement at the suction port of the self-circulating casing presented a circumferential to radial deflection, then the airflows flowed along the self-circulating casing wall to the inject port, indicating that the airflows through the self-circulating casing required a specific circumferential to radial deflection space provided by the self-circulating casing. The airflow could smoothly pass through the self-circulating casing but existed in the self-circulating casing in the form of low Mach number vortexes. A large circumferential coverage ratio significantly enhanced the airflow at the self-circulating casing suction port and increased the flow capacity of the self-circulating casing.
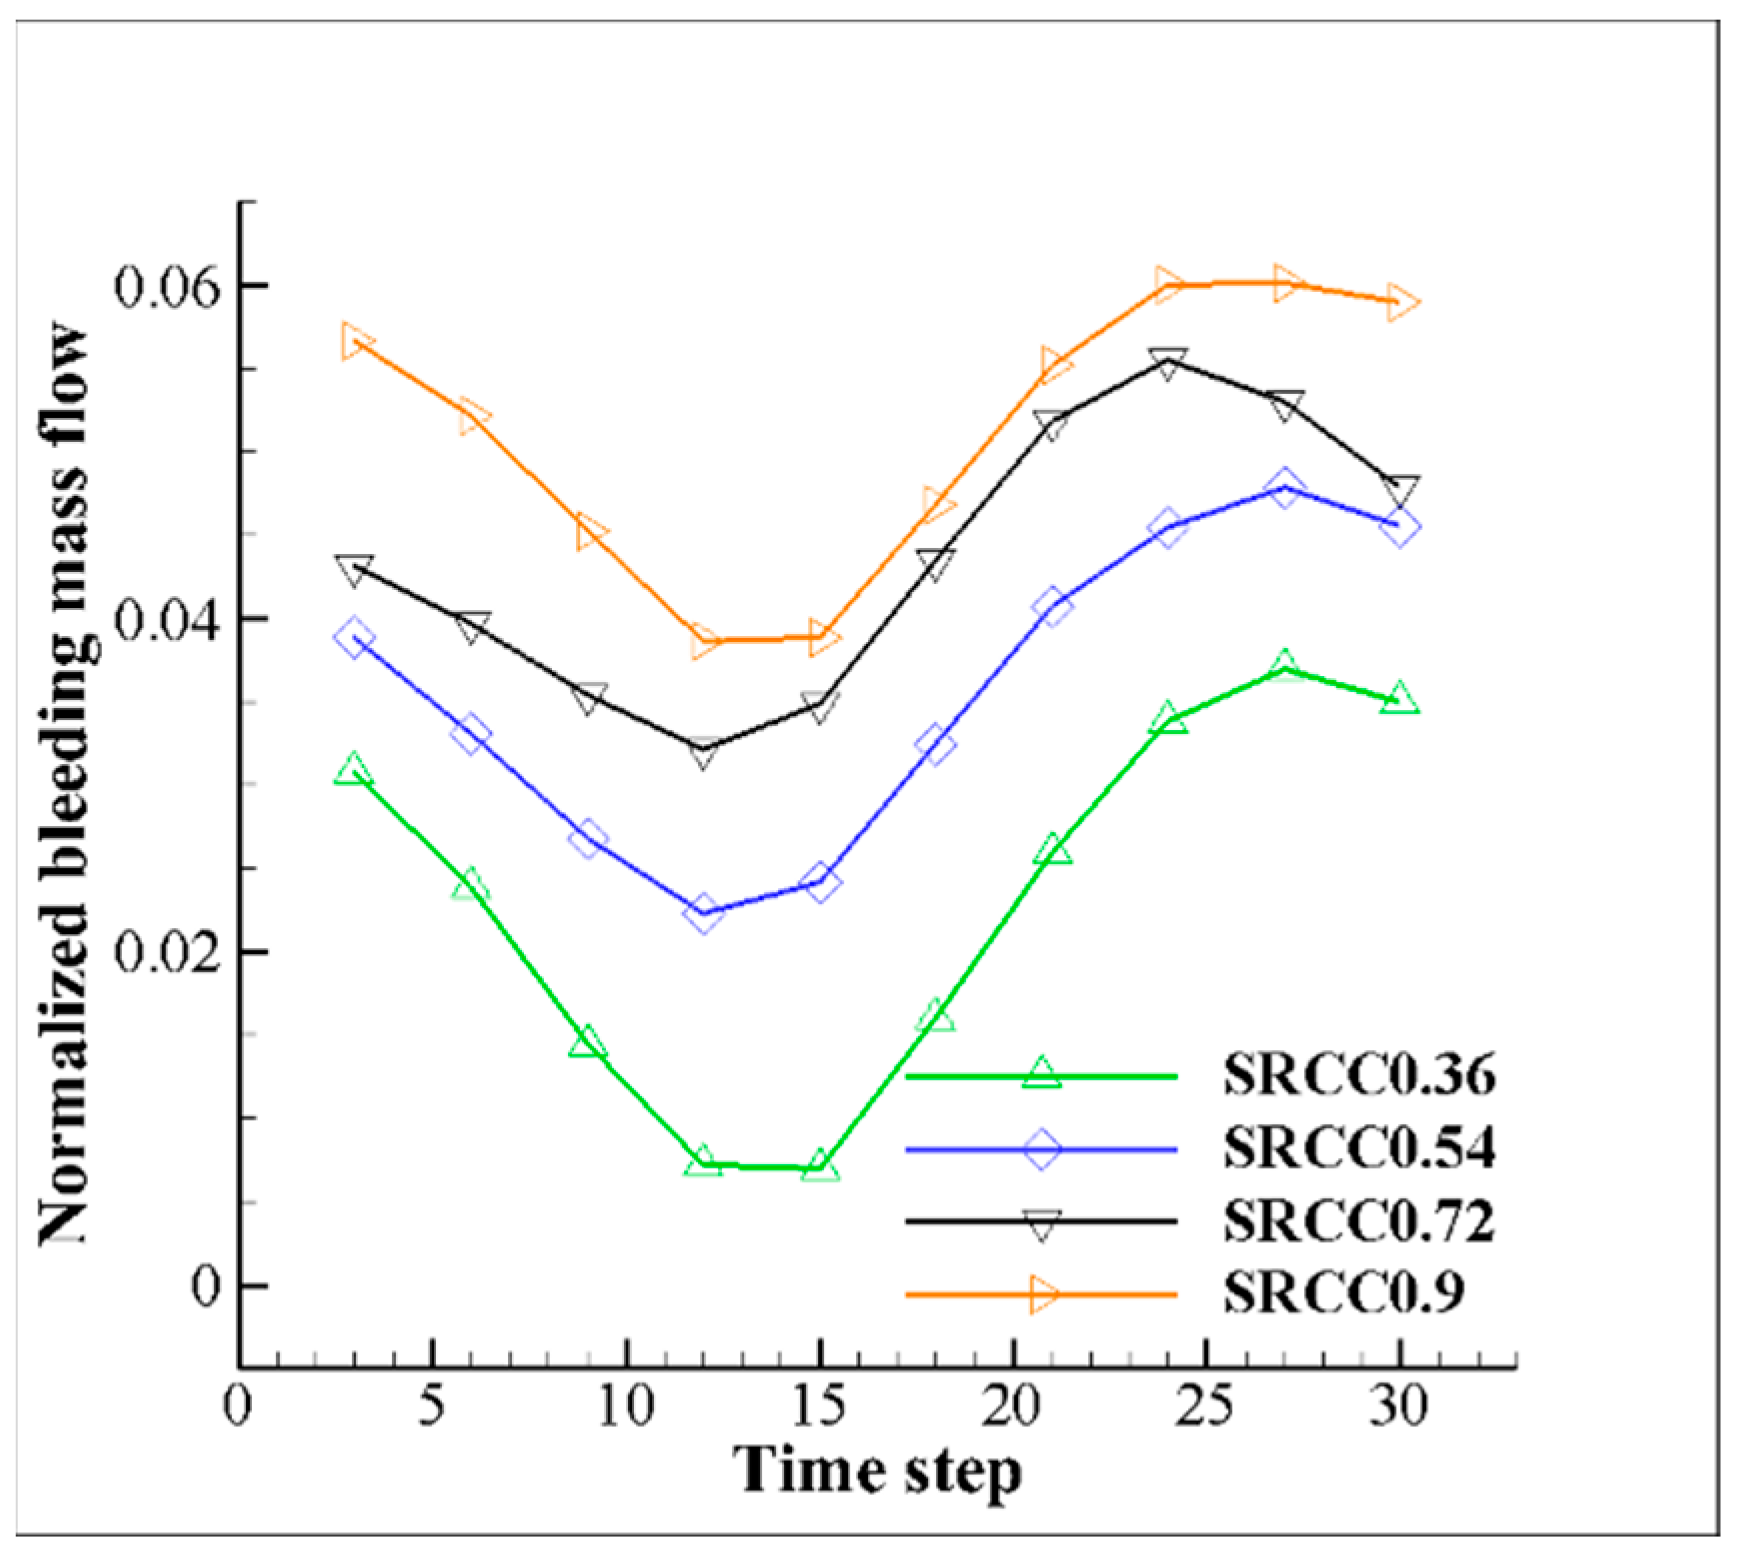
Change in dimensionless mass flow rate through the different self-circulating casings was determined over time (Figure 25). The ordinate represents the dimensionless mass flow rate based on the compressor design flow. The findings indicate that the dimensionless mass flow rate through the different self-circulating casings had significant fluctuations at different times. The mass flow rate was positively correlated with the circumferential coverage ratio. The mass flow rate increased gradually with an increase in the circumferential coverage ratio. Analysis of the mass flow rate change curve showed that the fluctuation rules of the different self-circulating casing treatments were remarkably similar, and the wave crest and wave trough basically occurred at the same time.
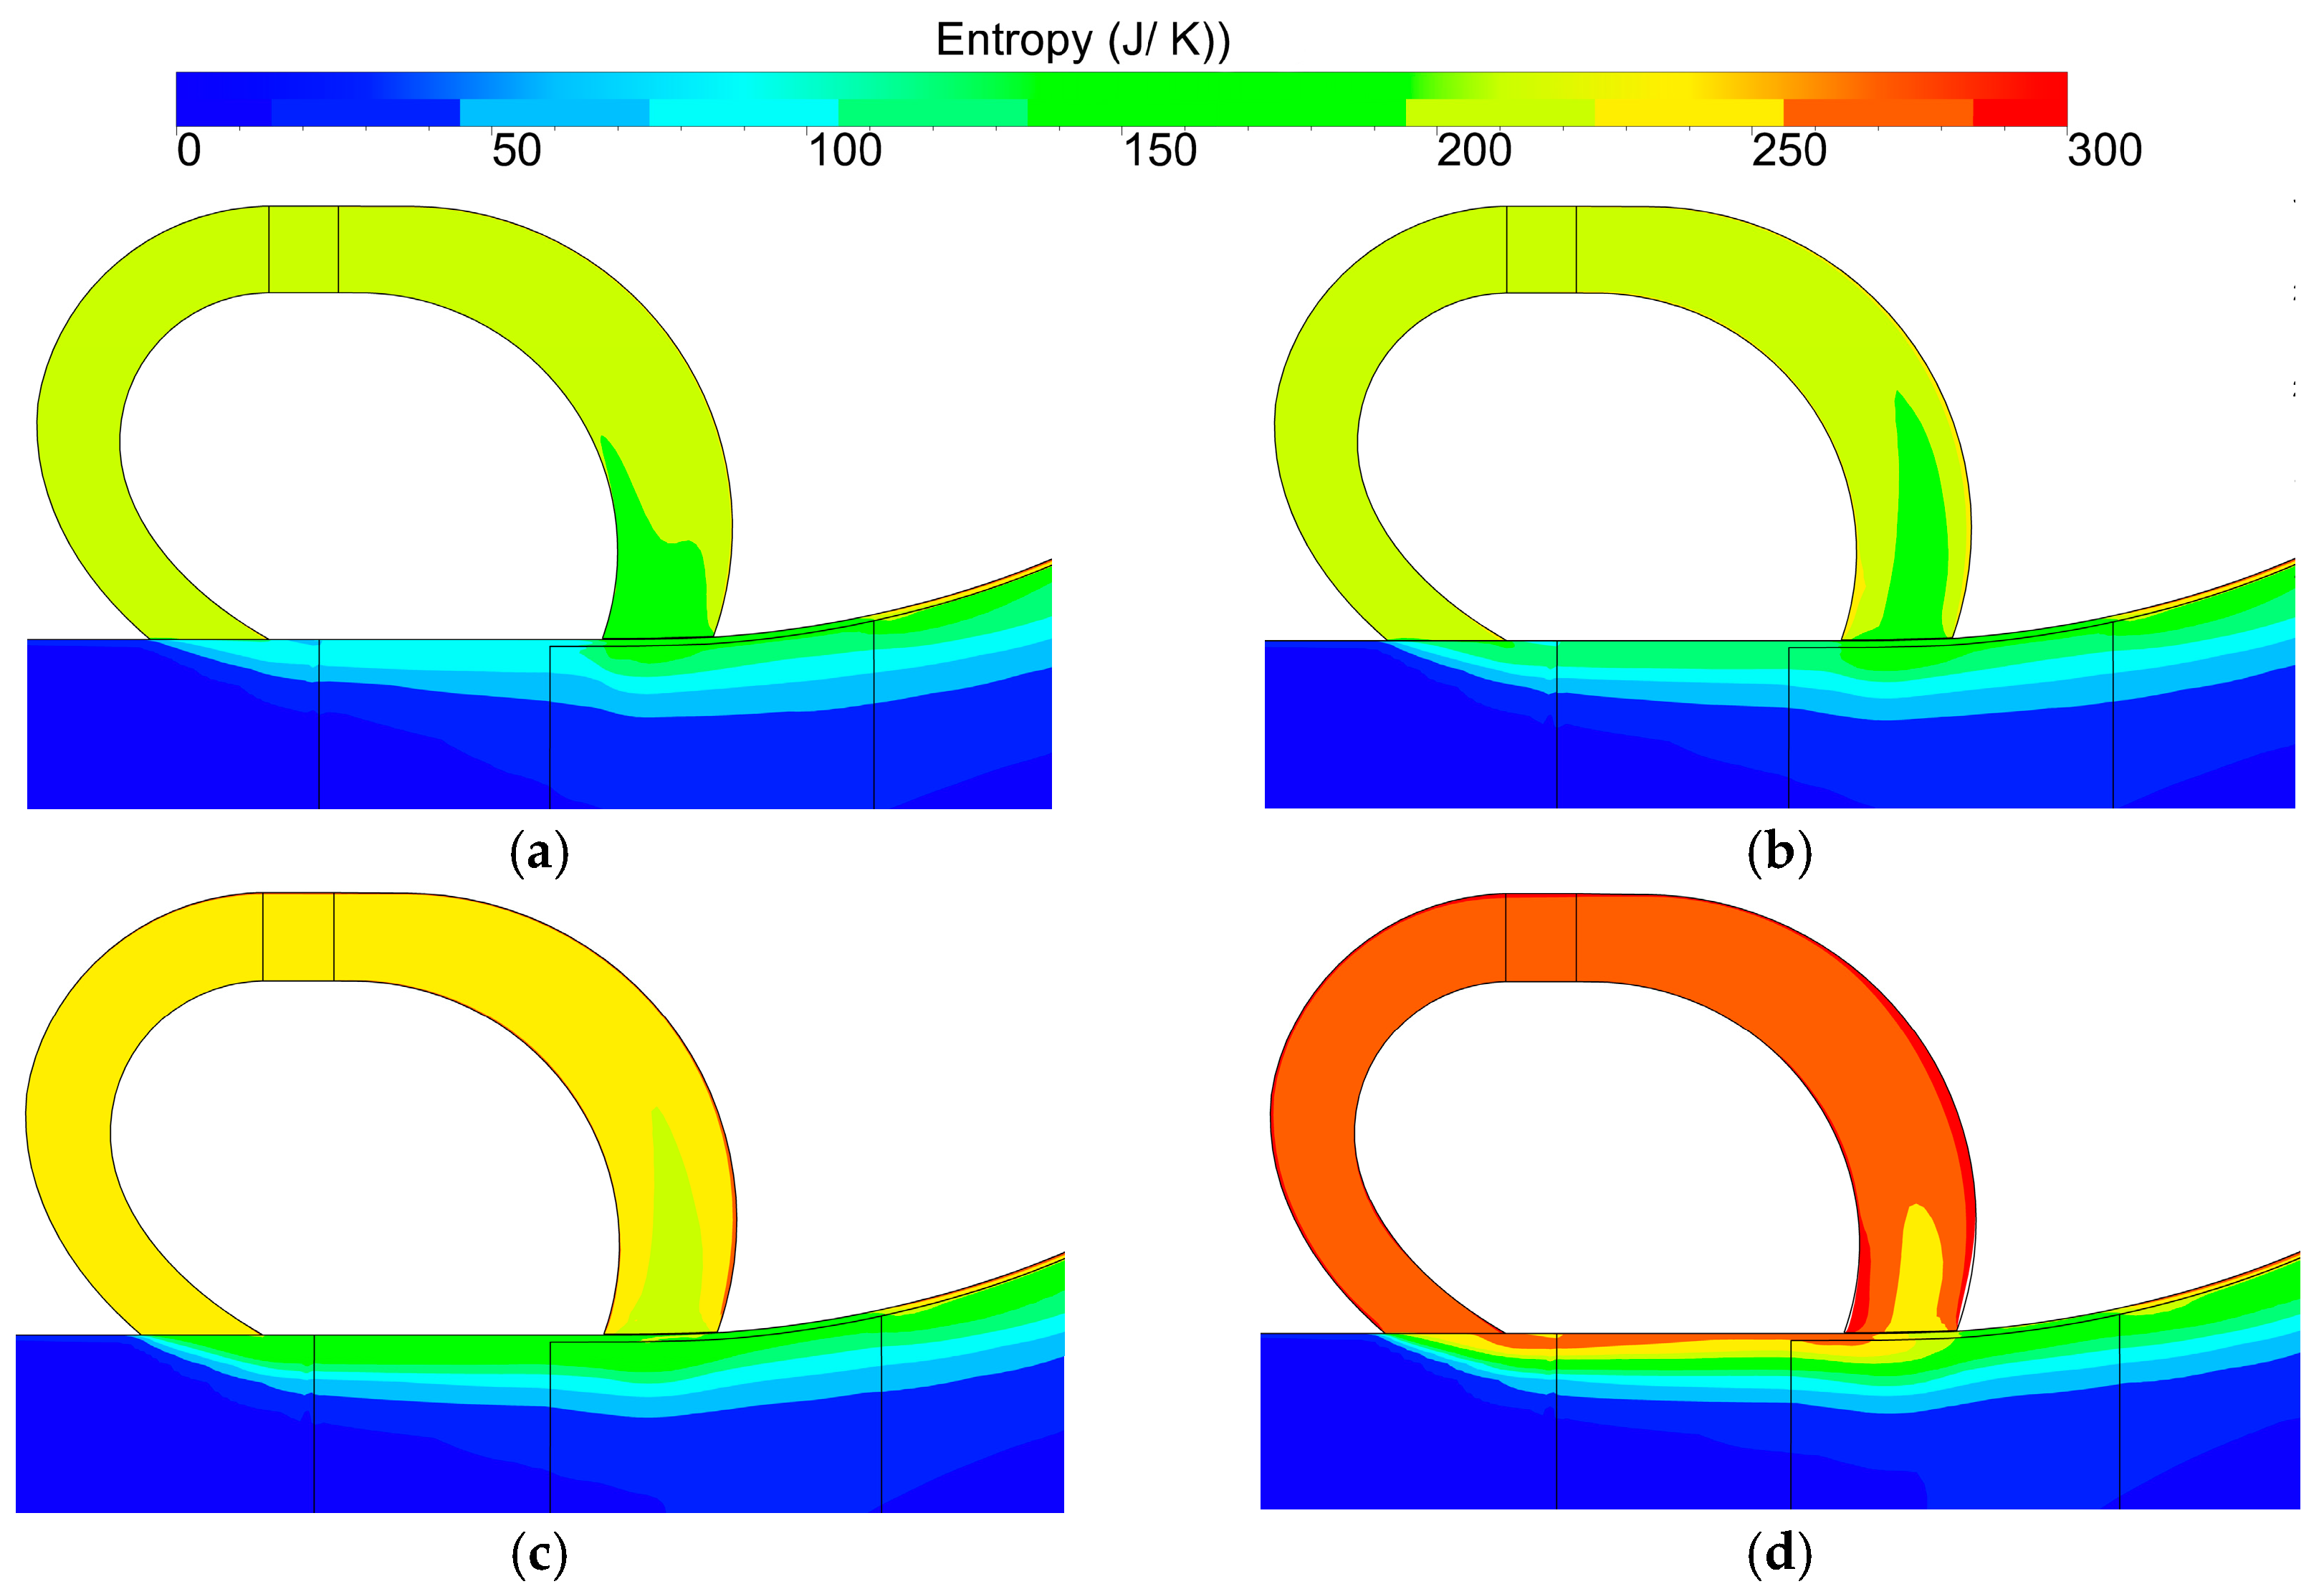
The entropy distribution in and under the four self-circulating casings on the meridian plane was determined as shown in Figure 26. The contours indicate that the entropy in the self-circulating casings had no significant difference between SRCC0.36 and SRCC0.54. In general, the entropy in the self-circulating casing increased with an increase in the circumferential coverage ratio, implying that the flow loss also increased. The high entropy area consistently increased in the blade tip passage with increase in circumferential coverage ratio. The maximum of entropy in SRCC0.9 was more than 250 J/K. The results in Figure 22 and Figure 23 showed that the mass flow rate through the suction/inject port, the velocity and momentum of flow in the self-circulating casing gradually increased with an increase in the circumferential coverage ratio. Mixing of the mainstream with the jet became violent, resulting in an increase in the entropy. This finding implies that the circumferential coverage ratio was positively correlated with the flow loss under the inject port.
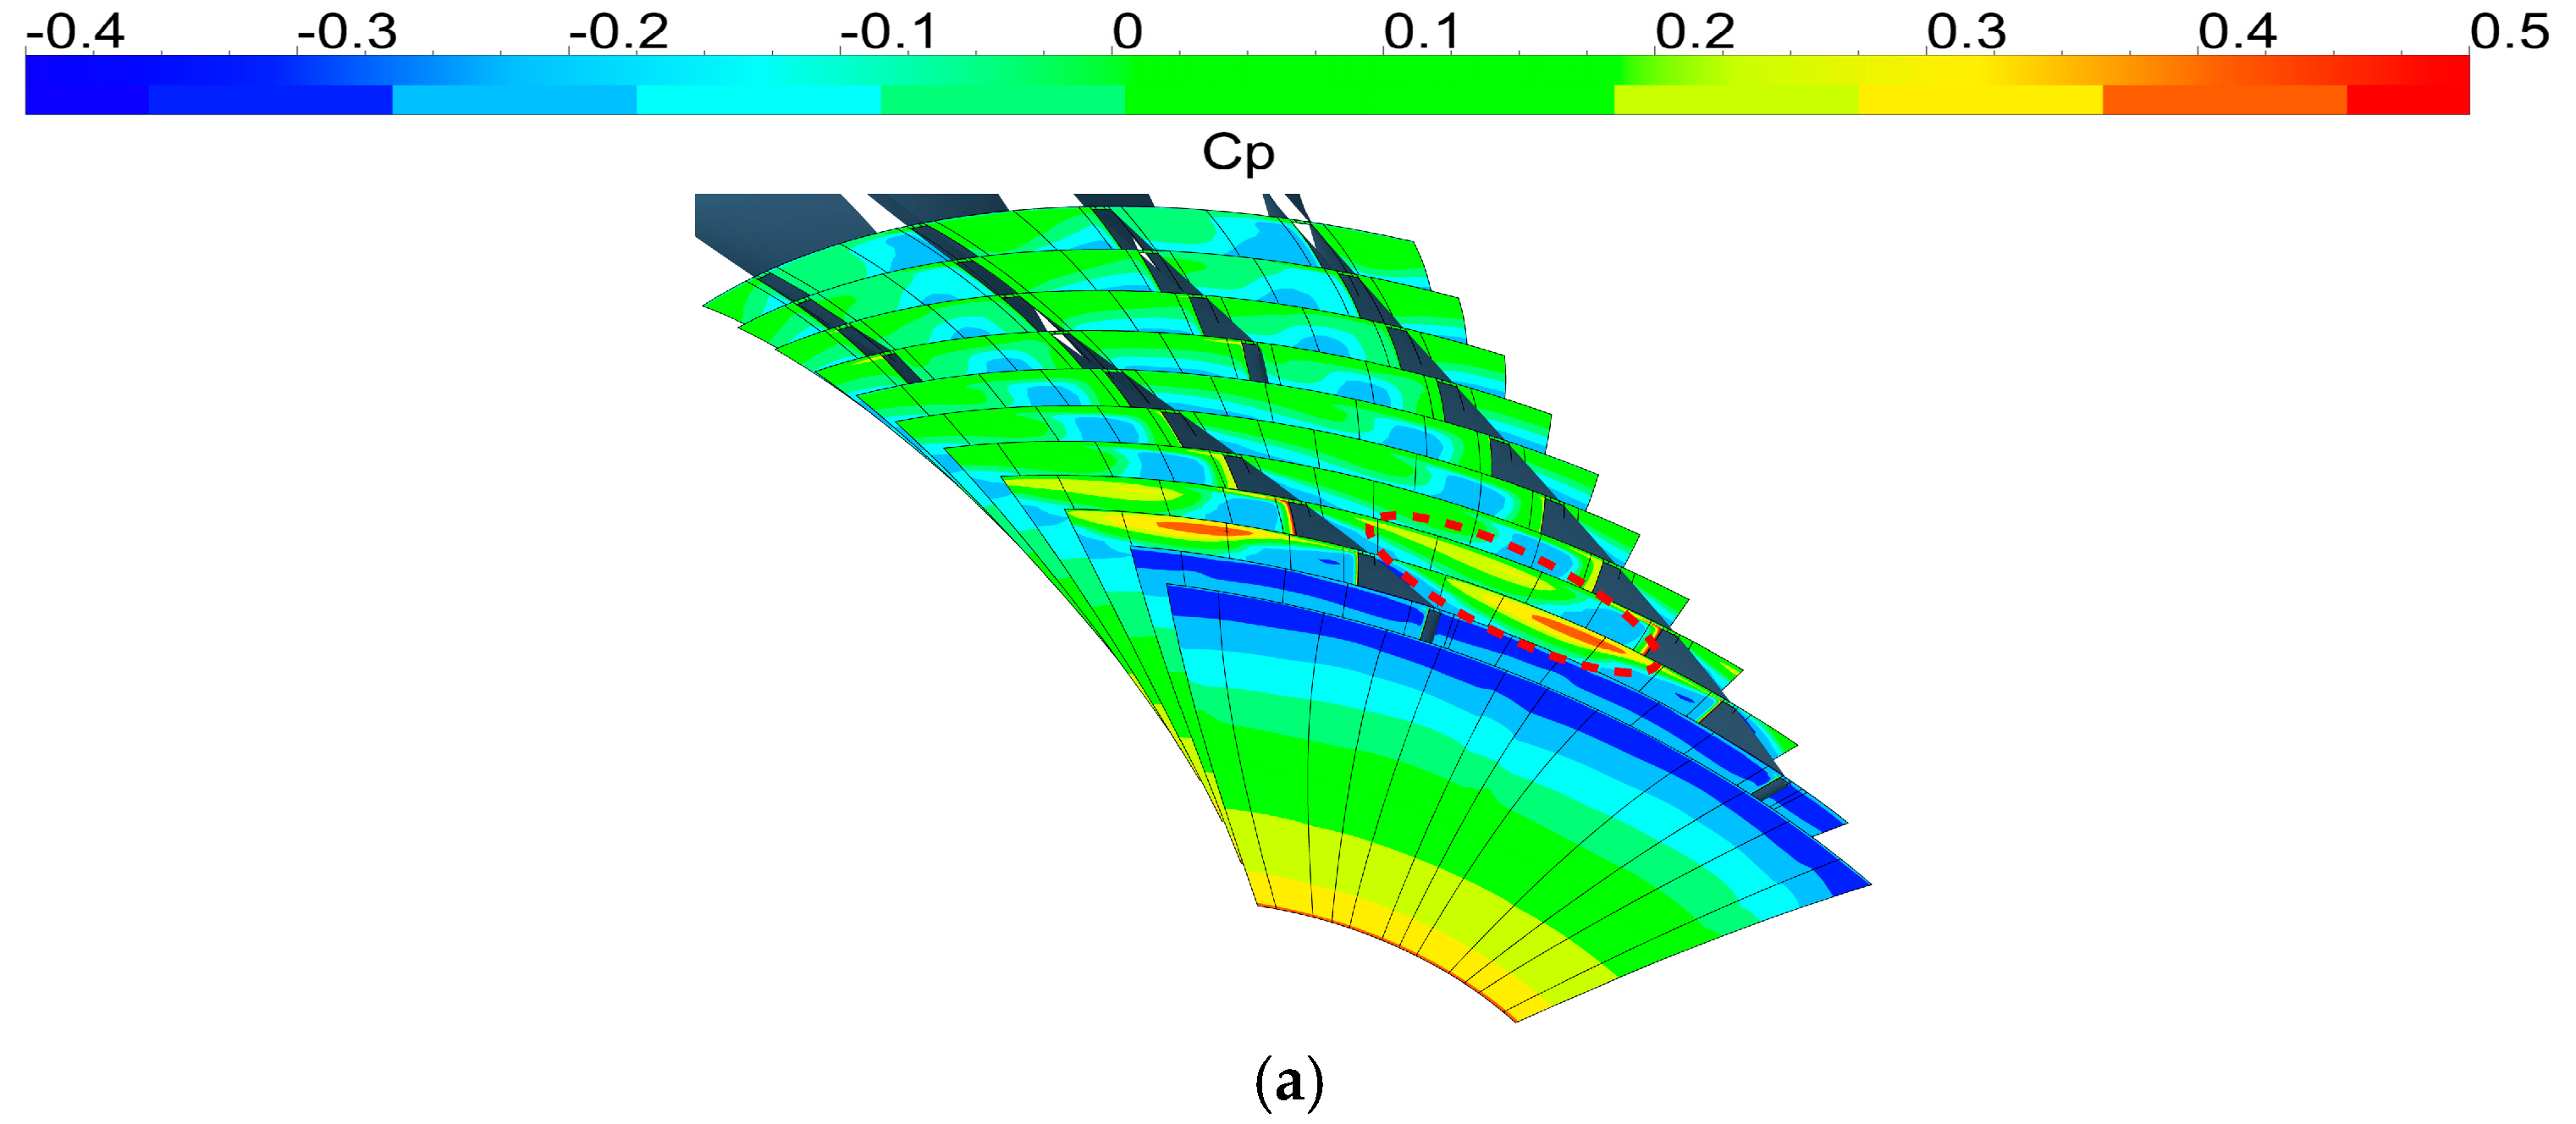
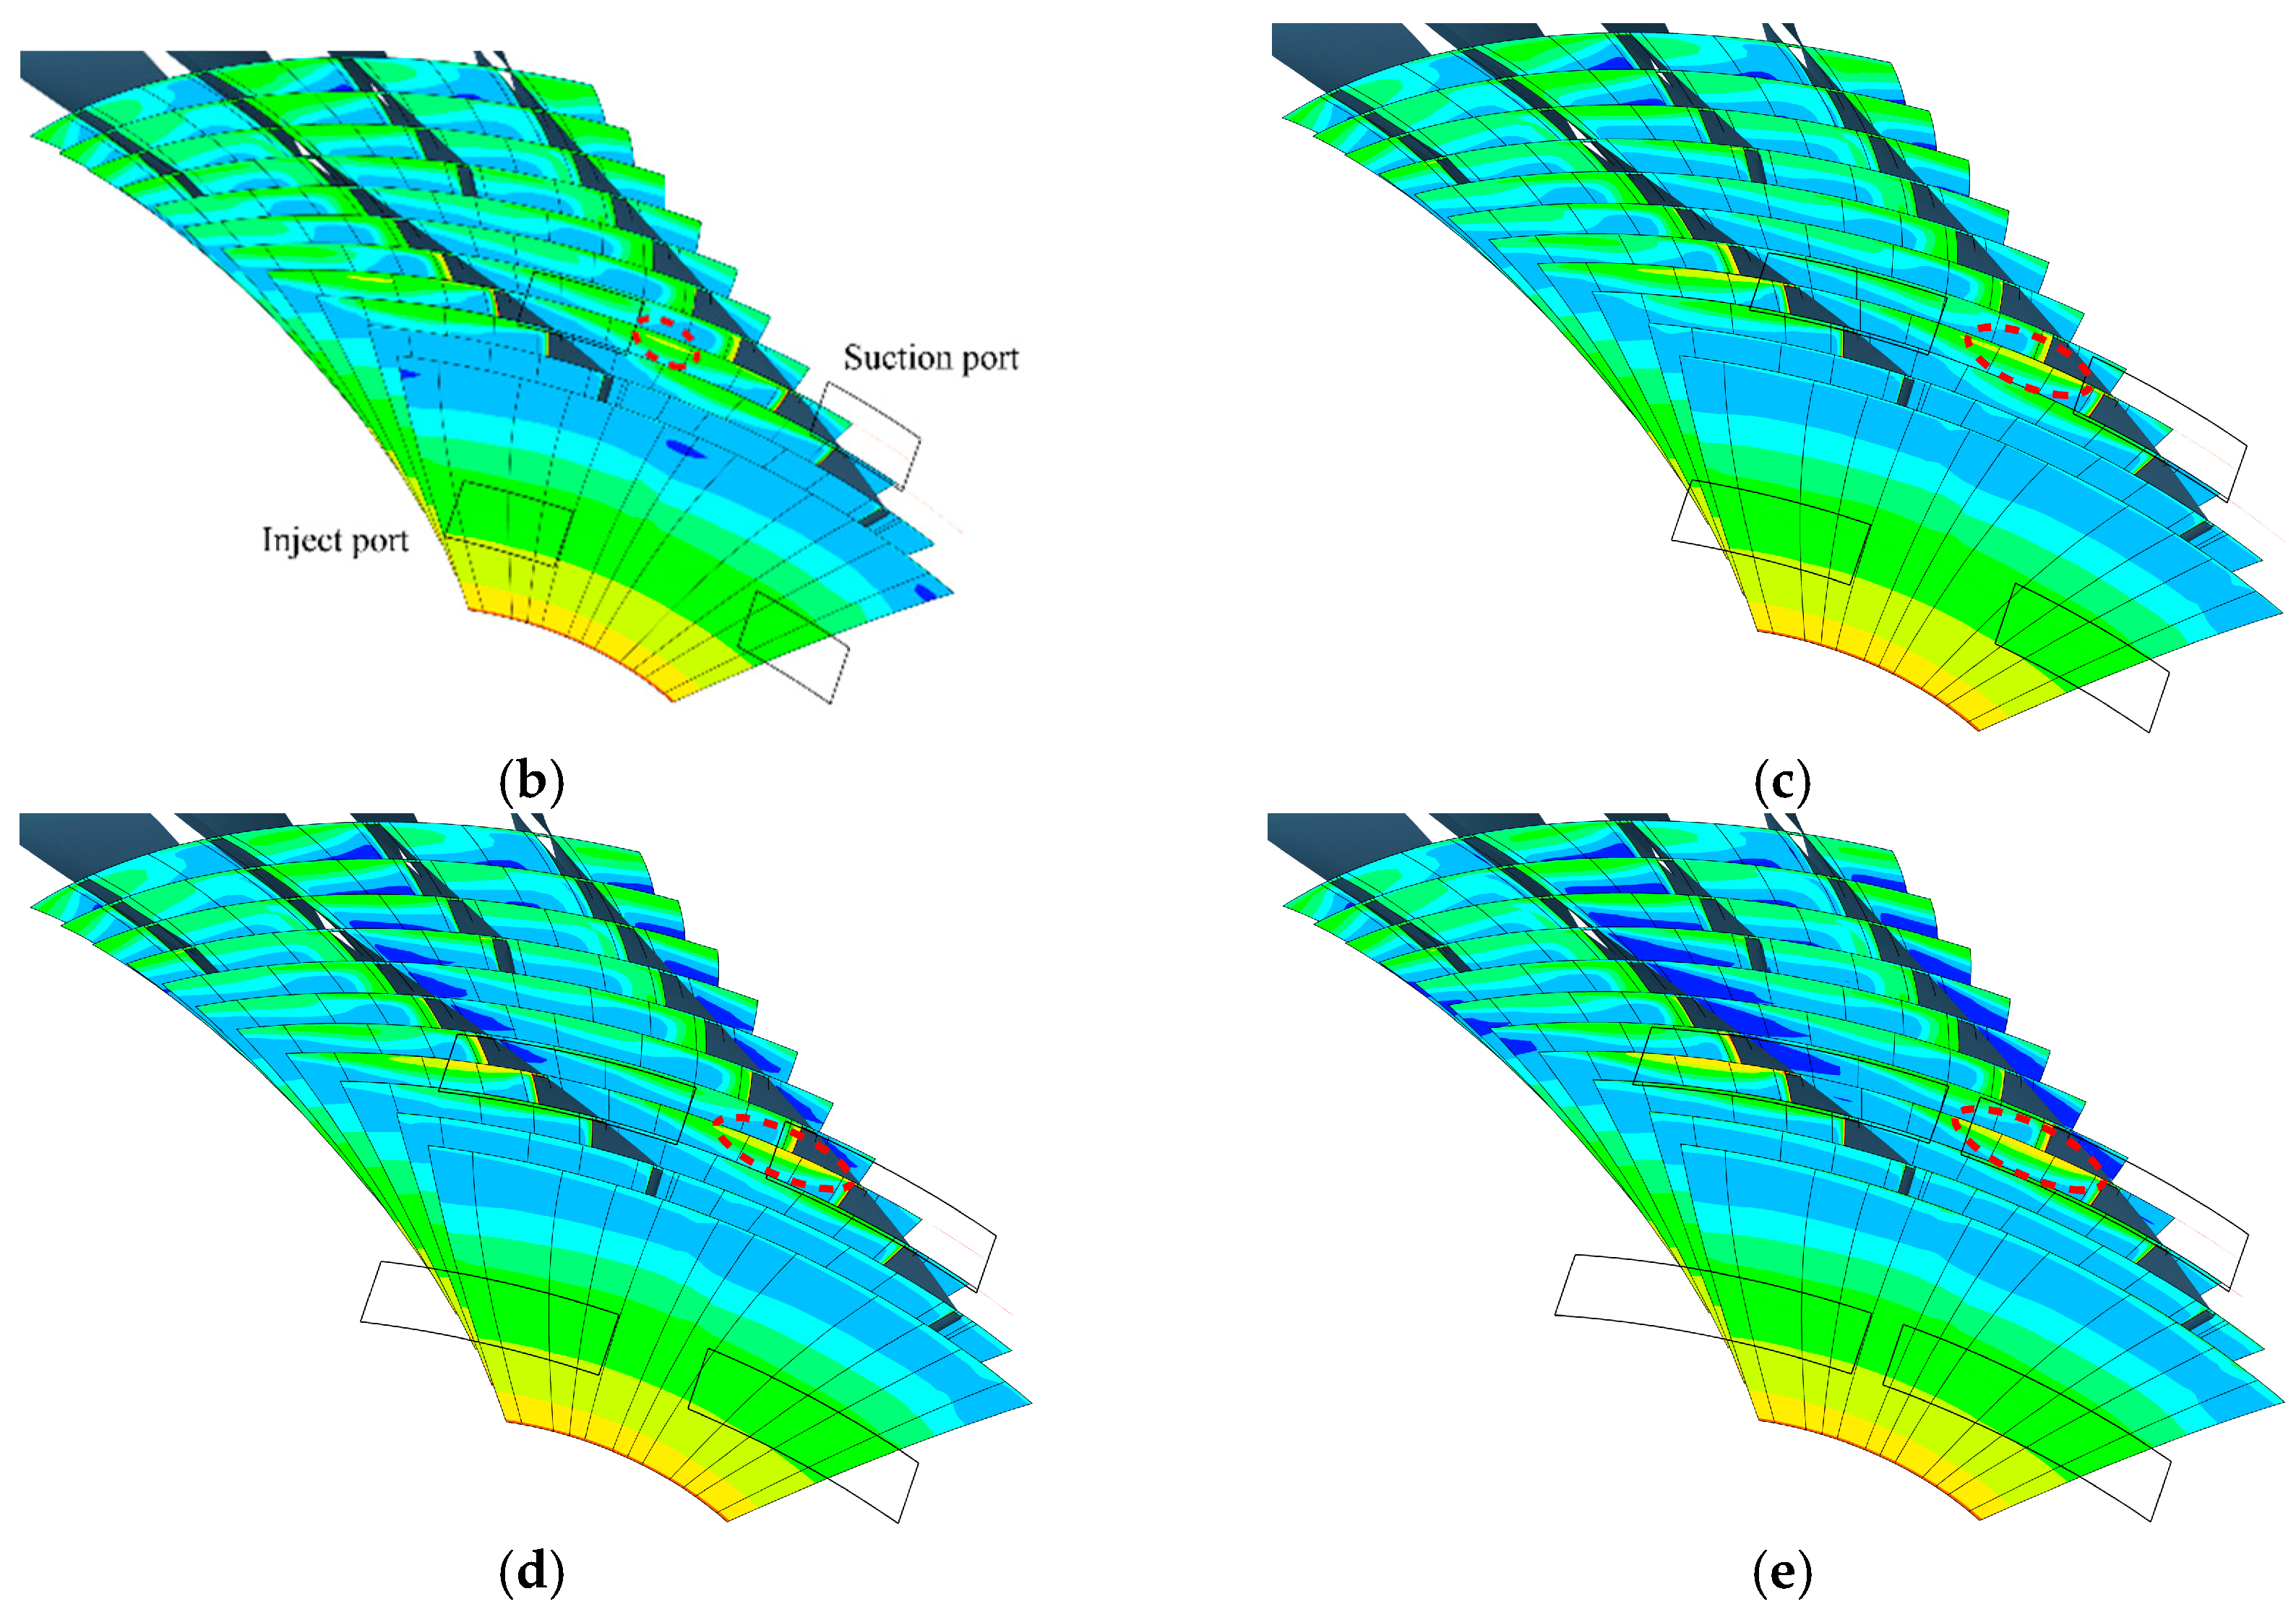
The previous analysis indicates that the self-circulating casing treatments improved the flow blockage but caused a higher flow loss in the blade tip passage, and the flow loss had an impact on the compressor’s efficiency. The relative total pressure loss coefficient distributions of the compressor were evaluated under the different self-circulating casing treatments in a time-averaged flow field (Figure 27). The relative total pressure loss coefficient is expressed as
C p = ( P t i n l e t P t ) P t i n l e t
where “ P t i n l e t ” represents the average relative total pressure at the rotating domain inlet and “ P t ” represents the local relative total pressure. The relative total pressure loss coefficient can be used to reflect the degree of flow loss in the rotating domain under the relative coordinate system. The relative total pressure loss of incoming flow for the solid-wall casing was small under the near-stall point, and the stratification was evident. However, a sudden increase in the relative total pressure loss was caused by the large-scale mixing of the leakage flows with the mainstream in the blade passage. The high relative total pressure loss area indicated by the dashed red line fills in the mainstream blade passage inlet and the flow loss was markedly large under the near-stall point. The results showed that the four different self-circulating casing treatments significantly reduced the high relative total pressure loss area in the passage under the near-stall point, and the relative total pressure loss coefficient was also significantly reduced (Figure 27b–e). The red high total pressure loss area was completely eliminated after application of the self-circulating casing treatments, implying that the self-circulating casing effectively sucked the leakage vortexes which would have expanded and developed in this region, which is consistent with the previous results in Figure 16 and Figure 17. The area with high total pressure loss at the blade tip passage inlet gradually increased with an increase in the circumferential coverage ratio. Analysis of the position showed that this high entropy area was just below the suction port, which is consistent with the results presented in Figure 22. The results indicated that the total pressure loss coefficient near the mainstream blade basin at the passage behind the suction port decreased with an increase in the circumferential coverage ratio, and this effect extended to the splitter blade passage. The total pressure loss coefficient in the blade tip passage was the lowest in the SRCC0.9 design compared with the other designs. The total pressure loss coefficient was distributed in most of the passages comprising the mainstream blade pressure surface and the splitter blade, as shown in the blue area in Figure 27e. In summary, the flow loss at the blade tip was significantly reduced, and the corresponding compressor efficiency increased after application of the self-circulating casings, which is consistent with the performance results.

4. Conclusions

In this study, four self-circulating casing research schemes with different circumferential coverage ratios were designed. The mechanisms underlying the effect of the self-circulating casing treatment with different circumferential coverage ratios on centrifugal compressor performance and stability were explored by evaluating the compressor performance and internal flow comparative analyses. The main conclusions of the study are presented below:
(1)
Application of self-circulating casings with different circumferential coverage ratios effectively increased the compressor’s stable working range and improved its boost capacity. The compressor’s boost capability increased with an increase in the circumferential coverage ratio. SRCC0.9 schemes, which had the largest circumferential coverage ratio, exhibited the highest increase in stall margin, with an SMI of 20.22%. The ability to expand compressor stability decreased with a decrease in the circumferential coverage ratio. Analysis of the compressor peak efficiency showed that the descent ranges of the four self-circulation casing treatments were less than 0.3%. The compressor isentropic efficiencies of the four schemes with different self-circulation casing treatments with a mass flow rate more than 2.8 kg/s were less than that of the solid-wall casing, whereas the isentropic efficiencies with a mass flow rate less than 2.8 kg/s were higher than that of the solid-wall casing.
(2)
The leakage flows were sucked by self-circulation casing in the blade tip passage after application of the self-circulating casing treatments. The development of distortion, expansion and break-up of leakage flows was restrained, thus alleviating the flow blockage in the passage. The suction effect on the leakage flows at the blade tip increased with an increase in the circumferential coverage ratio, and the corresponding ability to eliminate flow blockage and improve the stall margin was also enhanced.
(3)
The mass flow rate through the self-circulating casing significantly fluctuated with time. A larger circumferential coverage ratio was correlated with a larger circumferential to radial direction deflection space provided by the self-circulating casing for the flow in the impeller passage, and a more favorable airflow direction deflection at the suction port smoothly progressing to the self-circulating casing. The mass flow rate through the self-circulating casing, the flow velocity at suction and inject port and the flow capacity of the self-circulating casing significantly increased with an increase in the circumferential coverage ratio. Notably, the mixing of flows at the inject port was relatively intense, and the corresponding flow loss increased with an increase in the circumferential coverage ratio.
(4)
The four different self-circulating casing treatments used in this study significantly reduced the high relative total pressure loss area in the passage under the near-stall point. The total pressure loss coefficient and the flow loss in the blade tip passage decreased with an increase in the circumferential coverage ratio.

Author Contributions

Conceptualization, H.Z. and W.C.; methodology, Q.L.; software, Q.L.; validation, H.W. and Q.L.; formal analysis, Q.L. and Jing, F.; investigation, H.W.; resources, Q.L.; data curation, H.W. and Q.L.; writing—original draft preparation, H.W.; writing—review and editing, H.W. and Q.L.; visualization, H.Z. and F.J. All authors have read and agreed to the published version of the manuscript.

Funding

This research was funded by [51006084] grant number [National Natural Science Foundation of China], [2017-II-0005-0018] grant number [National Science and Technology Major Projects of China] and [51536006] grant number [Key Program of National Natural Science Foundation of China].

Data Availability Statement

The authors confirm that the data supporting the findings of this study are available within the article.

Acknowledgments

The work is funded by National Natural Science Foundation of China (Grant Nos. 51006084), National Science and Technology Major Projects of China (Grant Nos. 2017-II-0005-0018) and the Key Program of National Natural Science Foundation of China (Nos. 51536006).

Conflicts of Interest

The authors declare no conflict of interest.

References

  1. Li, D.; Yang, C.; Zhou, M.; Zhu, Z.; Wang, H. Numerical and experimental research on different inlet configurations of high-speed centrifugal compressor. Sci. China Technol. Sci. 2012, 55, 174–181. [Google Scholar] [CrossRef]
  2. Li, P.; Gu, C.; Song, Y. Optimum design of a low-pressure centrifugal compressor for MW stage gas turbine. J. Tsinghua Univ. 2015, 55, 1110–1116. [Google Scholar]
  3. Saha, S.L.; Kurokawa, J.; Matsui, J.; Imamura, H. Passive Control of Rotating Stall in a Parallel Wall Vaned Diffuser by J-Grooves. J. Turbomach. 2001, 123, 507–515. [Google Scholar] [CrossRef]
  4. Lu, X.; Chu, W.; Zhu, J. Experimental and Numerical Investigation of a Subsonic Compressor with Bend Skewed Slot Casing Treatment. ASME GT 2006-90026. Proc. Inst. Mech. Eng. Part C J. Mech. Eng. Sci. 2006, 220, 1785–1796. [Google Scholar] [CrossRef]
  5. Yan, S.; Chu, W.; Zhang, H.; Liu, K. Research on the effect of different axial positions of suction port of self-circulating casing. Propuls. Technol. 2019, 40, 1478–1489. [Google Scholar] [CrossRef]
  6. Fisher, F.B. Application of Map Width Enhancement Devices to Turbocharger Compressor Stages; SAE Technical Paper; SAE International: Warrendale, PA, USA, 1989; p. 880794. [Google Scholar]
  7. Hunziker, R.; Dickmann, H.P.; Emmrich, R. Numerical and experimental investigation of a centrifugal compressor with an inducer casing bleed system. Proc. Inst. Mech. Eng. Part A J. Power Energy 2001, 215, 783–791. [Google Scholar] [CrossRef]
  8. Ishida, M.; Surana, T.; Ueki, H.; Sakaguchi, D. Suppression of unstable flow at small flow rates in a centrifugal blower by controlling tip leakage flow and reverse flow. ASME J. Turbomach. Trans. 2005, 127, 76–83. [Google Scholar] [CrossRef]
  9. Ishida, M.; Sakaguchi, D.; Ueki, H. Optimization of Inlet Ring Groove Arrangement for Suppression of Unstable Flow in a Centrifugal Impeller. In Proceedings of the ASME Turbo Expo 2005: Power for Land, Sea, and Air, Reno, NV, USA, 6–9 June 2005; ASME Paper: New York, NY, USA, 2005. No. GT2005-68675. [Google Scholar]
  10. Ishida, M.; Sakaguchi, D.; Ueki, H. Effect of Pre-Whirl on Unstable Flow Suppression in a Centrifugal Impeller with Ring Groove Arrangement. In Proceedings of the ASME Turbo Expo 2006: Power for Land, Sea, and Air, Barcelona, Spain, 8–11 May 2006; ASME Paper: New York, NY, USA, 2006. No. GT2006-90400. [Google Scholar]
  11. Tamaki, H. Effect of recirculation device with counter swirl vane on performance of high pressure ratio centrifugal compressor. J. Turbomach. 2012, 134, 051036. [Google Scholar] [CrossRef]
  12. Jung, S.; Pelton, R. Numerically Derived Design Guidelines of Self Recirculation Casing Treatment for Industrial Centrifugal Compressors. In Proceedings of the ASME Turbo Expo 2016: Turbomachinery Technical Conference and Exposition, Seoul, Republic of Korea, 13–17 June 2016; ASME Paper: New York, NY, USA, 2016. No. GT2016-56672. [Google Scholar]
  13. Semlitsch, B.; Mihaescu, M. Flow Phenomena Leading to Surge in a Centrifugal Compressor. Energy 2016, 103, 572–587. [Google Scholar] [CrossRef]
  14. Zheng, X.; Zhang, Y.; Guo, G.; Zhang, J.; Yang, M. Research on Treatment and Stability Expansion of Transonic Centrifugal Compressor Casing. J. Eng. Thermophys. 2010, 31, 2023–2026. [Google Scholar]
  15. Xu, W.; Wang, T.; Ding, L. Unsteady numerical simulation of a centrifugal compressor with a holed casing. J. Shanghai Jiaotong Univ. 2012, 536–539. [Google Scholar]
  16. Xu, W.; Wang, T.; Gu, C. Internal flow field analysis of a centrifugal compressor with holed casing under low mass flow conditions. Chin. J. Electr. Eng. 2012, 123–129. [Google Scholar]
  17. Kang, J.; Huang, G.; Zhu, J. Mechanism analysis of self-circulating casing expand the stability of centrifugal compressor. J. Aeronaut. 2014, 3264–3272. [Google Scholar]
  18. Cao, S. Effect of casing treatment on performance of transonic centrifugal compressor. Propuls. Technol. 2017, 38, 773–777. [Google Scholar]
  19. Gan, J.; Wu, Y.; Chen, Z. Study on the effect of self-circulating casing on the performance and stability of high-speed centrifugal impeller. Fan Technol. 2019, 61, 1–9. [Google Scholar]
  20. Shang, P. Research on Stabilization Enlargement Mechanism of Self-Circulating Casing of Supercritical Carbon Dioxide Centrifugal Compressor; Tianjin University of Technology: Tianjin, China, 2022. [Google Scholar] [CrossRef]
  21. Wang, W. Research on Design Law and Flow Mechanism of Tip Jet and Self-Circulating Casing Treatment of Axial Flow Compressor; Northwest University of Technology: Xi’an, China, 2016. [Google Scholar]
  22. Krain, H.; Hoffmann, B.; Pak, H. Aerodynamics of a centrifugal compressor impeller with transonic inlet conditions. In Proceedings of the ASME 1995 International Gas Turbine and Aeroengine Congress and Exposition, Houston, TX, USA, 5–8 June 1995; ASME Paper: New York, NY, USA, 1995. No. 95-GT-79. [Google Scholar]
  23. Eisenlohr, G.; Krain, H.; Richter, F.A.; Tiede, V. Investigation of the flow through a high-pressure ratio centrifugal impeller. In Proceedings of the ASME Turbo Expo 2002: Power for Land, Sea, and Air, Amsterdam, The Netherlands, 3–6 June 2002; ASME Paper: New York, NY, USA, 2002. No. GT2002-30394. [Google Scholar]
  24. Kang, S. Numerical investigation of a high-speed centrifugal compressor impeller. In Proceedings of the ASME Turbo Expo 2005: Power for Land, Sea, and Air, Reno, NV, USA, 6–9 June 2005; ASME Paper: New York, NY, USA, 2005. No. GT2005-68092. [Google Scholar]
Figure 1. A schematic representation of the SRV2-O impeller.
Aerospace 10 00312 g001
Figure 2. The geometric structure of the self-circulating casing.
Aerospace 10 00312 g002
Figure 3. The three-dimensional structure of self-circulating casings. (a) SRCC0.36. (b) SRCC0.72.
Aerospace 10 00312 g003
Figure 4. The diagram of computed domain grid. (a) A representation of the meridional plane of the computational grid. (b) Three-dimensional diagram of the blade grids.
Aerospace 10 00312 g004
Figure 5. Compressor performance curves generated under different turbulence models. (a) Total pressure ratio. (b) Isentropic efficiency.
Aerospace 10 00312 g005
Figure 6. Compressor performance curves generated under different differential formats. (a) Total pressure ratio. (b) Isentropic efficiency.
Aerospace 10 00312 g006
Figure 7. Compressor performance under different grid numbers. (a) Total pressure ratio. (b) Isentropic efficiency.
Aerospace 10 00312 g007
Figure 8. The experimental laser measurement planes in the compressor passage.
Aerospace 10 00312 g008
Figure 9. The relative Mach number distribution on the different planes. (a) Experimental data on plane “−1”. (b) Numerical results on plane “−1”. (c) Experimental data on plane “4”. (d) Numerical results on plane “4”. (e) Experimental data on plane “10”. (f) Numerical results on plane “10”.
Aerospace 10 00312 g009aAerospace 10 00312 g009b
Figure 10. Distribution of meridional velocities on plane “10”. (a) Experimental data on plane “10”. (b) Numerical results on plane “10”.
Aerospace 10 00312 g010
Figure 11. Performance curves of the compressor under different casing parameters. (a) Total pressure ratio. (b) Isentropic efficiency.
Aerospace 10 00312 g011
Figure 12. Relative Mach number distribution in the blade tip passage. (a) SW. (b) SRCC0.36. (c) SRCC0.54. (d) SRCC0.72. (e) SRCC0.9.
Aerospace 10 00312 g012
Figure 13. Contours of relative Mach number distribution of different schemes at 96% blade span. (a) SW. (b) SRCC0.36. (c) SRCC0.54. (d) SRCC0.72. (e) SRCC0.9.
Aerospace 10 00312 g013
Figure 14. The axial velocity distribution at 50% τ. (a) SW. (b) SRCC0.36. (c) SRCC0.54. (d) SRCC0.72. (e) SRCC0.9.
Aerospace 10 00312 g014
Figure 15. Relative velocity vector of different structure casings at 98% blade span. (a) SW. (b) SRCC0.36. (c) SRCC0.54. (d) SRCC0.72. (e) SRCC0.9.
Aerospace 10 00312 g015
Figure 16. Distribution of leakage flows in the blade tip passage. (a) SW. (b) SRCC0.36. (c) SRCC0.54. (d) SRCC0.72. (e) SRCC0.9.
Aerospace 10 00312 g016aAerospace 10 00312 g016b
Figure 17. Non-dimensional helicity distribution of different casing structures at 98% blade span. (a) SW. (b) SRCC0.36. (c) SRCC0.54. (d) SRCC0.72. (e) SRCC0.9.
Aerospace 10 00312 g017
Figure 18. Contours of absolute vorticity and static pressure distributions at 98% blade span. (a) SW. (b) SRCC0.36. (c) SRCC0.54. (d) SRCC0.72. (e) SRCC0.9.
Aerospace 10 00312 g018
Figure 19. Distribution curve of the blocked area of the blade tip channel along the axis.
Aerospace 10 00312 g019
Figure 20. Changes in the blockage ratio under different self-circulating casings at 50% τ.
Aerospace 10 00312 g020
Figure 21. Contour distribution of the blockage area at 99% blade span. (a) SW. (b) SRCC0.36. (c) SRCC0.54. (d) SRCC0.72.
Aerospace 10 00312 g021
Figure 22. Contours of dimensionless radial velocity on the meridian plane. (a) SW. (b) SRCC0.36. (c) SRCC0.54. (d) SRCC0.72.
Aerospace 10 00312 g022
Figure 23. Variation of normalized mass flow level in suction/jet port of the different self-circulating casings.
Aerospace 10 00312 g023
Figure 24. Absolute Mach number and streamline distributions under the different self-circulating casings. (a) SW. (b) SRCC0.36. (c) SRCC0.54. (d) SRCC0.72.
Aerospace 10 00312 g024
Figure 25. Change in dimensionless mass flow rate under the different self-circulating casings over time.
Aerospace 10 00312 g025
Figure 26. Contours distribution of entropy on the meridian plane under different self-circulating casings. (a) SW. (b) SRCC0.36. (c) SRCC0.54. (d) SRCC0.72.
Aerospace 10 00312 g026
Figure 27. Contours of total pressure loss coefficient at the blade tip under different self-circulating casings. (a) SW. (b) SRCC0.36. (c) SRCC0.54. (d) SRCC0.72. (e) SRCC0.9.
Aerospace 10 00312 g027aAerospace 10 00312 g027b
Table 1. The basic design parameters of the SRV2-O impeller.
ParametersValueParametersValue
Mass flow (kg/s)2.55The number of main/splitter blade13/13
Rotation speed (rpm)50,000Blade tip inlet relative Mach number1.3
Inlet total pressure (Pa)101,325Inlet total temperature (K)288.15
Inlet blade tip/root radius (mm)30/78Outlet impeller radius (mm)112
Total pressure ratio6.1Adiabatic efficiency0.84
Inlet/outlet blade angle (°)26.5/52Blade leading/trailing tip clearance (mm)0.3/0.5
Table 2. The geometric parameters of the self-circulating casing.
ParameterValueParameterValue
A (°)30k (mm)18.57
β (°)70z (mm)3.7
m (mm)8.56x (mm)8
n (mm)6.23y (mm)25
Table 3. SMI and PEI of self-circulating casings with different circumferential coverage ratios.
SMI/%PEI/%
SRCC0.3611.26−0.13
SRCC0.5412.67−0.23
SRCC0.7218.05−0.17
SRCC0.920.22−0.27
Disclaimer/Publisher’s Note: The statements, opinions and data contained in all publications are solely those of the individual author(s) and contributor(s) and not of MDPI and/or the editor(s). MDPI and/or the editor(s) disclaim responsibility for any injury to people or property resulting from any ideas, methods, instructions or products referred to in the content.

