
Numerical Study of the Effects of Injection Conditions on Rotating Detonation Engine Propulsive Performance

Abstract
:1. Introduction
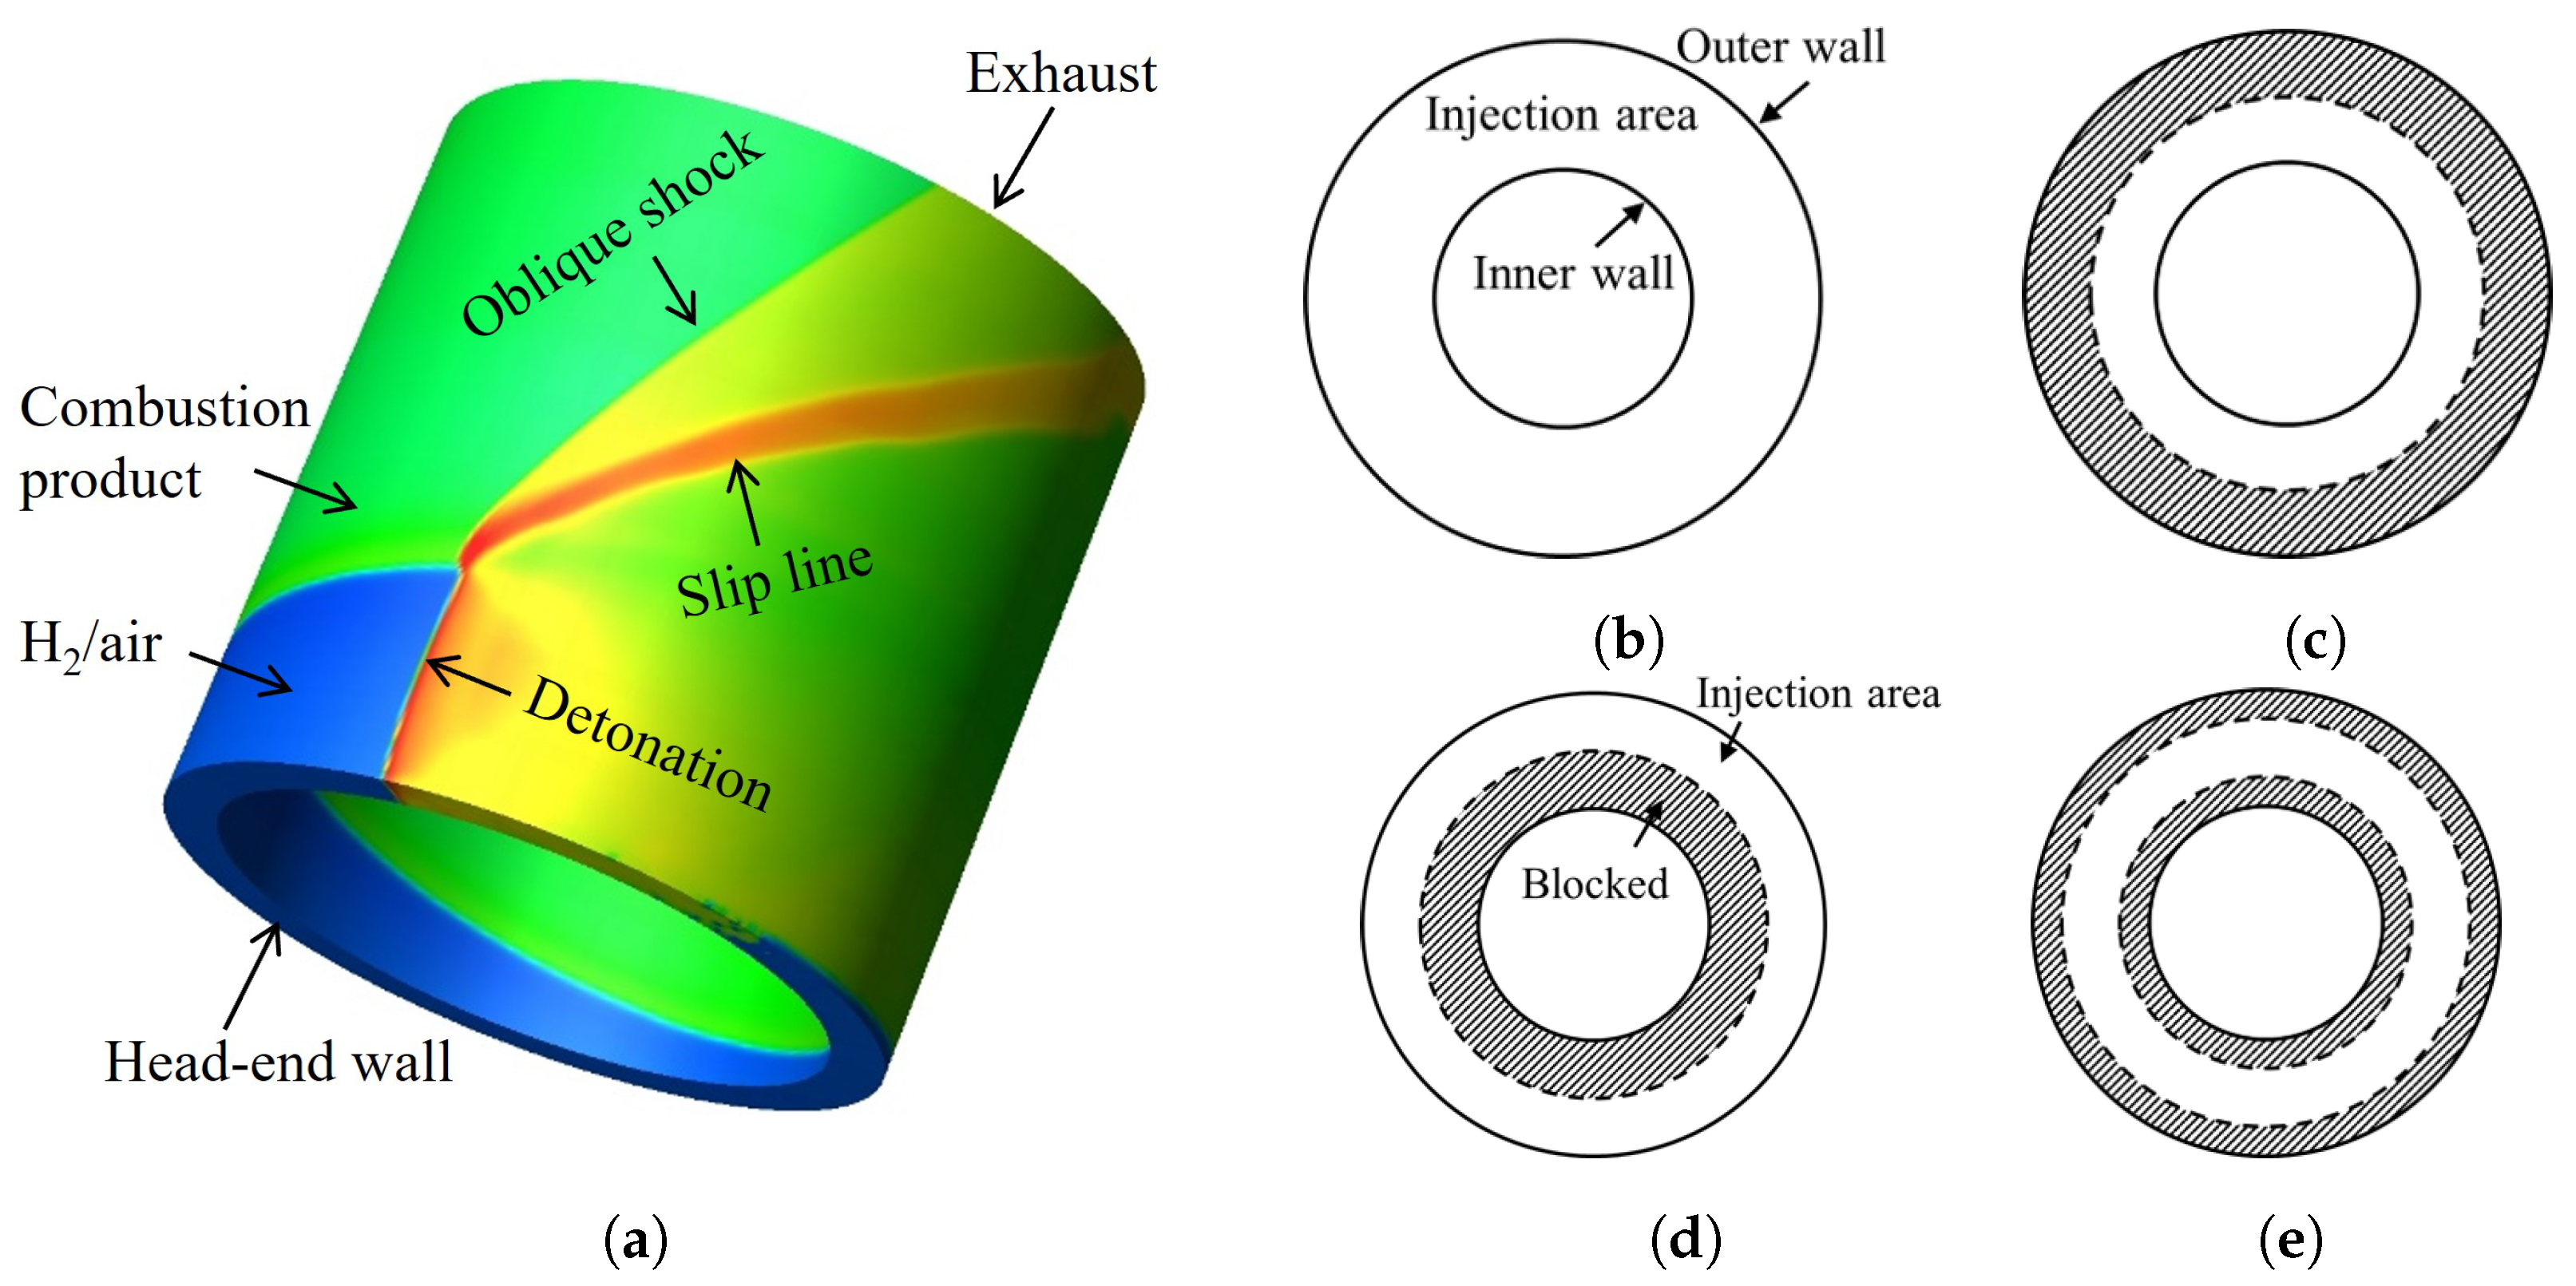
2. Physical Model
- (a)
- if , there is no injection, and the slip wall boundary will be implemented;
- (b)
- if , the inflow velocity is locally subsonic;
- (c)
- if , the throat of the nozzle maintains choking conditions, and the injection is subsonic;
- (d)
- if , the injection is supersonic and not affected by .
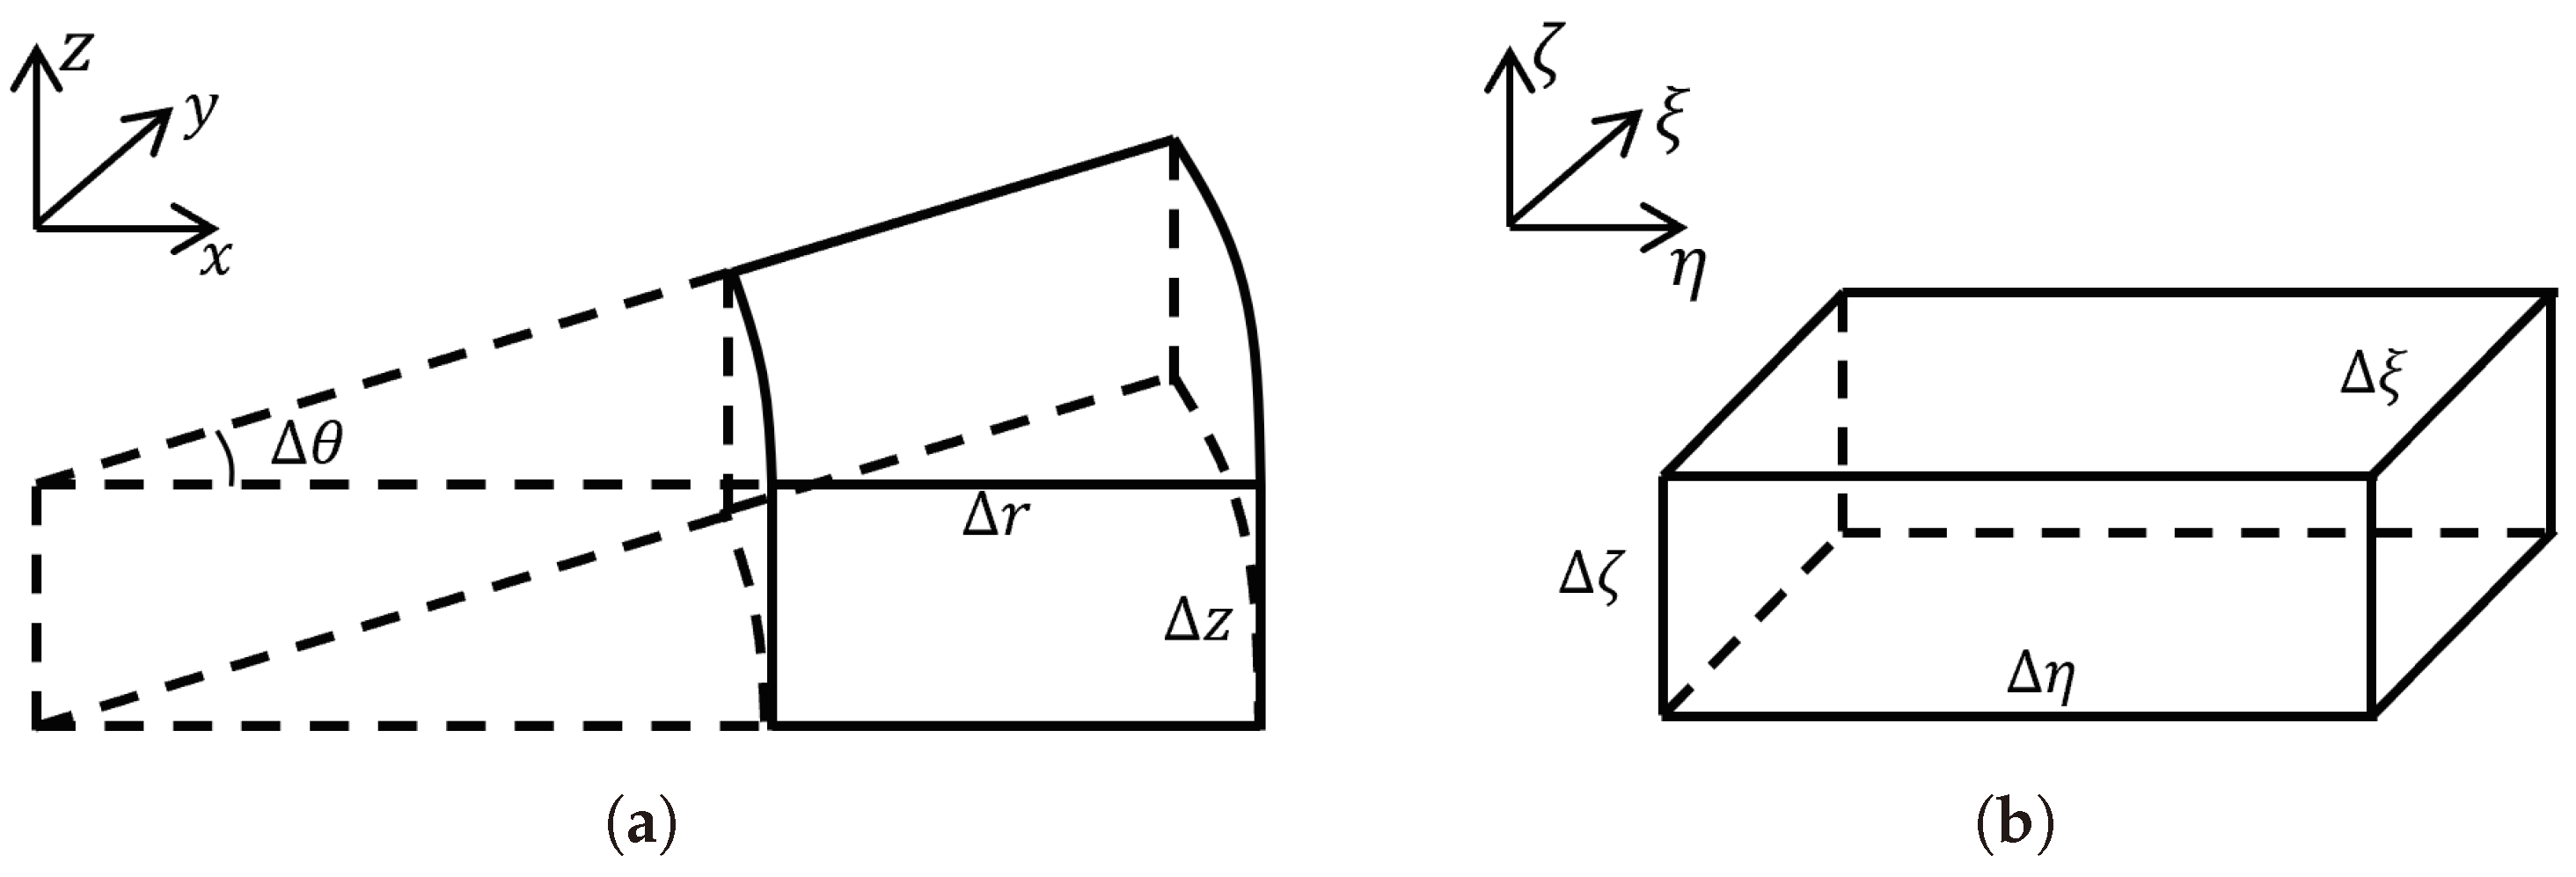
3. Extension of 3D CESE Method to Cylindrical Coordinate System
4. Results and Discussion
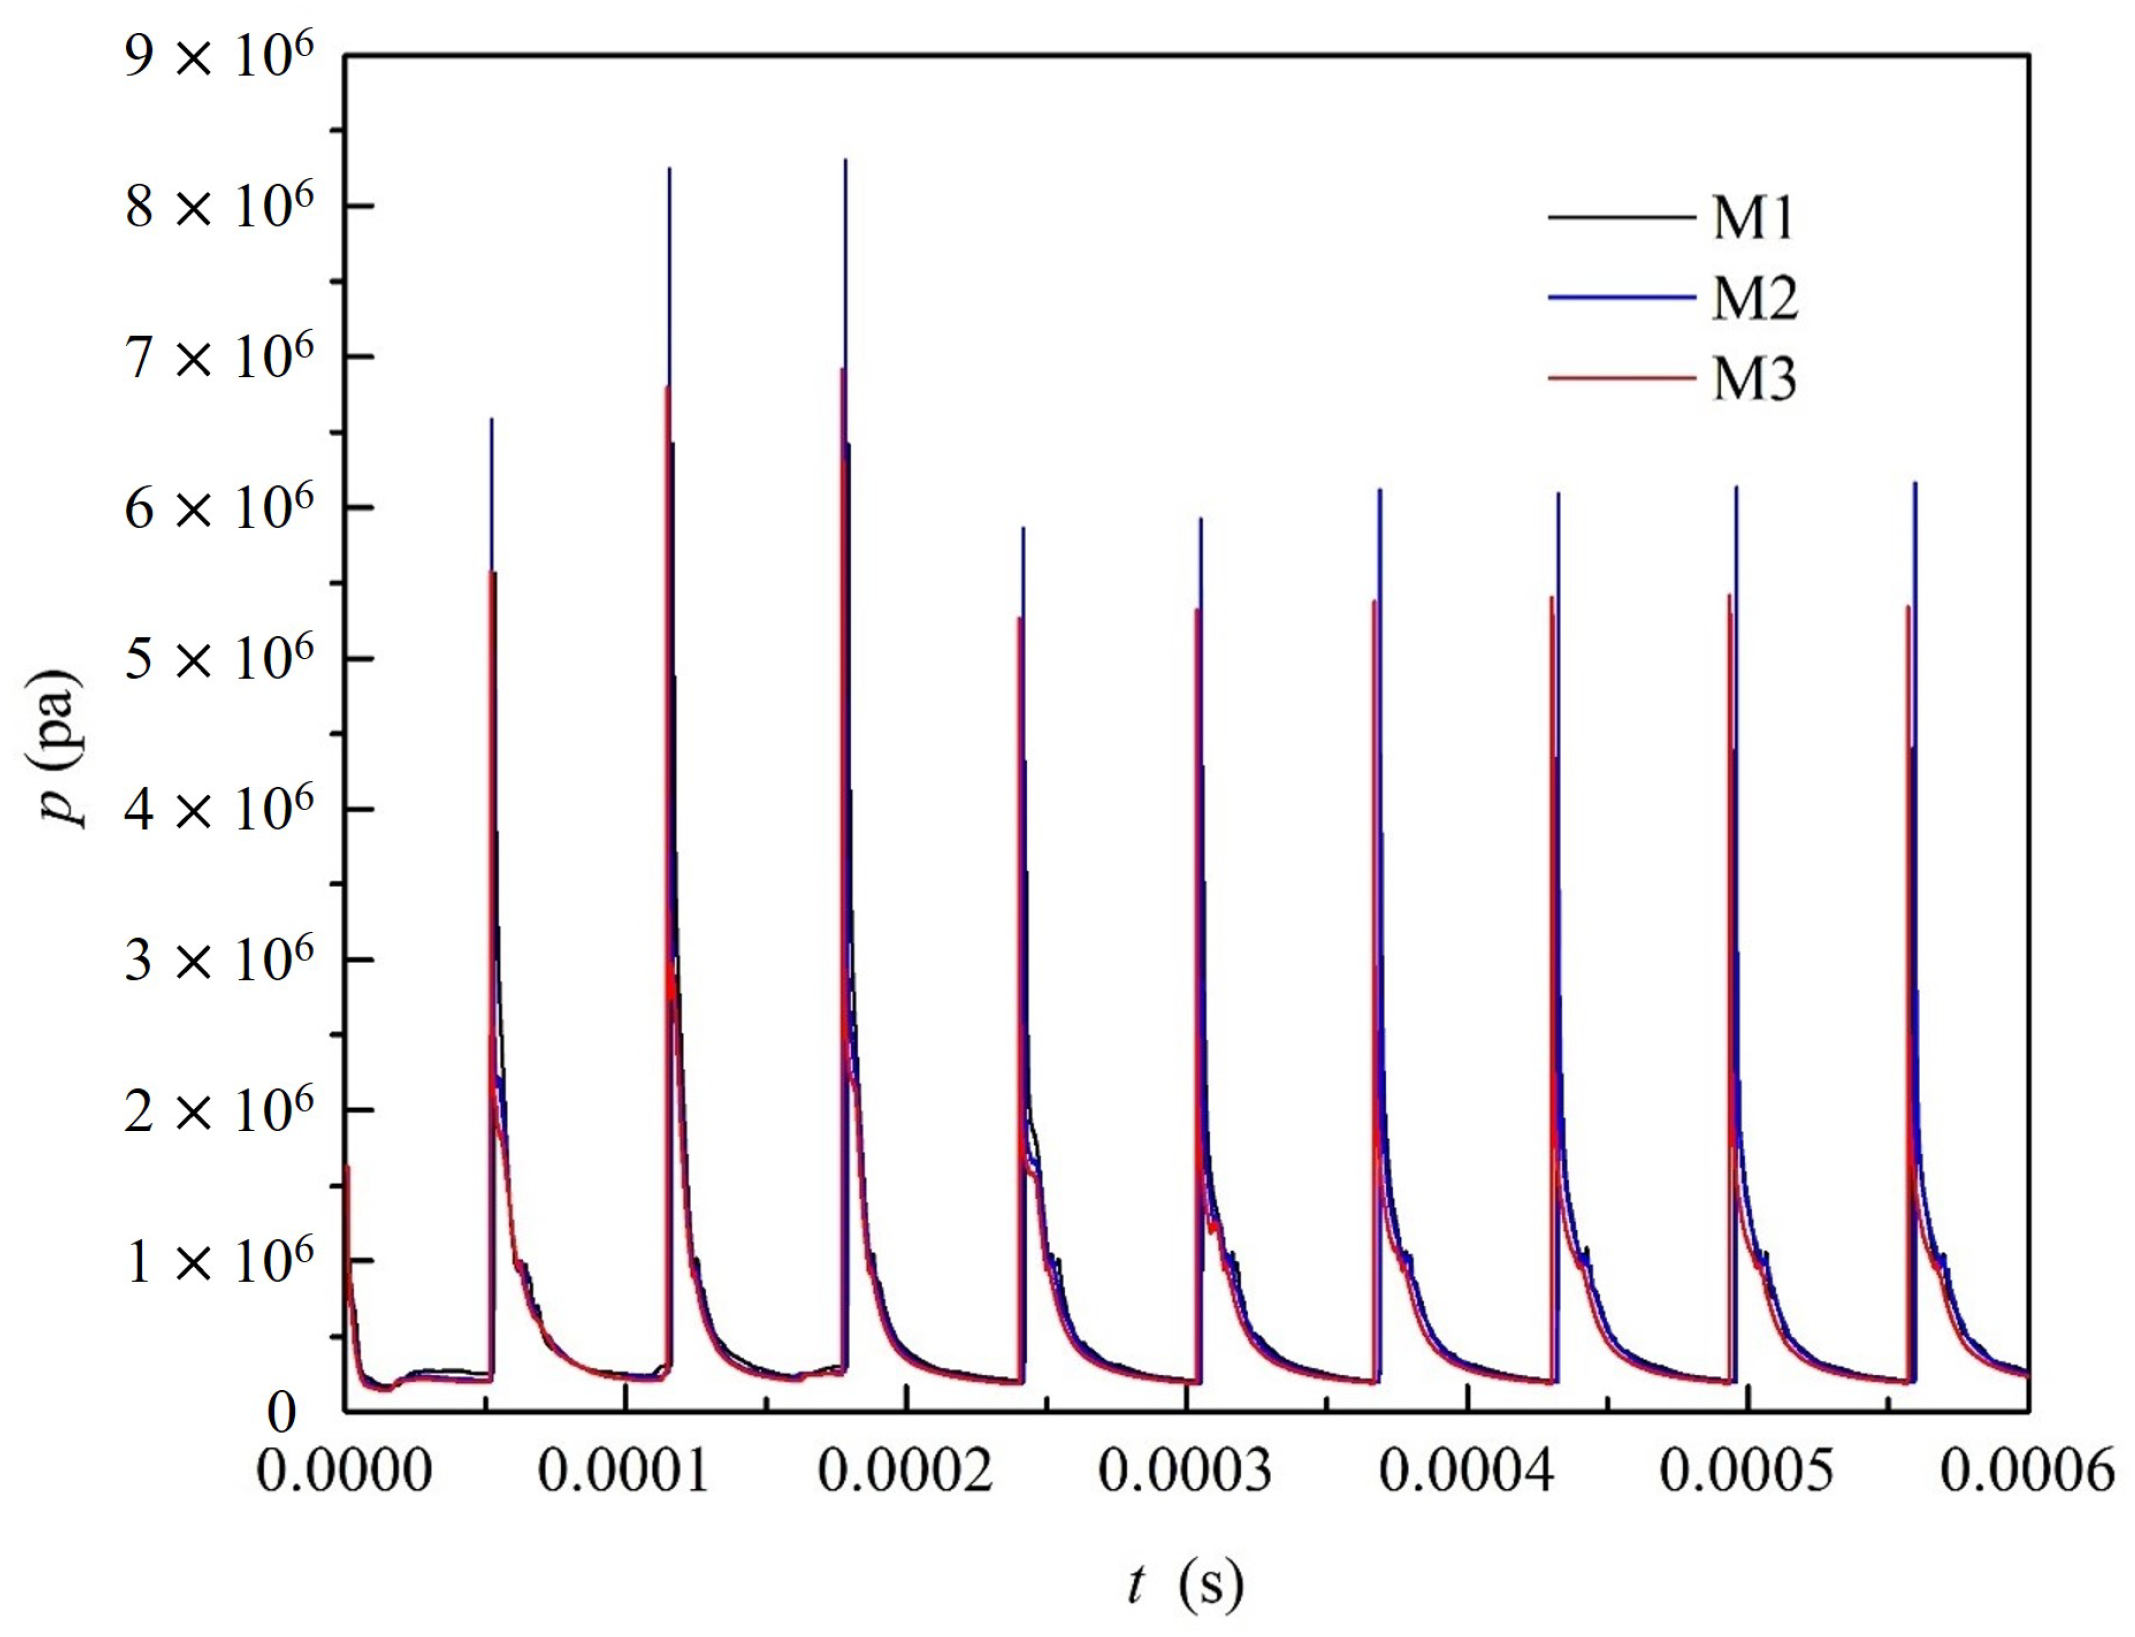
4.1. Grid Sensitivity Analysis
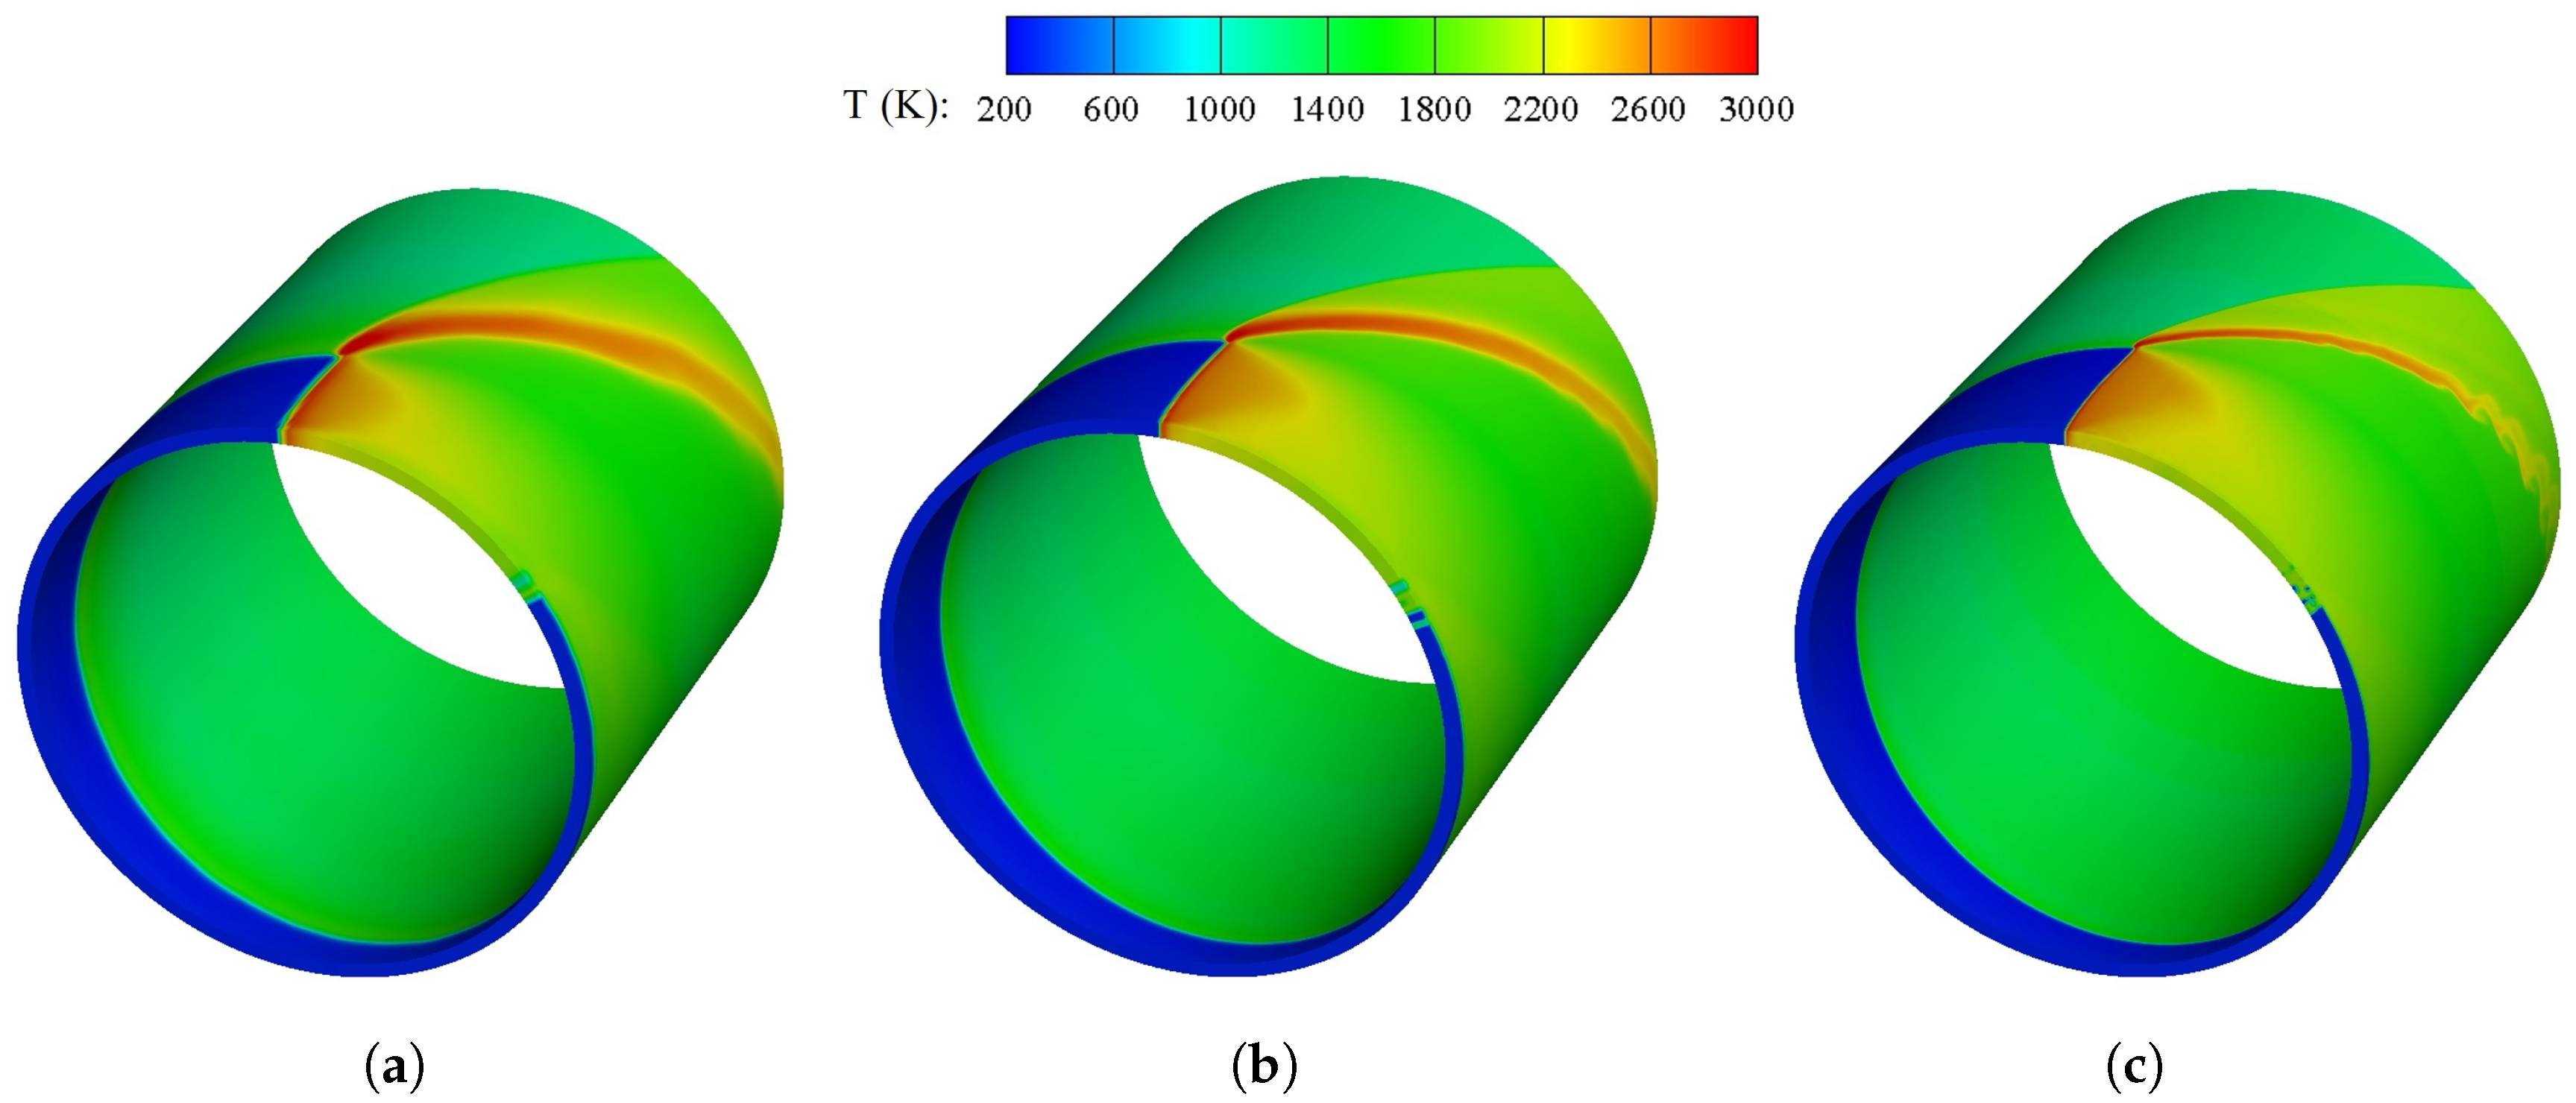
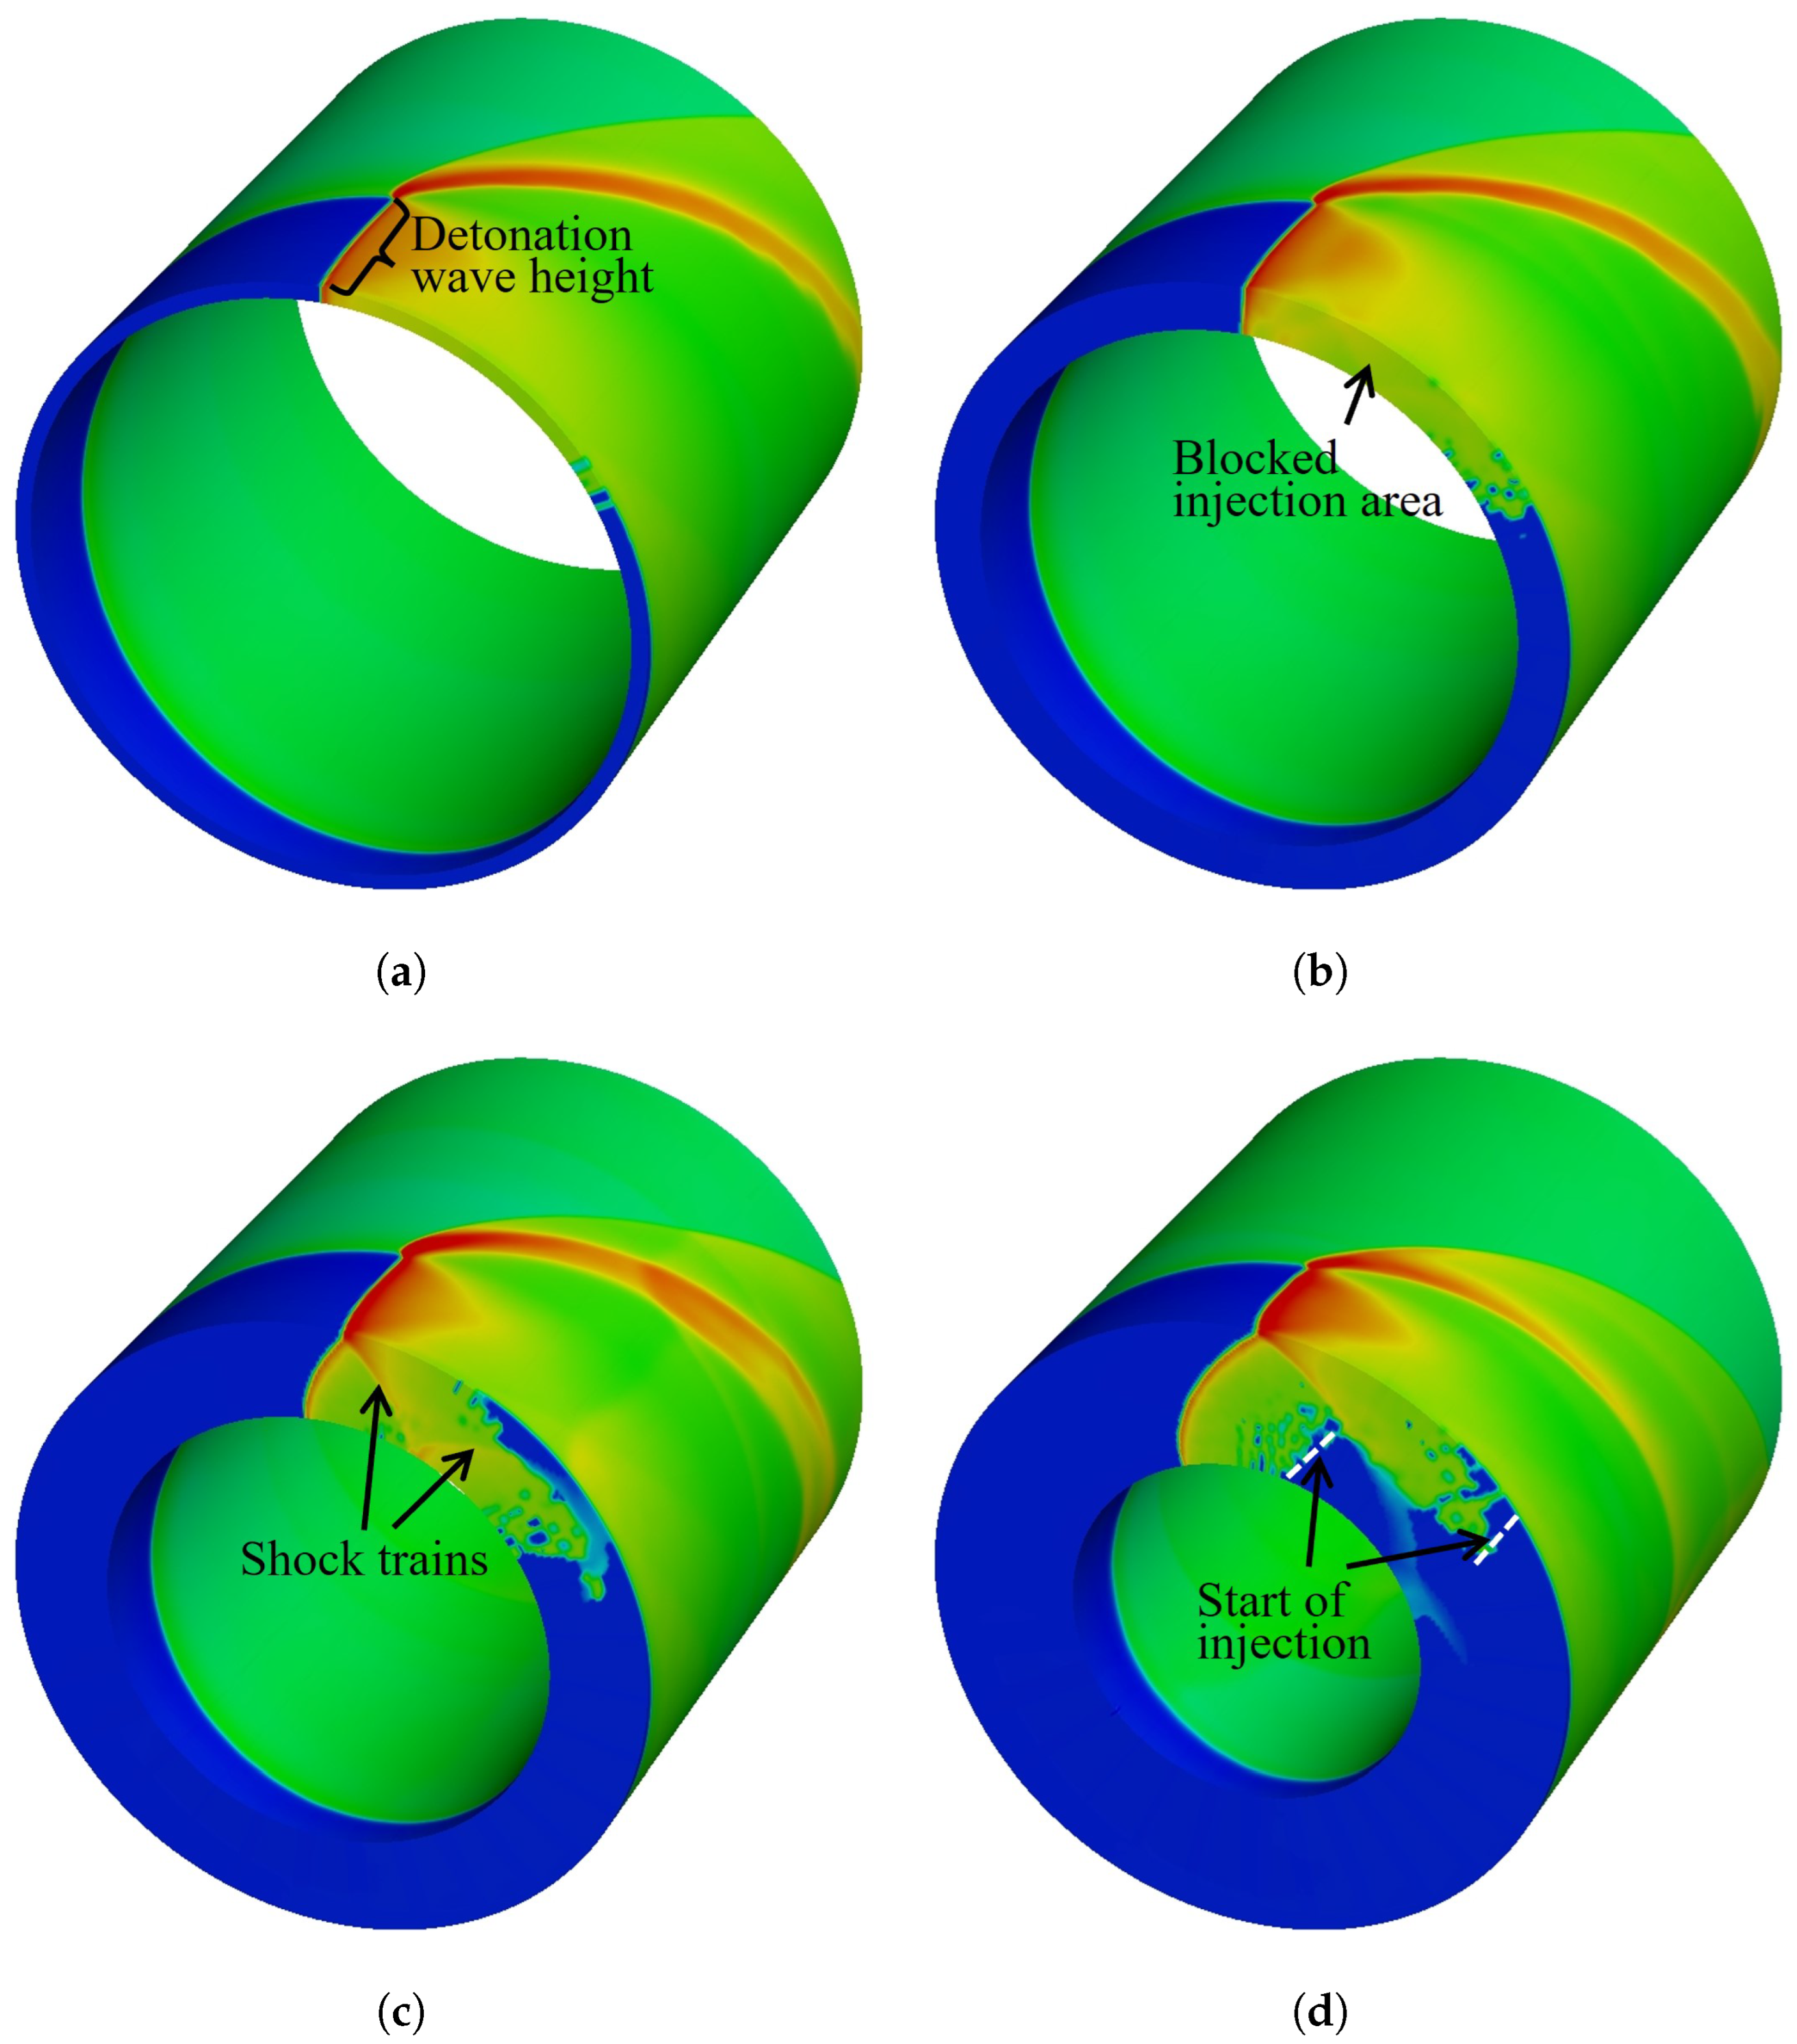
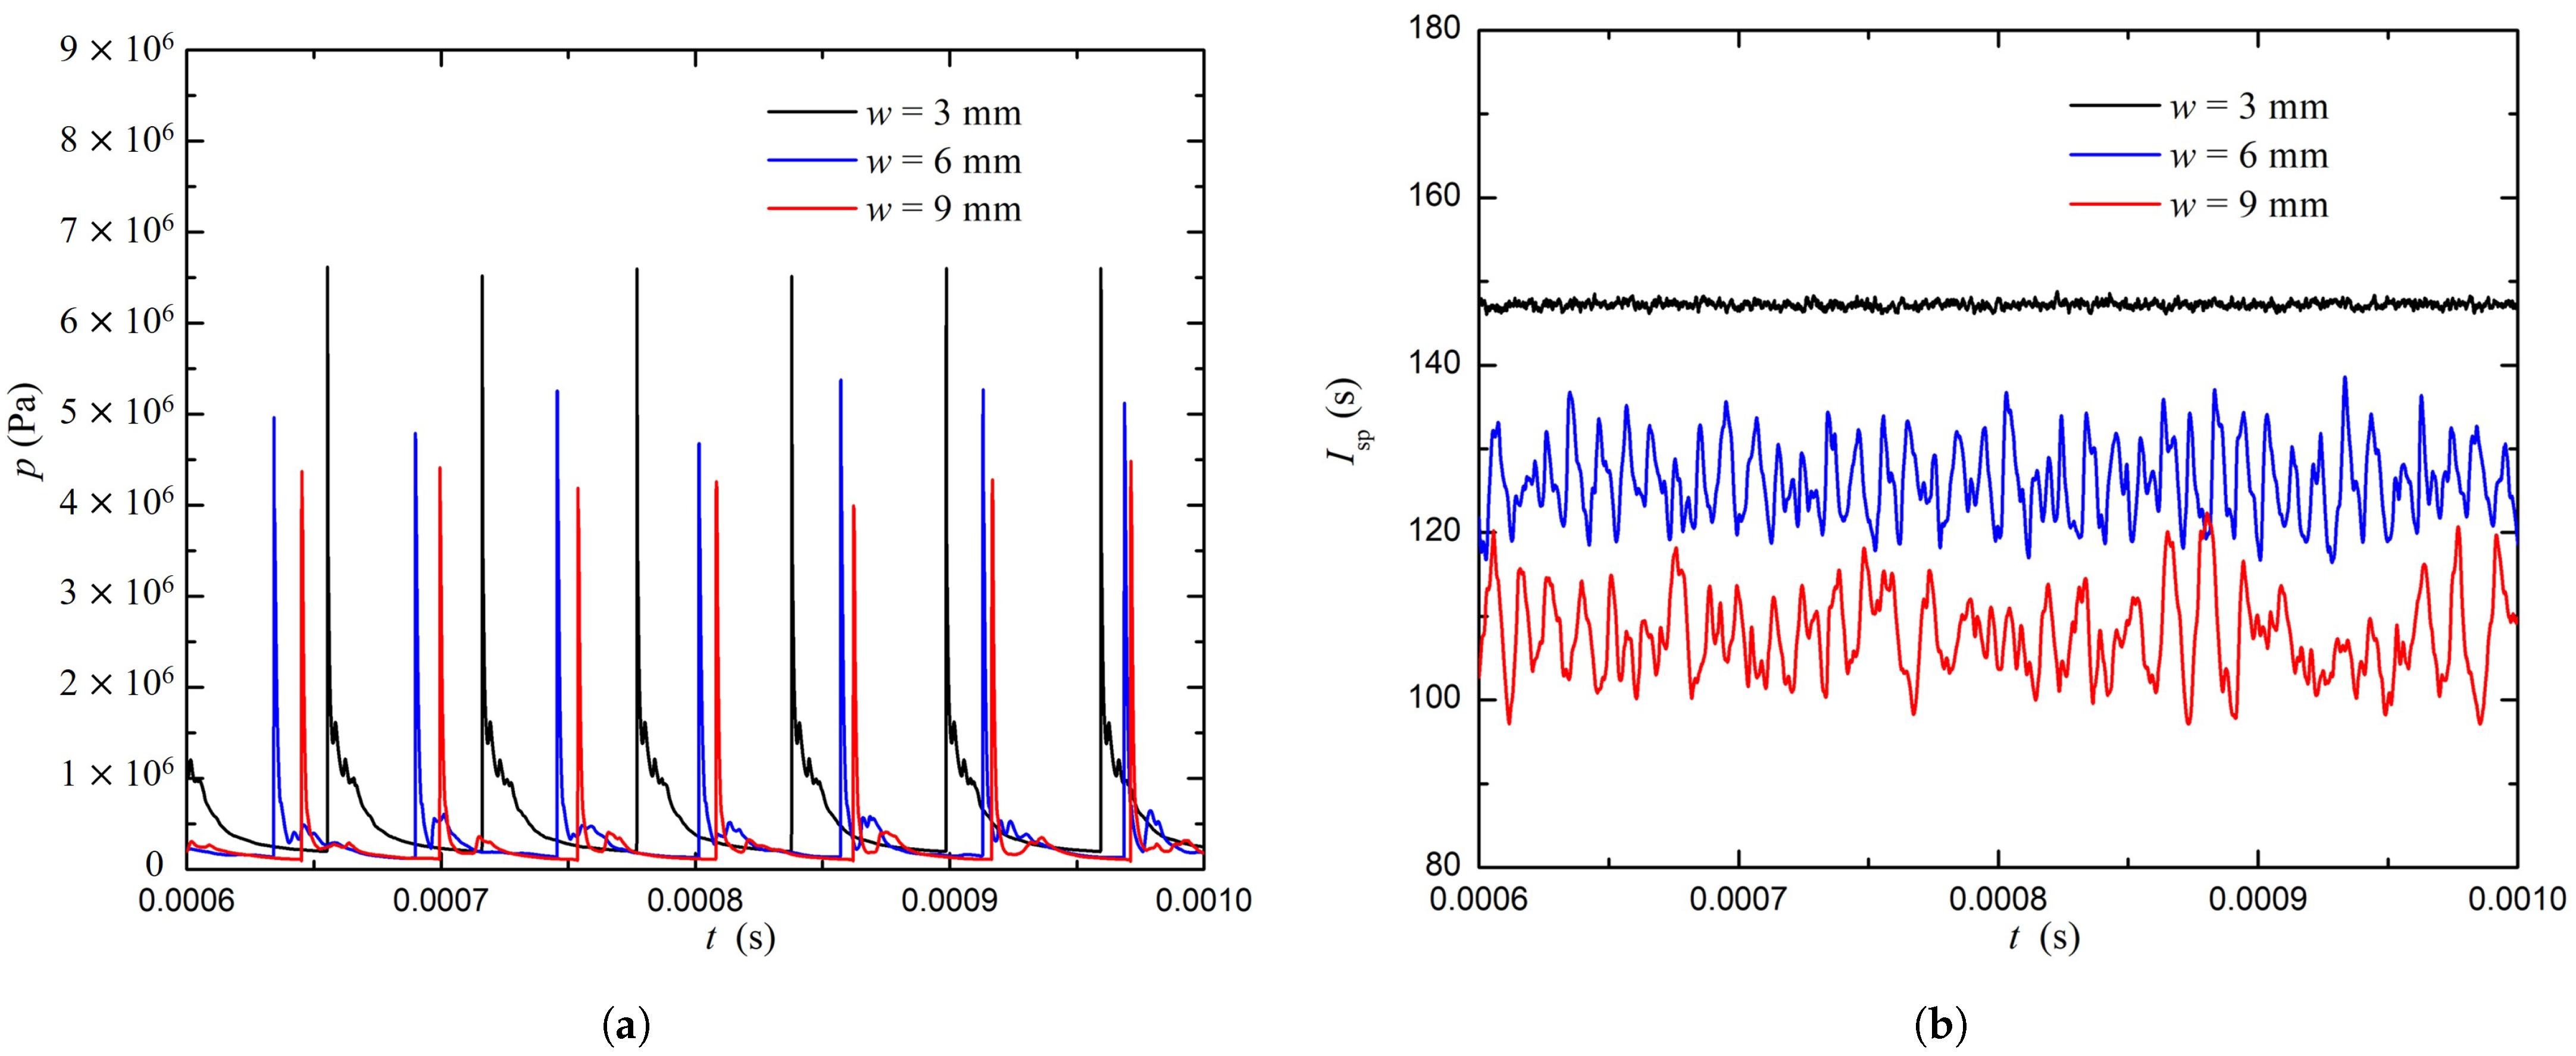
4.2. Effect of Channel Width with Full Injection
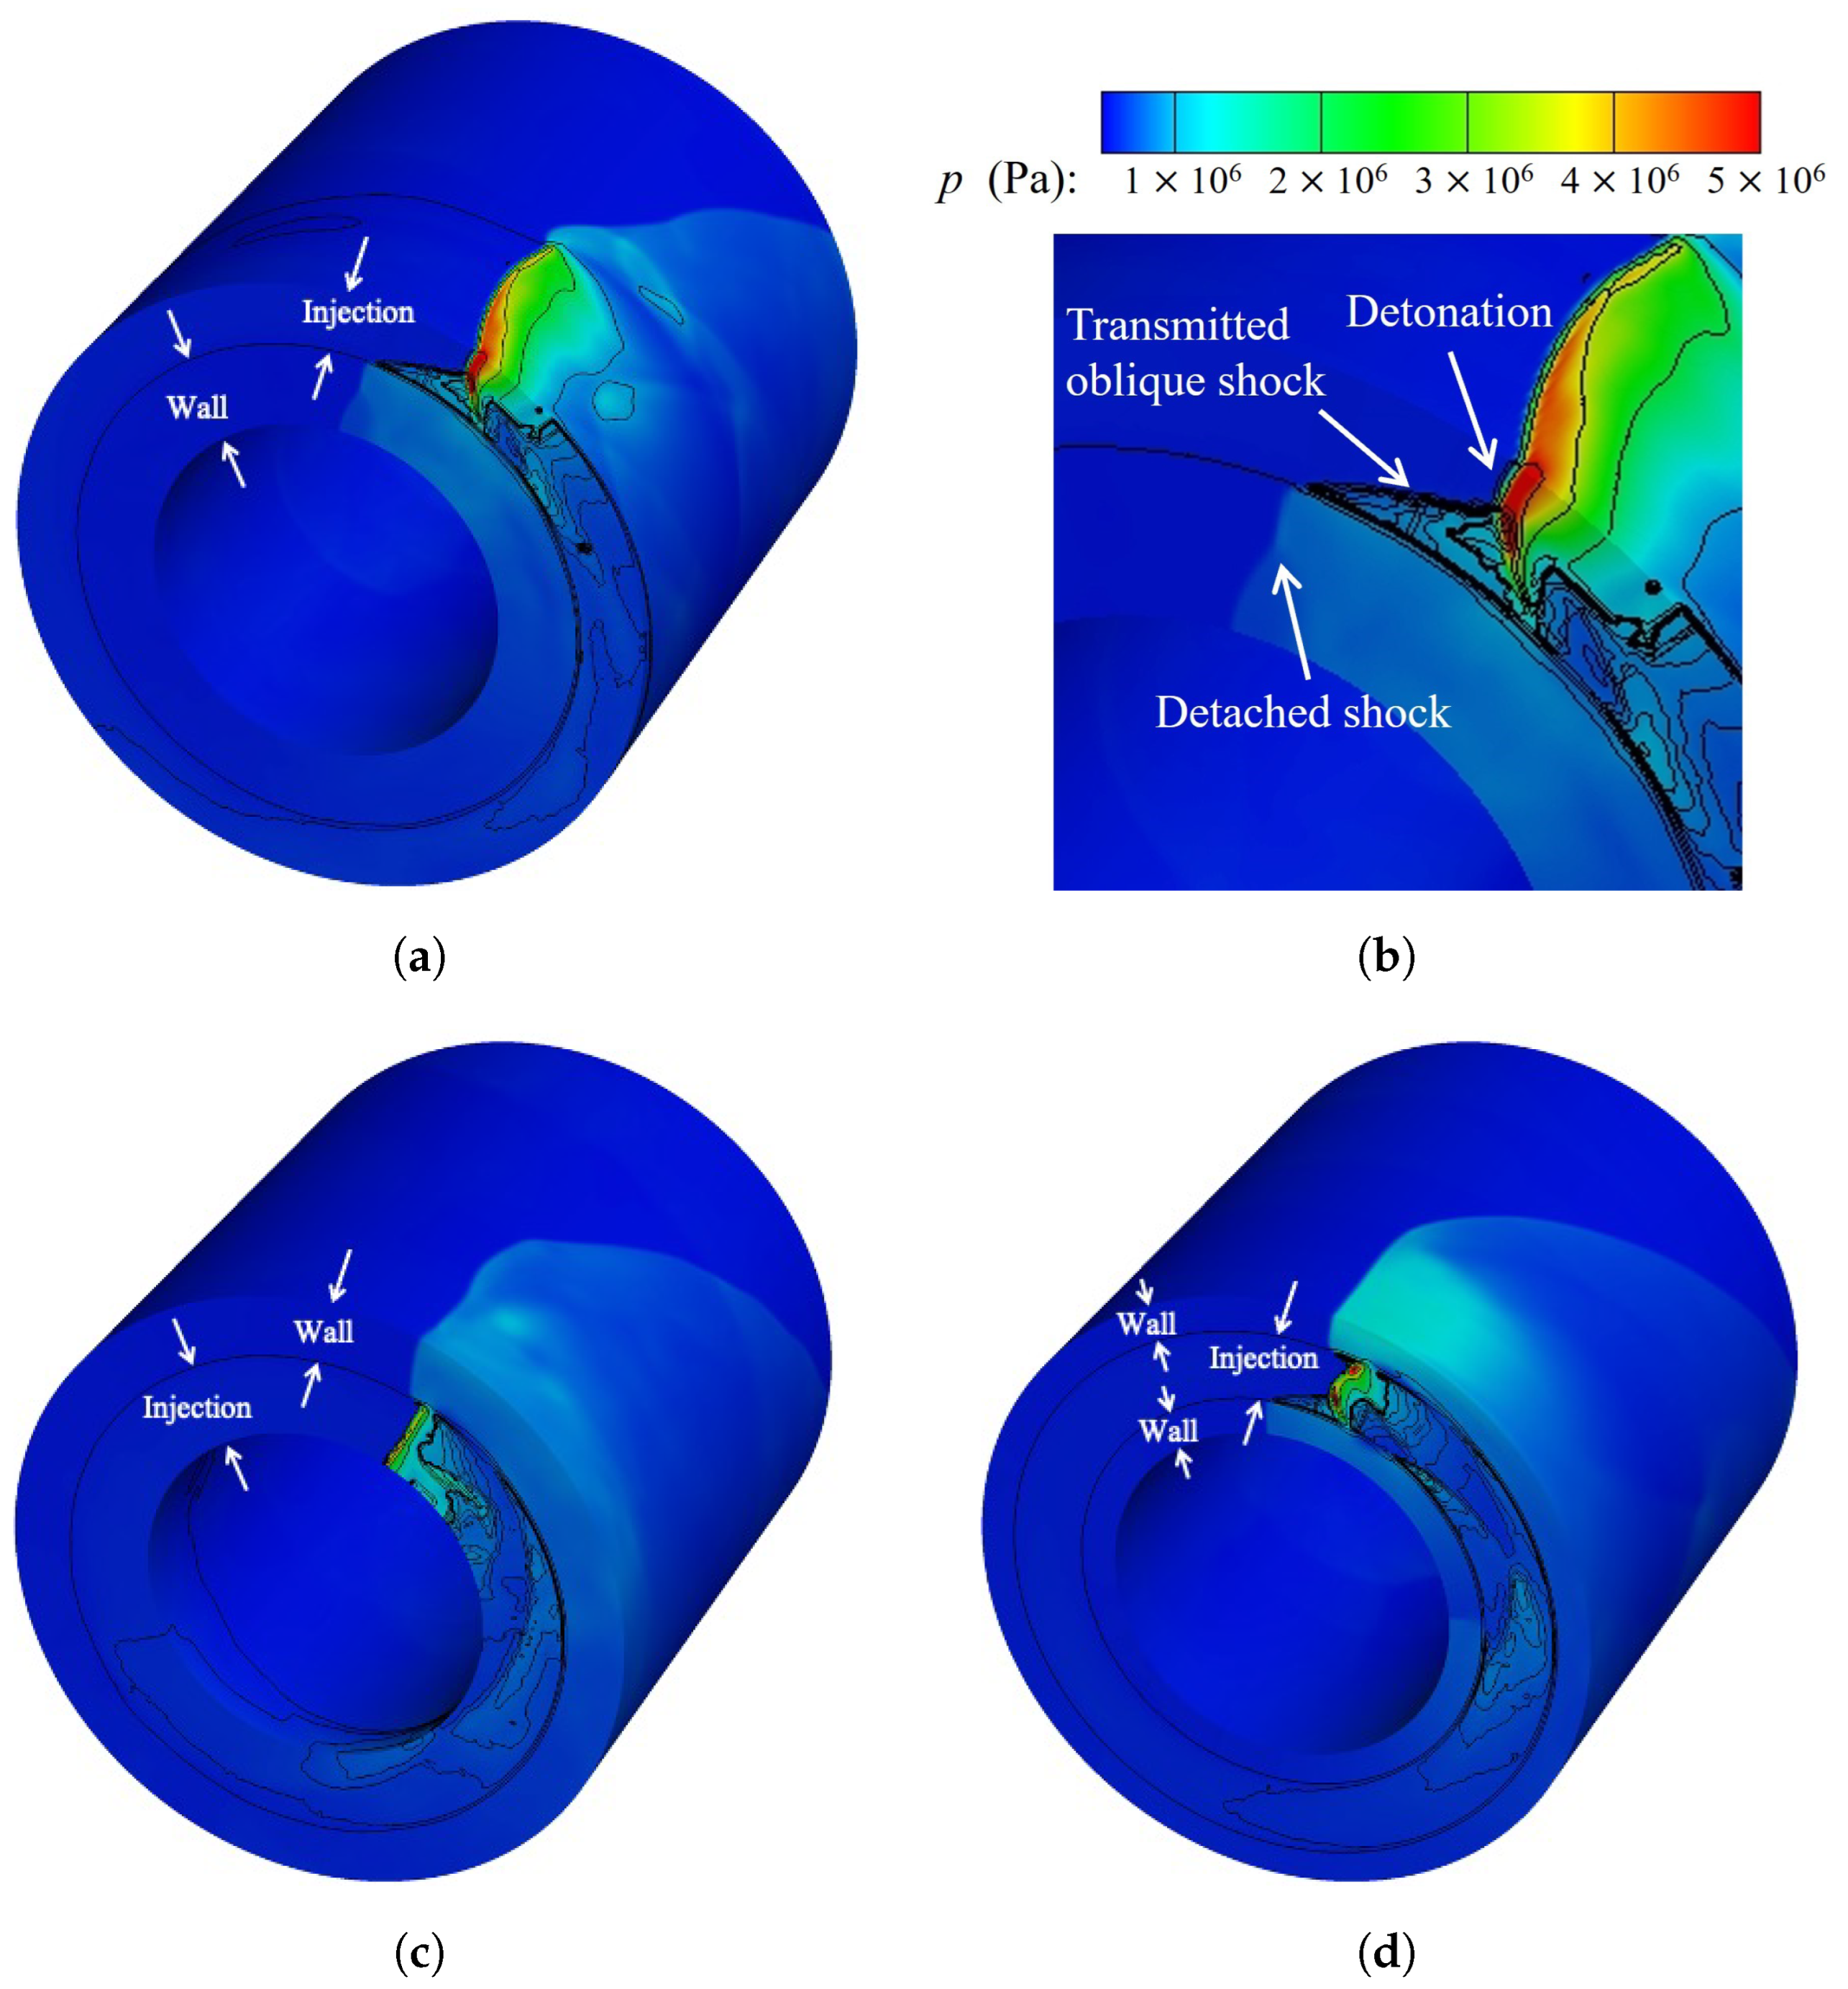
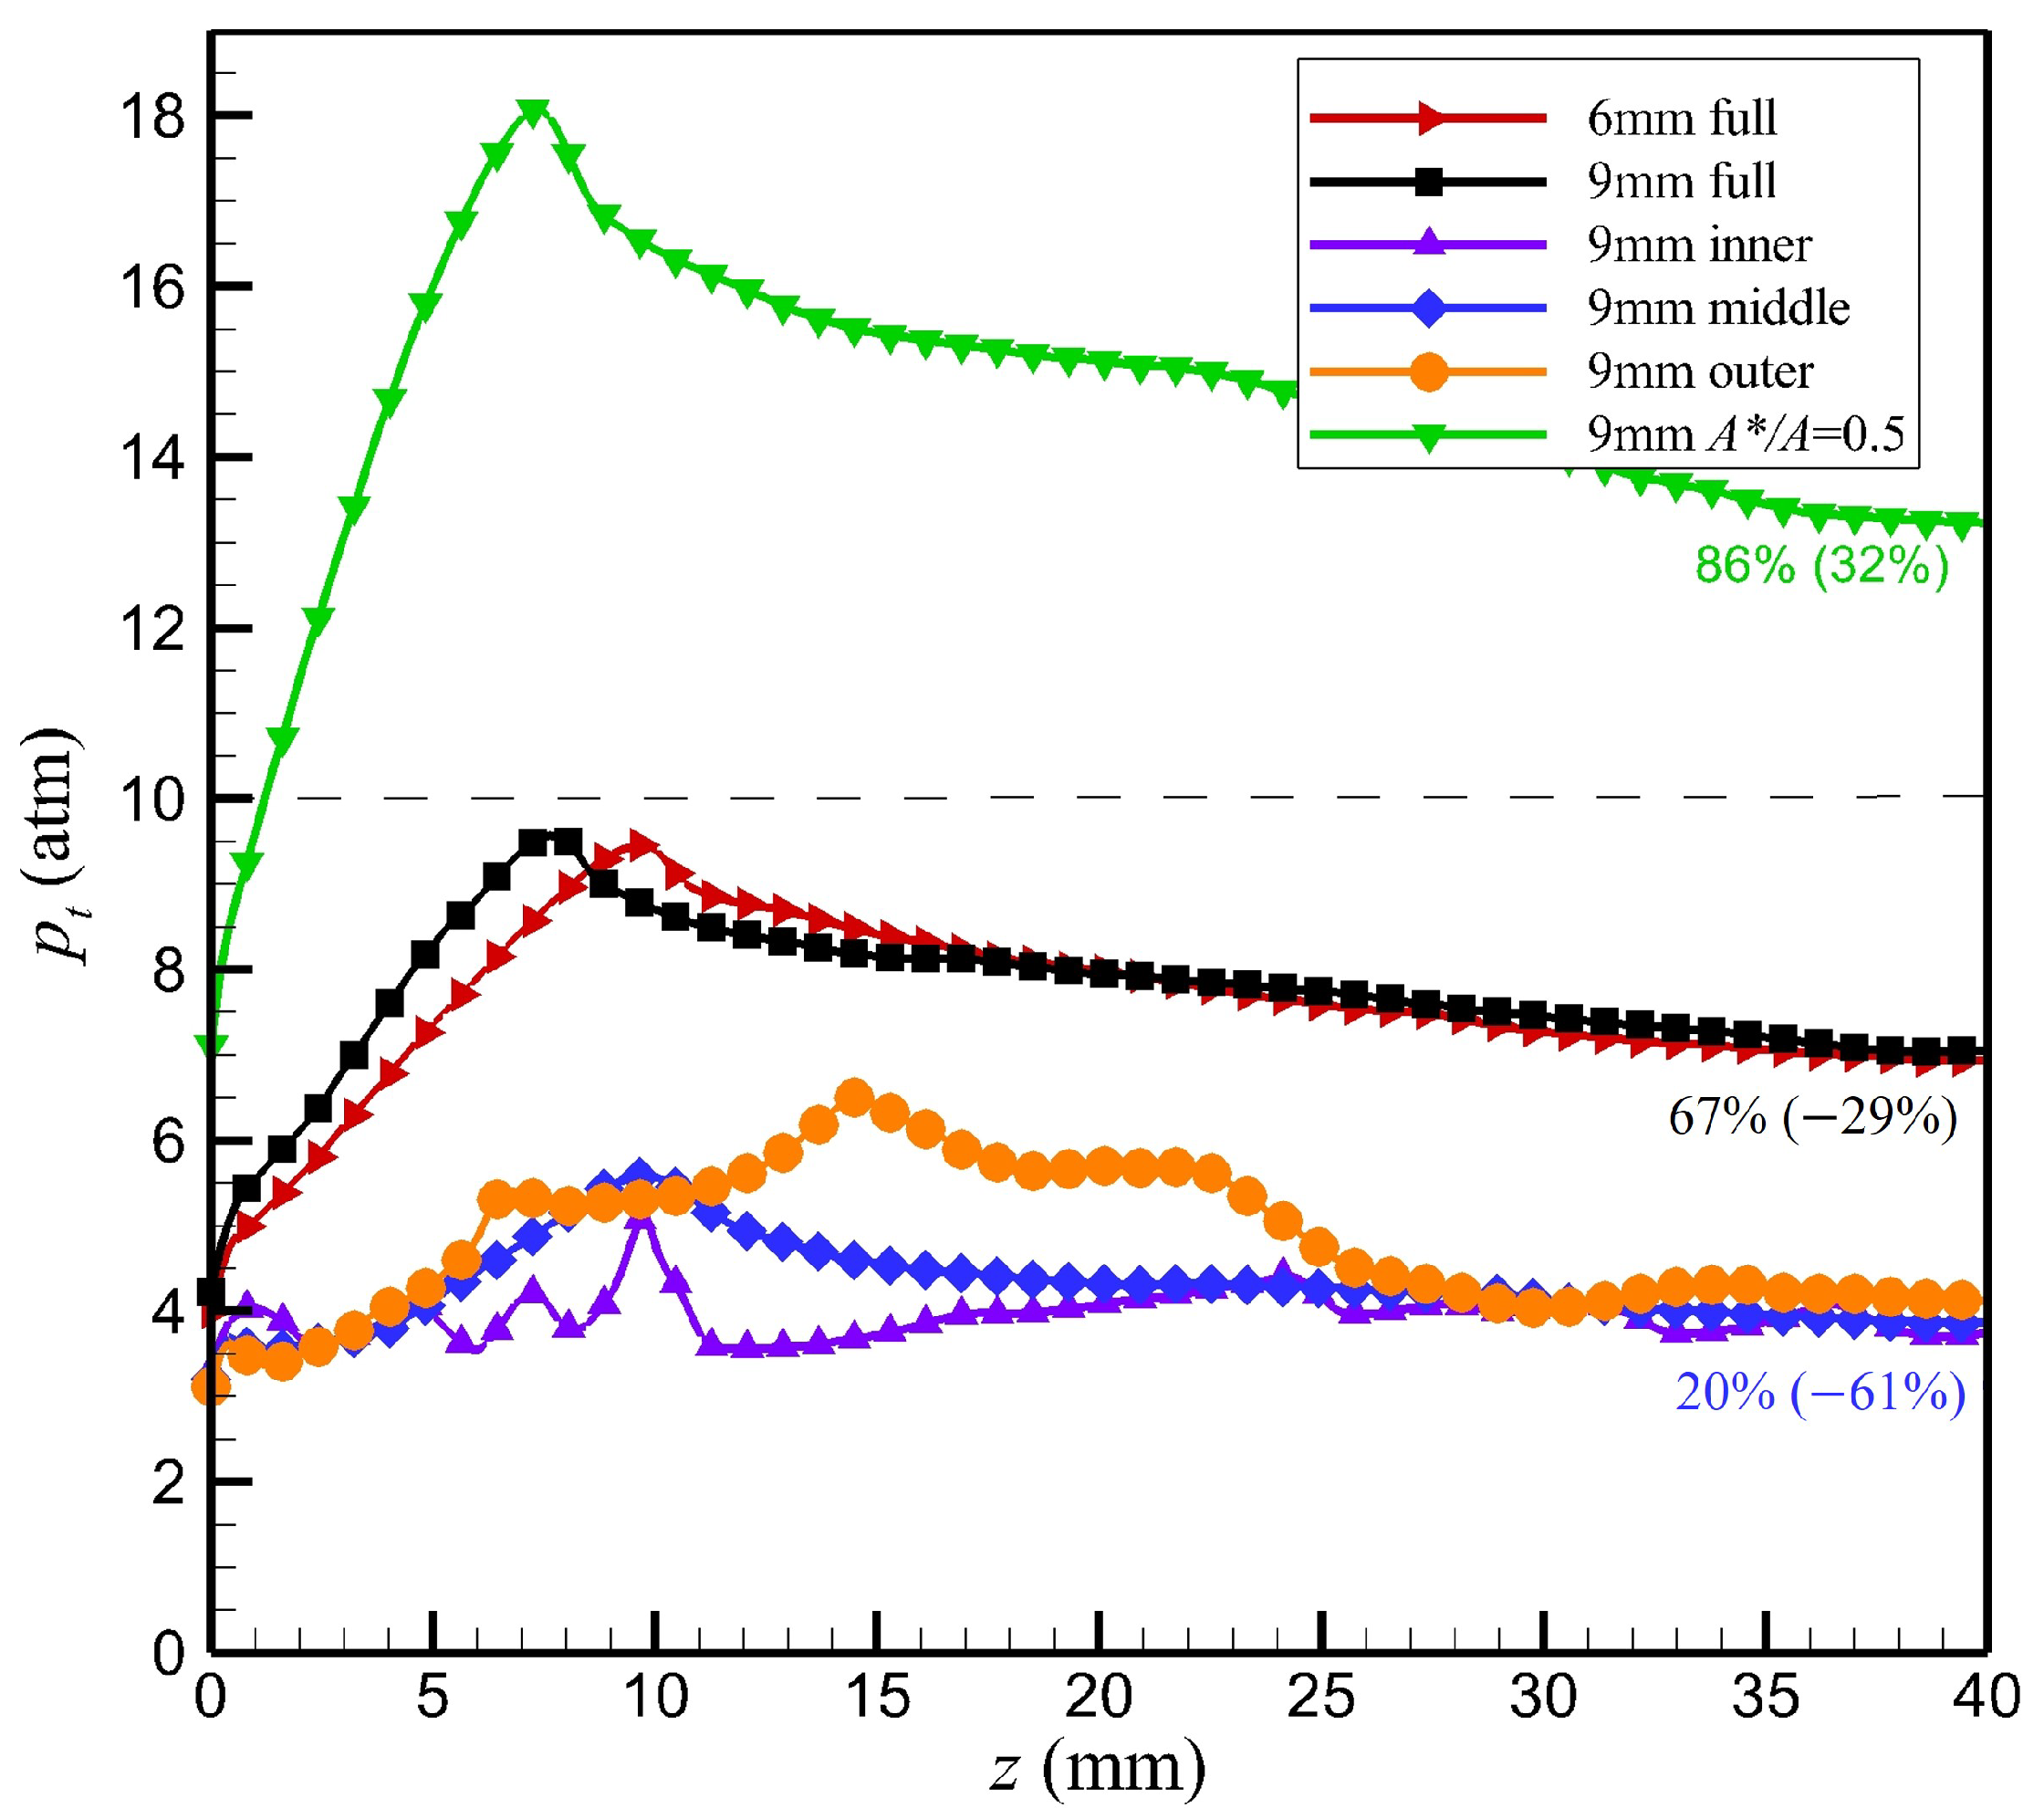
4.3. Effect of Inner Radius with Fixed Injection Area
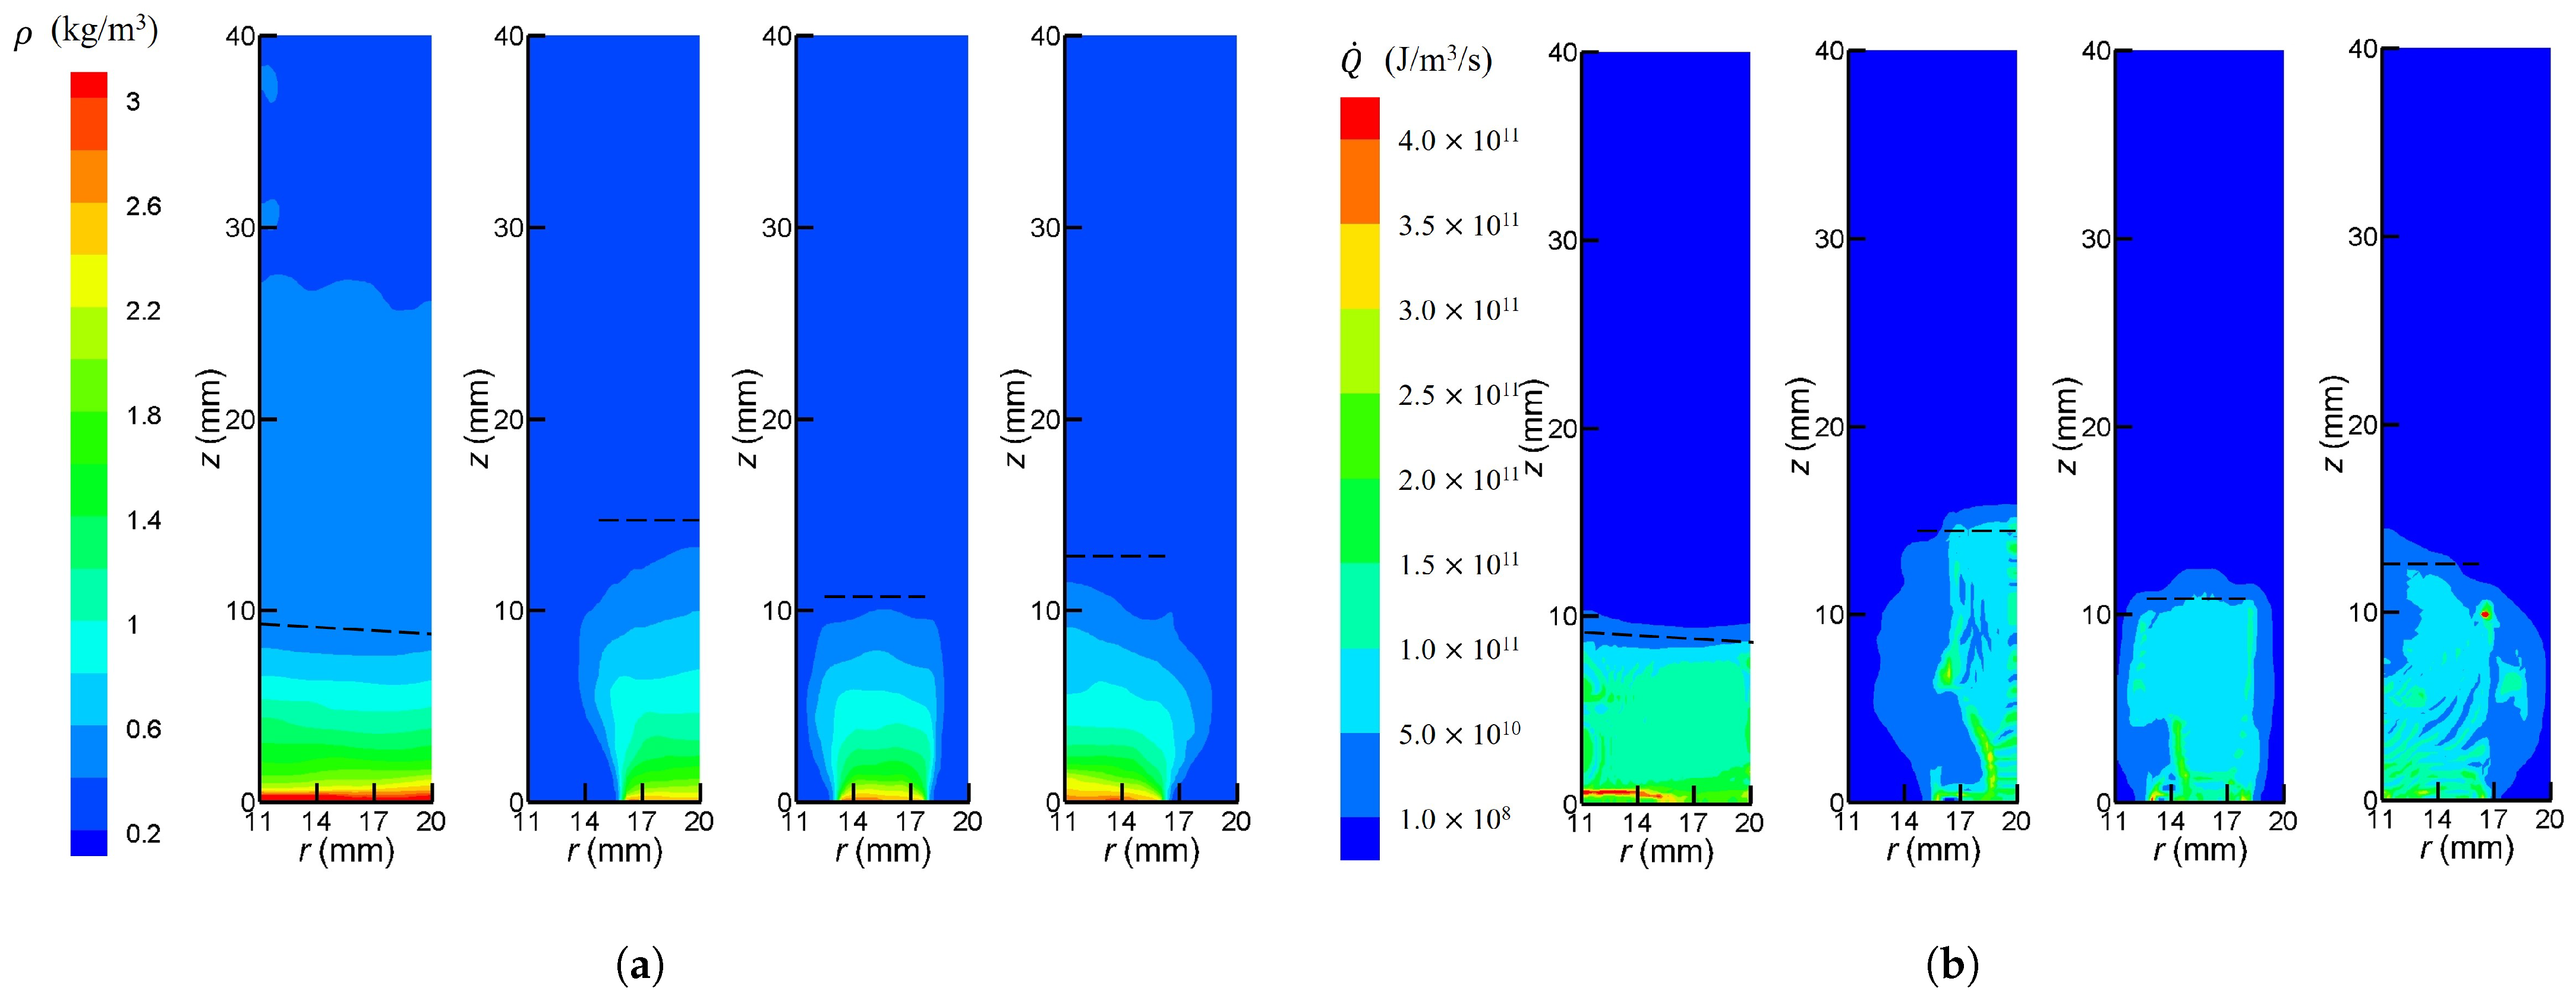
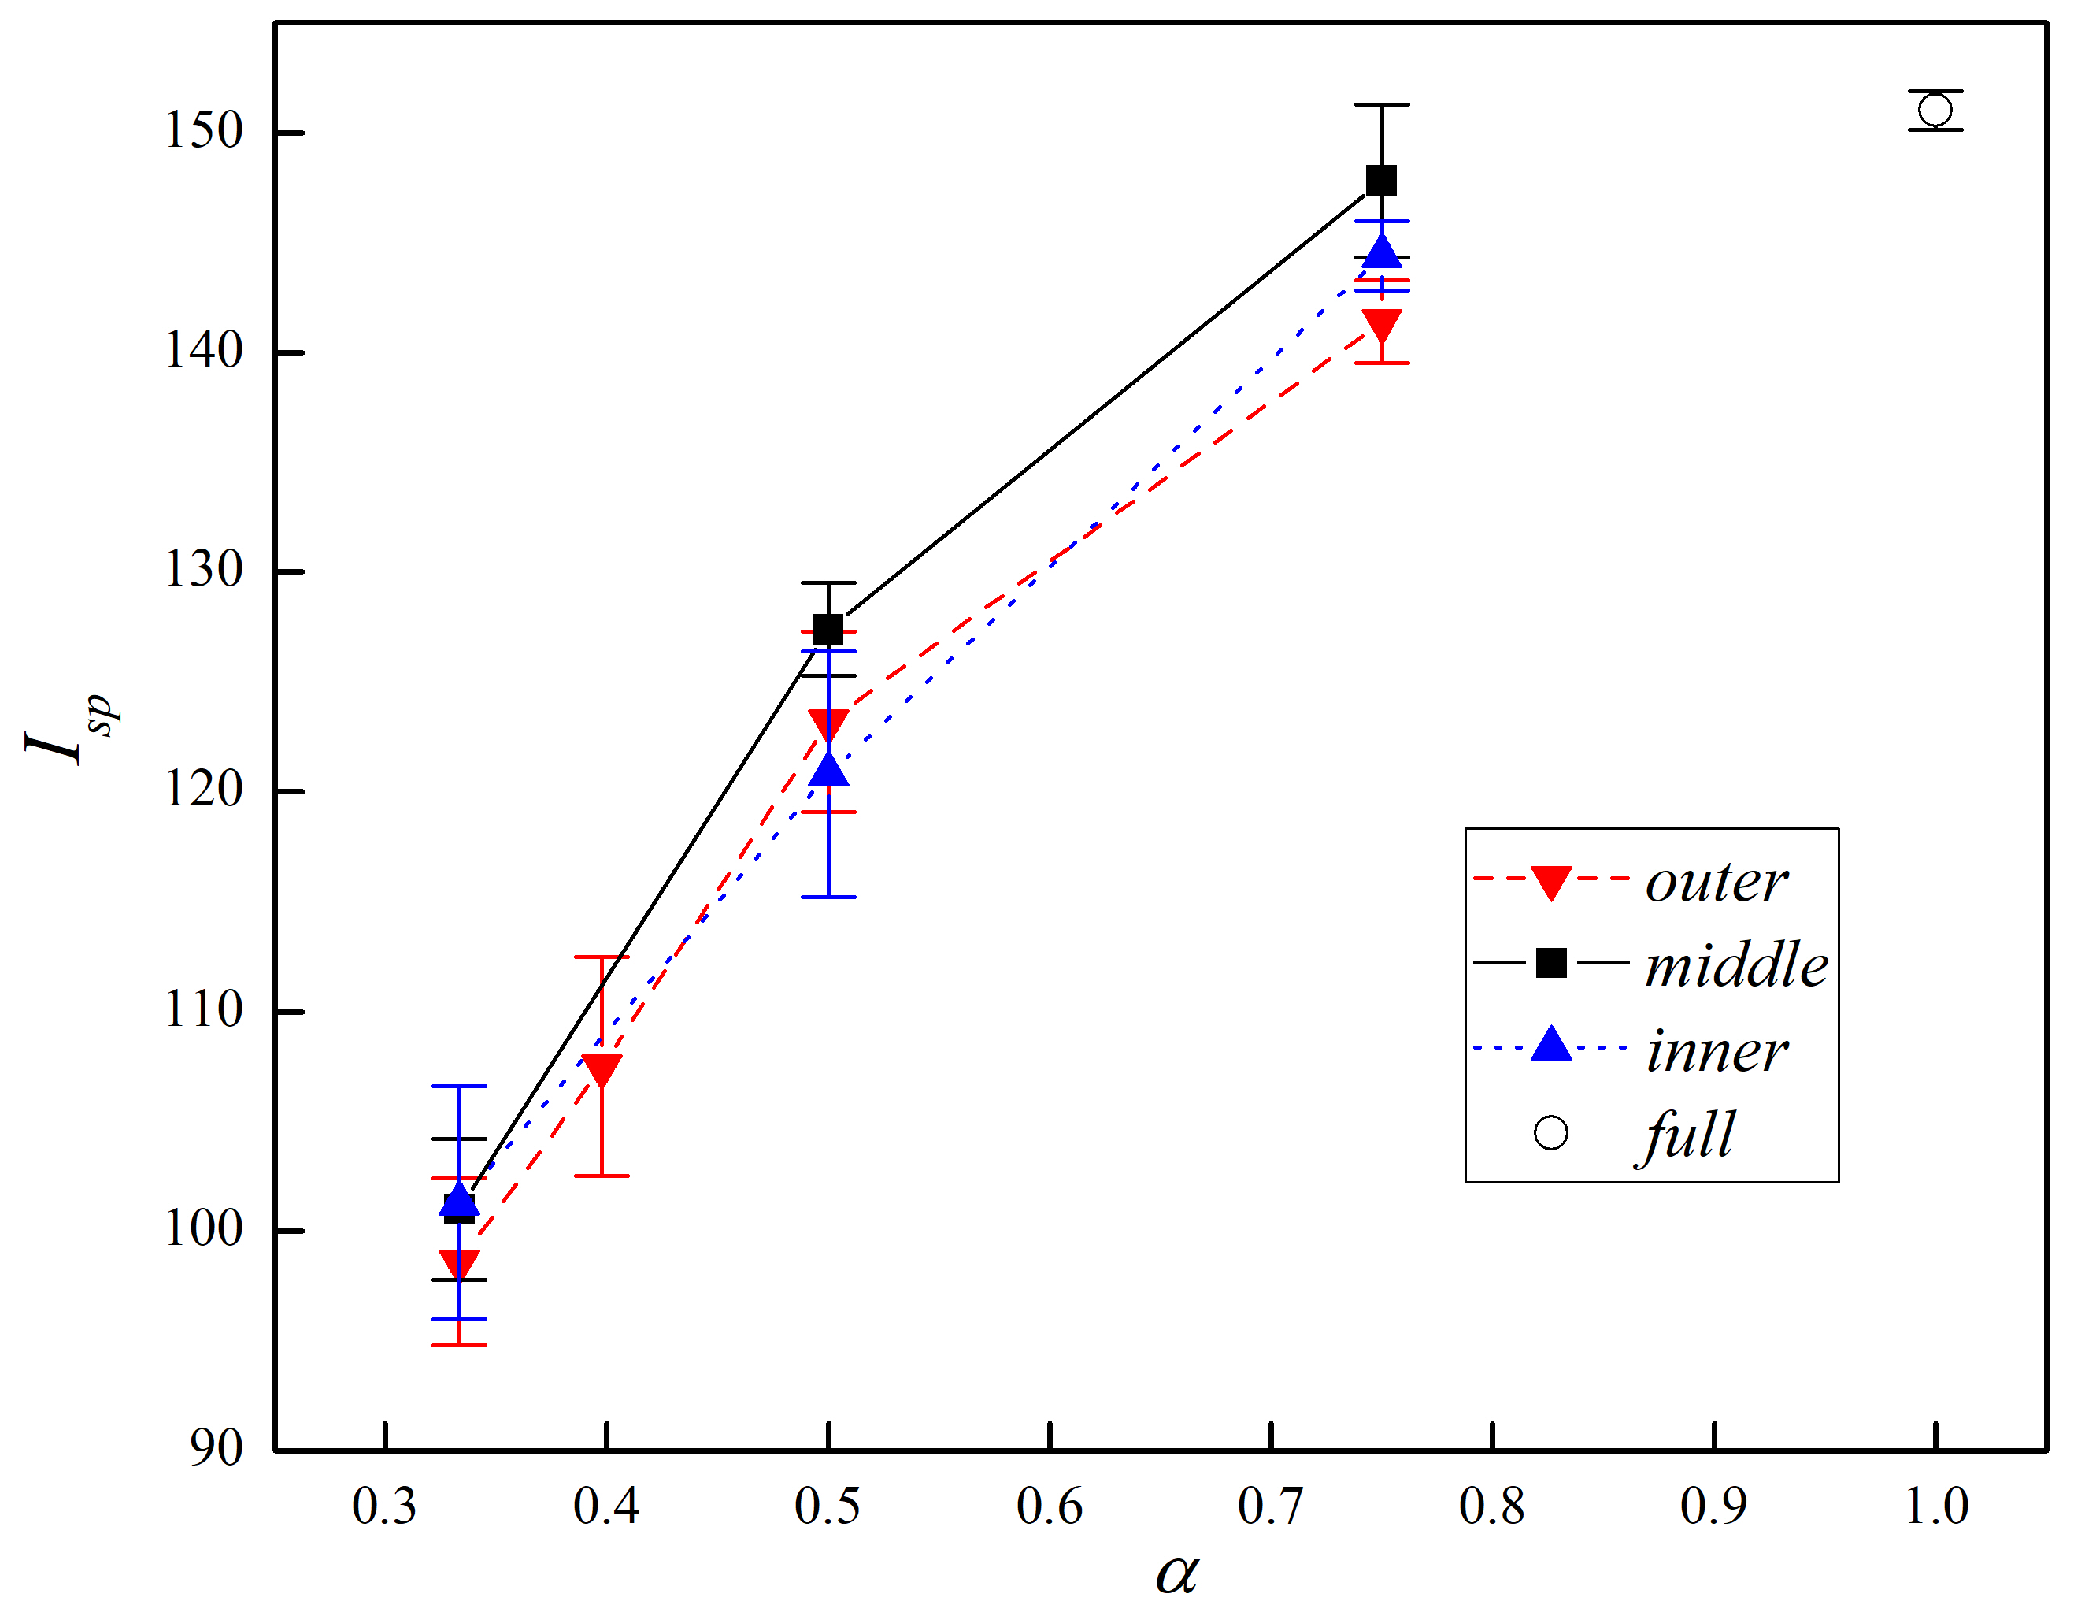
4.4. Effect of Injector Location and Size
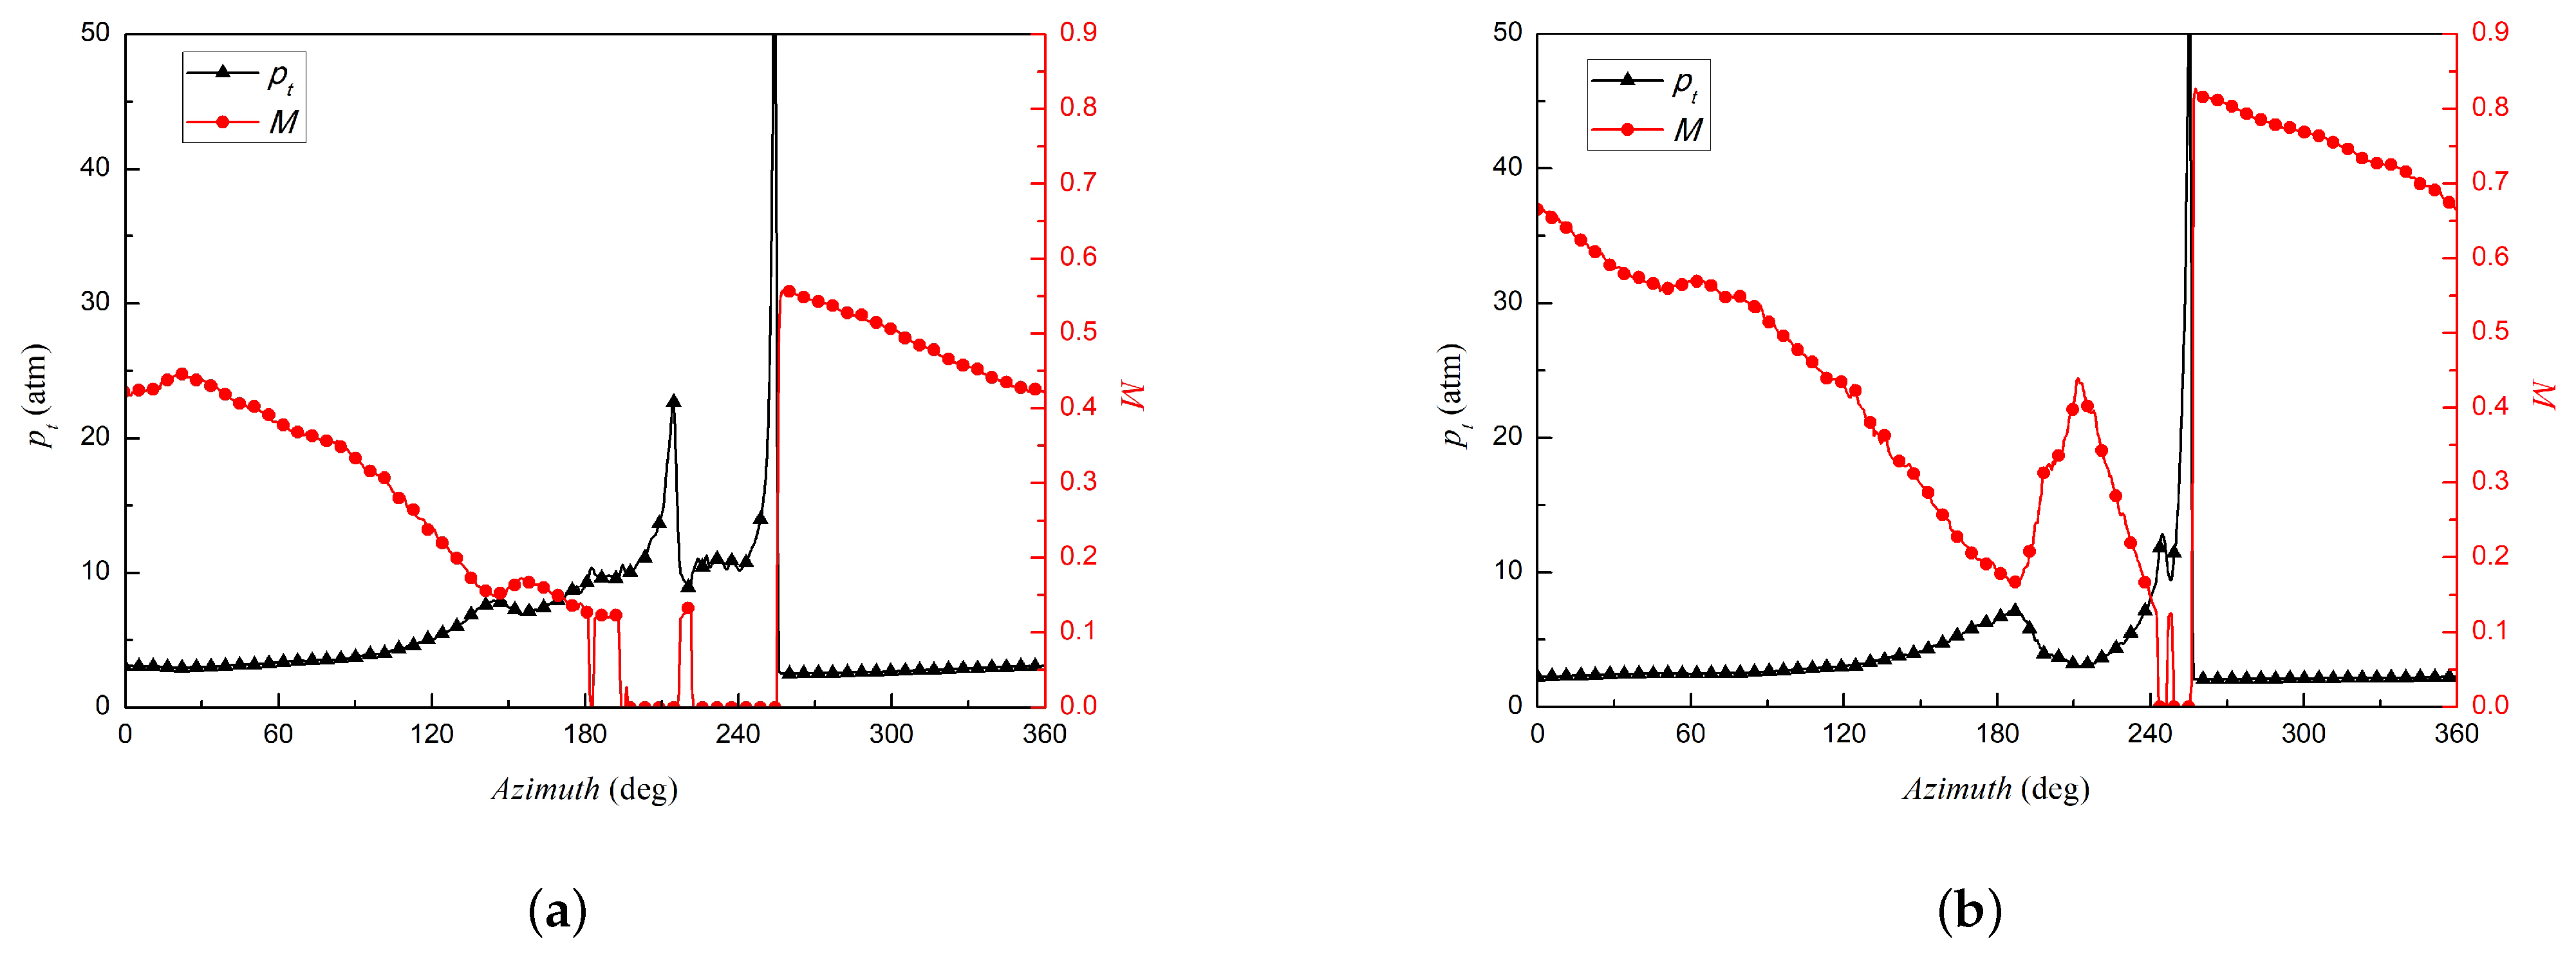
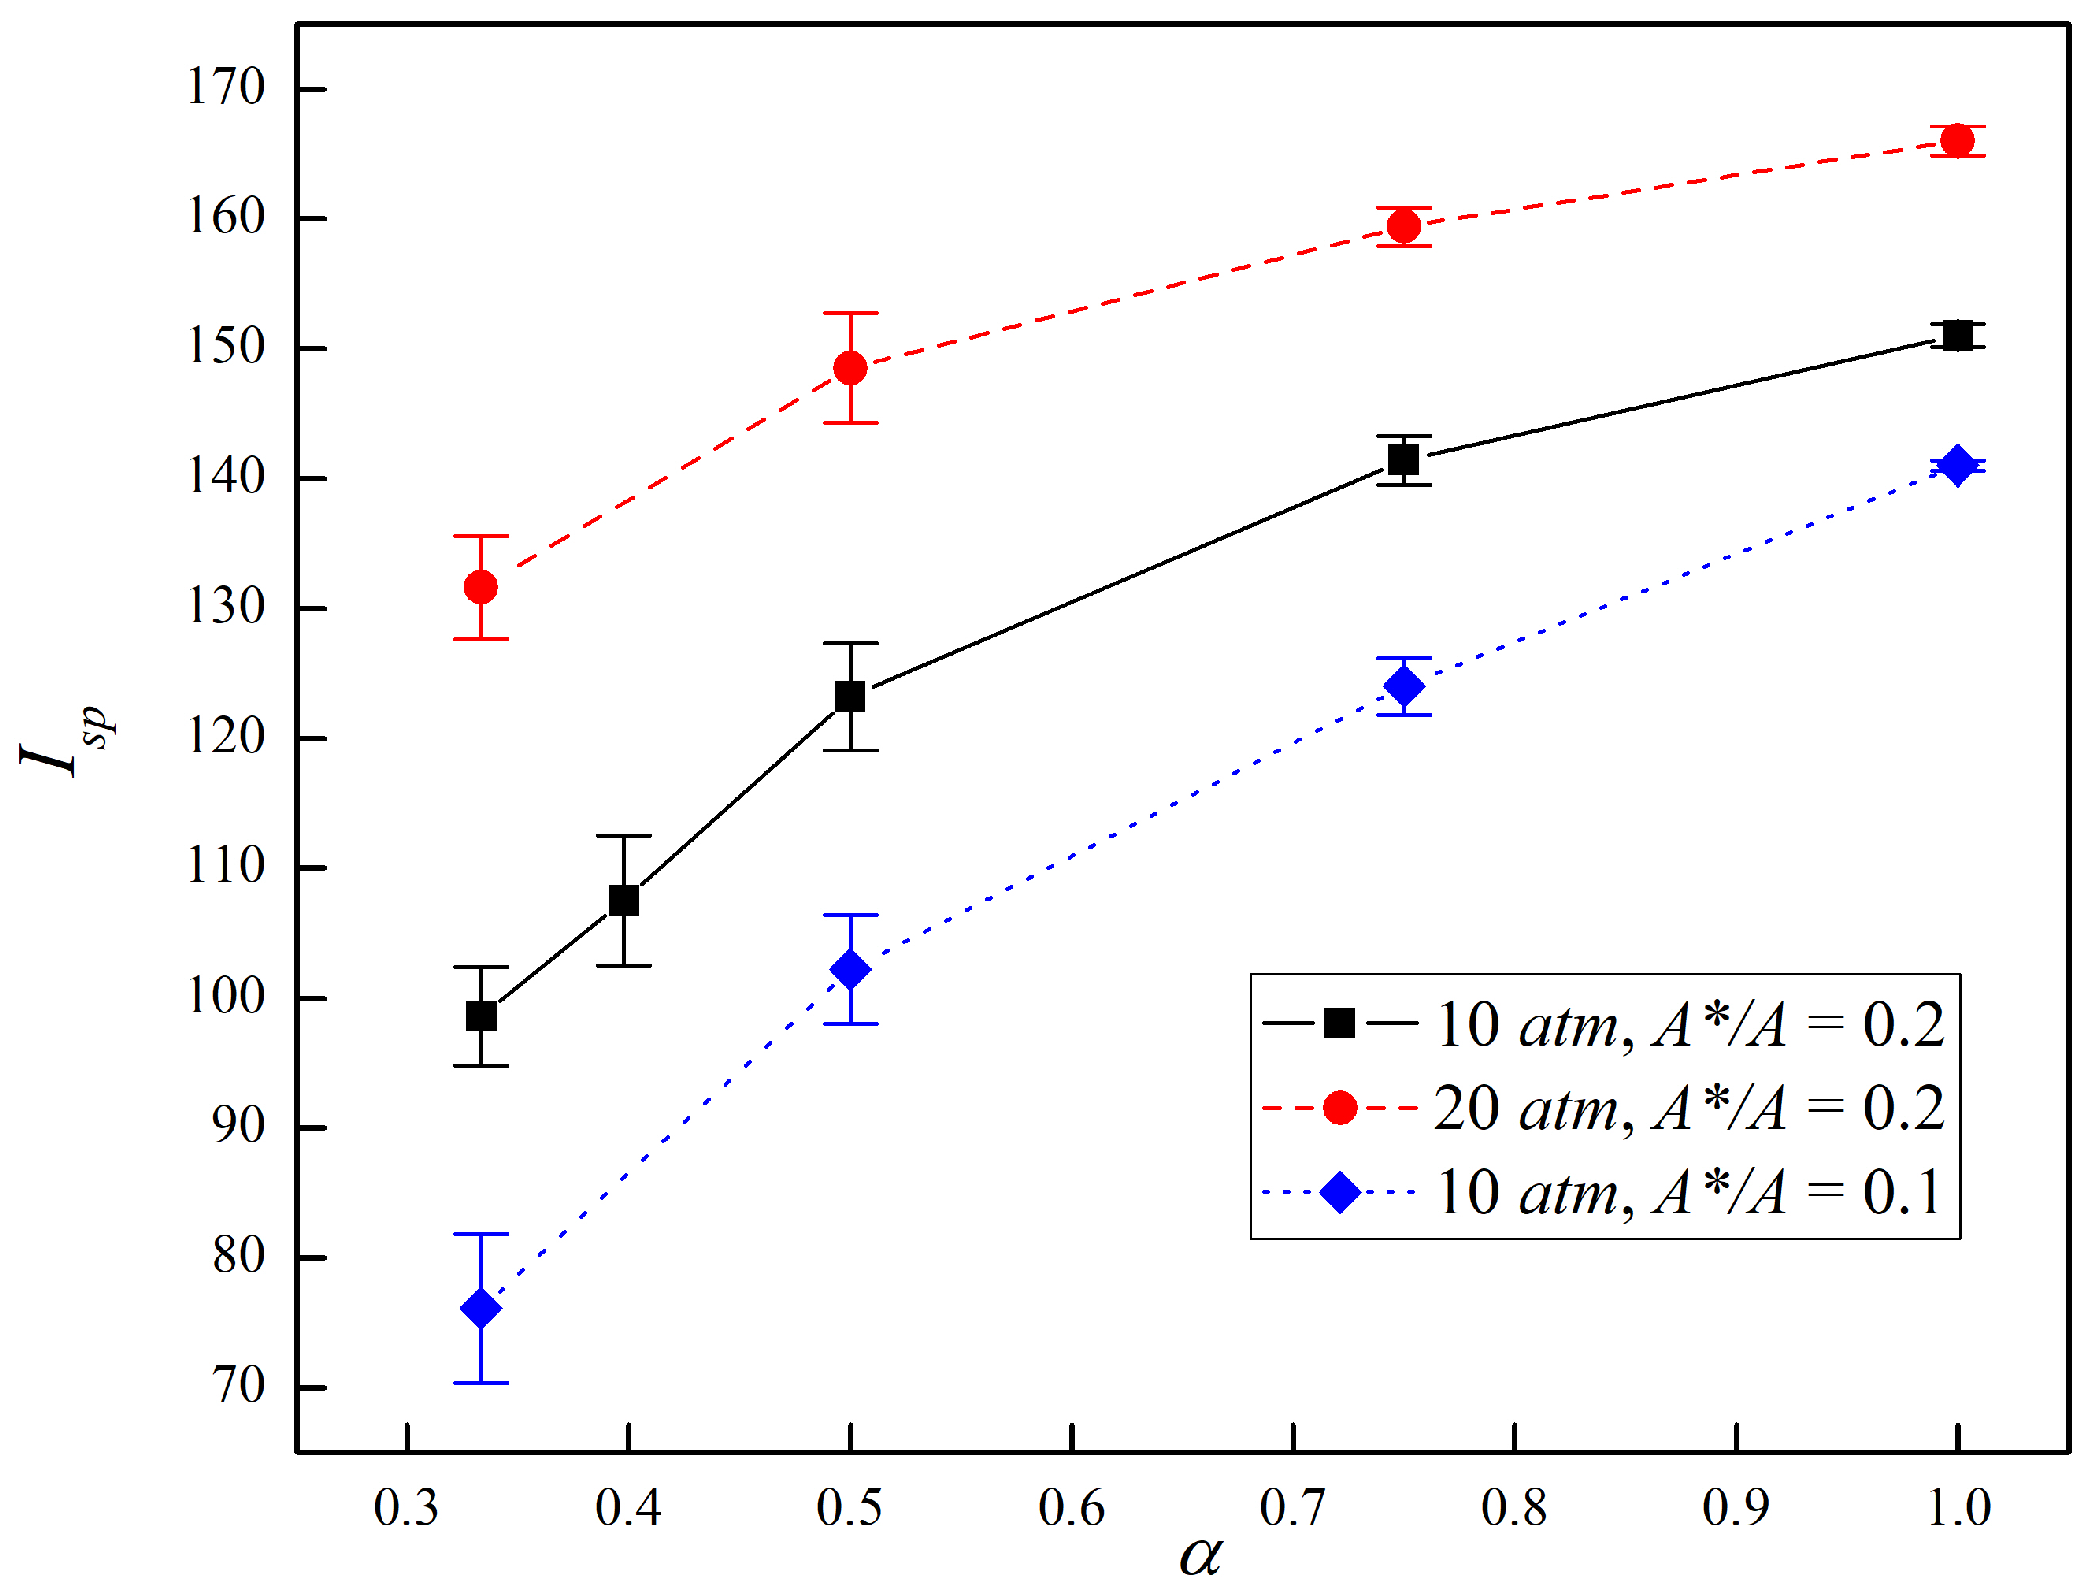
4.5. Effect of Stagnation Pressure and Area Ratio of the Injector Nozzle
5. Conclusions
Author Contributions
Funding
Institutional Review Board Statement
Informed Consent Statement
Data Availability Statement
Conflicts of Interest
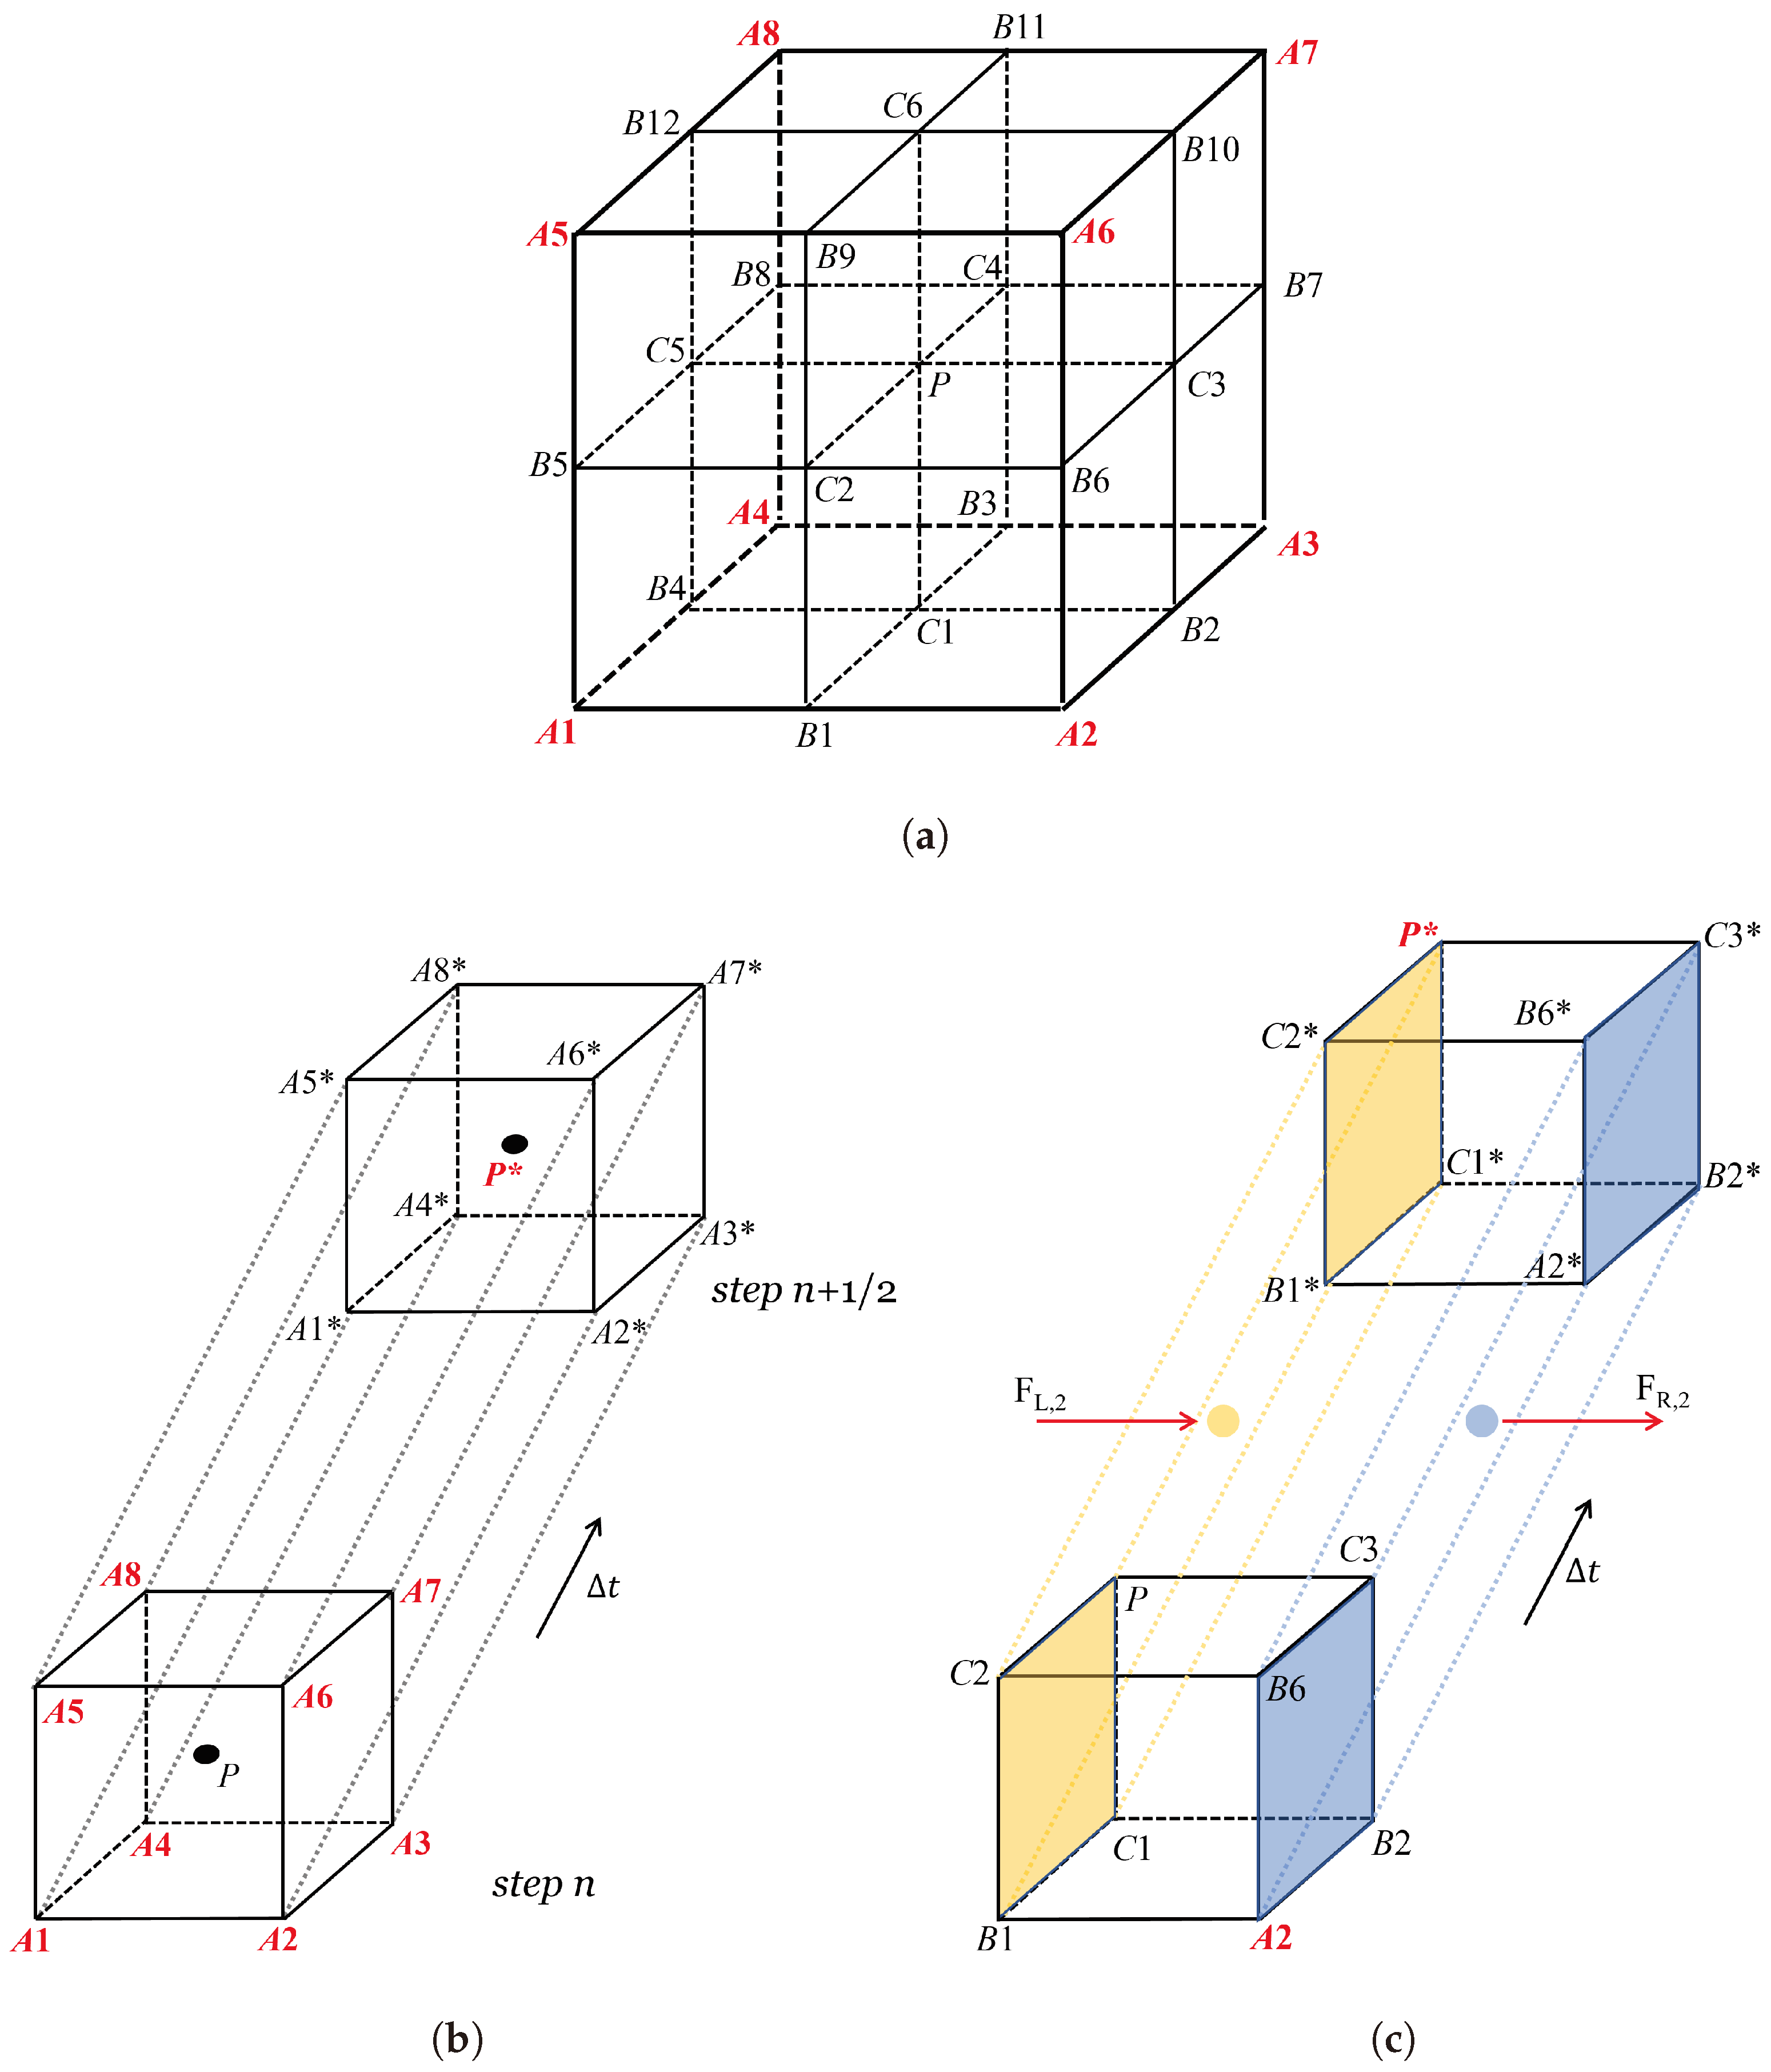
Appendix A. 3D CESE Method
Appendix A.1. Upwind CESE Method on 3D Meshes

Appendix A.2. Numerical Outline for 3D Upwind CESE Method
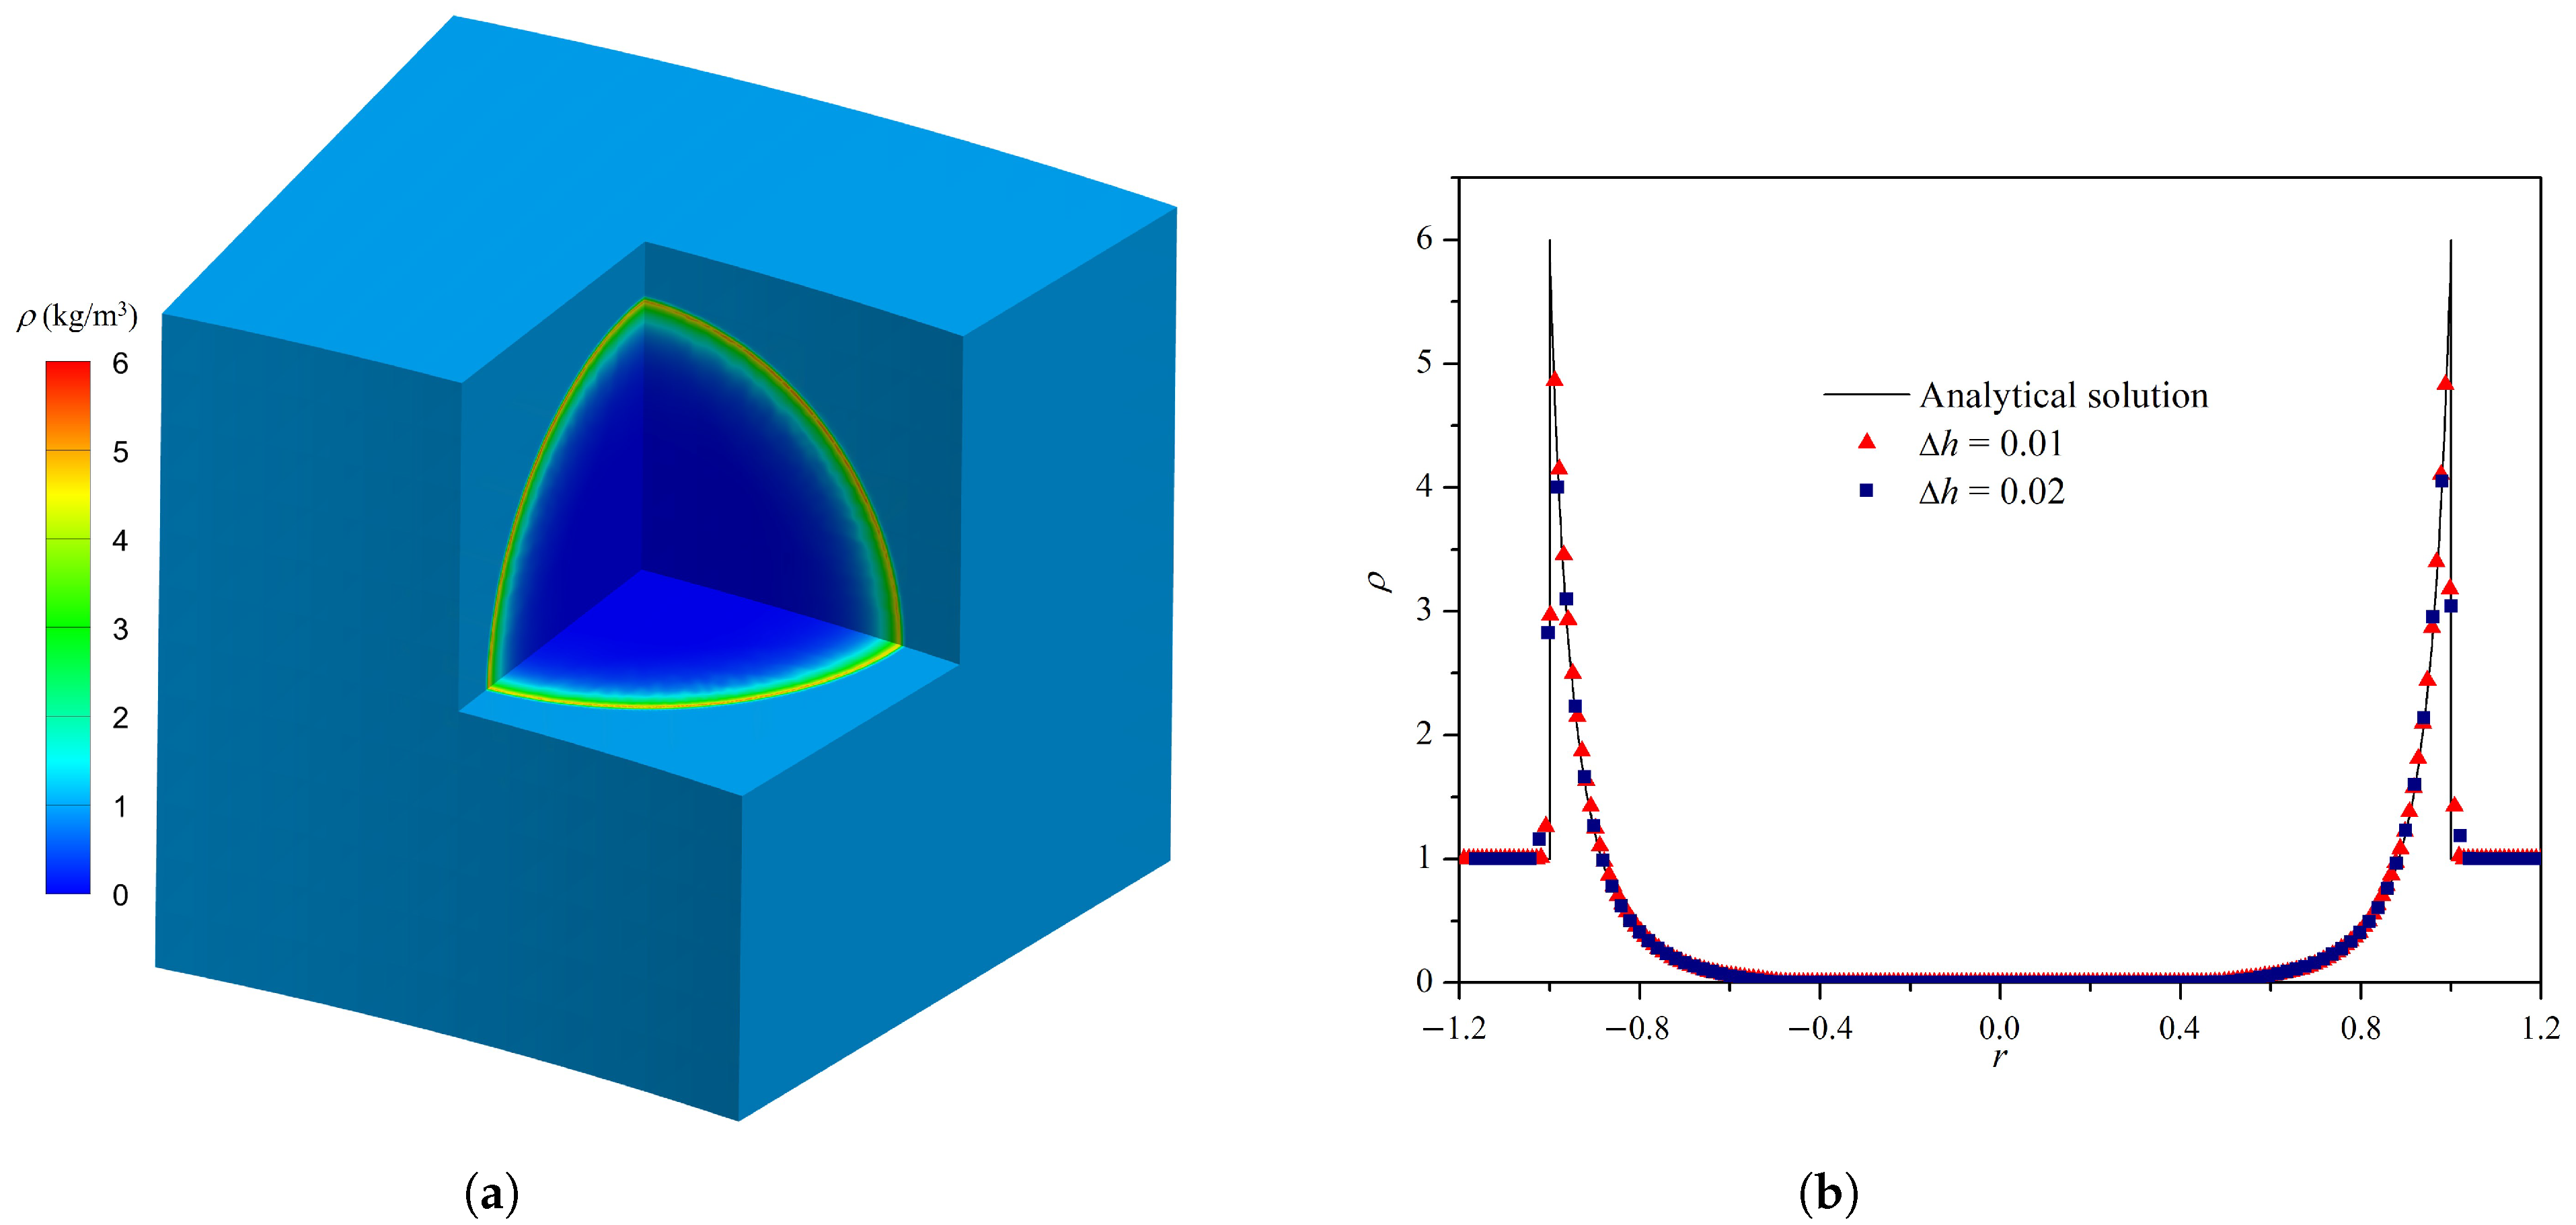
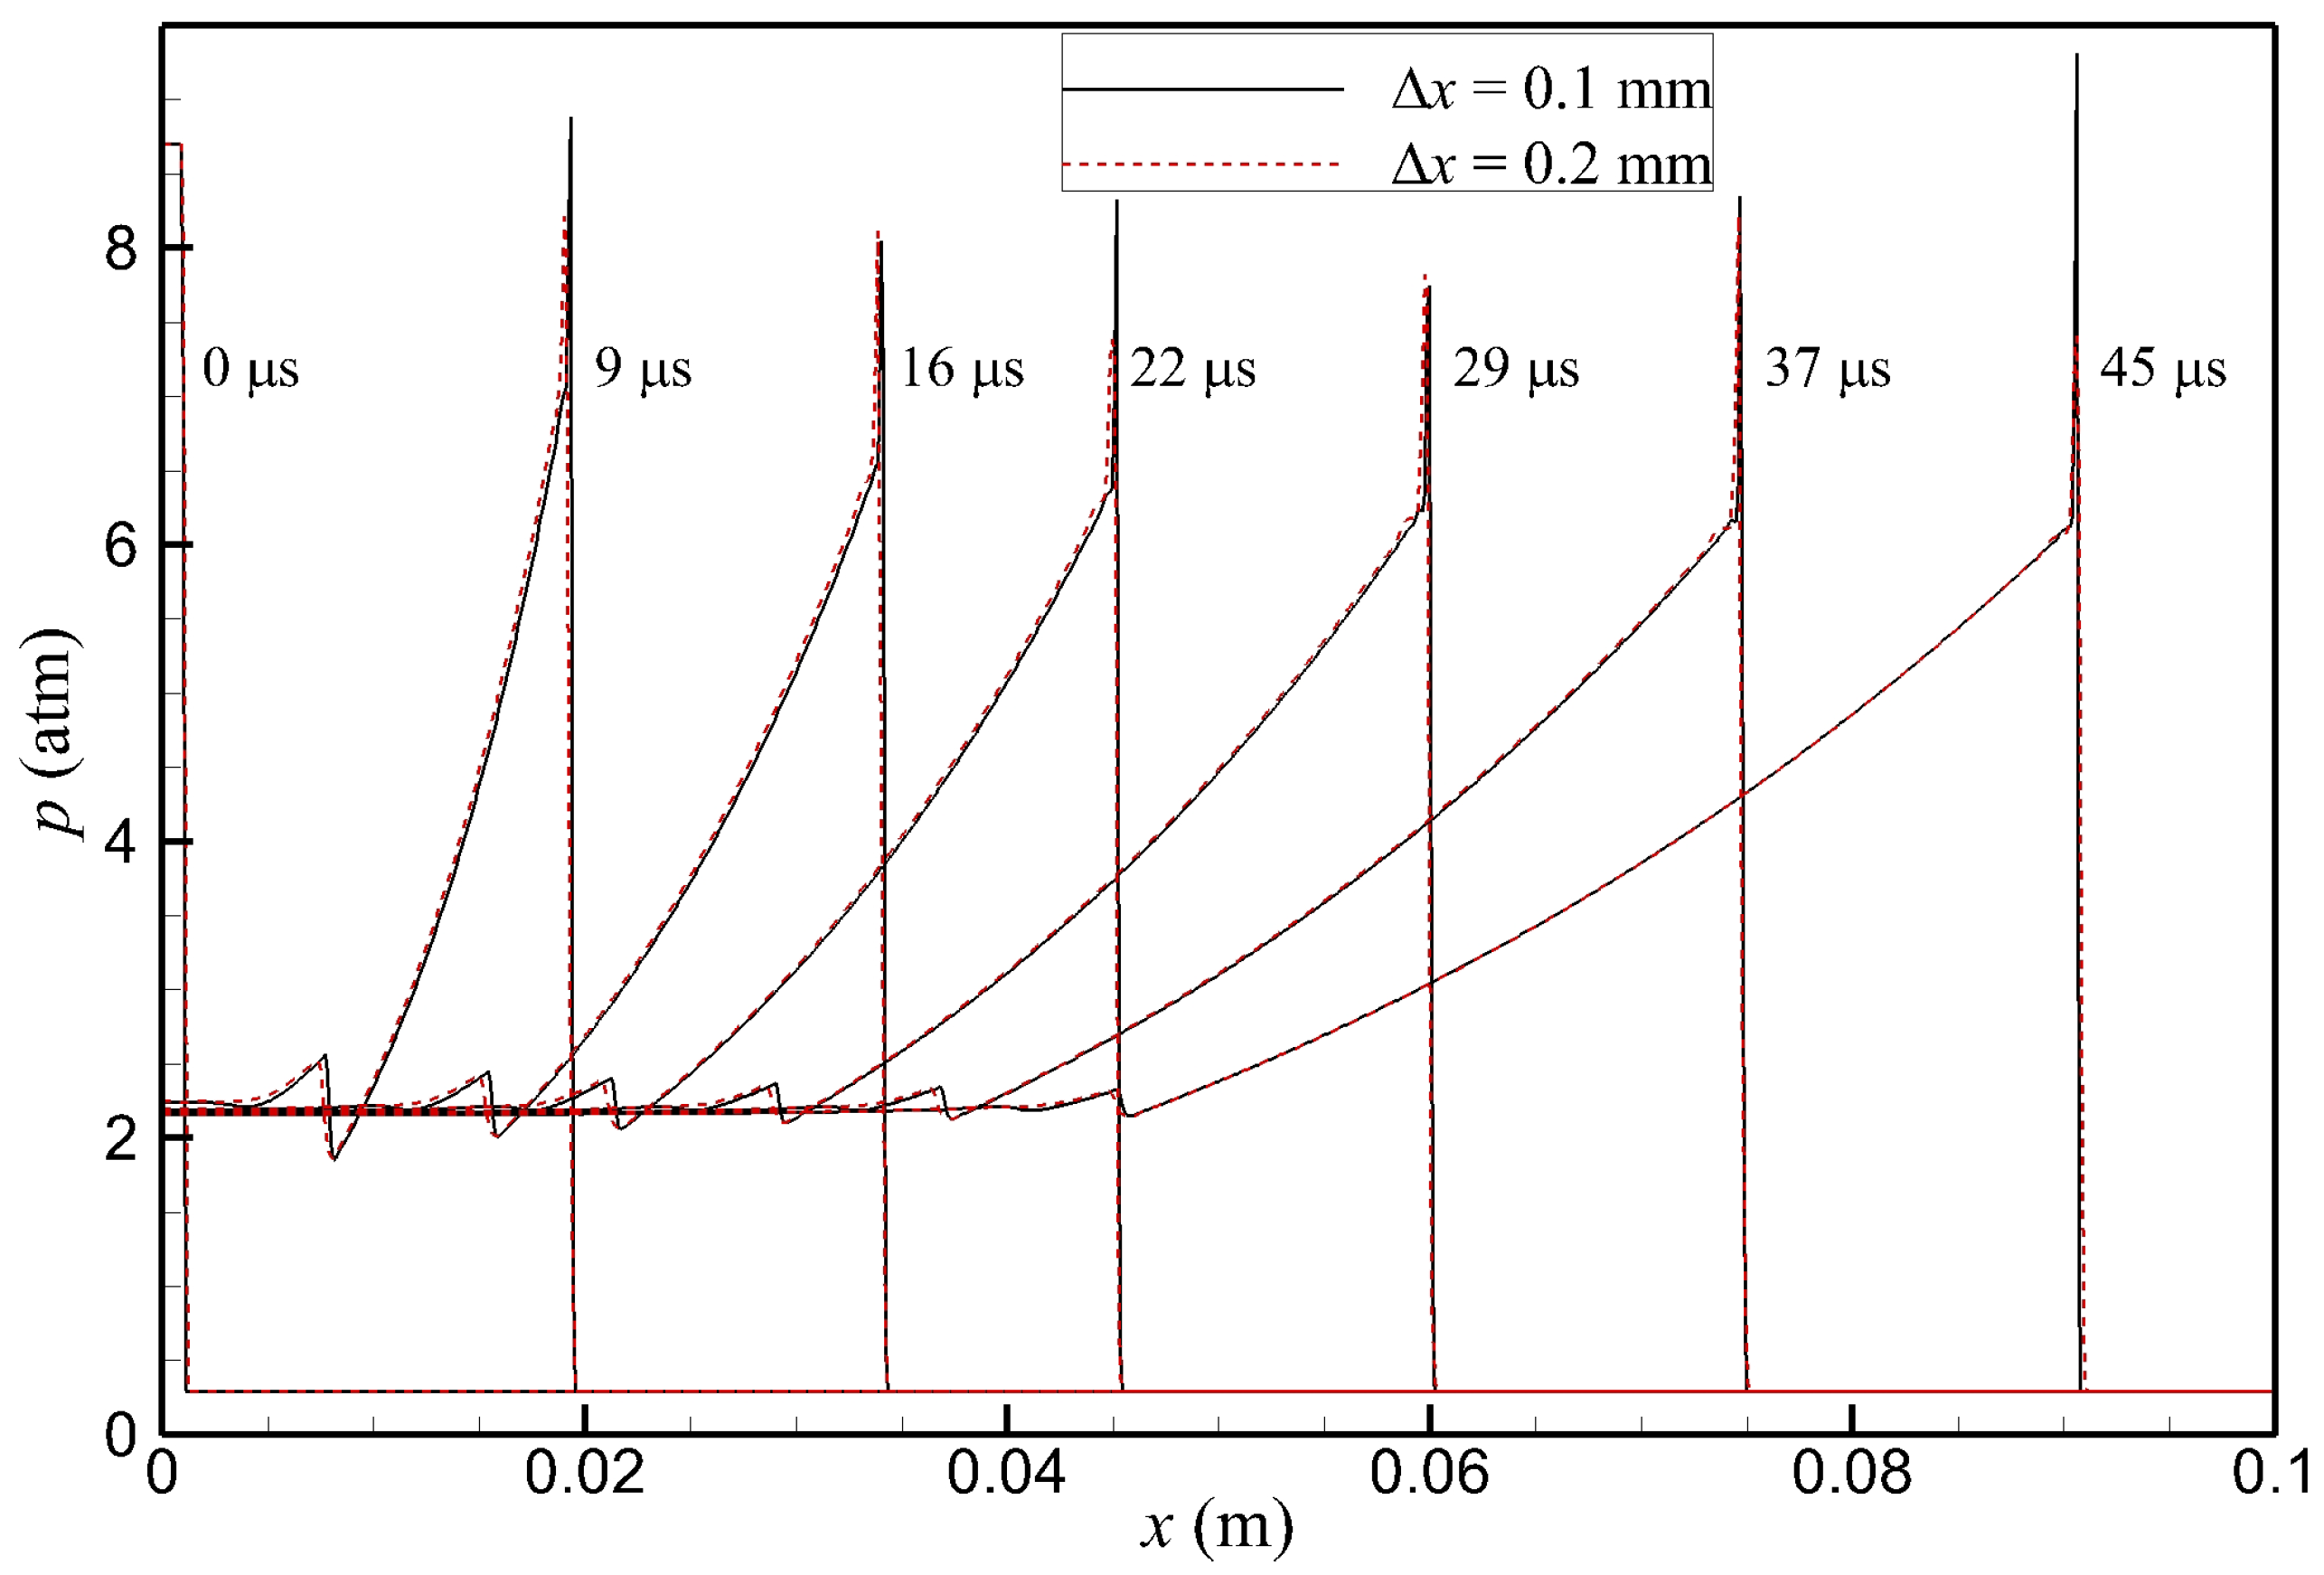
Appendix B. Validation of the 3D CESE Method in Cylindrical Coordinates
Appendix B.1. Sedov Blast Wave Problem

Appendix B.2. 1D Detonation Velocity

References
- Peng, H.Y.; Liu, W.D.; Liu, S.J.; Zhang, H.L.; Jiang, L.X. Hydrogen-air, ethylene-air, and methane-air continuous rotating detonation in the hollow chamber. Energy 2020, 211, 118598. [Google Scholar] [CrossRef]
- Lin, W.; Tong, Y.; Lin, Z.; Nie, W.; Su, L. Propagation mode analysis on H2–air rotating detonation waves in a hollow combustor. AIAA J. 2020, 58, 5052–5062. [Google Scholar] [CrossRef]
- Zhang, P.; Meagher, P.A.; Zhao, X. Multiplicity for idealized rotational detonation waves. Phys. Fluids 2021, 33, 106102. [Google Scholar] [CrossRef]
- Yi, T.H.; Lou, J.; Turangan, C.; Choi, J.Y.; Wolanski, P. Propulsive performance of a continuously rotating detonation engine. J. Propuls. Power 2011, 27, 171–181. [Google Scholar] [CrossRef]
- Hishida, M.; Fujiwara, T.; Wolanski, P. Fundamentals of rotating detonations. Shock Waves 2009, 19, 1–10. [Google Scholar] [CrossRef]
- Nejaamtheen, M.; Kim, T.; Pavalavanni, P.; Ryu, J.; Choi, J.Y. Effects of the dimensionless radius of an annulus on the detonation propagation characteristics in circular and non-circular rotating detonation engines. Shock Waves 2021, 31, 703–715. [Google Scholar] [CrossRef]
- Lee, J.H.; Ryu, J.H.; Lee, E.S.; Han, H.S.; Choi, J.Y. Experimental Proof of Concept of a Noncircular Rotating Detonation Engine (RDE) for Propulsion Applications. Aerospace 2022, 10, 27. [Google Scholar] [CrossRef]
- Schwer, D.; Kailasanath, K. Fluid dynamics of rotating detonation engines with hydrogen and hydrocarbon fuels. Proc. Combust. Inst. 2013, 34, 1991–1998. [Google Scholar] [CrossRef]
- Tsuboi, N.; Watanabe, Y.; Kojima, T.; Hayashi, A.K. Numerical estimation of the thrust performance on a rotating detonation engine for a hydrogen–oxygen mixture. Proc. Combust. Inst. 2015, 35, 2005–2013. [Google Scholar] [CrossRef]
- Zhao, M.; Zhang, H. Origin and chaotic propagation of multiple rotating detonation waves in hydrogen/air mixtures. Fuel 2020, 275, 117986. [Google Scholar] [CrossRef]
- Hayashi, A.K.; Tsuboi, N.; Dzieminska, E. Numerical study on JP-10/air detonation and rotating detonation engine. AIAA J. 2020, 58, 5078–5094. [Google Scholar] [CrossRef]
- Meng, Q.; Zhao, N.; Zhang, H. On the distributions of fuel droplets and in situ vapor in rotating detonation combustion with prevaporized n-heptane sprays. Phys. Fluids 2021, 33, 043307. [Google Scholar] [CrossRef]
- Ren, Z.; Zheng, L. Numerical study on rotating detonation stability in two-phase kerosene-air mixture. Combust. Flame 2021, 231, 111484. [Google Scholar] [CrossRef]
- Yao, S.; Tang, X.; Luan, M.; Wang, J. Numerical study of hollow rotating detonation engine with different fuel injection area ratios. Proc. Combust. Inst. 2017, 36, 2649–2655. [Google Scholar] [CrossRef]
- Liu, X.Y.; Chen, Y.L.; Xia, Z.J.; Wang, J.P. Numerical study of the reverse-rotating waves in rotating detonation engine with a hollow combustor. Acta Astronaut. 2020, 170, 421–430. [Google Scholar] [CrossRef]
- Tang, X.M.; Wang, J.P.; Shao, Y.T. Three-dimensional numerical investigations of the rotating detonation engine with a hollow combustor. Combust. Flame 2015, 162, 997–1008. [Google Scholar] [CrossRef]
- Katta, V.R.; Cho, K.Y.; Hoke, J.L.; Codoni, J.R.; Schauer, F.R.; Roquemore, W.M. Effect of increasing channel width on the structure of rotating detonation wave. Proc. Combust. Inst. 2019, 37, 3575–3583. [Google Scholar] [CrossRef]
- Kawasaki, A.; Inakawa, T.; Kasahara, J.; Goto, K.; Matsuoka, K.; Matsuo, A.; Funaki, I. Critical condition of inner cylinder radius for sustaining rotating detonation waves in rotating detonation engine thruster. Proc. Combust. Inst. 2019, 37, 3461–3469. [Google Scholar] [CrossRef]
- Jiang, Y.; Wen, C.Y.; Zhang, D. Space–time conservation element and solution element method and its applications. AIAA J. 2020, 58, 5408–5430. [Google Scholar] [CrossRef]
- Chang, S.C. The method of space-time conservation element and solution element—A new approach for solving the Navier-Stokes and Euler equations. J. Comput. Phys. 1995, 119, 295–324. [Google Scholar] [CrossRef]
- Shen, H.; Wen, C.Y.; Zhang, D.L. A characteristic space–time conservation element and solution element method for conservation laws. J. Comput. Phys. 2015, 288, 101–118. [Google Scholar] [CrossRef]
- Shen, H.; Wen, C.Y. A characteristic space–time conservation element and solution element method for conservation laws II. Multidimensional extension. J. Comput. Phys. 2016, 305, 775–792. [Google Scholar] [CrossRef]
- Shen, H.; Parsani, M. Positivity-preserving CE/SE schemes for solving the compressible Euler and Navier–Stokes equations on hybrid unstructured meshes. Comput. Phys. Commun. 2018, 232, 165–176. [Google Scholar] [CrossRef]
- Shi, L.; Uy, K.C.K.; Wen, C.Y. The re-initiation mechanism of detonation diffraction in a weakly unstable gaseous mixture. J. Fluid Mech. 2020, 895, A24. [Google Scholar] [CrossRef]
- Shi, L.; Shen, H.; Zhang, P.; Zhang, D.; Wen, C. Assessment of vibrational non-equilibrium effect on detonation cell size. Combust. Sci. Technol. 2017, 189, 841–853. [Google Scholar] [CrossRef]
- Uy, K.C.K.; Shi, L.; Wen, C.Y. Numerical analysis of the vibration-chemistry coupling effect on one-dimensional detonation stability. Aerosp. Sci. Technol. 2020, 107, 106327. [Google Scholar] [CrossRef]
- Jiang, C.; Feng, X.; Zhang, J.; Zhong, D. AMR simulations of magnetohydrodynamic problems by the CESE method in curvilinear coordinates. Sol. Phys. 2010, 267, 463–491. [Google Scholar] [CrossRef]
- Fan, E.; Guan, B.; Wen, C.Y.; Shen, H. Numerical study on the jet formation of simple-geometry heavy gas inhomogeneities. Phys. Fluids 2019, 31, 026103. [Google Scholar] [CrossRef]
- Zhang, Z.; Wen, C.; Liu, Y.; Zhang, D.; Jiang, Z. Application of CE/SE method to gas-particle two-phase detonations under an Eulerian-Lagrangian framework. J. Comput. Phys. 2019, 394, 18–40. [Google Scholar] [CrossRef]
- Jourdaine, N.; Tsuboi, N.; Ozawa, K.; Kojima, T.; Hayashi, A.K. Three-dimensional numerical thrust performance analysis of hydrogen fuel mixture rotating detonation engine with aerospike nozzle. Proc. Combust. Inst. 2019, 37, 3443–3451. [Google Scholar] [CrossRef]
- Xia, Z.J.; Luan, M.Y.; Liu, X.Y.; Wang, J.P. Numerical simulation of wave mode transition in rotating detonation engine with OpenFOAM. Int. J. Hydrogen Energy 2020, 45, 19989–19995. [Google Scholar] [CrossRef]
- Teng, H.; Zhou, L.; Yang, P.; Jiang, Z. Numerical investigation of wavelet features in rotating detonations with a two-step induction-reaction model. Int. J. Hydrogen Energy 2020, 45, 4991–5001. [Google Scholar] [CrossRef]
- Ma, F.; Choi, J.Y.; Yang, V. Thrust chamber dynamics and propulsive performance of single-tube pulse detonation engines. J. Propuls. Power 2005, 21, 512–526. [Google Scholar] [CrossRef]
- Harroun, A.J.; Heister, S.D.; Ruf, J.H. Computational and experimental study of nozzle performance for rotating detonation rocket engines. J. Propuls. Power 2021, 37, 660–673. [Google Scholar] [CrossRef]
- Zhdan, S.A.; Bykovskii, F.A.; Vedernikov, E.F. Mathematical modeling of a rotating detonation wave in a hydrogen-oxygen mixture. Combust. Explos. Shock Waves 2007, 43, 449–459. [Google Scholar] [CrossRef]
- Wen, C.Y.; Jiang, Y.; Shi, L. Space–Time Conservation Element and Solution Element Method: Advances and Applications in Engineering Sciences; Springer Nature: Singapore, 2023. [Google Scholar]
- Sow, A.; Chinnayya, A.; Hadjadj, A. On the viscous boundary layer of weakly unstable detonations in narrow channels. Comput. Fluids 2019, 179, 449–458. [Google Scholar] [CrossRef]
- Lin, W.; Shi, Q.; Liu, S.; Lin, Z.; Tong, Y.; Su, L.; Nie, W. Study of thrust vector control for the rotating detonation model engine. Int. J. Hydrogen Energy 2022, 47, 1292–1305. [Google Scholar] [CrossRef]
- Nakayama, H.; Moriya, T.; Kasahara, J.; Matsuo, A.; Sasamoto, Y.; Funaki, I. Stable detonation wave propagation in rectangular-cross-section curved channels. Combust. Flame 2012, 159, 859–869. [Google Scholar] [CrossRef]
- Nakayama, H.; Kasahara, J.; Matsuo, A.; Funaki, I. Front shock behavior of stable curved detonation waves in rectangular-cross-section curved channels. Proc. Combust. Inst. 2013, 34, 1939–1947. [Google Scholar] [CrossRef]
- Zhang, Y.; Sheng, Z.; Rong, G.; Shen, D.; Wu, K.; Wang, J. Experimental research on the performance of hollow and annular rotating detonation engines with nozzles. Appl. Therm. Eng. 2023, 218, 119339. [Google Scholar] [CrossRef]
- Houim, R.W.; Fievisohn, R.T. The influence of acoustic impedance on gaseous layered detonations bounded by an inert gas. Combust. Flame 2017, 179, 185–198. [Google Scholar] [CrossRef]
- Wen, H.; Fan, W.; Wang, B. Theoretical analysis on the total pressure gain of rotating detonation systems. Combust. Flame 2023, 248, 112582. [Google Scholar] [CrossRef]
- Schwer, D.; Kailasanath, K. Feedback into mixture plenums in rotating detonation engines. In Proceedings of the 50th AIAA Aerospace Sciences Meeting Including the New Horizons Forum and Aerospace Exposition, Nashville, TN, USA, 9–12 January 2012; p. 617. [Google Scholar]
- She-Ming Lau-Chapdelaine, S.; Radulescu, M.I.; Hong, Z. Quasi-Two-Dimensional Simulation of a Rotating Detonation Engine Combustor and Injector. J. Propuls. Power 2023, 1–8. [Google Scholar] [CrossRef]
- Baratta, A.R.; Stout, J. Demonstrated Low Pressure Loss Inlet and Low Equivalence Ratio Operation of a Rotating Detonation Engine (RDE) for Power Generation; Technical Report; Aerojet Rocketdyne: Sacramento, CA, USA, 2020. [Google Scholar]
- Paxson, D.E.; Schwer, D.A. Operational stability limits in rotating detonation engine numerical simulations. In Proceedings of the AIAA Scitech 2019 Forum, San Diego, CA, USA, 7–11 January 2019; p. 0748. [Google Scholar]
- Li, W.; Ren, Y.X.; Lei, G.; Luo, H. The multi-dimensional limiters for solving hyperbolic conservation laws on unstructured grids. J. Comput. Phys. 2011, 230, 7775–7795. [Google Scholar] [CrossRef]
- Zhang, X.; Shu, C.W. On positivity-preserving high order discontinuous Galerkin schemes for compressible Euler equations on rectangular meshes. J. Comput. Phys. 2010, 229, 8918–8934. [Google Scholar] [CrossRef]
- Sedov, L.I. Similarity and Dimensional Methods in Mechanics; CRC Press: Boca Raton, FL, USA, 2018. [Google Scholar]


| w (mm) | p0 (atm) | (mm) | |
|---|---|---|---|
| 1 | 10 | 0.2 | 0.5, 0.4, 0.4 |
| 1 | 10 | 0.2 | 0.2, 0.2, 0.2 |
| 1 | 10 | 0.2 | 0.1, 0.1, 0.1 |
| w (mm) | (mm) | Inj Loc | (atm) | ||
|---|---|---|---|---|---|
| 1, 3, 6, 9 | same as w | Full | 1 | 10 | 0.2 |
| 6 | 3 | Outer | 0.5441 | 10 | 0.2 |
| 9 | 3 | Outer | 0.3978 | 10 | 0.2 |
| w (mm) | Inj Loc | (atm) | ||
|---|---|---|---|---|
| 9 | 0.33∼0.75 | Outer | 10 | 0.2 |
| 9 | 0.33∼0.75 | Middle | 10 | 0.2 |
| 9 | 0.33∼0.75 | Inner | 10 | 0.2 |
| w (mm) | Inj Loc | (atm) | ||
|---|---|---|---|---|
| 9 | 0.33∼1 | Outer | 10 | 0.2 |
| 9 | 0.33∼1 | Outer | 20 | 0.2 |
| 9 | 0.33∼1 | Outer | 10 | 0.1 |
| w (mm) | Isp ± SD (s) | F ± SD (N) | Vo ± SD (m/s) | Vi ± SD (m/s) |
|---|---|---|---|---|
| 1 | 147.4 ± 0.78 | 59.7 ± 0.18 | 1975.43 ± 0.34 | 1876.66 ± 0.33 |
| 3 | 147.2 ± 0.38 | 169.1 ± 0.22 | 2066.44 ± 1.08 | 1756.4 ± 0.92 |
| 6 | 148.9 ± 0.32 | 315.5 ± 0.33 | 2374.99 ± 6.07 | 1662.4 ± 4.25 |
| 9 | 151 ± 0.9 | 439.7 ± 0.62 | 2960.41 ± 8.23 | 1628.23 ± 4.52 |
Disclaimer/Publisher’s Note: The statements, opinions and data contained in all publications are solely those of the individual author(s) and contributor(s) and not of MDPI and/or the editor(s). MDPI and/or the editor(s) disclaim responsibility for any injury to people or property resulting from any ideas, methods, instructions or products referred to in the content. |
© 2023 by the authors. Licensee MDPI, Basel, Switzerland. This article is an open access article distributed under the terms and conditions of the Creative Commons Attribution (CC BY) license (https://creativecommons.org/licenses/by/4.0/).
Share and Cite
Shi, L.; Fan, E.; Shen, H.; Wen, C.-Y.; Shang, S.; Hu, H. Numerical Study of the Effects of Injection Conditions on Rotating Detonation Engine Propulsive Performance. Aerospace 2023, 10, 879. https://doi.org/10.3390/aerospace10100879
Shi L, Fan E, Shen H, Wen C-Y, Shang S, Hu H. Numerical Study of the Effects of Injection Conditions on Rotating Detonation Engine Propulsive Performance. Aerospace. 2023; 10(10):879. https://doi.org/10.3390/aerospace10100879
Chicago/Turabian StyleShi, Lisong, E Fan, Hua Shen, Chih-Yung Wen, Shuai Shang, and Hongbo Hu. 2023. "Numerical Study of the Effects of Injection Conditions on Rotating Detonation Engine Propulsive Performance" Aerospace 10, no. 10: 879. https://doi.org/10.3390/aerospace10100879