Article

Numerical Study of Combustion and Emission Characteristics for Hydrogen Mixed Fuel in the Methane-Fueled Gas Turbine Combustor

School of Energy and Power Engineering, Beihang University, Beijing 100191, China
*
Author to whom correspondence should be addressed.
Aerospace 2023, 10(1), 72; https://doi.org/10.3390/aerospace10010072
Submission received: 24 November 2022 / Revised: 5 January 2023 / Accepted: 7 January 2023 / Published: 10 January 2023
(This article belongs to the Section Aeronautics)

Abstract

:
The aeroderivative gas turbine is widely used as it demonstrates many advantages. Adding hydrogen to natural gas fuels can improve the performance of combustion. Following this, the effects of hydrogen enrichment on combustion characteristics were analyzed in an aeroderivative gas turbine combustor using CFD simulations. The numerical model was validated with experimental results. The conditions of the constant mass flow rate and the constant energy input were studied. The results indicate that adding hydrogen reduced the fuel residues significantly (fuel mass at the combustion chamber outlet was reduced up to 60.9%). In addition, the discharge of C2H2 and other pollutants was reduced. Increasing the volume fraction of hydrogen in the fuel also reduced CO emissions at the constant energy input while increasing CO emissions at the constant fuel mass flow rate. An excess in the volume fraction of added hydrogen changed the combustion mode in the combustion chamber, resulting in fuel-rich combustion (at constant mass flow rate) and diffusion combustion (at constant input power). Hydrogen addition increased the pattern factor and NOx emissions at the outlet of the combustion chamber.

1. Introduction

Energy shortage and increasingly stringent emission regulations have attracted increasing attention. Studies on improving thermal efficiency and reducing pollutant emissions have become the focus for combustion and power equipment [1,2,3]. Aeroengine design concepts are similar to aeroderivative gas turbines [4,5]. Aeroderivative gas turbines can utilize a variety of fuels or a mixture of fuels [6,7]. Patrik et al. [8] analyzed the prospects of fuel flexibility in Europe. Ino [9] also investigated Japan’s energy structure and gas turbine fuel flexibility. LM2500, as a widely used aeroderivative gas turbine, accumulates a larger commercial operation time. Neilson et al. [10] studied the suitability of fuel on GE LM2500 series fuel engines.
Natural gas contains very low aromatic hydrocarbons and sulfur. Its combustion produces lower soot emissions than gasoline and diesel because of its simple chemical structure and the absence of fuel evaporation problems. The primary reason is the low C/H ratio of natural gas. Hence, it is one of the most promising alternatives as well as the cleanest fuel in combustion [11]. However, as the main component of natural gas, methane has a unique tetrahedral molecular structure and large C-H bond energy. Therefore, it exhibits some unique combustion characteristics, such as high ignition temperature and low flame propagation speed, resulting in slow combustion speed and poor lean combustion ability, leading to incomplete combustion [12]. An effective solution to this problem is to mix natural gas with fuels with high combustion rates, such as hydrogen [13]. However, mixing natural gas with hydrogen can affect the infrastructure and pipelines. Gondal [14] studied the influence of hydrogen doping on the infrastructure and quality of natural gas and obtained an allowable limit of hydrogen doping, which is 10%. Judd et al. [15] observed that the best mixing ratio of H2 is 12%, considering the operation of the natural gas system. Suez [16] from the “GRHYD” project noted that the gas pipeline system could operate stably when the mixing ratio is 6–20%.
In studying the combustion performance of the mixed fuel, Emadi [17] and Schefer [18,19] reported that adding hydrogen significantly changed the flame structure and improved the flame stability limit. Different conclusions have been reported on the combustion performance of hydrogen blending under different flame and terminal equipment controlling constant energy input. Lamioni [20] found the downstream temperature decreases when adding H2 to natural gas. This behavior has a positive impact on pollutant emissions. Furthermore, the effect of pressure on lean methane-air premixed flames has been investigated [21]. Patel et al. [22] showed that hydrogen doping shortens the swirl flame length, reduces CO emissions, and increases NOx emissions. Shih et al. [23] illustrated that hydrogen doping could enhance the combustion stability of micro flue gas turbines, reduce the combustion temperature and NOx emissions, and make the flame wider and shorter. However, it significantly increases CO emissions and reduces combustion efficiency. Rajpara et al. [24] conducted hydrogen doping experiments and simulation studies on the self-designed gas turbine combustor. They reported that the flame is relatively wider and shorter at higher hydrogen concentrations. Hydrogen doping increases flame speed, temperature, and chemical reaction rate and reduces CO emission, but the increase in flame temperature leads to the problem of increased NOx emission.
The combustion performance of different thermal equipment is also distinct under a constant volumetric flow rate of fuel mixed with hydrogen. Meziane et al. [25] studied the influence of natural gas mixed with hydrogen fuel on the combustion performance and pollutant emissions of tank burners. The results showed that adding 10% hydrogen to natural gas reduced CO and NOx emissions by about 60% and 14%, respectively. However, the reduction in average outlet temperature reduced the output power of the micro gas turbine. Shih et al. [23] observed that hydrogen doping increases the flame temperature and decreases the heat load of the combustion chamber. Rajpara et al. [24] noted that hydrogen doping increases the flame temperature of the gas turbine combustion chamber, reduces the flame size, reduces CO emissions, and slightly increases NOx emissions. In the non-premixed burner used by Cozzi and Coghe [25], higher soot formation was observed, and CO and NOx emissions increased with the hydrogen content in the fuel.
The geometrical design of combustion chambers, upstream and downstream boundary conditions, fuel injection, and mixing of fuel and air affect gas turbine performance, efficiency, and fuel consumption. Established energy companies such as Siemens, GE, and Mitsubishi have investigated the premixing structure of swirlers in mixing fuel and air [26,27,28]. Jiang et al. [29] numerically investigated the effects of trapezoidal lobe strut on fuel mixing. Sun et al. [30] conducted a comparative study to improve the mixing efficiency of hydrogen fuels introduced through backward steps under supersonic flow conditions. The results showed that the mixing efficiency could be increased by 15% by increasing the step height. Wang et al. [31] studied the effect of mixing enhancement of lobed nozzles on high-pressure differential mixed flow. Zhang et al. [32] reported that using coaxial air and fuel jets in supersonic cross-flow can improve the mixing performance of the combustion chamber. Using simulation, Gerdroodbary et al. [33] showed that hydrogen mixing in a multi-jet and supersonic flow could be enhanced by spraying inclined supersonic flow.
Based on the above, the methane-fueled gas turbine has been widely used. However, the slow-burning rate of natural gas results in many problems. Mixing a small amount of hydrogen into natural gas improves the combustion performance of methane-fueled gas turbines and, hence, could be considered for large-scale application of hydrogen. Although intense research is directed toward the combustion characteristics of hydrogen/natural gas mixtures, most studies have been carried out in a cannular combustor or a simplified combustion chamber. Many unknown problems exist when using a hydrogen/methane mixture, especially in a real annular aeroderivative gas turbine combustor. In this study, a 2.5 MW concentric staged low-pollution combustor was numerically simulated under constant fuel mass flow and energy input. The effects of hydrogen volume fraction of 0–80% in the fuel on the combustion characteristics and emission performance were analyzed.

2. Materials and Methods

This section introduces the basic equations and theories used in numerical calculation, the geometric model of the numerical calculation, the mesh generation method, the mesh independence, and the method verification and calculation process.

2.1. Numerical Model

2.1.1. Governing Equations

Comprehensively considering the calculation accuracy and computational cost, the three-dimensional Reynolds-averaged Navier–Stokes (RANS) equations were employed as the governing equations using the commercial CFD software ANSYS Fluent 2020 in this paper. The governing equations are as follows:
ρ t + x j ( ρ u j ) = S m
t ( ρ u i ) + x j ( ρ u i u j ) = x j ( δ i j P + τ i j ) + F i + S u i
t ( ρ h t P ) + x j ( ρ h t u j ) = x j ( q j + τ i j u i ) + u j F j + S h
t ( ρ Y m ) + x j [ ρ Y m u j + ρ Y m V j , m ] = S Y m + ω ˙ m
Equations (1)–(4) are the continuity equation, momentum conservation equation, energy conservation equation, and species conservation equation. The shear stress tensor τ i j in Equation (2) can be expressed as
τ i j = μ ( u i x j + u j x i 2 3 u k x k δ i j )
where δ i j is the Kronecker Delta function, and μ represents the dynamic viscosity coefficient, which can be calculated from a polynomial function of the temperature by the Sutherland formulation:
μ = μ 0 ( T T 0 ) 3 / 2 T 0 + S μ T + S μ
Here, T 0 = 273.15 K, and μ 0 is the reference viscosity coefficient. For air, μ 0 = 1.7161 × 10 5 N·s/m2, S μ = 124.0 K.
The total enthalpy h t in Equation (3) can be expressed as
h t = h + u i u j 2
and the heat flux vector q j can be expressed as
q j = λ T x j + m = 1 N s ρ Y m V j . m h m
where λ is the thermal conductivity, Y m is the mass fraction of the components, and V j . m is the molecular diffusion rate.
The source terms S m , S u i , and S h respectively denote the changes in mass, momentum, and energy between the droplet and gas phases. The source term S Y m represents the rate of creation by addition from the dispersed phase, while the source term ω ˙ m represents the generation rate of the chemical reactions.
The state equation of ideal gas was finally added to solve the above RANS equations:
p = ρ T m = 1 N Y m R u M m
Here, R u = 8.314 J/(mol·K) is the universal gas constant, and M m is the molar mass of component m .

2.1.2. Turbulence Model and Combustion Model

The turbulence model used in this manuscript is the realizable k ε model [34]. The model constants are C 1 ε = 1.44, C 2 = 1.9, σ K = 1.0, and σ ε = 1.2.
The flamelet-generated manifold (FGM) method is adopted as the combustion model. The method can be considered as a combination of two approaches to simplify flame calculations, i.e., a flamelet and a manifold approach. The FGM method shares the idea with flamelet approaches that a multi-dimensional flame may be considered as an ensemble of one-dimensional flames.
The FGM model [35] assumes that the thermochemical states in a turbulent flame are similar to the states in a laminar flame, and parameterize these by mixture fraction and reaction progress. Within the laminar flame, reaction progress increases from the unburnt reactants to the burnt products, over a nonzero flame thickness. A point within the turbulent flame brush has contributions from both fluctuating flame fronts, as well as intermediate reaction progress.
The FGM model assumes that the local state in the flame is a set of canonical flames described by just a few independent variables. These states are stored in look-up tables that are used in the calculation of the flame to be investigated. They are dependent on two independent variables, mixture fraction and progress variable. The FGM model uses a presumed PDF of which the details have been described in this work [36].
The detailed reaction mechanism GRI Mech 3.0 [37] is adopted for numerical calculation. GRI Mech 3.0 is an optimized mechanism used to simulate the combustion of methane and hydrogen, including 53 species and 325 chemical reactions. The model has been widely verified based on the experimental data of oxidation, ignition, flame propagation speed, and flame structure of the laminar flame of hydrogen, methane, and other hydrocarbons and their mixtures.

2.1.3. NOx Model

ANSYS Fluent solves the mass transport equation for the NO species, taking into account convection, diffusion, production, and consumption of NO and related species. This approach is completely general, being derived from the fundamental principle of mass conservation [38]. The effect of residence time in NOx mechanisms (a Lagrangian reference frame concept) is included through the convection terms in the governing equations written in the Eulerian reference frame. In this manuscript, thermal and prompt NOx mechanisms are adopted.
For thermal and prompt NOx mechanisms, only the NO species transport equation is needed:
t ( ρ Y N O ) + ( ρ v Y N O ) = ( ρ D Y N O ) + S N O
where Y N O is mass fraction of NO in the gas phase, and D is the effective diffusion coefficient. The source term S N O is to be determined next for different NOx mechanisms.
The formation of thermal NOx is determined by a set of highly temperature-dependent chemical reactions known as the extended Zeldovich mechanism. The principal reactions governing the formation of thermal NOx from molecular nitrogen are as follows:
O + N 2 N + NO
N + O 2 O + NO
A third reaction has been shown to contribute to the formation of thermal NOx particularly at near stoichiometric conditions and in fuel-rich mixtures:
N + OH H + NO
It is known that during combustion of hydrocarbon fuels, the NOx formation rate can exceed that produced from direct oxidation of nitrogen molecules (that is, thermal NOx). Prompt NOx is most prevalent in rich flames. The actual formation involves a complex series of reactions and many possible intermediate species. The route now accepted is as follows:
CH + N 2 HCN + N
N + O 2 NO + O
HCN + OH CN + H 2 O
CN + O 2 NO + CO
A number of species resulting from fuel fragmentation have been suggested as the source of prompt NOx in hydrocarbon flames (for example, CH, CH2, C, and C2H), but the major contribution is from CH (Equation (14)) and CH2, via
CH 2 + N 2 HCN + NH
The products of these reactions could lead to formation of amines and cyano compounds that subsequently react to form NO by reactions similar to those occurring in oxidation of fuel nitrogen, for example:
HCN + N N 2 +

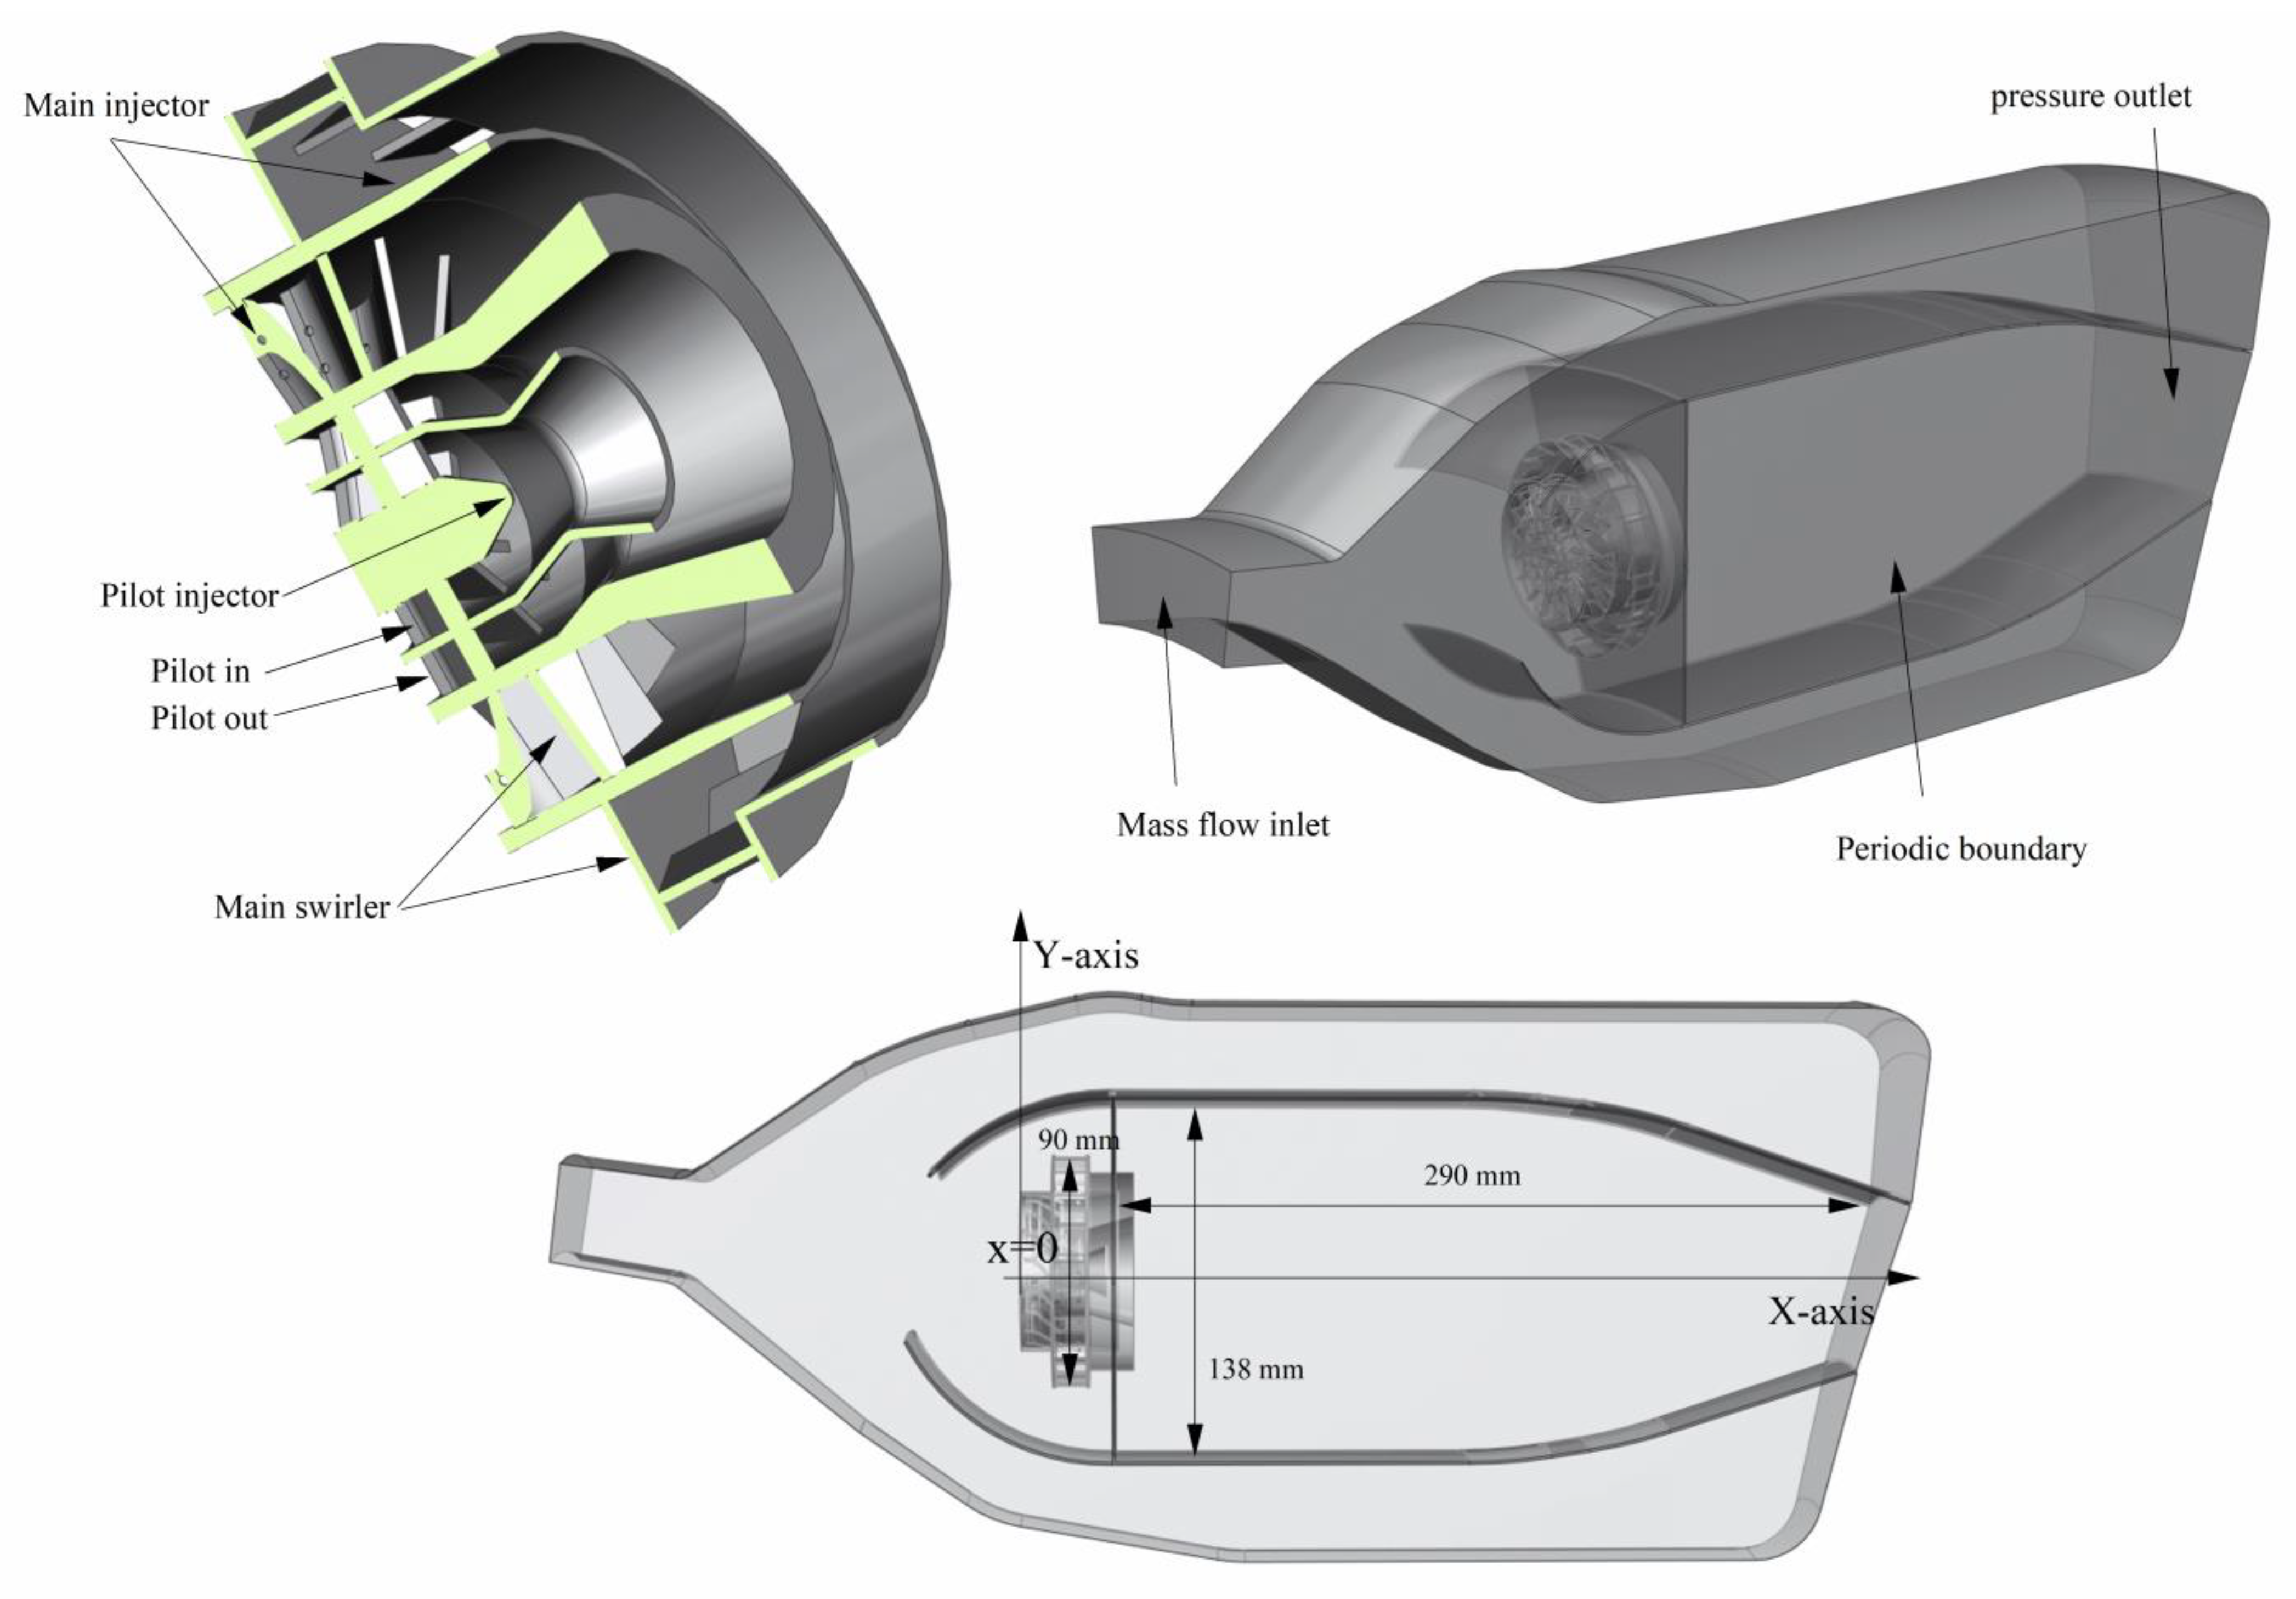
2.2. Numerical Set and Combustor Structure

The combustor is shown in Figure 1. The swirler consists of a three-stage axial swirler and a one-stage radial swirler. The dome comprises the main and pilot stages both mounted concentrically. The main stage composed of the radial swirler and the axial swirler ensures good mixing of fuel and air and lean burn at high power conditions. In the pilot stage, a dual swirler is used to enable rapid fuel–air mixing, reliable ignition compacity, and extending lean blowout limits at low power conditions. Furthermore, to prevent the carbon deposition in the fuel nozzle caused by the flame reverse diffusion, the dual swirling flow is separated by a convergent-divergent venturi.
The maximum volume fraction of hydrogen used was 80%, and the hydrogen mass ratio in the mixed gas was 33%. The effect of hydrogen addition on the fuel characteristics of natural gas turbines was explored. In the two groups, a constant mass flow of fuel and a constant total heat energy input were considered. The following specific working conditions are shown in Table 1: for cases 2–7, a constant fuel mass flow rate, and for cases 8–13, a constant energy input was employed.
Commercial software Fluent 2020R2 was used for the numerical solutions. ANSYS fluent meshing completes the mesh generation, and the Poly-Hexcore mesh generation method was adopted to generate a hexahedral mesh and a polyhedral mesh simultaneously. The minimum mesh quality was higher than 0.45, and the maximum mesh size of other parts was controlled at 0.01 mm. The y+ of the first grid layer in the chamber liner region is about 20 for all cases. In this study, an 18-degree fan-shaped region is chosen, and the interface on both sides is a rotating periodic boundary. The mass flux difference between the inlet and outlet is required to be kept within 0.0001 kg/s. Other boundary conditions can be obtained from Table 2.

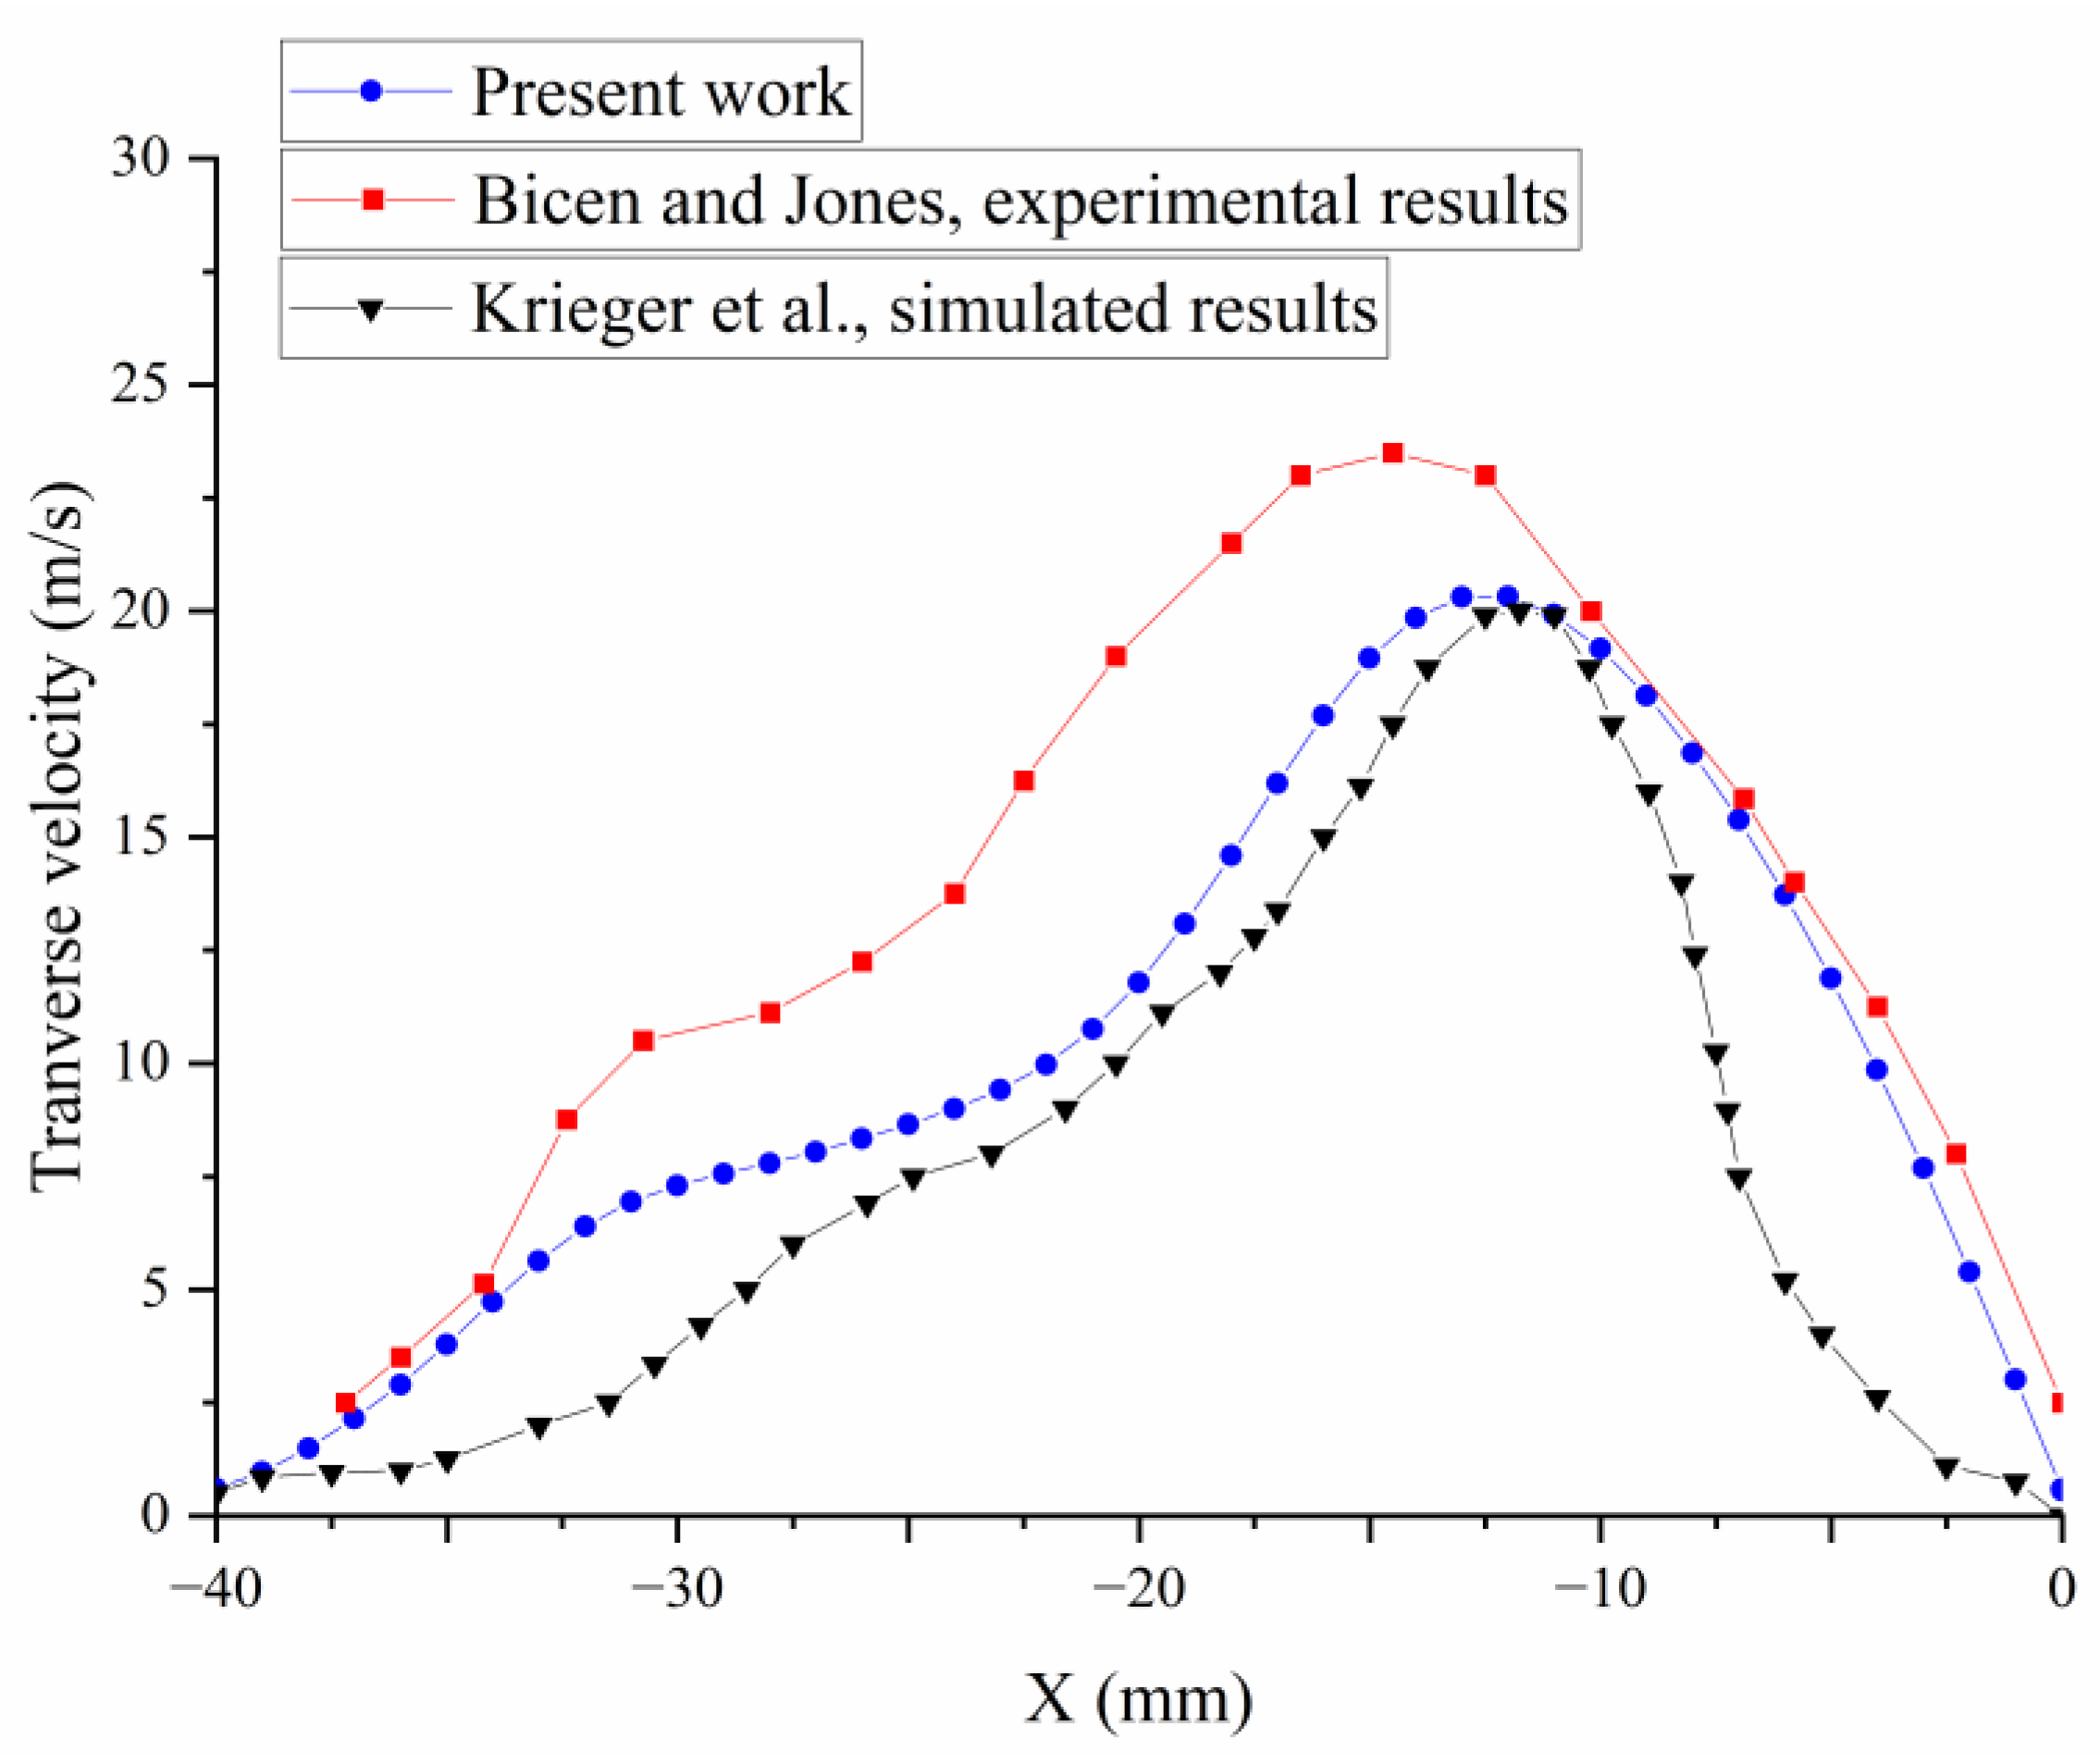
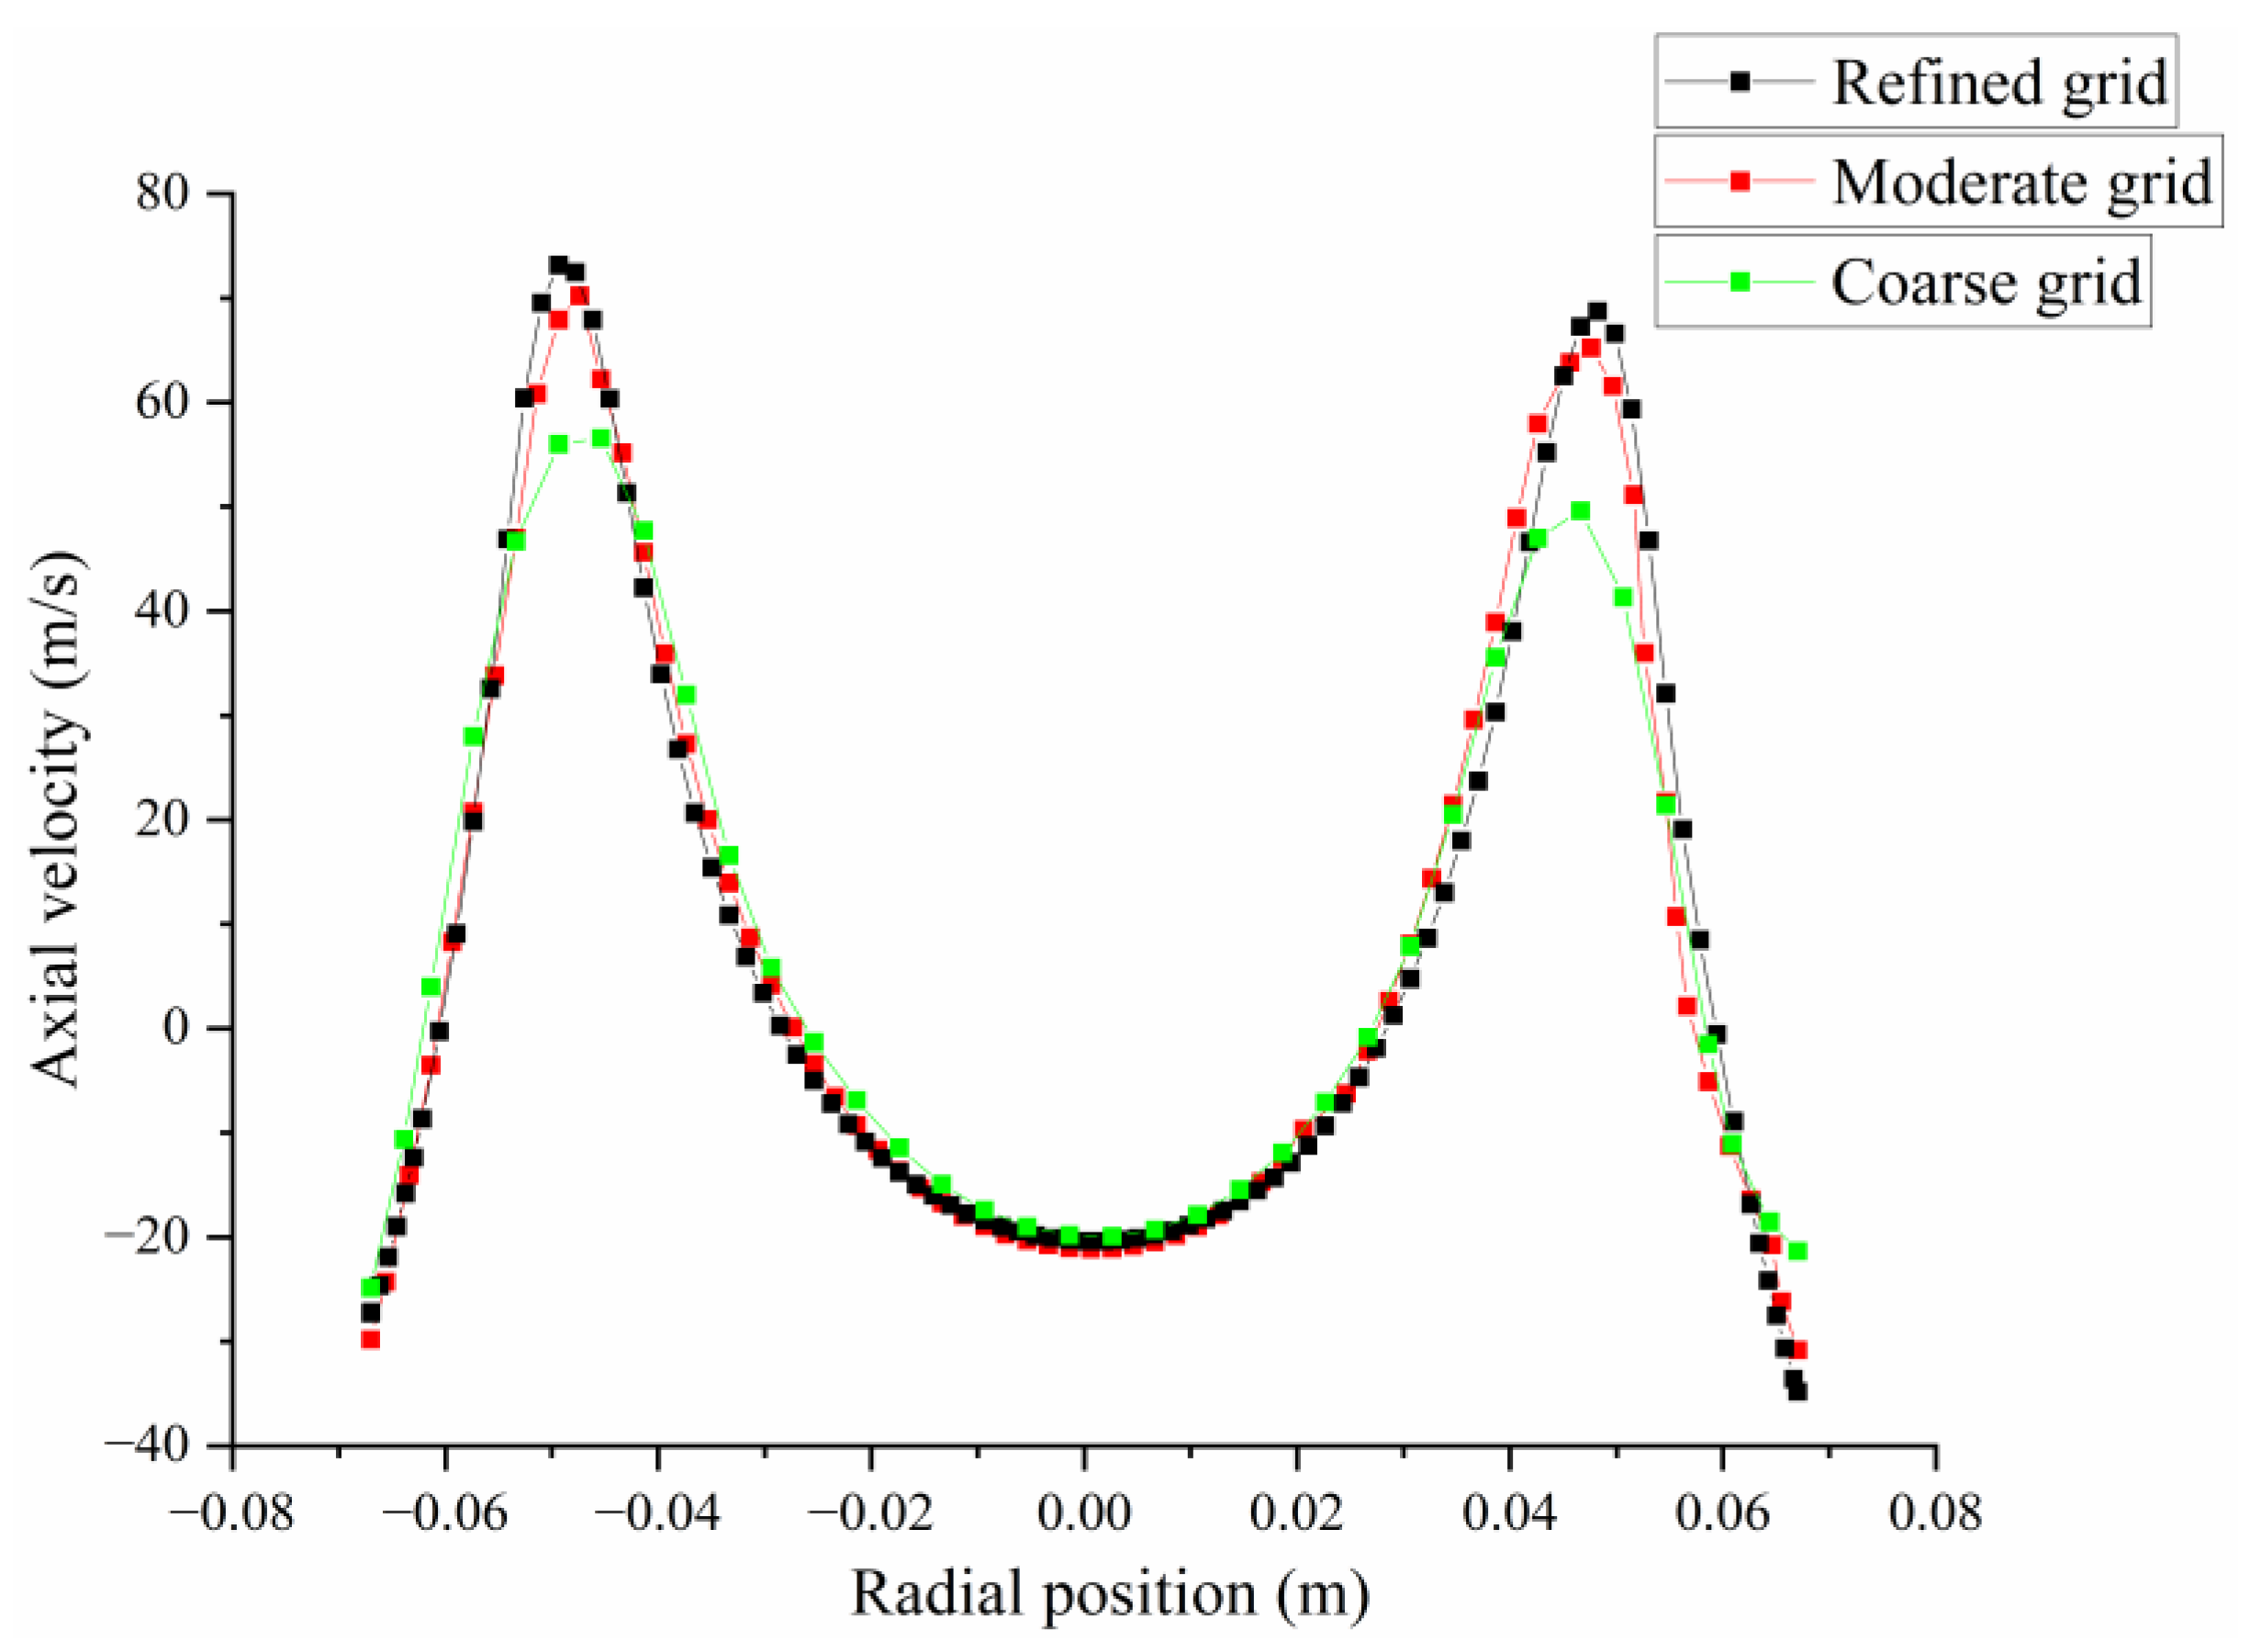
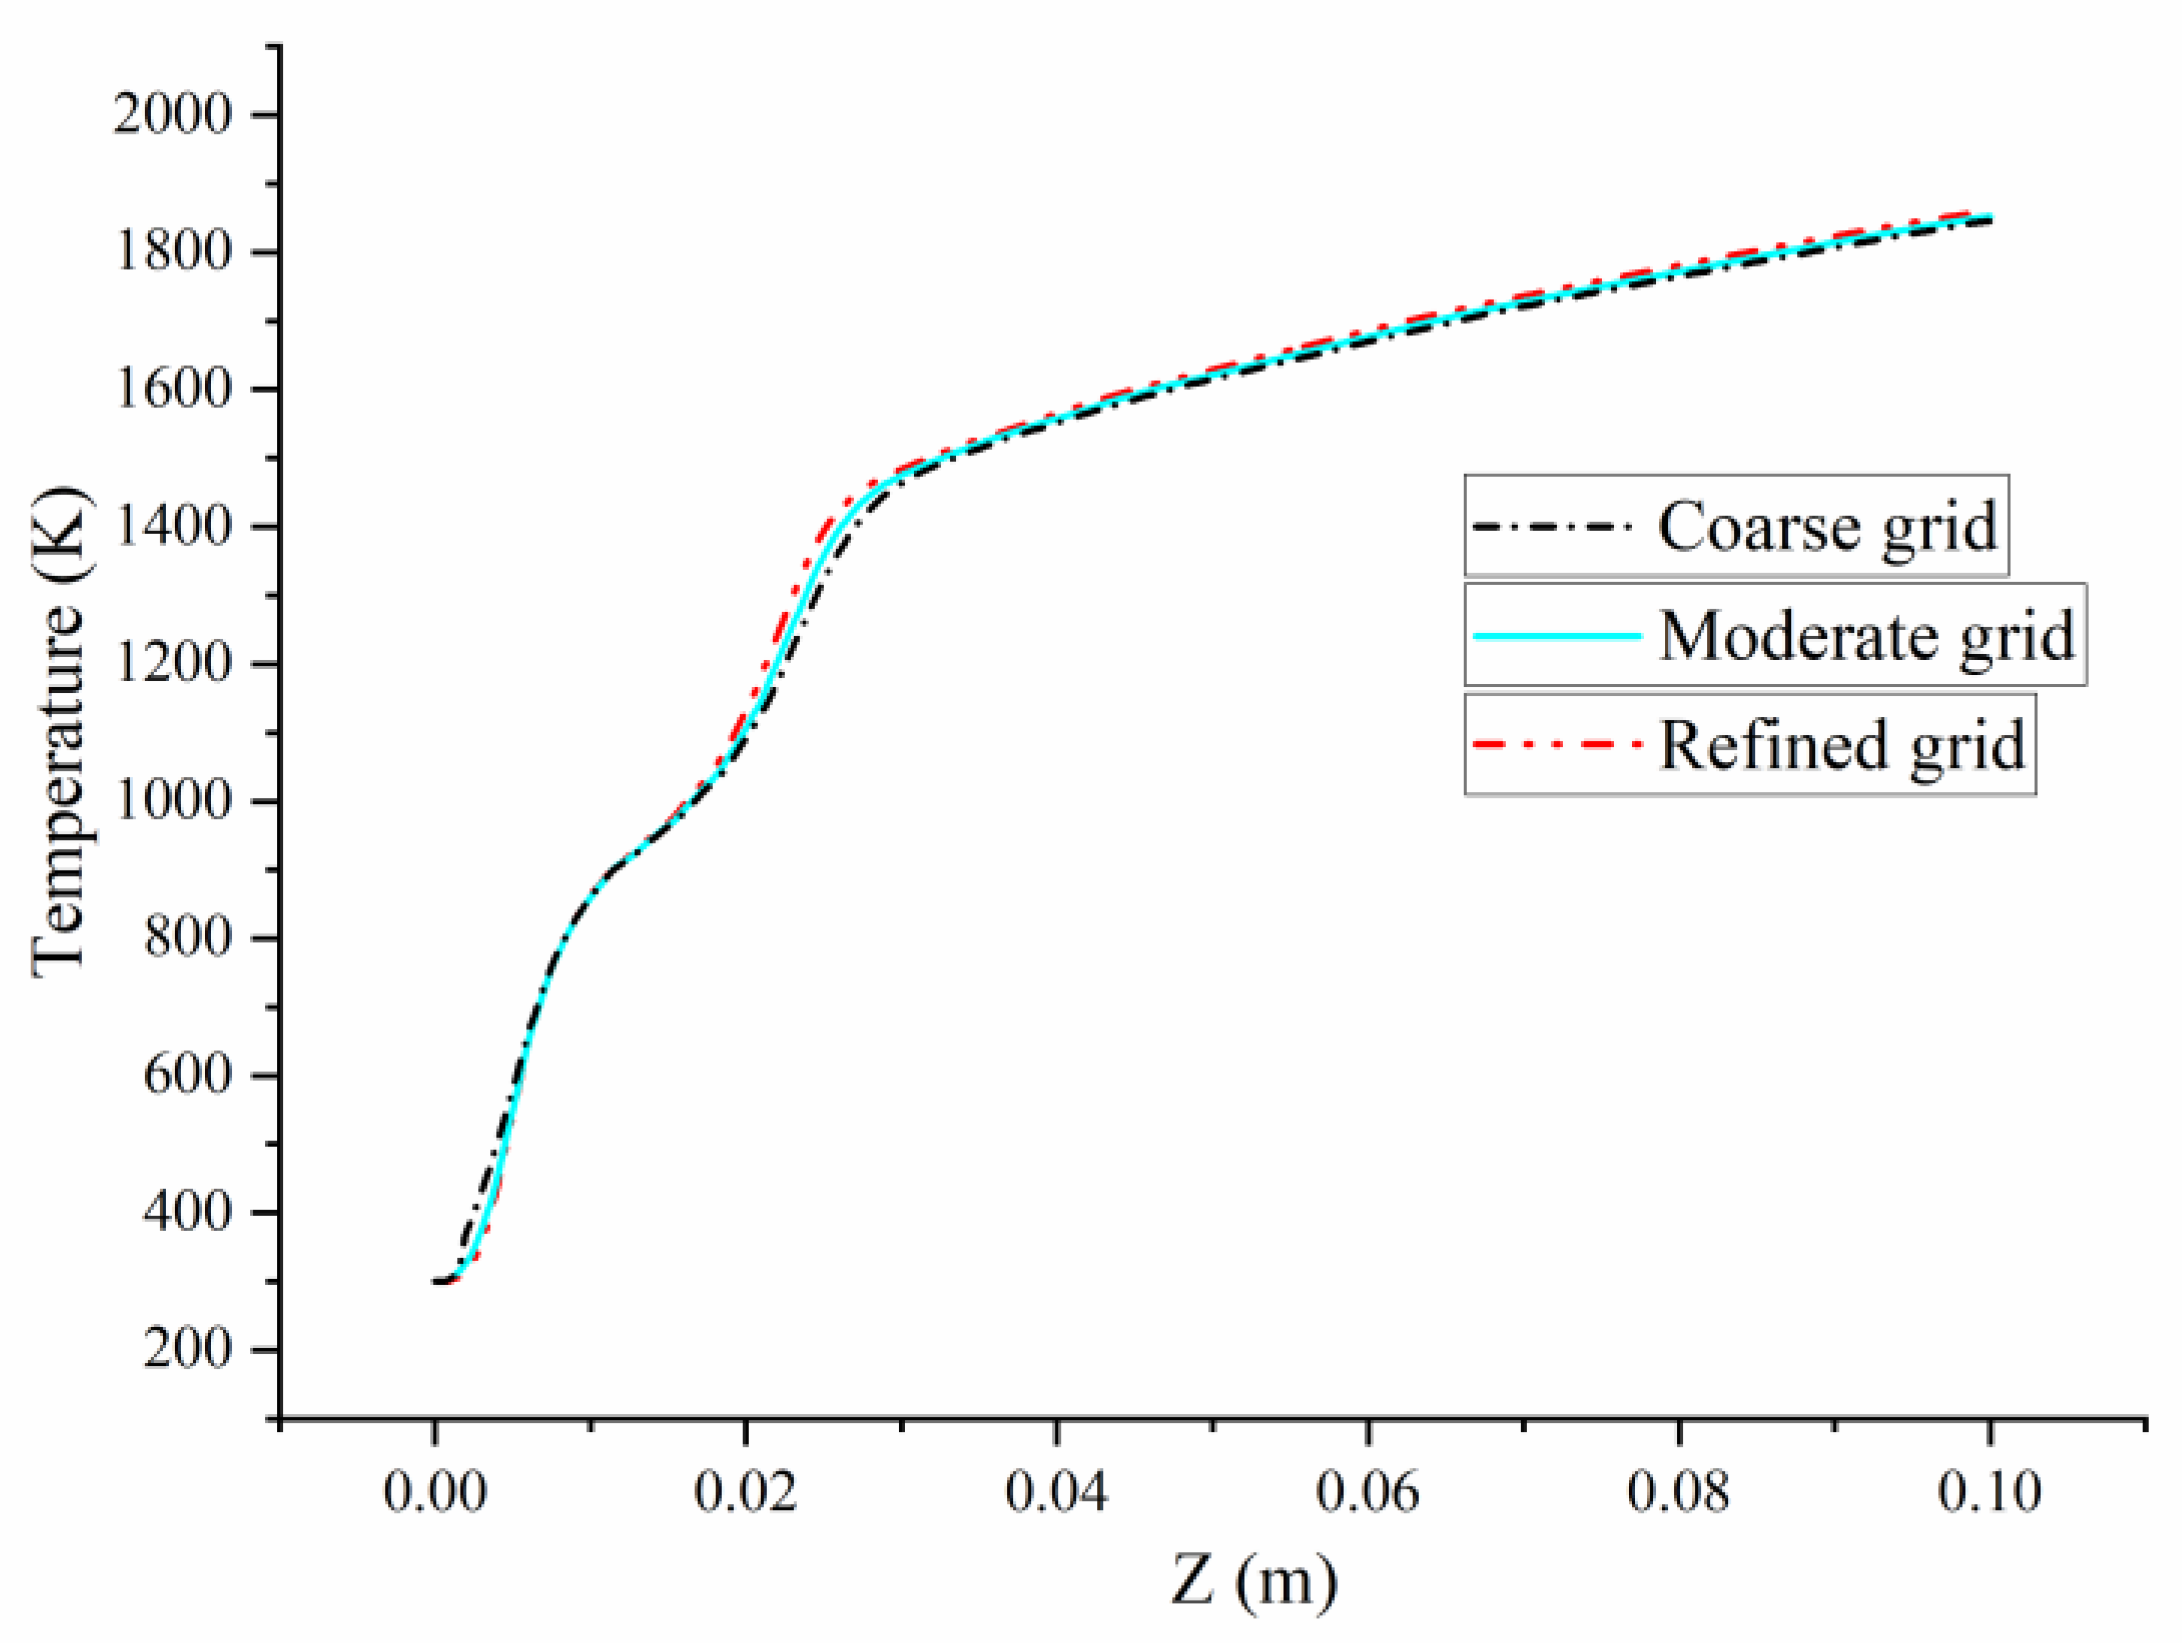
2.3. Numerical Validation

Figure 2 performs the transversal velocity distribution at the position of the dilution hole located at 50 mm in the first row for the isothermal flow, which is consistent with the results of Krieger et al. [39] and Bicen and Jones [40]. The small error in the peak velocity is acceptable. However, the simulation results were better than those of Tamang et al. [41] and Krieger et al. [39]. The present simulation is closer to the experimental results especially at the distance X = 0 to −10 mm. Thus, the numerical method used in this paper is reliable.
To validate the mesh independency, the axial velocity profiles of four cases with different mesh schemes (2 M, 6 M, and 13 M) are shown in Figure 3. Although there are some errors in the prediction of axial velocity under the coarse grid condition, the velocity distributions with the moderate grid and refined grid are almost the same as shown in Figure 3. To validate the mesh independency of the flame structure. The smaller geometries in Ren’s work [36] are used to verify the grid convergence of the flame structure with three different densities of grid (2 M, 6 M and 16 M). The temperature distributions on the central axis are shown in Figure 4. It can be seen that the mesh size has little effect on the flame structure. Hence, the numerical results were supposed to be independent of mesh densities in this paper.

3. Results and Discussion

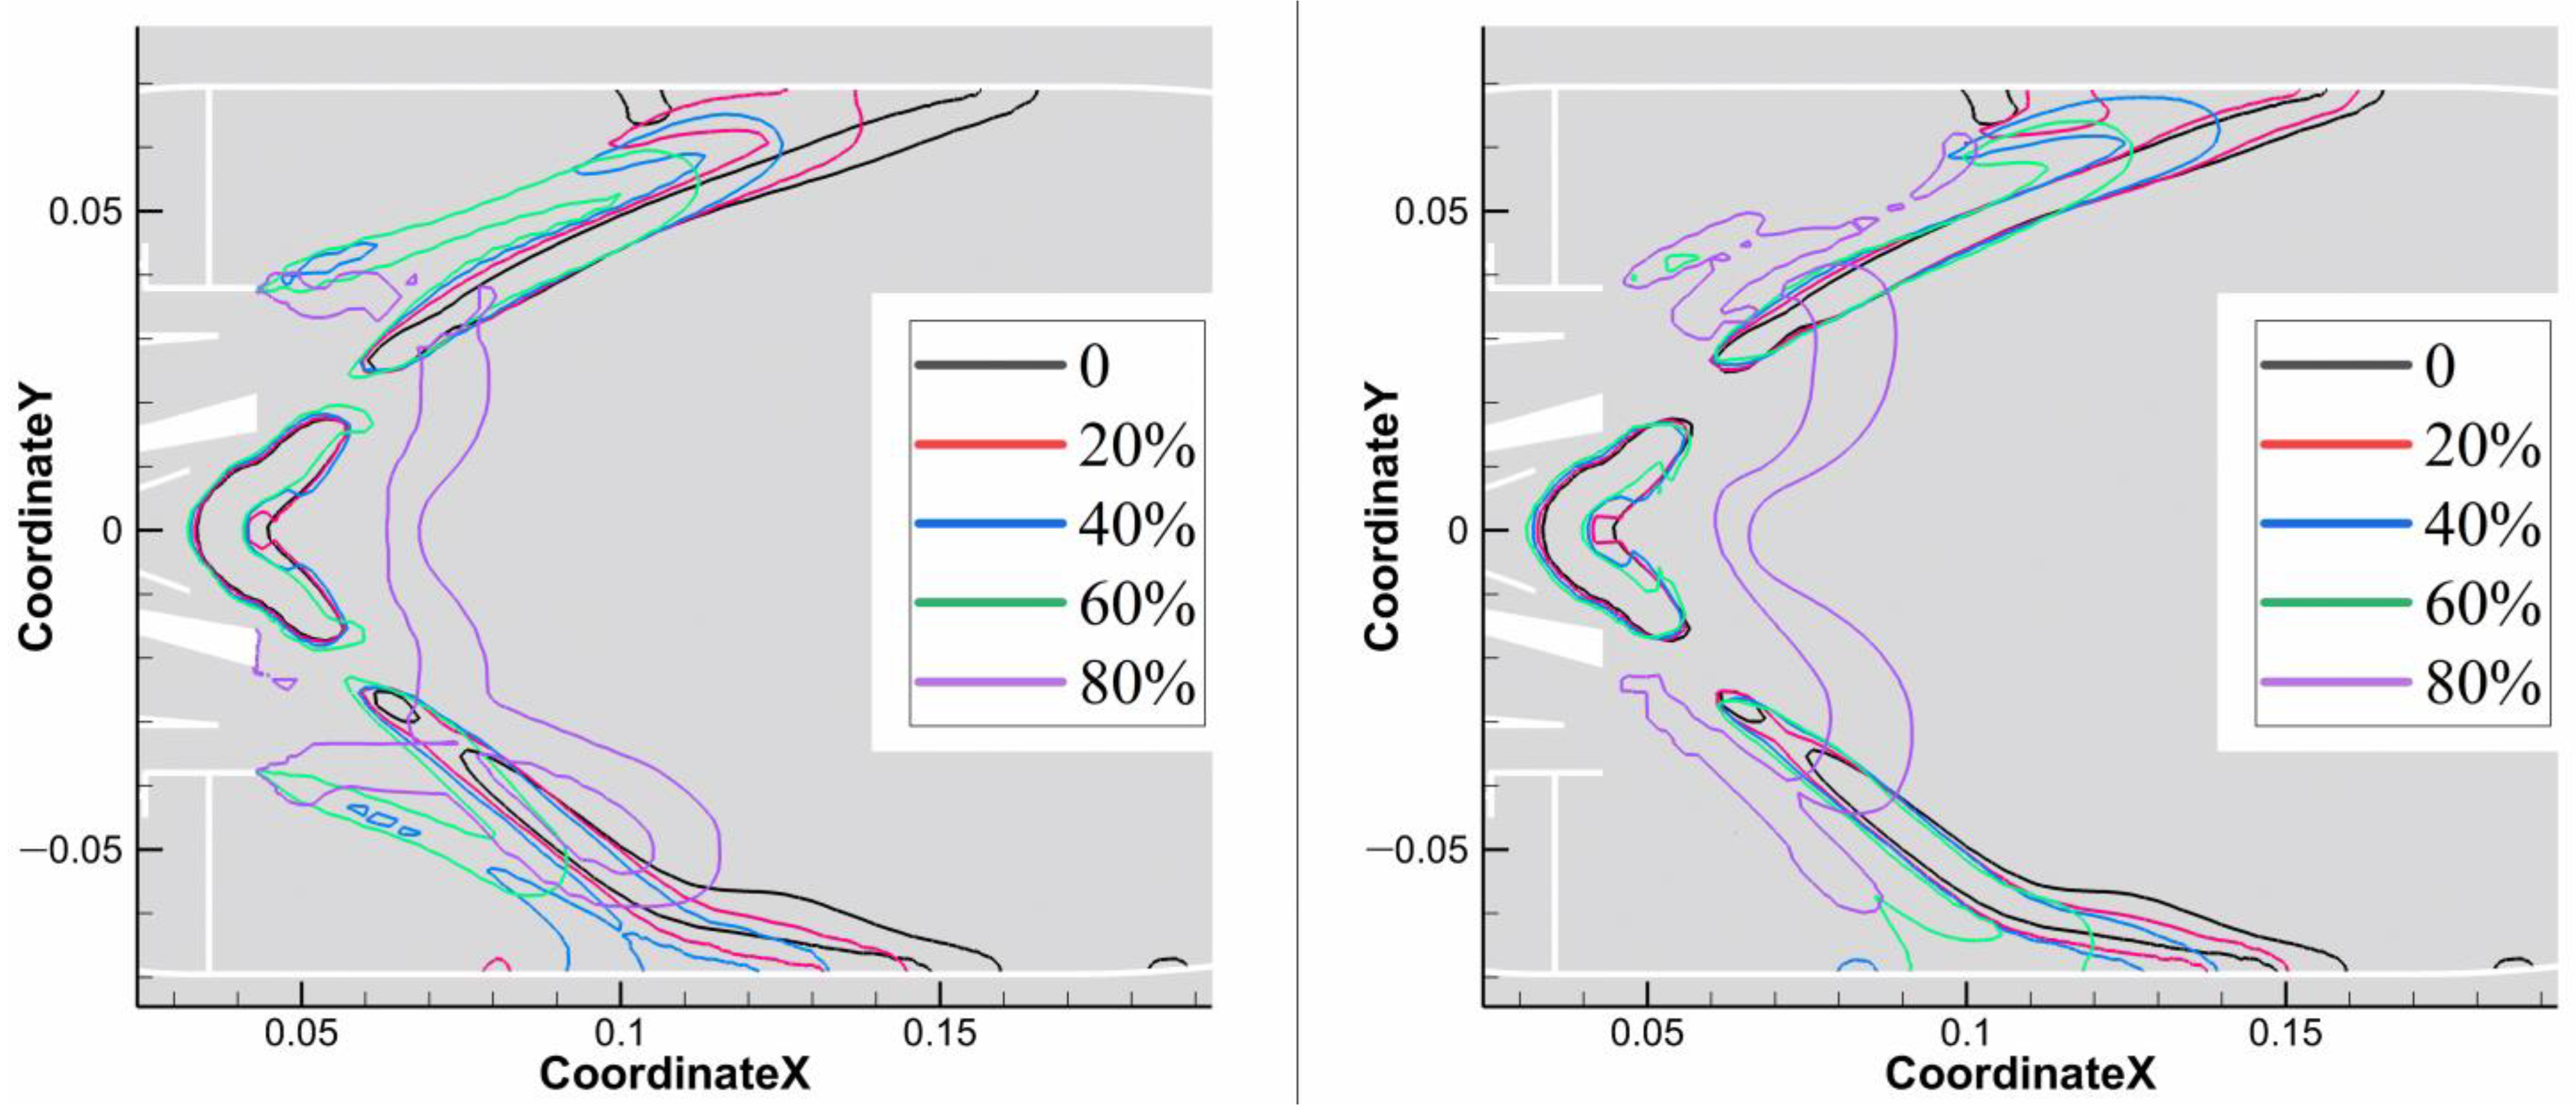
3.1. Velocity Distribution

In both the case of the constant fuel mass flow rate and the constant energy input, it can be seen from Figure 5 that with an increase in the hydrogen volume fraction in the mixed fuel, the axial velocity of the recirculation zone decreases gradually. Moreover, with an increase in the hydrogen volume fraction, the fuel density decreases, so if the nozzle size is not changed at the same mass flow rate, the fuel outlet speed increases.
The velocity distribution along the central axis shows that when the hydrogen volume fraction is 80%, the flow field in the combustion chamber changes greatly. The place where the maximum reverse axial velocity occurs in the extended flow direction is delayed for a certain distance compared with other cases. In addition, the average speed at the outlet gradually increases.

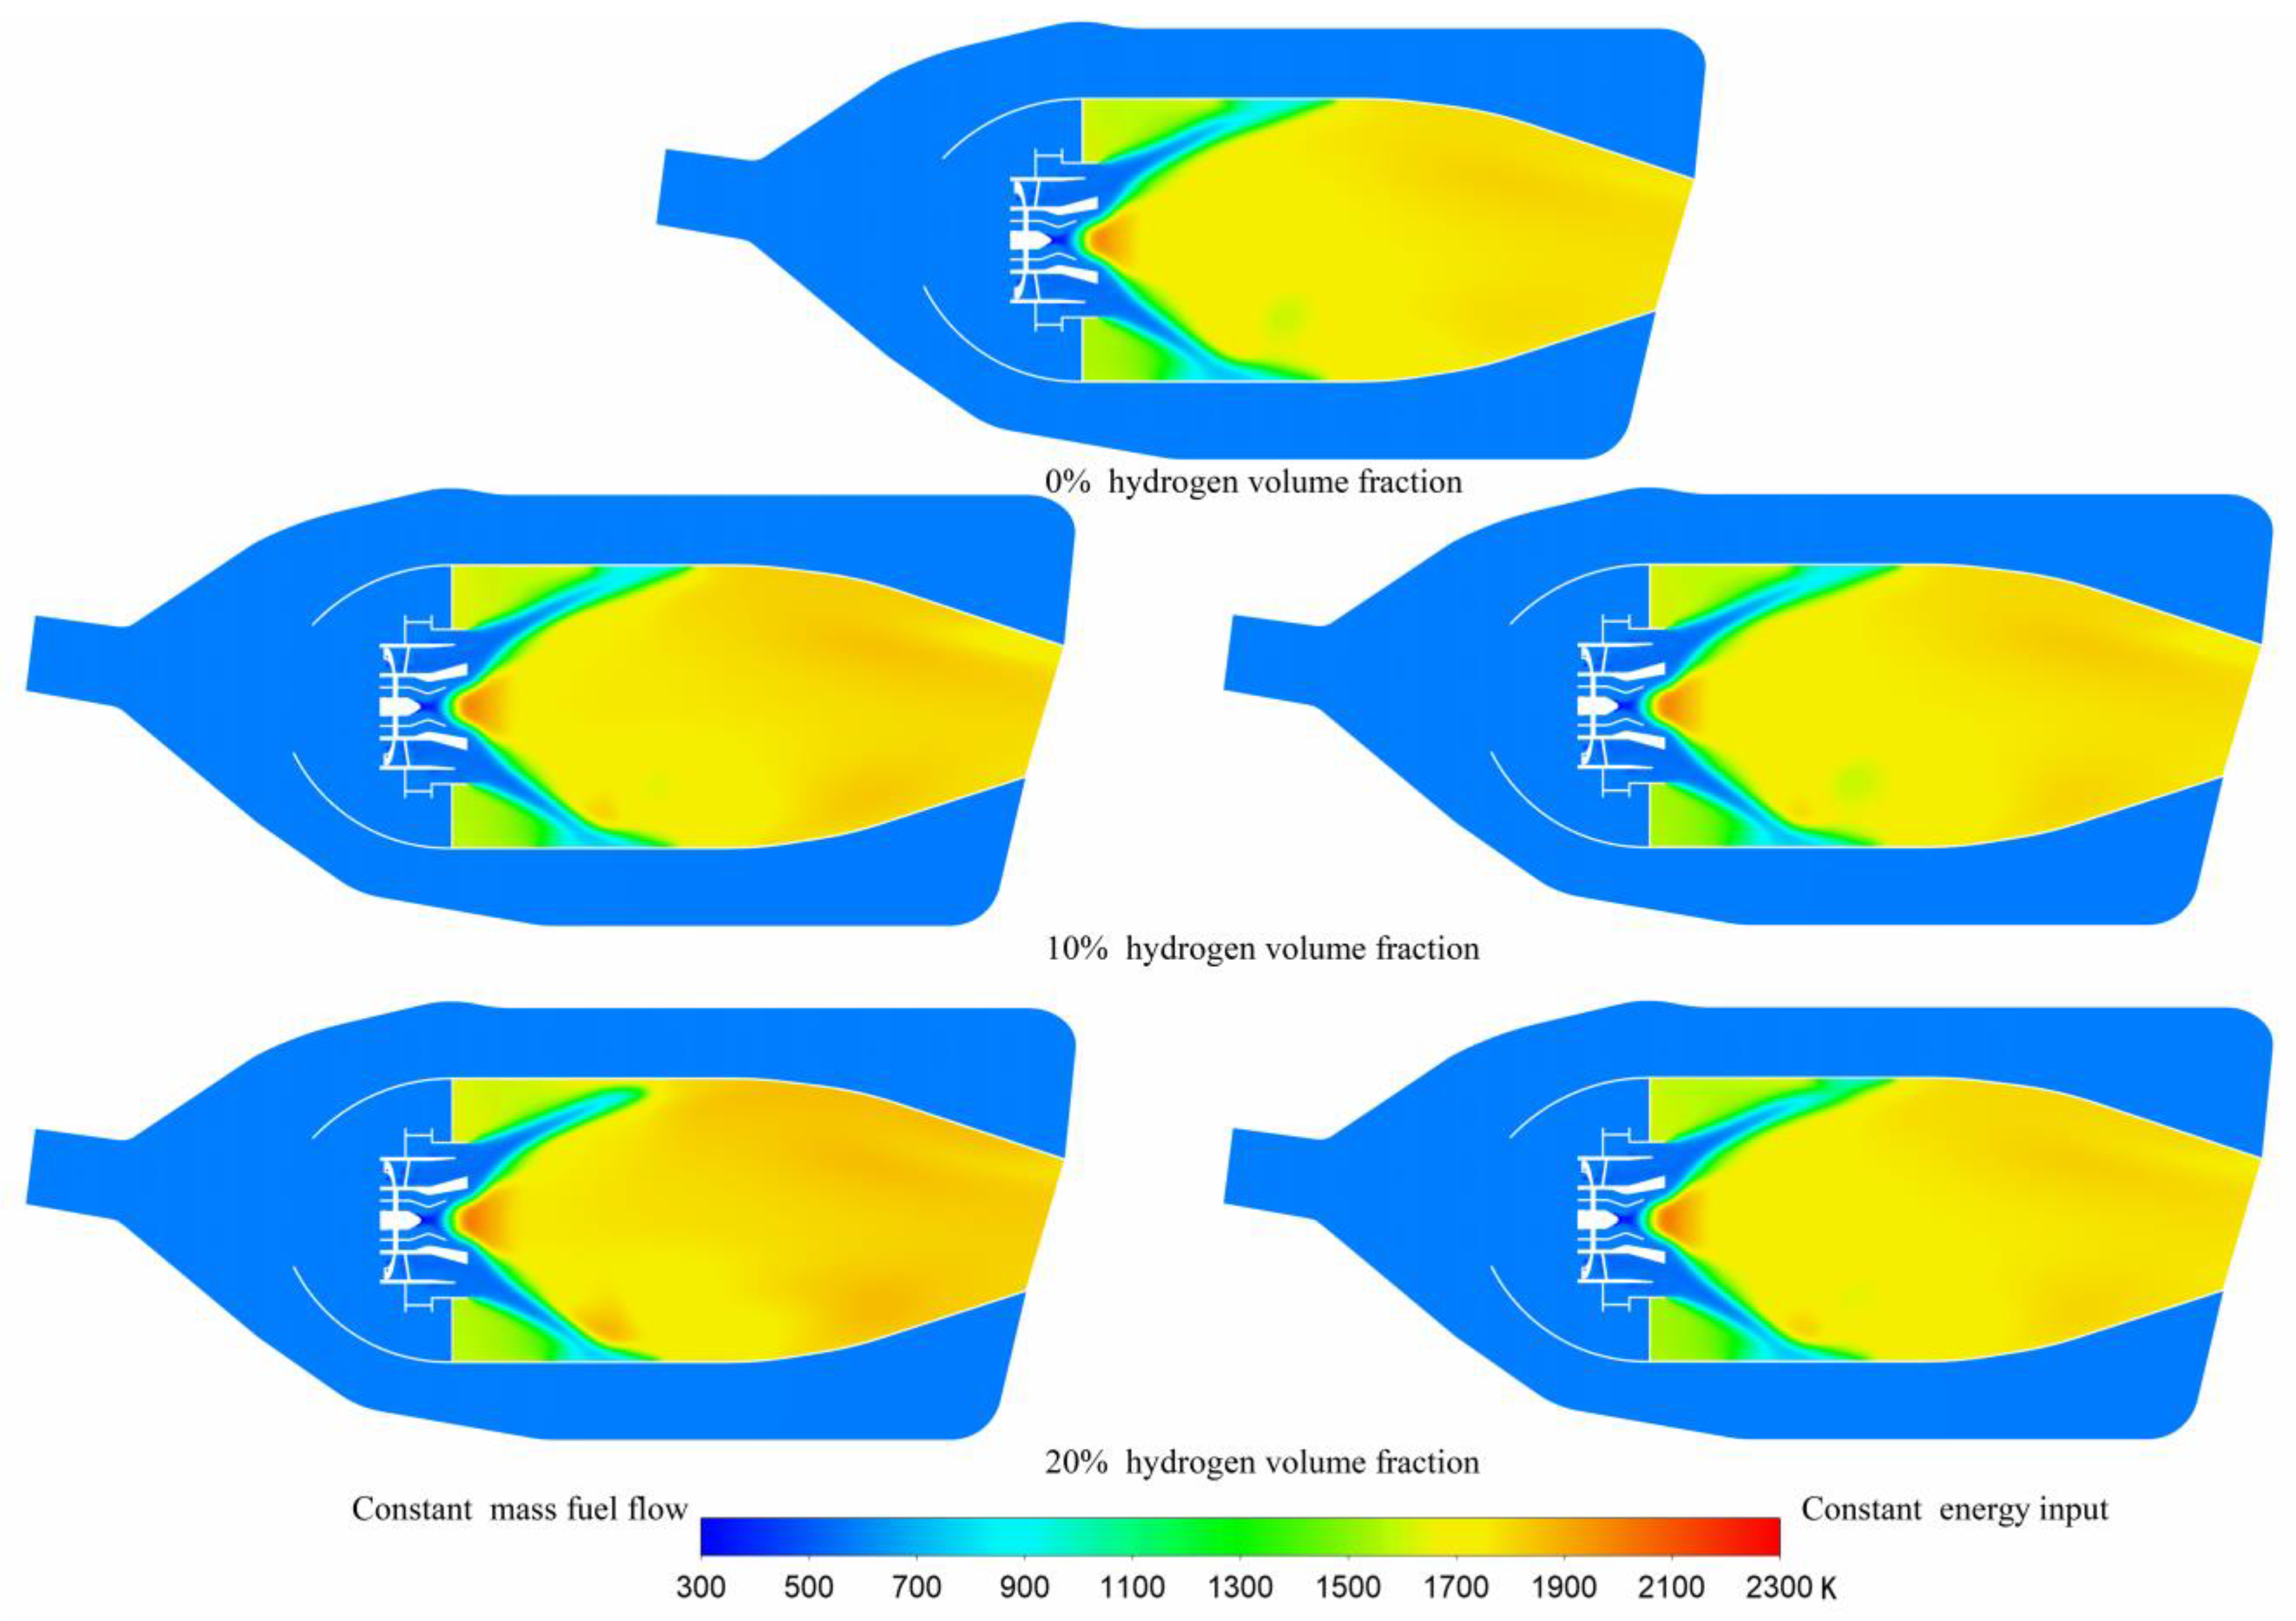
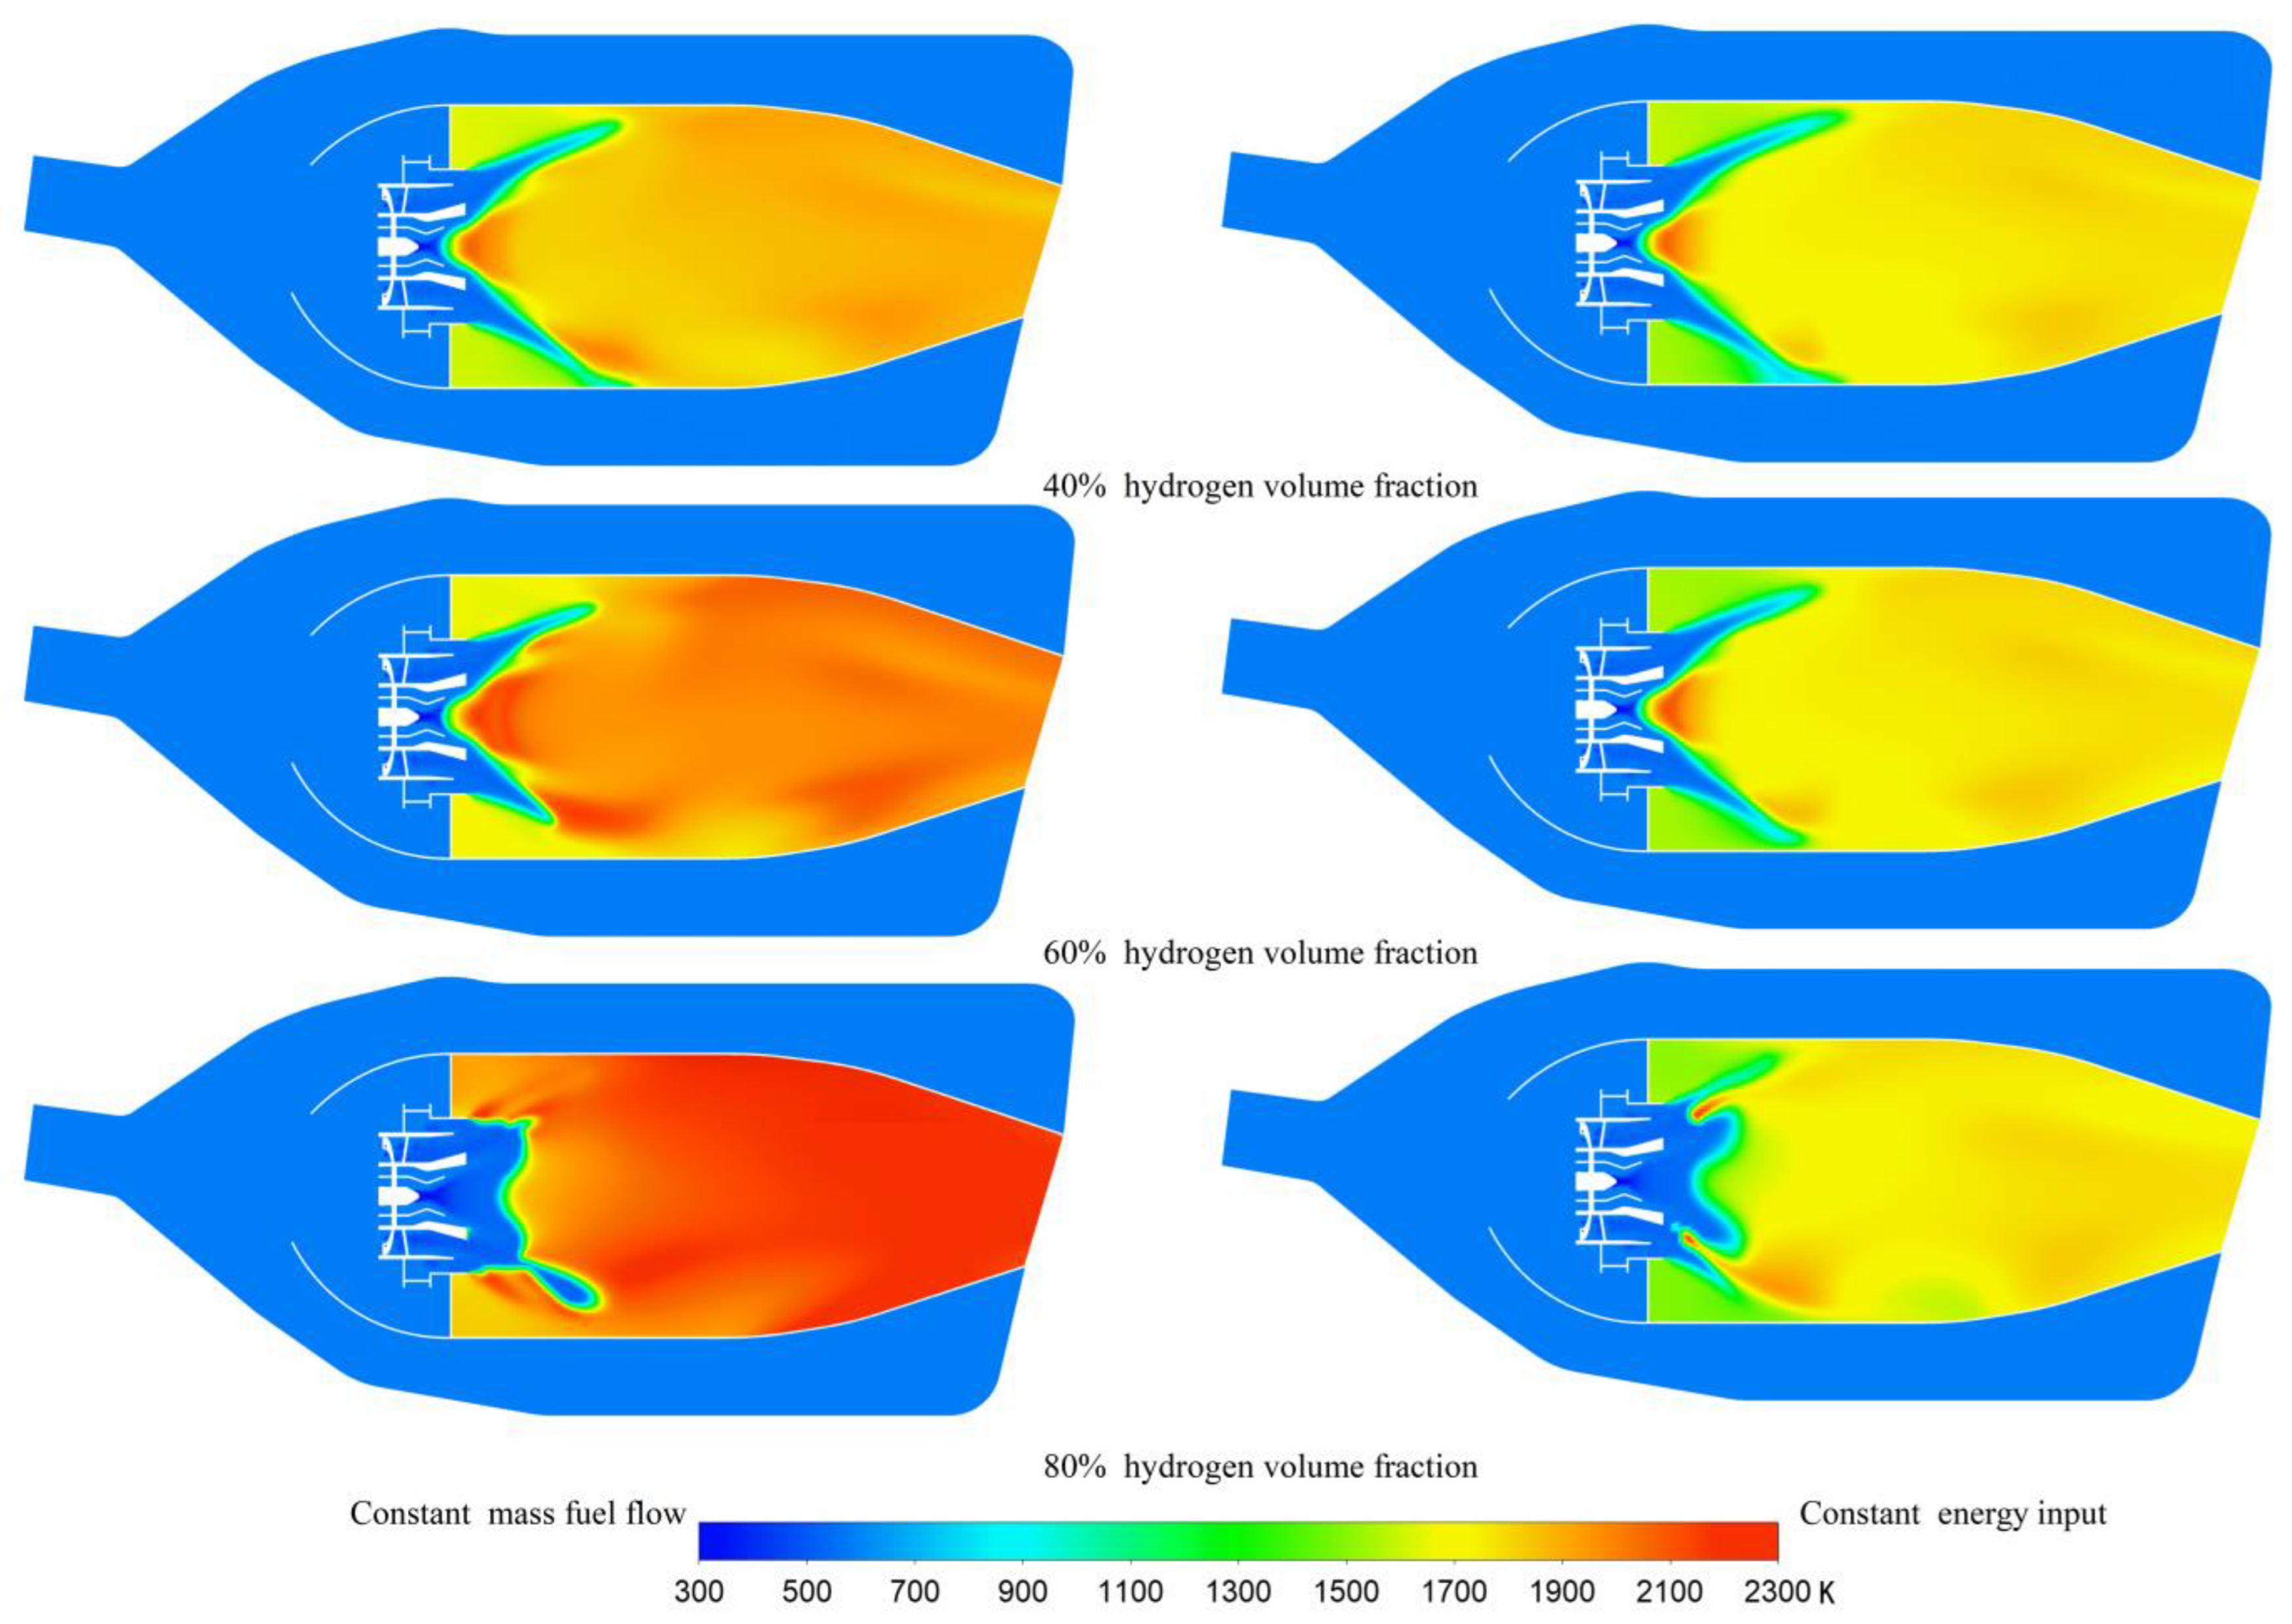
3.2. Temperature Distribution

Because of the lean premixed (LP) technology used in the combustion chamber of this study, the fuel gas was premixed with air at the swirler before entering the combustion chamber, and the fuel distribution at the outlet of the swirler was relatively uniform. As a result, the maximum combustion temperature in the combustion chamber was low, which appeared behind the nozzle in the pilot stage without local hot spots. However, since the pilot stage is inherently responsible for stabilizing the flames, generating a slightly high-temperature zone is acceptable. Due to the good premixing of the complete fuel and the elimination of the primary and dilution holes in the advanced combustion chamber for lean fuel combustion, the outlet temperature is fairly uniform.
For the constant fuel mass flow rate conditions (cases 2–7), as shown in Figure 6 and Figure 7, the temperature at the combustion chamber outlet increases gradually with an increase in the hydrogen volume fraction. Hence, the temperature distribution coefficient at the combustion outlet also increases gradually. This indicates that hydrogen mixing in the fuel increases the energy density per unit mass. The higher temperature rise of the combustion chamber requires higher control of temperature distribution at the outlet of the combustion chamber. However, due to design, the outlet temperature coefficient of the advanced combustion chamber is quite low and at a very excellent level.
At the same time, it can be seen from Figure 8 that when the hydrogen volume fraction reaches 80% (case 7), the hydrogen at some area of the pilot stage exceeds the rich limit of hydrogen without changing the fuel intake ratio, resulting in the non-combustion of the pilot stage flame, which should have been steady burning as the pilot flame. Moreover, the laminar combustion speed of combustible premix decreases, which makes it impossible for the swirl flame to maintain stably behind the swirler, and the flame is farther away from the swirler.
Under the constant fuel energy input (cases 8–13), it can be seen from Figure 6 and Figure 7 that the overall temperature of the combustion chamber does not change significantly, and the main change is that the high-temperature area gradually moves forward along the flow direction. This is because the combustion rate of hydrogen is fast. The fuel burns faster with the increased hydrogen volume fraction, making the high-temperature zone ahead of time. When the hydrogen volume fraction reaches 80% (case 13), the combustion structure changes considerably. This is because when the volume fraction of hydrogen is high, the proportion of fuel grading distribution remains constant. At the pilot stage flame, hydrogen exceeds the rich combustion limit. In addition, the hydrogen moves to both sides of the main combustion area along the radial direction without good premixing. Two diffusion flames can effectively prevent backfire and other problems and cause a high temperature (2200 K) in the combustion area.
Based on the above two cases, new requirements are proposed for the combustion chamber design and matching when the hydrogen ratio is too high. First, the fuel nozzle needs to be optimized to adapt to the low-density mixed hydrogen fuel; otherwise, the fuel velocity at the nozzle outlet can even exceed 500 m/s. Secondly, the fuel might be distributed according to the selected proportion of hydrogen. When a high-temperature rise combustion chamber or even an ultra-high temperature rise combustion chamber is required, the fuel with a high hydrogen volume fraction can be selected. However, the intake proportion of the pilot stage needs to be appropriately increased, or the fuel input of the pilot stage needs to be reduced. At the same time, to prevent flashbacks and other problems, it may be necessary to modify and improve the structure of the cyclone head to conduct a part of diffusion combustion.

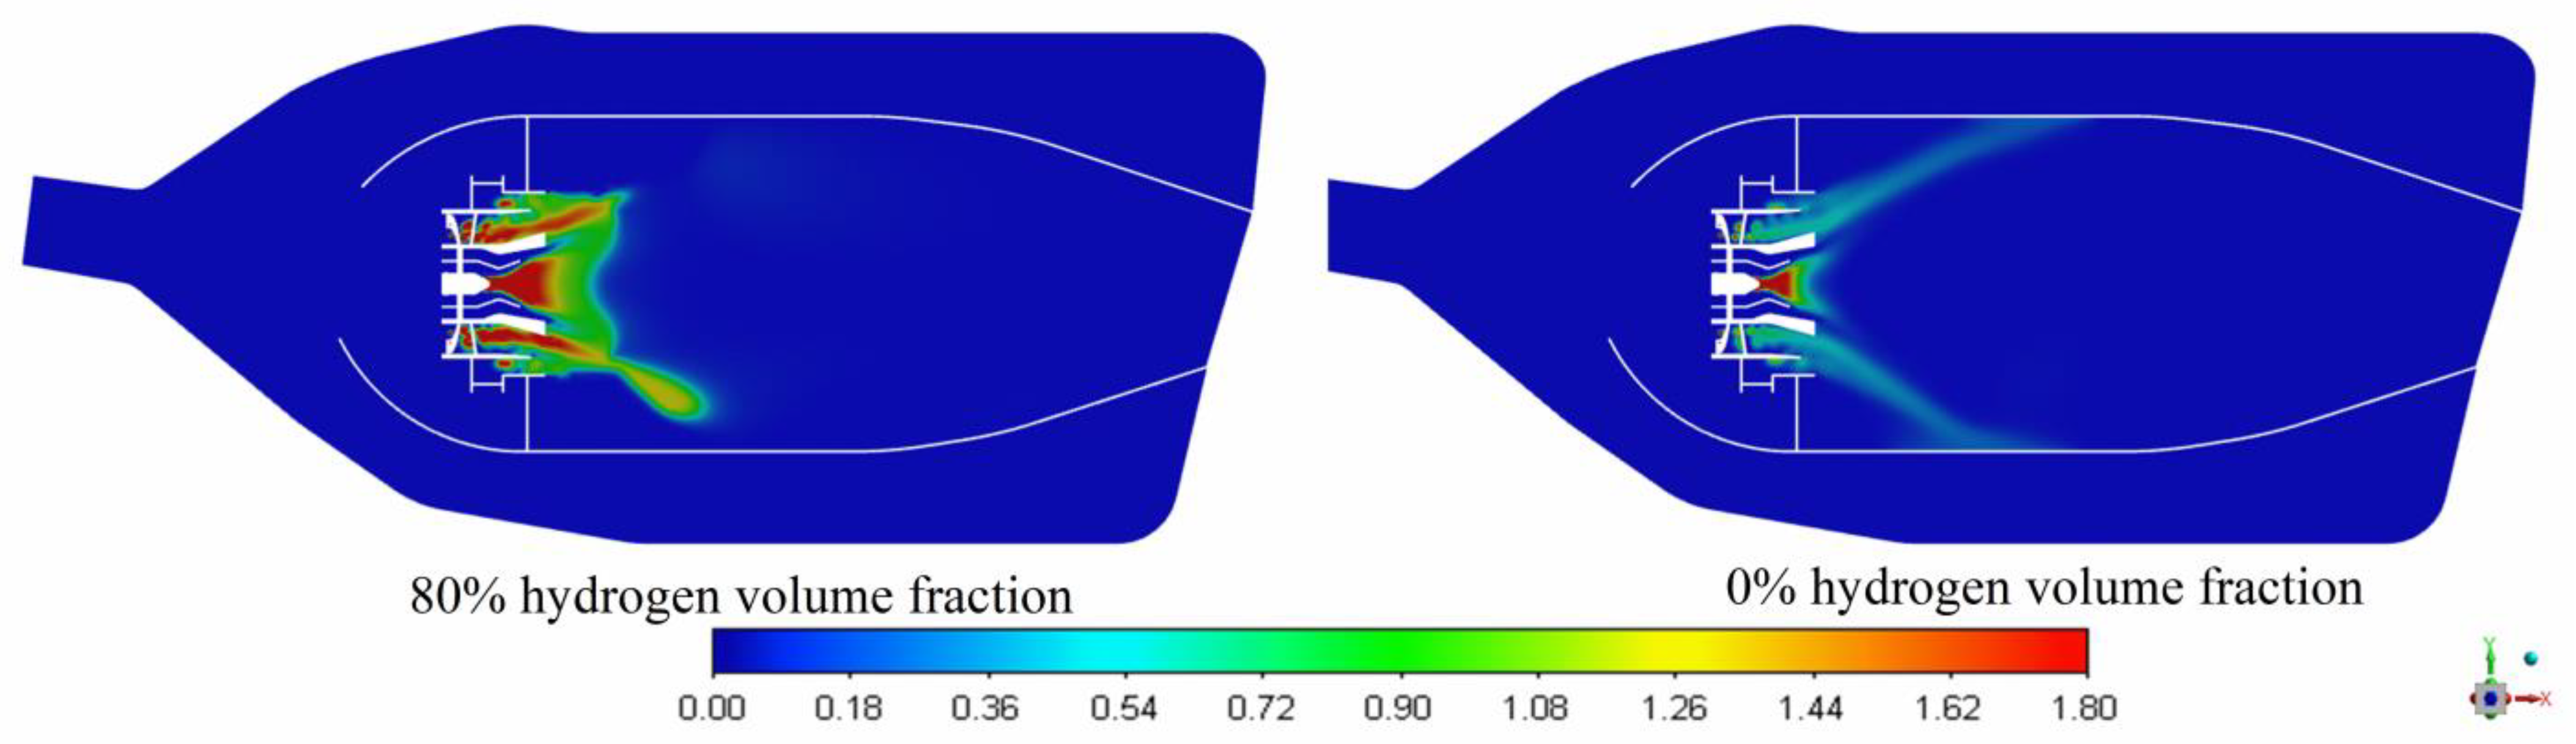
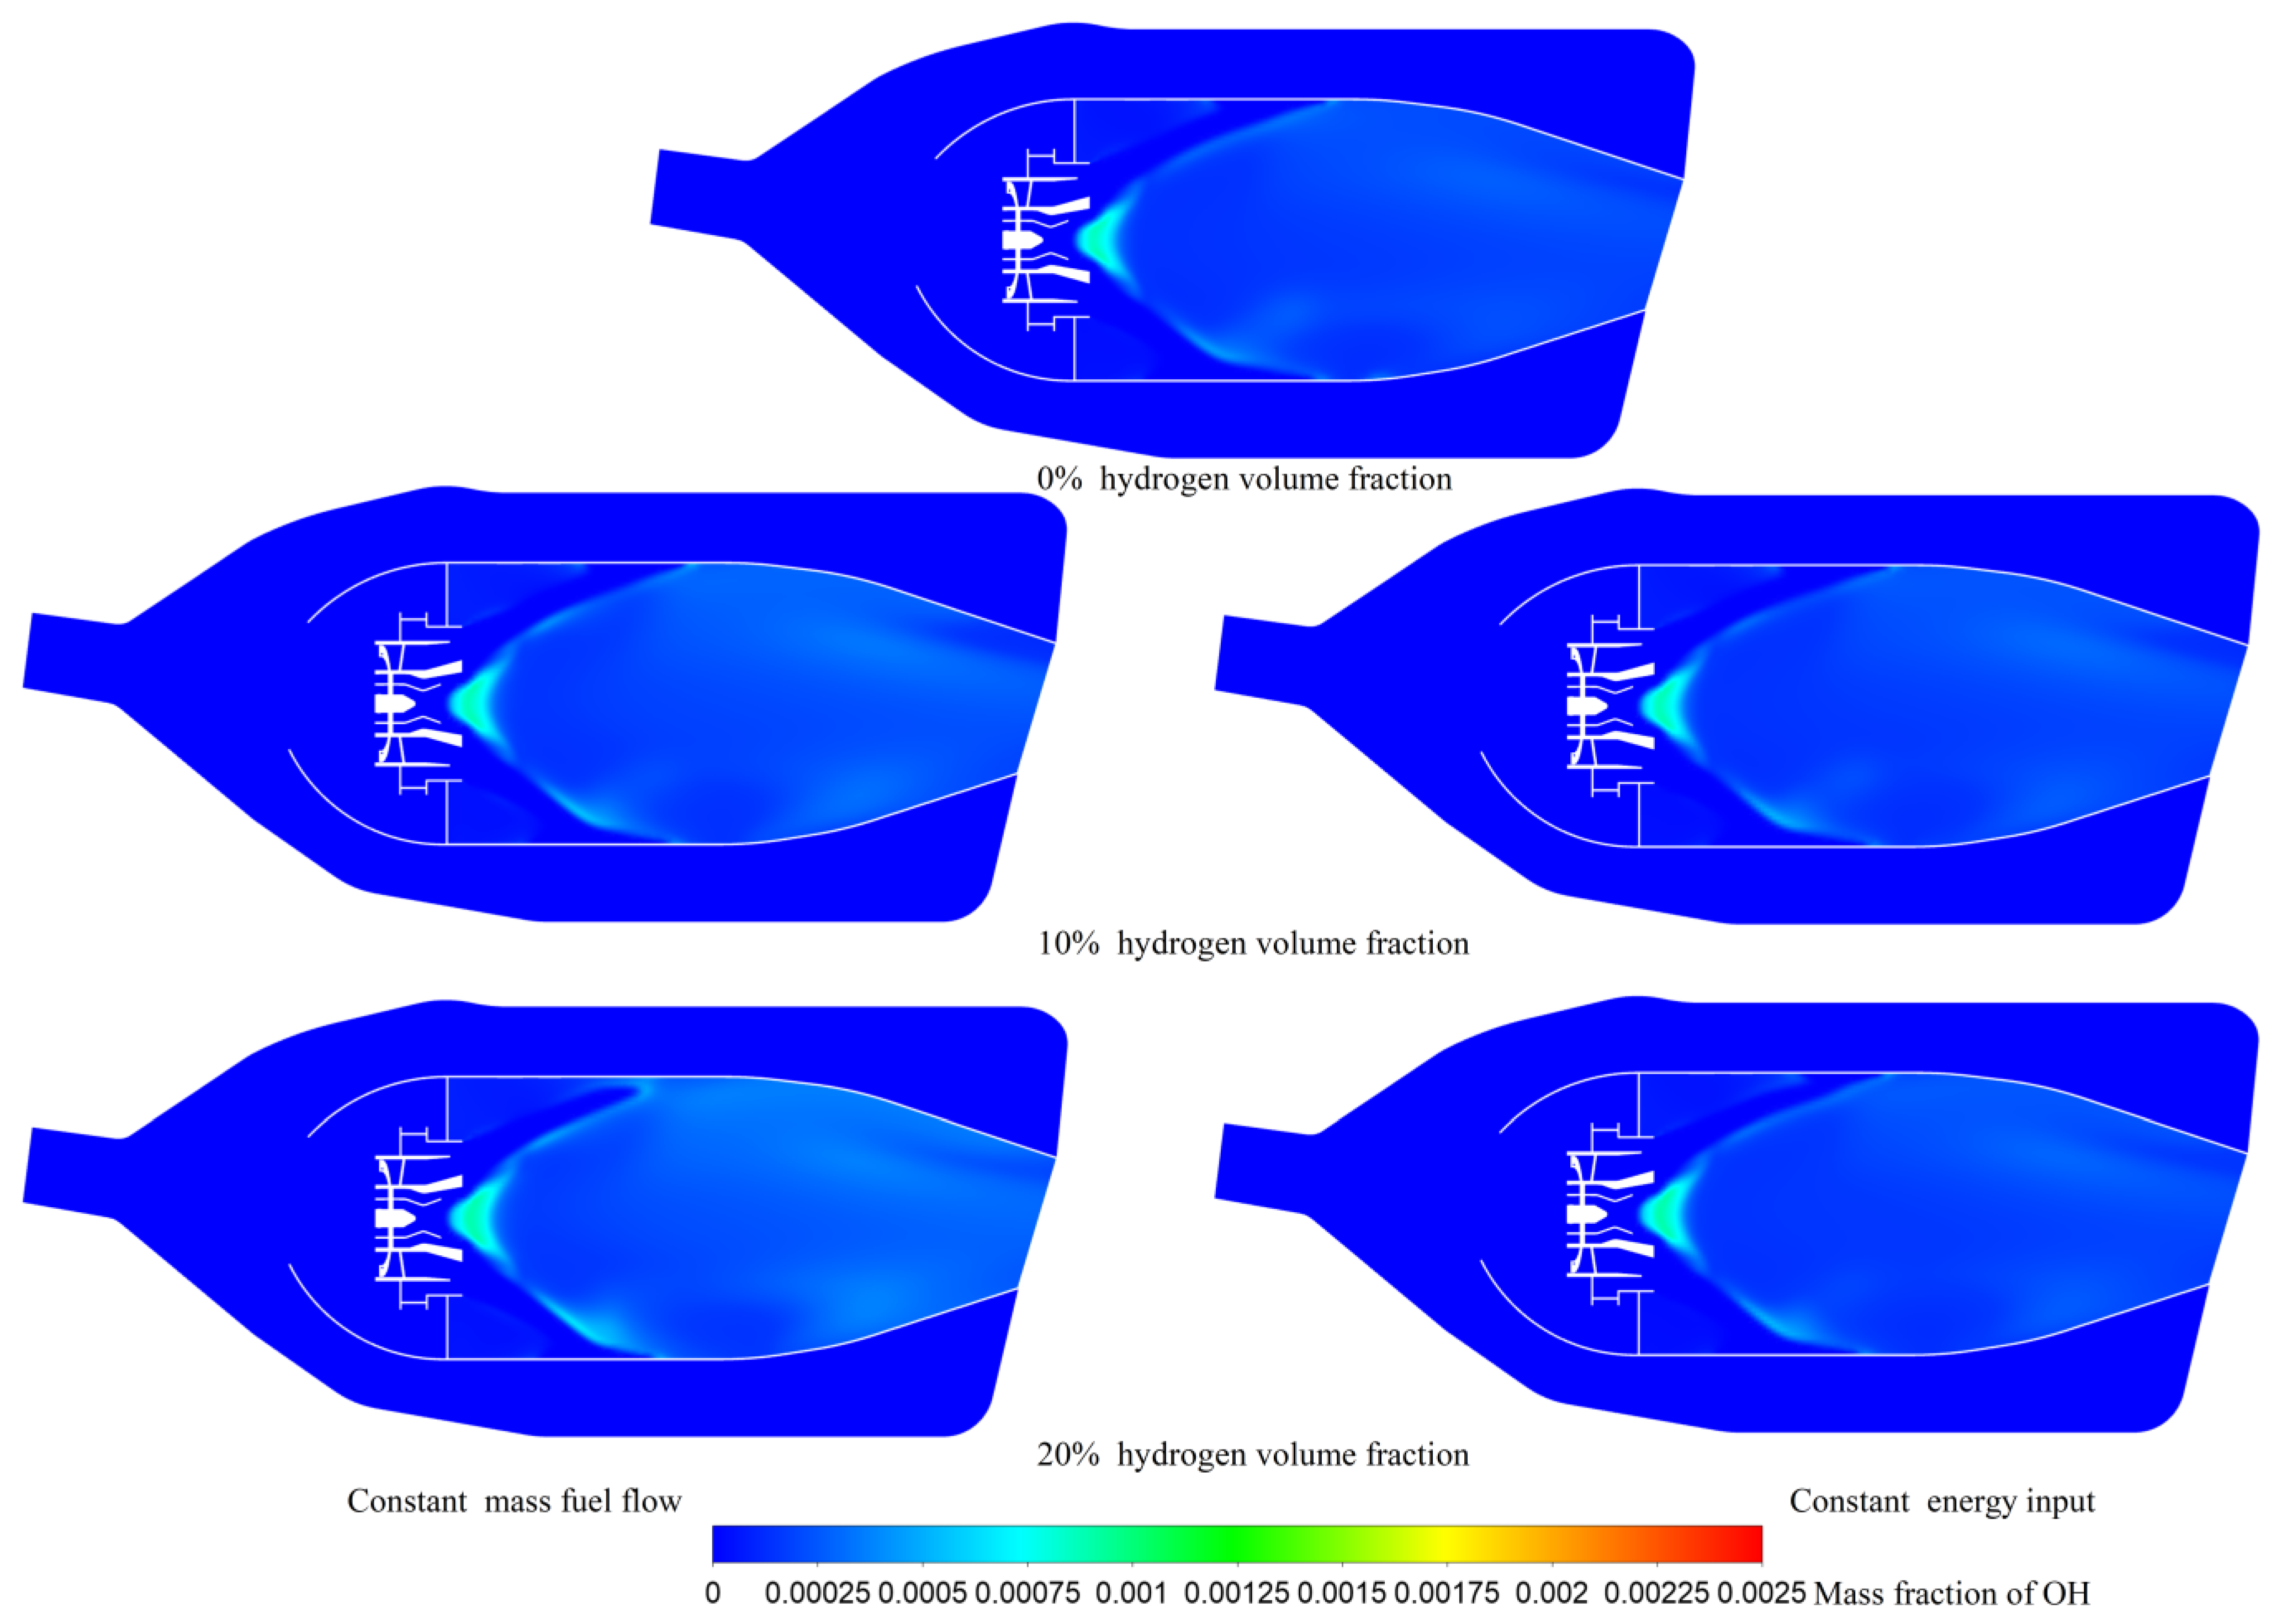
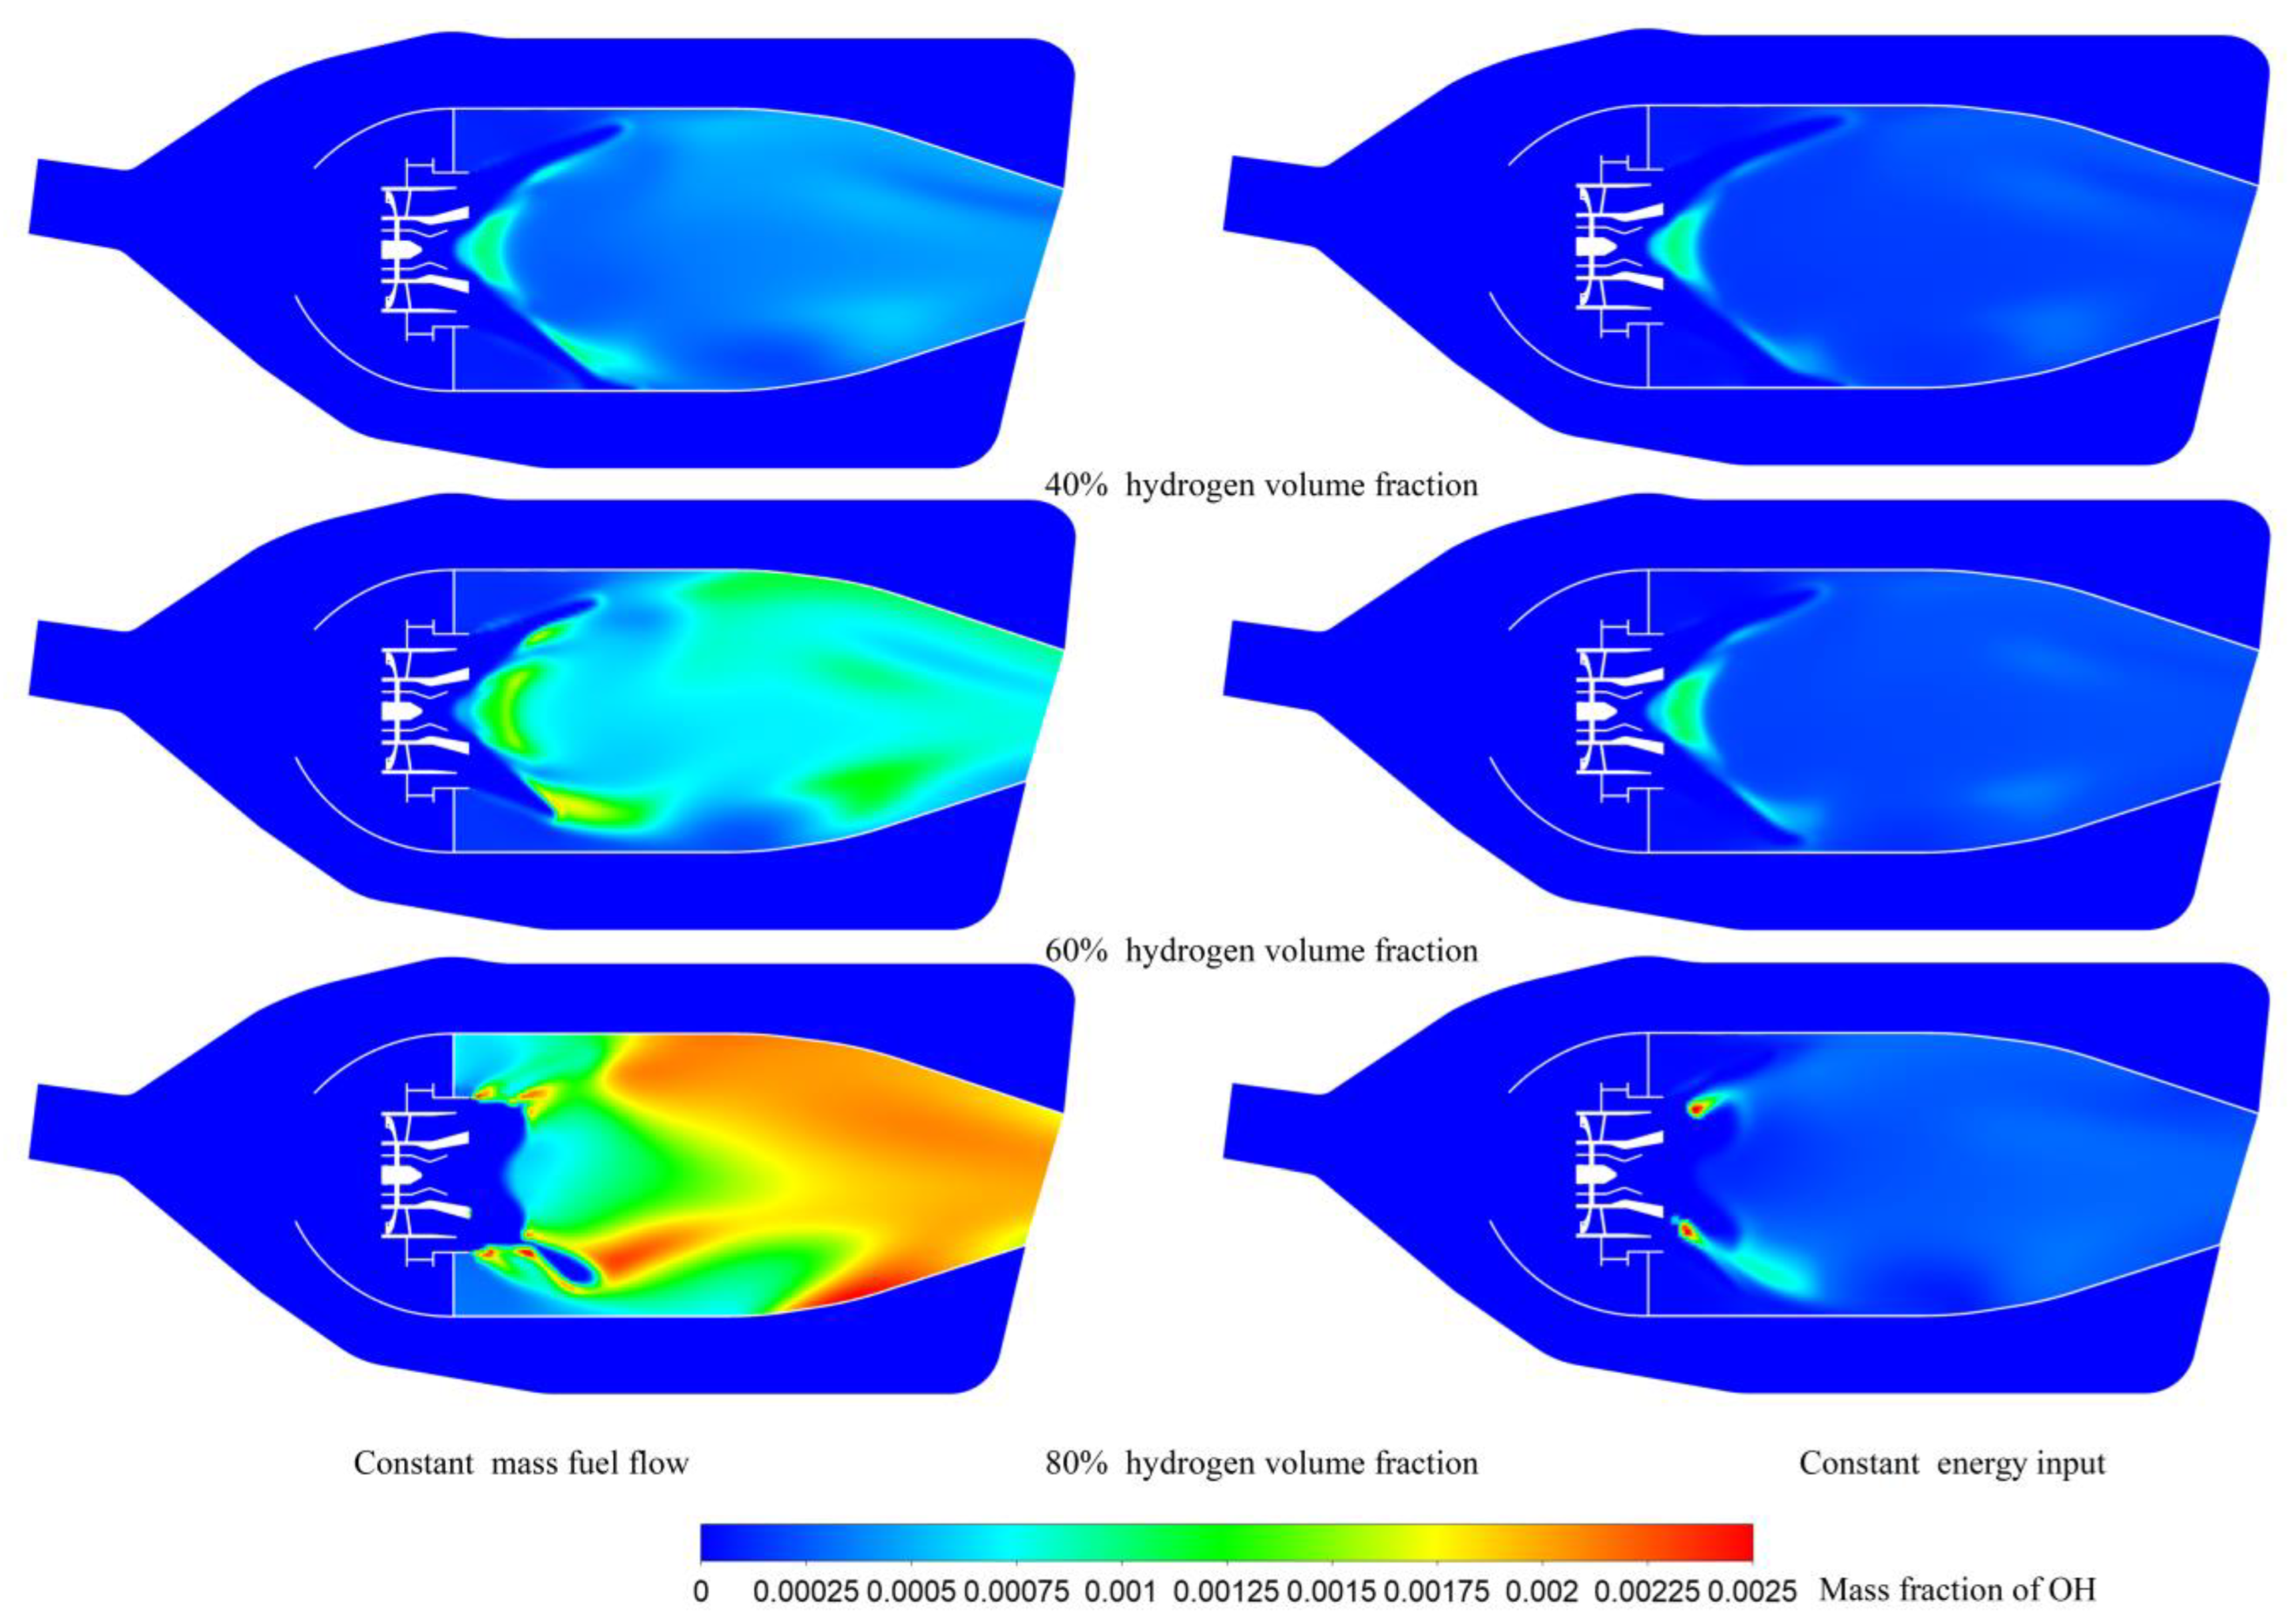
3.3. Unburned Fuel Emissions

Since the flame propagation rate of natural gas combustion is low, it may result in higher unburned methane emissions from natural gas turbines. Under a constant fuel mass flow rate (0.051 kg/s), the specific conditions of fuel residues (methane and hydrogen) are shown in Table 3. It can be seen from Table 3 that with an increase in the hydrogen volume fraction, under a constant mass flow rate of the imported fuel, the total fuel surplus gradually decreases and then increases.
With an increase in the hydrogen volume fraction, the consumption rate of both hydrogen and methane increases. It can be seen from cases 1–5 that with every 10% increase in the hydrogen volume fraction, the improved hydrogen quality only accounts for about 2% of the total fuel mass. In comparison, the fuel export residue decreases by about 10%. The very low proportion of hydrogen causes a large decline in the residual quality of fuel exports. This shows that at a low level of hydrogen volume fraction (cases 1–5), hydrogen causes the combustion of the mixed methane and hydrogen fuel more completely without much changes in the physical characteristics of the mixed fuel. Although the gas transport pipeline and combustion chamber nozzle may be improved at the medium level of hydrogen volume fraction (case 6), even fuel distribution in the combustion chamber also needs to be improved. At this time, the fuel reached the maximum combustion, and the fuel quality at the outlet decreased by 58.2%. Compared with pure methane fuel (without hydrogen), both methane and hydrogen reached the maximum burnout rate. However, when the hydrogen volume fraction is high (case 7), without changing other factors, fuel-rich combustion is achieved, resulting in incomplete combustion of many fuels. On the contrary, the fuel quality at the outlet increases by 35%, and methane and hydrogen consumption rates are the lowest under all the working conditions.
Under the constant fuel energy input (2.55 MW), the specific conditions of fuel residues (methane and hydrogen) are shown in Table 4.
Similar to the constant mass flow rate, adding hydrogen also makes fuel combustion more complete, but incomplete combustion occurs at a high hydrogen volume fraction. Since the energy input is constant, cases 8–13 are lean burn combustion. The higher the proportion of hydrogen, the lower the fuel residue. The mass fraction of fuel at the outlet of case 12, reduced by 60.9%, is the lowest under all the working conditions. The fuel residue of case 13 is increased compared with case 12. Similar to the constant mass flow rate (case 7), the above might be due to the high volume fraction of hydrogen, which does not match the fuel distribution ratio, resulting in hydrogen accumulation exceeding the rich combustion limit. The difference between them is that case 7 is rich combustion, while case 13 is lean combustion but local diffusion combustion.
Because all the constant energy input conditions are lean burn combustion, the hydrogen consumption rate is higher than under the constant mass flow rate. This indicates that the combustion of hydrogen is more complete. However, it can be seen that case 6 has a higher methane consumption rate than case 12 when the hydrogen volume fraction is 60%, specifying that case 6 inputs more methane but burns more completely. This may be due to the fuel’s increased mass calorific value as the hydrogen volume fraction increases at the same fuel mass flow rate. This increases the temperature in the combustion chamber, increasing the reaction rate and, thus, the complete combustion of methane.

3.4. Combustion Characteristics

3.4.1. Heat Release Rate

At the beginning of natural gas combustion, the flame propagation rate is slow, and the heat release rate is low. After mixing with hydrogen, the ignition delay shortened, the blended fuel’s combustion rate increased, and the maximum heat release rate’s position advanced. It can be seen from Figure 9 that with an increase in the hydrogen, the end position of the area with a high heat release rate gradually moves forward along the flow direction. In contrast, the area with a high heat release rate gradually reduces. Cases 1 and 2 exhibit a longer high heat release area and are in contact with the upper and lower walls. From case 3 onwards, the area with a high heat release rate no longer touches the upper wall, and from case 6 onwards, it no longer touches the lower wall. It can also be seen that the maximum heat release rate increases with the volume fraction of hydrogen due to the increase in the combustion rate after mixing with hydrogen. The local maximum heat release rate is three times for case 1 and case 6, and two times for case 1 and case 12. This also reduces the loss of combustion time.
Combined with the OH distribution mentioned later, it can be concluded that the flame length decreases with the increase of hydrogen volume fraction. This may be due to H2 having a substantially high laminar flame speed when compared to other fuels [42]. This leads to potentially high laminar flame velocity for syngas and hydrogen-rich fuel blends [1].
Density distribution affects the combustion efficiency of the combustion chamber [43]. High-density air (oxidizer) enters the combustion chamber through the swirler and is governed by the gas equation. After combustion, the gas is heated, and the density decreases. As indicated earlier, this is due to the mixing of hydrogen in the fuel and the earlier location of the fuel’s high heat release rate, allowing the air entering the combustion chamber to heat up faster.

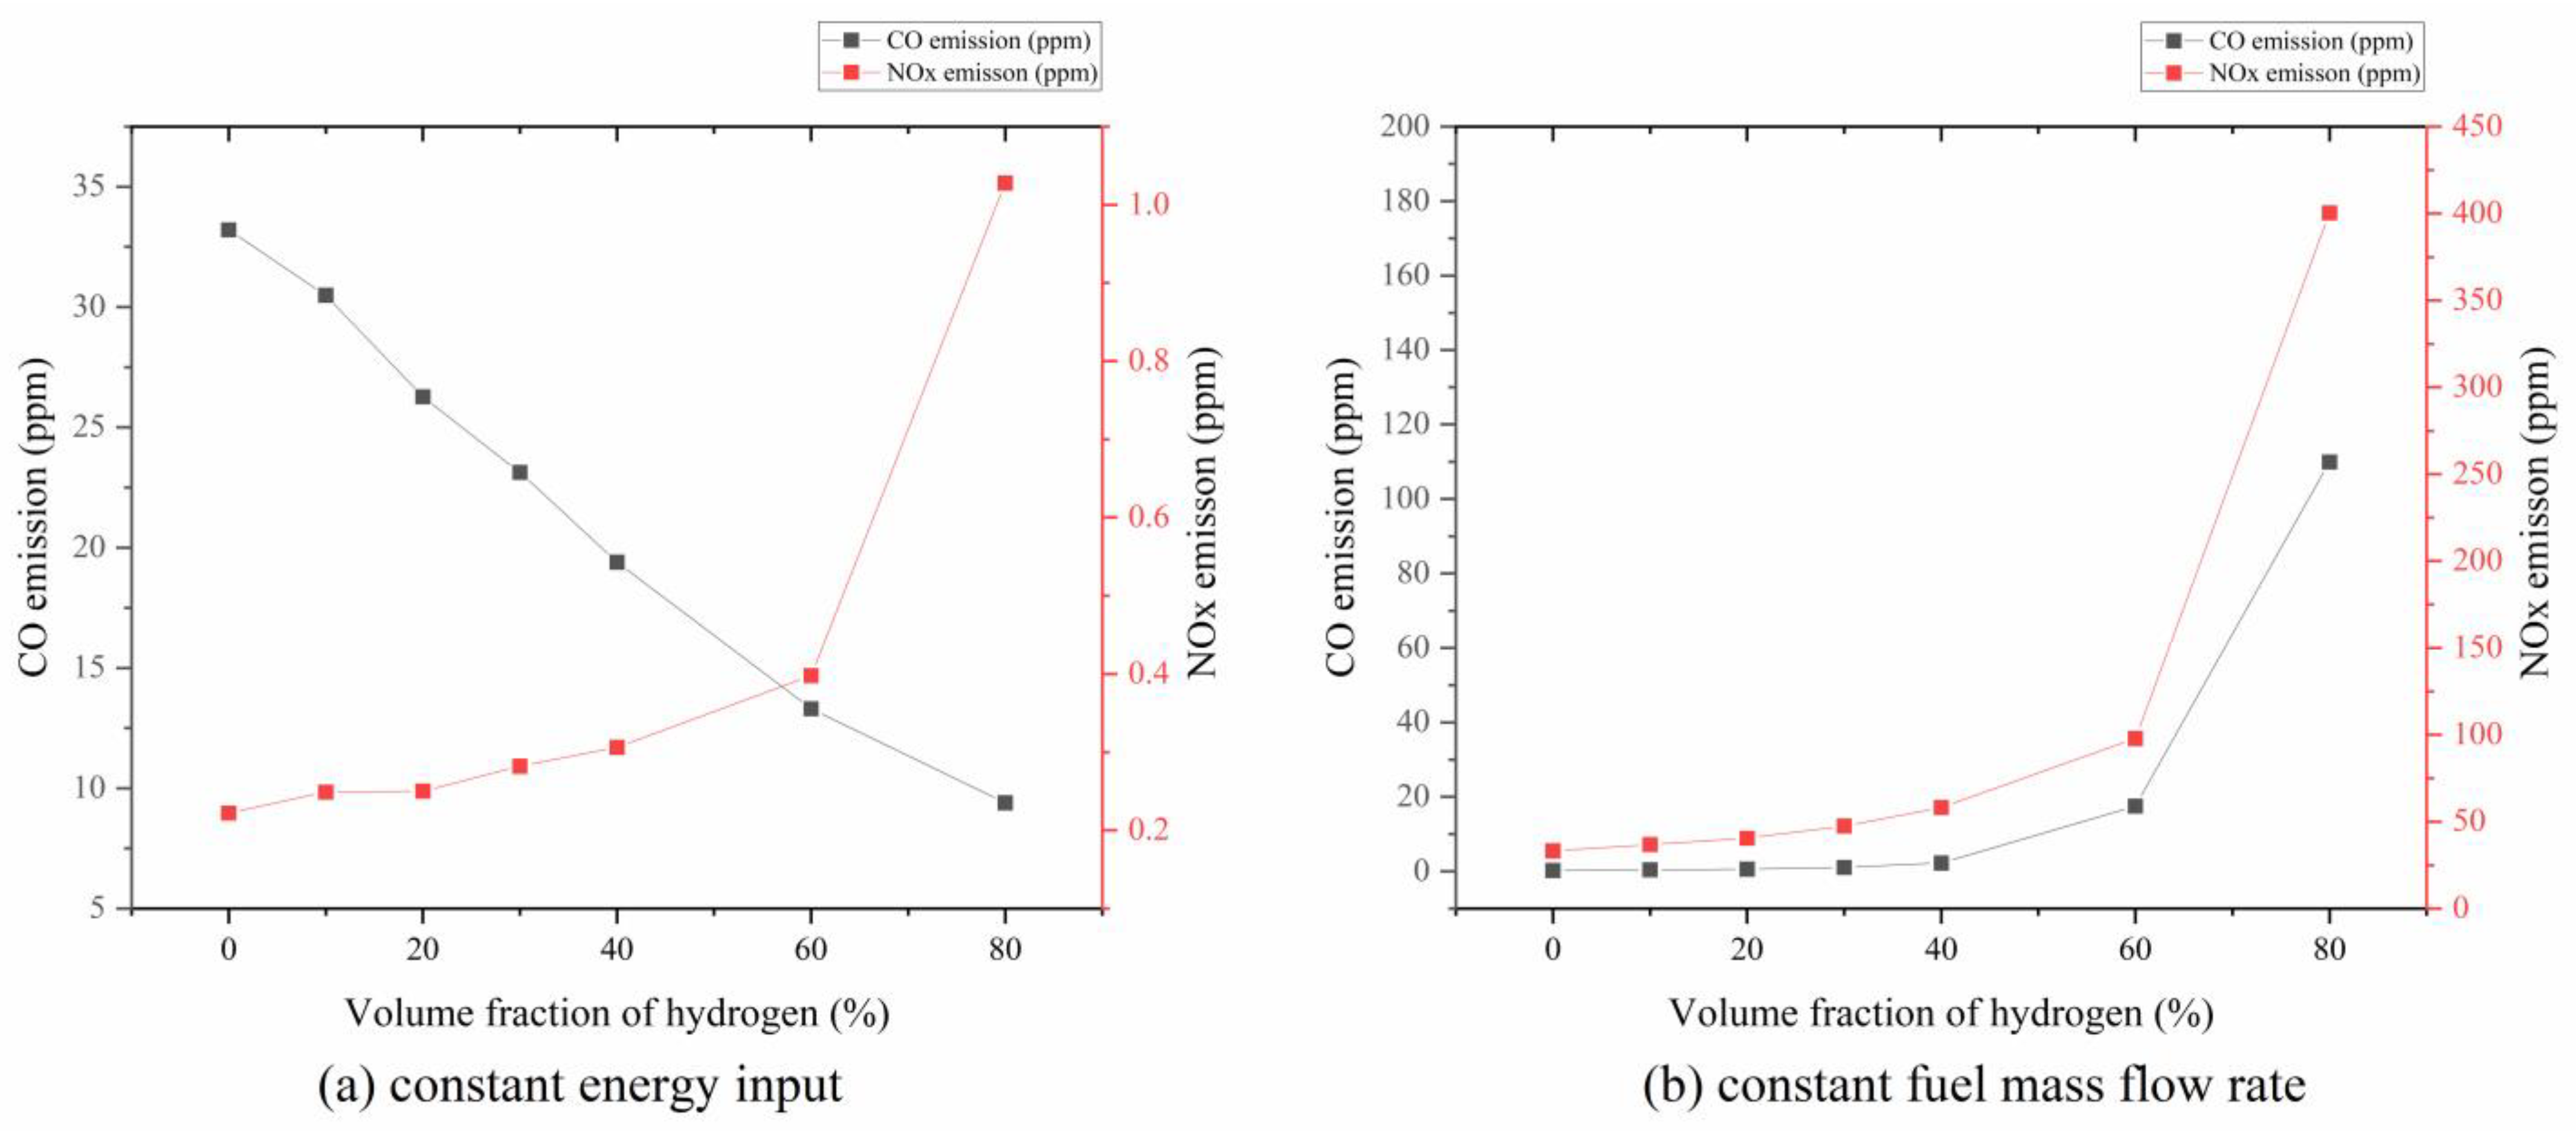
3.4.2. Emissions of Combustion

Hydrogen is not a hydrocarbon, it has no carbon atom, and the combustion does not contain CH2O, C2H2, CO, and other products. Therefore, the use of hydrogen to add natural gas will inevitably lead to a decline in the production of these products.
As the molar fractions of H, O, and OH radicals in the flame are increased by mixing with hydrogen, the reaction rates of all these elementary reactions increase. The consumption reaction rate of CH2O increases more than the generation reaction rate, so the molar fraction of CH2O decreases with an increase in the hydrogen volume fraction. CH2O is a harmful pollutant emitted from the combustion of hydrocarbon fuel, which is harmful to the environment. In the actual combustion equipment, CH2O emissions mainly arise from the incomplete combustion of fuel. Using H2 instead of CH4 will reduce the emission of CH2O, because the combustion of H2 does not contain CH2O. Furthermore, with reference to case 5 and case 1 in Table 1 and Table 5, it can be seen that the mass of fuel methane in case 5 is 93% of that in case 1, and the C2H2 generated after combustion in case 5 is only 15% of that in case 1. The molar fraction of CH2O decreases significantly with an increase in the hydrogen volume fraction, indicating that mixing with hydrogen has the potential to reduce CH2O emissions from methane combustion.
It is necessary to check whether, at a constant fuel mass flow rate or constant energy input, the generation rate of C2H2 main generation and consumption reaction decreases with an increase in the hydrogen volume fraction. Studies show that C2H2 is an important soot inducer; C2H2 generates HC≡CCH2, which creates a benzene ring through cyclization, and its polymerization generates soot. Table 5 exhibits that a volume fraction of 20% (3% mass fraction) hydrogen reduces the outlet mass fraction of C2H2 by about 59%. At the constant fuel mass flow rate, the volume fraction of hydrogen increases, increasing the temperature of the combustion chamber, which reduces more generation of C2H2. The C2H2 mass fraction decreases significantly with an increase in the hydrogen volume fraction, indicating that mixing with hydrogen can reduce the emission of soot from methane combustion.
OH is produced in the area where the chemical reaction is most intense, and, generally, OH represents the area where oxidation takes place. It can be seen from Figure 10 and Figure 11 that the concentration of OH in the combustion chamber increases as the hydrogen volume fraction increases at the constant fuel mass flow rate (cases 1–7). In cases 1–2, OH mainly appears at the boundary of the primary zone behind the swirler. From case 3, two high concentrations of OH are generated in the middle of the combustion chamber and the area near the outlet, indicating that the combustion area of intense mixing in this LP combustion chamber extends towards the outlet with an increase in the hydrogen mixing ratio. At the same time, with an increase in the hydrogen volume fraction (60–80%), the high concentration area of OH is closer to the combustion chamber outlet. This may be due to the high rate of hydrogen combustion, causing the fuel mixture to enter the violent reaction zone more quickly, thus reducing the distance from the outlet of the swirler to the violent reaction zone. With a constant energy input (cases 8–13), the hydrogen addition also causes a slight increase in the OH concentration; however, the increase is less than in cases 2–7. When the volume fraction of hydrogen reaches 80%, as previously mentioned, the combustion mode has changed, and the area with severe combustion changes to diffusion combustion. Therefore, the distribution of OH is different from that before.
The emission characteristics can be obtained from Figure 12. In this study, at the constant fuel mass flow rate, CO emission increases with the volume fraction of hydrogen. CO production is mainly related to the local equivalent combustion ratio and is caused by incomplete fuel combustion. This study shows that under the constant fuel mass flow rate (0.051 kg/s), with a gradual increase in the hydrogen volume fraction, hydrogen consumes a large amount of oxygen, reducing methane’s excess air coefficient and resulting in the incomplete combustion of methane and, thus, a large amount of CO production. As the proportion of hydrogen increases gradually, CO emission increases rapidly.
The fuels are well-lean premixed with a constant energy input (2.55 MW). Adding hydrogen increases the combustion reaction’s activity and promotes the combustion conversion of CO in the reaction, thus reducing CO emissions. This is consistent with the study of Rajpara [24].
NOx emission is the key focus in gas turbines. As an LP combustor with premixed combustion, its main purpose is to reduce NOx emission. The N element in the air mainly causes NOx emission. The main influencing factor is the maximum combustion temperature in the combustion zone. The purpose of premixed combustion is to reduce the maximum gas temperature in the combustion chamber. It can be seen that the maximum gas temperature in this combustion chamber does not exceed 2000 K at the low mixing ratio of hydrogen, making the outlet NOx emission at a fairly low level.
Under the constant fuel mass flow rate (0.051 kg/s), the proportion of hydrogen gradually increases. The energy density of the same fuel mass gradually increases, resulting in more and more air requirements for fuel, lean combustion gradually approaches the equivalent ratio combustion direction, and the outlet temperature of the combustion chamber and the maximum gas temperature gradually increase. In case 6, with a 60% hydrogen volume fraction, NOx emission can also meet the low emission standard. With a hydrogen volume fraction of 80% (case 7), NOx emission increases 491 times and does not meet the low emission standard.
At a constant energy input (2.55 MW), NOx emission increases with hydrogen volume fraction. This is due to the high combustion temperature of hydrogen, resulting in the formation of thermal NOx. In addition, a diffusive combustion is formed without changing the nozzle structure and fuel distribution ratio, as discussed in the previous temperature section, resulting in a rapid increase in the generation of NOx. NOX emissions from case 13 increased by about 363% compared to case 1.

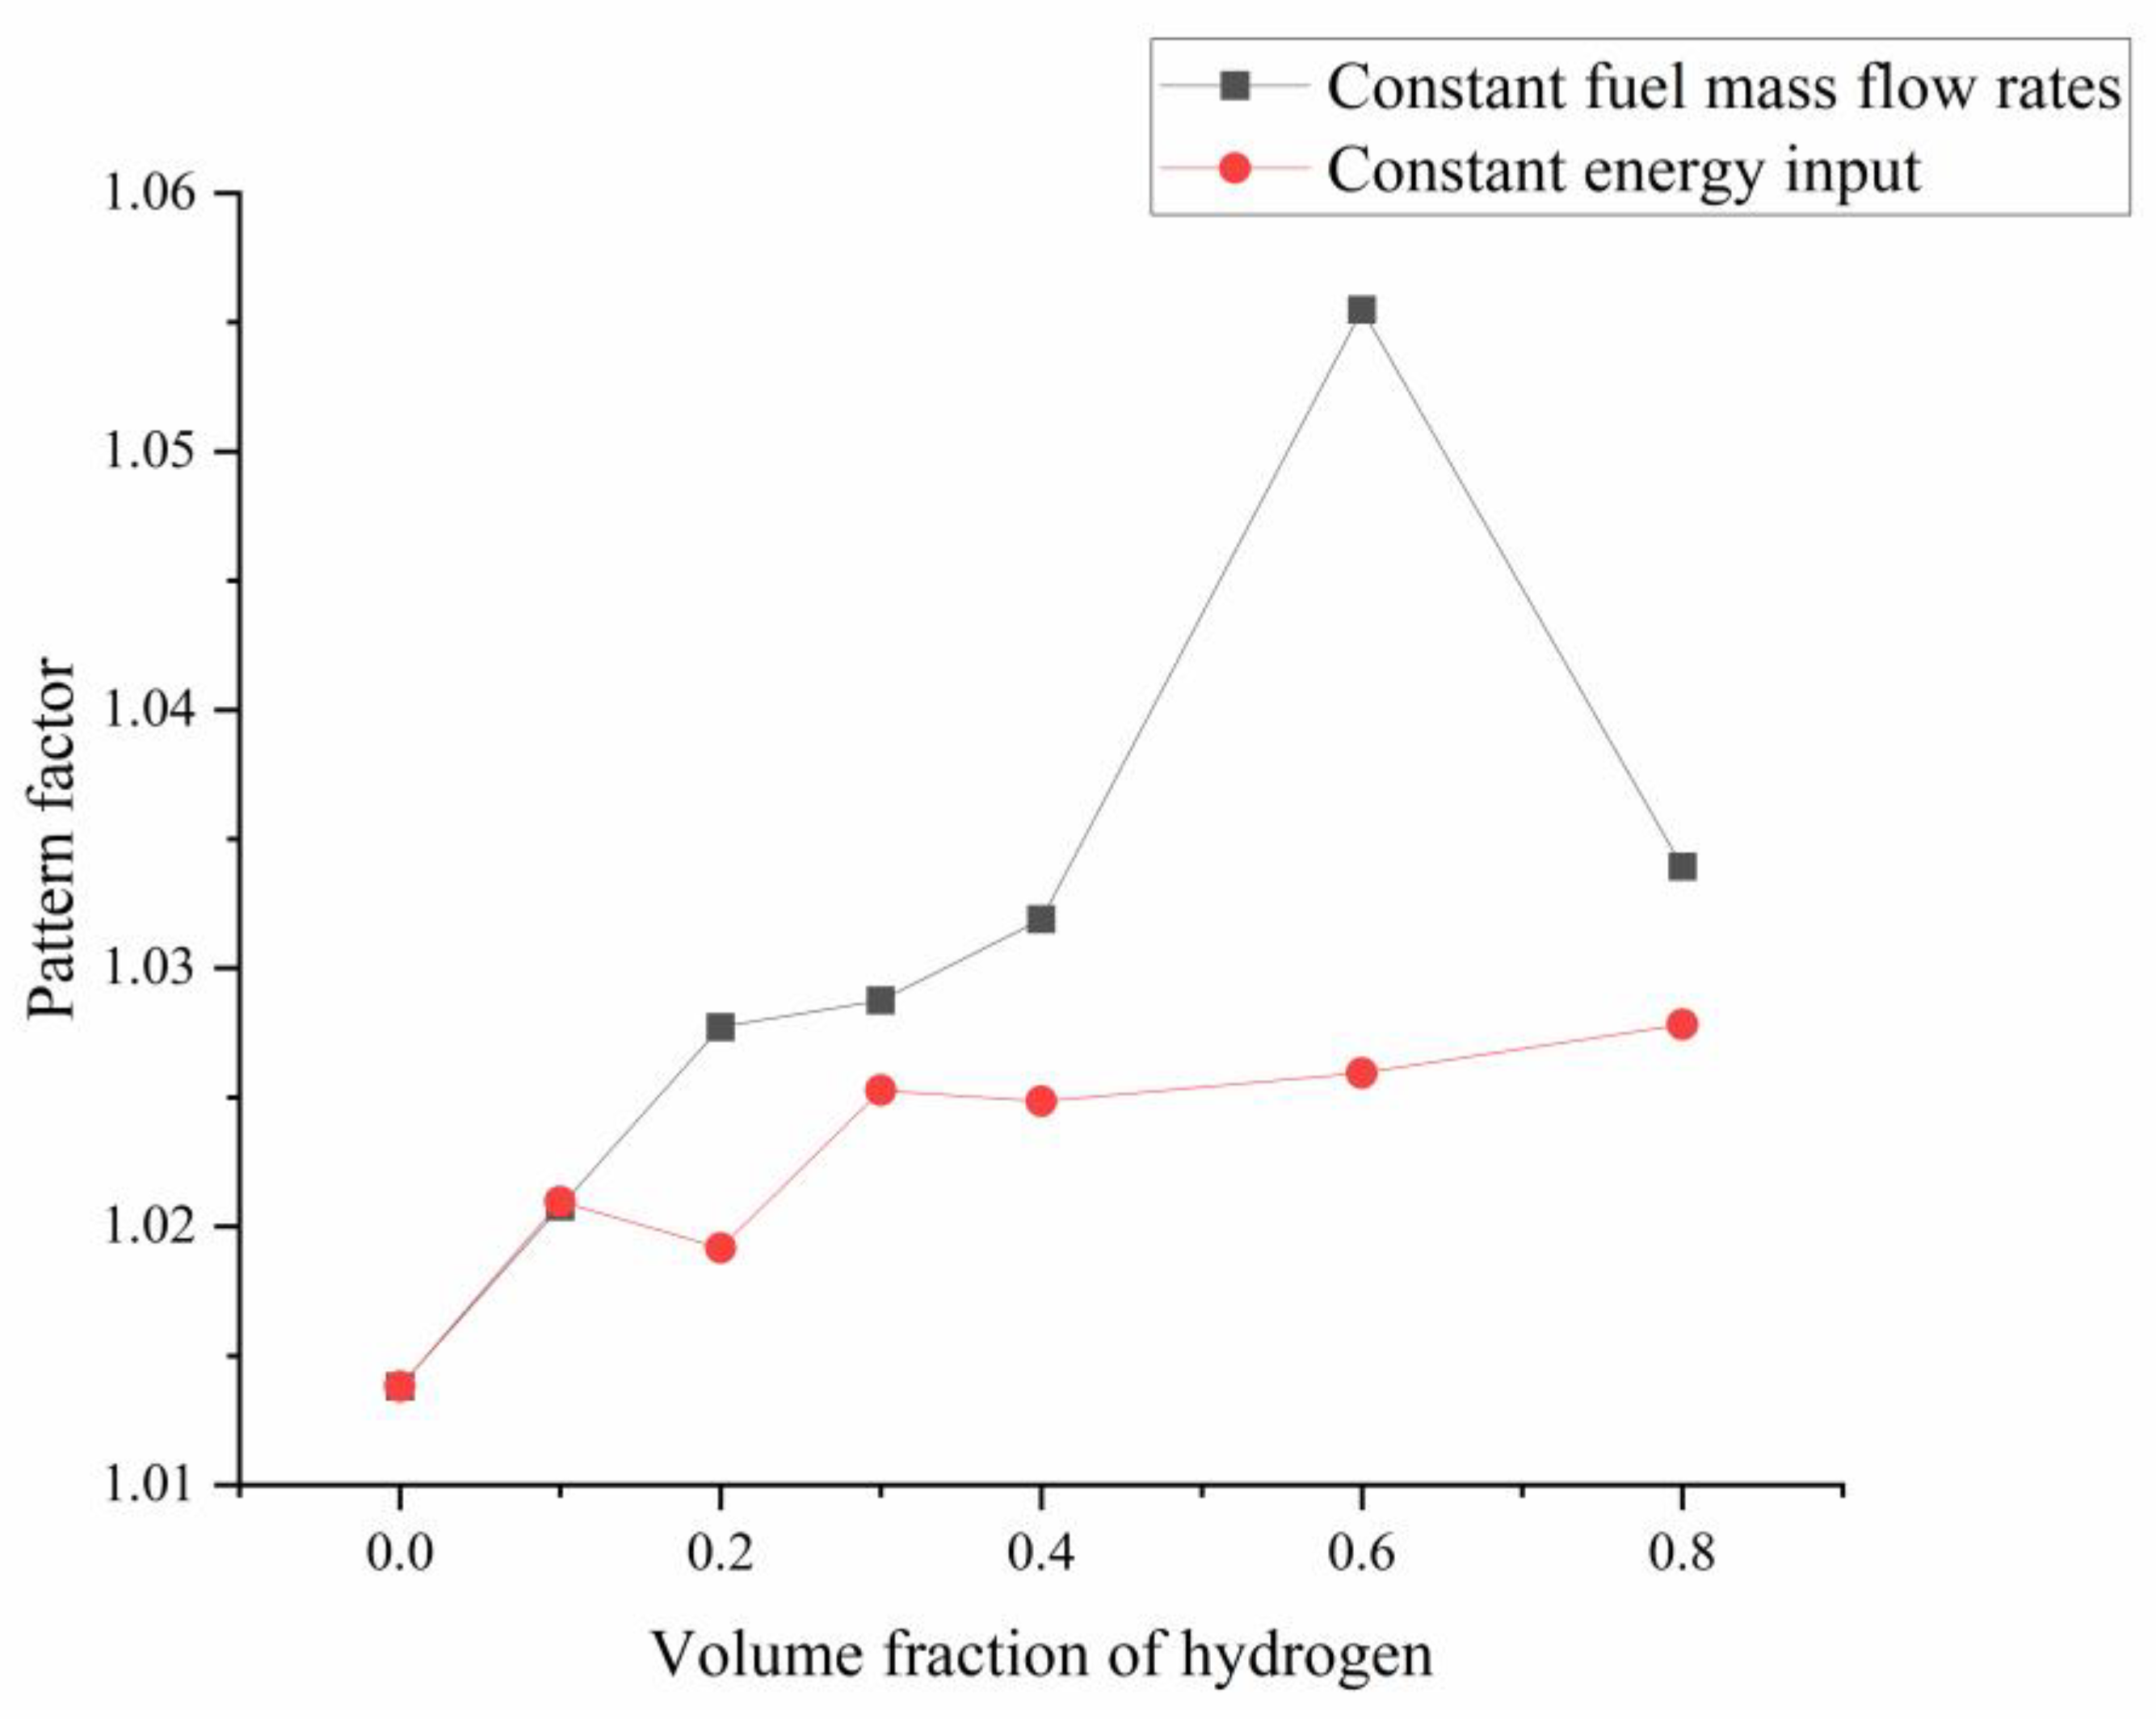
3.4.3. Pattern Factor

To increase the gas turbine efficiency, a higher turbine inlet temperature is required, as a higher outlet temperature with a uniform distribution can improve the operation of the turbine section. The uniformity of the outlet flow is typically evaluated by calculating the pattern factor [39]. Equation (20) defines the pattern factor, measuring the homogeneity of the temperature field in the exhaust section. When the pattern factor is calculated using Equation (20), the closer to the unity of the temperature distribution at the outlet, the more uniform it is.
Pattern   factor = T o u t , m a x T i n T o u t , a v e T i n
In the above, T i n , T o u t , a v e , and T o u t , m a x represent the oxidizer inlet temperature, average temperature, and maximum temperature calculated for the outlet section of the combustor, respectively. Figure 13 compares the pattern factor at the combustion chamber outlet with different hydrogen volume fractions. It can be seen that with an increase in the volume fraction of hydrogen, the pattern factor increases gradually at the same mass flow rate. With the constant energy input, pattern factors also increase, but the trend is not as high as that of the former. This may be due to the rapid combustion rate of hydrogen, the high heat release rate in a short time, and the advanced area of the high heat release rate, resulting in the existence of a local high-temperature zone in the combustion chamber. Since there are no dilution holes in this LP combustion chamber, the already generated high-temperature zone cannot be rapidly dissipated and flows to the outlet, resulting in uneven temperature distribution at the outlet.

4. Conclusions

This study shows that a small amount of hydrogen doping can significantly reduce fuel residues (the mass fraction of fuel at the outlet is reduced up to 60.9%). Due to hydrogen mixing, the combustion rate of the blended fuel is increased, and the high heat release rate and high-temperature area in the combustion chamber are advanced. Hydrogen mixing reduced the generation of CH2O as well as C2H2 significantly, which can induce carbon fumes. Therefore, hydrogen mixing can potentially reduce the emission of carbon fumes from methane combustion. Increasing the volume fraction of hydrogen in the fuel also reduced CO emissions at the same fuel input power while increasing CO emissions at the same fuel mass flow rate.
A large hydrogen volume fraction changed the combustion mode in the combustion chamber. Under constant mass flow rate (case 7), the combustion changed to rich combustion. Under constant energy input (case 13), the combustion showed a certain diffusion combustion. With hydrogen addition, under constant energy input (cases 8–13), only the maximum gas temperature in the combustion chamber is increased, and NOx emission is slightly increased. Under constant fuel mass flow rate (cases 2–7), the combustion chamber’s maximum temperature and overall temperature are increased, and NOx emission is greatly increased. Adding hydrogen increases the pattern factor, indicating that the uniformity of the combustion chamber outlet temperature worsens.
Regarding all-around performance and emissions, a hydrogen blending ratio of 30–40% (cases 4 and 5) is most suitable for the natural gas LP combustion chamber under the constant mass flow rate of fuel. In the case of the constant input power, a higher hydrogen volume fraction of 60% can be attempted (case 12).
The effects of differential diffusion are not considered in current studies. While the differential diffusion is sometimes neglected by assuming that the turbulent transport overwhelms molecular diffusion in intense turbulence [44]. However, the differential diffusion is important for numerical simulation of hydrogen combustion [45]. In future research, differential diffusion can be taken into consideration by changing the combustion model and carrying out experimental research.

Author Contributions

Conceptualization, K.W. and F.L.; methodology, K.W. and F.L.; software, K.W. and T.Z.; validation, K.W. and T.Z.; formal analysis, K.W.; investigation, F.L. and Y.A.; resources, F.L.; data curation, K.W.; writing—original draft preparation, K.W.; writing—review and editing, K.W.; visualization, K.W. and Y.A.; funding acquisition, F.L. All authors have read and agreed to the published version of the manuscript.

Funding

This research was supported by the National Science and Technology Major Project (2017-III-0006-0031, J2017-III-0008-0034 and J2019-III-0002-0045).

Institutional Review Board Statement

Not applicable.

Informed Consent Statement

Not applicable.

Data Availability Statement

Not applicable.

Conflicts of Interest

The authors declare no conflict of interest.

References

  1. Taamallah, S.; Vogiatzaki, K.; Alzahrani, F.M.; Mokheimer, E.M.A.; Habib, M.A.; Ghoniem, A.F. Fuel flexibility, stability and emissions in premixed hydrogen-rich gas turbine combustion: Technology, fundamentals, and numerical simulations. Appl. Energy 2015, 154, 1020–1047. [Google Scholar] [CrossRef]
  2. Flaszynski, P.; Piotrowicz, M.; Bacci, T. Clocking and Potential Effects in Combustor–Turbine Stator Interactions. Aerospace 2021, 8, 285. [Google Scholar] [CrossRef]
  3. Seitz, A.; Nickl, M.; Troeltsch, F.; Ebner, K. Initial Assessment of a Fuel Cell—Gas Turbine Hybrid Propulsion Concept. Aerospace 2022, 9, 68. [Google Scholar] [CrossRef]
  4. Neilson, C.E. LM2500 gas turbine modifications for biomass fuel operation. Biomass Bioenergy 1998, 15, 269–273. [Google Scholar] [CrossRef]
  5. Abudu, K.; Igie, U.; Roumeliotis, I.; Szymanski, A.; Di Lorenzo, G. Aeroderivative gas turbine back-up capability with compressed air injection. Appl. Therm. Eng. 2020, 180, 115844. [Google Scholar] [CrossRef]
  6. Przysowa, R.; Gawron, B.; Białecki, T.; Łęgowik, A.; Merkisz, J.; Jasiński, R. Performance and Emissions of a Microturbine and Turbofan Powered by Alternative Fuels. Aerospace 2021, 8, 25. [Google Scholar] [CrossRef]
  7. Rochelle, D.; Najafi, H. A review of the effect of biodiesel on gas turbine emissions and performance. Renew. Sustain. Energy Rev. 2019, 105, 129–137. [Google Scholar] [CrossRef]
  8. Söderholm, P. Fuel flexibility in the West European power sector. Resour. Policy 2000, 26, 157–170. [Google Scholar] [CrossRef]
  9. Ino, H. Future View of Energy Supply & Role of Gas Turbine in Japan (View of Electric Power Company). Gener. Up Now 2003, 2003–2006. [Google Scholar]
  10. Neilson, C.E.; Shafer, D.G.; Carpentieri, E. LM2500 Gas Turbine Fuel Nozzle Design and Combustion Test Evaluation and Emission Results with Simulated Gasified Wood Product Fuels. J. Eng. Gas Turbines Power 1998, 121, 600–606. [Google Scholar] [CrossRef]
  11. Muk, C.H. He Bang-Quan. Spark ignition natural gas engines—A review. Energy Convers. Manag. 2007, 48, 608–618. [Google Scholar]
  12. Turns, S.R. An Introduction to Combustion: Concepts and Applications, 2nd ed.; McGraw-Hill: Boston, MA, USA, 2000; p. 158. [Google Scholar]
  13. Wang, J.; Huang, Z.; Tang, C.; Miao, H.; Wang, X. Numerical study of the effect of hydrogen addition on methane-air mixtures combustion. Int. J. Hydrogen Energy 2009, 34, 1084–1096. [Google Scholar] [CrossRef]
  14. Gondal, I.A. Hydrogen integration in power-to-gas networks. Int. J. Hydrogen Energy 2019, 44, 1803–1815. [Google Scholar] [CrossRef]
  15. Judd, R.; Pinchbeck, D. Hydrogen admixture to the natural gas grid. Compend. Hydrog. Energy 2016, 165–192. [Google Scholar] [CrossRef]
  16. Suez, G.D.F. GDF Suez, McPhy in French GRHYD project on methane, hydrogen. Fuel Cells Bull. 2012, 2012, 10. [Google Scholar]
  17. Emadi, M.; Karkow, D.; Salameh, T.; Gohil, A.; Ratner, A. Flame structure changes resulting from hydrogen-enrichment and pressurization for low-swirl premixed methane-air flames. Int. J. Hydrogen Energy 2012, 37, 10397–10404. [Google Scholar] [CrossRef]
  18. Schefer, R.W. Reduced turbine emissions using hydrogen enriched fuels. In Proceedings of the 2002 U.S. DOE Hydrogen Program Review, NREL/CP-610-32405, Golden, Colorado, 6–10 May 2002. [Google Scholar]
  19. Schefer, R.W.; Wicksall, D.M.; Agrawal, A.K. Combustion of hydrogen-enriched methane in a lean premixed swirl stabilized burner. Proc. Combust. Inst. 2002, 29, 843–851. [Google Scholar] [CrossRef]
  20. Patel, V.; Shah, R. Effect of hydrogen enrichment on combustion characteristics of methane swirling and non-swirling inverse diffusion flame. Int. J. Hydrogen Energy 2019, 44, 28316–28329. [Google Scholar] [CrossRef]
  21. Lamioni, R.; Bronzoni, C.; Folli, M.; Tognotti, L.; Galletti, C. Feeding H2-admixtures to domestic condensing boilers: Numerical simulations of combustion and pollutant formation in multi-hole burners. Appl. Energy 2022, 309, 118379. [Google Scholar] [CrossRef]
  22. Lamioni, R.; Lapenna, P.E.; Berger, L.; Kleinheinz, K.; Attili, A.; Pitsch, H.; Creta, F. Pressure-induced Hydrodynamic Instability in Premixed Methane-Air Slot Flames. Combust. Sci. Technol. 2020, 192, 1998–2009. [Google Scholar] [CrossRef]
  23. Shih, H.Y.; Liu, C.R. A computational study on the combustion of hydrogen/methane blended fuels for a micro gas turbines. Int. J. Hydrogen Energy 2014, 39, 15103–15115. [Google Scholar] [CrossRef]
  24. Rajpara, P.; Shah, R.; Banerjee, J. Effect of hydrogen addition on combustion and emission characteristics of methane fuelled upward swirl can combustor. Int. J. Hydrogen Energy 2018, 43, 17505–17519. [Google Scholar] [CrossRef]
  25. Cozzi, F.; Coghe, A. Behavior of hydrogen-enriched non-premixed swirled natural gas flames. Int. J. Hydrogen Energy 2006, 31, 669–677. [Google Scholar] [CrossRef]
  26. Tsukagoshi, K.; Arimura, H.; Tanaka, K. Development of air cooled combustor for Mitsubishi G class gas turbine. In Proceedings of the ASME Turbo Expo 2010:Power for Land, Sea, and Air, Glasgow, UK, 14–18 June 2010. [Google Scholar]
  27. Thundil Karuppa Raj, R.; Ganesan, V. Study on the effect of various parameters on flow development behind vane swirlers. Int. J. Therm. Sci. 2008, 47, 1204–1225. [Google Scholar] [CrossRef]
  28. Lazik, W.; Doerr, T.; Bake, S.; Bank, R.; Rackwitz, L. Development of lean-burn low-NOx combustion technology at Rolls-Royce deutschland. In Proceedings of the ASME Turbo Expo 2008: Power for Land, Sea, and Air, Volume 3: Combustion, Fuels and Emissions, Parts A and B, Berlin, Germany, 9–13 June 2008; pp. 797–807. [Google Scholar] [CrossRef]
  29. Jiang, Y.; Hajivand, M.; Sadeghi, H.; Gerdroodbary, M.B.; Li, Z. Influence of trapezoidal lobe strut on fuel mixing and combustion in supersonic combustion chamber. Aerosp. Sci. Technol. 2021, 116, 106841. [Google Scholar] [CrossRef]
  30. Sun, C.; Gerdroodbary, M.B.; Abazari, A.M.; Hosseini, S.; Li, Z. Mixing efficiency of hydrogen multi jet through backward facing steps at supersonic flow. Int. J. Hydrogen Energy 2021, 46, 16075e85. [Google Scholar] [CrossRef]
  31. Wang, K.; Li, F.; Zhao, K.; Zhou, T. Numerical study on the lobed nozzles for enhancing the mixing and combustion performance of rocket-based combined cycle engine. Energy Reports 2022, 8, 6645–6658. [Google Scholar] [CrossRef]
  32. Zhang, Y.; Gerdroodbary, M.B.; Hosseini, S.; Abazari, A.M.; Li, Z. Effect of hybrid coaxial air and hydrogen jets on fuel mixing at supersonic crossflow. Int. J. Hydrogen Energy 2021, 46, 16048e62. [Google Scholar] [CrossRef]
  33. Gerdroodbary, M.B.; Moradi, R.; Babazadeh, H. Computational investigation of multi hydrogen jets at inclined supersonic flow. Int. J. Energy Res. 2021, 45, 1661–1672. [Google Scholar] [CrossRef]
  34. Shih, T.H.; Liou, W.W.; Shabbir, A.; Yang, Z.; Zhu, J. A new k-ϵ eddy viscosity model for high reynolds number turbulent flows. Comput. Fluids 1995, 24, 227–238. [Google Scholar] [CrossRef]
  35. van Oijen, J.A.; de Goey, L.P.H. Modelling of premixed laminar flames using flamelet-generated manifolds. Combust. Sci. Technol. 2000, 161, 113–137. [Google Scholar] [CrossRef] [Green Version]
  36. Ren, M.; Wang, S.; Zhao, J.; Zou, C.; Roekaerts, D. Numerical study of a turbulent co-axial non-premixed flame for methanol hydrothermal combustion: Comparison of the EDC and FGM models. J. Supercrit. Fluids 2020, 169, 105132. [Google Scholar] [CrossRef]
  37. Smith, G.P.; Golden, D.M.; Frenklach, M.; Moriarty, N.W.; Eiteneer, B.; Goldenberg, M.; Bowman, C.T.; Hanson, R.K.; Song, S.; Gardiner, W.C.; et al. Available online: http://www.me.berkeley.edu/gri_mech/ (accessed on 23 November 2022).
  38. Correa, S.M. A Review of NO x Formation Under Gas-Turbine Combustion Conditions. Combust. Sci. Technol. 1992, 87, 329–362. [Google Scholar]
  39. Krieger, G.C.; Campos, A.P.V.; Takehara, M.D.B.; Alfaia Da Cunha, F.; Gurgel Veras, C.A. Numerical simulation of oxy-fuel combustion for gas turbine applications. Appl. Therm. Eng. 2015, 78, 471–481. [Google Scholar] [CrossRef]
  40. Bicen, A.F.; Jones, W.P. Velocity characteristics of isothermal and combusting flows in a model combustor. Combust. Sci. Technol. 1986, 49, 1–15. [Google Scholar] [CrossRef]
  41. Tamang, S.; Park, H. Numerical investigation of combustion characteristics for hydrogen mixed fuel in a can-type model of the gas turbine combustor. Int. J. Hydrogen Energy 2022, 5, 273. [Google Scholar] [CrossRef]
  42. Law, C.; Kwon, O. Effects of hydrocarbon substitution on atmospheric hydrogenair flame propagation. Int. J. Hydrogen Energy 2004, 29, 867–879. [Google Scholar] [CrossRef]
  43. Yin, C.; Zhang, R.; Zhang, C.; Fan, W. Numerical simulation on combustion and exhaust emission of staged combustor. IOP Conf. Ser. Earth Environ. Sci. 2017, 52, 12026. [Google Scholar] [CrossRef]
  44. Peters, N. Turbulent combustion. Meas. Sci. Technol. 2000, 125. [Google Scholar]
  45. Cai, X.; Fan, Q.; Bai, X.S.; Wang, J.; Zhang, M.; Huang, Z.; Alden, M.; Li, Z. Turbulent burning velocity and its related statistics of ammoniahydrogenair jet flames at high Karlovitz number: Effect of differential diffusion. Proc. Combust. Inst. 2022, 1–12. [Google Scholar] [CrossRef]
Figure 1. Schematic diagram of the calculation domain model.
Aerospace 10 00072 g001
Figure 2. Validation of the numerical model with experimental data [39,40].
Aerospace 10 00072 g002
Figure 3. Grid independence verification for velocity.
Aerospace 10 00072 g003
Figure 4. Centerline mean temperature profiles with different mesh densities.
Aerospace 10 00072 g004
Figure 5. Axial velocity distribution along the central axis. (a) constant energy input; (b) constant fuel mass flow rate.
Aerospace 10 00072 g005
Figure 6. Temperature distribution under different hydrogen volume fractions.
Aerospace 10 00072 g006
Figure 7. Temperature distribution under different hydrogen volume fractions.
Aerospace 10 00072 g007
Figure 8. The equivalence ratio distribution under different hydrogen volume fractions.
Aerospace 10 00072 g008
Figure 9. The high heat release rate zones in the combustion chamber.
Aerospace 10 00072 g009
Figure 10. Contours for the mass fraction of OH on the central plane of the combustor under different fuel conditions.
Aerospace 10 00072 g010
Figure 11. Contours for the mass fraction of OH on the central plane of the combustor under different fuel conditions.
Aerospace 10 00072 g011
Figure 12. Emission characteristics for hydrogen-methane fuels. (a) constant energy input; (b) constant fuel mass flow rate.
Aerospace 10 00072 g012
Figure 13. Pattern factor distribution at the outlet position of the combustor for different fuel conditions.
Aerospace 10 00072 g013
Table 1. The parameters under the conditions of constant energy input and fuel mass flow rate.
Hydrogen Volume Fraction (%)Hydrogen Mass Fraction (%)Fuel Mass Flow Rate (kg/s)Air Mass Flow Rate (kg/s)The Total Heat Energy Input (MW)
Case 1000.0512.2732.550
Case 2101.370.0512.2732.600
Case 3203.030.0512.2732.660
Case 4305.080.0512.2732.734
Case 5407.690.0512.2732.829
Case 66015.790.0512.2733.122
Case 78033.330.0512.2733.757
Case 8101.370.05002.2732.55
Case 9203.030.04892.2732.55
Case 10305.080.04762.2732.55
Case 11407.690.04592.2732.55
Case 126015.790.04172.2732.55
Case 138033.330.03462.2732.55
Table 2. The boundary conditions.
ParameterValue
Air inlet total pressure (MPa)1
Air inlet static temperature (K)600
Fuel inlet static temperature (K)300
Wall treatmentadiabatic wall
Pressure drop of the combustor4.9%
Table 3. The fuel residue at the combustor outlet under constant fuel mass flow rate.
Methane Mass Fraction at the OutletHydrogen Mass Fraction at the OutletTotal Fuel Mass Fraction at the OutletRelative Change (%)Hydrogen Consumption Rate (%)Methane Consumption Rate (%)
Case 17.4592 × 10−57.747 × 10−77.5367 × 10−50N/A99.75
Case 26.6058 × 10−519.261 × 10−76.7984 × 10−5−9.799.5499.78
Case 35.3478 × 10−529.753 × 10−75.6453 × 10−5−2599.6899.82
Case 44.4744 × 10−541.254 × 10−74.8869 × 10−5−35.299.7499.84
Case 53.5147 × 10−553.021 × 10−74.0449 × 10−5−46.399.7899.87
Case 62.2152 × 10−593.528 × 10−73.1477 × 10−5−58.299.8399.93
Case 74.62 × 10−55.55 × 10−51.0178 × 10⁻⁴+3599.4699.77
Table 4. The fuel residue at the combustor outlet under constant energy input.
Methane Mass Fraction at the OutletHydrogen Mass Fraction at the OutletTotal Fuel Mass Fraction at the OutletRelative Change (%)Hydrogen Consumption Rate (%)Methane Consumption Rate (%)
Case 17.4592 × 10−57.747 × 10−77.5367 × 10−50N/A99.75
Case 86.9732 × 10−517.513 × 10−77.1483 × 10−5−5.299.5899.76
Case 95.8619 × 10−525.749 × 10−76.11932 × 10−5−18.899.7199.79
Case 104.9990 × 10−534.012 × 10−75.33907 × 10−5−29.299.7699.82
Case 114.1124 × 10−541.106 × 10−74.52348 × 10−5−40.099.8099.84
Case 122.4253 × 10−552.363 × 10−72.94885 × 10−5−60.999.8999.89
Case 131.9986 × 10−51.099 × 10−53.09822 × 10⁻⁵−58.999.8999.86
Table 5. Emissions level of combustion chamber’s outlet.
CH2O Mass FractionOH Mass FractionC2H2 Mass FractionCO Emission (ppm)NOx Emission (ppm)
Case 147.2 × 10−82.21 × 10−845.5 × 10−1033.210.222
Case 236.9 × 10−82.57 × 10−832.9 × 10−1036.810.375
Case 323.0 × 10−83.03 × 10−819.0 × 10−1040.450.577
Case 414.9 × 10−83.62 × 10−811.9 × 10−1047.511.037
Case 59.23 × 10−84.45 × 10−87.04 × 10−1058.082.207
Case 65.11 × 10−87.47 × 10−83.55 × 10−1097.8717.5
Case 7N/AN/AN/A400.37109.94
Case 841.9 × 10−82.22 × 10−834.6 × 10−1030.490.249
Case 932.5 × 10−82.23 × 10−822.6 × 10−1026.270.250
Case 1026.1 × 10−82.24 × 10−815.8 × 10−1023.130.282
Case 1120.7 × 10−82.25 × 10−810.3 × 10−1019.400.306
Case 1211.5 × 10−82.41 × 10−83.51 × 10−1013.310.398
Case 13N/AN/AN/A9.391.028
Disclaimer/Publisher’s Note: The statements, opinions and data contained in all publications are solely those of the individual author(s) and contributor(s) and not of MDPI and/or the editor(s). MDPI and/or the editor(s) disclaim responsibility for any injury to people or property resulting from any ideas, methods, instructions or products referred to in the content.

