Article

Spatio-Temporal Assessment of Satellite Estimates and Gauge-Based Rainfall Products in Northern Part of Egypt

National Water Research Center, Environment and Climate Changes Research Institute, Cairo 13621, Egypt
Climate 2022, 10(9), 134; https://doi.org/10.3390/cli10090134
Submission received: 26 July 2022 / Revised: 14 September 2022 / Accepted: 14 September 2022 / Published: 19 September 2022

Abstract

:
Egypt’s climate is generally dry all over the country except for the Northern Mediterranean Coast. The Egyptian Meteorological Authority (EMA) uses few meteorological stations to monitor weather events in the entire country within the area of one million square kilometers, which makes it scarce with respect to spatial distribution. The EMA data are relatively expensive to obtain. Open access rainfall products (RP) are commonly used to monitor rainfall as good alternatives, especially for data-scarce countries such as Egypt. This paper aims to evaluate the performance of 12 open access rainfall products for 8 locations in the northern part of Egypt, in order to map the rainfall spatial distribution over the northern part of Egypt based on the best RP. The evaluation process is conducted for the period 2000–2018 for seven locations (Marsa-Matrouh, Abu-Qeir, Rasheed, Port-Said, Tanta, Mansoura, and Cairo-Airport), while it is conducted for the period 1996–2008 for the Damanhour location. The selected open access rainfall products are compared with the ground stations data using annual and monthly timescales. The point-to-pixel approach is applied using four statistical indices (Pearson correlation coefficient (r), Nash–Sutcliffe efficiency (NSE), root mean square error (RMSE) and bias ratio (Pbias)). Overall, the results indicate that both the African Rainfall Estimation Algorithm (RFE) product and the Climate Prediction Center (CPC) product could be the best rainfall data sources for the Marsa-Matrouh location, with relatively higher r (0.99–0.93 for RFE and 0.99–0.89 for CPC) and NSE (0.98–0.79 for RFE and 0.98–0.75 for CPC), in addition to lower RMSE (0.94–7.78 for RFE and 0.92–12.01 for CPC) and Pbias (0.01–11.95% for RFE and −2.22–−12.15% for CPC) for annual and monthly timescales. In addition, the Global Precipitation Climatology Centre (GPCC) and CPC give the best rainfall products for the Abu-Qier and Port-Said locations. GPCC is more suitable for the Rasheed location. The most appropriate rainfall product for the Tanta location is CHIRPS. The current research confirms the benefits of using rainfall products after conducting the recommended performance assessment for each location.

1. Introduction

Several climate datasets were developed using the observations of a meteorological station. For instance, the Global Historical Climatology Network is an integrated database with more than 30,000 meteorological stations and observations covering the entire 20th century. However, gauge observations have several weaknesses, for example, they have insufficient coverage and shortcomings throughout the majority of oceanic and sparsely inhabited areas [1]. Hybrid systems, including satellite observations, the microwave (MW) technique and advanced infrared (IR), provide spatio-temporal homogeneous coverage for most areas of the globe [2].
Currently, several satellite-derived datasets exist, such as, the Tropical Rainfall Measuring Mission (TRMM), the Climate Prediction Center (CPC), the Precipitation Estimation from Remotely Sensed Information using Artificial Neural Networks (PERSIANN), and the Climate Prediction Center morphing method (CMORPH) [3,4,5]. Moreover, products merging remote sensing and gauge station datasets were achieved to enhance the accuracy of meteorological parameter monitoring. One of the most frequent products utilized in numerous meteorological studies is the monthly Global Precipitation Climatology Project (GPCP) analysis, which combines gauge observations with low-orbit satellite MW data and geosynchronous-orbit satellite IR data [6].
Typically, rainfall products are gauge observations, gauge-based precipitation products, satellite estimates, and reanalysis systems.

1.1. Gauge Observations

The World Meteorological Organization (WMO) is a 191-member intergovernmental organization tasked with compiling all data from different countries into a single worldwide dataset. WMO supports the creation of gauge observation networks in the disciplines of climatology, geophysics, and hydrology, as well as the interchange, processing, and standardization of associated data. It is estimated that between 150,000 and 250,000 real-time rainfall gauges were in use around the world [7]. There is a wide range of estimations due to the varied criteria used to count gauges. Despite the fact that there are several gauges, not all of them have been utilized consistently or at the same time [1]. WMO collects various meteorological ground-based measurements through a global network of around 10,000 weather stations [8].
This number of gauges is so limited to conduct specified hydrological/weather/climatic studies. Thus, the other data sources/technologies are used to cover the shortage of precipitation data all over the world.

1.2. Gauge-Based Rainfall Products

As a result of the random distribution of rainfall ground stations, data gridding is essential for achieving different environmental investigations. Several gridded rainfall datasets based solely on gauge data are developed and are widely used. The CRU TS (Climatic Research Unit gridded Time Series) dataset contains 10 observed and calculated variables and provides a monthly high-resolution grid for land. In the defined domain, there are no missing values. Individual station series are anomalized using observations from 1961 to 1990, then gridded to a 0.5° regular grid [9]. There are four versions from CRU TS. The newest one is CRU TS V4, which was modified to include additional station observations from 1901 to 2018 [10].
The Global Precipitation Climatology Centre (GPCC) has established cutting-edge capabilities for data collection, quality control, and quality assurance, as well as the analysis of rainfall ground gauge data from throughout the world. The core dataset for the GPCC is provided by national meteorological organizations. Most gauges’ datasets used in the GPCC database come from 158 nations and 31 regional suppliers [11].
Accordingly, the CPC was constructed as a monthly precipitation dataset beginning in 1948 to meet the need for a high-quality and observation-based values. The CPC Gauge-Based Analysis of Global Daily Precipitation (CPC-Global) was the first product from the CPC Unified Precipitation Project in progress at the National Oceanic and Atmospheric Administration (NOAA) [12]. The WMO GTS, the Cooperative Observer Network (COOP), and other sources are included in the CPC-Global package, which contains reports from 30,000 ground stations.
The production of these databases is filled with challenges. In 1901, the GPCC had roughly 10,900 operable stations around the world. This number rose to almost 49,470 in 1970, then dropped to 30,000 in 2005, and finally to around 10,000 in 2012 [12,13].

1.3. Satellite Estimates

Satellite systems are vital tools for monitoring global atmospheric parameter measurements at regular intervals. They provide spatially continuous datasets that can help to advance the knowledge in climate-related activities/phenomena [14]. TRMM_3B42 and TRMM_3B43 are the most extensively used products from TRMM. They include estimates of rainfall from multiple satellites [15]. TRMM_3B43 combines the TRMM_3B43 dataset with the GPCC rainfall gauge analysis [16].
The Global Precipitation Measurement (GPM) mission is a global satellite network that provides next-generation global snow and rainfall datasets. The success of TRMM performance led to the development of the GPM using an advanced radar/radiometer system to detect precipitation from space. It can replace the TRMM satellite and improve the accuracy of rainfall data [17].
GPM and TRMM satellites currently have in-space precipitation radars. This precipitation radar generates 3D maps of the storm structure. Knowing the time between transmitting the signal and measuring, the reflected signal produces the 3D maps. This provides information on the rainfall’s intensity and dispersion, as well as the type of rainfall and the ice layer [18].
From 1983 until now, PERSIANN-CDR gives daily rainfall estimates with a spatial resolution of 0.25 degrees [19]. CPC Merged Analysis of Precipitation (CMAP) [20] and GPCP are the most widely used precipitation models [6,21]. The GPCP 1° daily precipitation analysis (GPCP 1dd) was established to help with initialization in mathematical models, driving land-surface models, determining precipitation advance and retreat, and evaluating forecasting models [22].
The Climate Hazards Group (CHG) developed the Climate Hazards Group Infra-Red Precipitation Station (CHIRPS) product [23]. CHIRPS is the third-generation precipitation procedure based on various interpolation schemes to create spatially continuous grids from raw point data [24]. From 1981 to near-present, CHIRPS provides precipitation data with a 0.05° resolution. In addition, it helps in drought monitoring. Furthermore, The Africa Rainfall Climatology V2 (ARC2) and the African Rainfall Estimation Algorithm V2 (RFE 2.0) provide daily precipitation estimations over Africa at high spatial resolution.

1.4. Reanalysis Systems

Since the early 1980s, steady progress in numerical climate prediction led to better description of the global atmospheric circulation as observed during the recent past. This was accomplished by “reanalysis,” which is a consistent reprocessing of archived climate observations using modern forecasting/mathematical simulation systems. Reanalysis generates gridded multidecadal datasets that estimate a wide range of atmospheric, sea-state, and land-surface parameters, including those that are not directly observed. Millions of observations are reanalyzed to create a stable data assimilation system. In this research, we do not address this type of rainfall product due to its limitations, where reanalysis reliability can considerably vary depending on the location, time period, and variable considered. In addition, reanalysis output for rainfall and evaporation has to be utilized with extreme caution since “the changing mix of observations, and related biases of observations and models, can introduce spurious variability and trends into reanalysis output” [25].
Before using the rainfall products in any study, these products have to be evaluated locally for the study location, where the previous studies prove that each product can give satisfactory results in a certain location in a certain time/period and this product can give unsatisfactory results in other locations or in other times/periods in the same location. For example, several studies reported that CMORPH give underestimated values in Turkey and Malaysia [26,27]. On the contrary, different studies reported that CMORPH have the best performance in China and Vietnam [28,29]. Furthermore, Pang et al. (2020) [30] pointed out that CPC generally underestimates rainfall of all magnitudes over Jialing River watershed, China. On the other hand, Salehie et al. (2021) [31] pointed out that CPC is the best product for 20 out of 55 stations analyzed over Amu Darya River basin, China. Although Wang and Zhao (2022) [32] reported that TRMM shows the highest accuracy in spring and autumn over Heihe River Basin, Northwest China, they additionally reported that Multi-Source Weighted Ensemble Precipitation (MSWEP), and CRU show the highest accuracy in summer and winter, respectively. Moreover, Duan et al. (2015) [28] pointed out that PERSIANN had the worst performance among three products (TRMM-3B42, CMORPH and PERSIANN) at all cases over Subtropical Watershed in China. On the contrary, Wang and Zhao (2022) [32] pointed out that PERSIANN (in addition to CRU and ERA5) show the most accurate results in the different reaches of the Heihe River Basin in China.
In this research, performances of the selected RP (TRMM, ARC, RFE, Chirps, CMORPH. CPC, CRU, GPCC, GPCP_1DD, GPCP, PERSIANN and TAMSAT) are evaluated at the Northern Part of Egypt using different statistical indicators (r, NSE, RMSE and Pbias). RP evaluation processes are conducted to map the rainfall spatial distribution over northern part of Egypt based on the best RP; this leads to enhancing the accuracy of the water mass balance calculation and water accounting in the study area at monthly, seasonal and annual levels. Study locations and used rainfall data are mentioned under Section 2. In addition, the used statistical indicators are presented in Section 2. The results are presented in Section 3 under headings Section 3.1, Section 3.2, Section 3.3 and Section 3.4. Annual rainfall distribution for the investigated 12 RP and the ground stations followed by the evaluation of annual rainfall products are presented under headings Section 3.1 and Section 3.2. Moreover, monthly rainfall distribution for the investigated 12 RP and the ground stations followed by the evaluation of monthly rainfall products are presented under headings Section 3.3 and Section 3.4. Conclusion is drawn to summarize the best RP in the investigated 8 locations under Section 4.

2. Methodology

2.1. Study Area

Egypt’s climate is generally dry all over the country except on the North Mediterranean Zone, which receives rainfall with rates within 200 mm yearly. Assessment of the open access rainfall products is achieved for the north part of Egypt, which covers 8 observation locations (Marsa-Matrouh, Abu-Qeir, Rasheed, Port-Said, Damanhour, Tanta, Mansoura and Cairo-Airport), Figure 1.

2.2. Evaluation Rainfall Products

Several datasets can be used for rainfall monitoring. In this paper, daily rainfall data from 12 rainfall products (RP) were downloaded and processed to assess the most successful products to monitor rainfall at the study locations. The choice of these datasets passed through different levels of selections under the following conditions: (i) data resolutions are not below 1° × 1°, (ii) the datasets are verified using ground measurements, and (iii) the datasets cover a duration that is longer than 15 years of recorded data, where some datasets covered short periods, such as CHOMPS: CICS High-Resolution Optimally Interpolated Microwave Precipitation from Satellites (1998–2007) and NASA Energy and Water cycle Study (NEWS) Climatology of the 1st Decade of the 21st Century Dataset (1998–2010). The evaluated Rainfall Products (RP) are listed in Table 1.

2.3. Used Ground Stations

Daily rainfall data for eight ground stations in the northern part of Egypt were purchased, under the ordinary research plan of National Water Research Center 2020/2021, from the Egyptian Meteorological Authority (EMA). EMA data were used for evaluation and testing the performance of mentioned RP. The investigated period for all stations was from January 2000 to December 2018, except for Damanhour. Its data were from January 1996 to December 2008, at which point the investigation stopped (Figure 1).

2.4. Statistical Evaluation of Rainfall Products

The statistical evaluation was conducted on monthly (except June, July and August because the rainfall equal zero in these months [47]) and annual timescales (aggregated from the obtained daily rainfall data) for the considered time duration. As mentioned in the literature, daily timescale was ignored in this research as a result of low performance of RP [48]. This is due to the measurement time mismatch between ground stations and satellite rainfall products, since satellites have certain time for pathing. In addition, CRU and GPCC datasets are only available for monthly timescale; therefore, comparative assessment for daily timescale will be unable to be undertaken with other RP.
Statistical evaluation process typically uses two approaches. The first one compares pixel-to-pixel between interpolated ground station rainfall datasets and RP datasets. Point-to-pixel is the second approach, which compares between RP estimates that extracted for ground stations location (from the pixel) and ground station rainfall datasets. Point-to-pixel approach was applied in the current research. This is due to the fact that the eight ground stations that were used were not evenly distributed across the research region, which was necessary for the first approach to accurately capture spatial variability in rainfall. Tested durations were unequal, as well.
On an annual and monthly timescale, the performance of the investigated RP was assessed using various statistical indices. Pearson correlation coefficient (r), Nash–Sutcliffe efficiency (NSE), root mean square error (RMSE) and bias ratio (Pbias) were applied [49,50,51]. The Pearson correlation coefficient (r) evaluates how well the estimates (from RP) correspond to the observed rainfall values, NSE demonstrates how well the estimate (from RP) predicted the observed rainfall time series, RMSE measures the average magnitude of the estimate errors, and Pbias reflects how the estimated rainfall can either overestimate or underestimate the rainfall ground observations. Table 2 lists mathematical descriptions of the applied statistical indices.

3. Results and Discussions

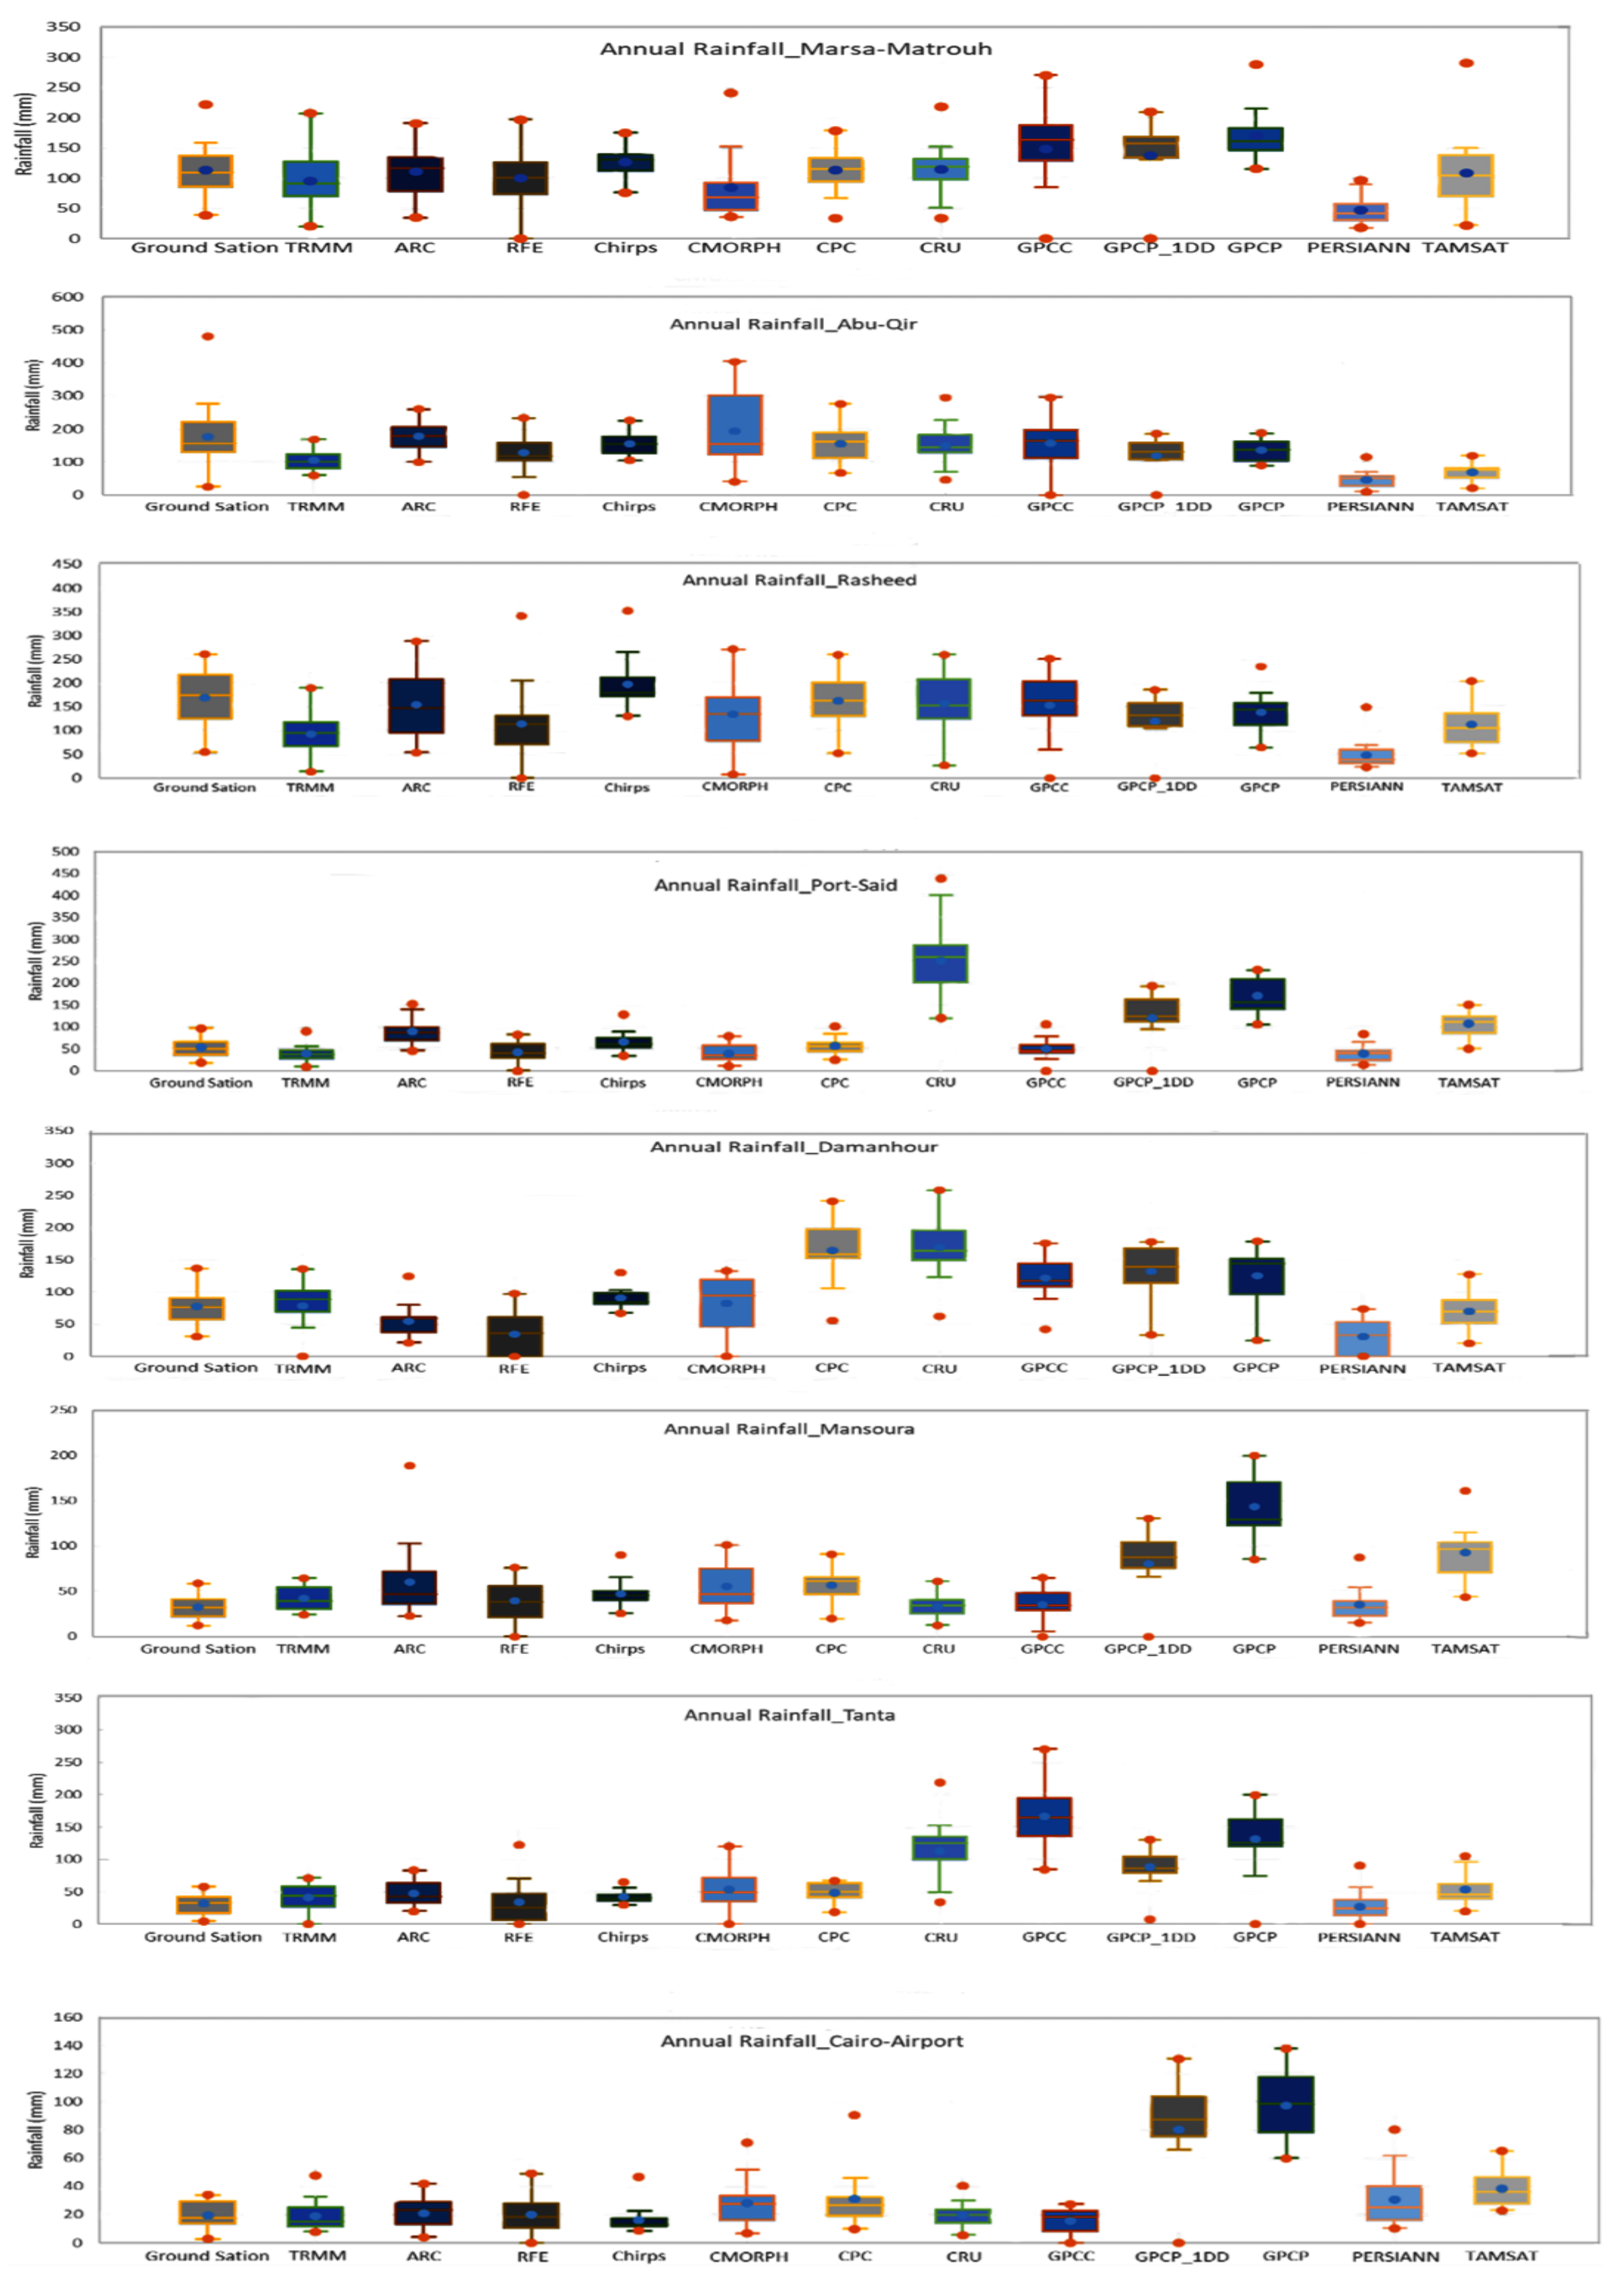
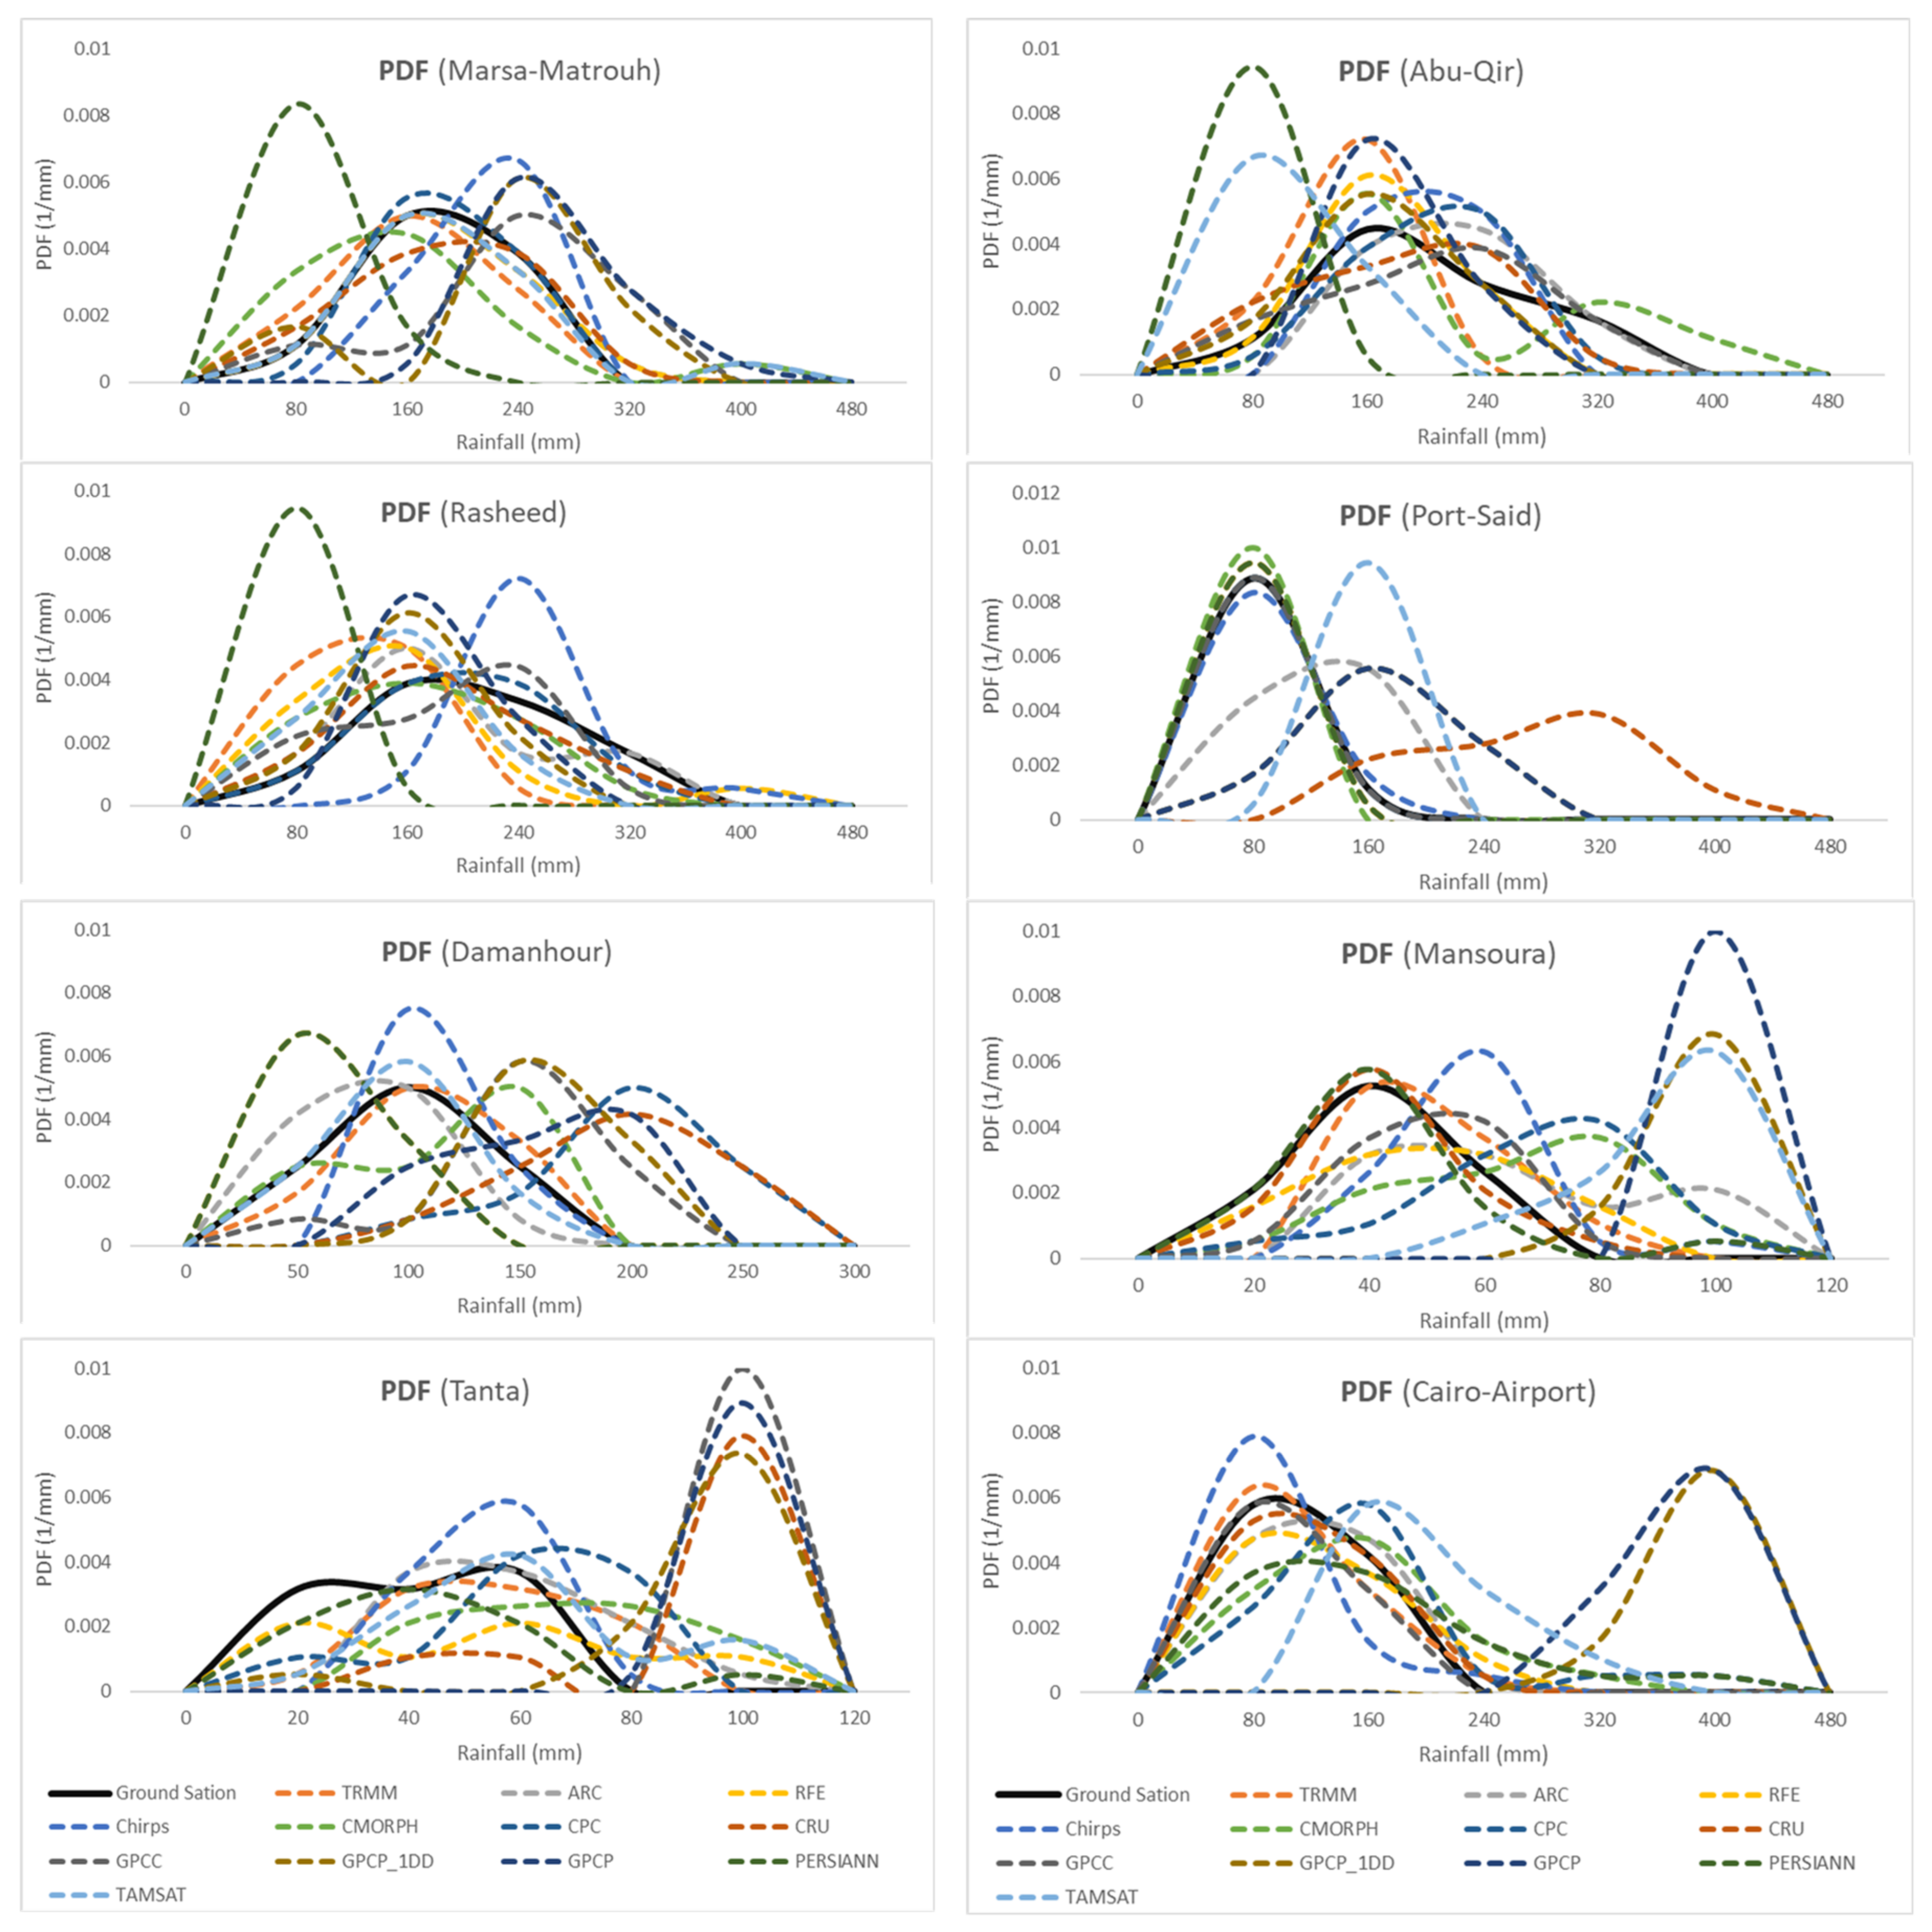
3.1. Annual Rainfall Distribution

According to the investigated ground stations, the average annual rainfall figures for the considered duration were 112.8, 177.2, 169.3, 53.5, 77.5, 32.7, 32.4 and 19.4 mm/year for Marsa-Matrouh, Abu-Qier, Rasheed, Port-Said, Damanhour, Mansoura, Tanta and Cairo-Airport, respectively. Generally, total annual rainfall range estimates were significantly different among examined RP. Some groups of RP gave overestimated values, while the other groups gave underestimated values. For example, the minimum rainfall, maximum rainfall, mean and standard deviation for Marsa-Matrouh ground station were 93.1, 221.2, 112.8 and 41.6 mm/year, respectively, while the same statistics from GPCP were 84.9, 270.3, 147.7 and 65.2 mm/year. On the contrary, the same statistics from PERSIANN were 18.2, 97.1, 47.4 and 22.9 mm/year. In this regard, Marsa-Matrouh ground station recorded about 60% of annual rainfall between 120 and 150 mm, while PERSIANN recorded 67% of annual rainfall with 30 mm. In most cases, GPCP gave overestimated values, while PERSIANN gave underestimated values for the investigated locations. Moreover, the behavior of each RP varied from one location to the other. For example, GPCC provided very close values at Rasheed and provided overestimated values at Tanta. In the same manner, CRU provided very close values at Marsa-Matrouh and Rasheed, which is consistent with the findings of previous studies in China and Nigeria [32,52], and provided overestimated values at Damanhour and Tanta, which is consistent with the previous study in Burundi [53]. Figure 2 shows box-plots of annual rainfall for evaluated RP for all studied locations, while Figure 3 shows the Probability Density Function (PDF) Plot of annual rainfall for the evaluated RP for all studied locations.

3.2. Evaluation of Annual Rainfall Products

Four statistical indices were used to evaluate the performance of the tested Rainfall Products (RP) on an annual timescale. Table 3 lists the results of statistical evaluation indices (r, NSE, RMSE and Pbias) that were calculated for the evaluated RP compared with rainfall gauges on an annual timescale for all studied locations. In Table 3, values with an asterisk means that the related product is the best RP on the annual timescale for that location, while an italic value means that the value of the mentioned indicator is sufficient.
For Marsa-Matrouh, several RP have acceptable values for r, where r equals 0.916, 0.912, 0.823, 0.811, 0.770 and 0.671 for CPC, ARC, TRMM, Chirps, CRU and GPCC, respectively. In addition, NSE values were satisfactory for CPC and ARC with values of 0.836 and 0.818, respectively. Furthermore, RMSE and Pbias gave the lowest values for CPC and ARC. The previous analyses mean that the best products on an annual timescale for Marsa-Matrouh are CPC and ARC.
For Abu-Qier, the best RP on an annual timescale was ARC (without reaching to sufficient values of statistical indices) with values of 0.42, 0.17, 86.132 mm and −0.777% for r, NSE, RMSE and Pbias, respectively.
The Pearson correlation coefficient for Rasheed was sufficient for GPCC, TRMM, CMORPH and ARC. The best RP on an annual timescale was GPCC with values of 0.877, 0.629, 38.327 mm and 9.529% for r, NSE, RMSE and Pbias, respectively. For Port-Said, the best RP on an annual timescale was CPC with values of 0.943, 0.862, 8.703 mm and −5.354% for r, NSE, RMSE and Pbias, respectively. For Damanhour, the best RP on an annual timescale was Chirps (without reaching to sufficient values of statistical indices) with values of 0.556, 0.122, 23.891 mm and −16.913% for r, NSE, RMSE and Pbias, respectively. Hessels, 2015 [18], checked the performance of 13 RP on the Nile Basin. He reported that Chirps and TRMM-3B42V7 were the best RP.
Regarding Mansoura, the best RP on an annual timescale was TRMM (without reaching to sufficient value of NSE) with values of 0.742, 0.047, 13.813 mm and −29.651% for r, NSE, RMSE and Pbias, respectively. With respect to Cairo-Airport, the best RP on an annual timescale was ARC with values of 0.802, 0.505, 6.751 mm and −8.729% for r, NSE, RMSE and Pbias, respectively. Finally, all RP gave unsuitable values of annual rainfall comparing with Tanta ground station. It can be concluded that the best RP on an annual timescale was ARC for three locations. On the other hand, PERSIANN and TAMSAT were the worst RP for all studied locations. This result is consistent with Gadouali and Messouli (2020) [54]; they reported that PERSIANN-CDR exhibited the worst performance over Morocco.

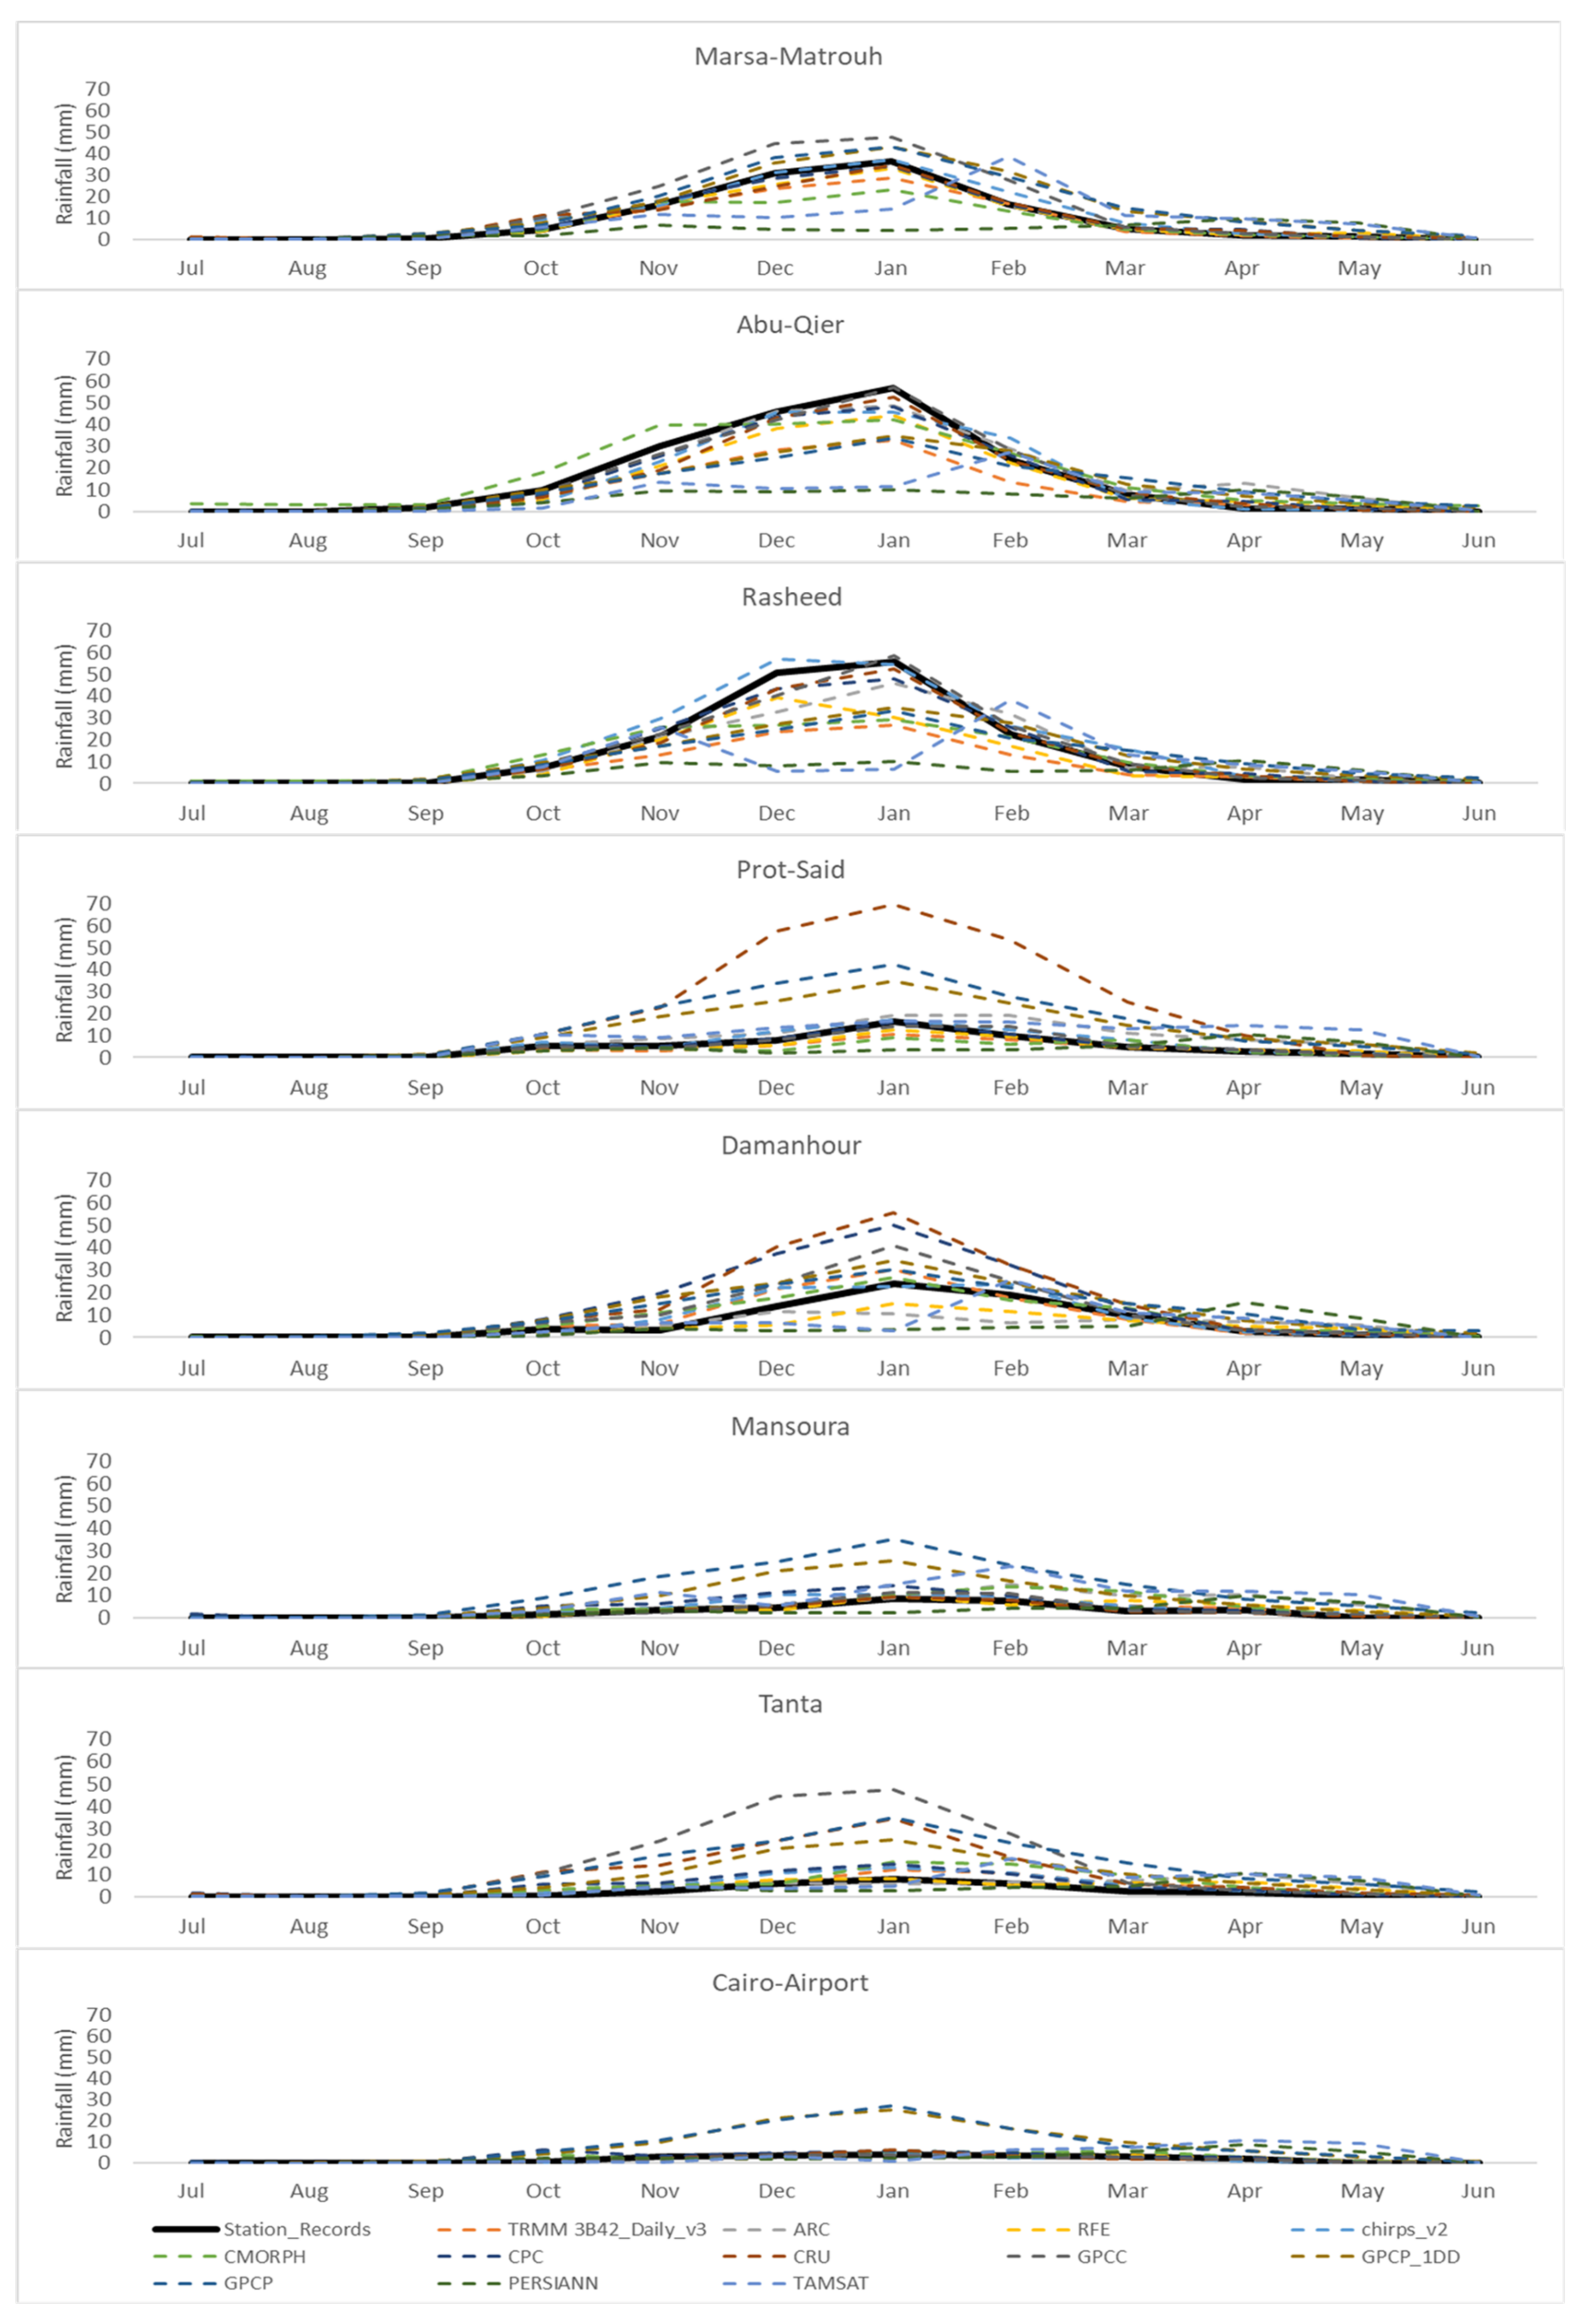
3.3. Monthly Rainfall Distribution

According to Figure 4, rainfall at all locations in June, July and August equal zero. The maximum rainfall occurs in winter (December, January and February). Marsa-Matrouh ground station recorded 36.26 mm as an average monthly rainfall in January, while it varied between 4.02 mm using PERSIANN and 47.70 mm using GPCC. Monthly rainfall of GPCC and GPCP_1DD were overestimated for all months. On the other hand, monthly rainfall of PERSIANN was underestimated for all months, while the other RP gave satisfactory monthly rainfall. Most RP gave underestimated monthly rainfall compared with Abu-Qier ground station in Winter, while they gave overestimated monthly rainfall compared with Abu-Qier ground station in Spring. GPCC and CRU gave very closed data to Abu-Qier ground station for all months, while PERSIANN gave underestimated monthly rainfall. In the same manner, Most RP gave underestimated monthly rainfall compared with Rasheed ground station in Winter, while they gave overestimated monthly rainfall compared with Rasheed ground station in Spring. Moreover, CPC, GPCC and CRU provided very closed monthly rainfall to Rasheed ground station for all months, while PERSIANN provided underestimated monthly rainfall. CRU, GPCP and GPCP_1DD gave very high monthly rainfall compared with Port-Said ground station, while CPC gave very closed monthly rainfall to Port-Said ground station. CMORPH gave sufficient monthly rainfall compared with Damanhour ground station for all months except November. It is not consistent with Tan et al., 2015 [27]. They reported that CMORPH gave significantly underestimated rainfall in Malaysia. Most of the RP gave underestimated monthly rainfall compared with Mansoura ground station. CRU, TRMM and GPCC gave acceptable monthly rainfall compared with Mansoura ground station for most months. Most of the RP gave underestimated monthly rainfall compared with Tanta ground station. RFE gave acceptable monthly rainfall compared with Tanta ground station for most months. Most of the RP gave sufficient monthly rainfall compared with Cairo-Airport ground station for all months except GPCP_1DD, GPCP, PERSIANN and TAMSAT.
For all investigated locations, TAMSAT provided opposite distributions compared with each ground station, where it gave underestimated monthly rainfall in winter, while it provided overestimated monthly rainfall in spring. Wedajo et al., 2021 [48] reported that TAMSAT gave overestimated monthly rainfall for the Dhidhessa River Basin, Ethiopia, as well.

3.4. Evaluation of Monthly Rainfall Products

Monthly statistical evaluation results for each RP at the studied locations were presented in spider charts, Figure 5. Statistical evaluation indices (r, NSE, RMSE and Pbias) were used to evaluate the performance of each RP at each location.
For Marsa-Matrouh, r values were higher than 0.9 for GPCC, RFE, ARC and CPC at January, February, March, October, November and December. With reference to r and NSE at Marsa-Matrouh, different RP have high values in January, but RFE gave the best values of r and NSE with 0.98 and 0.92, respectively. In addition, in February, RFE and CPC gave 0.98 and 0.95 for the same indices. In March, RFE, CPC, ARC and GPCC provided high values at 0.99 and 0.98 for r and NSE, respectively. Furthermore, in April and October RFE and ARC provided the higher values for r and NSE. In October, November and December, RFE, ARC and CPC gave the best values for r and NSE. On the other hand, all RP did not achieve any sufficient efficiency for monitoring rainfall at Marsa-Matrouh in May and September. From October to March, the lowest RMSE values were for RFE, ARC and CPC. RMSE values for RFE ranged between 0.94 mm in March and 7.79 mm in December as a lowest average magnitude of the estimate errors between different RP at Marsa-Matrouh. Moreover, for the same period and location, RFE and ARC have the lowest values of Pbias. Values of Pbias for RFE ranged between 0.01% in March and 11.95% in December as a lowest bias ratio. From the previous analyses, RFE then ARC then CPC can be considered the best RP at Marsa-Matrouh for all months except May and September. A similar finding was reported in a prior study over Morocco (similar climate to that of Marsa-Matrouh) [53], through assessing the performance of TRMM-3B42V7, ARC2, RFE2.0 and PERSIANN-CDR; they reported that the best RP was RFE2.0 and ARC2.
Regarding r and NSE results at Abu-Qier in January, GPCC gave the best values of r and NSE with values of 0.82 and 0.66, respectively. It was only GPCC that gave acceptable values for r and NSE in May at 0.76 and 0.5. In September, several RP have high values, but ARC gave the best values of r and NSE at 1.0 and 0.79, respectively. It was only TRMM that gave acceptable values for r and NSE in October at 0.84 and 0.63. In December, GPCC provided the best values for r and NSE at 0.91 and 0.68, respectively. On the contrary, all RP did not achieve any sufficient efficiency for monitoring rainfall at Abu-Qier in February, March, April and December. The lowest values of RMSE and Pbias were obtained at the best RP values. For example, RMSE and Pbias for GPCC at Abu-Qier in January were 23.07 mm and 2.69%, respectively. Form the previous analyses, GPCC had the best RP at Abu-Qier in January, May and November. This result is consistent with Nie and Sun, 2020 [54], who evaluated 11 RP over Southwest China. They reported that GPCC gives the best performances.
For Rasheed data, GPCC gave the best values for r and NSE in January and February (0.88 and 0.77 in January and 0.83 and 0.66 in February, respectively). Different RP gave acceptable values for r and NSE in March, but CRU provided the best values of r and NSE at 0.92 and 0.85, respectively. Chirps and RFE gave acceptable values for r and NSE in September. It was only TRMM that gave sufficient values for r and NSE in October at 0.86 and 0.7, respectively, while GPCC gave sufficient values for r and NSE in November at 0.85 and 0.7, respectively. On the other hand, all RP did not achieve any sufficient efficiency for monitoring rainfall at Rasheed in April, May and December. RMSE in January was variable at 17.72 mm in GPCC and 62 mm in TAMSAT and PERSIANN, while Pbias varied from −0.14% in GPCC to 94.38% in PERSIANN. Generally, GPCC had the best RP at Abu-Qier in January, February and November, and gave acceptable rainfall values in March, which is consistent with findings of previous studies in China and Nigeria [52,55].
For Port-Said data, CPC provided acceptable values for r and NSE in all months. Values of r varied between 0.99 in January and March and 0.83 in October, and values of NSE varied between 0.97 in January and March and 0.67 in October. In addition, GPCC provided acceptable values for r and NSE in all months except for February. The acceptable values for r varied between 0.99 in March, May and December and 0.86 in September, and values for NSE varied between 0.97 in March and 0.65 in September. Furthermore, RFE provided acceptable values for r and NSE in all months except March, May and September. The acceptable values for r varied between 0.94 in January and 0.89 in October, and values of NSE varied between 0.81 in January and 0.65 in October. In addition, TRMM gave acceptable values in March, April and October. CPC and GPCC gave the lowest values of RMSE and Pbias for all months, as well. Thus, CPC and GPCC can be considered the best RP at Port-Said.
Regarding the Damanhour rainfall data, several RP gave high values for r, but they gave unacceptable values for NSE. This means that RP values corresponded to the observed rainfall events (high relation and high bias). However, RP values were not a good prediction for the observed rainfall time series. Only GPCP gave acceptable values of r and NSE, in February, with rainfall of 0.77 and 0.5, respectively. Different RP gave acceptable values of r and NSE in March, but TRMM provided the best values of r and NSE with 0.94 and 0.76, respectively. Furthermore, CRU gave the best values of r and NSE with 0.97 and 0.91, respectively in May. On the other hand, all RP did not achieve any sufficient efficiency for monitoring rainfall at Damanhour in January, April, September, October, November and December. As r and NSE were low in most RP in most months, RMSE and Pbias were high for the same RP.
With respect to Mansoura, in March and April, GPCC gave acceptable values of r and NSE with 0.85 and 0.70, respectively. In addition, in October, RFE, GPCC and CRU gave acceptable values of r and NSE. However, RFE gave the best values with 0.98 and 0.77, respectively. On the contrary, all RP did not achieve any sufficient efficiency for monitoring rainfall at Mansoura in January, February, May, September, November and December. Furthermore, the best values for RMSE and Pbias were for GPCC in March and April in addition to RFE, GPCC and CRU in October.
With respect to Tanta, only CPC gave acceptable values of r, NSE, RMSE and Pbias with 0.78, 0.55, 3.14 mm, and −30.95%, respectively, in March, while, in May, CMORPH gave the best r, NSE, RMSE and Pbias with 0.78, 0.55, 2.17 mm and −29.55%, respectively. On the contrary, all RP did not achieve any sufficient efficiency for monitoring rainfall at Tanta in the remaining months.
At Cairo-Airport, GPCC was the dataset that gave the best values for r, NSE (higher than 0.85) in January, February and October. In addition, ARC gave the best values of r, NSE (higher than 0.80) in March, November and December. Furthermore, GPCC and ARC gave the best values for RMSE and Pbias. It was noted that all RP and the ground station at Cairo-Airport did not record rainfall in September.

3.5. Spatial Distribution Mapping of Monthly and Annual Rainfall

Table 4 lists summary results of the best RP on monthly and annual timescales at the investigated locations. Two asterisks represents the best RP with acceptable values of statistical indices (r is more than 0.65 and NSE is more than 0.50), while one asterisk represents the best RP with non-acceptable values of statistical indices (r is less than 0.65 and NSE is less than 0.50). Table 4 indicates that GPCC, CPC, RFE, TRMM and Chirps were considered the best RP for spatial and temporal rainfall monitoring. It is consistent with Gebremicael et al., 2018 [56], who assessed the performance of five satellite RP (TRMM, Chirps, RFE, PERSIANN and CMORPH) over the Tekeze-Atbara basin in Ethiopia. They reported that Chirps, TRMM, and RFE gave the best RP on all spatiotemporal scales. In addition, Hessels, 2015 [18], checked the performance of 13 RP on the Nile Basin. He reported that TRMM-3B42V7 and Chirps were the best RP. On the other hand, PERSIANN, GPCP and GPCP-1DD did not achieve any efficiency in rainfall monitoring at the investigated locations. Our result is consistent with a previous study by Tan et al. (2015) [27], who reported that PERSIANN and GPCP-1DD designated the worst RP performance over Malaysia. Based on the best RP that was reported in Table 4, the spatial distribution mapping of average monthly and annual rainfall using the best RP has been conducted using the ANUDEM method for interpolation [57]. Figure 6 shows the mentioned spatial distribution mapping for the study area.

4. Conclusions

Several rainfall products are available to be used in climate studies in case of a lack of ground rainfall stations. Wedajo et al., 2021 [48], reported that “RP contain uncertainties attributed to errors in measurement, sampling, retrieval algorithm and bias correction processes. Furthermore, the accuracy of the rainfall estimation algorithm is influenced by topography and climate conditions of the monitored area”. Therefore, before they are utilized in any study, RP have to be assessed locally for each area. In the current research, the performance of twelve RP datasets (TRMM, ARC, RFE, Chirps, CMORPH. CPC, CRU, GPCC, GPCP_1DD, GPCP, PERSIANN and TAMSAT) is statistically evaluated. The point-to-pixel approach is applied using four statistical indices (Pearson correlation coefficient (r), Nash–Sutcliffe efficiency (NSE), root mean square error (RMSE) and bias ratio (Pbias)).
The results generally reveal that GPCC, CPC, ARC and RFE have promising RP potential for use at different locations (i.e., Port-Said and Marsa-Matrouh), with r and NSE being greater than 0.70 and 0.64, respectively. Generally, in most months, the statistical analysis results indicate that the performances of GPCC and Chirps are the best in January, while in February and March, CPC achieved the best performance for rainfall simulation. The statistical indices show that GPCC performs the best in estimating and detecting rainfall at most locations in April, October and November. In addition, TRMM had the best performance in December. On the other hand, PERSIANN and GPCP_1DD do not achieve acceptable values for most locations. For the annual timescale, the best RP for Marasa-Matrouh and Port-Said is CPC, with r, NSE, RMSE and Pbias being equal to 0.91, 0.82, 17.3, and 1.7, respectively, while the best RP for Abu-Qier and Cairo-Airport is ARC. Furthermore, Chirps is the best RP for Damanhour and Tanta. Additionally, GPCC is the best RP for Rasheed, while TRMM is the best RP for Mansoura. It is recommended that we can carefully use several RP in climate studies after evaluating their performance.

Funding

This work was financially supported by Environment and Climate changes Research Institute, National Water Research Center, Egypt, research plan funding 2020/2021.

Institutional Review Board Statement

Not applicable.

Informed Consent Statement

Not applicable.

Data Availability Statement

Ground stations rainfall data purchased from the Egyptian Meteorological Authority (EMA). Satellite Estimates and Gauge-Based Rainfall Products of TRMM, ARC, RFE, Chirps, CMORPH. CPC, CRU, GPCC, GPCP_1DD, GPCP, PERSIANN and TAMSAT.

Conflicts of Interest

The author declares that have no conflict of interest with anyone or anything related to this manuscript or this journal.

References

  1. Kidd, C.; Becker, A.; Huffman, G.J.; Muller, C.L.; Joe, P.; Skofronick-Jackson, G.; Kirschbaum, D.B. So, how much of the Earth’s surface is covered by rain gauges? Bull. Am. Meteorol. Soc. 2017, 98, 69–78. [Google Scholar] [CrossRef] [PubMed]
  2. Kidd, C.; Levizzani, V. Status of satellite precipitation retrievals. Hydrol. Earth Syst. Sci. 2011, 15, 1109–1116. [Google Scholar] [CrossRef]
  3. Huffman, G.J.; Pendergrass, A.; National Center for Atmospheric Research Staff (Eds.) Last Modified 20 March 2021. The Climate Data Guide: TRMM: Tropical Rainfall Measuring Mission. Available online: https://climatedataguide.ucar.edu/climate-data/trmm-tropical-rainfall-measuring-mission (accessed on 21 November 2021).
  4. Sinta, N.S.; Mohammed, A.K.; Ahmed, Z.; Dambul, R. Evaluation of Satellite Precipitation Estimates Over Omo–Gibe River Basin in Ethiopia. Earth Syst. Environ. 2022, 6, 263–280. [Google Scholar] [CrossRef]
  5. Joyce, R.J.; Janowiak, J.E.; Arkin, P.A.; Xie, P. CMORPH: A method that produces global precipitation estimates from passive microwave and infrared data at high spatial and temporal resolution. J. Hydrometeorol. 2004, 5, 487–503. [Google Scholar] [CrossRef]
  6. Adler, R.F.; Huffman, G.J.; Chang, A.; Ferraro, R.; Xie, P.P.; Janowiak, J.; Rudolf, B.; Schneider, U.; Curtis, S.; Bolvin, D.; et al. The version-2 global precipitation climatology project (GPCP) monthly precipitation analysis (1979–present). J. Hydrometeorol. 2003, 4, 1147–1167. [Google Scholar] [CrossRef]
  7. Morbidelli, R.; Saltalippi, C.; Dari, J.; Flammini, A. A Review on Rainfall Data Resolution and Its Role in the Hydrological Practice. Water 2021, 13, 1012. [Google Scholar] [CrossRef]
  8. WMO, World Meteorological Organization. 2021. Available online: https://public.wmo.int/en/our-mandate/what-we-do/observations (accessed on 5 December 2021).
  9. Harris, I.P.; Jones, P.D.; Osborn, T.J.; Lister, D.H. Updated high-resolution grids of monthly climatic observations–the CRU TS3. 10 Dataset. Int. J. Climatol. 2014, 34, 623–642. [Google Scholar] [CrossRef]
  10. Harris, I.; Osborn, T.J.; Jones, P.; Lister, D. Version 4 of the CRU TS monthly high-resolution gridded multivariate climate dataset. Sci. Data 2020, 7, 1–18. [Google Scholar] [CrossRef]
  11. Becker, A.; Finger, P.; Meyer-Christoffer, A.; Rudolf, B.; Schamm, K.; Schneider, U.; Ziese, M. A description of the global land-surface precipitation data products of the Global Precipitation Climatology Centre with sample applications including centennial (trend) analysis from 1901–present. Earth Syst. Sci. Data 2013, 5, 71–99. [Google Scholar] [CrossRef]
  12. Sun, Q.; Miao, C.; Duan, Q.; Ashouri, H.; Sorooshian, S.; Hsu, K.L. A review of global precipitation data sets: Data sources, estimation, and intercomparisons. Rev. Geophys. 2018, 56, 79–107. [Google Scholar] [CrossRef] [Green Version]
  13. Negrón Juárez, R.I.; Li, W.; Fu, R.; Fernandes, K.; de Oliveira Cardoso, A. Comparison of precipitation datasets over the tropical South American and African continents. J. Hydrometeorol. 2009, 10, 289–299. Available online: https://www.jstor.org/stable/10.2307/24911970 (accessed on 11 June 2022). [CrossRef]
  14. Ogbu, K.N.; Hounguè, N.R.; Gbode, I.E.; Tischbein, B. Performance evaluation of satellite-based rainfall products over Nigeria. Climate 2020, 8, 103. [Google Scholar] [CrossRef]
  15. Liu, Z.; Ostrenga, D.; Teng, W.; Kempler, S. Tropical Rainfall Measuring Mission (TRMM) precipitation data and services for research and applications. Bull. Am. Meteorol. Soc. 2012, 93, 1317–1325. Available online: https://www.jstor.org/stable/10.2307/26219323 (accessed on 11 June 2022). [CrossRef]
  16. Nastos, P.T.; Kapsomenakis, J.; Philandras, K.M. Evaluation of the TRMM 3B43 gridded precipitation estimates over Greece. Atmos. Res. 2016, 169, 497–514. [Google Scholar] [CrossRef]
  17. NASA. 2022. Available online: https://www.nasa.gov/mission_pages/GPM/main/index.html (accessed on 15 April 2022).
  18. Hessels, T.M. Comparison and Validation of Several Open Access Remotely Sensed Rainfall Products for the Nile Basin. Master’s Thesis, Delft University of Technology, Delft, The Netherlands, 2015. [Google Scholar]
  19. Ashouri, H.; Hsu, K.L.; Sorooshian, S.; Braithwaite, D.K.; Knapp, K.R.; Cecil, L.D.; Nelson, B.R.; Prat, O.P. PERSIANN-CDR: Daily precipitation climate data record from multisatellite observations for hydrological and climate studies. Bull. Am. Meteorol. Soc. 2015, 96, 69–83. [Google Scholar] [CrossRef]
  20. Xie, P.; Arkin, P.A.; Janowiak, J.E. CMAP: The CPC Merged Analysis of Precipitation. In Measuring Precipitation from Space; Springer: Dordrecht, The Netherlands, 2007; pp. 319–328. [Google Scholar]
  21. Yin, X.; Gruber, A.; Arkin, P. Comparison of the GPCP and CMAP merged gauge–satellite monthly precipitation products for the period 1979–2001. J. Hydrometeorol. 2004, 5, 1207–1222. [Google Scholar] [CrossRef]
  22. Huffman, G.J.; Adler, R.F.; Morrissey, M.M.; Bolvin, D.T.; Curtis, S.; Joyce, R.; McGavock, B.; Susskind, J. Global precipitation at one-degree daily resolution from multisatellite observations. J. Hydrometeorol. 2001, 2, 36–50. [Google Scholar] [CrossRef]
  23. Abdelmoneim, H.; Soliman, M.R.; Moghazy, H.M. Evaluation of TRMM 3B42V7 and CHIRPS satellite precipitation products as an input for hydrological model over Eastern Nile Basin. Earth Syst. Environ. 2020, 4, 685–698. [Google Scholar] [CrossRef]
  24. Katsanos, D.; Retalis, A.; Michaelides, S. Validation of a high-resolution precipitation database (CHIRPS) over Cyprus for a 30-year period. Atmos. Res. 2016, 169, 459–464. [Google Scholar] [CrossRef]
  25. Dee, D.; Fasullo, J.; Shea, D.; Walsh, J.; National Center for Atmospheric Research Staff. The Climate Data Guide: Atmospheric Reanalysis: Overview & Comparison Tables; National Center for Atmospheric Research: Boulder, CO, USA, 2016; p. 2017. Available online: https://climatedataguide.ucar.edu/climatedata/atmospheric-reanalysis-overview-comparison-tables (accessed on 21 May 2022).
  26. Derin, Y.; Yilmaz, K.K. Evaluation of multiple satellite-based precipitation products over complex topography. J. Hydrometeorol. 2014, 15, 1498–1516. [Google Scholar] [CrossRef] [Green Version]
  27. Tan, M.L.; Ibrahim, A.L.; Duan, Z.; Cracknell, A.P.; Chaplot, V. Evaluation of six high-resolution satellite and ground-based precipitation products over Malaysia. Remote Sens. 2015, 7, 1504–1528. [Google Scholar] [CrossRef]
  28. Liu, J.; Duan, Z.; Jiang, J.; Zhu, A. Evaluation of three satellite precipitation products TRMM 3B42, CMORPH, and PERSIANN over a subtropical watershed in China. Adv. Meteorol. 2015, 2015, 151239. [Google Scholar] [CrossRef]
  29. Trinh-Tuan, L.; Matsumoto, J.; Ngo-Duc, T.; Nodzu, M.I.; Inoue, T. Evaluation of satellite precipitation products over Central Vietnam. Prog. Earth Planet. Sci. 2019, 6, 54. [Google Scholar] [CrossRef]
  30. Pang, J.; Zhang, H.; Xu, Q.; Wang, Y.; Wang, Y.; Zhang, O.; Hao, J. Hydrological evaluation of open-access precipitation data using SWAT at multiple temporal and spatial scales. Hydrol. Earth Syst. Sci. 2020, 24, 3603–3626. [Google Scholar] [CrossRef]
  31. Salehie, O.; Ismail, T.; Shahid, S.; Ahmed, K.; Adarsh, S.; Asaduzzaman, M.; Dewan, A. Ranking of gridded precipitation datasets by merging compromise programming and global performance index: A case study of the Amu Darya basin. Theor. Appl. Climatol. 2021, 144, 985–999. [Google Scholar] [CrossRef]
  32. Wang, Y.; Zhao, N. Evaluation of Eight High-Resolution Gridded Precipitation Products in the Heihe River Basin, Northwest China. Remote Sens. 2022, 14, 1458. [Google Scholar] [CrossRef]
  33. Huffman, G.J.; Bolvin, D.T.; Nelkin, E.J.; Wolff, D.B.; Adler, R.F.; Gu, G.; Hong, Y.; Bowman, K.P.; Stocker, E.F. The TRMM Multisatellite Precipitation Analysis (TMPA): Quasi-global, multiyear, combined-sensor precipitation estimates at fine scales. J. Hydrometeorol. 2007, 8, 38–55. [Google Scholar] [CrossRef]
  34. Novella, N.S.; Thiaw, W.M. African rainfall climatology version 2 for famine early warning systems. J. Appl. Meteorol. Climatol. 2013, 52, 588–606. [Google Scholar] [CrossRef]
  35. The NOAA Climate Prediction Center. The NOAA Climate Prediction Center African Rainfall Estimation Algorithm Version 2.0. Technical Report. 2001. Available online: https://www.cpc.ncep.noaa.gov/products/fews/RFE2.0_tech.pdf (accessed on 25 July 2022).
  36. Climate Hazards Center. CHIRPS: Rainfall Estimates from Rain Gauge and Satellite Observations; UC Santa Barbara: Santa Barbara, CA, USA, 2017. [Google Scholar]
  37. National Center for Atmospheric Research Staff (Ed.) Last Modified 6 October 2017 The Climate Data Guide: CMORPH (CPC MORPHing Technique): High Resolution Precipitation (60S-60N). Available online: https://climatedataguide.ucar.edu/climate-data/cmorph-cpc-morphing-technique-high-resolution-precipitation-60s-60n (accessed on 8 January 2022).
  38. Xie, P.; Joyce, R.; Wu, S.; Yoo, S.H.; Yarosh, Y.; Sun, F.; Lin, R. NOAA Climate Data Record (CDR) of CPC Morphing Technique (CMORPH) High Resolution Global Precipitation Estimates, Version 1; NOAA National Centers for Environmental Information; NOAA: Silver Spring, MD, USA, 2019. [Google Scholar] [CrossRef]
  39. National Center for Atmospheric Research Staff (Ed.) Last Modified 8 March 2022. The Climate Data Guide: CPC Unified Gauge-Based Analysis of Global Daily Precipitation. Available online: https://climatedataguide.ucar.edu/climate-data/cpc-unified-gauge-based-analysis-global-dailyprecipitation (accessed on 8 January 2022).
  40. National Center for Atmospheric Research Staff (Ed.) Last Modified 27 February 2020. The Climate Data Guide: GPCC: Global Precipitation Climatology Centre. Available online: https://climatedataguide.ucar.edu/climate-data/gpcc-global-precipitation-climatology-centre (accessed on 12 January 2022).
  41. Schneider, U.; Fuchs, T.; Meyer-Christoffer, A.; Rudolf, B. Global Precipitation Analysis Products of the GPCC; Global Precipitation Climatology Centre (GPCC), DWD, Deutscher Wetterdienst: Offenbach, Germany, 2021. [Google Scholar]
  42. Pendergrass, A.; National Center for Atmospheric Research Staff (Eds.) Last Modified 1 July 2016. The Climate Data Guide: GPCP (Daily): Global Precipitation Climatology Project. Available online: https://climatedataguide.ucar.edu/climate-data/gpcp-daily-global-precipitation-climatology-project (accessed on 11 January 2022).
  43. Pendergrass, A.; Wang, J.-J.; National Center for Atmospheric Research Staff (Eds.) Last Modified 6 November 2020. The Climate Data Guide: GPCP (Monthly): Global Precipitation Climatology Project. Available online: https://climatedataguide.ucar.edu/climate-data/gpcp-monthly-global-precipitation-climatology-project (accessed on 12 January 2022).
  44. Adler, R.F.; Sapiano, M.R.; Huffman, G.J.; Wang, J.J.; Gu, G.; Bolvin, D.; Chiu, L.; Schneider, U.; Becker, A.; Nelkin, E.; et al. The Global Precipitation Climatology Project (GPCP) monthly analysis (new version 2.3) and a review of 2017 global precipitation. Atmosphere 2018, 9, 138. [Google Scholar] [CrossRef] [Green Version]
  45. Ashouri, H.; Gehne, M.; National Center for Atmospheric Research Staff (Eds.) Last Modified 31 October 2021. The Climate Data Guide: PERSIANN-CDR: Precipitation Estimation from Remotely Sensed Information using Artificial Neural Networks—Climate Data Record. Available online: https://climatedataguide.ucar.edu/climate-data/persiann-cdr-precipitation-estimation-remotely-sensed-information-using-artificial (accessed on 11 January 2022).
  46. Maidment, R.I.; Grimes, D.; Black, E.; Tarnavsky, E.; Young, M.; Greatrex, H.; Allan, R.; Stein, T.; Nkonde, E.; Senkunda, S.; et al. A new, long-term daily satellite-based rainfall dataset for operational monitoring in Africa. Sci. Data 2017, 4, 170063. [Google Scholar] [CrossRef]
  47. Gado, T.A.; El-Hagrsy, R.M.; Rashwan, I.M.H. Spatial and temporal rainfall changes in Egypt. Environ. Sci. Pollut. Res. 2019, 26, 28228–28242. [Google Scholar] [CrossRef] [PubMed]
  48. Wedajo, G.K.; Muleta, M.K.; Awoke, B.G. Performance evaluation of multiple satellite rainfall products for Dhidhessa River Basin (DRB), Ethiopia. Atmos. Meas. Tech. 2021, 14, 2299–2316. [Google Scholar] [CrossRef]
  49. Sidike, A.; Chen, X.; Liu, T.; Durdiev, K.; Huang, Y. Investigating alternative climate data sources for hydrological simulations in the upstream of the Amu Darya River. Water 2016, 8, 441. [Google Scholar] [CrossRef]
  50. Hordofa, A.T.; Leta, O.T.; Alamirew, T.; Kawo, N.S.; Chukalla, A.D. Performance evaluation and comparison of satellite-derived rainfall datasets over the Ziway lake basin, Ethiopia. Climate 2021, 9, 113. [Google Scholar] [CrossRef]
  51. El Alaoui El Fels, A.; Saidi, M.E.; Alam, M.J. Rainfall Frequency Analysis Using Assessed and Corrected Satellite Precipitation Products in Moroccan Arid Areas. The Case of Tensift Watershed. Earth Syst. Environ. 2022, 6, 391–404. [Google Scholar] [CrossRef]
  52. Salaudeen, A.; Ismail, A.; Adeogun, B.K.; Ajibike, M.A.; Zubairu, I. Evaluation of ground-based, daily, gridded precipitation products for Upper Benue River basin, Nigeria. Eng. Appl. Sci. Res. 2021, 48, 397–405. [Google Scholar] [CrossRef]
  53. Nkunzimana, A.; Bi, S.; Alriah, M.A.; Zhi, T.; Kur, N.A. Comparative Analysis of the Performance of Satellite-Based Rainfall Products Over Various Topographical Unities in Central East Africa: Case of Burundi. Earth Space Sci. 2020, 7, e2019EA000834. [Google Scholar] [CrossRef]
  54. Gadouali, F.; Messouli, M. Evaluation of multiple satellite-derived rainfall products over Morocco. Int. J. Hydrol. Sci. Technol. 2020, 10, 72–89. [Google Scholar] [CrossRef]
  55. Nie, Y.; Sun, J. Evaluation of high-resolution precipitation products over southwest China. J. Hydrometeorol. 2020, 21, 2691–2712. [Google Scholar] [CrossRef]
  56. Gebremicael, T.; Mohamed, Y.; Berhe, A.; Haile, G.; Yazew, E.; Kifle, M. Comparative evaluation of multiple satellite rainfall products over the complex terrains of Tekeze-Atbara sub-basin, Nile River basin. In Proceedings of the EGU General Assembly Conference Abstracts, Vienna, Austria, 8–13 April 2018; p. 5979. [Google Scholar]
  57. Arun, P.V. A comparative analysis of different DEM interpolation methods. Egypt. J. Remote Sens. Space Sci. 2013, 16, 133–139. [Google Scholar] [CrossRef] [Green Version]
Figure 1. Locations of used ground stations.
Climate 10 00134 g001
Figure 2. Box-plots of annual rainfall.
Climate 10 00134 g002
Figure 3. Probability density function (PDF) plot of annual rainfall.
Climate 10 00134 g003
Figure 4. Annual cycle of mean monthly rainfall for tested RP.
Climate 10 00134 g004
Figure 5. Monthly statistical evaluation results for each RP at the studied locations.
Climate 10 00134 g005
Figure 6. Spatial distribution of average monthly and annual rainfall using the best RP.
Climate 10 00134 g006
Table 1. Examined rainfall product.
No.Rainfall ProductAbbreviationResolutionTime ScaleTemporal CoverageReference
1Tropical Rainfall Measuring Mission–3B43 V7TRMM0.25° × 0.25°Daily1998–2019[33]
2The African Rainfall Climatology–V2 ARC0.1° × 0.1°Daily1983–2022[34]
3African Rainfall Estimation Algorithm–V2RFE0.1° × 0.1◦Daily2000–2022[35]
4the Climate Hazards Group Infra-Red Precipitation StationChirps0.05° × 0.05°Daily1981–2022[36]
5Climate Prediction Center morphing methodCMORPH0.25° × 0.25°Daily2002–2019[37,38]
6Climate Prediction CenterCPC0.5° × 0.5°Daily1947–2018[39]
7Climatic Research UnitCRU0.5° × 0.5°Monthly1901–2019[10]
8Global Precipitation Climatology CentreGPCC0.5° × 0.5°Monthly1891–2018[40,41]
9Global Precipitation Climatology Project–One-Degree Daily Precipitation DatasetGPCP_1DD1° × 1°Daily1996–2015[42]
10Global Precipitation Climatology ProjectGPCP1° × 1°Daily1979–2020[43,44]
11Precipitation Estimation from Remotely Sensed Information using Artificial Neural Networks–Climate Data RecordPERSIANN0.25° × 0.25°Daily1983–2021[19,45]
12Tropical Applications of Meteorology Using Satellite Data and Ground-Based ObservationsTAMSAT0.0375° × 0.0375°Daily1983–2022[46]
Table 2. Mathematical descriptions of the applied statistical indices.
IndicesFormulaParametersIndices RangeAcceptable Range in This Paper
r R g R g ¯ R s R s ¯ R g R g ¯ 2   R s R s ¯ 2 R g ¯ is average ground station observation
R s ¯ is average RP estimates
X 0 is observed rainfall
X s is simulated rainfall
−1 to 1>0.65
NSE 1 R s R g 2 R g R g ¯ 2 −∞ to 1>0.50
RMSE R g R s 2 n 0 to ∞-
Pbias X 0 X s   X 0 100 −∞ to ∞<±15%
Table 3. Statistical evaluation indices of annual rainfall for the examined RP for studied locations.
Marha-Matrouh rNSERMSEPbiasAbu-Qier rNSERMSEPbias
TRMM0.8230.41631.015.3TRMM0.650−0.254105.940.6
ARC0.912 *0.818 *17.3 *1.7 *ARC0.420 *0.170 *86.1 *−0.8 *
RFE0.262−0.71353.111.0RFE0.287−0.260106.227.4
Chirps0.8110.48529.1−12.6Chirps0.237−0.01295.112.6
CMORPH0.010−2.04170.724.7CMORPH0.092−0.997133.6−9.6
CPC0.916 *0.836 *16.4 *−0.2 *CPC0.3870.07191.212.9
CRU0.7700.45729.9−1.8CRU0.148−0.311108.315.2
GPCC0.671−1.09058.6−30.9GPCC0.4940.12488.511.4
GPCP_1DD0.380−1.60665.4−21.7GPCP_1DD−0.231−0.964132.532.4
GPCP0.344−2.18172.3−50.2GPCP0.183−0.182102.823.4
PERSIANN0.054−2.85079.558.0PERSIANN0.476−1.730156.273.7
TAMSAT−0.014−1.97469.93.3TAMSAT0.062−1.339144.660.9
Rasheed rNSERMSEPbiasPort-Said rNSERMSEPbias
TRMM0.759−0.94487.745.5TRMM0.7850.26420.125.9
ARC0.6570.19556.58.9ARC0.332−2.97546.8−68.0
RFE0.167−1.737104.133.1RFE0.501−0.09824.619.6
Chirps0.425−0.15467.6−16.9Chirps−0.094−1.16334.5−23.4
CMORPH0.7570.11759.120.7CMORPH0.345−0.48828.626.6
CPC0.6060.29552.83.8CPC0.9430.8628.7−5.4
CRU0.461−0.14867.47.4CRU0.481−80.241211.5−368.4
GPCC0.877 *0.629 *38.3 *9.5 *GPCC0.5760.00223.47.0
GPCP_1DD0.605−0.36573.529.8GPCP_1DD0.550−11.73183.7−125.7
GPCP0.464−0.05264.518.5GPCP0.370−26.199122.4−218.8
PERSIANN0.226−3.705136.571.6PERSIANN−0.012−0.96332.926.8
TAMSAT0.150−1.10491.333.8TAMSAT−0.256−7.09066.7−100.0
Damanhour rNSERMSEPbiasMansoura rNSERMSEPbias
TRMM0.234−1.09236.6−1.0TRMM0.742 *0.047 *13.8 *−29.7 *
ARC0.238−0.88235.129.3ARC0.296−9.11945.0−84.0
RFE−0.287−3.65955.555.9RFE0.357−1.62022.9−20.8
Chirps0.556 *0.122 *23.9 *−16.9 *Chirps−0.033−1.95624.3−43.2
CMORPH0.079−1.92543.3−6.1CMORPH0.435−3.61230.4−68.9
CPC0.679−8.35779.9−112.3CPC0.286−3.75730.9−74.0
CRU0.867−8.81382.0−118.2CRU0.4660.06113.7−1.9
GPCC0.757−1.65842.5−57.4GPCC0.519−0.29716.1−7.6
GPCP_1DD0.431−3.77356.6−70.4GPCP_1DD0.585−15.39457.3−145.1
GPCP0.422−3.13252.6−62.3GPCP0.588−64.173114.2−339.1
PERSIANN−0.005−3.02451.960.8PERSIANN−0.080−1.69023.2−6.7
TAMSAT−0.175−1.40739.39.8TAMSAT0.319−21.47467.1−184.4
Tanta rNSERMSEPbiasCairo-Airport rNSERMSEPbias
TRMM0.093−1.92126.5−28.8TRMM0.477−0.09810.11.7
ARC−0.139−2.74330.0−46.9ARC0.802 *0.505 *6.8 *−8.7 *
RFE−0.035−5.38739.2−7.1RFE0.7300.1928.6−3.1
Chirps0.398 *−0.322 *17.8 *−32.1 *Chirps0.448−1.89416.3−46.4
CMORPH−0.252−6.49542.5−65.5CMORPH0.448−1.89416.3−46.4
CPC0.474−1.10522.5−51.1CPC0.538−3.48420.3−59.7
CRU0.796−30.89487.6−250.3CRU0.4560.0379.4−1.1
GPCC0.723−78.477138.3−413.7GPCC0.5710.0279.520.2
GPCP_1DD−0.025−15.78063.5−172.5GPCP_1DD−0.154−57.12673.2−312.1
GPCP0.042−49.748110.5−307.6GPCP0.343−69.93480.8−400.6
PERSIANN−0.101−2.40728.617.5PERSIANN0.094−4.84423.2−58.0
TAMSAT−0.097−4.30635.7−64.9TAMSAT−0.066−6.03725.5−96.9
* The related product is the best RP on the annual timescale for the location. Italic value: the mentioned indicator is sufficient
Table 4. Summary results of the best RP on monthly and annual timescales.
JanFebMarAprMaySepOctNovDecAnnual
Marsa-MatrouhRFE **RFE **
CPC **
ARC **
RFE **
CPC **
ARC **
RFE **
TRMM **GPCC *RFE **RFE **CPC **CPC **
Abu-QierGPCC **GPCP *CPC *Chirps *GPCC **ARC **TRMM **GPCC **GPCC *ARC *
RasheedGPCC **GPCC **CRU **GPCC *TRMM *Chirps **TRMM **GPCC **Chirps *GPCC **
Port-SaidCPC **CPC **CPC ** GPCC **GPCC **GPCC **CPC **GPCC **GPCC **GPCC **CPC **
DamanhourChirps *GPCP **TRMM **GPCC *TRMM **CRU * TAMSAT *GPCC *RFE *TRMM *Chirps *
MansouraChirps *CPC *GPCC **GPCC **CRU *CRU *RFE **CMORPH *TRMM *TRMM *
TantaChirps *CPC *CPCChirps *CMORPH **CMORPH *TAMSAT *Chirps *TRMM *Chirps *
Cairo-AirportGPCC **GPCC **ARC ** CPC **CPC *CPC *No RainfallGPCC **ARC **ARC **ARC **
** Best RP with acceptable values of statistical indices. * Best RP with non-acceptable values of statistical indices.
Publisher’s Note: MDPI stays neutral with regard to jurisdictional claims in published maps and institutional affiliations.

