Article

Potential Climate Impacts of Hydrological Alterations and Discharge Variabilities of the Mura, Drava, and Danube Rivers on the Natural Resources of the MDD UNESCO Biosphere Reserve

1
Faculty of Civil Engineering and Architecture, University of Osijek, 31000 Osijek, Croatia
2
Faculty of Water Sciences, University of Public Service, Bajcsy-Zs. Utca 12-14, 6500 Baja, Hungary
3
Department of Biology, University of Osijek, 31000 Osijek, Croatia
*
Author to whom correspondence should be addressed.
Climate 2022, 10(10), 139; https://doi.org/10.3390/cli10100139
Submission received: 13 August 2022 / Revised: 21 September 2022 / Accepted: 22 September 2022 / Published: 25 September 2022

Abstract

:
This study investigated hydrological alterations in the sections of the Mura, Drava, and Danube rivers, which together form a unique river landscape proclaimed by UNESCO as the Transboundary Biosphere Reserve Mura, Drava, and Danube (TBR MDD). A coherent network of 12 major protected areas along the rivers highlights their ecological value, which could be endangered by climate change and consequent environmental changes. Statistical analyses, such as the homogeneity test, Mann–Kendall trend test of monthly and seasonal discharges, and empirical probabilities of daily discharges, were applied to discharge data series (1960–2019) from six hydrological stations prior to the calculation of indicators of hydrologic alteration (IHA). This method could be a helpful tool for recognizing the changes in hydrological regimes that can affect river ecosystems. The 33 indicators were organized into five groups. The results showed a decrease in low pulse duration and increase in rise/fall rates and the number of reversals. From an ecological perspective, the results obtained for the probabilities of long flooding periods were particularly significant. They drastically decreased for all three rivers on their stretches within the reserve. According to IHA modeling results, the river sections analyzed were moderately altered with global indicator values between 0.5 and 0.75. The most pronounced hydrological alterations were associated with the frequency and duration of low and high pulses and the rate and frequency of changes in water condition, which could have a significant impact on the ecological values of the TBR MDD. In addition, results show more pronounced climate impact versus human activities.

1. Introduction

The largest seminatural river stretch with conserved floodplains in the Middle Danube Basin extends along the lower courses of the Drava and Mura rivers and related sections of the Danube River, forming an almost 700 km long “green belt” spanning across Austria, Slovenia, Hungary, Croatia, and Serbia. In September 2021, UNESCO proclaimed this unique river landscape as the world’s first five-country biosphere reserve, designated as the Transboundary Biosphere Reserve Mura, Drava, and Danube (TBR MDD) [1]. With an area of approximately 1 Mha of highly valuable natural landscapes, the reserve constitutes Europe’s largest protected riverine area. This stunning river landscape hosts amazing biological diversity and is a hotspot for rare natural species and habitats [2]. A coherent network of 12 major protected areas along the rivers highlights their ecological value.
Despite the preserved natural features, the Mura, Drava, and Danube rivers have suffered human impacts in the past two centuries, such as channelization of the riverbed by cutting the meanders and reducing the river length, construction of embankments, extraction of gravel and sand, and construction of hydropower plants. Most of these alterations were completed in the 1970s [2]. Deepening of the river channels is one of the most prominent consequences of these numerous impacts [3]. This was confirmed by several hydrobiological investigations focusing on the changes in river water levels in the river stretches along the reserve. The lowering of water levels in the Danube, which is directly caused by the incision of the riverbed, has been confirmed by several comprehensive hydrological analyses conducted from the end of the last century onward, initially by Kalocsa and Zsuffa (1997) [4], later by Goda et al. (2007) [5], and recently by Tamás et al. (2021) [6]. The process of severe riverbed deepening along the downstream reaches of the Drava River reportedly started during the nineteenth century (Bonacci and Oskorus, 2010) [7] and has continued to the present, as was confirmed by the current research carried out by Tadić and Brleković (2019) [8]. A decrease in the discharges in the Mura River was observed in studies conducted by Globevnik and Kaligaric (2005) [9] and Šraj et al. (2011) [10].
The changes in the hydrological regime of rivers are particularly significant in assessing their ecological conditions because river flow variability is considered as a fundamental characteristic of river systems and their ecological functioning [11]. Spatiotemporal variations in flow exert direct and indirect control on the structure and dynamics of biotic communities and influence ecosystem processes, such as nutrient uptake and transformation, organic matter processing, and ecosystem metabolism [12]. The critical role of water quantity and dynamics in supporting the quality of aquatic ecosystems has been incorporated into the assessment of the ecological status of rivers, according to the Water Framework Directive 2000/60/EC [13]. It is explicitly defined that the hydrological regime of rivers must be used to support the biological elements in the assessment of the ecological status/potential of the surface waters of rivers. Moreover, ecological flows must be considered when evaluating the impacts of hydrological regimes on river ecosystems [14].
Based on the results of research related to the impact of the hydrological regime on river ecosystems, natural flow regimes exhibit variability at different timescales from seasonal to interannual, and native aquatic and riparian biota are adapted to this variability [15]. Therefore, the magnitude, frequency, duration, timing, and rate of change of the natural flow regime are generally considered as the key elements for sustaining and conserving native species and ecological integrity.
For the total environmental water requirement, ecologically relevant low- and high-flow components are equally important and depend on the objective of environmental water management [16]. The water regimes of natural watercourses are continuously changing. Some of these changes are forced by human intervention, some of which are caused by climate change or by the combination of these two major factors. In the 21st century, almost no river has a natural hydrological regime; however, the degrees of their alterations are different. Richter et al. (1996) developed indicators of hydrologic alteration (IHA), which is a method for assessing the degree of hydrologic alteration based on the analysis of hydrologic data available from existing measurement points within an ecosystem [17].
Hydrological analyses have specific limitations and uncertainties. In the analysis of the IHA, separating human impacts from climate impacts on the river regime is very difficult. The IHA method was primarily developed for analyzing hydraulic structures, such as river regulation structures and reservoirs [17,18,19,20,21].
This method was recently applied to river systems under the conditions of severe climate change [15,22]. In addition, a recently published study revealed alterations caused by both reservoirs and climate change. According to their analysis, climate change caused alterations in flow regimes ranging from 1.0 to 9.0% across the basin, whereas reservoir operations altered the flow regime with a degree of alteration ranging from 8.0 to 25% [23].
In this study area, the most intensive hydraulic engineering activities occurred in the 1970s; however, inhomogeneity and hydrologic alteration occurred considerably later. Therefore, in our opinion, the dominant impacts are driven by climate change rather than by human activities.
The importance of flow as a major determinant of the physical habitats of streams is unquestionable. Aquatic species have evolved life history strategies primarily in direct response to natural flow regimes and natural patterns of longitudinal and lateral connectivity, which are essential to the viability of populations of many riverine species [24]. Studying hydrological alterations is an essential prerequisite for designing environmental flow regimes, considering both the effects on the hydrological alteration itself and the implication on the reliability of water demand satisfaction [25]. Understanding how alterations from expected or “natural” flow regimes adversely impact ecological functions has become a central pursuit in ecology and the interface between environmental science regulation and management of river ecosystems [26].
To the best of our knowledge, no comprehensive study about the discharge variability or seasonal changes in the transported water volumes of this specific river network has been conducted to date. Therefore, we investigated if and how hydrological alterations of the Mura, Drava, and Danube rivers affected the discharge distribution and the behavior of flood waves and low-water episodes of these rivers, which have changed in the past decades. The eventual impacts of hydrological alterations on possible environmental changes in river–floodplain systems would be considered. In addition, we studied what has a more dominant impact on observed hydrological alterations:—human activities or climate change.

2. Materials and Methods
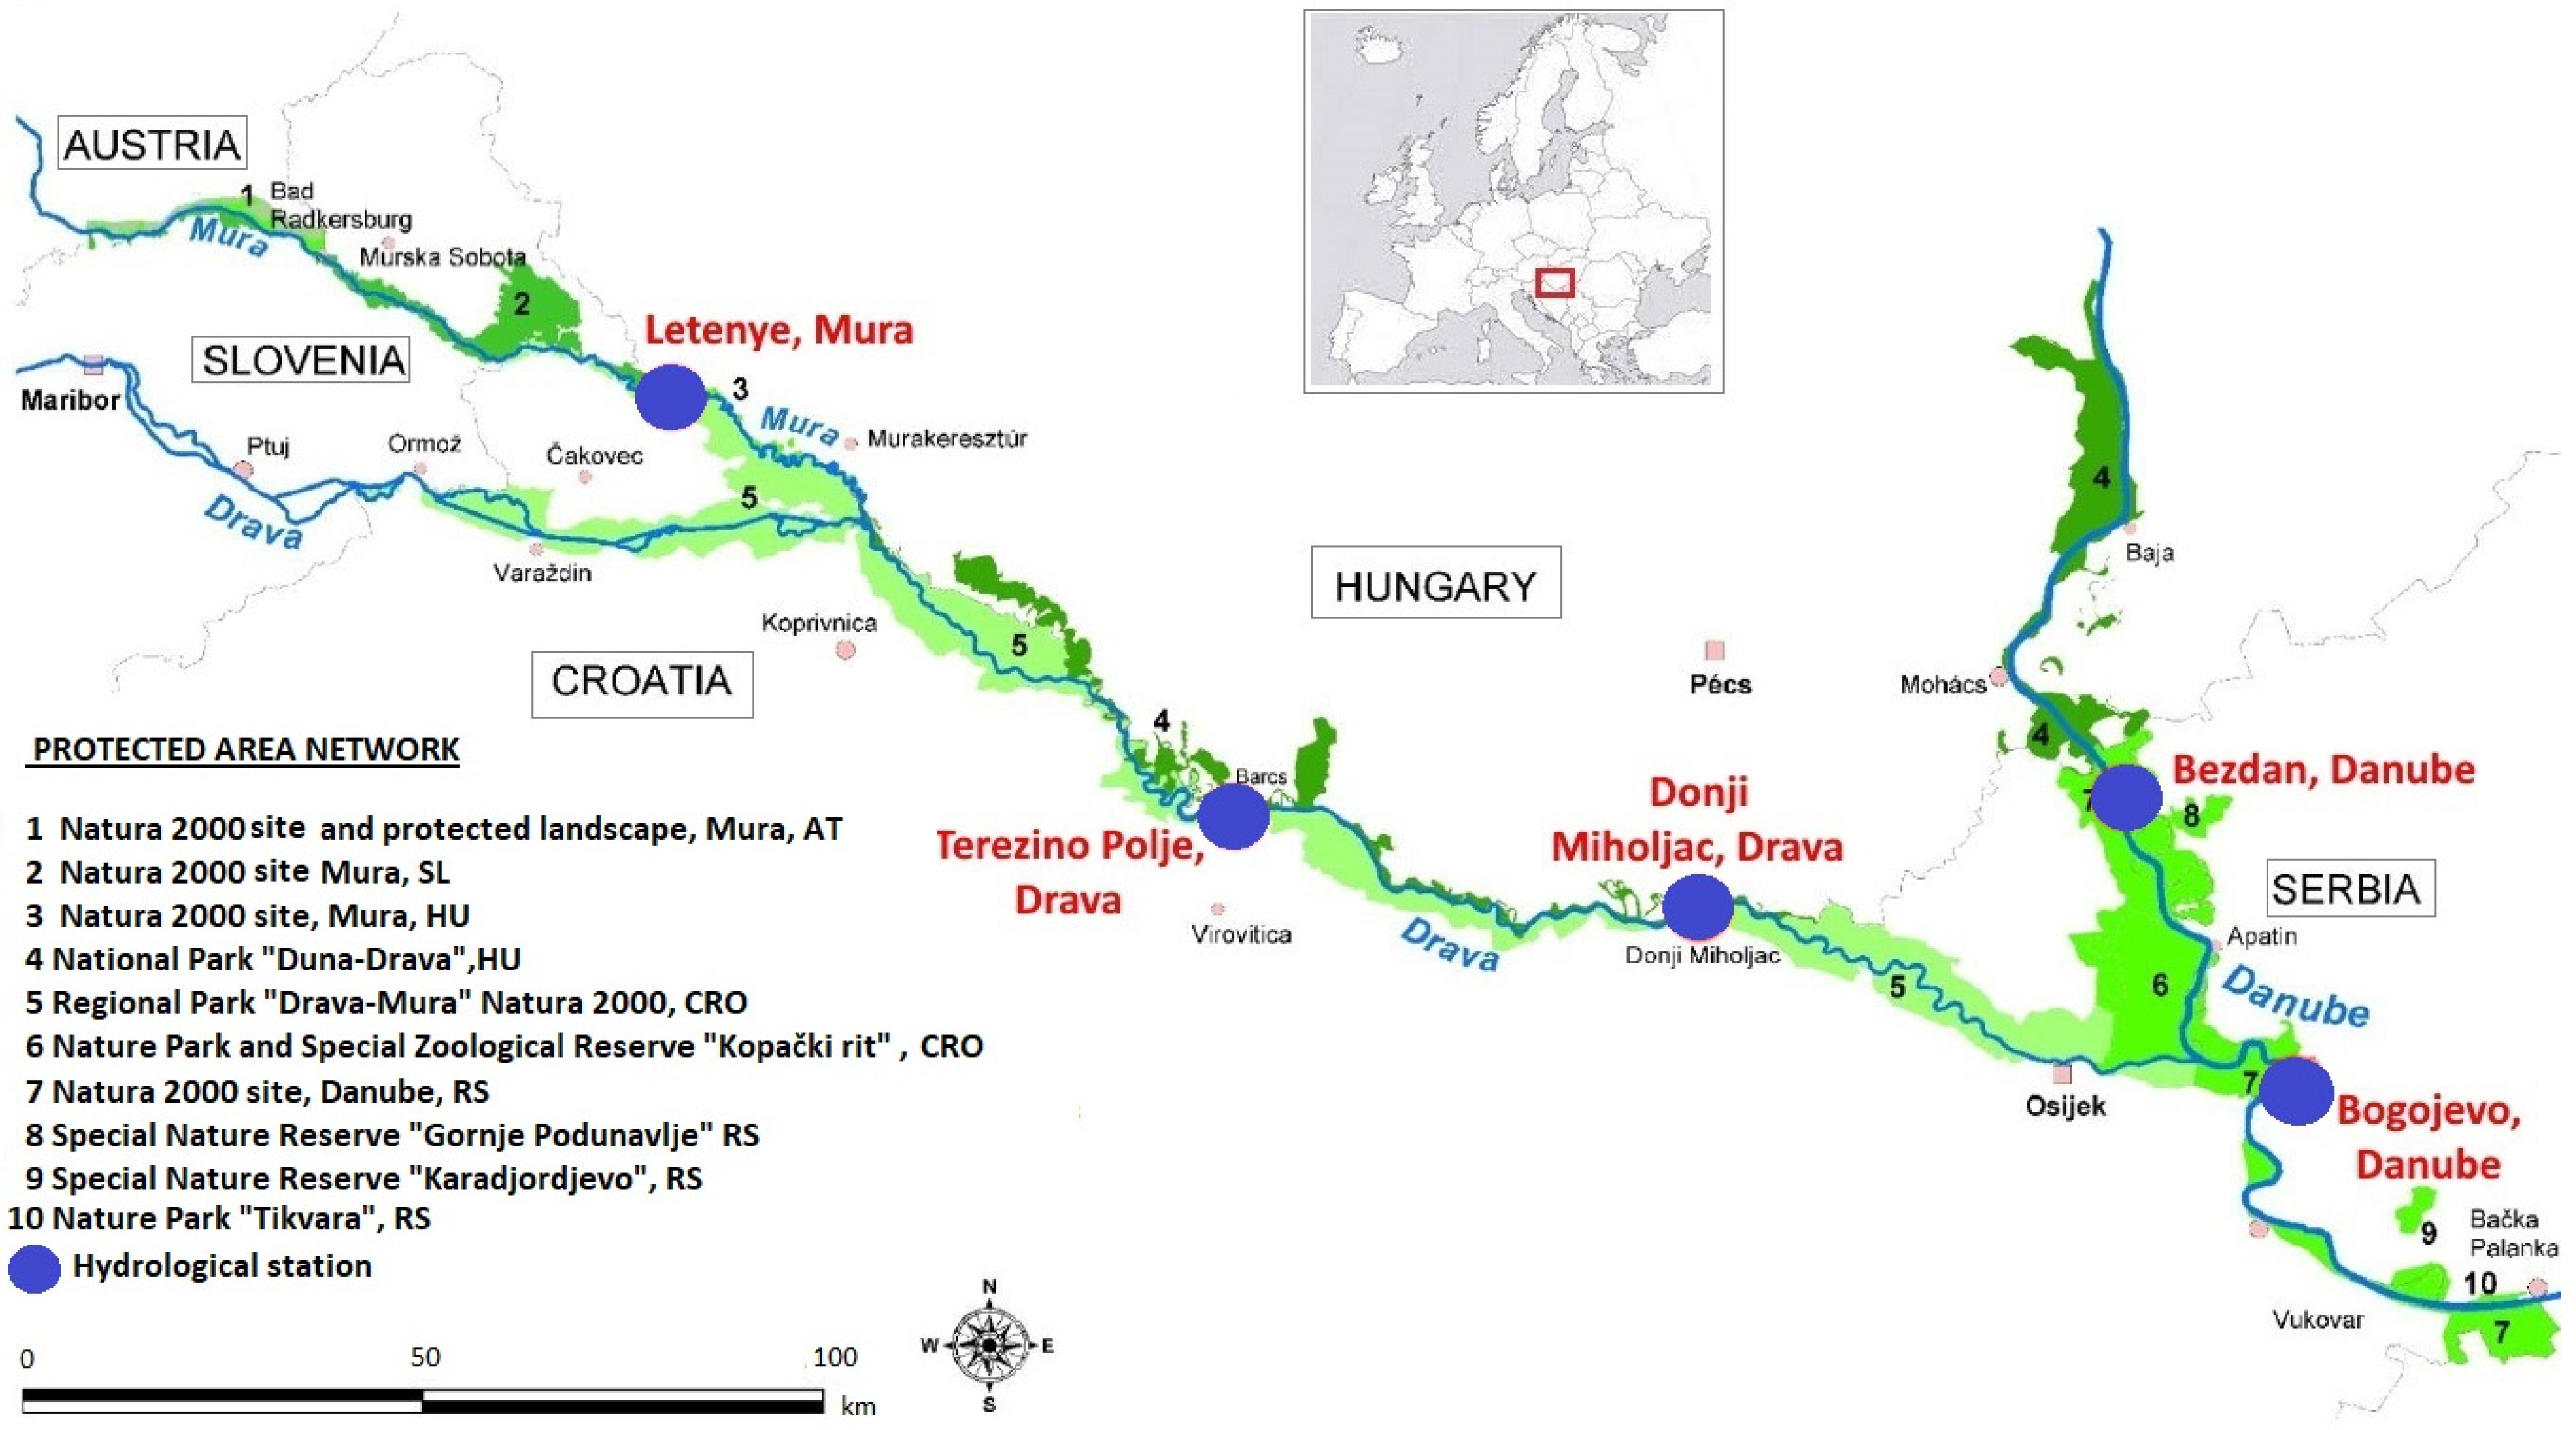
2.1. Study Area

The study area includes the river stretches of the Mura, Drava, and Danube along the Transboundary Biosphere Reserve Mura–Drava–Danube (TBR MDD), as shown in Figure 1 [1]. The Reserve includes several valuable Natura 2000 sites, among which the most prominent are the floodplains known as Kopački rit (part of the Kopački rit Nature Park, Croatia) and Gemenc (part of the Danube–Drava National Park, Hungary). These floodplains are distinguished by numerous wetland habitats, including alluvial forests, wet grasslands, gravel and sand bars, islands, steep banks, oxbow lakes, stagnant backwaters, abandoned riverbeds, and river meanders. The six gauging stations that were the study sites were chosen to represent the water regime of all three rivers along the common interest reaches of Croatia and Hungary. In total, using these six stations, we evaluated approximately 300 km of the lengths of the three rivers.
The daily discharge data series used in this analysis are listed in Table 1. As the data series at different stations have different lengths (between 57 and 94 years), we included data from 1960 in our analyses.

2.2. Empirical Probability Analyses

We also analyzed the durations of flooding periods and their changes for ten-year intervals between 1960 and 2019, the results of which show that the probabilities of longer flooding periods decrease alarmingly in all three rivers.
We examined the changes in the empirical probabilities of the discharges for each month, in ten-year intervals (1960–2019). Empirical probability analysis was performed using MHStat (Technical Hydrology and Statistics) 2.0.1.6. (2015).

2.3. Mann–Kendall Test

Another statistical tool is important for temporal data characterization. This shows the existence of significant temporal tendencies in the values of monthly discharges, tested by the well-known Mann–Kendall nonparametric test [27,28,29,30]. The Mann–Kendall test statistic, ZMK, can be computed as follows:
Z M K = { S 1 σ   if   S > 0 0   if   S = 0 S + 1 σ   if   S < 0   }
where positive and negative values depict upward and downward trends, respectively, for a certain period. The significance levels are marked by the following symbols: *** if a trend is proven at α = 0.001 level of significance, ** if at α = 0.01, * if at α = 0.05, and + if at α = 0.1 [31].

2.4. Standard Normal Homogeneity Test

The SNHT is a widely used test tool for the confirmation of data homogeneity. It was developed by Alexandersson (1986) for precipitation data [32]. It has recently become very useful for detecting change points in hydrological and meteorological time series [33]. The test statistic T(y) is used to compare the mean of the first y observations with the mean of the remaining (n − y) observations with n data points. It can be written as follows:
T y = y z 1 ¯ + ( n 1 ) z 2 ¯ , y = 1 , 2 n
where
z 1 ¯ = 1 n i = 1 n ( Y i Y ¯ ) s   and   z 2 ¯ = 1 n y i = y + 1 n ( Y i Y ¯ ) s
If the value of T exceeds the maximum value, then year y is the break year of the data series [34,35].
All five groups of environmental flow components relevant for this research were tested by SNHT to define possible break points in relatively long daily data series that could be caused by anthropogenic or climate impacts. Furthermore, data nonhomogeneity was used as an indicator of the introduction of a weighting factor into the calculation.

2.5. Indicators of Hydrologic Alteration (IHA)

As previously mentioned, IHA are helpful tools for identifying the changes in hydrological regimes that affect river ecosystems. The 33 indicators were organized into five groups [17,19]. The first and second parameter groups give the magnitudes of six monthly discharges and provide general conditions of habitat suitability during the wet and dry periods of the year, respectively. The third group provides the magnitude and duration of low extreme water conditions on daily, 3-day, weekly, monthly, and seasonal bases, including base flow and the Julian date of the annual 1-day minimum. The fourth group provides the magnitude and duration of high extreme water conditions on daily, 3-day, weekly, monthly, and seasonal bases, including base flow and the Julian date of the annual 1-day maximum. The magnitudes of the low and high water extremities present environmental disturbances. Group 5 had seven parameters: frequency and duration of high and low pulses and daily positive and negative sudden discharge changes.
The variables presented in Table 2 have different units, and for their comparison, they should be standardized by applying the following equation:
I H A s = I H A I H A ¯ s
where IHA and I H A ¯ represent a single value and the mean value of each indicator, respectively, and s is the standard deviation. Then, the indicators were normalized by applying the following equations:
i f       1 I H A 0       IHAn = IHA + 1 i f       IHA > 0       IHAn = 1 IHA + 1
The introduction of the weighting factor into the calculation depends on the importance of each IHAn for the environmental soundness of the watercourses.
The value of each weighting factor is typically defined according to the importance of the corresponding IHAn for management objectives [19]. In this case, the weighting factors (ci) were based on the indicators of temporal variability. This approach was selected because the study area is very large, and management objectives are rather different in the five countries. IHA calculations were performed using Nature Conservancy, 2009 Indicators of the Hydrologic Alteration Model (Version 7.1).
G I H A 1 = c i I H A n i ; c i = 1 ; i = 1 6 G I H A 2 = c i I H A n i ; c i = 1 ; i = 7 12 G I H A 3 = c i I H A n i ; c i = 1 ; i = 13 19 , 25 G I H A 4 = c i I H A n i ; c i = 1 ; i = 20 24 , 26 G I H A 5 = c i I H A n i ; c i = 1 ; i = 27 33
Finally, a global indicator (GI) of hydrological alteration was calculated by considering the previous five indicators using equation [19]:
G I = K 1 G I H A 1 + K 2 G I H A 2 + K 3 G I H A 3 + K 4 G I H A 4 + K 5 G I H A 5
Table 3 gives the range of GI values that define the hydrological status of the basin [19].

3. Results

Linear trend analysis of the yearly minimum, mean, and maximum discharges revealed that there was no significant change in the overall discharge quantities of the three rivers for the period 1960–2019. The trend lines of all three rivers for the yearly discharge minima and means were horizontal; a slight decrease was observed in the maxima at the Letenye station of the Mura River and Terezino Polje station of the Drava River, whereas a slight increase was observed at the Baja station of the Danube River (Table 4, Figure 2). No significant difference was observed in the annual minimum, mean, and maximum discharge trends.
We examined the changes in the empirical probabilities of the discharges for each month, in ten-year intervals (1960–2019). The results showed that the probabilities of longer flooding periods decreased alarmingly in all three rivers. In addition, we found a high level of variability for all rivers, which was naturally the most prominent in the Danube River, which has the largest and most diverse catchment area. Figure 3 presents empirical probabilities of the daily discharges for the full years separated to 10-year periods.
At Letenye station on the Mura River, the probabilities of higher discharges had no change over decades. Increasing of probabilities of lower discharges of the last decade (2010–2019) was more prominent (Figure 3).
At the Terezino Polje station on the Drava River, a much more significant increase of lower discharge probabilities was observed in the last decade (2010–2019) (Figure 3).
At the Baja station on the Danube River, the smallest change in empirical distribution of lower daily discharges was observed. However, at all three hydrological stations, the first observed decade between 1960 and 1969 had more expressed lower discharges (Figure 3).
The empirical probabilities obtained were confirmed using the Mann–Kendall test (Table 5). The significance of monthly and seasonal discharge decreasing varied between low levels of significance (“+” at 0.1 and “**” at 0.01).
The Mura River, with its smallest catchment, had the most pronounced decreasing trends on an annual and seasonal basis, except in winter.
The upstream station on the Drava River also exhibited significant decreasing trends in spring, particularly in summer. Downstream stations, considering larger catchment areas, had a critically decreasing discharge trend only during the summer period.
The Danube River, which has the largest and most diverse catchment area, exhibited different hydrological behaviors at this river section. The decreasing trend was of very low significance in the summer for the most upstream station at Baja. Downstream stations Bezdan and Bogojevo exhibited more prominent decreasing trends. The only exception was the positive but weak discharge trend in autumn at the Bezdan station (designated by the red square).
The Mura River was mostly affected by low flows, and its ecosystem might be seriously endangered, particularly during summer.
An analysis of indicators of hydrological alterations can be conducted with or without weighting factors. The option to use depends on the importance or strength of each indicator. To define the potential weighting factors, we applied a homogeneity test to the data series of each indicator. Nonhomogeneous data series were more influential on the hydrological regime of each river and were the basis for weighting factor application. The results are presented in Table 6. The blue downward and red upward arrows indicate the existence of two subperiods with smaller and larger values in the second subperiod, respectively. More detailed homogeneity analysis is given in Supplementary Files.
Parameter groups 1 and 2 showed homogeneous data for the mean monthly discharges throughout the observed period for all three Danube River stations. On the Mura River, the nonhomogeneous month was January, and on the Drava River, January (Terezino Polje station) and June (Donji Miholjac station). In the parameter group of the most downstream Danube River station (Bogojevo station), the indicators of low flows showed consistent nonhomogeneity and lower values of 1- to 90-day minimum flows. Two processes could cause this behavior. The first is the lowering of the Drava River minimum flow, and the second is filling of the large area of the Kopački rit Nature Park located upstream of the Bogojevo station (Figure 1).
In the Mura River, only discharges with longer low-flow periods showed nonhomogeneity. In parameter group 4, almost all indicators were homogeneous, except for the date of starting maximum flows on the Mura River, which implies that high-flow periods started later in the year.
The most prominent parameter was group 5. It included the number of annual occurrences of high/low water periods, their duration, fall/rise rates, and number of reversals. The values for high flows (high pulse count and high pulse duration) were homogeneous for all three rivers. The rise rate, fall rate, and number of reversals showed nonhomogeneity in the Danube River. This indicates sudden and strong changes in discharge that could have a significant impact on the ecosystem. On the Drava River, a similar situation was observed at both stations. This phenomenon was less pronounced only on the Mura River. Weighting factors were applied to the nonhomogeneous parameters. The results of the IHA analysis are shown in Figure 4.
The hydrological alterations varied across the five parameter groups. There were almost no alterations in the magnitude of the monthly water conditions in the winter months, except in the Mura River (Figure 4). The magnitude of monthly water conditions at the six characteristic stations in the summer months differed between the slightly altered and altered hydrological regimes (Figure 4a). More significant alterations were observed in parameter groups 3 and 4 (magnitude and duration of low extreme and high extreme water conditions and timing of annual extreme water conditions) (Figure 4c,d).
Figure 4e presents parameter group 5, which includes frequencies and duration of low and high pulses and rate and frequencies of water condition change at the six characteristic stations. Hydrological alterations of this parameter group were the most pronounced. The number of reversals and fall and rise rates were increasing. In particular, low pulses and low flows showed significant changes. From the environmental perspective, this group was crucial because low pulses, and particularly flood pulses, can be a stimulating or a disturbance factor for phytoplankton development [36].
The global indicators of hydrological alterations (GIs) of all catchments are listed in Table 7. They all belong to moderately altered catchments.

4. Discussion

The results of our analyses showed that there were no significant changes in the annual discharges in the observed stretches of the Mura, Drava, and Danube rivers during the period 1960–2019 (Figure 2). However, the distribution of river discharge on a monthly and seasonal basis has changed. The pronounced trends of decreasing monthly and seasonal discharge in the Mura River and significant trends of decreasing discharge in the Drava River, particularly in summer, were notable (Table 5). Annual flow of near-natural catchments is primarily controlled by climatic elements, particularly by precipitation and temperature, and therefore can be a good index of climatic variability and/or climate change [37]. The observed trends can be partially linked to the consequences of climate change on precipitation and river runoff because streamflow trends must be interpreted with caution owing to the presence of confounding factors, such as land use changes, irrigation, and urbanization [38]. The climate scenarios for the Danube River and its tributaries obtained using a regional hydrological model [39] agree on a general trend with a distinct reduction in summer river flows and an increase in winter runoff, particularly in the Middle and Lower Danube Basin, where climate change is projected to aggravate the low flows in late summer and autumn. In the near future, global warming will be the most unavoidable hazard in the ecosystem (IPCC, 2022) [40]. At the end of the 20th century and the beginning of the 21st century, the frequency of droughts and catastrophic floods of the Danube River and inundations increased. Thus, extreme floods of the Danube in the area of focus occurred in 2002 due to the heavy rains in Central and Eastern Europe. They also occurred later in spring and summer 2006, due to the large amounts of melted snow, the very warm spring, and the heavy precipitation leading to the Danube water levels exceeding the maxima observed during the previous 100–130 years [41]. Extreme floods occurred again in the summer of 2013 along the Middle Danube region, where the water level at the Budapest hydrological station was higher than the previous maximum recorded in 2006 (ICPD, 2014) [42]. The area of interest was also affected by severe droughts such as those that occurred during the summers of 2003 and 2015. These droughts were caused by the dual effects of a shortfall in precipitation and the occurrence of high temperatures (ICPDR, 2016) [43]. This study confirms increasing empirical frequencies of lower discharges in the last decade. However, the first observed decade (1960–1969) has more pronounced lower daily discharges than other decades. Both droughts and floods can occur within the same system, and this may be repeated over a protracted period, as in the case of the Middle Danube River, whose naturally variable flow regime has become increasingly characterized by frequent droughts and floods. Compared with drought episodes, our investigation showed less variable flood episodes. High flows and high water pulses showed homogeneity in the observed rivers (Table 6). Low-flow episodes are considerably frequent and potentially endanger this specific wetland environment. In general, droughts have considerably stronger ecological impacts than floods, which is perhaps unsurprising given that a surfeit of water seems less likely than a deficit to be a problem for aquatic organisms [44]. The impact of hydrological changes on aquatic organisms and overall ecological conditions has been well documented because of the numerous studies conducted in the floodplains of Gemenc and Kopački rit, the most ecologically valuable areas in the TBR MDD. The changes in phytoplankton dynamics in the Kopački rit floodplain waters showed that, depending on the timescale of the occurrence, flood pulses can be a stimulating or a disturbance factor for phytoplankton development [36]. Generally, floods increase the aquatic surface area and reshape aquatic and terrestrial habitats, maintain their complexity, and facilitate the dispersal of aquatic and terrestrial organisms, thereby stimulating productivity and biodiversity [45]. Nevertheless, the long-term isolation phase of the floodplain habitats from the incoming flood waters (particularly as occurred in the extreme dry conditions of 2003) triggered a specific pattern of phytoplankton characterized by heavy cyanobacterial blooms with the dominance of invasive alien species [46]. However, the occurrence of extreme floods, as in 2006, can be enough of a stressor to trigger the transition from a turbid (high phytoplankton biomass) to a clear (very low phytoplankton biomass) state in the floodplain lake. This indicates that cyclic shifts between alternative stable states in floodplain ecosystems can be expected as a consequence of the impact of extreme hydrological events induced by climate change [47].
A strong connection between hydrological events and diversity patterns of zooplankton assemblages in different water bodies of the Gemenc floodplain has been found [48,49], indicating that the water regime of the Danube appears to provide pronounced temporal variability in the hydroecology of the Gemenc floodplain.
Flood pulses also drive the temporal dynamics of assemblages of aquatic insects in the floodplains. According to Turić et al. (2015), the current water regime of the Danube River section along the Kopački rit floodplain favors generalist species with high dispersal capacity, and broad niches and food resources [50]. Flood pulses are recognized to have a significant influence on the distribution of fish in the Danube River-associated wetlands, which are characterized by a high diversity of fishes, as they use that type of aquatic ecosystem as a refuge for breeding, feeding, and nesting purposes at one stage or another of their life cycle [51]. Flood dynamics are crucial for sustaining riparian zones in river–floodplain systems. A significant amount of riparian vegetation is still present in larger floodplains in the TBR MDD, particularly in the floodplain areas of Gemenc and Kopački rit [52]. Riparian vegetation has significant ecological roles, such as buffering nutrients, stabilizing riverbanks, reducing erosion, and reducing sediment transportation. The survival of riparian vegetation depends on the preservation of near-natural flood dynamics, which provide periodic changes from aquatic to terrestrial ecosystems and thus enable the maintenance of great biodiversity. Fish, macroinvertebrates, and riparian vegetation exhibit biota-specific responses (abundance, diversity, and demographic parameters) to flow alteration depending on the flow components affected (magnitude, frequency, duration, timing, and rate of change) [53].

5. Conclusions

The vulnerability of valuable natural resources in the Mura–Drava–Danube Reserve, Europe, the largest protected riverine area of approximately a million hectares of natural landscapes, is highly dependent on the hydrological regime of the watercourse network.
From an ecological perspective, particularly significant are the results obtained showing that the probabilities of longer flooding periods occurring have decreased alarmingly in all three rivers, Mura, Drava, and Danube, on their stretches along the Reserve. This can have a strong negative impact on the ecological integrity of the observed water system and flow–biota–ecosystem processes.
Significant changes in low and high pulses and rise and fall rates observed in all three river sections could remove the positive influence of floods on aquatic insect communities and lead to losses of threatened species that depend on these river–floodplain habitats. Floods and droughts alter the distribution of water in the landscape through both time and space and, by extension, how organisms interact with each other. The observed trends in summer discharges, low and high pulses, and rise and fall rates endanger these environmental interactions and overall sustainability.
The long data series of indicators of hydrological alterations that was available for this research (1960–2018) confirms the dominance of climate change impacts on the observed undesirable processes. Human activities such as river regulation, water abstraction, and dam construction were mostly completed in the 1970s. It is proved by analysis of empirical daily discharges per decade, and the observed hydrological alterations could have a significant impact on the ecological values of the Mura–Drava–Danube Reserve. Particularly vulnerable are the conserved riverine floodplain biotopes, where changes in the flow regime can have a significant negative impact on biota and overall ecological conditions. Scientific approaches together with international efforts are necessary in practicing ecologically sustainable river management to preserve the environmental flow regimes of the Mura, Drava, and Danube rivers along the stretches of the world’s first five-country UNESCO Biosphere Reserve, Europe’s largest protected riverine area.

Supplementary Materials

The following supporting information can be downloaded at: https://www.mdpi.com/article/10.3390/cli10100139/s1: Table S1: The Mura River (Leteney)–IHA homogeneity test; Table S2: The Drava River –IHA homogeneity test and Table S3: The Danube River –IHA homogeneity test.

Author Contributions

Conceptualization, L.T. and E.A.T.; methodology, L.T. and J.J.; software, J.J.; validation, E.A.T.; formal analysis, E.A.T.; investigation, L.T.; resources, E.A.T. and M.M.; data curation, J.J.; writing—original draft preparation, L.T., E.A.T. and M.M.; writing—review and editing, L.T.; visualization, L.T.; supervision, M.M. All authors have read and agreed to the published version of the manuscript.

Funding

This research received no external funding.

Conflicts of Interest

The authors declare no conflict of interest.

References

  1. UNESCO. Mura-Drava-Danube Transboundary Biosphere Reserve. Croatia/Hungary. Available online: https://en.unesco.org/biosphere/eu-na/mura-drava-danube (accessed on 13 May 2022).
  2. Csagoly, P.; Magnin, G.; Mohl, A. Danube, Drava, and Mura Rivers: The “Amazon of Europe”. In The Wetland Book; Finlayson, C., Milton, G., Prentice, R., Davidson, N., Eds.; Springer: Dordrecht, The Netherlands, 2016. [Google Scholar] [CrossRef]
  3. WWF. Assessment of the River and Floodplain Restoration Potential in the Transboundary UNESCO Biosphere Reserve “Mura-Drava-Danube”; WWF: Vienna, Austria, 2013. [Google Scholar]
  4. Kalocsa, B.; Zsuffa, I. A Duna magyar szakaszának vízállásváltozásai. J. Hungar. Hydrol. Soc. 1997, 77, 183–192. [Google Scholar]
  5. Goda, L.; Kalocsa, B.; Tamás, E.A. Riverbed erosion on the Hungarian section of the Danube. J. Environ. Sci. Sustain. Soc. 2007, 1, 47–54. [Google Scholar]
  6. Tamás, E.A.; Đorđević, D.; Kalocsa, B.; Vujanović, A. Hydrological indicators of the riverbed incision along the free-flowing Danube River reach from Budapest to Slankamen relevant for the lateral connectivity between the river channel and floodplains. In Proceedings of the 43rd IAD Conference Rivers and Floodplains in the Anthropocene—Upcoming Challenges in the Danube River Basin, Virtual Conference, 9–11 June 2021. [Google Scholar]
  7. Bonacci, O.; Oskoruš, D. The changes in the lower Drava River water level, discharge and suspended sediment regime. Environ. Earth Sci. 2009, 59, 1661–1670. [Google Scholar] [CrossRef]
  8. Tadić, L.; Brleković, T. Hydrological characteristics of the Drava river in Croatia. In The Drava River; Lóczy, D., Ed.; Springer Geography: Berlin/Heidelberg, Germany, 2019; ISBN 9783319928159. [Google Scholar] [CrossRef]
  9. Globevnik, L.; Kaligaric, M. Hydrological changes of the Mura River in Slovenia. accompanied with habitat deterioration in riverine space. Mater. Geoenviron. 2005, 52, 45–49. [Google Scholar]
  10. Šraj, M.; Horvat, A.; Koprivšek, M.; Vidmar, A.; Brilly, M. Analysis of water regime of the Mura River by homogenized discharge data. In Proceedings of the XXVth Conference of Danubian Countires, Budapest, Hungary, 16–17 June 2011. [Google Scholar]
  11. Poff, N.L.; Zimmerman, J.K. Ecological responses to altered flow regimes: A literature review to inform the science and management of environmental flows. Freshw. Biol. 2010, 55, 194–205. [Google Scholar] [CrossRef]
  12. Palmer, M.; Ruhi, A. Linkages between flow regime, biota, and ecosystem processes: Implications for river restoration. Science 2019, 365, eaaw2087. [Google Scholar] [CrossRef]
  13. WFD; European Commission. Directive 2000/60/EC, Establishing a framework for community action in the field of water policy. Off. J. Eur. Communities 2000, L327, 1–71. [Google Scholar]
  14. European Commision. Ecological Flows in the Implementation of the Water Framework Directive. Guidance Document No. 31; European Commission: Brussels, Belgium, 2015. [Google Scholar] [CrossRef]
  15. Bussatini, M.; Percopo, C.; Lastoria, B.; Mariani, S. A Method for Characterizing the Stream Flow Regime in Europe. In Engineering Geology for Society and Territory—Volume 3; Lollino, G., Arattano, M., Rinaldi, M., Giustolisi, O., Marechal, J.C., Grant, G., Eds.; Springer: Cham, Switzerland, 2015. [Google Scholar] [CrossRef]
  16. Smakhtin, V.; Revenga, C.; Döll, P. A Pilot Global Assessment of Environmental Water Requirements and Scarcity. Water Int. 2004, 29, 307–317. [Google Scholar] [CrossRef]
  17. Richter, B.D.; Baumgartner, J.V.; Powell, J.; Braun, D.P. A Method for Assessing Hydrologic Alteration within Ecosystems. Conserv. Biol. 1996, 10, 1163–1174. [Google Scholar] [CrossRef]
  18. Mathews, R.; Richter, B.D. Application of the indicators of hydrologic alteration software in environmental flow settings. J. Am. Water Resour. Assoc. 2007, 43, 1400–1413. [Google Scholar] [CrossRef]
  19. Gao, Y.; Vogel, R.M.; Kroll, C.N.; Poff, N.L.; Olden, J.D. Development of representative indicators of hydrologic alteration. J. Hydrol. 2009, 374, 136–147. [Google Scholar] [CrossRef]
  20. Zhou, X.; Huang, X.; Zhao, H.; Ma, K. Development of a revised method for indicators of hydrologic alteration for analyzing the cumulative impacts of cascading reservoirs on flow regime. Hydrol. Earth Syst. Sci. 2020, 24, 4091–4107. [Google Scholar] [CrossRef]
  21. Pardo-Loaiza, J.; Solera, A.; Bergillos, R.J.; Paredes-Arquiola, J.; Andreu, J. Improving Indicators of Hydrological Alteration in Regulated and Complex Water Resources Systems: A Case Study in the Duero River Basin. Water 2021, 13, 2676. [Google Scholar] [CrossRef]
  22. Lee, A.; Cho, S.; Kang, D.K.; Kim, S. Analysis of the effect of climate change on the Nakdong river stream flow using indicators of hydrological alteration. J. Hydro-Environ. Res. 2013, 8, 234–247. [Google Scholar] [CrossRef]
  23. Maskey, M.L.; Dourado, G.F.; Rallings, A.M.; Rheinheimer, D.E.; Medellín-Azuara, J.; Viers, J.H. Assessing Hydrological Alteration Caused by Climate Change and Reservoir Operations in the San Joaquin River Basin, California. Front. Environ. Sci. 2022, 10, 765426. [Google Scholar] [CrossRef]
  24. Bunn, S.E.; Arthington, A.H. Basic principles and ecological consequences of altered flow regimes for aquatic biodiversity. Environ. Manag. 2002, 30, 492–507. [Google Scholar] [CrossRef]
  25. Monico, V.; Solera, A.; Bergillos, R.J.; Paredes-Arquiola, J.; Andreu, J. Effects of environmental flows on hydrological alteration and reliability of water demands. Sci. Total Environ. 2022, 810, 151630. [Google Scholar] [CrossRef]
  26. George, R.; McManamay, R.; Perry, D.; Sabo, J.; Ruddell, B.L. Indicators of hydro-ecological alteration for the rivers of the United States. Ecol. Indic. 2020, 120, 106908. [Google Scholar] [CrossRef]
  27. Mann, H.B. Nonparametric tests against trend. Econometrica 1945, 13, 245–259. [Google Scholar] [CrossRef]
  28. Kendall, M.G. Rank Correlation Methods; Charles Griffin & Company Limited: London, UK, 1962. [Google Scholar]
  29. Gilbert, R.O. Statistical Methods for Environmental Pollution Monitoring; Wiley: New York, NY, USA, 1987. [Google Scholar]
  30. Asfaw, A.; Simane, B.; Hassen, A.; Bantider, A. Variability and time series trend analysis of rainfall and temperature in northcentral Ethiopia: A case study in Woleka sub-basin. Weather. Clim. Extrem. 2018, 19, 29–41. [Google Scholar] [CrossRef]
  31. Salmi, T.; Määttä, A.; Anttila, P.; Ruoho-Airola, T.; Amnell, T. Detecting Trends of Annual Values of Atmospheric Pollutants by the Mann-Kendall Test and Sen’s Slope Estimates—The Excel Template Application MAKESENS; Publications on Air Quality No. 31; Finnish Meteorological Institute: Helsinki, Finland, 2002. [Google Scholar]
  32. Alexandersson, H. A homogeneity test applied to precipitation data. J. Clim. 1986, 6, 661–675. [Google Scholar] [CrossRef]
  33. Pandžić, K.; Kobold, M.; Oskoruš, D.; Biondić, B.; Biondić, R.; Bonacci, O.; Likso, T.; Curić, O. Standard normal homogeneity test as a tool to detect change points in climate-related river discharge variation: Case study of the Kupa River Basin. Hydrol. Sci. J. 2020, 65, 227–241. [Google Scholar] [CrossRef]
  34. Ho Ming, K.; Yusof, F. Homogeneity Tests on Daily Rainfall Series in Peninsular Malaysia. Int. J. Contemp. Math. Sci. 2012, 7, 9–22. [Google Scholar]
  35. Ahmed, K.; Shahid, S.; Ismail, T.; Nawaz, N.; Wang, X.-J. Absolute homogeneity assessment of precipitation time series in an arid region of Pakistan. Atmósfera 2018, 31, 301–316. [Google Scholar] [CrossRef]
  36. Mihaljević, M.; Stević, F.; Horvatić, J.; Kutuzović, B.H. Dual impact of the flood pulses on the phytoplankton assemblages in a Danubian floodplain lake (Kopački Rit Nature Park. Croatia). Hydrobiologia 2009, 618, 77–88. [Google Scholar] [CrossRef]
  37. Nováky, B.; Bálint, G. Shifts and Modification of the Hydrological Regime Under Climate Change in Hungary. In Climate Change—Realities, Impacts Over Ice Cap, Sea Level and Risks; Singh, B.R., Ed.; IntechOpen: London, UK, 2013; p. 524. [Google Scholar] [CrossRef]
  38. Pletterbauer, F.; Melcher, A.; Graf, W. Climate Change Impacts in Riverine Ecosystems. In Riverine Ecosystem Management: Science for Governing towards a Sustainable Future; Schmutz, S., Sendzimir, J., Eds.; Aqatic Book Series (AQEC. volume 8); Springer: Cham, Switzerland, 2018; Chapter 11; pp. 203–223. [Google Scholar] [CrossRef]
  39. Stagl, J.C.; Hattermann, F.F. Impacts of Climate Change on the Hydrological Regime of the Danube River and Its Tributaries Using an Ensemble of Climate Scenarios. Water 2015, 7, 6139–6172. [Google Scholar] [CrossRef]
  40. IPCC (The Intergovernmental Panel on Climate Change). Climate Change 2022: Impacts. Adaptation and Vulnerability. Summary Policymakers. 2022. Available online: https://www.ipcc.ch/report/ar6/wg2/downloads/report/IPCC_AR6_WGII_SummaryForPolicymakers.pdf (accessed on 1 September 2022).
  41. Mikhailov, V.N.; Morozov, V.N.; Cheroy, N.I.; Mikhailova, M.V.; Zayalova, Y.F. Extreme Flood on the Danube River in 2006. Russ. Meteorol. Hydrol. 2008, 33, 48–54. [Google Scholar] [CrossRef]
  42. ICPDR. 2014: Record flooding in the Danube River Basin. 2014. Available online: https://www.icpdr.org/main/resources/2002-floods-danube-river-basin (accessed on 23 June 2022).
  43. ICPDR. The 2015 Droughts in the Danube River Basin. 2016. Available online: https://www.icpdr.org/main/sites/default/files/nodes/documents/icpdr_report_on_2015_droughts_in_the_danube_river_final.pdf (accessed on 20 June 2022).
  44. Woodward, G.; Bonada, N.; Brown, L.E.; Death, R.G.; Durance, I.; Gray, C.; Hladyz, S.; Ledger, M.E.; Milner, A.M.; Ormerod, S.J.; et al. The effects of climatic fluctuations and extreme events on running water ecosystems. Philos. Trans. R. Soc. B Biol. Sci. 2016, 371, 20150274. [Google Scholar] [CrossRef]
  45. Tockner, K.; Pannetzdorfer, D.; Reiner, N.; Scheiner, F.; Ward, J.V. Hydrological connectivity and the exchange of organic matter and nutrients in a dynamic river–floodplain system (Danube. Austria). Freshw. Biol. 1999, 415, 21–535. [Google Scholar] [CrossRef]
  46. Stević, F.; Mihaljević, M.; Špoljarić, D. Changes of phytoplankton functional groups in a floodplain lake associated with hydrological perturbations. Hydrobiologia 2013, 709, 143–158. [Google Scholar] [CrossRef]
  47. Mihaljević, M.; Špoljarić, D.; Stević, F.; Cvijanović, V.; Kutuzović, B.H. The influence of extreme floods from the River Danube in 2006 on phytoplankton communities in a floodplain lake: Shift to a clear state. Limnologica 2010, 40, 260–268. [Google Scholar] [CrossRef]
  48. Schöll, K. Spatial and Temporal Diversity Patterns of Planktonic Rotifer Assemblages in Water Bodies of the Floodplain Gemenc (Duna-Dráva National Park, Hungary). Int. Rev. Hydrobiol. 2010, 95, 450–460. [Google Scholar] [CrossRef]
  49. Schöll, K.; Kiss, A.; Dinka, M.; Berczik, A. Flood-Pulse Effects on Zooplankton Assemblages in a River-Floodplain System (Gemenc Floodplain of the Danube, Hungary). Int. Rev. Hydrobiol. 2012, 97, 41–54. [Google Scholar] [CrossRef]
  50. Turić, N.; Temunović, M.; Radović, A.; Vignjević, G.; Bogojević, M.S.; Merdić, E. Flood pulses drive the temporal dynamics of assemblages of aquatic insects (Heteroptera and Coleoptera) in a temperate floodplain. Freshw. Biol. 2015, 60, 2051–2065. [Google Scholar] [CrossRef]
  51. Stojković Piperac, M.; Milošević, D.; Čerba, D.; Simić, V. Fish Communities Over the Danube Wetlands in Serbia and Croatia. In Small Water Bodies of the Western Balkans; Pešić, V., Milošević, D., Miliša, M., Eds.; Springer: Cham, Switzerland, 2021; pp. 337–349. [Google Scholar] [CrossRef]
  52. Sommerwerk, N.; Bloesch, J.; Baumgartner, C.; Bittl, T.; Čerba, D.; Csányi, B.; Davideanu, G.; Dokulil, M.; Frank, G.; Grecu, L.; et al. The Danube River Basin. In Rivers of Europe; Tockner, K., Zarfl, C., Robinson, C.T., Eds.; Elsevier: Amsterdam, The Netherlands, 2022; pp. 81–180. [Google Scholar] [CrossRef]
  53. Zeiringer, B.; Seliger, C.; Greimel, F.; Schmutz, S. Chapter 4—River Hydrology, Flow Alteration, and Environmental Flow. In Riverine Ecosystem Management: Science for Governing towards a Sustainable Future; Schmutz, S., Sendzimir, J., Eds.; Aqatic Book Series (AQEC. volume 8); Springer: Cham, Switzerland, 2018; pp. 67–89. [Google Scholar] [CrossRef]
Figure 1. Study area with designated gauging stations (map source: https://www.interreg-danube.eu/uploads/media/approved_project_output/0001/24/c33bf56841c18e182014950ede42c8e58990d67d.pdf, accessed on 23 May 2022).
Climate 10 00139 g001
Figure 2. Yearly maximum, mean, and minimum discharges and linear trends of the Mura River (Letenye station, 1960–2019), Drava River (Terezino Polje station, 1960–2019), and Danube River (Baja station, 1960–2019).
Climate 10 00139 g002
Figure 3. Empirical probabilities of daily discharges on annual basis at the Letenye station (Mura River), Terezino Polje station (Drava River), and Baja station (Danube River) during 1960–2019.
Climate 10 00139 g003
Figure 4. Results of IHA analysis: parameter group 1 (a), parameter group 2 (b), parameter group 3 (c), parameter group 4 (d), and parameter group 5 (e).
Climate 10 00139 g004
Table 1. Characteristic hydrological data of the rivers in the study area.
River SectionData SeriesDistance from River Mouth (km)Catchment Area (km2)Longitude and Latitude
Mura River (Letenye)1960–202035.6013,14846°26′ N 16°43′ E
Drava River (T. Polje)1962–2019152.3033,91645°57′ N 17°28′ E
Drava River (D. Miholjac)1926–201977.0037,14245°48′ N 18°21′ E
Danube River (Baja)1930–20171478.70189,09246°10′ N 18°55′ E
Danube River (Bezdan)1950–20201425.59210,25045°51′ N 18°51′ E
Danube River (Bogojevo)1950–20171367.25251,59345°31′ N 19°54′ E
Table 2. Indicators of hydrologic alterations [17,19].
Parameter Group 1
October
November
December
January
February
March
Magnitude of monthly water conditions (m3/s).
Parameter Group 2
April
May
June
July
August
September
Magnitude of monthly water conditions (m3/s).
Parameter Group 3
1-day minimum
3-day minimum
7-day minimum
30-day minimum
90-day minimum
Number of zero-flow days
Base flow index
Julian date of annual 1-day minimum
Magnitude and duration of low extreme water condition (m3/s) and timing of annual extreme water conditions (Julian date).
Parameter Group 4
1-day maximum
3-day maximum
7-day maximum
30-day maximum
90-day maximum
Julian date of annual 1-day maximum
Magnitude and duration of high extreme water condition (m3/s) and timing of annual extreme water conditions (Julian date).
Parameter Group 5
Low pulse count
Low pulse duration
High pulse count
High pulse duration
Rise rate
Fall rate
Number of reversals
Frequency (number) and duration of low and high pulses (days).
Rate (m3/s/day) and frequency of water condition changes (number).
Table 3. Hydrological status of the basin defined by GI [19].
Hydrological StatusGI Value Range
Slightly altered or not altered0.75 to 1.0
Moderately altered0.5 to 0.75
Altered0.25 to 0.5
Very altered0 to 0.25
Table 4. Trend line equations and coefficients of determination (R2) of characteristic annual discharges.
River SectionAnnual Discharge (m3/s)
MinimumMeanMaximum
Mura River (Letenye)Y= −0.217X + 508
R2 = 0.047
Y= −0.619X + 195
R2 = 0.09
Y= −1.761X + 4158
R2 = 0.09
Drava River (T. Polje)Y= −0.285X + 786
R2 = 0.013
Y= −1.373X + 557
R2 = 0.065
Y= −4.179X + 9771
R2 = 0.028
Danube River (Baja)Y= −0.234X + 1684
R2 = 0.0006
Y= −3.18X + 2475
R2 = 0.019
Y= 5.233X − 5169
R2 = 0.014
Table 5. Mann–Kendall test of trends in monthly and seasonal discharges.
Time SeriesMura River Leteny Drava River T. PoljeDrava River D. Miholjac Danube River BajaDanube River BezdanDanube River Bogojevo
Test ZSignif. 1Test ZSignif. 1Test ZSignif. 1Test ZSignif.Test ZSignif. 1Test Z Signif.
Oct−0.666 −0.307 0.101 0.05 1.127 0.394
Nov−0.548 0.968 −0.353 −0.78 0.953 −0.035
Dec−1.276 0.451 −0.173 0.28 0.928 −0.052
Jan−2.229*−0.759 −0.977 −0.04 1.539 1.402
Feb−2.035*−0.804 −1.352 −1.57 0.139 0.632
Mar−1.195 −0.007 −0.794 −0.13 1.355 0.979
Apr−2.085*−1.870+−0.719 −1.11 −0.963 0.139
May−1.270 −2.224*−1.362 −0.22 −0.596 −0.655
Jun−1.948+−2.380*−2.348*−1.71+−0.695 −0.886
Jul−2.079*−2.681**−1.999*−1.84+−2.035*−2.005*
Aug−0.647 −1.354 −1.303 −1.73+−0.923 −2.034*
Sep−0.286 −0.824 0.467 0.43 1.246 0.533
Annual−2.477*−1.792+−1.522 −0.99 0.124 −0.394
Winter−2.116*−0.288 −0.846 −0.65 1.057 1.025
Spring−2.072*−1.681+−1.336 −0.61 −0.119 0.098
Summer−1.736+−2.649**−2.437*−1.45 −1.296 −1.755+
Autumn−0.118 0.504 0.474 0.16 1.703+0.481
1 *** If trend at α = 0.001 level of significance, ** if trend at α = 0.01 level of significance, * if trend at α = 0.05 level of significance, + if the trend at α = 0.1 level of significance.
Table 6. Results of homogeneity test applied on IHA.
Mura RiverDrava River Danube River
LetenyT. PoljeD. MiholjacBajaBezdanBogojevo
Parameter Group 1
OctoberHHHHHH
NovemberHHHHHH
DecemberHHHHHH
JanuaryNH Climate 10 00139 i001NH Climate 10 00139 i001HHHH
FebruaryHHHHHH
MarchHHHHHH
Parameter Group 2
AprilHHHHHH
MayHHHHHH
JuneHHNH Climate 10 00139 i001HHH
JulyHHHHHH
AugustHHHHHH
SeptemberHHHHHH
Parameter Group 3
1-day min.HHNH Climate 10 00139 i001HHNH Climate 10 00139 i001
3-day min.HHNH Climate 10 00139 i001HHNH Climate 10 00139 i001
7-day min.HHNH Climate 10 00139 i001HHNH Climate 10 00139 i001
30-day min.NH Climate 10 00139 i001HNH Climate 10 00139 i001HHNH Climate 10 00139 i001
90-day min.NH Climate 10 00139 i001HNH Climate 10 00139 i001HHNH Climate 10 00139 i001
No. of zero-flow daysHHHHHH
Base flow indexHHHHHH
Julian date of annual 1-day min.HHHHHH
Parameter Group 4
1-day max.HHHHHH
3-day maxHHHHHH
7-day max.HHHHHH
30-day max.HHHHHH
90-day max.HHHHHH
Julian date of annual 1-day max.NH Climate 10 00139 i002H Climate 10 00139 i002HHHH
Parameter Group 5
Low pulse countHNH Climate 10 00139 i002NH Climate 10 00139 i002HHNH Climate 10 00139 i002
Low pulse durationHNH Climate 10 00139 i001NH Climate 10 00139 i001HHNH Climate 10 00139 i001
High pulse countHHHHHH
High pulse durationHHHHHH
Rise rateHHHNH Climate 10 00139 i002NH Climate 10 00139 i002H
Fall rateNH Climate 10 00139 i001HNH Climate 10 00139 i002NH Climate 10 00139 i002NH Climate 10 00139 i002NH Climate 10 00139 i002
Number of reversalsHNH Climate 10 00139 i002NH Climate 10 00139 i002NH Climate 10 00139 i002NH Climate 10 00139 i002NH Climate 10 00139 i002
H = homogeneous data; NH = nonhomogeneous data with positive/negative shift ( Climate 10 00139 i002/ Climate 10 00139 i001).
Table 7. Global indicators (GIs) of hydrological alterations.
Mura RiverDrava RiverDanube River
Global IndicatorLetenyeTerezino PoljeD. MiholjacBajaBezdanBogojevo
0.6090.6070.6980.5400.5190.639
Publisher’s Note: MDPI stays neutral with regard to jurisdictional claims in published maps and institutional affiliations.

