Article

Development of a Multisensor-Based Non-Contact Anthropometric System for Early Stunting Detection

by
Umiatin Umiatin
1,*,
Widyaningrum Indrasari
1,
Taryudi Taryudi
2 and
Abdul Fatah Dendi
1
1
Department of Physics, Faculty of Mathematic and Natural Science, Universitas Negeri Jakarta, Jl Rawamangun Muka No 11, Jakarta Timur 13220, Indonesia
2
Department of Electronic, Faculty of Engineering, Universitas Negeri Jakarta, Jl Rawamangun Muka No 11, Jakarta Timur 13220, Indonesia
*
Author to whom correspondence should be addressed.
J. Sens. Actuator Netw. 2022, 11(4), 69; https://doi.org/10.3390/jsan11040069
Submission received: 17 September 2022 / Revised: 9 October 2022 / Accepted: 20 October 2022 / Published: 24 October 2022

Abstract

:
The stunting prevalence in Indonesia is still above the WHO minimum standard of 20%. An important aspect of early detection of stunting is to monitor the nutritional status of children under five periodically. In daily practice, nutritional status is obtained through anthropometry. The main anthropometric parameters are body mass, height, and head circumference. This research entails the development of an integrated and non-contact anthropometric system for measuring body mass, height, and head circumference for children aged 12–60 months. This non-contact method can prevent the transmission of infectious diseases, especially during the COVID-19 pandemic. For the development of a prototype, three types of sensors are used: load, proximity, and temperature sensor. In addition, a load cell sensor is used to measure body mass, an infrared sensor to measure height and head circumference, ultrasonic sensor to measure height. In addition, the anthropometric system developed is equipped with an MLX90614-DCI sensor to measure temperature, a thermal printer to print measurement results, and sound output. The results of the tests showed that this anthropometric system had an average error less than 5%. Therefore, it is suitable to measure the body mass, height, and head circumference of children under five.

1. Introduction

Stunting, or the condition of failure to grow that results in children having shorter statures compared to other children their age, is still a big challenge for the Indonesian nation. Stunted children are affected by poor nutrition in early childhood as well as recurrent infections at the time of pre- and post-natal stages. Various studies have shown that stunting in children affects cognitive and motor development in such a way that they do not develop optimally which places them at a higher risk of disease [1]. According to the Level and Trends in Child Malnutrition Report in 2021, the prevalence of stunting in Indonesia in 2018 was 31.8%, which placed them in the very high category [2]. Indonesia is ranked fifth among countries in Southeast Asia with the largest number of stunting cases [1]. This situation if left unchecked will affect the quality and productivity of Indonesian human resources in the future.
Amid efforts made to reduce stunting, the COVID-19 pandemic has also caused a decline in the quality of nutrition for children under five and pregnant women [3]. During the COVID-19 pandemic, nearly 6.7 million children in the world were malnourished and stunted [4,5]. In Indonesia, during the COVID-19 pandemic, health service activities at Posyandu (Integrated Healthcare Center) were stopped. This restriction and termination of Posyandu services pose a risk of increasing the prevalence of stunting. It was reported that there was an increase in stunting prevalence of 4.3% in the Province of the Bangka Belitung Islands during the COVID-19 pandemic [6]. Integrated intervention is needed to reduce the risk factors for stunting, ranging from individual factors to environmental factors. One of the keys to preventing stunting in children is to periodically monitor the nutritional status at Posyandu [7].
Anthropometry is a field of science that deals with the measurement of the dimensions of the human body, including body mass, height, length (e.g., limb lengths), skinfold thickness, breadth (e.g., shoulder, wrist, etc.), and circumference [8]. Examination of the nutritional status of children is carried out through anthropometrics. Whereas in adults, anthropometrics is not only used to assess nutritional status, but also to assess health status, especially with regard to obesity, and the risk of cardiovascular disease, stroke, diabetes mellitus, dyslipidemia, and hypertension [9]. In the pediatric population, anthropometry is used as a screening device to evaluate health status, nutritional adequacy, and patterns of growth and development of children [8]. Measurement of growth and normal growth patterns of children during the initial five years of growth is the gold standard for clinicians to assess the health and well-being of children [10]. According to the WHO, four anthropometric indices that are often used are mass for age, height for age, mass for height, and body mass index (BMI) for age which are evaluated over time to identify abnormalities or disorders of growth and development, especially in children under five [11].
In order to obtain accurate anthropometric data, trained people are needed. In Indonesia, anthropometrics generally still use manual methods using devices, including scales, meters, and measuring tapes. This measurement requires quite a lot of time so it is inefficient also exhibits poor reliability [12], there was a need for the development and validation of accessible, valid, reproducible, and cost-effective technologies that are capable of providing robust measurements of mass, height, and head circumferences.
Body mass measurement in children under five is performed using a baby scale or floor scale for children aged 12–60 months or children who can stand [10]. In general, the manufacture of mass scale utilizes a load cell sensor with a strain gauge and has a fairly high accuracy [13]. The development of an anthropometric system for measuring body mass using a load cell has an accuracy of ±0.1 kg [14]. Each additional 1 gr of load produces a voltage of 0.0001 V. The greater the added load, the greater the output voltage will be. It was reported in previous studies that the average error was 2.12% [13].
Clinically, the physical growth records are maintained which is necessary for height. Growth indicators like the height of the individual can be used in diagnosing conditions such as stunting in children. Height measurement is generally carried out using a stadiometer for children aged 12–60 months and using an infantometer for infants. Various manual methods have been used to date to measure the height. The typical method is to stand in front of the stadiometer and manually check the height. However, the number of errors may be introduced due to human errors because the eye cannot accurately read the scale [15]. In addition, conventional measurements of height or body length require physical contact and the skills of officers in reading the scale.
During the pandemic, non-contact anthropometry methods are indispensable because they can reduce the risk of disease transmission. Measurement of height with a non-contact method can be performed using a proximity sensor. A proximity sensor is a noncontact-type sensor that detects the presence of an object. Proximity sensors can be implemented using different techniques such as optical, ultrasonic, Hall effect, capacitive, and so on [16,17,18].
The use of ultrasonic sensors for height measurement is reported to yield good results. The ultrasonic sensor HC-SR04 can detect the closest distance as small as 3 cm and as far as 100 cm. To increase the accuracy of the readings from the ultrasonic sensor, it can be performed by adding a Hall-effect sensor UGN 3503. It has been reported that height measurement using the combination of these two sensors has an accuracy of 97.88%. However, the addition of a Hall-effect sensor is technically difficult to implement because it requires a small magnet or magnetizable material attached to the part of the body to be measured [13]. The Hall-effect sensor is an inductive type that can be used to detect magnetized objects, including metal or magnetic materials [19].
Another anthropometrics of height is the use of an RGB-D sensor. The use of this method makes it possible to measure the height and body dimensions including sitting height, leg length, knee length, hand length, forearm length, shoulder width, and hip width. The sensor will capture objects that can be detected, which then become an input for the program to generate RGB data which will be processed to obtain skeletal tracking. The program will then generate height and length data for other body parts. This method is reported to have an absolute error of 2.53% for the measurement of height [12]. An RGB-D sensor can be used to measure height, but it is not possible if it is used in anthropometry which is integrated with measurements of mass and head circumference. This is because the RGB-D sensor requires a distance of 4 to 6 feet from the object to be measured [20].
Another important anthropometric parameter is a head circumference. It is important because the head circumference is among the characteristics of the growth process and brain development, in which changes in brain size in children occur. Head circumference is particularly crucial to measure in children as it reflects the size and growth of a child’s brain. The American Academy of Pediatrics recommends that head circumference be regularly monitored, primarily until a child reaches two years of age [21].
Head circumference is a part of anthropometry that requires accurate measurements. Until recently, capturing head shape had been limited to sizes using the conventional instruments (e.g., sliding calipers, spreading calipers, and measurement tapes). These methods are pretty simple and inexpensive to perform. Nevertheless, there are several limitations, including human error and time consumption to obtain accurate data [22,23,24].
Measurement of head circumference can be performed using a rotary sensor. The working principle of this sensor is that a row of pulses will appear on each channel at a frequency proportional to the rotational speed when the shaft rotates. In order to obtain the distance traveled, this process can be measured by counting the number of pulses that occur against the dish resolution [21]. Another method that has been widely developed for measuring head circumference is the use of 3D surface scanning devices and structure sensors. The use of this 3D system shows a good correlation with traditional measurements, but the accuracy needs to be improved. This method has a maximum error approaching 13%. One of the obstacles in obtaining results that have a strong correlation with traditional measurements is hair. Hair is one of the limitations of head surface scanning; therefore, efforts are needed to minimize the beading effect by fitting all volunteers with nylon caps when the scans are taken [22]. Camera utilization from the front and side is reported to yield identical results with the utilization of the caliper. It’s been reported that the best distance between the camera and the head being 200 cm [25].
Concerning the current research’s various limitations, it is still necessary to develop an accurate and easy-to-use anthropometric system. Therefore, in this study, we have developed an anthropometric system for children aged 12–60 months.

2. Materials and Methods

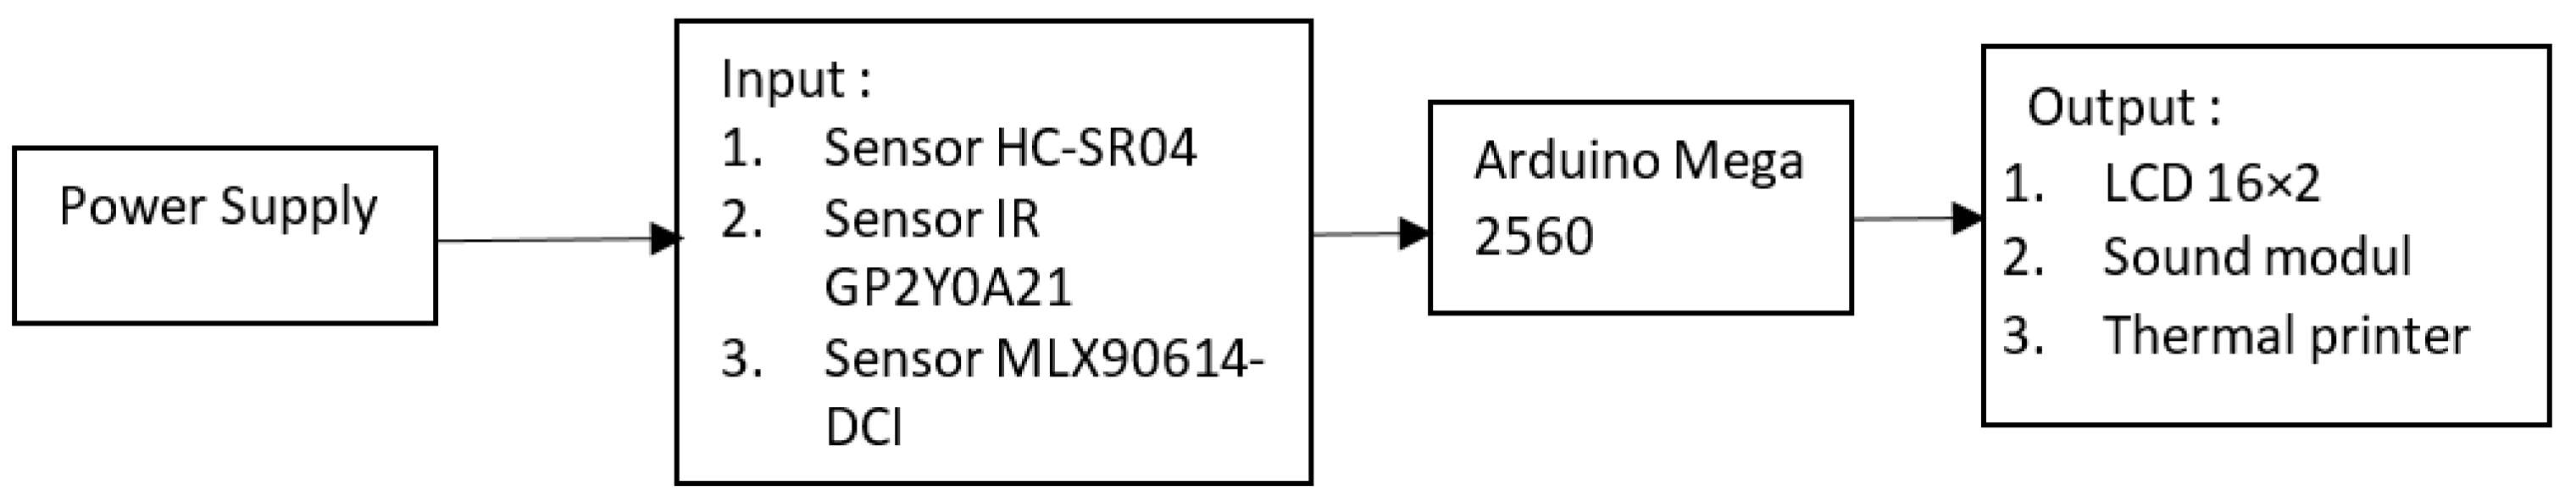
2.1. System Block Diagram

In this study, the development of an integrated measuring instrument for body mass, height, and head circumference was carried out in one device. In addition, to comply with the health protocols during the pandemic, the anthropometric system is equipped with a body temperature thermometer, sound output, and a thermal printer to print the measurement results. Figure 1 below shows the block diagram of the developed anthropometric system.
The system block diagram consists of a power supply block to supply electrical power to all electronic device parts. The input block functions to input height measurement data using the HC-SR04 sensor and sharp IR GP2Y0A21 sensor, head circumference measurement using four, sharp IR GP2Y0A21 sensors, body mass measurement using a load cell sensor, and body temperature measurement data using the MLX90614-DCI sensor. The process block functions to process measurement data, including body mass, head circumference, height, and body temperature, using an Arduino Mega 2560. The output block functions to display the data that has been processed using a sound module and a thermal printer for measurement data of body mass, height, head circumference, and body temperature, then the use of seven segment display for body temperature data.

2.2. Design and Planning

The anthropometric system developed consists of four main parts, namely: the base or footrest for measuring body mass, a section for measuring height, a section for measuring head circumference, and a control box for the entire electronic circuit. The anthropometric system is made with a height of 140 cm and a base with a size of 30 × 30 cm, which has been adapted to the characteristics of Indonesian children aged up to 5 years. The whole process of measuring and displaying data is controlled using the Arduino Mega 2560 microcontroller.

2.3. Measurement Trial

For a limited trial on the performance of the anthropometric system that has been built, measurements of body mass, height, head circumference, and body temperature were carried out. This study used a sample of 5 children, comprising 3 boys and 2 girls. used. The parents of the children involved had given their informed consent regarding this study. The inclusion criteria in this study were children who could stand and were younger than 5 years old. This is due to the consideration that in the first 5 years of a child’s life is the golden age period, so it is necessary to pay attention to their nutritional status. Measurements were repeated 10 times each. The measurement results by the anthropometric system that has been developed are compared with the measurement results from commercial tools. The measurement data were presented using mean ± deviation standard.

3. Results

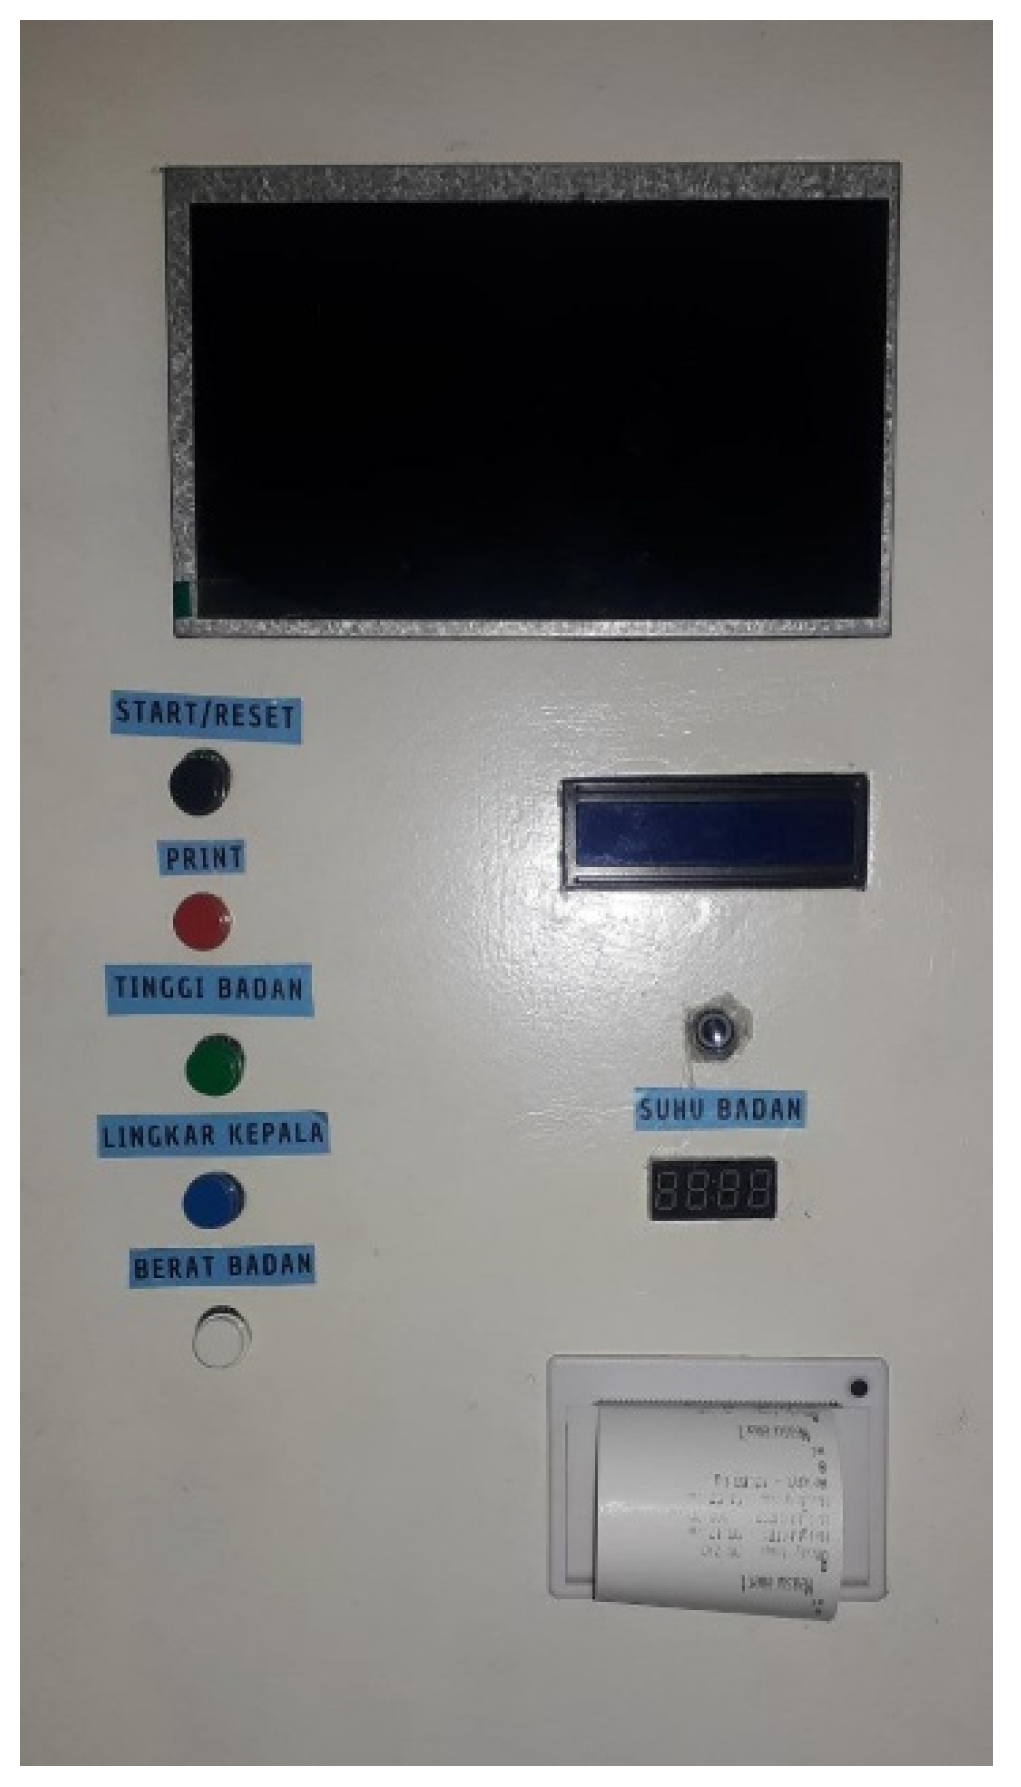
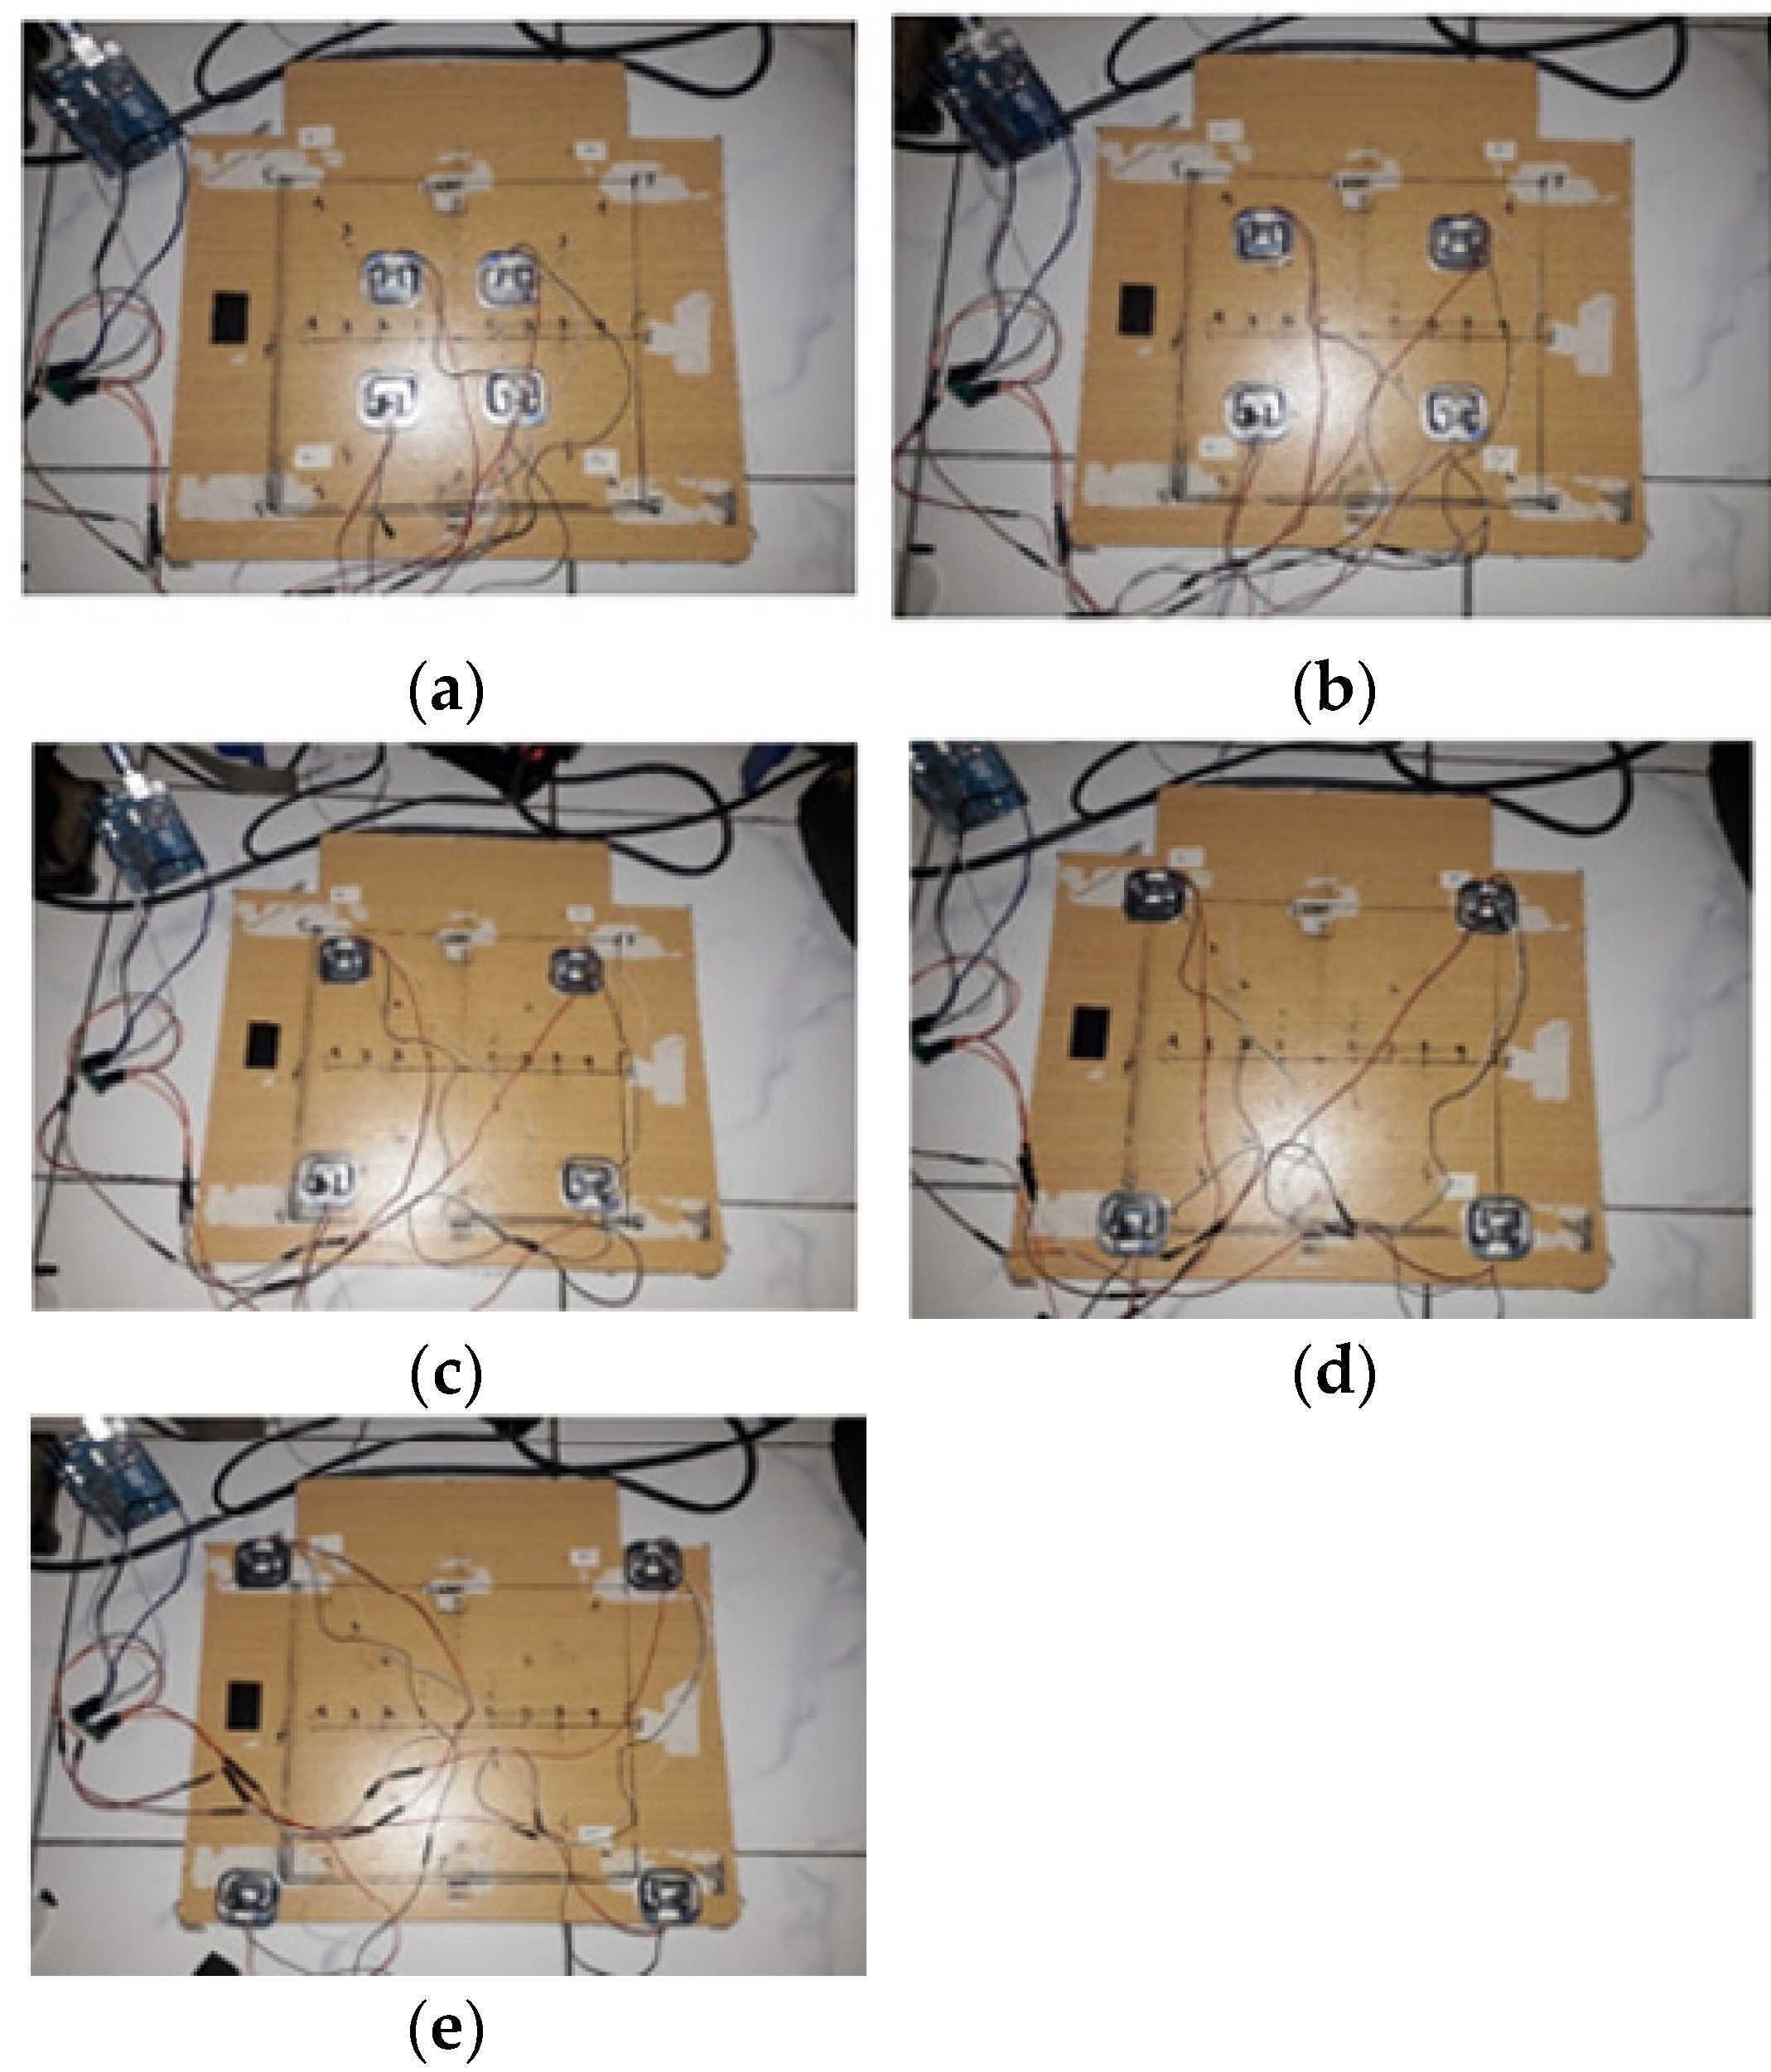
3.1. Prototype of Developed Anthropometric System

The prototype of the anthropometric system that has been developed consists of 4 parts, where the first part is the base for measuring body mass. The second part is the control box which contains all the components, namely the microcontroller, LCD, temperature sensor, thermal printer, and speakers. The third part is circular as a component for measuring the head circumference, and the fourth part is located above the control box to place the height-measuring sensor. Figure 2 shows the part of a control box and its component.

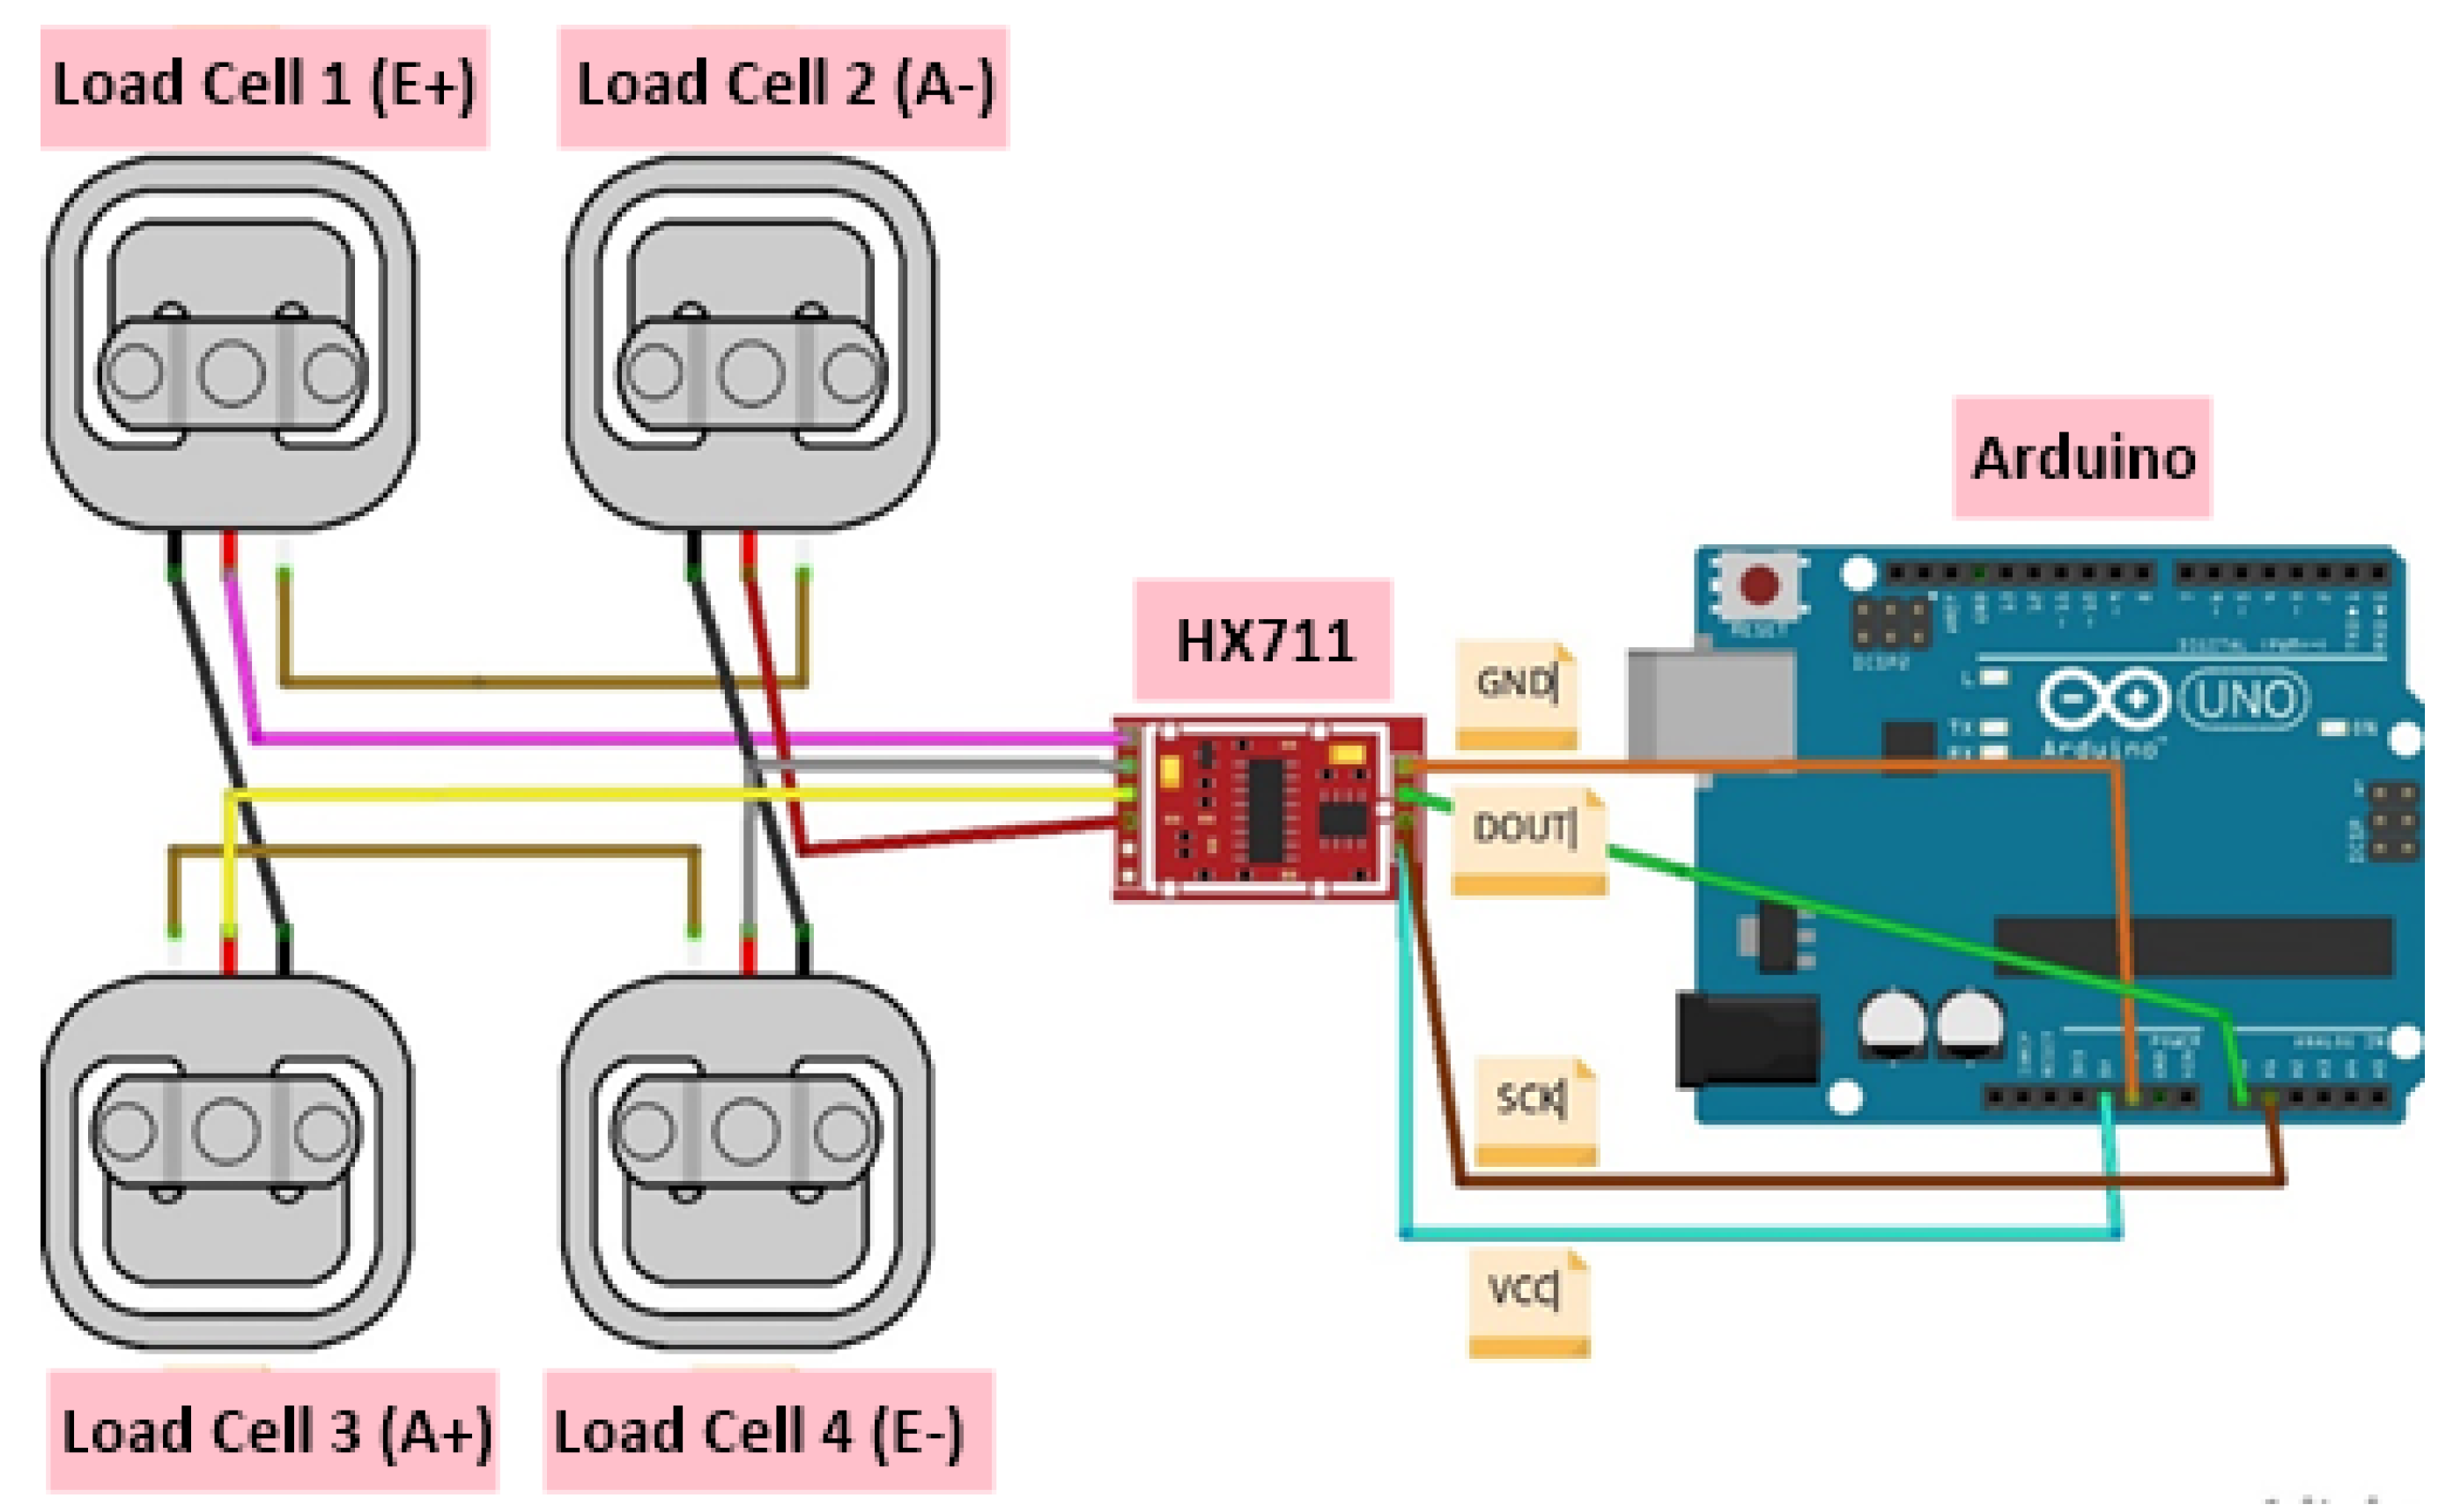
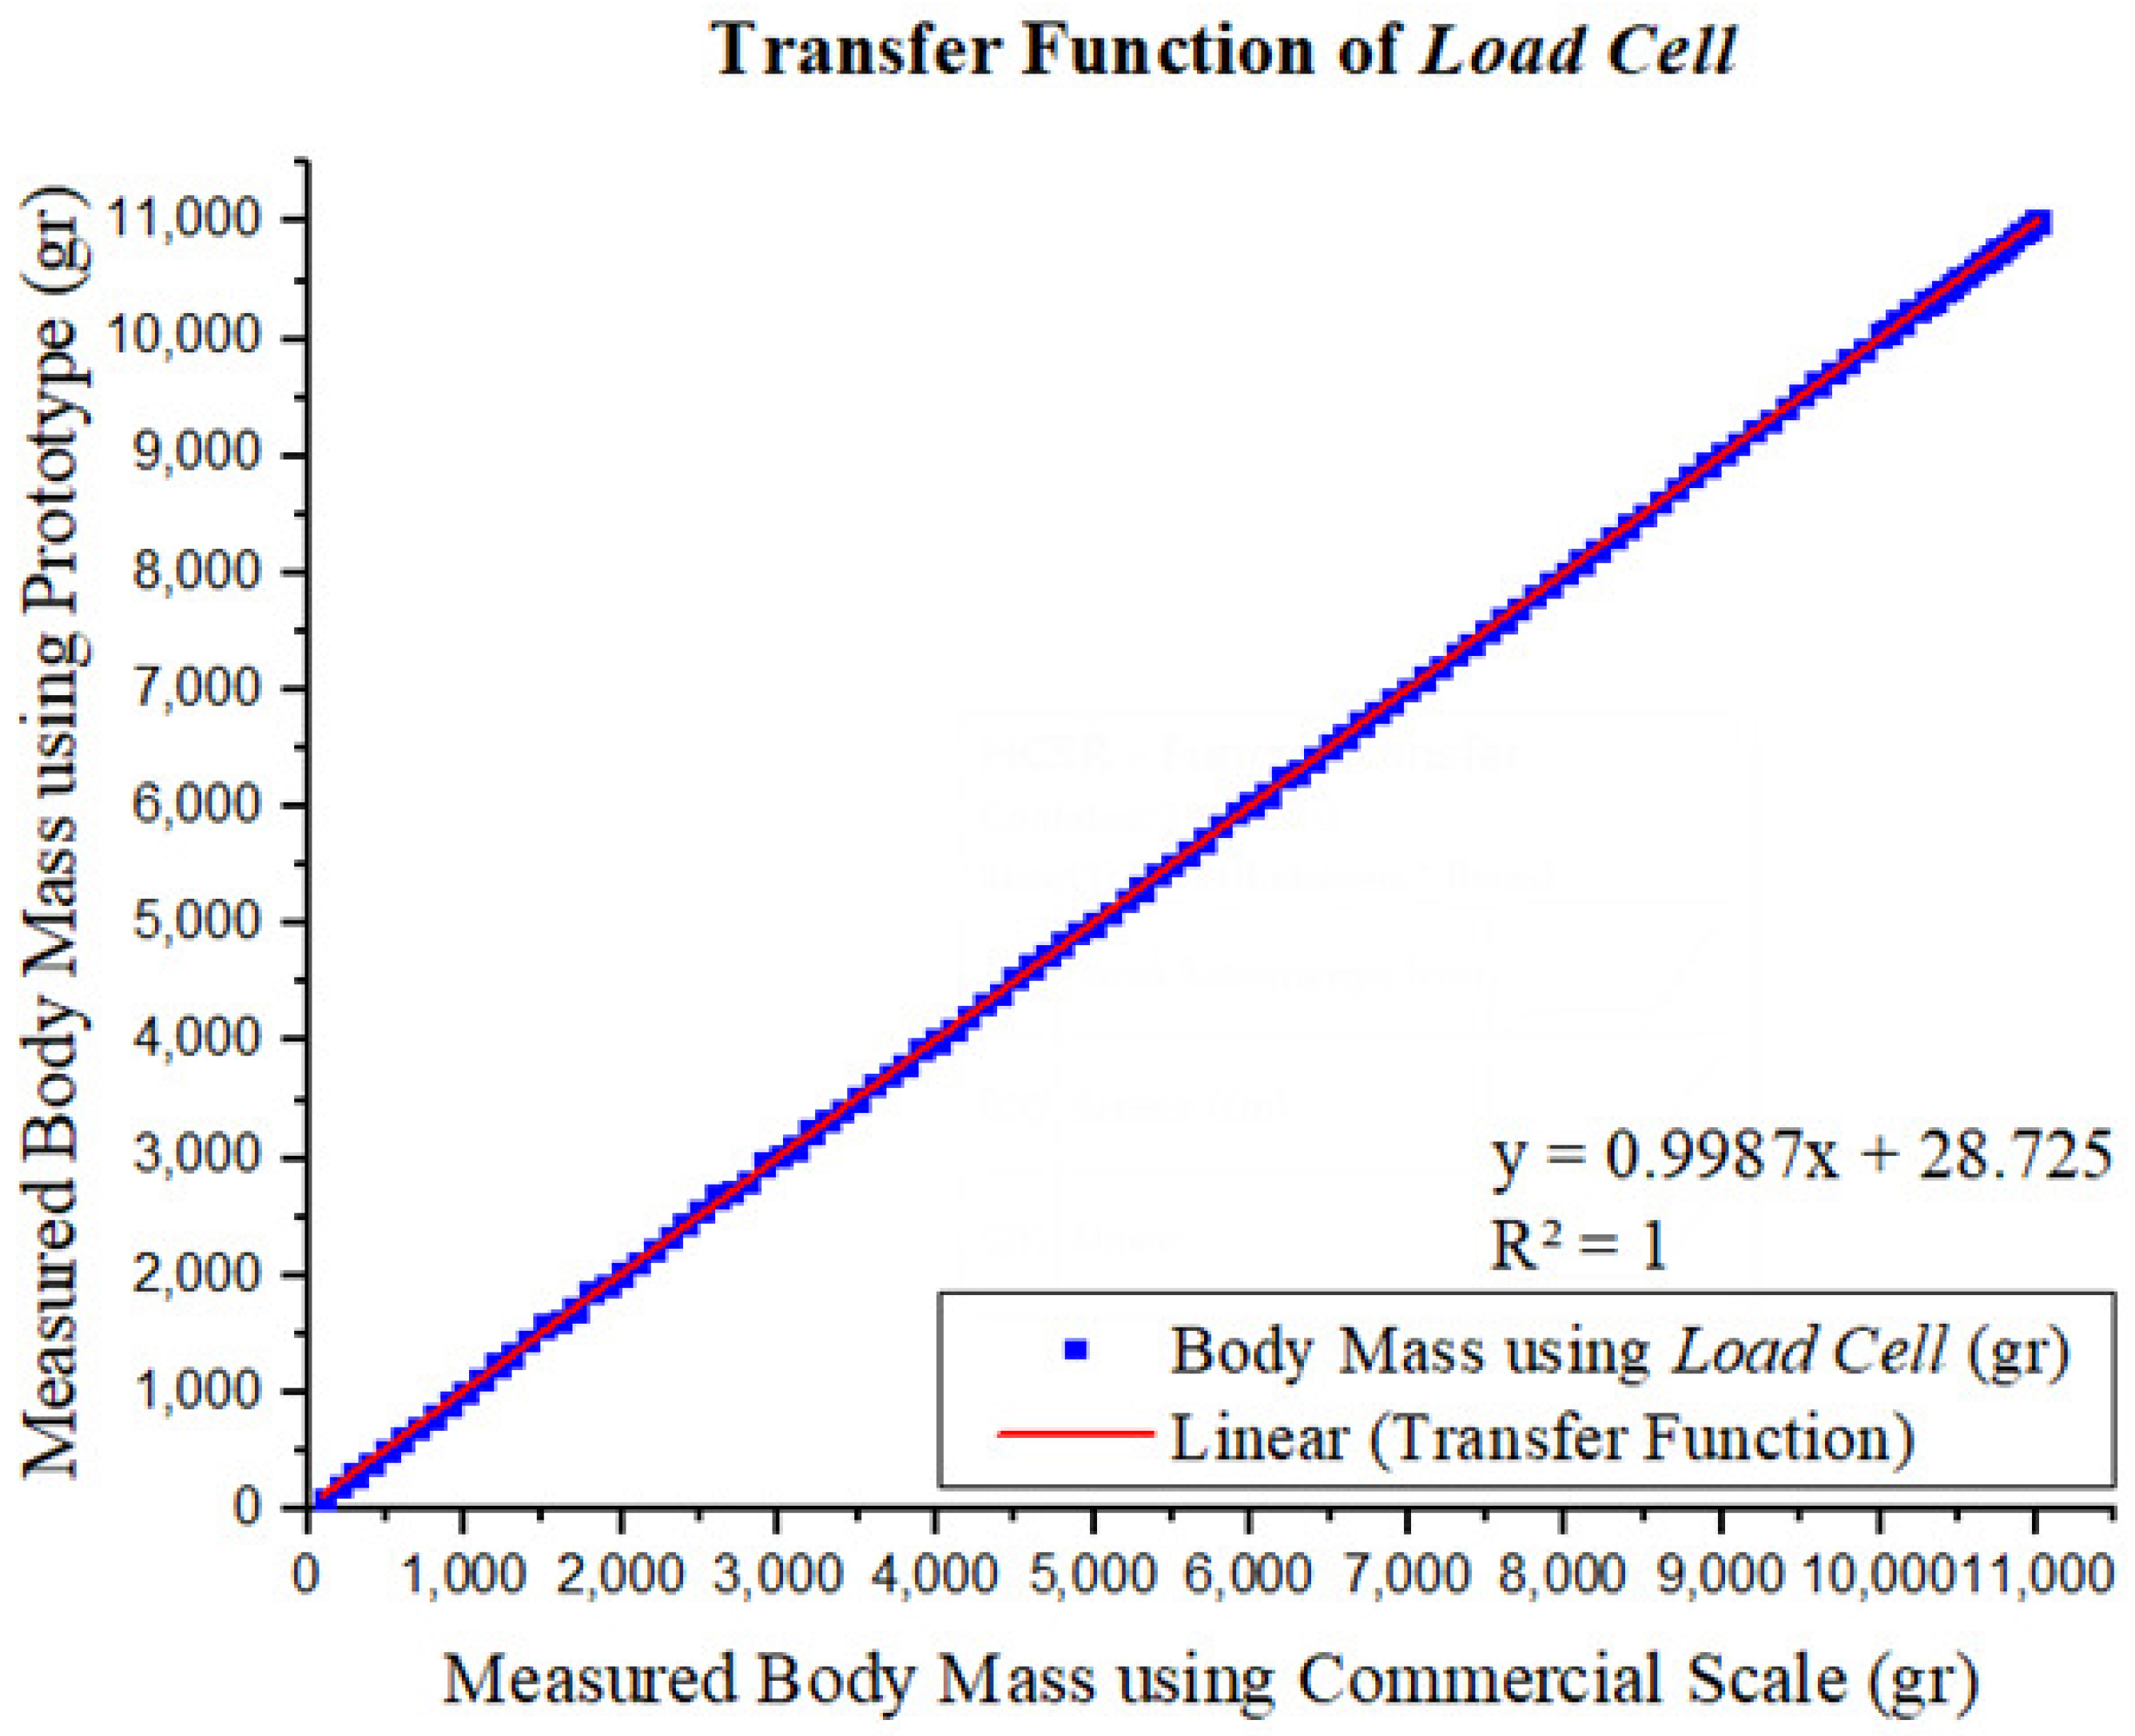
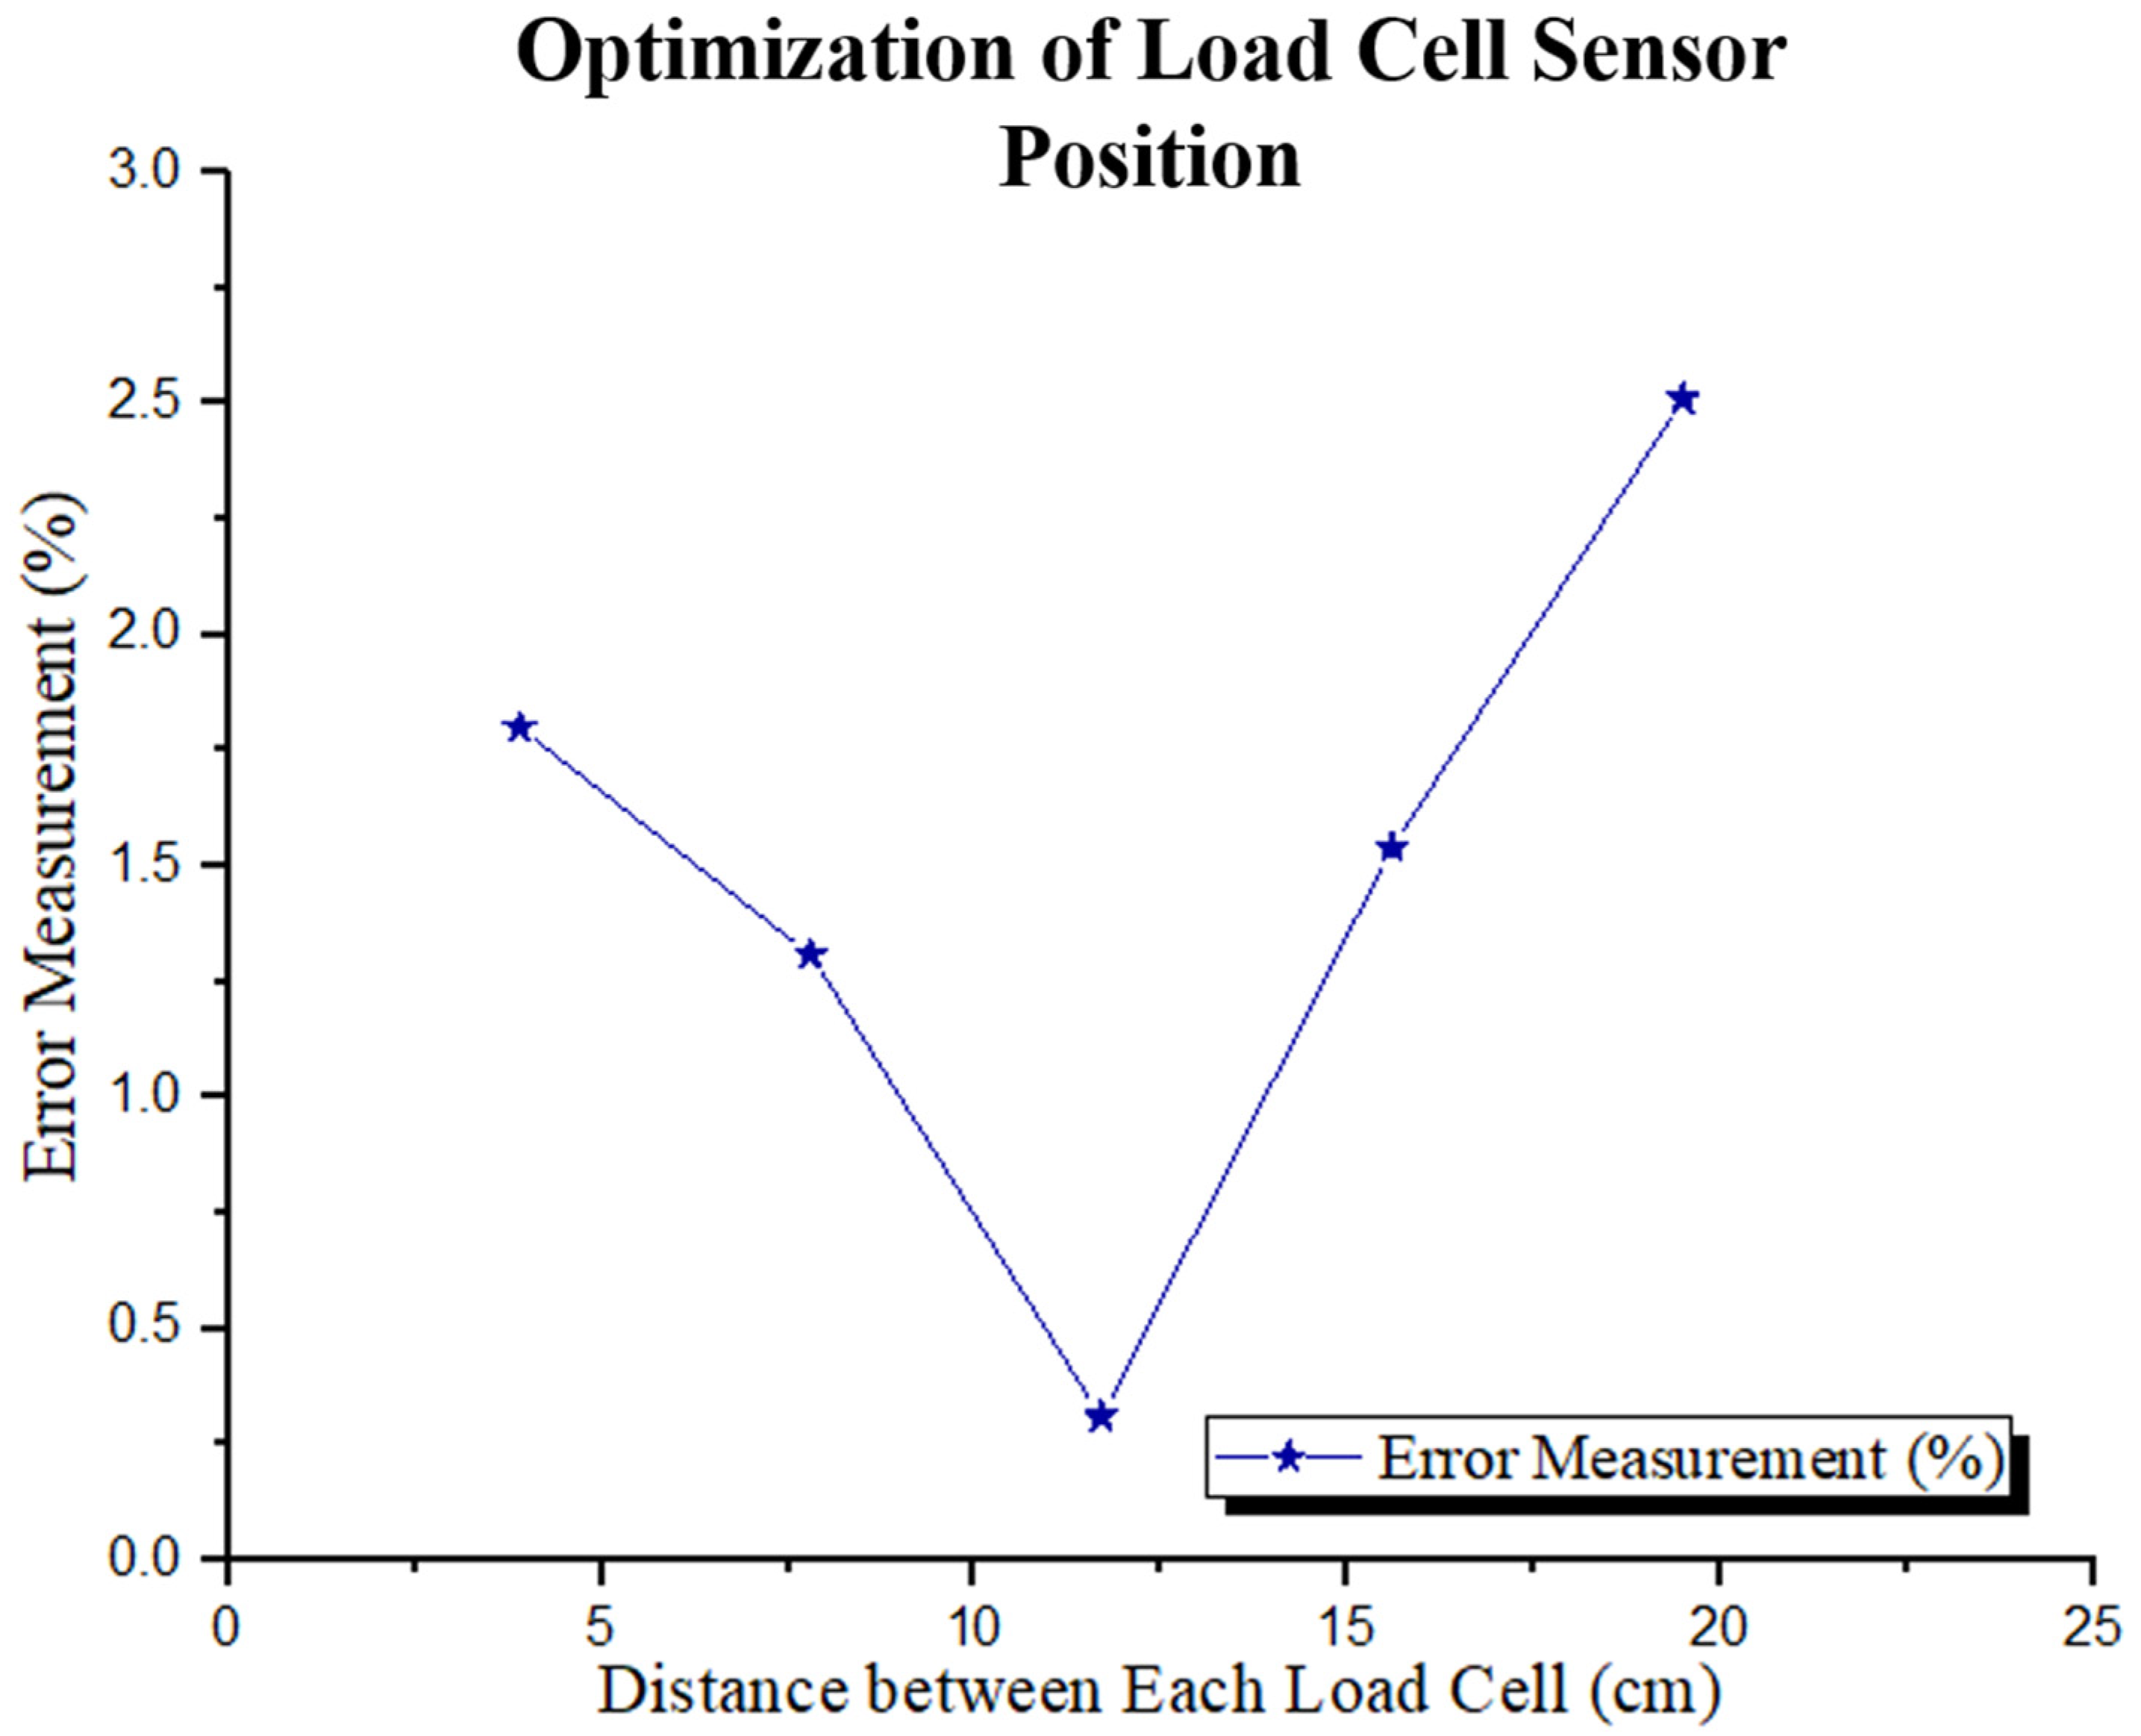
3.2. Body Mass Measurement Components

Four half-bridge load cell sensors were used for body mass measurement with a sensitivity value of 1.0 ± 15% mV/V. However, the output value generated from the half-bridge type load cell was very small, so it required an amplifier, which was a HX711 as shown in Figure 3.
Sensor characterization was performed by comparing the voltage at the measurement point (A+ and A−) with the voltage at the source point (E+ and E−) by looking at increasing or decreasing changes for every 100 g in the range of 100 gr to 10,000 gr and seeing increasing or decreasing changes for every 50 gr in the range of 10,000 gr to 11,000 gr, each of which was performed three times. For every change in the load of 100 gr, there was a change in voltage of 1 ± 17% mV, whereas for every change in the load of 50 gr, there was a change in voltage of 1 ± 17% mV. Furthermore, the sensor characterization was carried out through a graph of the sensor transfer function, specifically by comparing the load value read on the digital scale with the load value read by the load cell sensor, as shown in Figure 4.
Afterward, optimization of the position of the load cell sensor was carried out. The load cell sensor was mounted on a board measuring 30 cm × 30 cm × 1.7 cm, and a plate mass of 21,254 gr was used as the value of the calibration factor, as shown in Figure 5. In order to determine the most optimal sensor position, five samples with different masses were used, and measurements were carried out with ten repetitions.
Placement of the sensor that is too close will cause the reference voltage to become unstable, and friction will occur on the four sensors, causing a pressure-damping force. In addition, a distance that is too close will cause the sensor to be overloaded, causing a decrease in the elasticity of the sensor. Based on the test data that had carried out, it was found that the sensor position had a small error percentage value (%) at a distance of 11.7 cm, which is 0.31%, as shown in Figure 6.

3.3. Height Measurement Components

In this study, for height measurements, a comparison was made using an ultrasonic sensor HC-SR04 and an infrared sensor of the Sharp IR GP2Y0A21 type to identify the type of sensor with better accuracy.

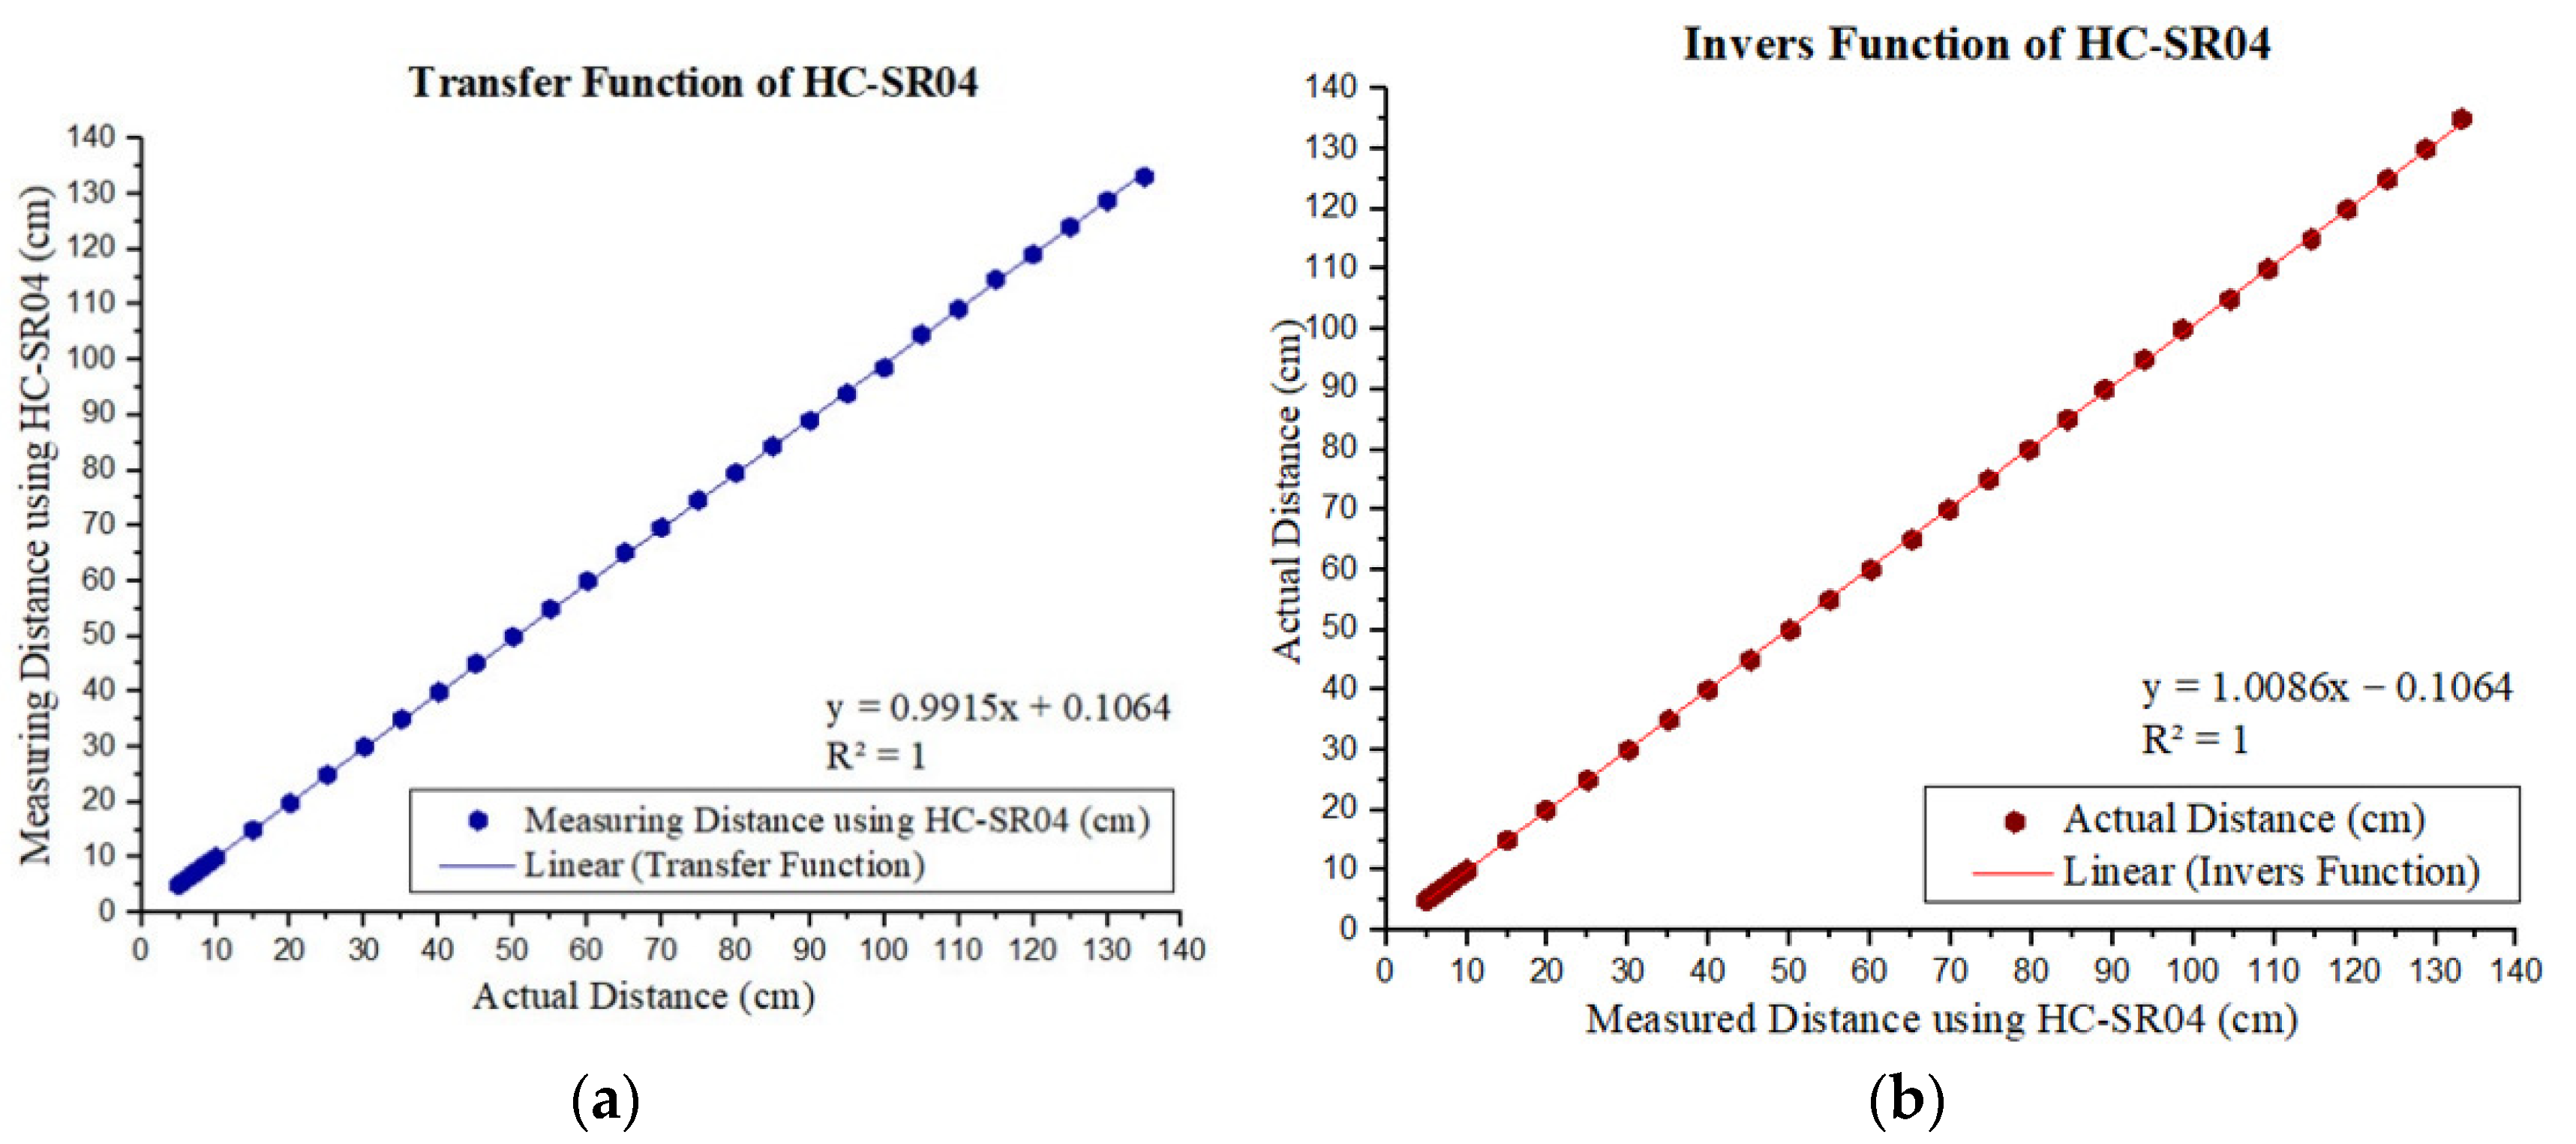
3.3.1. Characterization of HC-SR04 Ultrasonic Sensor for Height Measurement

The HC-SR04 sensor is an ultrasonic sensor widely used for distance measurement. This sensor can read distances in the range of 2 cm to 4 m with an accuracy of 3 mm. The ultrasonic sensor HC-SR04 emits waves with a frequency of 40 kHz. In this study, the determination of the optimum distance is performed by finding the minimum distance that the sensor can read. The distance range used is from 2 cm to 10 cm, with addition and reduction in the distance by 0.5 cm, each of which was performed three times. The output value on the sensor will be compared with the actual distance.
It was found that at a distance of 5 cm the sensor reading data had a small deviation value of 0.03 cm. Therefore, it can be concluded that the sensor can measure the distance accurately, starting from the actual distance of 5 cm. After that, the minimum distance is used to graph the transfer function and the inverse function, which is 5 cm. The determination of the transfer function graph used a distance of 5 cm to 10 cm with increments of 0.1 cm and a distance of 10 cm to 135 with increments of 5 cm. The obtained results of the transfer function graph are shown in Figure 7.
After obtaining the transfer function equation, the non-linear graph can be identified, namely the inverse function. The inverse function equation will determine the value of the relative error. Based on the equation of the inverse function, it is found that the relative error value or the average sensor error is 0.83%.

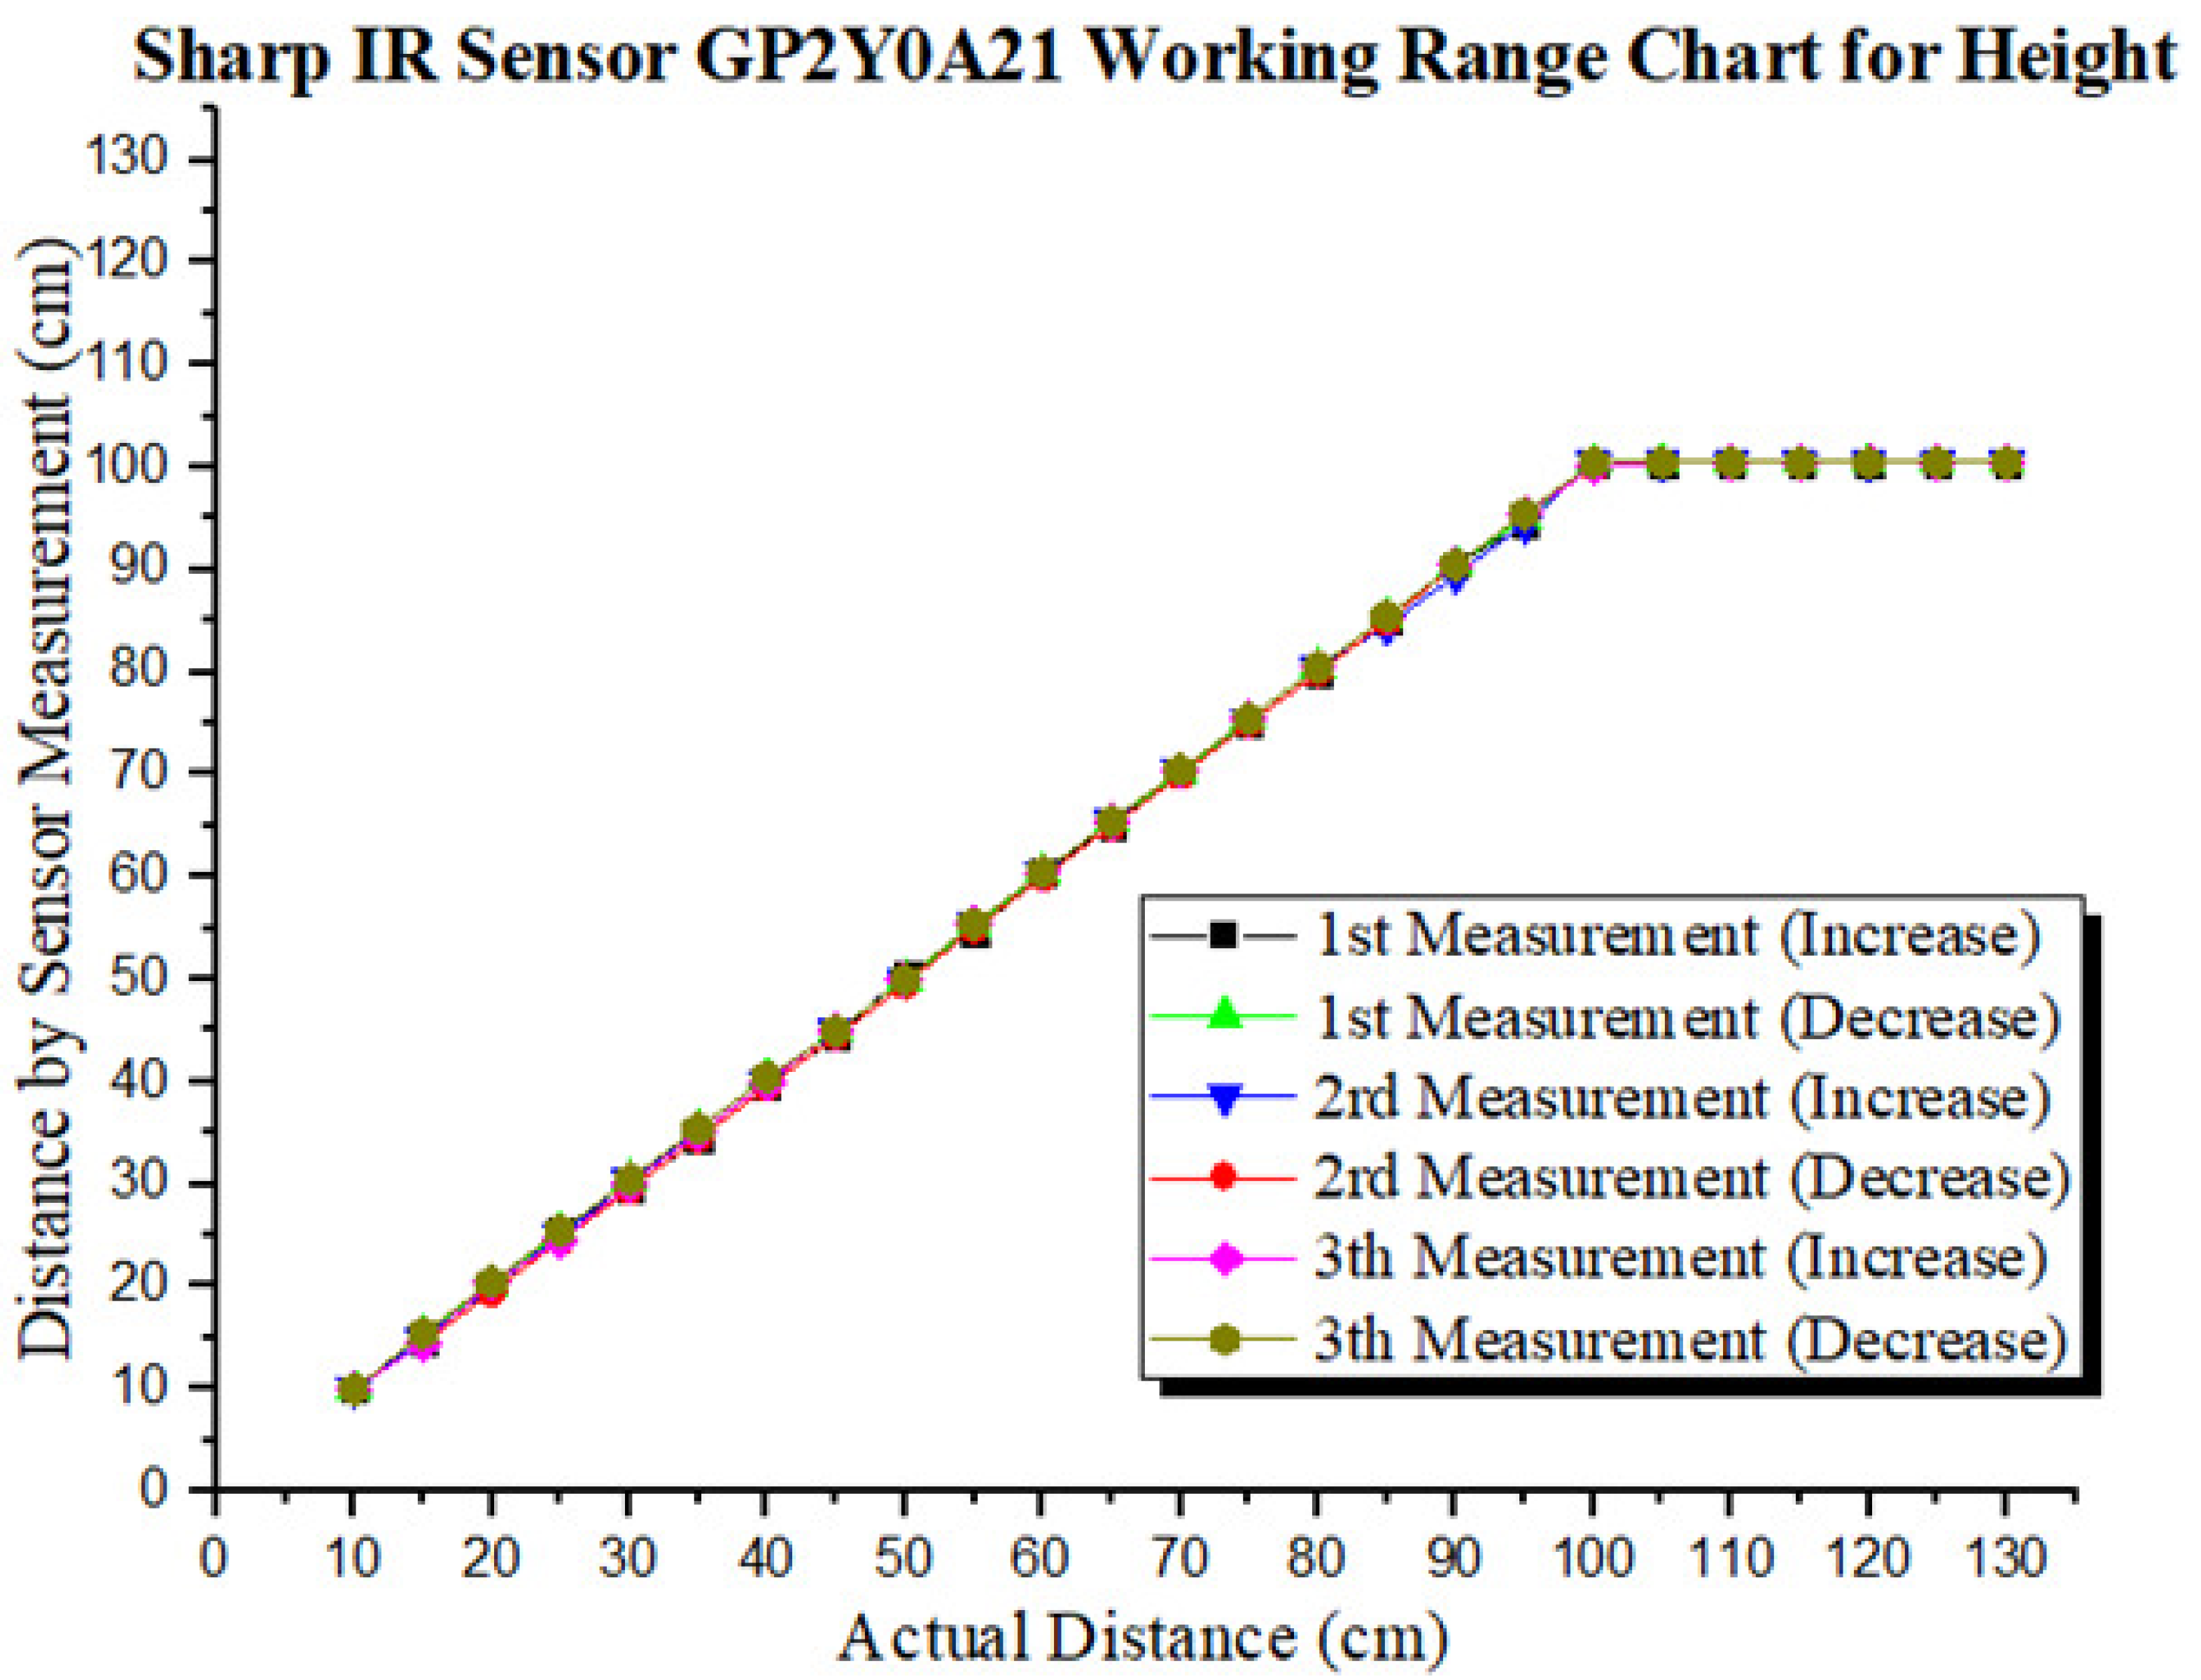
3.3.2. Characterization of Sharp IR GP2Y0A21 Sensor for Height Measurement

The Sharp IR GP2Y0A21 sensor is a sensor that uses the principle of transmitting and receiving infrared waves in order to obtain the distance value. This sensor utilizes the triangulation method so that sensor detection will not be affected by operating duration, reflectivity, and ambient temperature. This sensor has an output voltage value that corresponds to the detected distance. The IR GP2Y0A21 sharp sensor has an accurate measuring distance in the range of 10 to 80 cm. The value of the working voltage on the sensor is around 4.5 volts to 5.5 volts.
In order to identify the minimum distance read by the sensor, characterization was carried out using a distance of 5 cm to 10 cm with an addition or subtraction of 0.1 cm, each of which was repeated three times. When the sensor reading distance is 10 cm, the smallest standard deviation value is obtained; therefore, it can be said that the sensor has a minimum distance of 10 cm. Furthermore, characterization is carried out to determine the furthest distance that can be read by the sensor, as shown in the graph of the sensor working range in Figure 8.
After knowing the sensor’s minimum value and working range, a transfer function is made using a distance of 10 cm to 100 cm with a change in distance of 5 cm. It can be concluded that the relative error value or average error of the sharp IR sensor GP2Y0A21 for height measurement is 0.24%.
In this study, the prototype of anthropometric system has a height of 140 cm. This is based on the fact that according to Indonesian standards, it is known that the maximum height standard for Indonesian children is around 123.9 cm at this age [25,26].

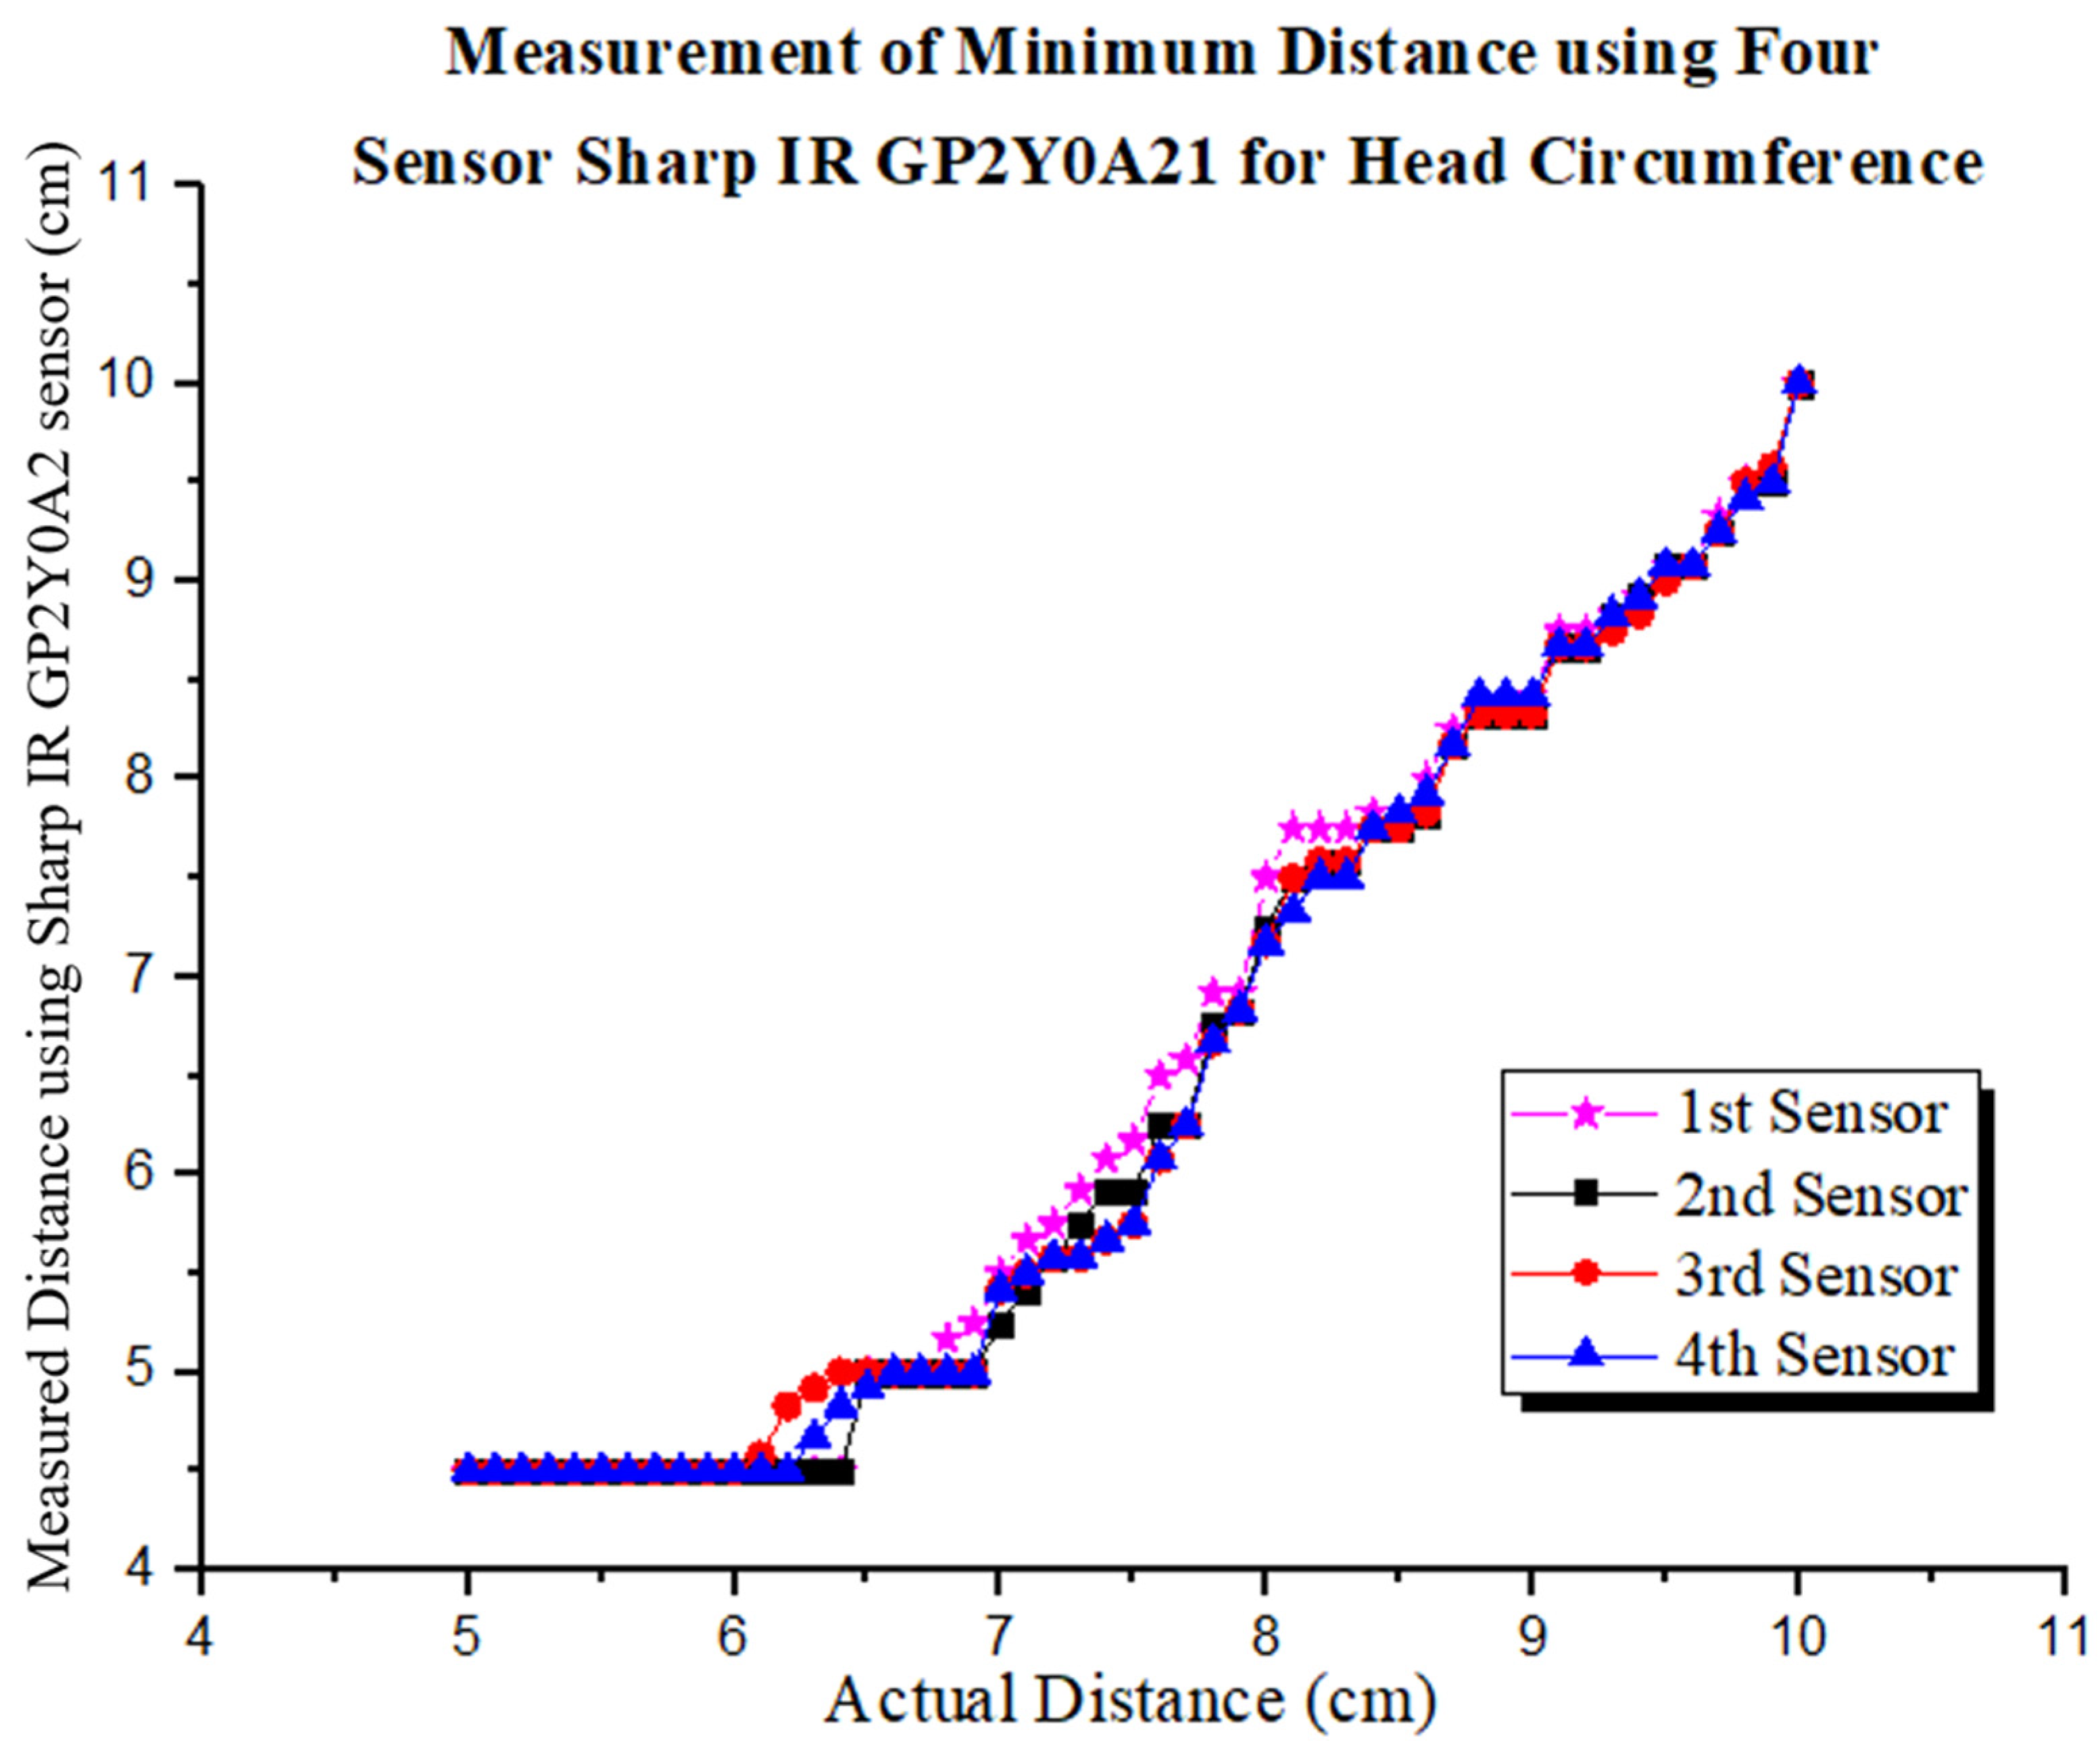
3.4. Characterization of Sharp IR GP2Y0A21 Sensor for Head Circumference

Four Sharp IR GP2Y0A21 sensors are used for the head circumference measurement, each of which is placed at an angle of 90°. At first, the characterization of 4 sensors was carried out by identifying the minimum distance that the sensor was able to read, using a distance range of 5 cm to 10 cm with a difference in the distance range of 0.1 cm, repeated three times, the results are shown in the Figure 9.
Determination of the transfer function on the four Sharp IR GP2Y0A21 sensors for head circumference is carried out using a distance of 10 cm to 65 cm with a distance range of 5 cm. The four sensors for head circumference have output values that are directly proportional to the actual distance, and it can be seen that the transfer function graph is linear. The slope or sensitivity value for head circumference 1 is 0.9995, head circumference 2 is 0.9962, head circumference 3 is 1.0002, and head circumference 4 is 1.0013. This shows that the sensitivity value of the four sensors is relatively high. Based on the transfer function graph obtained, the actual value measured can be determined by making a graph of the inverse function. The relative error value or average error of head circumference sensor 1 is 0.51%, head circumference sensor 2 is 0.53%, head circumference sensor 3 is 0.25%, and head circumference sensor 4 is 0.37%. The head circumference measurement is performed by determining the width and height of the head by fitting the ellipse equation [23].

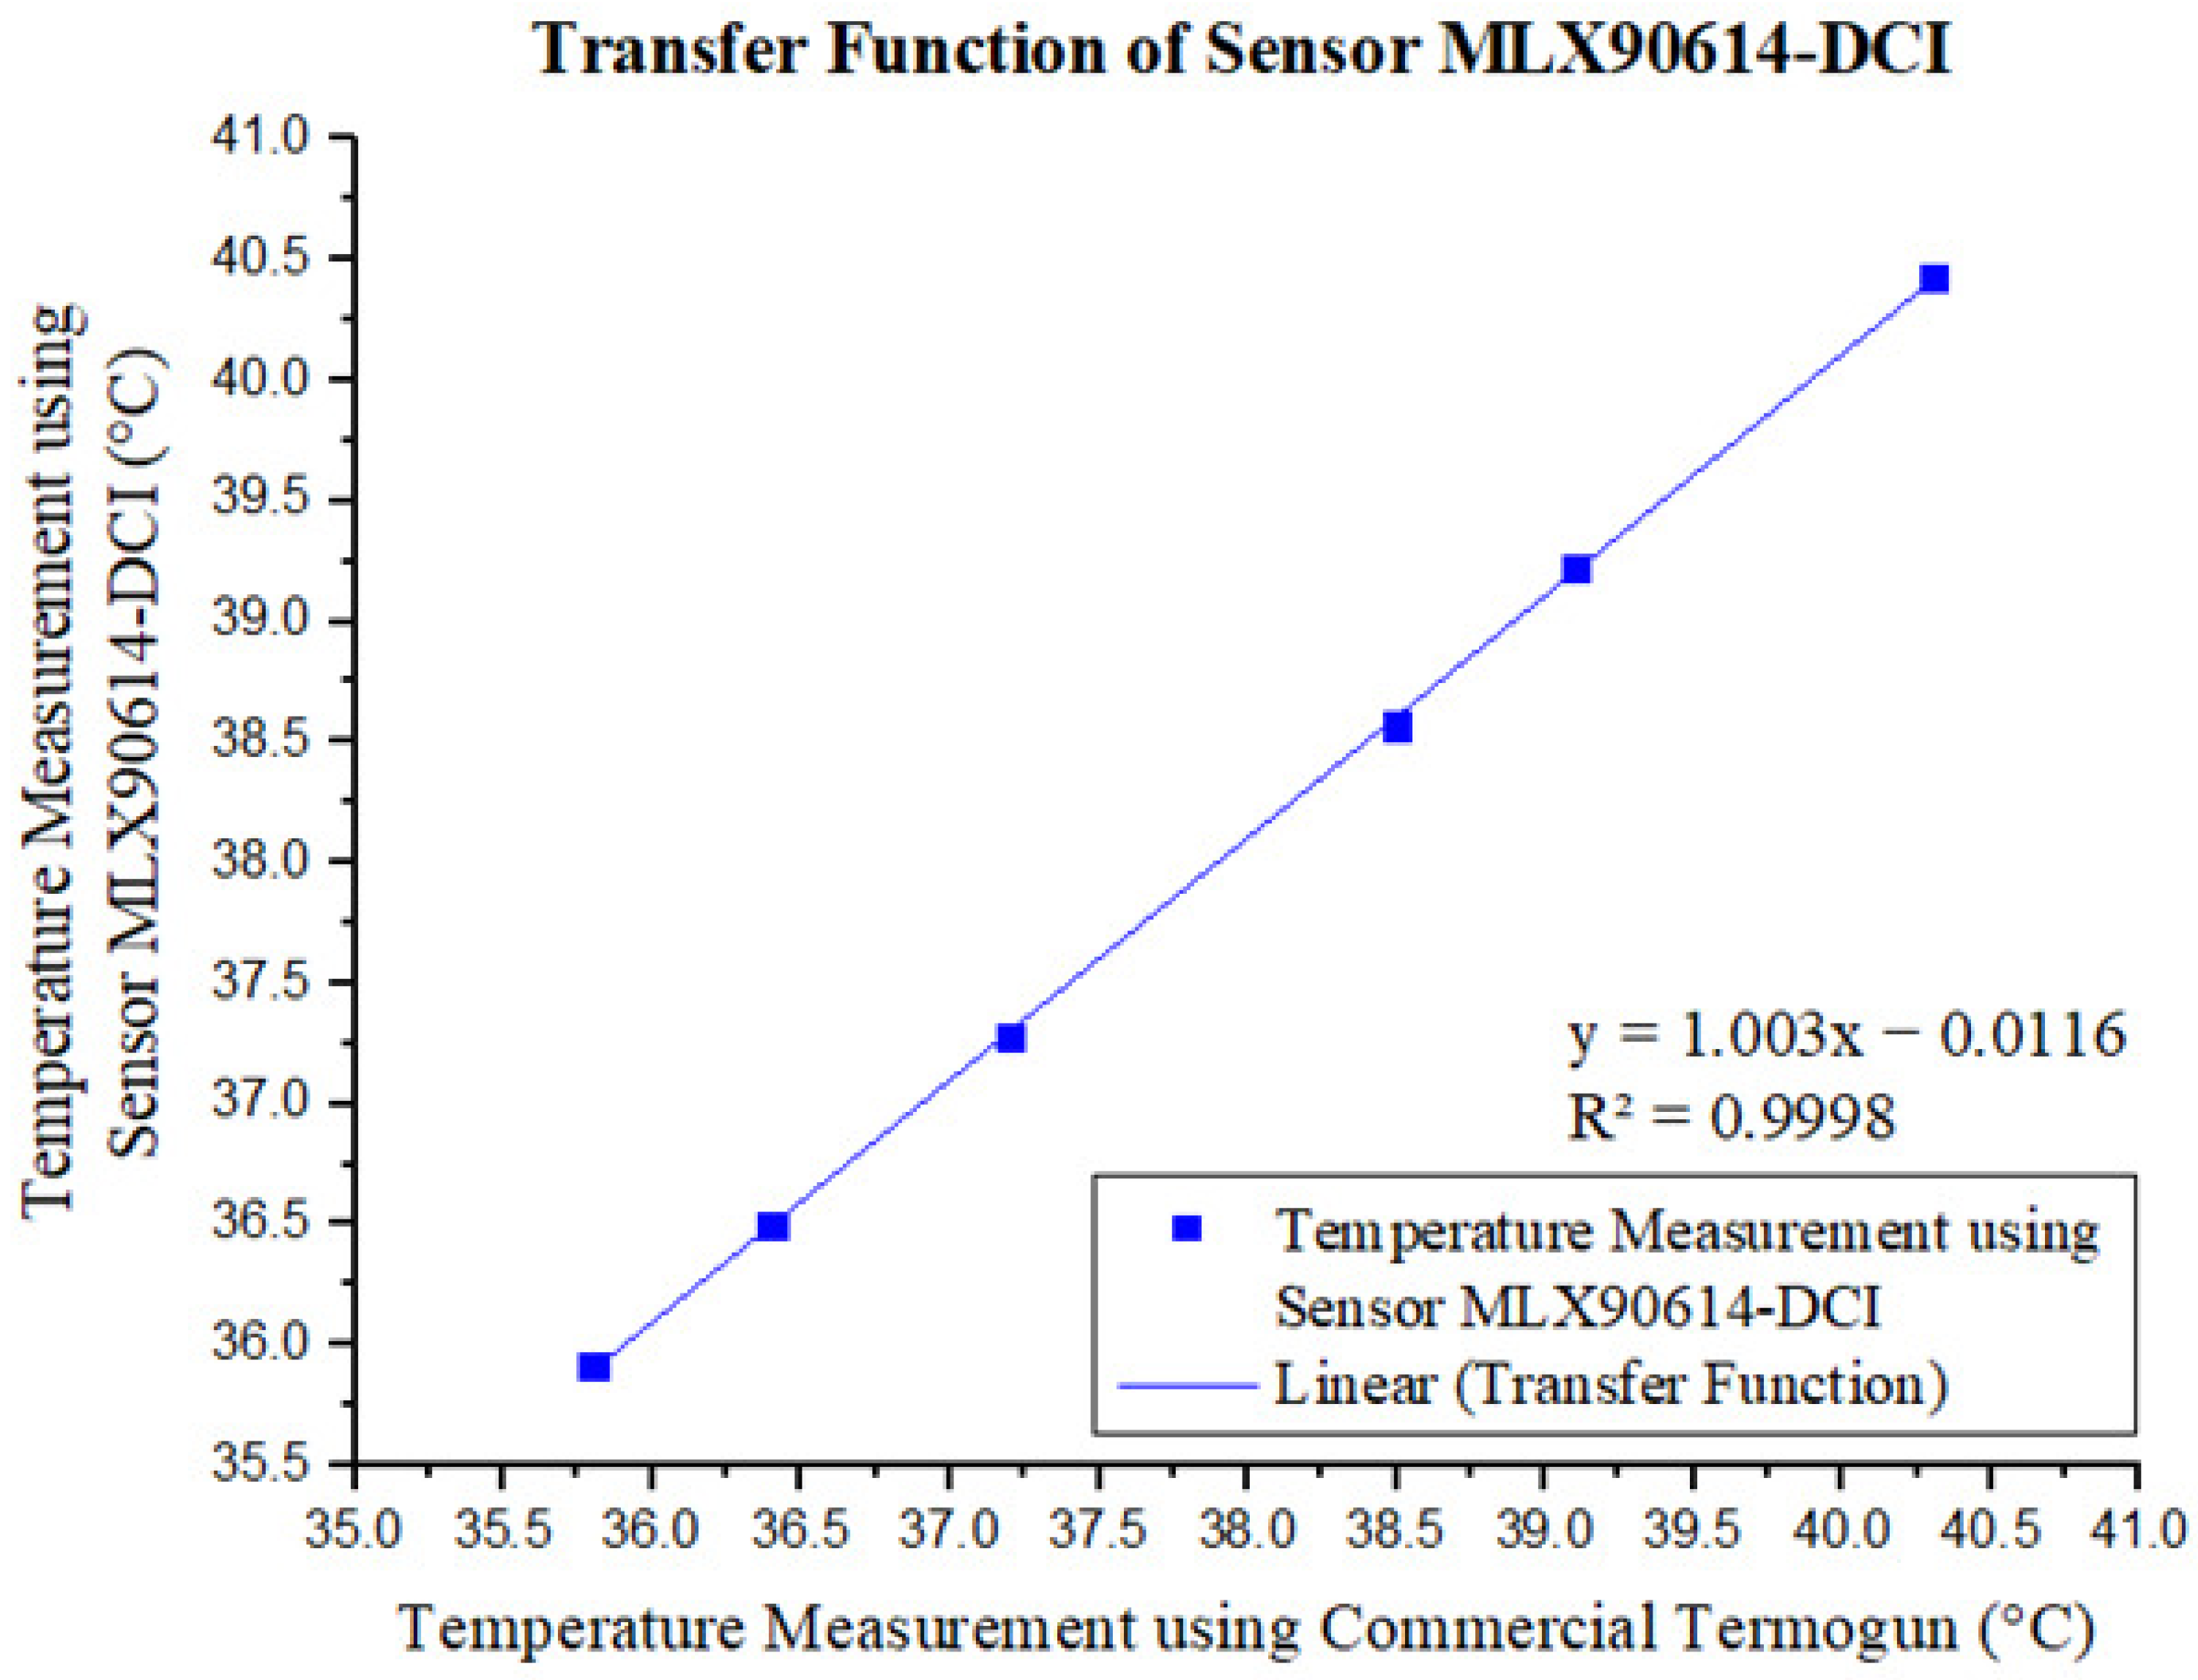
3.5. Characterization of MLX90614-DCI Sensor for Body Temperature Measurement

The MLX90614-DCI sensor is a non-contact sensor that utilizes infrared radiation emitted by objects, which will then convert into temperature quantities. This sensor has a field of view of around 5°, so it is very suitable for calculating temperatures with high accuracy and has a wide range of temperature readings.
The optimum distance of the MLX90614-DCI sensor is determined by measuring the object’s temperature from a distance of 1 cm to 20 cm with the addition of a distance of 1 cm. The temperature read by the sensor is then compared with the temperature reading by the thermogun. Based on the comparison data of the two temperature measurement methods, it can conclude that the MLX90614-DCI sensor has an optimal distance of 14 cm because it has the smallest deviation. Furthermore, the data correlation is carried out by plotting the distance data with the output value on the MLX90614-DCI sensor and comparing it with a body temperature measuring instrument or thermogun. Data plotting was carried out using a temperature range of 35 °C to 40 °C, as shown in Table 1.
The output value of the thermogun and sensor strongly correlates with the value of r in the range from 0.8 to 1. Then, a transfer function is made based on the data in Table 1, as shown in Figure 10.
The transfer function graph of the MLX90614-DCI sensor is linear, which shows that the sensor output value is proportional to the value measured by the thermogun. This is because the MLX90614-DCI sensor has a high sensitivity, which is indicated by the slope value of the transfer function of 1.003. After obtaining the transfer function, a graph of the inverse function and the error value of the sensor is made. The average error value of the MLX90614-DCI sensor for measuring body temperature is 0.05%.

3.6. Anthropometric System Testing

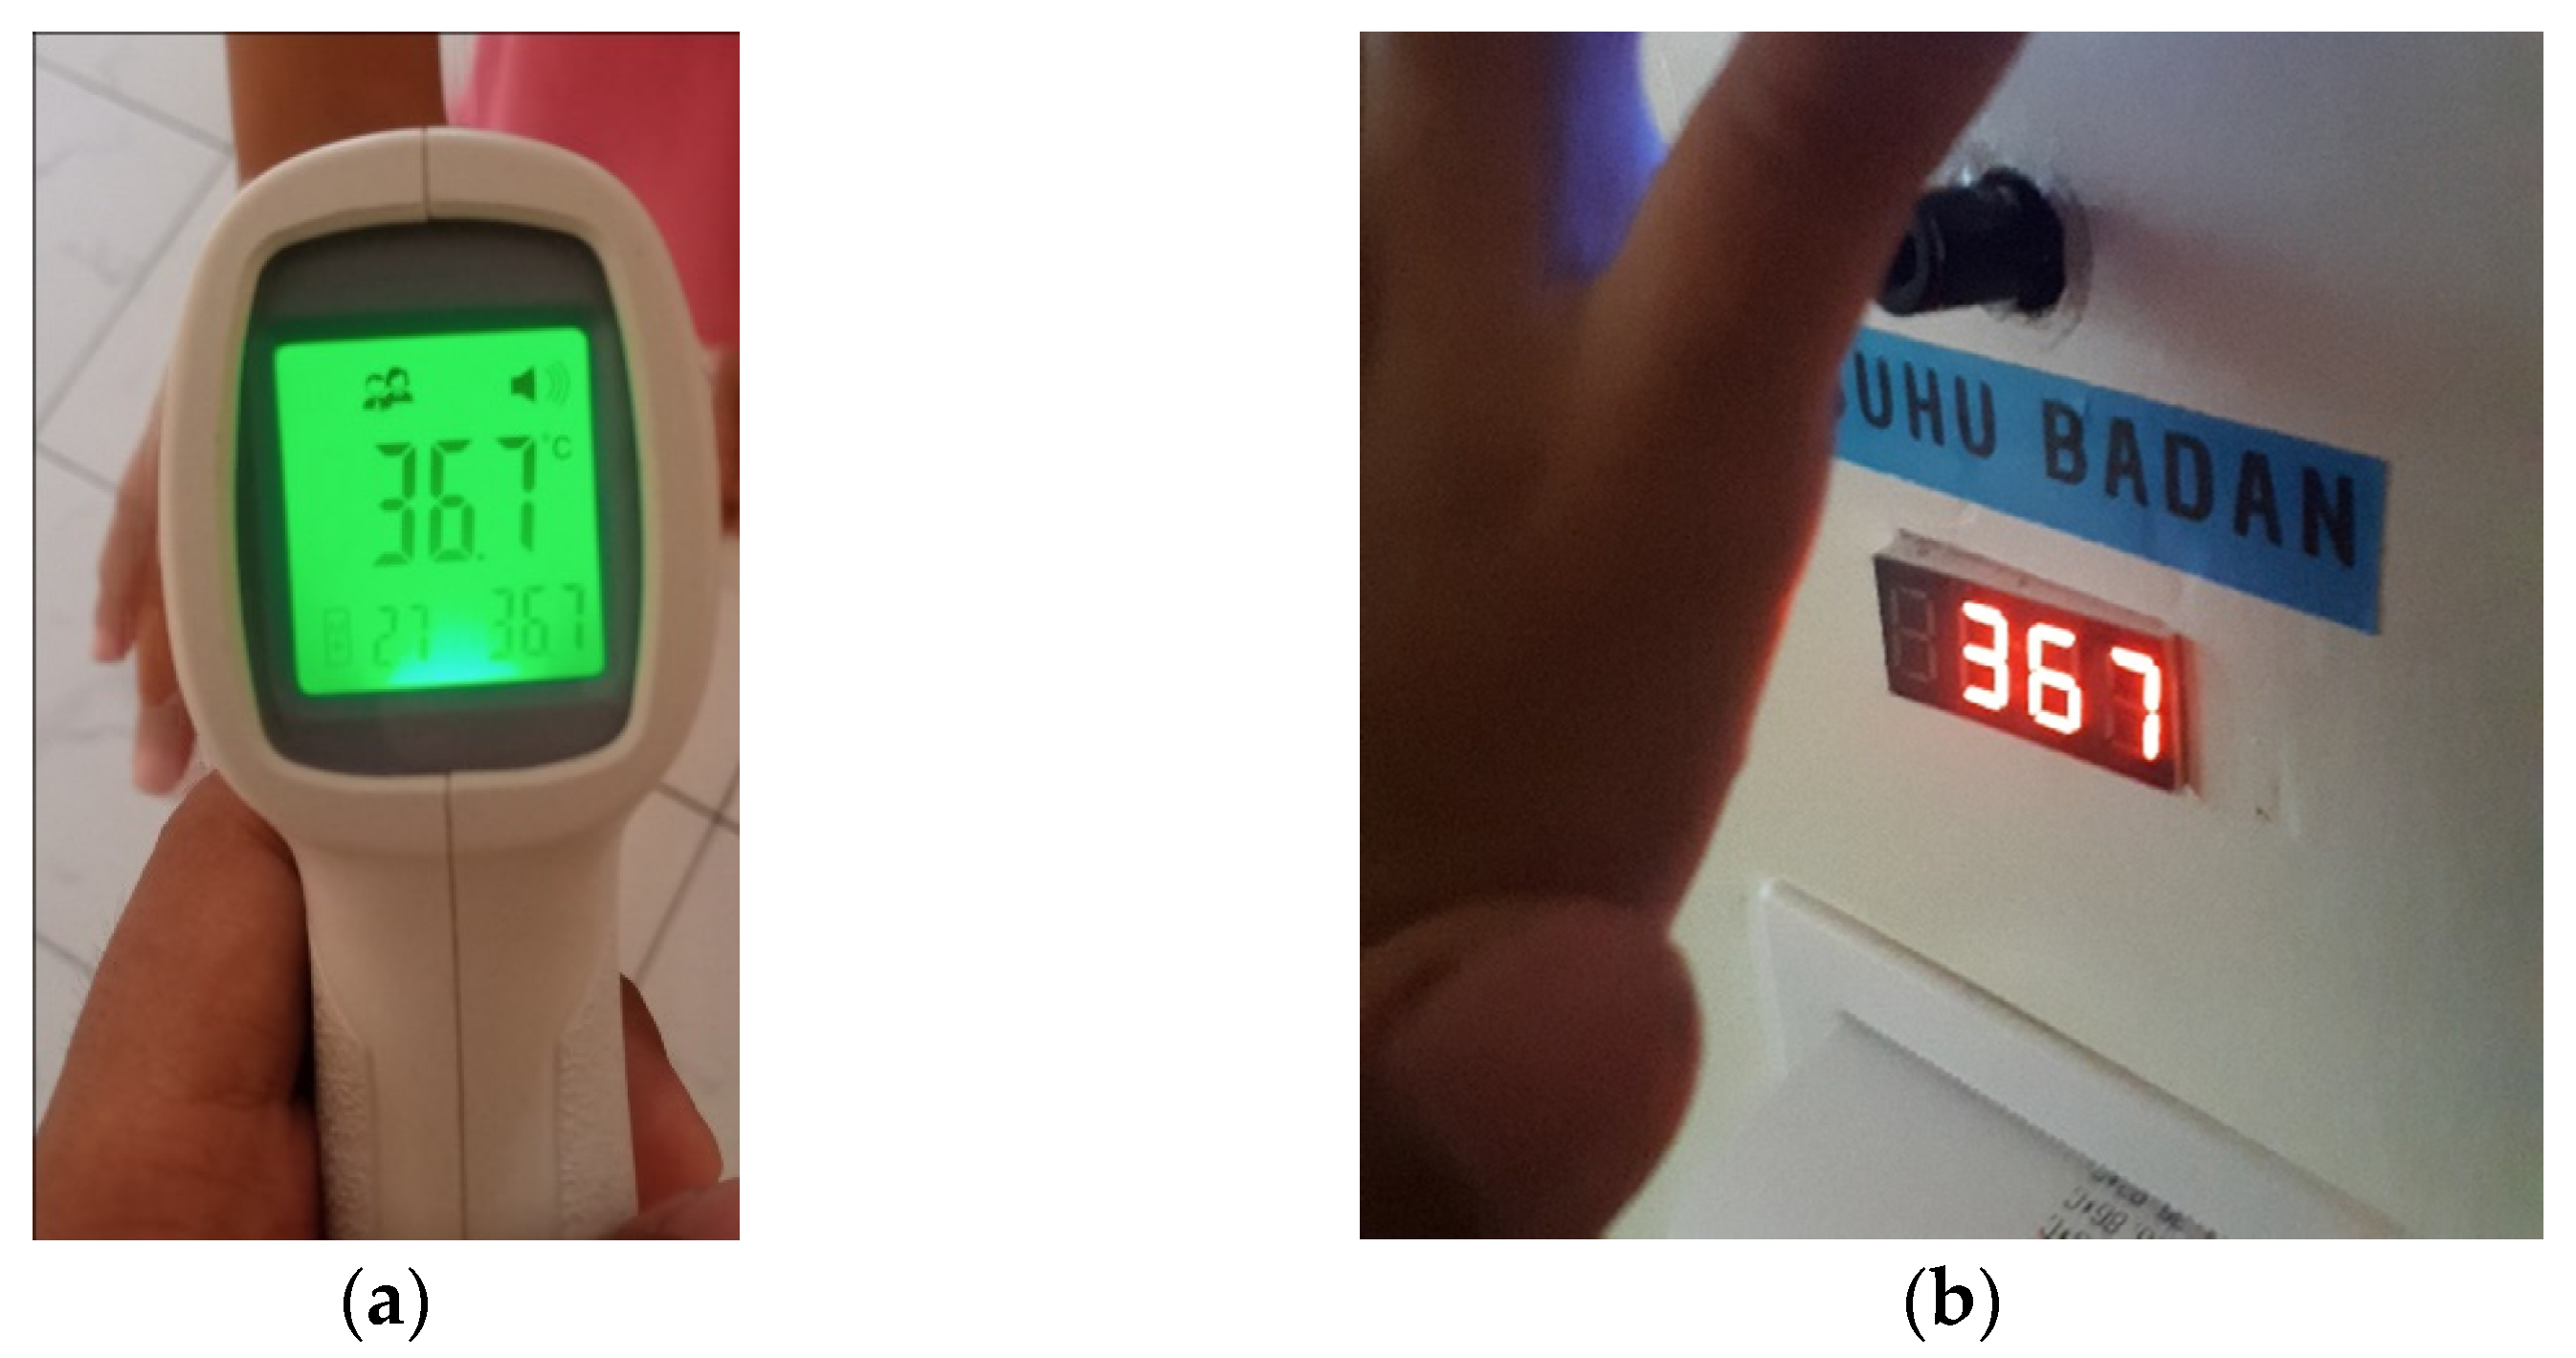
3.6.1. Body Temperature Measurement

Body temperature measurement is carried out by placing the hand at an optimum distance of 14 cm, as shown in Figure 11.
Body temperature measurements for five participants were carried out using a prototype anthropometric system that had been developed and compared with conventional measurements using a thermogun. The results of measuring body temperature are shown in Table 2. The average error in the developed anthropometric tool is 0.06%

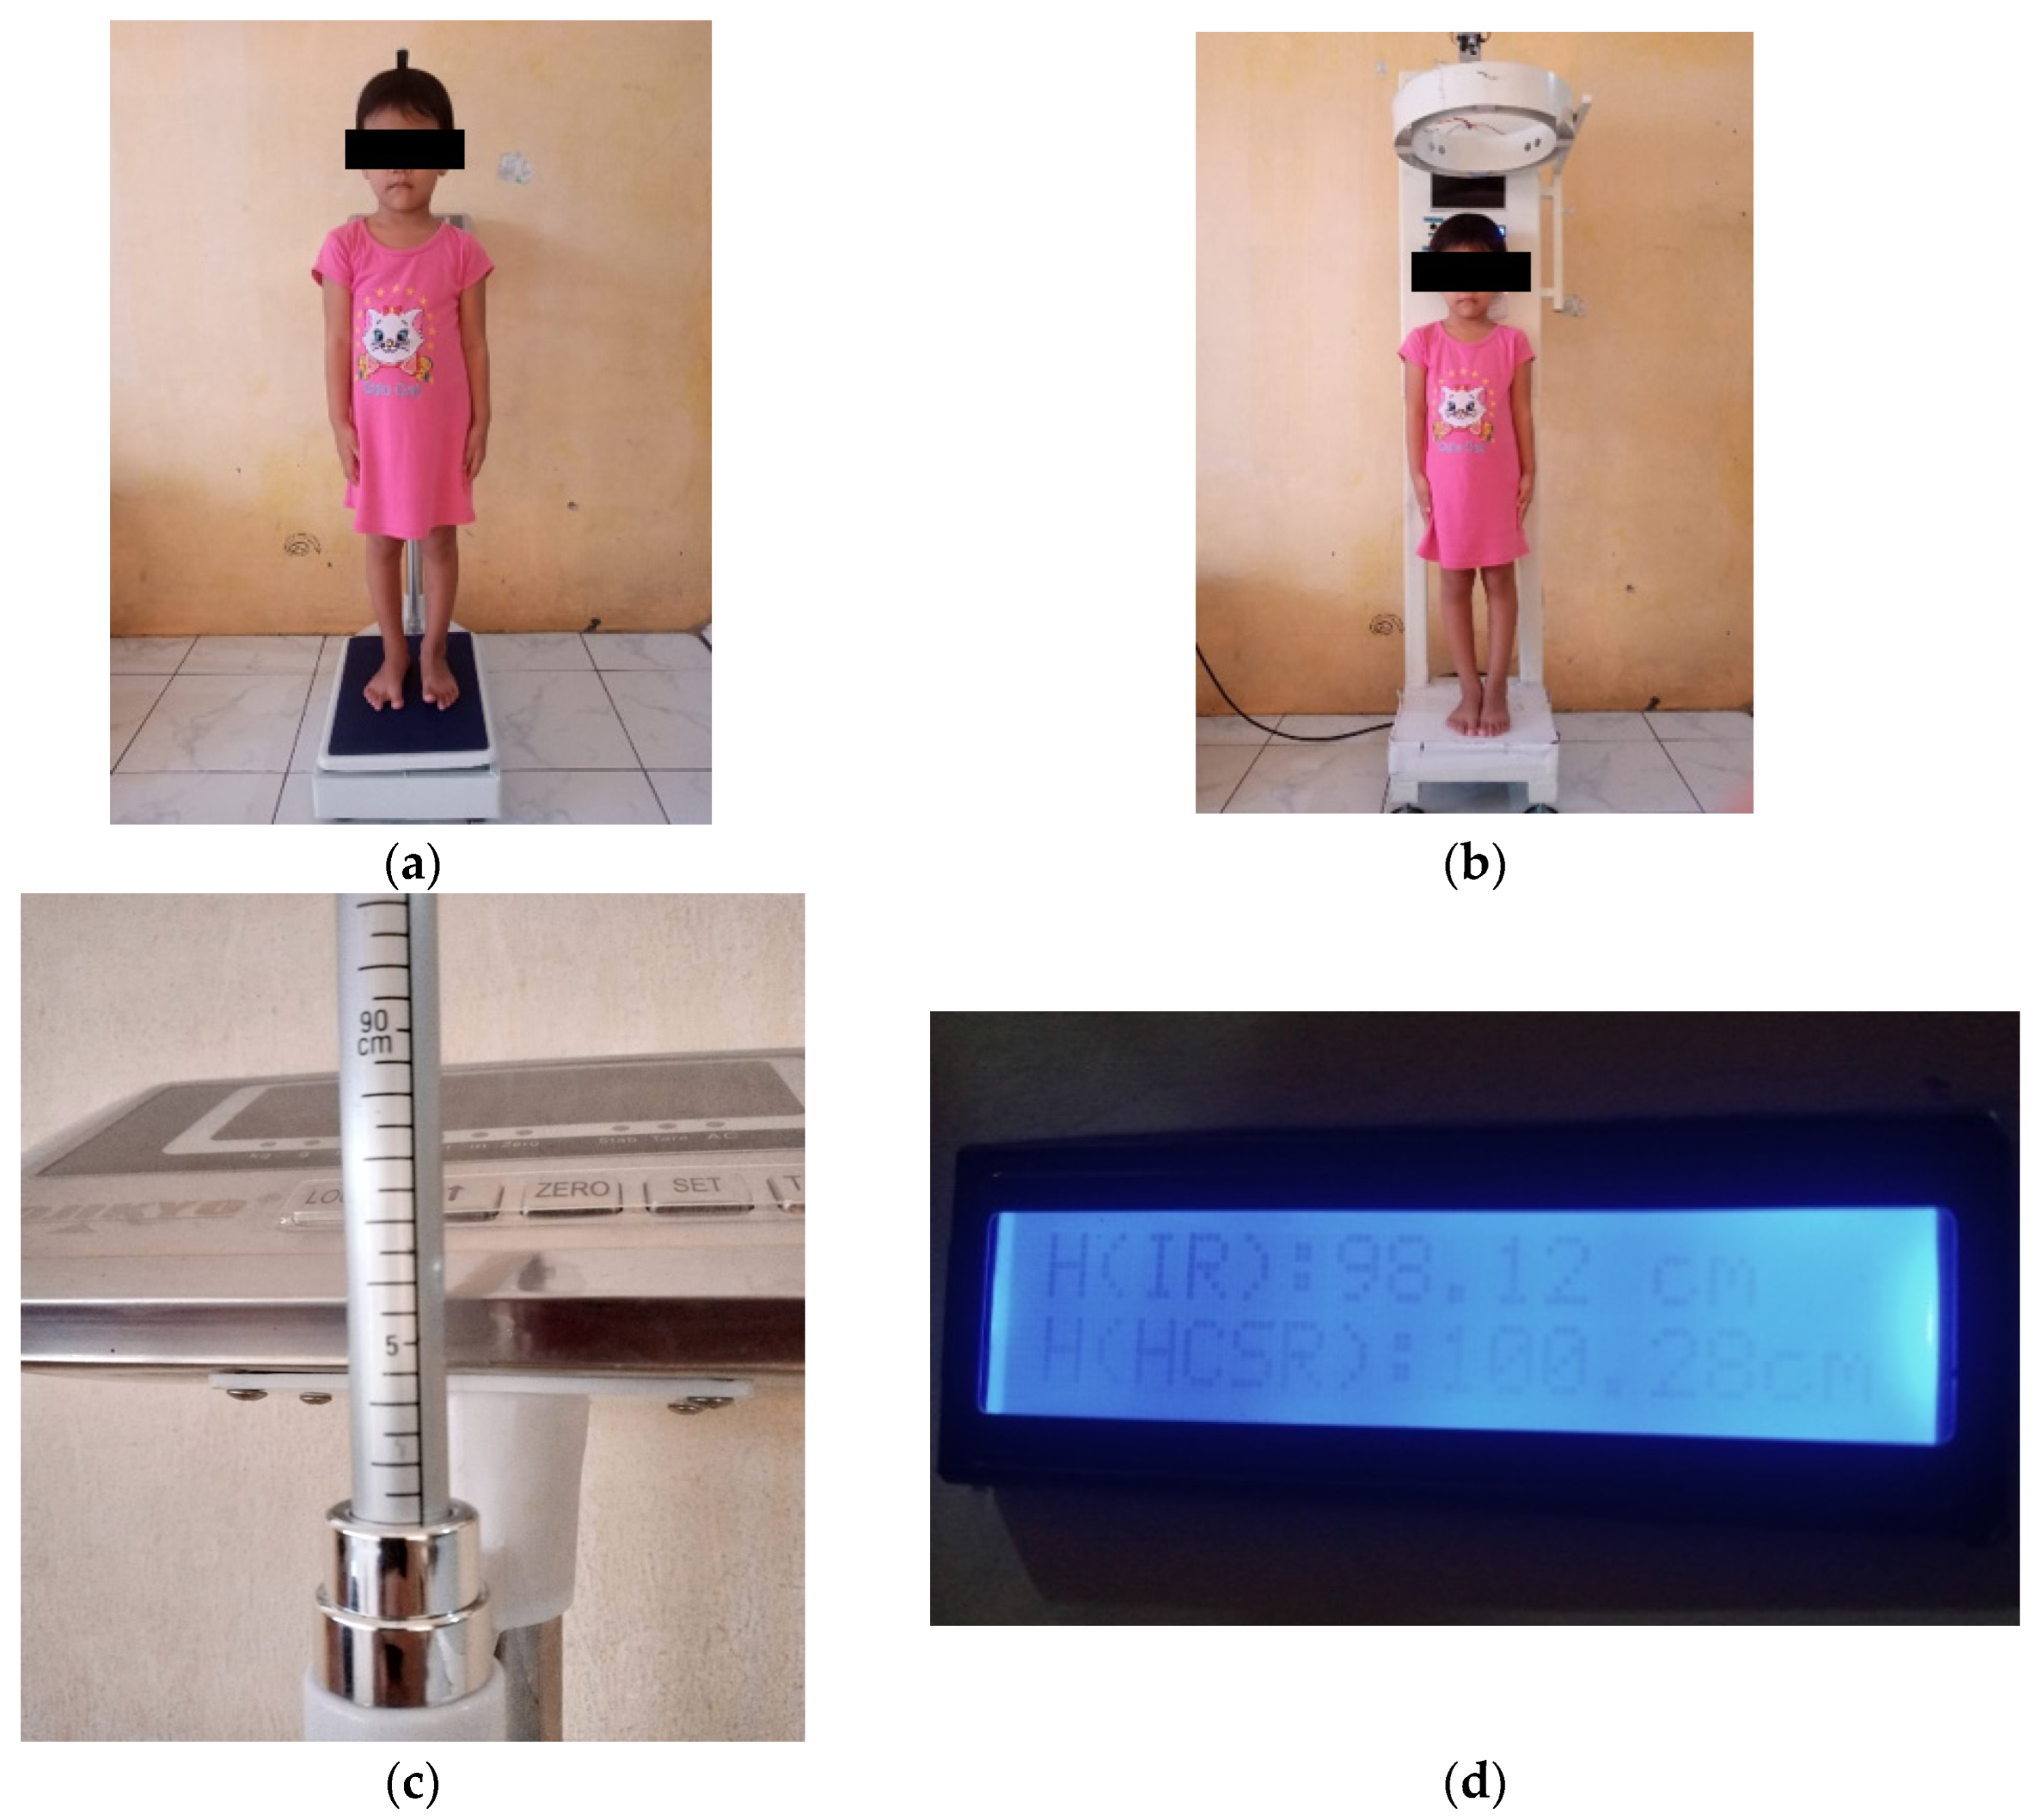
3.6.2. Height Measurement

Height measurement uses two sensors, the HC-SR04 sensor and the Sharp IR GP2Y0A2 sensor, which is performed to compare the performance of the two sensors. The output value read by the two sensors will be compared with a commercial device to obtain the error value. The measurement results are displayed on a 16 × 2 LCD and can be printed using a thermal printer as hard copy. In addition, the anthropometric system is also equipped with sound output. The results of the height measurement can be seen in Figure 12.
Based on the tests carried out in Table 3, the average error of height measurement using the sharp IR sensor GP2Y0A21 is 0.33%. Measurement of height using the sharp IR sensor GP2Y0A21 has an average error value of 2.19%.
Based on data from the test, it is found that the sharp IR sensor GP2Y0A21 has a smaller error than the HC-SR04 sensor. In addition, the sharp IR GP2Y0A21 sensor can detect objects faster because the IR beam communication is very safe and is not blocked by anything through the sensor’s line of sight.

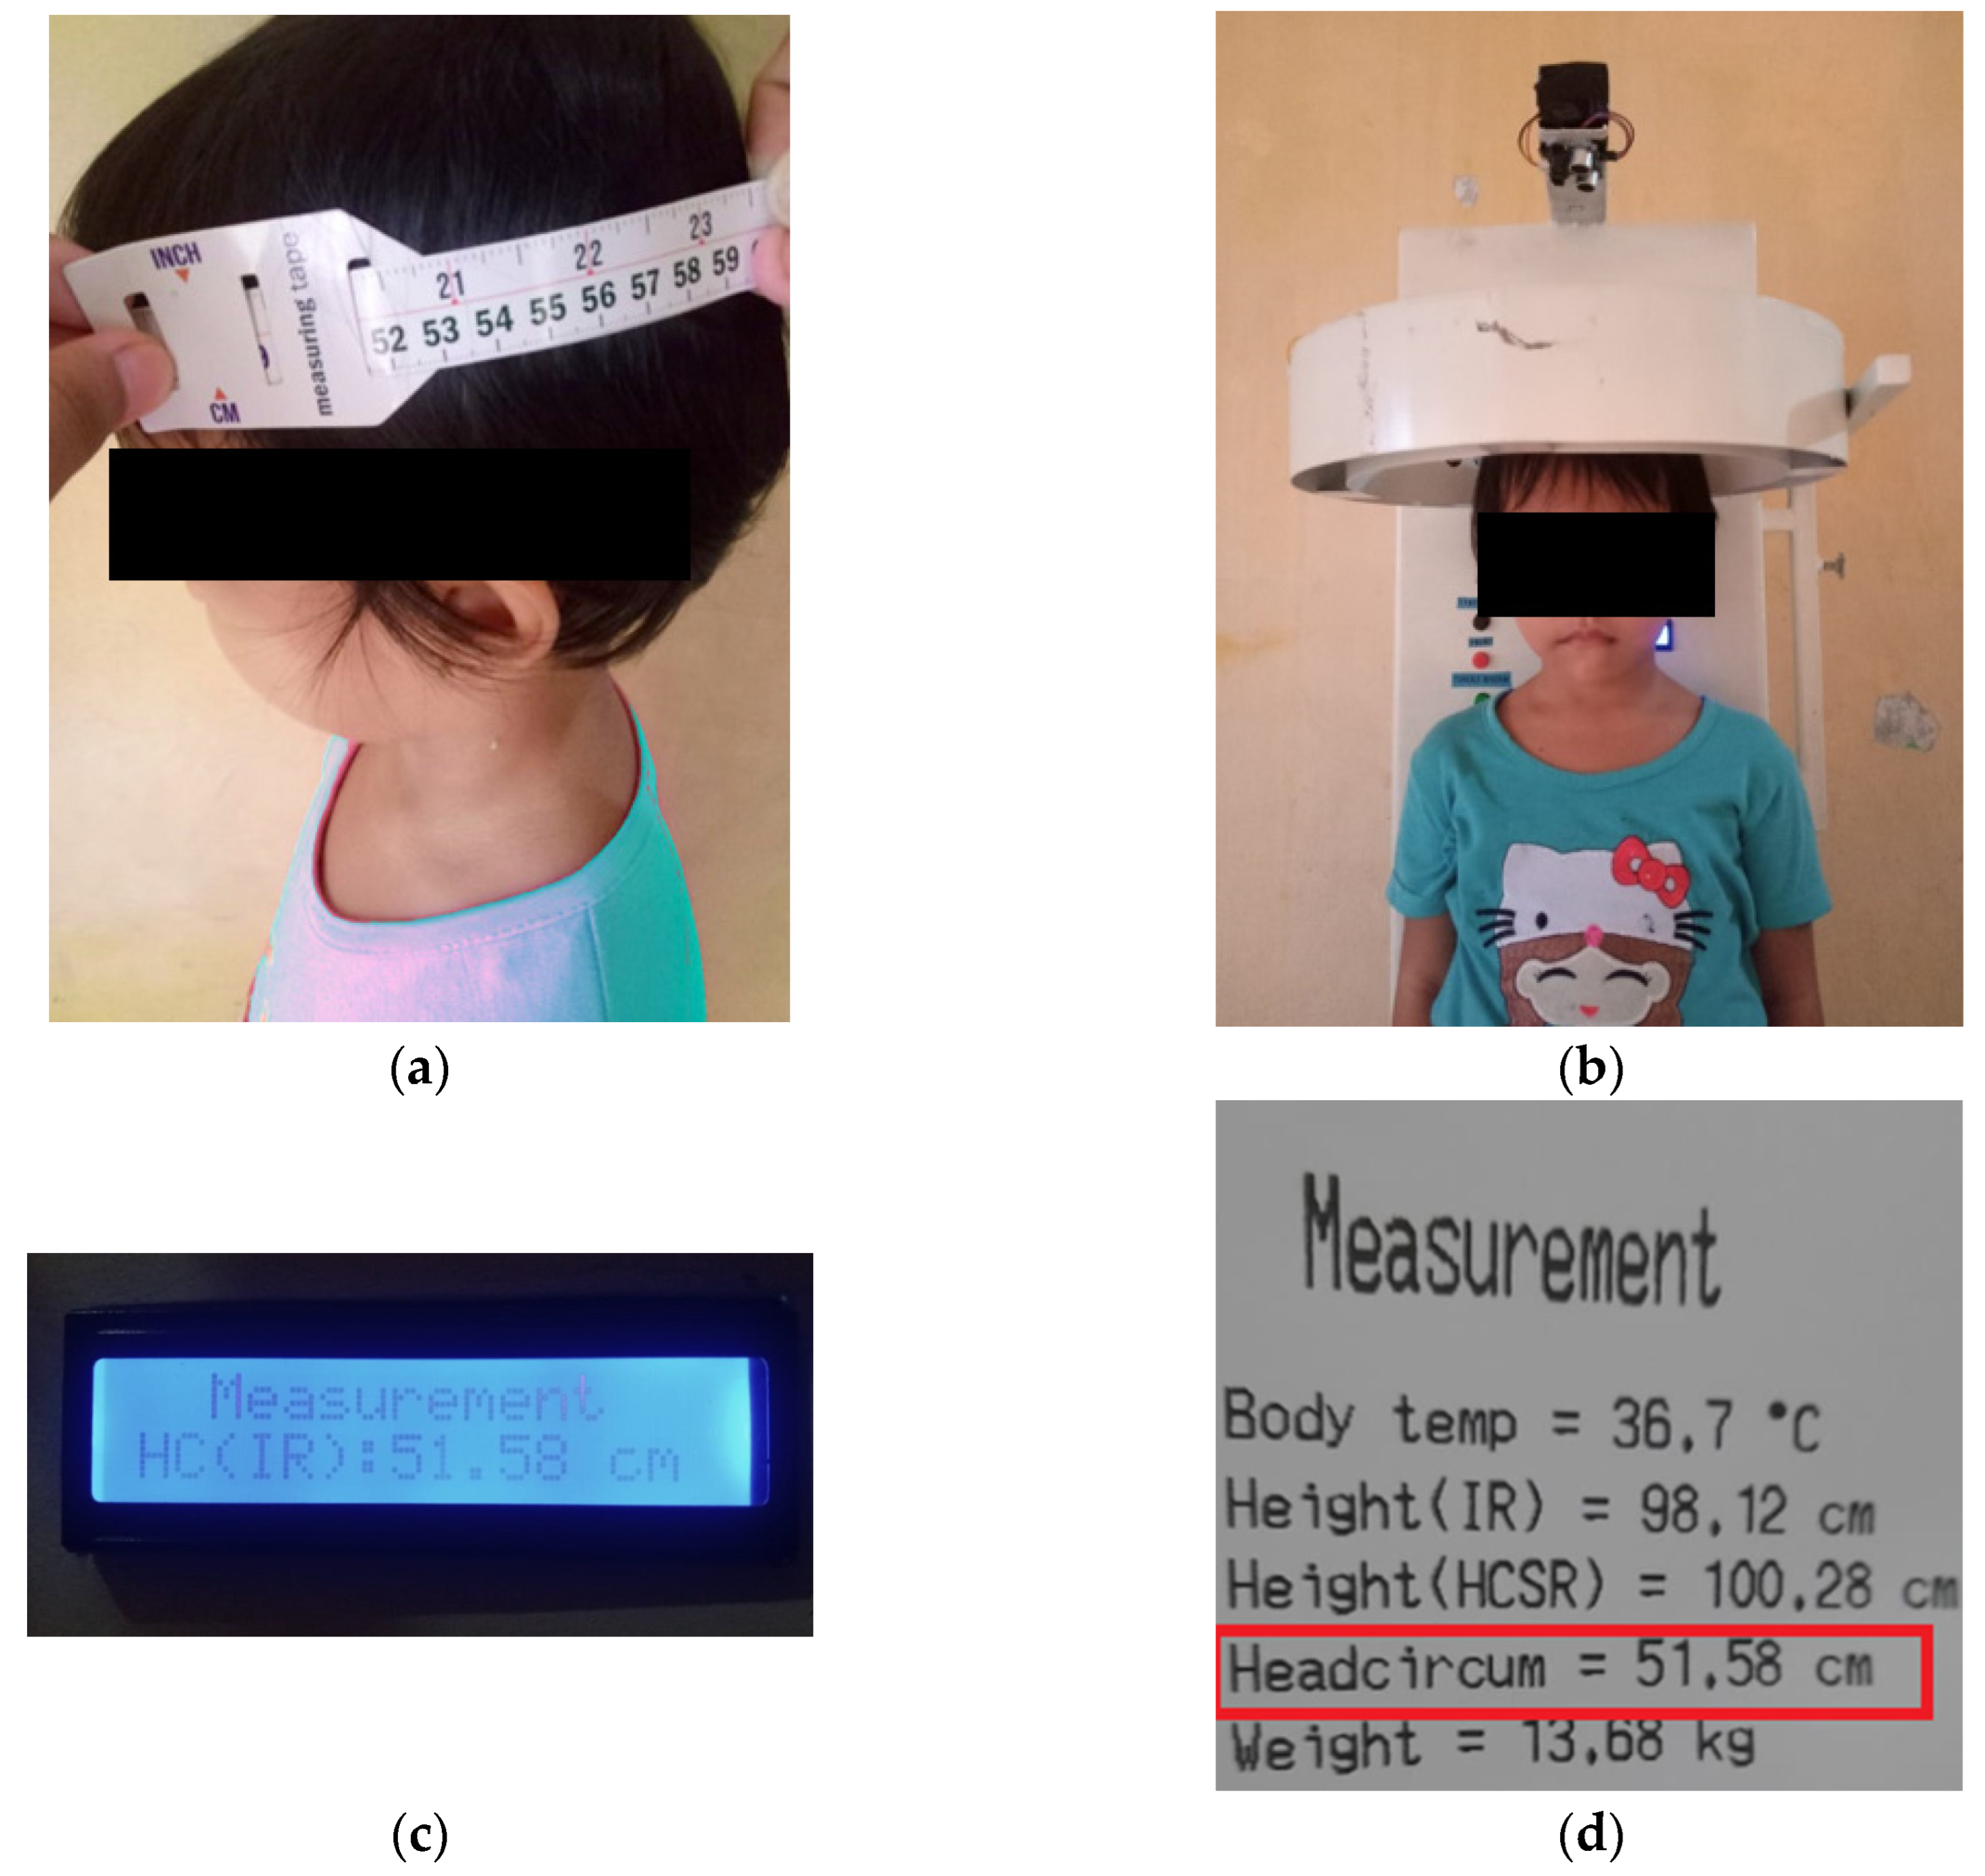
3.6.3. Head Circumference Measurement

The component for measuring head circumference is circle shaped with an outer circle diameter of 33 cm and an inner circle diameter of 27 cm. The four sensors are placed inside the outer circle (the space between the inner and outer circle) with positions on the front, right, left, and back sides. The measurement of head circumference is through the length of the distance between the sensor and the toddler’s head. The measured distance is then converted using the ellipse equation to approximate the head circumference. Finally, the output value read by the sensor will be compared with a commercial device so that the relative error can be obtained. The series of tests carried out can be seen in Figure 13 below.
The measurement results for the five participants were carried out using a measuring tape as a conventional tool and a prototype anthropometric, as shown in Table 4 below.
Based on the tests carried out, the error value in measuring head circumference using four sharp IR sensors GP2Y0A21 is 0.7%.

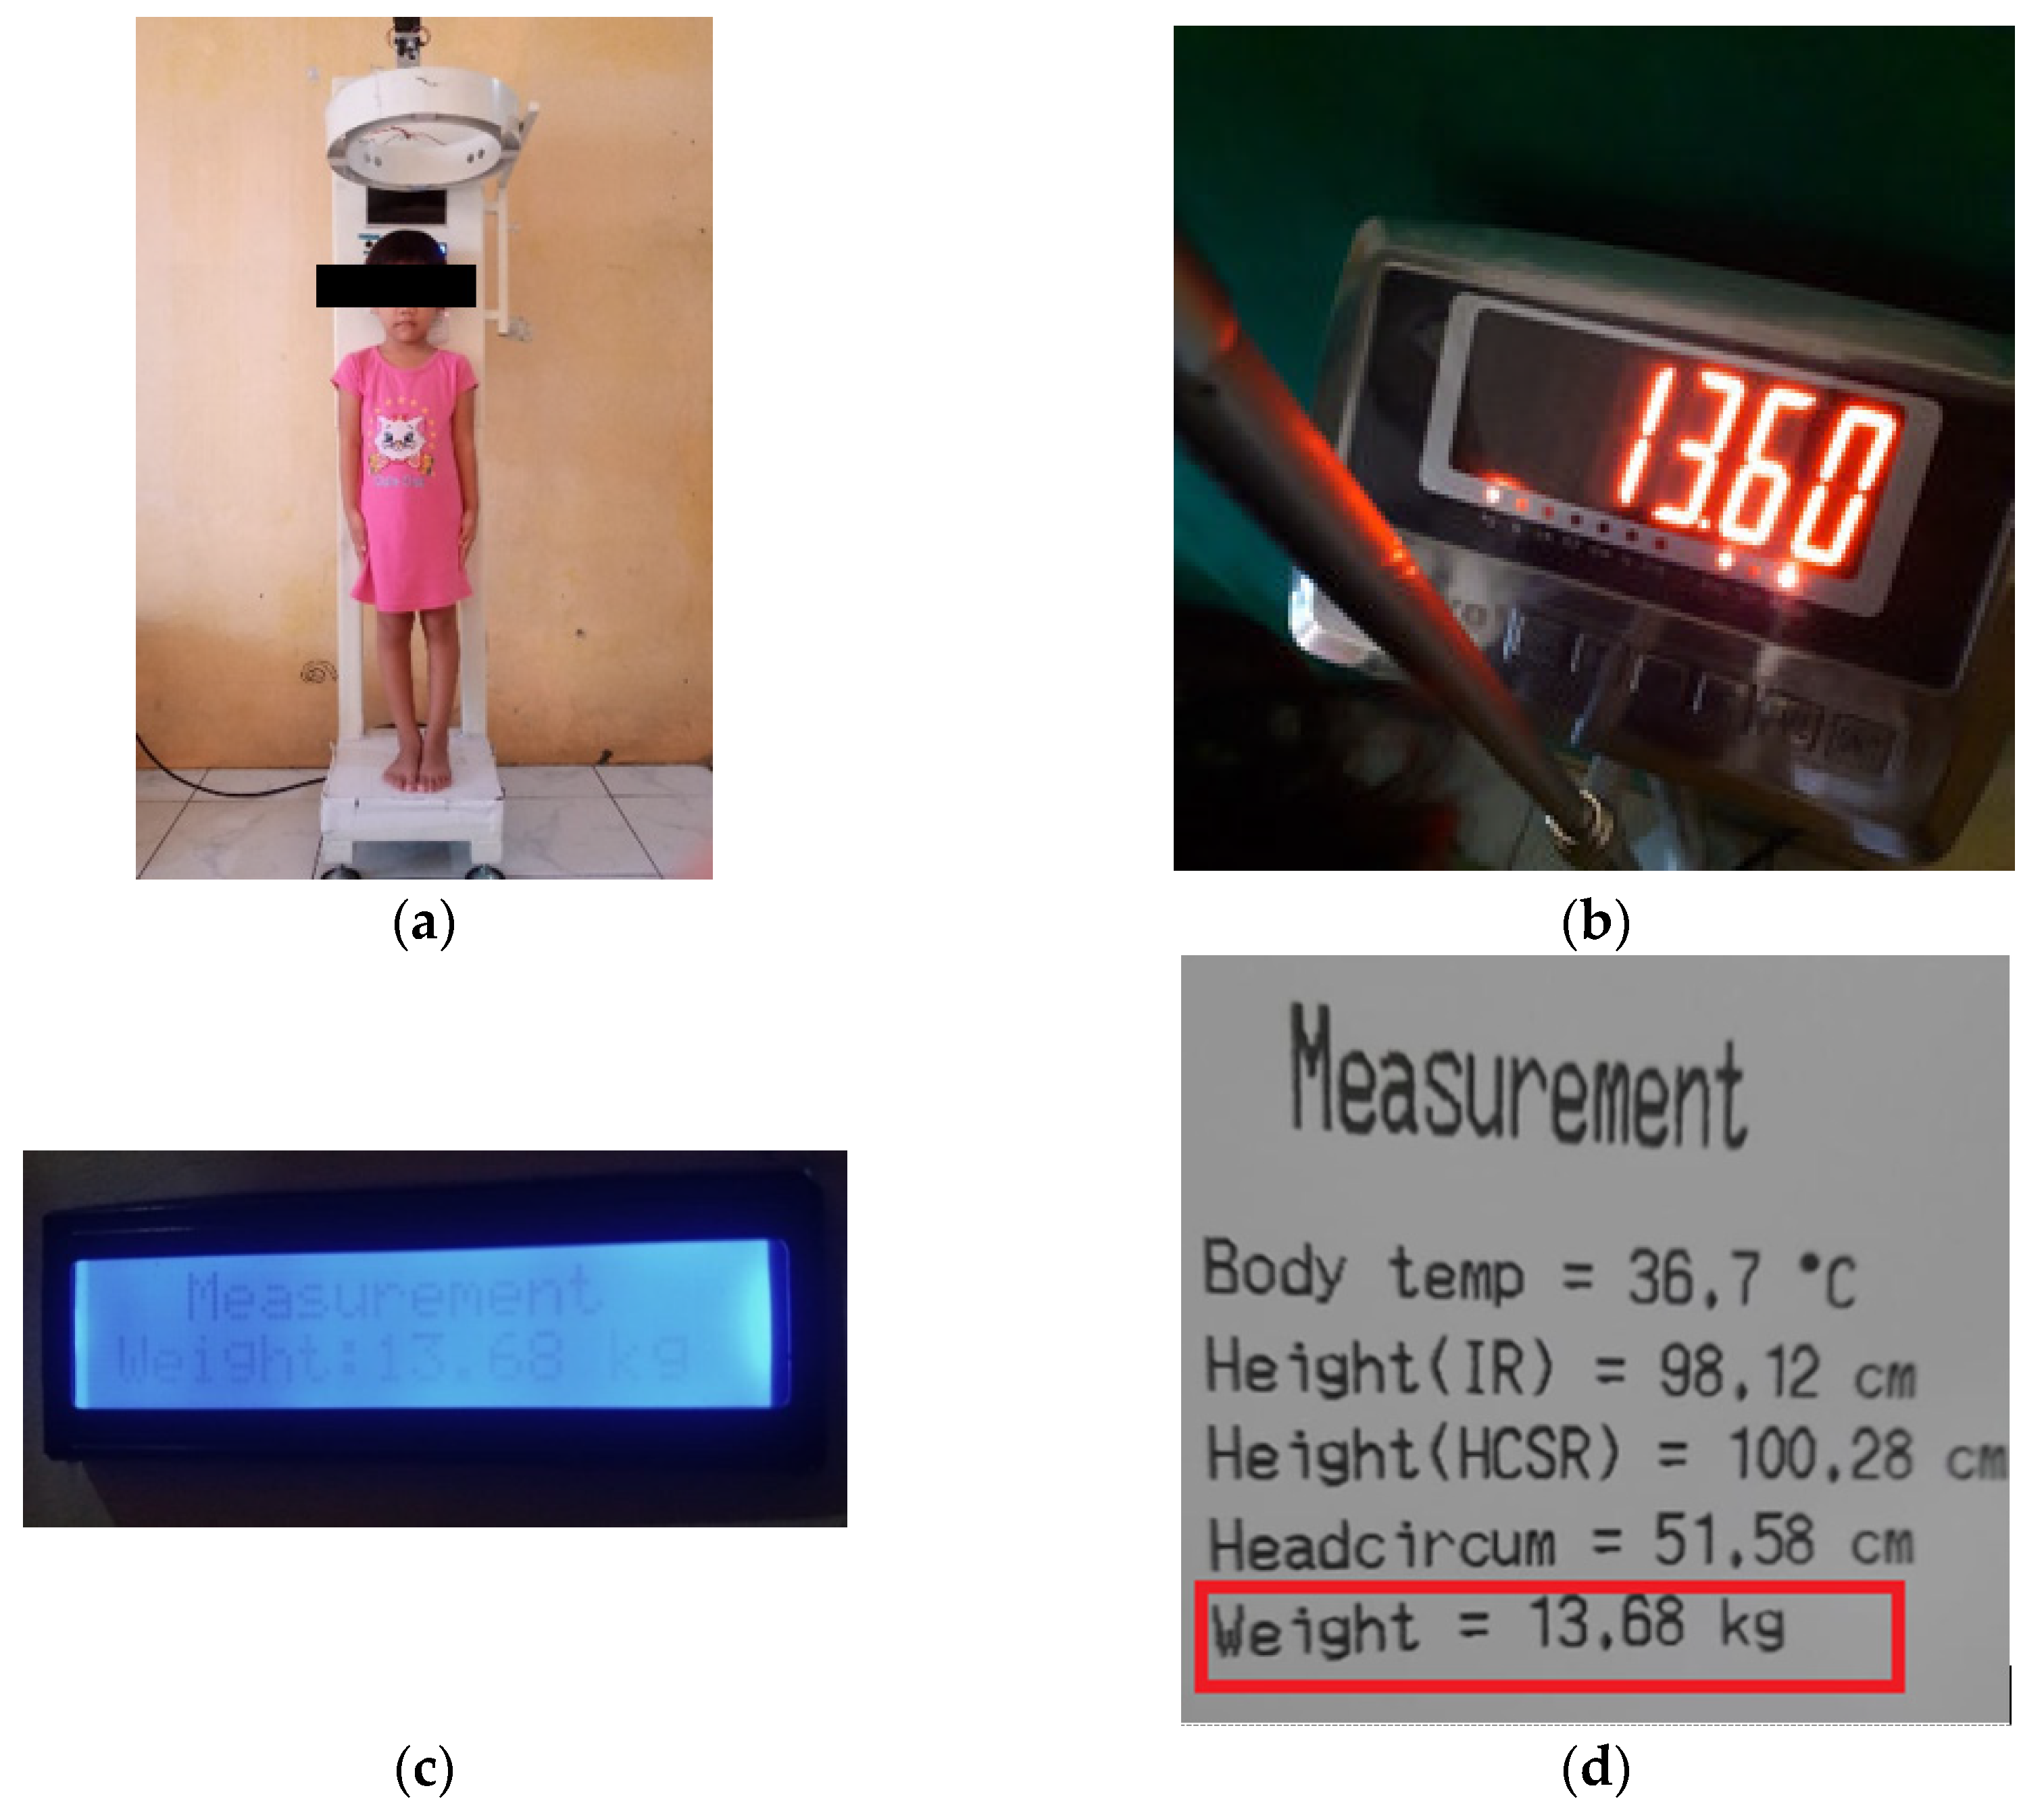
3.6.4. Body Mass Measurement

Body mass measurements were carried out using four, half-bridge load cell sensors. The four load cell sensors were placed at the optimum distance between the sensors, which is a distance of 11.7 cm. Figure 14 shows the tests performed for body mass measurement.
The results of measuring body mass using conventional tools and prototype of the anthropometric system are shown in Table 5. The average error in this test is 0.92%.

4. Discussion

Changes in body mass and height are essential parameters that indicate infants’ and children’s health and nutritional adequacy. This is closely related to the growth and development of children [27]. Among child growth disorders is stunting, where children are characterized by having shorter statures compared to other children their age. Children are stunted if their height–age index, which is indicated by their z-score, is below −2 SD. In the long term, stunting can affect children’s cognitive abilities and increase mortality and morbidity [28].
One of the steps required to prevent or detect stunting in children early is to regularly measure their mass and height, especially in the first five years of the child’s life. Generally, the measurement of children’s mass and height is performed simply using a scale and a stadiometer, where this method will inevitably involve physical contact between children and health workers. Several studies have reported various non-contact methods, including kinetic sensors, ultrasonic sensors, micro-Doppler radar, etc. The main limitation of non-contact body mass measurement is the main anatomic characteristics and the compartmental components. Ultrasonic sensors are cost-effective for measuring height despite variations in body shape [29].
In this study, the development of a non-contact anthropometric system that can be used for measuring body mass, height, and head circumference of children aged 1 to 5 years has been successfully carried out. This anthropometric system is equipped with a body temperature thermometer, thermal printer, and voice output to inform the measurement results. This anthropometric system is one of the innovations in non-contact anthropometry. Non-contact technology in medical devices plays an important role, especially in the era of the COVID-19 pandemic. Minimizing contact can minimize the risk of infection transmission during anthropometric measurements [30].

5. Conclusions

Based on the data and the analysis above, the anthropometric system for measuring body mass using a load cell sensor has high accuracy with an average error of ±0.92%. For height measurement, the average error is 0.33% for the IR sensor, whereas the ultrasonic sensor has an average error of 2.19%. For head circumference measurements using the configuration of four infrared sensors, the average error is 0.70%. The developed anthropometric system is also equipped with a body temperature thermometer using the MLX90614-DCI sensor, which has an average error of ±0.06%. Based on these results, we sure that the anthropometric system prototype can accurately measure the body mass, height, and head circumference of children under five in the Integrated Healthcare Center (Posyandu). Accurate measurement results can be used to determine the children under five’s nutritional status and detect stunting early. For further studies, it is necessary to conduct measurement trials with a more significant number of samples.

Author Contributions

Conceptualization, U.U.; methodology, U.U. and W.I., formal analysis, U.U. and W.I.; data collection and field work, A.F.D., U.U., W.I. and T.T.; writing—original draft preparation, U.U. and A.F.D.; writing—review and editing, U.U. and A.F.D., supervision, U.U. and W.I.; funding acquisition, U.U. and T.T. All authors have read and agreed to the published version of the manuscript.

Funding

The research was funded by Indonesian Directorate of Research and Community Service, Penelitian Terapan Unggulan Perguruan Tinggi, grant number: 3/PG.02.00.PT/LPPM/VI/2022.

Informed Consent Statement

Informed consent was obtained from all subjects involved in the study: informed parental concent was obtained from all the mothers.

Data Availability Statement

Data are available upon request from the corresponding due to ethical and privacy restriction.

Conflicts of Interest

The author declares no conflict of interest regarding this work.

References

  1. Titaley, C.R.; Ariawan, I.; Hapsari, D.; Muasyaroh, A.; Dibley, M.J. Determinants of the Stunting of Children Under Two Years Old in Indonesia: A Multilevel Analysis of the 2013 Indonesia Basic Health Survey. Nutrients 2019, 11, 1106. [Google Scholar] [CrossRef] [PubMed] [Green Version]
  2. Arora, A. Joint Child Malnutrition Estimates (UNICEF-WHO-The World Bank)—2021. Available online: https://data.unicef.org/resources/jme-report-2021/ (accessed on 6 October 2022).
  3. Akseer, N.; Kandru, G.; Keats, E.C.; Bhutta, Z.A. COVID-19 pandemic and mitigation strategies: Implications for maternal and child health and nutrition. Am. J. Clin. Nutr. 2020, 112, 251–256. [Google Scholar] [CrossRef] [PubMed]
  4. Roberton, T.; Carter, E.D.; Chou, V.B.; Stegmuller, A.R.; Jackson, B.D.; Tam, Y.; Sawadogo-Lewis, T.; Walker, N. Early estimates of the indirect effects of the COVID-19 pandemic on maternal and child mortality in low-income and middle-income countries: A modelling study. Lancet Glob. Health 2020, 8, e901–e908. [Google Scholar] [CrossRef]
  5. UNICEF: An Additional 6.7 Million Children under 5 Could Suffer from Wasting This Year due to COVID-19. Available online: https://www.unicef.org/press-releases/unicef-additional-67-million-children-under-5-could-suffer-wasting-year-due-covid-19 (accessed on 16 February 2022).
  6. Efrizal, W. Berdampakkah Pandemi COVID-19 terhadap Stunting di Bangka Belitung? J. Kebijak. Kesehat. Indones. JKKI 2020, 9, 154–157. [Google Scholar] [CrossRef]
  7. Widiastuti, A.; Winarso, S.P. Program Pmt Dan Grafik Pertumbuhan Balita Pada Masa Pandemi Covid. J. Sains Kebidanan 2021, 3, 30–35. [Google Scholar] [CrossRef]
  8. Minetto, M.A.; Pietrobelli, A.; Busso, C.; Bennett, J.P.; Ferraris, A.; Shepherd, J.A.; Heymsfield, S.B. Digital Anthropometry for Body Circumference Measurements: European Phenotypic Variations throughout the Decades. J. Pers. Med. 2022, 12, 906. [Google Scholar] [CrossRef]
  9. Fryar, C.D.; Gu, Q.; Ogden, C.L.; Flegal, K.M. Anthropometric Reference Data for Children and Adults: United States, 2011–2014. Vital Health Stat. 3 Anal. Stud. 2016, 39, 1–46. [Google Scholar]
  10. Casadei, K.; Kiel, J. Anthropometric Measurement. In StatPearls; StatPearls Publishing: Treasure Island, FL, USA, 2022; Available online: http://www.ncbi.nlm.nih.gov/books/NBK537315/ (accessed on 12 September 2022).
  11. WHO Child Growth Standards: Length/Height-for-Age, Weight-for-Age, Weight-for-Length, Weight-for-Height and Body Mass Index-for-Age: Methods and Development. Available online: https://www.who.int/publications-detail-redirect/924154693X (accessed on 6 October 2022).
  12. Jamil, A.; Herodian, S.; Saulia, L. RGB-D sensor application for static anthropometry measurement. IOP Conf. Ser. Earth Environ. Sci. 2020, 542, 012036. [Google Scholar] [CrossRef]
  13. Umiatin; Erlandita, S.M.; Indrasari, W. Design baby mass and height monitoring system based on Arduino and Android application. AIP Conf. Proc. 2019, 2169, 030013. [Google Scholar] [CrossRef]
  14. Erinle, T.J.; Oladebeye, D.H.; Ademiloye, I.B. Parametric Design of Height and Weight Measuring System. Syst. Des. Mach. Des. 2020, 8, 13. [Google Scholar] [CrossRef]
  15. Aarthi, M.A. Automatic Human Height Detector—A Review. Int. J. Res. Appl. Sci. Eng. Technol. 2021, 9, 846. [Google Scholar]
  16. Ye, Y.; Zhang, C.; He, C.; Wang, X.; Huang, J.; Deng, J. A Review on Applications of Capacitive Displacement Sensing for Capacitive Proximity Sensor. IEEE Access 2020, 8, 45325–45342. [Google Scholar] [CrossRef]
  17. Moheimani, R.; Hosseini, P.; Mohammadi, S.; Dalir, H. Recent Advances on Capacitive Proximity Sensors: From Design and Materials to Creative Applications. C 2022, 8, 26. [Google Scholar] [CrossRef]
  18. Zhmud, V.A.; Kondratiev, N.O.; Kuznetsov, K.A.; Trubin, V.G.; Dimitrov, L.V. Application of ultrasonic sensor for measuring distances in robotics. J. Phys. Conf. Ser. 2018, 1015, 032189. [Google Scholar] [CrossRef] [Green Version]
  19. Rukshna, R.A.; Anusha, S.; Bhuvaneswarri, E.; Devashena, T. Interfacing of Proximity Sensor With My-RIO Toolkit Using LabVIEW. Int. J. Sci. Res. Dev. 2015, 3, 562–566. [Google Scholar]
  20. Albances, X.; Binungcal, D.; Nikko Cabula, J.; Cajayon, C.; Cabatuan, M. RGB-D Camera Based Anthropometric Measuring System for Barong Tagalog Tailoring. In Proceedings of the 2019 IEEE 11th International Conference on Humanoid, Nanotechnology, Information Technology, Communication and Control, Environment, and Management (HNICEM), Laoag, Philippines, 29 November–1 December 2019; pp. 1–6. [Google Scholar]
  21. Martono, K.T.; Nurhayati, O.D.; Indrasto, E.Y.; Adhy, S. Design and build a head circumference measurement system for toddlers. J. Phys. Conf. Ser. 2021, 1858, 012031. [Google Scholar] [CrossRef]
  22. Beaumont, C.A.A.; Knoops, P.G.M.; Borghi, A.; Jeelani, N.U.O.; Koudstaal, M.J.; Schievano, S.; Dunaway, D.J.; Rodriguez-Florez, N. Three-dimensional surface scanners compared with standard anthropometric measurements for head shape. J. Cranio-Maxillofac. Surg. 2017, 45, 921–927. [Google Scholar] [CrossRef]
  23. Martini, M.; Klausing, A.; Lüchters, G.; Heim, N.; Messing-Jünger, M. Head circumference—A useful single parameter for skull volume development in cranial growth analysis? Head Face Med. 2018, 14, 3. [Google Scholar] [CrossRef] [Green Version]
  24. Leah, L.; Gupta, K.; Wagio, P. Enhancing Performance of Low-Cost Sensors Using an Infant Care Usecase. IT J. Res. Dev. 2022, 7, 111–123. [Google Scholar] [CrossRef]
  25. Pratama, F.S.; Muslim, I.; Zul, M.I. Digitalization of Human Head Anthropometry Measurement Using Pixels Measurement Method. Int. J. Inf. Technol. Electr. Eng. 2019, 2, 63–70. [Google Scholar] [CrossRef] [Green Version]
  26. PMK_No__2_Th_2020_ttg_Standar_Antropometri_Anak.pdf. Available online: http://hukor.kemkes.go.id/uploads/produk_hukum/PMK_No__2_Th_2020_ttg_Standar_Antropometri_Anak.pdf (accessed on 8 October 2022).
  27. Guideline: Assessing and Managing Children at Primary Health-Care Facilities to Prevent Overweight and Obesity in the Context of the Double Burden of Malnutrition. Available online: https://www.who.int/publications-detail-redirect/9789241550123 (accessed on 15 September 2022).
  28. Kassie, G.W.; Workie, D.L. Exploring the association of anthropometric indicators for under-five children in Ethiopia. BMC Public Health 2019, 19, 764. [Google Scholar] [CrossRef] [PubMed] [Green Version]
  29. Ly, M.H.; Khang, N.M.; Nhi, T.T.; Dang, T.T.; Dinh, A. A Non-contact Human Body Height and Weight Measurement Approach Using Ultrasonic Sensor. In Proceedings of the 7th International Conference on the Development of Biomedical Engineering in Vietnam (BME7), Ho Chi Minh, Vietnam, 27–29 June 2018; Springer: Singapore, 2020; pp. 31–37. [Google Scholar]
  30. Kim, J.; Lee, W.H.; Kim, S.H.; Na, J.Y.; Lim, Y.-H.; Cho, S.H.; Cho, S.H.; Park, H.-K. Preclinical trial of noncontact anthropometric measurement using IR-UWB radar. Sci. Rep. 2022, 12, 8174. [Google Scholar] [CrossRef] [PubMed]
Figure 1. The block diagram of the anthropometric system is consisted of the input components, namely the ultrasonic sensor HC-SR04, the half-bridge type load cell sensor, the temperature sensor, a microcontroller component, the Arduino Mega 2560, and the output component consists of an LCD to display measurement data.
Jsan 11 00069 g001
Figure 2. Control box of the anthropometric system and its components including push button. LCD 16 × 2, LCD 7 inch, seven segment display, temperature sensor, and thermal printer.
Jsan 11 00069 g002
Figure 3. Load cell sensor communication circuit and HX711 module with Arduino.
Jsan 11 00069 g003
Figure 4. The graph of transfer function illustrates a comparison between the output of the load cell sensor and the commercial scale (floor scale). The slope value of 0.9987 means that the load cell sensor has high sensitivity, so the sensor output is proportional to the digital scale output.
Jsan 11 00069 g004
Figure 5. Sensor placement at: (a) 3.9 cm distance; (b) 7.8 cm distance; (c) 11.7 cm distance; (d) 15.6 cm distance; and (e) 19.5 cm distance.
Jsan 11 00069 g005
Figure 6. Load cell sensor distance optimization graph. The position of the sensor with the small percentage of error (%) is at a distance of 11.7 cm, which is 0.31%.
Jsan 11 00069 g006
Figure 7. (a) HC-SR04 sensor transfer function for height measurement. The slope value on the graph indicates that the sensor has a sensitivity value of 0.991; and (b) HC-SR04 sensor invers function for height measurement.
Jsan 11 00069 g007
Figure 8. Graph of the Sharp IR GP2Y0A21 sensor’s working range shows that the sensor can read distances in the range of 10 cm to 100 cm. However, the sensor is saturated when reading the distance beginning from 100 cm and further, where the sensor cannot read the distance accurately.
Jsan 11 00069 g008
Figure 9. Minimum distance graph using four sharp IR sensors GP2Y0A21 for head circumference.
Jsan 11 00069 g009
Figure 10. Transfer function graph of MLX90614-DCI Sensor.
Jsan 11 00069 g010
Figure 11. Body temperature measurement on: (a) Commercial Device; and (b) MLX90614-DCI Sensor.
Jsan 11 00069 g011
Figure 12. Height measurement (a) using a stadiometer; (b) using sensor HCSR-04 and IR GP2Y0A2; (c) scale on the stadiometer; and (d) display of height measurement on LCD 6 × 2.
Jsan 11 00069 g012
Figure 13. Head circumference measurement tests (a) using the commercial device; (b) using anthropometric prototype; (c) display of height measurement on LCD 6 × 2; and (d) printer output.
Jsan 11 00069 g013
Figure 14. Body mass measurement test: (a) using the commercial device; (b) using anthropometric prototype; (c) display of body mass measurement on the LCD 6 × 2; and (d) printer output.
Jsan 11 00069 g014
Table 1. Comparison of temperature measurements using a thermogun and MLX90614-DCI sensor.
ObjectThermogun (°C)Sensor MLX90614DCI (°C)
Cheek35.835.92
Palm36.436.50
37 °C Water37.237.28
38 °C Water38.538.57
39 °C Water39.139.22
40 °C Water40.340.43
Table 2. Results of body temperature measurement using conventional tools and prototype of anthropometric system.
Participant NoAge (Years)SexTemperature (°C/Mean ± SD)
ConventionalPrototypeError (%)
14Female36.3 ± 036.3 ± 00.08
25Female36.5 ± 035.5 ± 00.08
34Male36.5 ± 036.5 ± 0.010.03
45Male36.6 ± 036.6 ± 00.03
53Female36.1 ± 036.1 ± 0.030.08
Average error0.06
Table 3. Comparison of height measurement results using conventional tools (a stadiometer), ultrasonic sensors (US) and infrared sensors (IR).
Participant NoAge (Years)Sex Body Height (Cm/Mean ± SD)
ConventionalPrototype (US)Prototype (IR)Error (US/%)Error (IR/%)
153Female98 ± 0100.0 ± 1.9498.3 ± 0.012.070.29
25Female117.5 ± 0118.8 ± 0117.7 ± 0.011.130.16
34Male108 ± 0111.0 ± 2.25108.2 ± 02.790.15
45Male113.5 ± 0114.9 ± 4.98113.7 ± 01.310.15
53Female8689.1 ± 0.1286.8 ± 0.113.640.91
Average error2.190.33
Table 4. Comparison between head circumference measurement results using conventional tools (measuring tape) and a prototype (IR sensor).
Participant NoAge (Years)SexHead Circumference (Cm/Mean ± SD)
ConventionalPrototypeError (%)
14Female49.0 ± 049.4 ± 0.030.71
25Female52.5 ± 052.9 ± 0.010.91
34Male54.0 ± 054.2 ± 00.44
45Male55.0 ± 054.3 ± 00.51
53Female48.0 ± 048.4 ± 0.020.92
Average error0.70
Table 5. Comparison between body mass measurement results using conventional tools (floor scale) and a prototype of an anthropometric system.
Participant NoAge (Years)SexBody Mass (Kg/Mean ± SD)
ConventionalPrototypeError (%)
14Female13.5 ± 013.6 ± 0.040.59
25Female18.4 ± 018.4 ± 0.060.33
34Male21.1 ± 021.4 ± 0.231.37
45Male16.5 ± 016.6 ± 00.48
53Female11.1 ± 011.3 ± 0.031.81
Average error0.92
Publisher’s Note: MDPI stays neutral with regard to jurisdictional claims in published maps and institutional affiliations.

