Review

The Definitive Guide to Actual Sensor Network Deployments in Research Studies from 2013–2017: A Systematic Review

Institute of Electronics and Computer Science, 14 Dzerbenes St., LV-1006 Riga, Latvia
*
Author to whom correspondence should be addressed.
These authors contributed equally to this work.
J. Sens. Actuator Netw. 2022, 11(4), 68; https://doi.org/10.3390/jsan11040068
Submission received: 12 August 2022 / Revised: 27 September 2022 / Accepted: 12 October 2022 / Published: 21 October 2022
(This article belongs to the Special Issue Journal of Sensor and Actuator Networks: 10th Year Anniversary)

Abstract

:
The research community has been working on sensor networks for more that seven decades and altogether more than a million research articles on sensor networks have been published, with this number growing every day. In this article, we try to provide a thorough and complete systematic review on the sensor network field resulting from representative subset of more than 3000 articles which include actual sensor network deployments. After a thorough analysis of these data, we provide a definitive overview of the trends in sensor network deployment described in published research articles.

1. Introduction

The research community has been working on sensor networks for more that seven decades [1]. The research output related to sensor networks really took off in the 1980s when DARPA started its distributed sensor network program [2], and now, with the advent of Wireless Sensor Networks (WSN) and Internet of Things (IoT), more than a million research articles on sensor networks have been published, with this number growing every day.
This scale leads to the problem that it is practically impossible for new researchers targeting the field of sensor networks to grasp the big picture overview of the existing state of the art and application fields. Existing sensor network-related reviews either focus on specific sub-fields (e.g., oceanographic monitoring [3]), or cover a relatively insignificant number of existing articles (usually less than 100). This problem leads to redundant research as well as an obscured path to the future of sensor network development.
To remedy this, in this work, we try to provide a thorough and complete systematic review on the sensor network field. As reading more than a million articles would be practically impossible, we settled on the narrower, but in our view, very representative, subset of articles which include actual sensor network deployments. The reason being that in such a long time scale, most sensor network-related research ideas with merit will have matured enough to be validated in an actual experiment, whether in real world scenarios, or at least a laboratory setup.
An important question we wanted to answer is what kind of actual deployed sensor networks are researchers working on and how does this trend change with time, especially now, while moving into the IoT era [4,5]. To provide a representative time scale, we selected five full years of research publications, which at the time of this research, had at leas one full year to be indexed in scientific databases (avoiding potential biases due to different indexing speeds for different sources). As the articles were sampled in June 2018, the period of this systematic review is set from the year 2013 to the year 2017, spanning a full 5 years of scientific literature in total.
Initially, 15,010 potentially relevant articles were identified in the SCOPUS and Web of Science databases, from which finally, 3017 articles containing 3059 unique sensor network deployments were extracted. From these deployments, relevant metadata, including field of application, communication type and scale of deployment, were extracted manually. Finally, this data set was thoroughly validated, cleaned and published as an open data set together with a detailed data descriptor [6] at the end of the year 2020.
Finally, we thoroughly analyzed the trends in these data, to provide the definitive overview of the trends in sensor network deployment described in published research. The knowledge gained from this systematic review can hopefully be used as the practical and theoretical basis, which will foster future research studies in the sensor network domain. By understanding the statistics of actual sensor network deployments, we aim to develop tools to support and encourage the evaluation and validation of sensor network research with actual deployments leading to increased quality of research and hope to provide a clear high-level outlook for future research related to sensor networks.
The rest of this article is structured as follows—Section 2 describes the methodology of the systematic review, Section 3 provides the results—first analyzing each individual metadata dimension and afterwards cross-examining the interactions between these dimensions, and finally, Section 4 summarizes and concludes this systematic review.

2. Materials and Methods

This systematic review was executed in two stages: (1) data acquisition and extraction of metadata (consisting of candidate article identification, exclusion or screening, selection of eligible articles and finally extracting deployment metadata from the included articles) and (2) data analysis. For the overall flowchart of the systematic review, see Figure 1.
The results of the first stage are published together with the final data set as a data descriptor [6] and contain an in-depth data acquisition methodology and metadata field descriptions. We suggest interested readers refer to the published data descriptor for in-depth details, including a detailed timeline of the data acquisition process, while we provide a short excerpt of the steps taken here:
  • First, the scope of the systematic review was defined as follows: original publications (no review articles) in English language, indexed by either SCOPUS or Web of Science, describing a physical deployment of a sensor network (at least two devices), published between the years 2013 and 2017 inclusive;
  • Queries for both selected databases were built as follows:
    • SCOPUS: KEY (sensor network OR sensor networks) AND TITLE-ABS-KEY (test* OR experiment* OR deploy*) AND NOT TITLE-ABS-KEY (review) AND NOT TITLE-ABS-KEY (simulat*) AND (LIMIT-TO (PUBYEAR, 2017) OR LIMIT-TO (PUBYEAR, 2016) OR LIMIT-TO (PUBYEAR, 2015) OR LIMIT-TO (PUBYEAR, 2014) OR LIMIT-TO (PUBYEAR, 2013));
    • Web of Science: TS = (“sensor network” OR “sensor networks”) AND TS = (test* OR experiment* OR deploy*) NOT TI =“review” NOT TS = simulat* with additional parameters: Indexes = SCI-EXPANDED, SSCI, A&HCI, CPCI-S, CPCI-SSH, BKCI-S, BKCI-SSH, ESCI, CCR-EXPANDED, IC Timespan = 2013–2017;
  • These queries were executed on 18 June 2018, and a total of 21,740 articles were found, of which 6730 duplicates were removed, leaving 15,010 identified candidate articles;
  • These articles were screened for exclusion based on titles and abstracts allowing 10,095 articles to be excluded and leaving 4915 articles;
  • Then, full text analysis for eligibility was done on these articles, leading to exclusion of additional 1898 articles;
  • This resulted in 3017 articles included in the review, which matched the defined scope;
  • Following a thorough validation of identified articles, 15 more articles were identified as mistakenly included, leaving the final included number to 3002 articles;
  • From these articles, the team codified all unique sensor network deployments with their related metadata, resulting in the final number of 3059 identified sensor network deployments for which metadata were extracted.
The extracted metadata from these deployments was codified in two main groups:
  • Details on the actual sensor network deployment described in the article; and,
  • If it exists—the goal deployment towards which this research is aimed in the future (1825 deployments of 3059 identified).
The extracted metadata was analyzed and descriptive statistics are reported in the Results section. In the results section first specific metadata dimensions are described and afterwards significant interactions between multiple dimensions are described.

3. Results and Discussion

From all the sensor network deployment-related research published in the 5 consecutive years from 2013 to 2017, a total of 3059 wireless sensor network deployments matched the criteria of this study. From these deployment descriptions data related to these deployments was extracted. In the sections below, we will first introduce the most descriptive results from the originally extracted metrics, which are laid out in detail in the published data descriptor [6], while discussing noteworthy results in more detail (Section 3.1). Afterwards, in Section 3.2, we analyze patterns in these data while comparing multiple data dimensions, thus providing a more complex analysis of results, that could lead to more in-depth research in the future.

3.1. Originally Extracted Metrics

We start by introducing the raw results obtained from the systematic review while discussing the patterns visible in the data when looking at a single metric.

3.1.1. Years

The data show that sensor networks remain equally relevant throughout the 5-year timespan of the review. Table 1 shows how many actual sensor network deployments were described in a publication from 2013 to 2017. In this time, the biggest difference in the number of deployments was only 0.85% (26), showing that the field is relatively mature—not growing, but also not declining, with a stable number of research papers describing innovative deployments.
One of the possible ways to check the actual state of some technology is the Gartner hype cycle graph. If we take into account the before-mentioned more that seven decades of sensor network era and our selected period of five years, then deployment distribution by years allows us to conclude that these five years match the phase #5—Plateau of Productivity. Nevertheless, there is an additional aspect. Instead of traditional communication based on optical, acoustical or radio waves, in specific cases, there are new attempts, for example, the human body as medium for wearable sensors. Therefore, new technology breakthroughs can be responsible for restarting the sensor network hype cycle on a new level.

3.1.2. Technology Readiness Levels

The distribution of these deployments among different technology readiness levels (TRL’s) is presented in Figure 2. A consequence of the original research question is that there are no deployments related to TRL levels 1 and 2 as basic technology research does not assume activities with deployments, and TRL level 9 does not involve any publishable research, thus, the results only contain deployments in range from TRL 3 to TRL 8. The smallest amount of deployments is related to TRL 3 with 3.37% (103) of all deployments and TRL 8 with 2.65% (81) of all deployments—in these cases, deployments are rarely used or results of corresponding usage are rarely published. Most deployments—93.98% (2875)—are related to TRL 4–7. Distribution of deployments between these four levels shows a rather low—15.66% (479)—number of deployments used for demo purposes, with more significant usage for tests—29.03% (888)—and for validation in target environment 27.00% (826). The rest—22.30% (682)—of deployments are used for validation in laboratory environment.
Overall this data, as expected, conforms to normal distribution, with the only outlier of TRL 6, where we suspect that the codification differences between TRL 6 and TRL 7 were ambiguous, leading to bias towards labeling some demonstration level deployments as target environment demonstration deployments and shifting some of TRL 6 results to TRL 7.

3.1.3. Testbed Facility Usage

Of all sensor network deployments, only 15.63% (478) utilize some sort of testbed facility to achieve their goal. Only 2.12% (65) of deployments were actually deployed as a part of a testbed facility, not utilizing it. The remaining 82.25% (2516) of deployments were standalone deployments without any connection to testbed facilities.

3.1.4. Deployment Type

In this review, we distinguish two distinct types of deployments:
  • “Tool”—deployments trying to solve a specific problem in a specific domain (e.g., agriculture, smart city infrastructure, education or any other field where sensor network solution could prove useful);
  • “Self”—where the deployment is meant for research in sensor networks themselves and not using sensor networks as tools for research in other domains.
Slightly less than half—47.11% (1441)—of deployments were conducted purely for sensor network research purposes and slightly more—52.89% (1618)—of deployments were conducted in order to solve a specific problem in another domain.

3.1.5. Rich Nodes

Sensor network deployments can differ in many aspects, one of which is the type of nodes that are used in the network. We divide the nodes in the following categories:
  • Simple—these are simple nodes that usually consist only of an embedded micro controller (MCU), Radio and a couple of sensors (e.g., Telos B, Arduino based systems, devices based on MSP, Atmega and similar MCUs);
  • Rich—these nodes are rich devices with a dedicated central processing unit (e.g., ARM or x86), capable of running a fully fledged operating system (e.g., Linux) and can potentially have additional rich periphery such as high resolution displays, quality audio speakers etc. (e.g., Raspberry Pi, mobile phone, embedded computer).
More specifically:
  • For 16 (0.52%) of all deployments we were not able to determine the node makeup of the deployed sensor network (“Null” in the graph);
  • The majority of deployments—2374 (77.61%)—-consisted only of Simple devices (“None” in graph) meaning, that the historical trend of building sensor networks from simple low energy embedded devices still holds;
  • The remaining 669 ( 21.87%) contain at least some Rich nodes:
    -
    Of these deployments, 416 (13.6%) contained a Rich base station node while the rest of nodes were Simple (“Base stations” in graph);
    -
    Additionally, 226 (7.39%) deployments contained only Rich nodes (“All” in graph);
    -
    Only 27 (0.88%) deployments contained a mix of Rich and Simple nodes, where some of the Rich nodes were not base stations.

3.1.6. Node Mobility

Sometimes sensor networks are used in a field that requires mobile solutions, e.g., automotive industry. These types of nodes are much more complex and have to battle with the software optimization, smart duty cycles and even dimensions. Our results show that 74.73% (2286) of the deployed sensor networks are considered static, without any mobility aspect whatsoever. We could not identify the mobility status of 1.73% (53) of the networks. The remaining 23.54% (720) of networks use at least some mobile nodes (4.58% (140) “Mixed” deployments with a mix of static and mobile nodes and 18.96% (580) “Mobile” deployments consisting of only mobile nodes).
The more complex analysis of trends related to node mobility (e.g., whether there is an increasing mobility trend) continues in Section 3.2.3.

3.1.7. Node Connectivity

Sensor networks consist of multiple nodes that form a network among themselves and usually also a base station connecting the network to external systems. Even though most of the time these connections are wireless, sometimes, wired connections are required for noise resilience, privacy or any other reason. This is usually especially important in industrial or otherwise harsh environments with complex obstacles.
Almost all—93.49% (2860)—of the sensor network deployments examined were wireless and only a small number, 2.91% (89), were hybrid, indicating both wired and wireless connections. Additionally, 3.07% (94) of deployments entirely relied on wired connections. In a small amount of deployments, 0.53% (16), we could not identify the type of connectivity solution used.

3.1.8. Deployment Goal Network

Several of the codified variables for the review were only relevant for the long-term goal usage of the sensor network deployment. In cases where there is no specific goal, these values could not be extracted from the reviewed papers, thus, we first identify which of the deployments actually have such a goal, and then follow up with the specific details of such a goal network deployment.
In more than a third, or 40.34% (1234), of the cases, the goal field is neither defined, nor implied, meaning that the deployment is created for general research on sensor networks, not as a step towards any specific application of sensor networks, while the remaining 59.66% (1825) have some sort of goal deployment in mind (see Table 2). From those deployments that have some sort of goal deployment, we extract additional characteristics below (note that the percentage data there refer only to the subset of those deployments that actually have a goal network deployment).

Field of the Goal Network

As shown in Figure 3, common fields of the goal network in sensor network deployments are infrastructure 22.63% (413) and health and wellbeing 19.12% (349). Less frequently deployments are dedicated to fields of environment 16.27% (297), agriculture 12.55% (229), safety 8.93% (163), industry 7.84% (143) and transport 6.74% (123). Other domains are very rare, altogether 5.92% (108) across four of the most unrepresented fields of the goal network—communication, research, entertainment and education. These underrepresented domains with a small amount of related deployments could yield promising research avenues with potential low-hanging fruit results.

Scale of the Goal Network

Even though the deployment itself might be relatively small-scale, some deployments are meant to lay the ground for large-scale deployments. When looking at the target deployment sizes (Table 3) the most typical ones are building and property scale, followed by single actor and region scale. Room, country and global scale, on the other hand, are much less represented. In these results, “None” means that no scale information of target deployment was clearly provided or defined.
Even though, previously, room scale has been much rarer than building scale, we predict, that during the next few years, it might be a more prevalent target due to increased concerns about the spread of airborne particles. On the other hand, the previous trend shows that most research targets the whole building, not just separate rooms, thus, it is not clear and it poses a question for a future review.

Subject of the Goal Network

Most real-world deployments are dedicated to monitoring of environment 39.89% (728), followed by monitoring of equipment 27.29% (498) and friendly actors 24.99% (456). Monitoring of opposing actors, 6.90% (126), is less widespread as uncooperative actor monitoring is rarer because sensor nodes cannot be attached to the actors being monitored, and also such research is related to security and defense, leading to fewer related publications, possibly due to security and privacy concerns. In 0.88% (16) of the deployments, the goal network had multiple mixed subjects from previous categories. Finally, there was only one case where the subject of the goal network was the network itself (SELF), meaning that the sensor network monitors itself—location of nodes, communication quality, etc.

Interactivity of the Goal Network

Table 4 shows that typical deployment does not provide interactivity (Passive), meaning that it only senses and gathers data for later or remote analysis without feedback/actuation. Only 20.55% (375) of deployments are equipped with actuators and, therefore, can react to the changes in the world around them. Two of the deployments had no clear information on interactivity of the target deployment in the article (None).

3.2. Double Metric Data

After the basic single dimension analysis of results, in order to provide information about potential trends in the sensor network deployment domain, we analyzed pairs of data in order to identify and showcase some of the most interesting metric pairs observed throughout the dataset. The following sections are ordered around the key topics or trends we found while analyzing the data, the topics we below are as follows:
  • Technology Readiness Level;
  • Usage of rich nodes;
  • Sensor node mobility;
  • Sensor network deployment interactivity;
  • Testbeds;
  • Wireless sensor networks;
  • Sensor network deployment usage.

3.2.1. Technology Readiness Levels

The percentage of deployment TRL is similar in all years, except for year 2015. In 2015, deployment TRL compared to other years seems to have shifted more to higher TRL levels, as shown in Figure 4, the reason for this deviation is unclear. In 2017, TRL6 had a much lower deployment count than in other years. The gap in normal distribution created by TRL6 deviation most probably is caused by blurred lines in the used definitions between adjacent TRL levels—this trend was also shown above in Section 3.1.2.
An obvious result shown on Figure 5 is that, indeed, if a sensor network has a specific end goal in mind, it is closer to the final readiness (higher TRL) as well as the opposite—lower TRL deployments more often lack specific target deployment in mind.
It is interesting to note the trend shown on Figure 6—even though the vast majority of deployed sensor networks use a wireless connection, at the very lowest and highest TRLs, the amount of wired deployments is much higher than in the middle levels. In the lowest TRL3/TRL4, the wired solutions seem to be used more just as a rough and easy prototyping measure, then at TRL5/TRL6, most deployments have transitioned to almost fully wireless. Finally, it seems that at TRL7/TRL8, more hybrid and wired solutions return.
We interpret this result as a result of the fact that generally speaking, sensor nodes are first tested in the laboratory conditions with wires, then, as the solutions develop, they are transferred to the wireless connection, which is perceived to be superior, only to finally face the real-world problems with wireless connections when testing in target environments. These problems can include obstructions, oversaturated radio spectrum, etc. This most likely leads to more final products being hybrid or fully wired than experimental prototypes and demonstrators, since wireless connections often cannot meet market requirements in sensor network deployments.
Figure 7 shows that mobile nodes are tied to wireless sensor node deployments and thus also peak in the middle TRLs, while static nodes are more likely to use wired connections and are more represented in the lowest and highest TRLs, mirroring the observations from the previous paragraph, stating that where possible mobile nodes might be reduced to static nodes with wired connections for final products due to reduced risks and uncertainty.
Richness of the nodes also seems to strongly correlate with wired sensor deployments in relation to the TRLs, as shown on Figure 8. Non-rich nodes are most prominent in the middle TRLs where wireless nodes were most prominent as well. Rich nodes are most prominent in very high TRLs and very low TRLs, which is especially visible among richness of the Base station nodes. This is most likely due to the fact that wired nodes are not limited by battery capacity which also limits the potential for rich node usage, but a decision to switch to a wired solution allows designers to select more feature-rich nodes that might be preferred by users of final products.
The data in Figure 9 also show an obvious pattern of sensor networks that are more ready (higher TRL) being used more as a tool for other research, while less ready experimental networks (lower TRL) are used for researching sensor networks themselves.
Some interesting patterns can be seen in the data depicted in Figure 10 about TRL correlation with the field of the goal network. Specifically, agricultural sensor network deployments are overwhelmingly deployed in the target environment—probably because of relatively easy access to agricultural spaces, even though much fewer of those deployments actually reach a status of agricultural sensor network in the shape of a final product. There are a lot of sensor network demonstrations and proof of concepts, but almost no target and final system deployments. It can also be seen that only after reaching a specific maturity of TRL 6, a sensor network deployment is considered for targeting the field of environment. Environmental sensor network deployments seem to correlate with the wired sensor network deployments with most deployments at very low and very high TRLs—this might be because sensor networks historically have mostly been used in environmental monitoring and thus, the technology is more mature. On the other hand, health and wellbeing-related deployments correlate with wireless sensor network deployments with most deployments in the middle TRLs, which is probably caused by the relative newness of these sensor network applications as well as the fact that they involve mobile subjects that in turn require wireless sensor networks. The trend in the industrial sensor network deployments shows that even though there is high interest in researching and testing new sensor network deployments with industrial applications, it is very hard to actually meet the requirements of industry, as with each increasing TRL, there are fewer and fewer sensor network deployments described.
Inverted grouping of TRL and goal network show that main target of deployments without field of the goal network (e.g., pure research) is focused on TRL4 and TRL5, as shown in Figure 11. Significant amount of deployments for infrastructure, environment and agriculture are focused on TRL7.
Most of the deployments where the subject of the goal network is a friendly actor are related to range from TRL4 to TRL6, which matches a normal distribution. On the other hand, in the case of the environment-related deployments, the situation is opposite—most deployments are related low and high TRLs, which is inverse to normal distribution (see Figure 12). It could be explained by the assumption that friendly actor deployments are more attractive for laboratory, test and demonstration purposes, e.g., performed by scientists and related personal itself, but environment deployments are rather useless if they do not reach at least TRL7.
We can observe that increasing TRL levels relate to increased areas of deployment scale. It could be explained with the scale of corresponding projects itself and their obligations for publications as mandatory project deliverables (see Figure 13).

3.2.2. Rich Nodes

Only a small number (226/7.39%) of deployments are completely based on rich devices, it is possible that it is more related to increased power consumption than to related costs for the more complex technical equipment itself.
As time goes on, the usage of rich nodes is increasing and consequentially the amount of deployments where no rich nodes are used at all has decreased from 82% to 74% during the monitored five year period as shown on Figure 14. This tendency is most likely a result of technological progress driving availability and lower prices as well as the increased usability of rich nodes as they are no longer tied to the cables and are capable of delivering days of usage from a reasonably sized mobile power source.
The richness of the nodes seems to strongly correlate to the technological readiness of the deployment. Figure 15 suggests that the more ready deployments have more rich nodes (mixed and all), while more experimental deployments rely more on basic sensor nodes or just rich base stations.
It is shown in Figure 16, when looking at the existence of a goal network—that those deployments having at least some rich nodes, are much more likely to have a goal network, than those which only have simple nodes.This also hints to correlation with higher TRLs.
In Figure 17, there is a general trend of more rich nodes being used in larger deployment scales. It seems that the larger the scale, the more ready the sensor network needs to be leading to more rich nodes used. While the percentage of no rich nodes in all deployment scales did not show significant change, the deployments where all nodes were rich increased with the scale (thus reducing the number of deployments where only base stations are rich). There is a notable outlier of Country scale where base-station-only rich nodes seem to drop significantly, while at the property scale, non-rich nodes seem to dominate more than on other scales.
Both richer nodes and nodes deployed as a tool are, by definition, of higher TRL than those that are research subjects themselves as evidenced by less non-rich nodes in tool category and less rich nodes in the subject category shown in Figure 18.
As Section 3.2.3 shows that mobility correlates with specific end use cases involving end users (people, vehicles), it is a surprise that more rich nodes are deployed in mobile deployments, as shown in Figure 19—this is a counterintuitive result since mobile deployments are assumed to be more power consumption-sensitive and thus might want to avoid rich power-hungry devices—the data show that there are some benefits to rich nodes in mobile applications that outweigh the negative effect on power consumption.
Another interesting crossover can be observed between mixed mobility and mixed usage of rich nodes—this tends to suggest that there are quite a lot of heterogeneous deployments with, most probably, static rich nodes and mobile simple nodes.
Figure 20 shows that wherever end users require interactivity, of course, more rich and capable nodes are deployed, which tends to suggest that more often than not, the decision making on the interactive part of the deployment is left to the end devices and not received over the network because actuation itself rarely requires a rich sensor node.
It is interesting to note in Figure 21 that wireless node deployments have all richness levels equally, wired deployments can support more rich devices due to power requirements, while hybrid deployments also have a mix of rich and non-rich devices where rich devices are most likely wired as well.

3.2.3. Node Mobility

In most deployments (2286/74.73%), sensor networks are realized using static nodes and less then 1/5 of all deployments (580/18.96%) are based on mobile nodes. Usage of both mentioned approaches together is very untypical (140/4.58%). There is an opportunity for increased amount of mobile sensor networks, this could give the benefit of fewer sensor nodes for equivalent geographical area.
As Figure 22 shows, many fields display a clear preference towards one type of deployment—static or mobile, while there are some that utilize both, resulting in mixed deployment. Most fields prefer static, which is clearly seen in agriculture, communications, environment and infrastructure. These fields tend to use fewer deployments with increasing mobility—this could be due to complexity and power requirements in sensor networks and also because of the small number of use cases for mobile networks in these fields.
A clear exception to this rule are Health and Wellbeing and Transport, where this trend is inversed, most likely due to the fact that the subjects monitored are mobile themselves and thus, static networks are less applicable.
An interesting observation can be taken from industry, where it seems that mobile networks are not popular. This could be due to the fact that industry tends to involve a rough and noisy environment, with machinery, and structures interfering with wireless networks. Such networks, which could survive in an industrial environment, are not trivial to build, so wired connection is used more often.
Most mixed deployments come from education, research and safety. While these discoveries are not particularly interesting, the reason why safety mostly uses mixed deployments is unclear. One reason could be smart housing, where sensors are used to automate many tasks. These sensors and nodes are of mixed types—static and mobile.
The correlation between node mobility and deployment field displayed in Figure 22 also predicts effects noted in node mobility and deployment scale comparison in Figure 23—a single actor is mostly related to mobile targets such as Health and Wellbeing or single units of transport, while the country scale is mostly related to road infrastructure, which is also related to transport.
Other significant correlations show the default assumption that there are more static than mobile sensor network deployments overall, except for those few exceptions mentioned above. It is also worth noting that indoor (room/building) scales almost always will have some static parts as well due to requirements of anchors/localization where GPS is not available.
The same trend of mostly static sensor network deployments with a smaller number of mobile nodes holds in comparison with the subject that is being monitored as visible in Figure 24. The only notable exception is “friendly actor”, which is a mobile target that can carry the sensor node with it, in contrast to “opposing actor” which has to be monitored remotely due to limited access.
In Figure 25, interactivity of the sensor network deployment correlates with more heterogeneous sensor network deployments which have both static and mobile nodes, while non-interactive or passive sensor deployments are more homogeneous and, thus, feature either purely mobile or purely static deployments.
In the case of friendly actor deployments, there are a significant number of mobile deployments compared with other types included opposing actor, Figure 24. This could be explained with the following three paradigms: (a) The main object of interest in the common case is rather mobile and, therefore, the data acquisition device should be mobile too; (b) The main object of interest is itself interested in these data (or at least not against its acquisition); (c) The usage of a number of static devices for data acquisition from one mobile object would be non-optimal in the sense of resource usage (not applicable in the case of opposing actor because the second paradigm does not work then).
According to Figure 26, the goal network plays a role in node mobility. Nodes are more likely to be static and less likely to be mobile if there is no goal network. If there is a goal network, the opposite is true: nodes are more likely to be mobile and less likely to be static.
If the node mobility is mixed, it is more probable that the rich nodes will be mixed, as well. Instead, if all nodes are rich, then it is more common for sensor networks to be mobile (smartphones, PC on Roomba, etc.) Mixed mobility is also quite common if all nodes are rich, see Figure 27.
However, if none of the nodes are rich, then it is more common for sensor networks to be static, see Figure 27. Battery constraints in the context of sensor network mobility do not seem to be an issue.
If the sensor network is used as a tool, it is more likely that, in some way, it will be mobile, while the opposite is true if the sensor network is a subject, Figure 28.

3.2.4. Interactivity

One of the most significant aspects of sensor networks is the interactivity or the possibility to react to the acquired information in the appropriate way. During the analyzed time period, there was no any significant increasing or decreasing of interactive sensor network deployments, as it remained roughly around 20% every year.
The largest number of interactive sensor networks are deployed in Buildings (158/42.13%), as displayed in Figure 29. The interactivity of deployed sensor networks seems to be more important around room, building and property scales, with much less interactivity required for bigger sensor network deployments as those are most likely aimed at passive monitoring on a larger scale. There is also one additional spike at country level, the distribution could be explained with scalability—it is rather rational to manage things on the level of geographical proximity to a located area. The country-level results could be explained with some administrative/government aspects when some domain-specific issues are managed on the national level regardless of geographical location.
The reason why interactive deployments are not increasing in scale could be the current tendency to automate every aspect of human life. Smart housing, smart fitness, smart driving, in every part of human life, the interaction with technology is slowly being taken out, leaving it autonomous.
When observing the interactivity of sensor networks in the context of particular domains, there are distinct domains where the interactivity level is higher compared to others, for example, in the Agriculture (73/31.44%), Industry (41/28.67%) and Infrastructure (104/25.18%) interactive deployments. There are also some “black horses” such as Communications (16/31.37%), Education (3/30.00%) and Research (5/25.00%), but an insufficient number of total deployments, less than 35 in each domain, does not form the basis for representative statistics. Last but not least, there is such a domain as Environment where only 21/7.07% of all deployments are interactive, which, on the one hand, allows the assumption on the possibility for tempting research in this direction, and, on the other hand—poses questions on the reasons why such direction is not already taken.

3.2.5. Testbeds

It is not surprisingly that only a rather small amount (543/17.75%) of sensor network deployments assumes usage of testbed facilities. On the other hand, this aspect leads to the conclusion that there are tempting possibilities for further improvements due to increased usage of testbeds.
There are no noticeable trends in the usage of testbed facilities between years, as shown in Figure 30, the usage of testbed facilities did not change significantly from the year 2013 to 2017, one might even speculate that the usage is slowly declining, but that notion might only be due to the lack of data in this regard. Does this suggest that the existing testbeds should consider the updates or change focus to stay relevant in the digitization processes which is quickly sweeping our everyday lives as well as industry with the ever-evolving Industry 4.0?
The gathered data also allow us to look at this from different perspectives, the sensor deployment technology readiness level when using a testbed facility is shown in Table 5. The data show that by far the most deployments used a testbed facility when the deployment was targeting TRL5, which is expected, as TRL5, as stated in the EU Horizon 2020 program [7], means that the “technology has been validated in relevant environment” and the testbed facility can be regarded as a relevant environment, because usually it is not located directly at the laboratory.
Additionally, to no-one’s surprise, Figure 31 shows that testbeds are used when the target of the deployment is to conduct research on the sensor network itself. Whereas, if the deployment of a sensor network intends to achieve anything not related to the sensor network itself, but rather to conduct research in another domain, probably using a real-world deployment, the usage of testbeds is quite low. This suggests that there is a niche for testbeds to occupy—helping with the sensor network deployments in the real-world deployments where typically the complexity is much greater compared to the laboratory deployments used for sensor network research.
Generally, sensor network deployments using a testbed facility tend to be of medium scale, as visible in Figure 32; this might be due to the nature of testbeds, they rarely focus on a single instance and even more rarely are the testbeds covering more than a region. This might be the case where the results do not tell the story of sensor network deployment needs, but rather the limitations of the tools, e.g., testbeds, used. However, it is worth mentioning that there are bigger deployments which have used existing testbed facilities. The following question is raised here: is it worth it for a testbed facility to support single-instance and large-scale solutions? For single instances, the answer most probably is no, because that just classifies as a test bench and there are little to no advantages of testbed facilities when working with a single device. As for the large-scale deployments, the problem remains the old cost/benefit ratio. However, this should change if we observe a shift in sensor deployment targeted scales as the testbed facilities, as any other tool, should adapt to the needs of the users.
Somewhat surprisingly, Figure 33 depicts that in the typical case, the testbed facility is created without some specific goal network in mind. Instead, it is intended to solve some specific problems such as node communication, data transmission, etc. Nevertheless, it would be adequate to use some specific testbeds for specific goal networks such as urban, outdoor or underwater environment with their specifics not reproducible in a laboratory environment.
Of all wired sensor networks, 7/7.45% and a similar number (6/6.74%) of all hybrid sensor networks are part of a testbed facility, whereas only 52/1.82% of all wireless sensor networks are part of a testbed facility. However, if the sensor network is wireless, it is more likely that it was tested in a testbed facility (467/16.33%).
Together with the previous results on connectivity, Table 6 shows that most testbeds are built using only or significant amount of static nodes. Therefore, there is some space for additional mobile testbeds in the future. In the context of deployment, there is also a need for additional research on mobile testbeds themselves before they are used as a tool.
In the case of deployment being “part of” testbed facility, this is only found in the Research domain (15/100%). It could be related to the rather well balanced distribution between science and industry through TRLs, where development of testbeds itself is left to scientific institutions, and not the R&D departments of corresponding industry subjects.
If we generalize among the fields where the testbed facility usage is comparatively high, the emerging groups are “World around us” (Agriculture and Environment) and “Technology we use” (Communcation, Industry, Infrastructure, Transport)-focused, the rest of the fields have low testbed facility usage. This suggests that the usage of testbeds is higher if the goal of the sensor network deployment is more industry-relevant, as 4 of the 5 top fields, except environment, unfortunately, are considered to be industrial fields, see Figure 34.
Among the deployments using any testbed facility, there are more interactive deployments (10% from Interactive) than among those who do not use a testbed facility (6% from Passive). Can this be an indication that more complex, e.g., interactive deployments, preferring to relay on existing testbed facility functionality as means to curb the complexity? Or is it related to the previous result where, if the testbed facility is used, the goal is more industry-relevant and this suggests that the goal is also more complex?
Drawing from Figure 5 and Figure 35, nodes which are tested in a testbed facilty are of relatively low TRL and thus less rich nodes, while testbeds themselves contain more rich nodes, although almost always also non-rich nodes. This leads to most of the testbeds falling under the mixed richness category corresponding to the heterogeneous sensor network deployment-ready testbeds.

3.2.6. Is the Future Really Wireless?

Statistically, the sensor networks used in equipment monitoring utilize more wired solutions than other subjects, while the use of wireless solutions are more or less equally distributed through all of the subjects, as noticeable in Figure 36. This suggests that, indeed, the future seems like it is going to be wireless. However, the outlier Equipment is interesting because it is the only one where the introduction of the sensor network is performed in the design phase, whereas the rest of the subjects are monitored as is, without any possible modifications. Therefore, the result taken from this is that if the conditions allow it, implementers tend to use wired connections for the sensor networks, and to no surprise, they are more robust and cheaper to implement. The only downside is the necessity to have wires, which is an inconvenience for sensor networks covering large areas and freely moving targets.
Figure 37 adds to the result expressed previously, sensor networks deployed as tools tend to be wired—wired: 65/69.15%, hybrid: 53/59.55%, wireless: 1493/52.50%, and sensor networks deployed as subjects lean towards being wireless—wired: 29/30.85%, hybrid: 36/40.45%, wireless: 1367/47.80%. Again, if we design the tool, it is a lot easier to plan for wired connections.
Figure 38 also confirms the same, there are less sensor networks with wireless nodes than wired nodes when the sensor network has a goal network. The opposite is true when there is no goal network, which typically involves some research on the wireless sensor network itself.
Considering connection type in regards to the field of the deployment, wireless connection is used equally (between 85% and 100% of total) for all fields except for research (65% of total), where it is used to a lesser extent. This also adds to the argument mentioned previously—when the research is planned, it is usually possible to easily plan for wired connections unless the target is not suitable for wireless deployment.
The overall consensus seems to be that it is still preferable to use wired connections if the target deployment is compatible and it does not add significant burdens. Therefore, in the authors’ opinion, the future will not be wireless, it will still involve making sensible decisions and using the best-suited approach for the encountered challenge.

3.2.7. How Are Sensor Networks Used?

Figure 39 reveals an interesting observation that the deployments are more and more likely to target a wider subject area as the observation of friendly and opposing actors (124/34.54% to 105/27.41%) is slowly decreasing in favor of wider subject areas such as equipment and environment (230/64.07% to 276/72.07%). The tendency together with the actual scales leads to thinking that the interest of research community had started this trend before the observation period and that the main focus nowadays is on subjects that we see and with which we interact. It might be connected with the world’s fight with climate and the increased attention towards carbon footprint from technology leading to the change of prioritizing the field of Environment and, therefore, increasing funding in this field of research.
The scale of wireless sensor networks (single actor, room, building, property, region, country, and global) is distributed quite similarly in usage fields except for some of the usage scales which are highly popular compared to other scales. For example, in the field of agriculture, by far the most common scale is property (71%), but in the field of environment, there are two common scales—property (26%) and region (54%). Similarly, the field of health and wellbeing has two most common scales—building (27%) and single actor (55%), whereas infrastructure has only one most common scale—building (59%). The country and global scales in all fields are the least common scales, probably, because of the range.
When looking at Figure 40, depicting the scale of monitoring subjects, it is quite obvious that when it comes to individual monitoring, the friendly actor takes the lead, while monitoring opposing actors is popular on the single-room, building, property and region scales. This could be related to security reasons. Equipment monitoring is not popular as a room scale, but it becomes more useful when looking at the whole building and property scale. Environment monitoring becomes interesting only in a building scale and stays relevant through property and region. What is interesting is that environment monitoring on a global scale is not very popular, despite the carbon neutrality movement, the probable cause being that it would be hard to develop and operate some global network for all possible climate zones and seasons, so most probably, localized networks with common data standards can and should perform better.
The scale of the deployments on Figure 41, when looking at scales with significant amount of data (building, property, region) shows a clear trend of expansion—the amount of Region-based deployments has been increasing annually, while Building-scale deployments are decreasing. This potentially points to improved ease of high area deployments due to easier accessibility of long-range wireless communication, either directly (e.g., LoRA) or indirectly through mobile network providers.
Of the target fields, two stand out as having mostly deployments which are meant for research in the sensor networks—Industry and Communications, while in all other fields, the deployed sensor networks are mostly used as tools for some other type of research.
Based on the subject of the deployed sensor network, some interesting trends emerge in the target deployment scale shown on Figure 42. Obviously, friendly actors are primarily targeted at smaller scales due to the fact that friendly actors usually need to be local/known, while opposing actors are usually targeted at room scale, indicating interest in deploying sensor networks for security or monitoring of specific rooms. On the other hand, sensor networks aimed at environmental concerns are more deployed at bigger scales, as environmental monitoring is of more use in larger environments.

4. Conclusions

In this article, we tried to provide a thorough and complete systematic review on the sensor network field resulting from a representative subset of more than 3000 articles, which include actual sensor network deployments. After a thorough analysis of these data, we provided a definitive overview of the trends in sensor network deployment described in published research articles.
We have summarized the main trends observed in this systematic review and have provided the potential gaps that are still open for investigation where possible as follows:
  • Sensor networks still are in their further developmental phases and not only a technical tool for other domains. It could be observed that there is a possibility to increase the amount of interactive deployments and therefore possibly gain more benefits and expand the usage of sensor networks in various domains;
  • Almost all sensor network deployments are wireless, and only a small amount are hybrid or entirely reliant on wired connections;
  • In more than one-third of cases, the goal field is not defined, so we can assume that the sensor network deployment is created for internal research purposes only;
  • Only a small number of deployments are equipped with actuators and can thus react. It could be observed that there is a possibility and it might be beneficial to increase such deployments;
  • Monitoring of opposing actors is less widespread or it is less commonly used for publication purposes;
  • Although the number of more capable sensor nodes increases steadily, the interactivity of the sensor networks does not increase; this means that the domain of edge computing is expanding, but the driving force is not the need to react.
As we are finalizing this research, we are planning to continue the observation of sensor network domain development and conduct the next systematic review of sensor network deployments targeting the next five-year interval from 2018 to 2022, with the approximate publication time being somewhere in the year 2024. It will be interesting to compare these data with deployments from the year 2020 and onward, with the aim to determine how the worldwide pandemic has impacted the sensor network domain and explore whether the sensor networks were actually helpful in these trying times for humanity.

Author Contributions

Conceptualization, J.J. and K.N.; Methodology, K.N.; Software, J.J. and V.A.; Validation, A.M., K.N., R.B. and J.J.; Formal analysis, A.M. and R.B.; Investigation, K.N.; Resources, K.N.; Data curation, K.N. and R.B.; Writing—original draft preparation, J.J., V.A., A.M., R.B. and K.N.; writing—review and editing, J.J., V.A., A.M., R.B. and K.N.; Visualization, V.A.; Supervision, K.N.; Project administration, J.J.; Funding acquisition, K.N. All authors have read and agreed to the published version of the manuscript.

Funding

This research was co-funded by H2020-EU.2.1.1.7. grant number 826452.

Data Availability Statement

The data used by this systematic review was previously published as a dataset by Judvaitis et al. (2020) [6].

Acknowledgments

In addition to the authors of this article, these people also contributed their efforts towards the acquisition and processing of this data: Ansis Skadins, Didzis Lapsa, Raimonds Rava, Maksims Ivanovs, Reinholds Zviedris, Armands Ancans and Sandra Ose.

Conflicts of Interest

The authors declare no conflict of interest.

References

  1. Zedalis, R.J. Military Uses of Ocean Space and the Developing International Law of the Sea: An Analysis in the Context of Peactime ASW. San Diego L. Rev. 1978, 16, 575. [Google Scholar]
  2. Morf, M.; Kailath, T.; Friedlander, B.; Newkirk, J.; Lee, D. Investigation of New Algorithms for Locating and Identifying Spatially Distributed Sources and Receivers; Technical report; Stanford Electronics Labs: Stanford, CA, USA, 1979. [Google Scholar]
  3. Albaladejo, C.; Sánchez, P.; Iborra, A.; Soto, F.; López, J.A.; Torres, R. Wireless sensor networks for oceanographic monitoring: A systematic review. Sensors 2010, 10, 6948–6968. [Google Scholar] [CrossRef]
  4. Taivalsaari, A.; Mikkonen, T. A roadmap to the programmable world: Software challenges in the IoT era. IEEE Softw. 2017, 34, 72–80. [Google Scholar] [CrossRef]
  5. Aksu, H.; Babun, L.; Conti, M.; Tolomei, G.; Uluagac, A.S. Advertising in the IoT era: Vision and challenges. IEEE Commun. Mag. 2018, 56, 138–144. [Google Scholar] [CrossRef] [Green Version]
  6. Judvaitis, J.; Mednis, A.; Abolins, V.; Skadins, A.; Lapsa, D.; Rava, R.; Ivanovs, M.; Nesenbergs, K. Classification of Actual Sensor Network Deployments in Research Studies from 2013 to 2017. Data 2020, 5, 93. [Google Scholar] [CrossRef]
  7. Héder, M. From NASA to EU: The evolution of the TRL scale in Public Sector Innovation. Innov. J. 2017, 22, 1–23. [Google Scholar]
Figure 1. Systematic review flow chart.
Jsan 11 00068 g001
Figure 2. Sensor network deployment distribution by TRL.
Jsan 11 00068 g002
Figure 3. Sensor network deployment distribution by field of the goal network.
Jsan 11 00068 g003
Figure 4. Deployment distribution between TRL in each of the sample years.
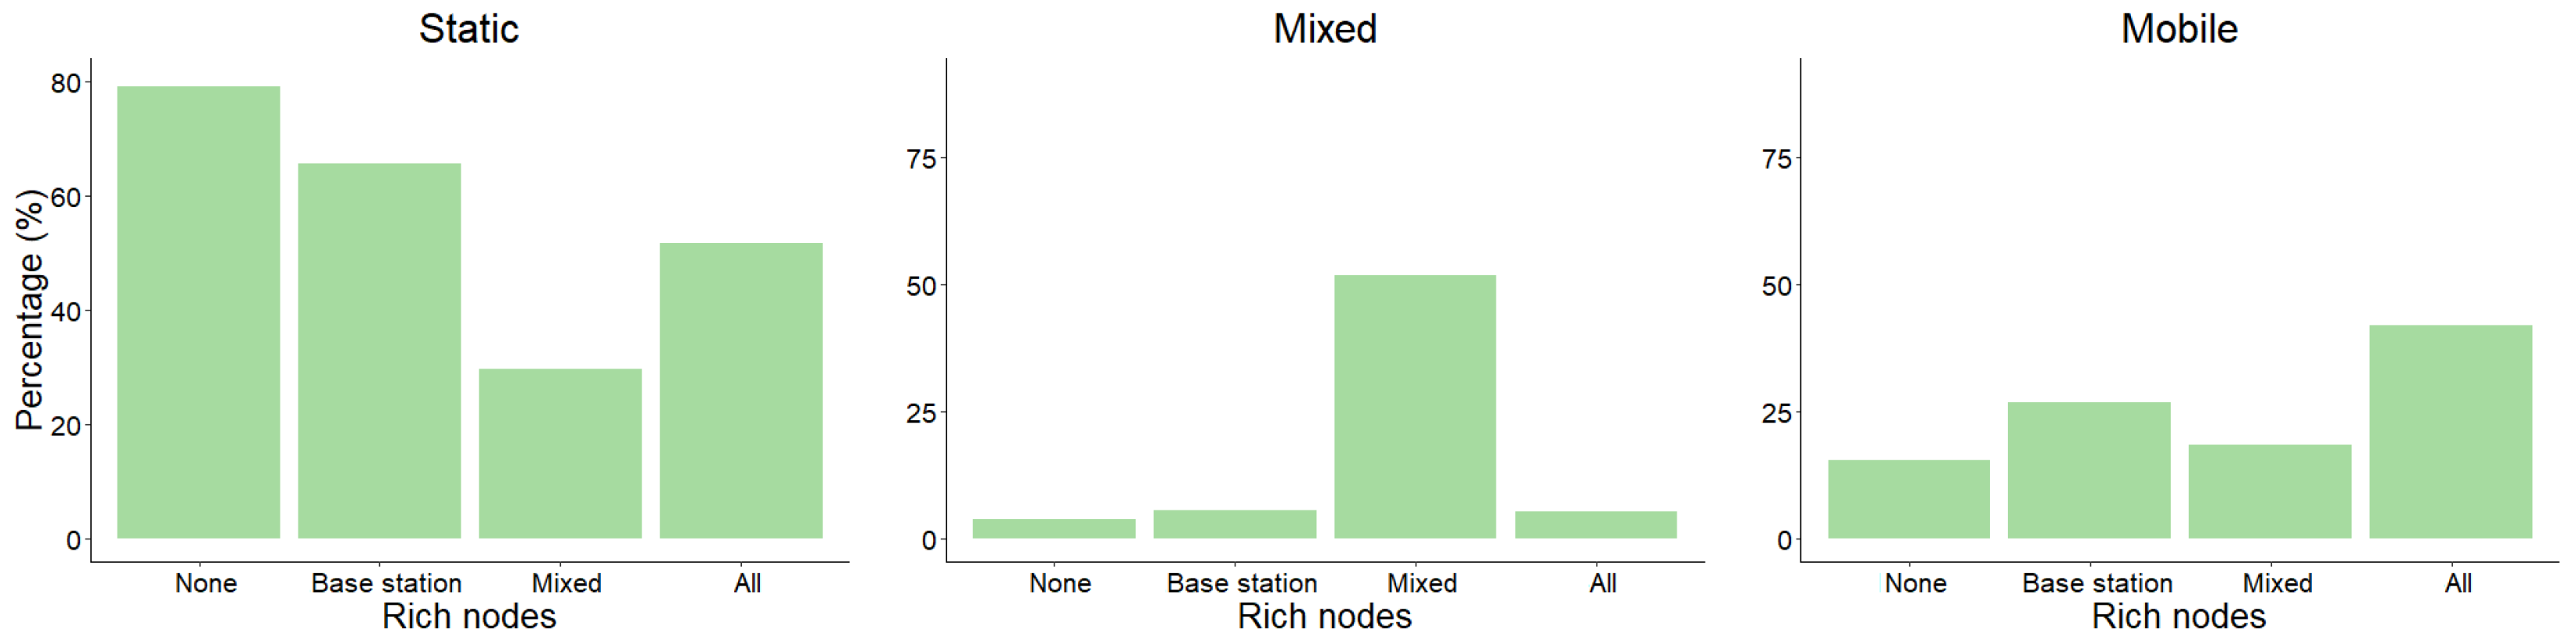
Jsan 11 00068 g004
Figure 5. Deployment distribution between TRL and existence of a goal network.
Jsan 11 00068 g005
Figure 6. Deployment distribution between TRL and node connection type.
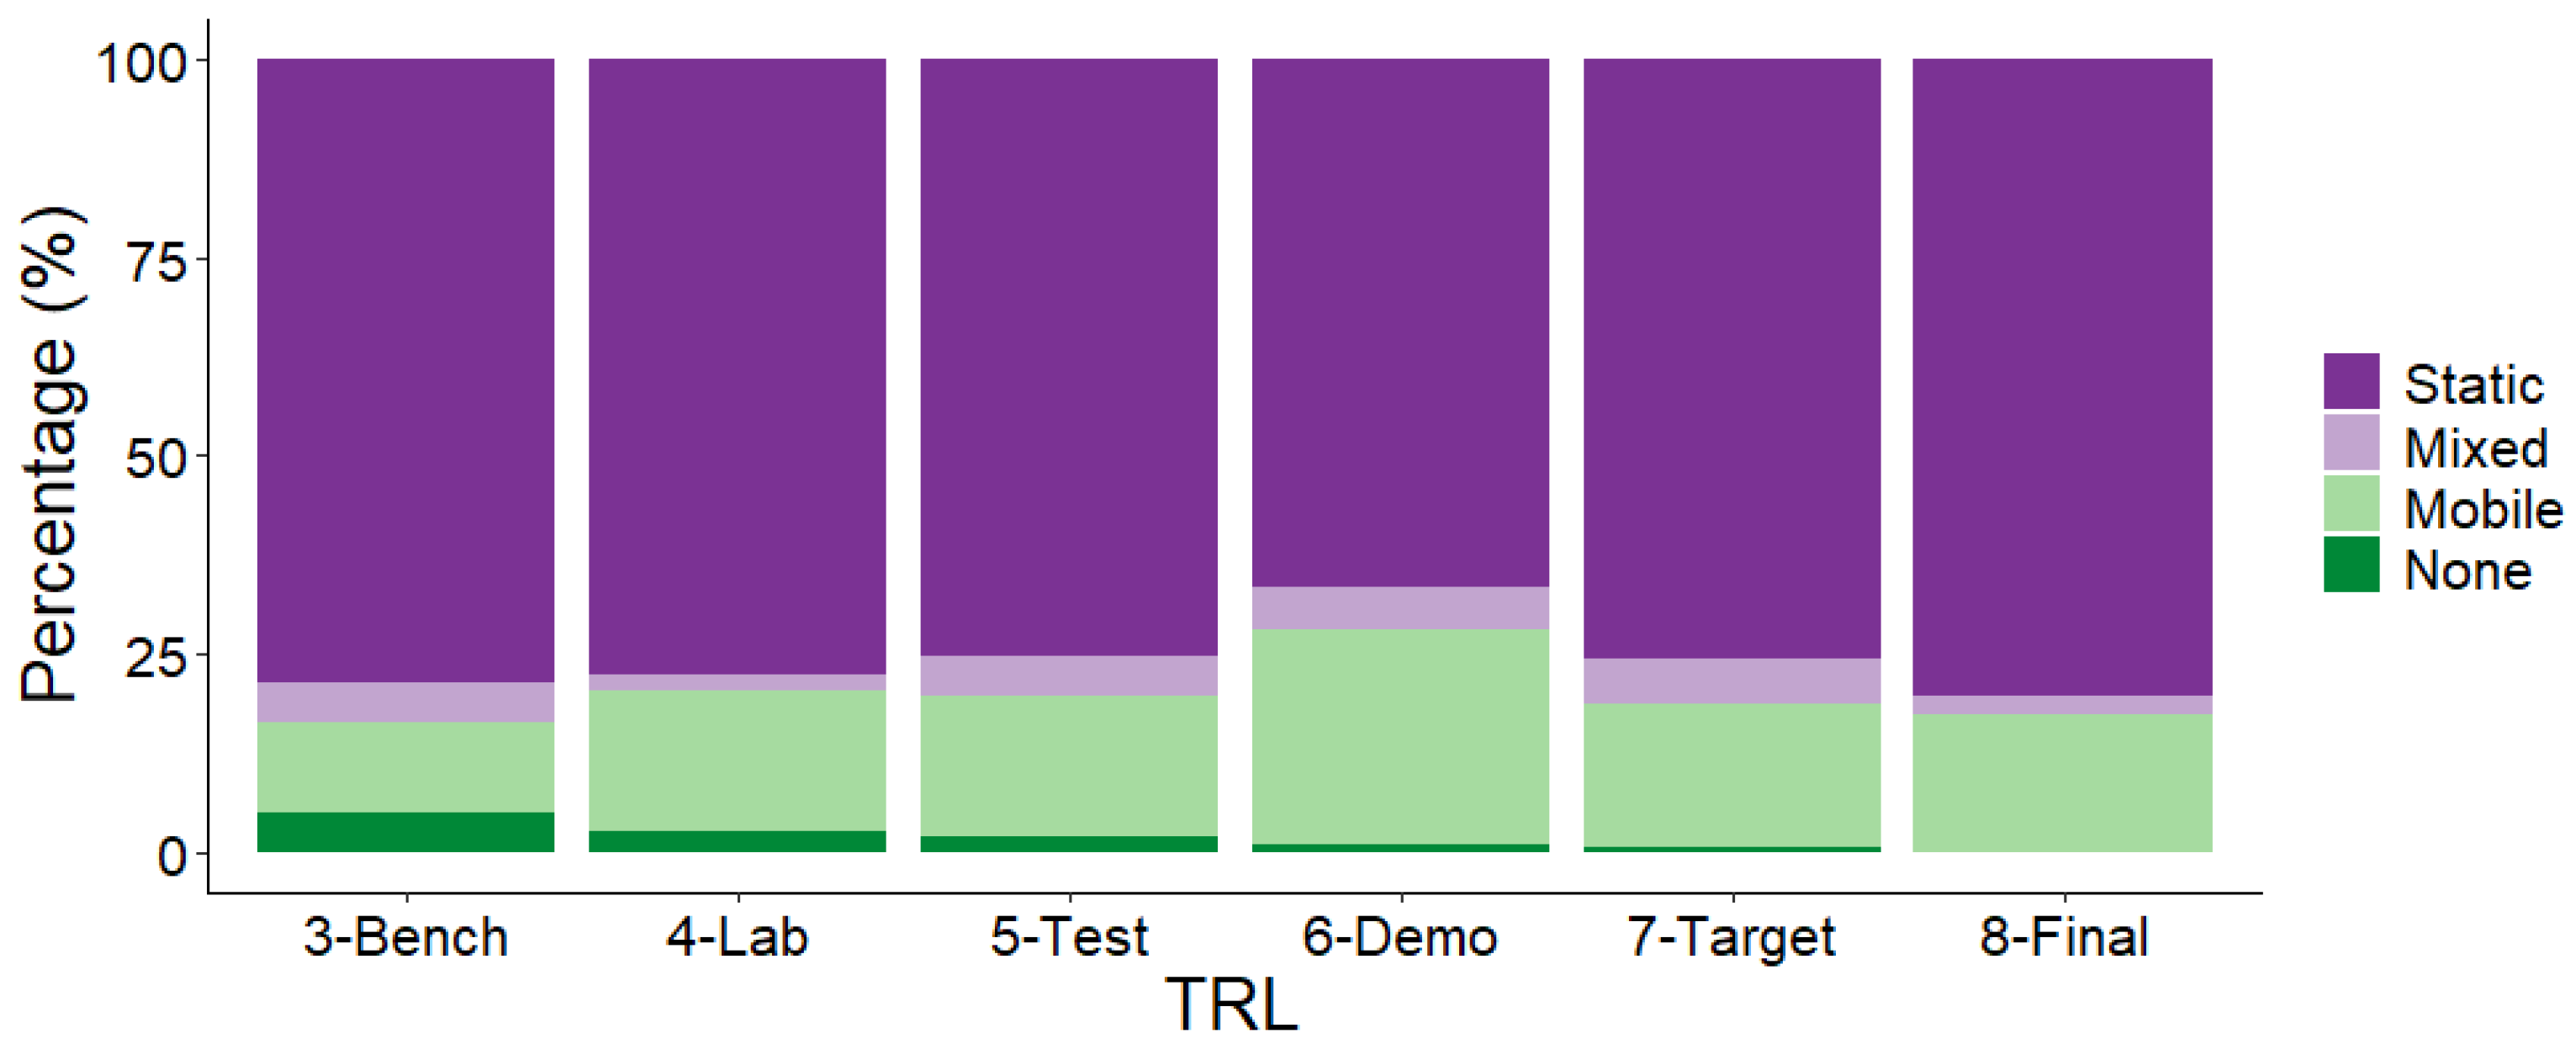
Jsan 11 00068 g006
Figure 7. Deployment distribution between TRL and node mobility.
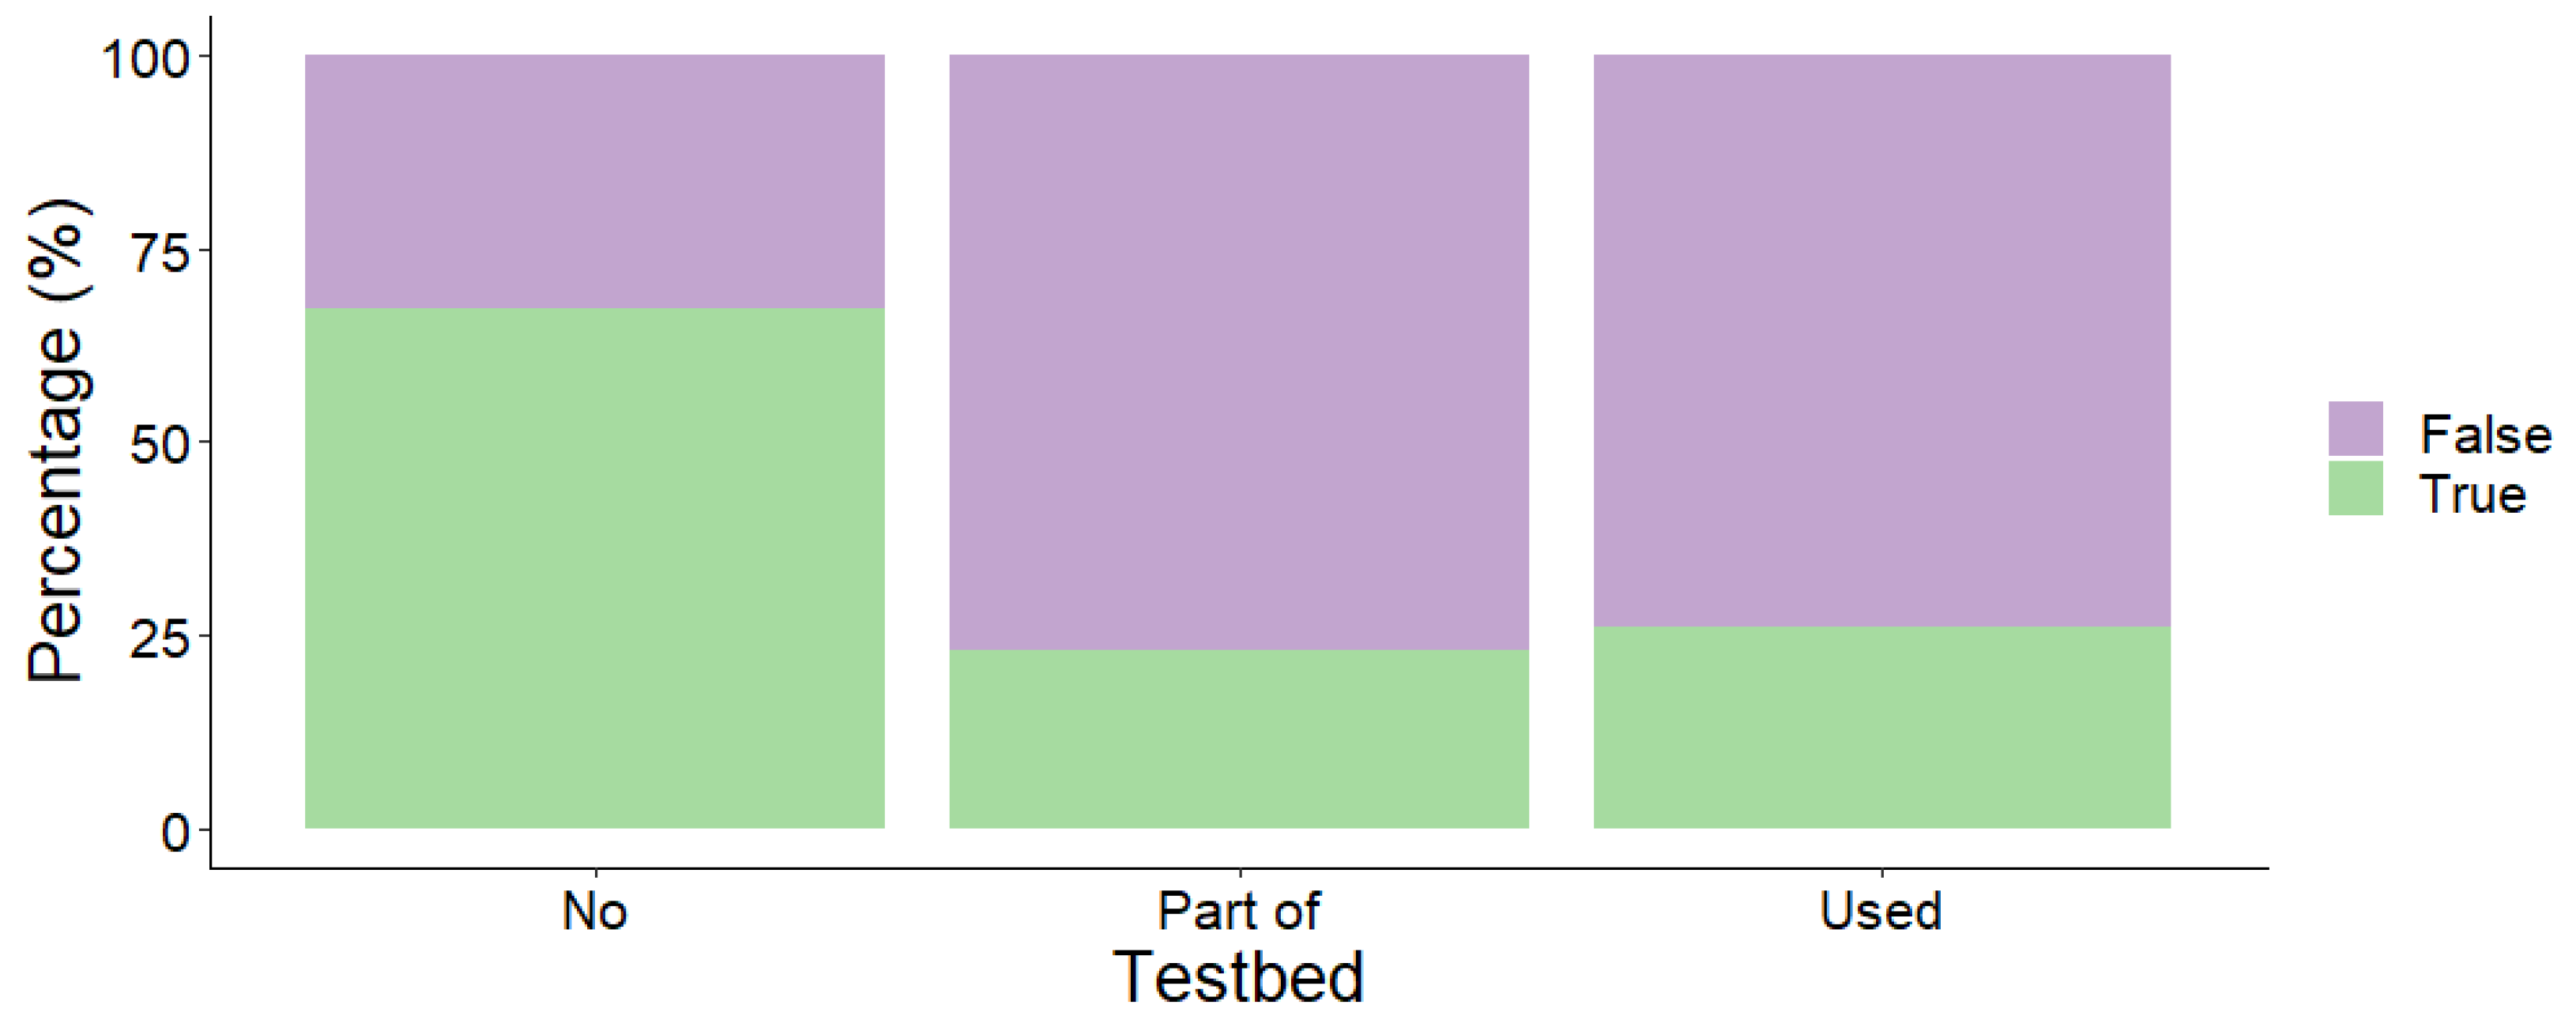
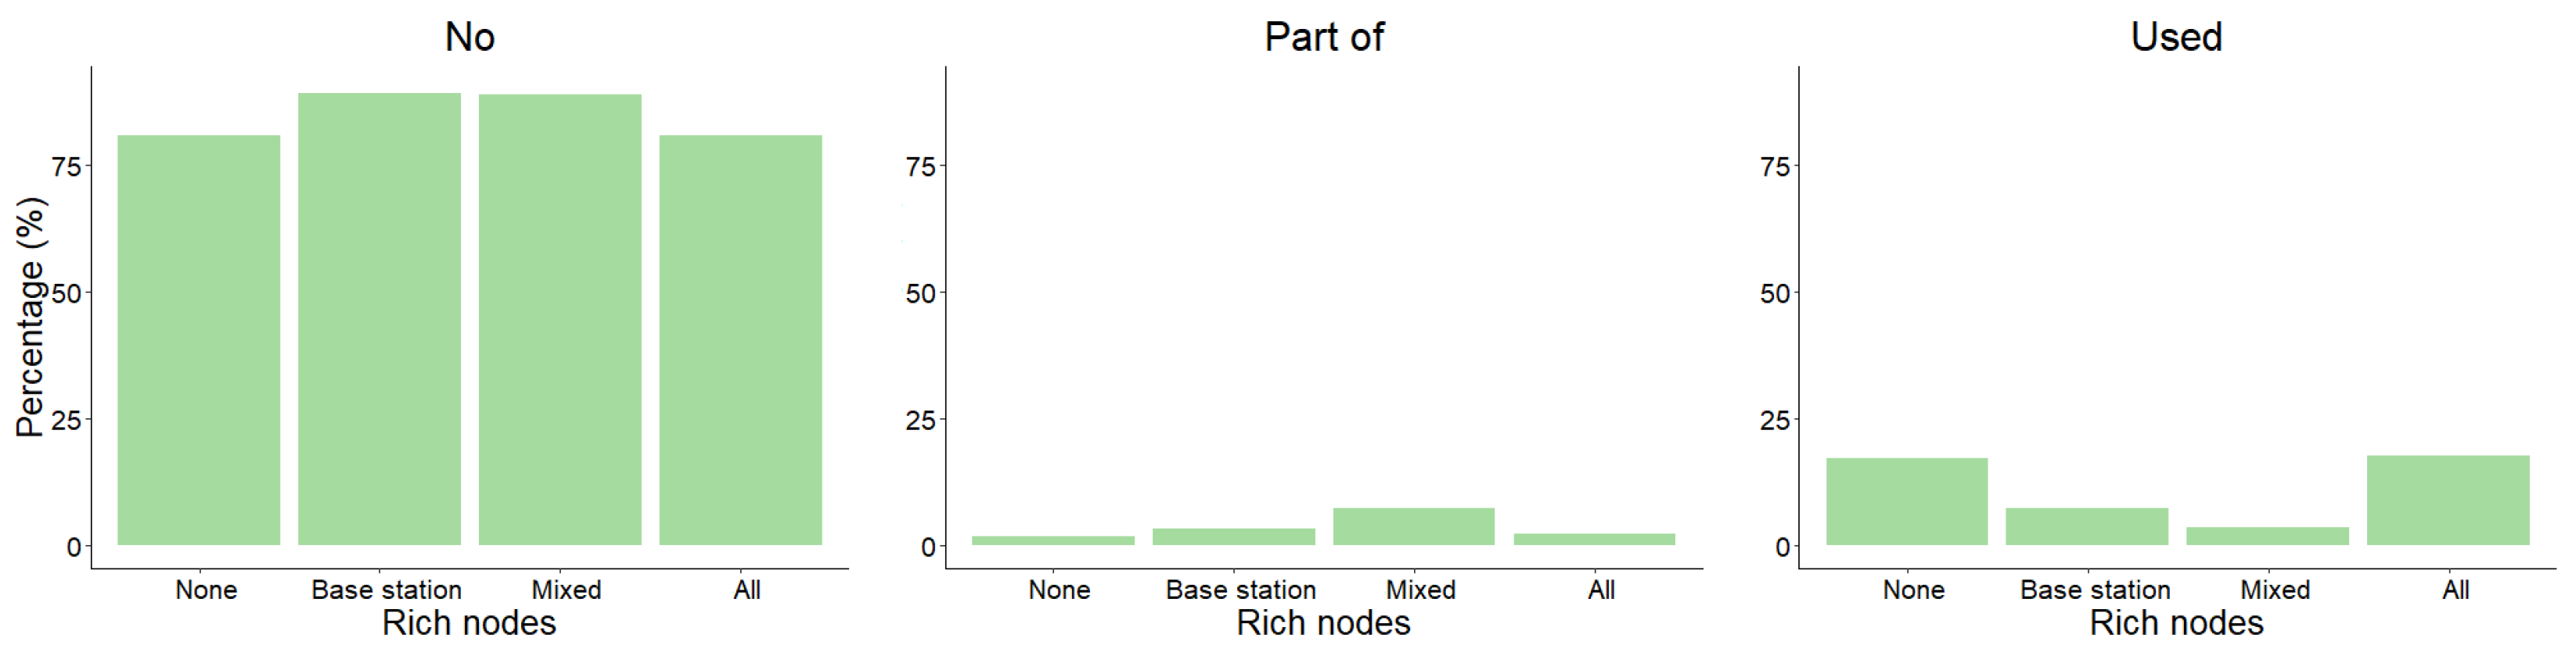
Jsan 11 00068 g007
Figure 8. Deployment distribution between TRL and usage of rich nodes.
Jsan 11 00068 g008
Figure 9. Deployment distribution between TRL and deployment type.
Jsan 11 00068 g009
Figure 10. Deployment distribution between TRL and field of the goal network.
Jsan 11 00068 g010
Figure 11. Deployment distribution between field of the goal network and TRL.
Jsan 11 00068 g011
Figure 12. Deployment distribution between TRL and subject of the goal network.
Jsan 11 00068 g012
Figure 13. Deployment distribution between TRL and scale of the goal network.
Jsan 11 00068 g013
Figure 14. Deployment distribution between year and usage of rich nodes.
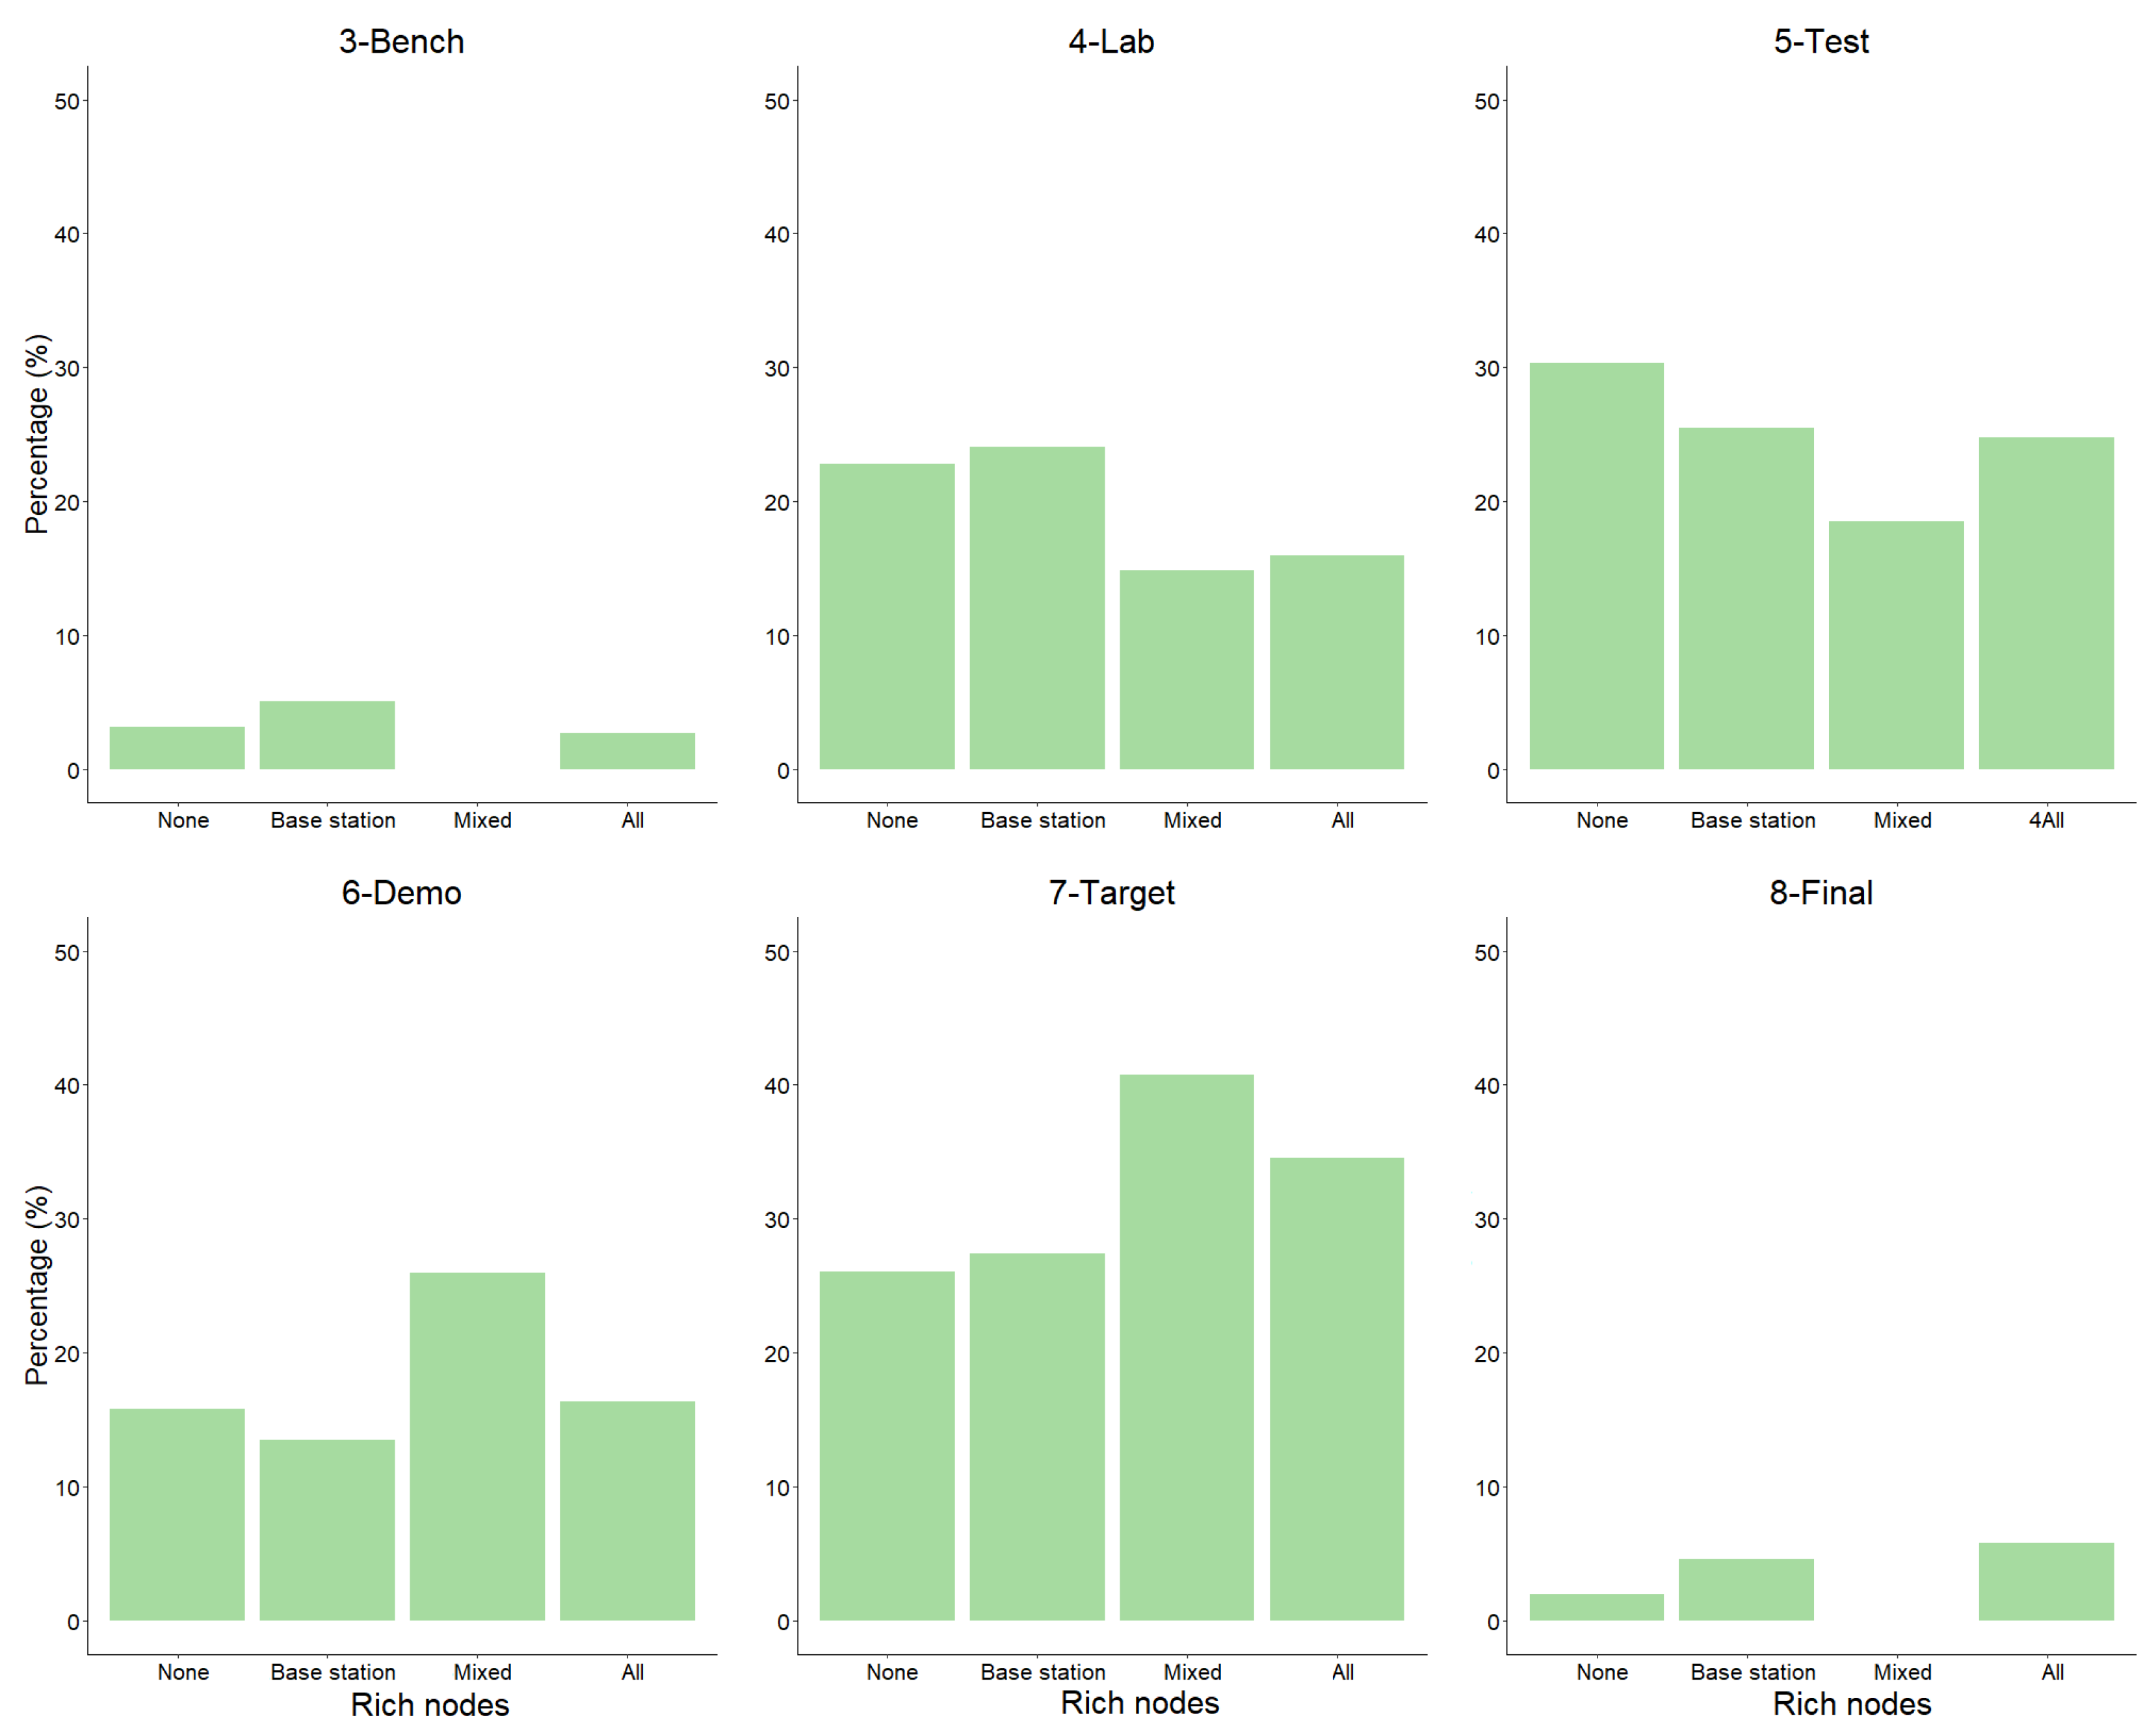
Jsan 11 00068 g014
Figure 15. Deployment distribution between usage of rich nodes and TRL.
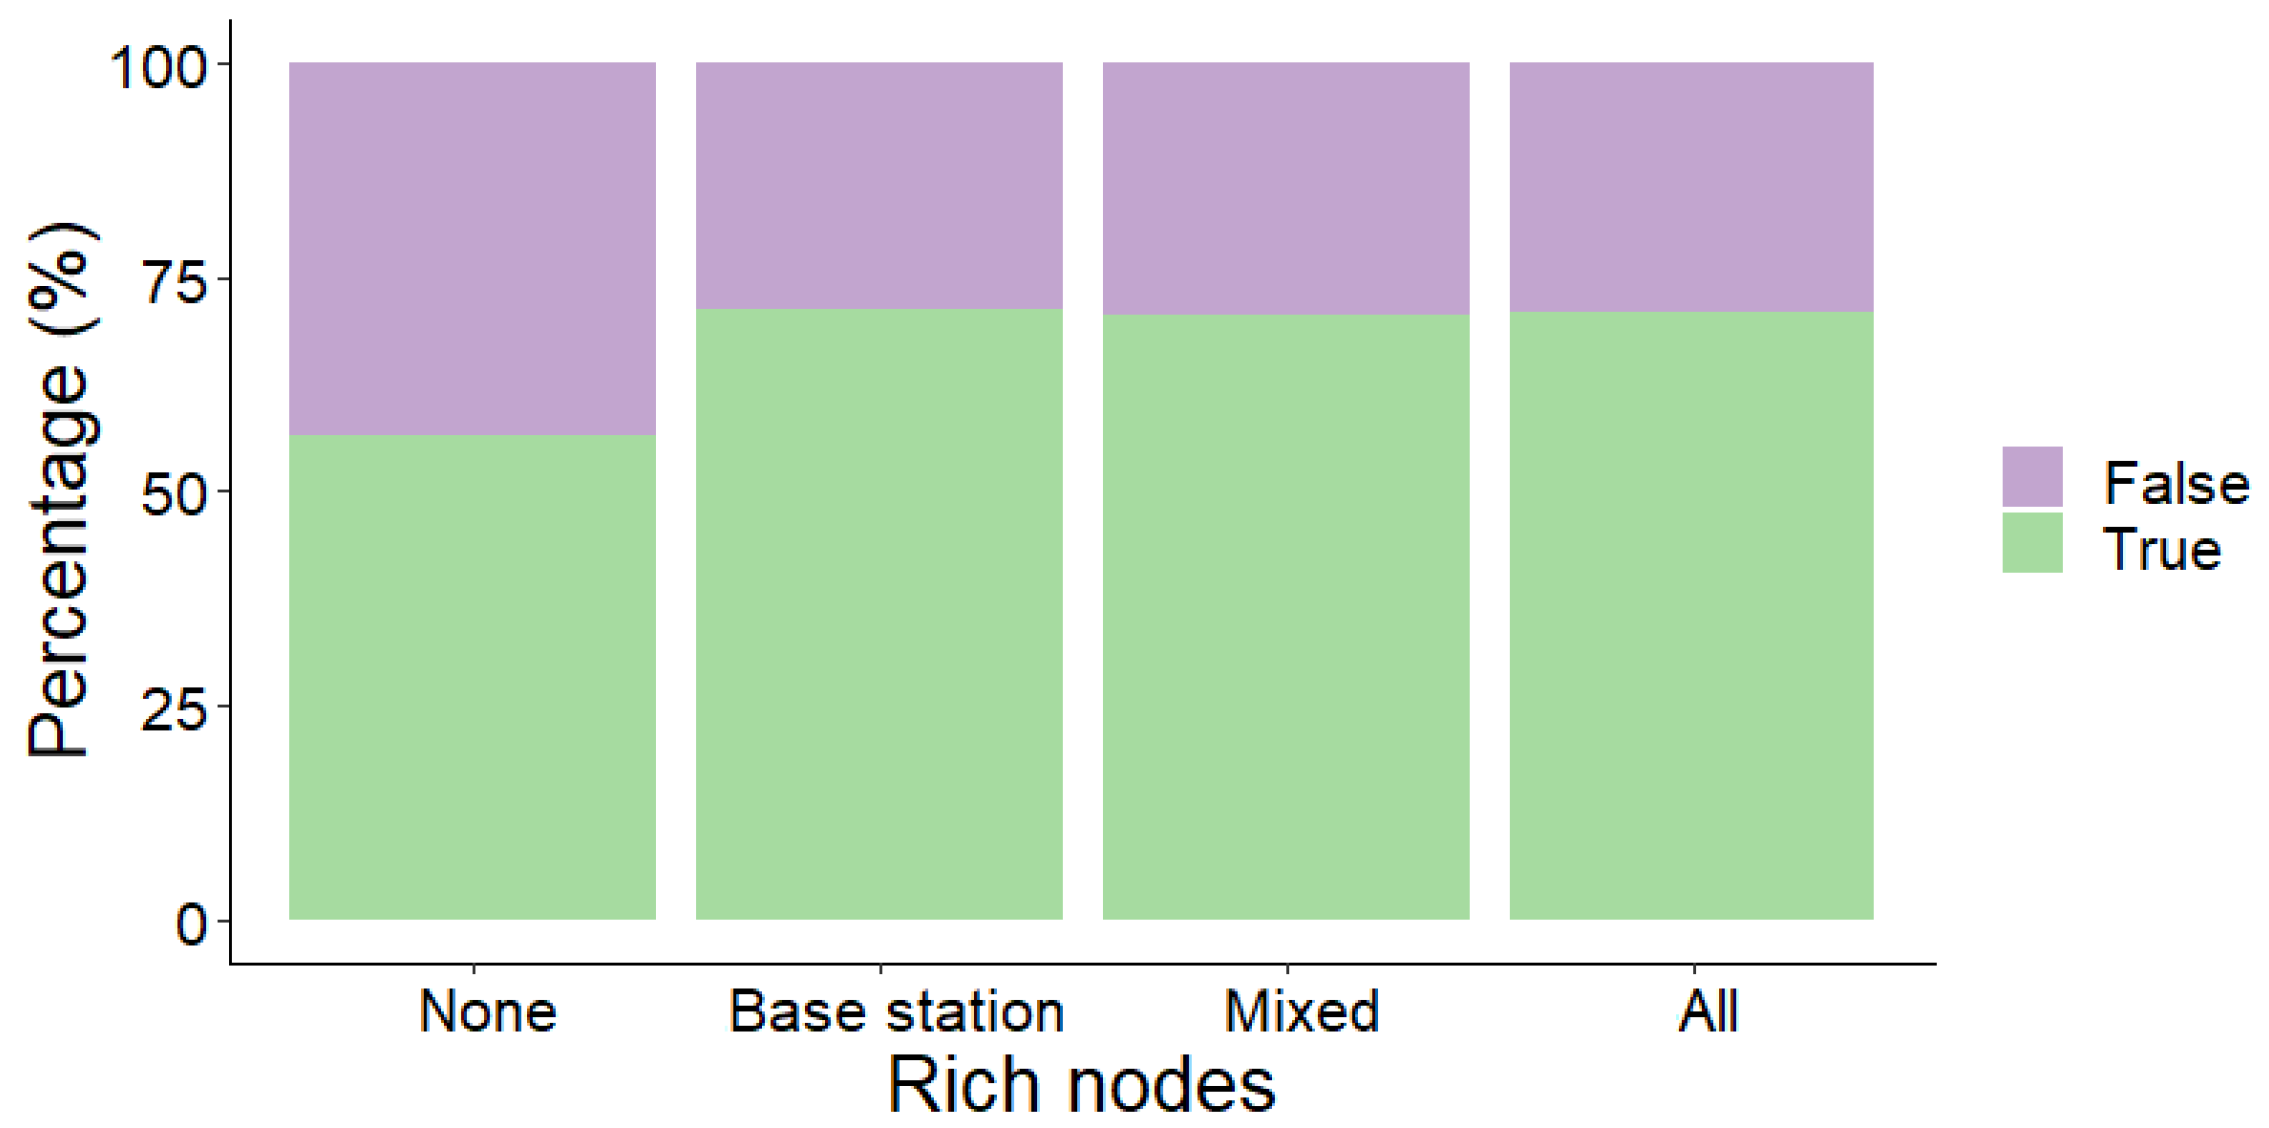
Jsan 11 00068 g015
Figure 16. Deployment distribution between usage of rich nodes and existence of goal network.
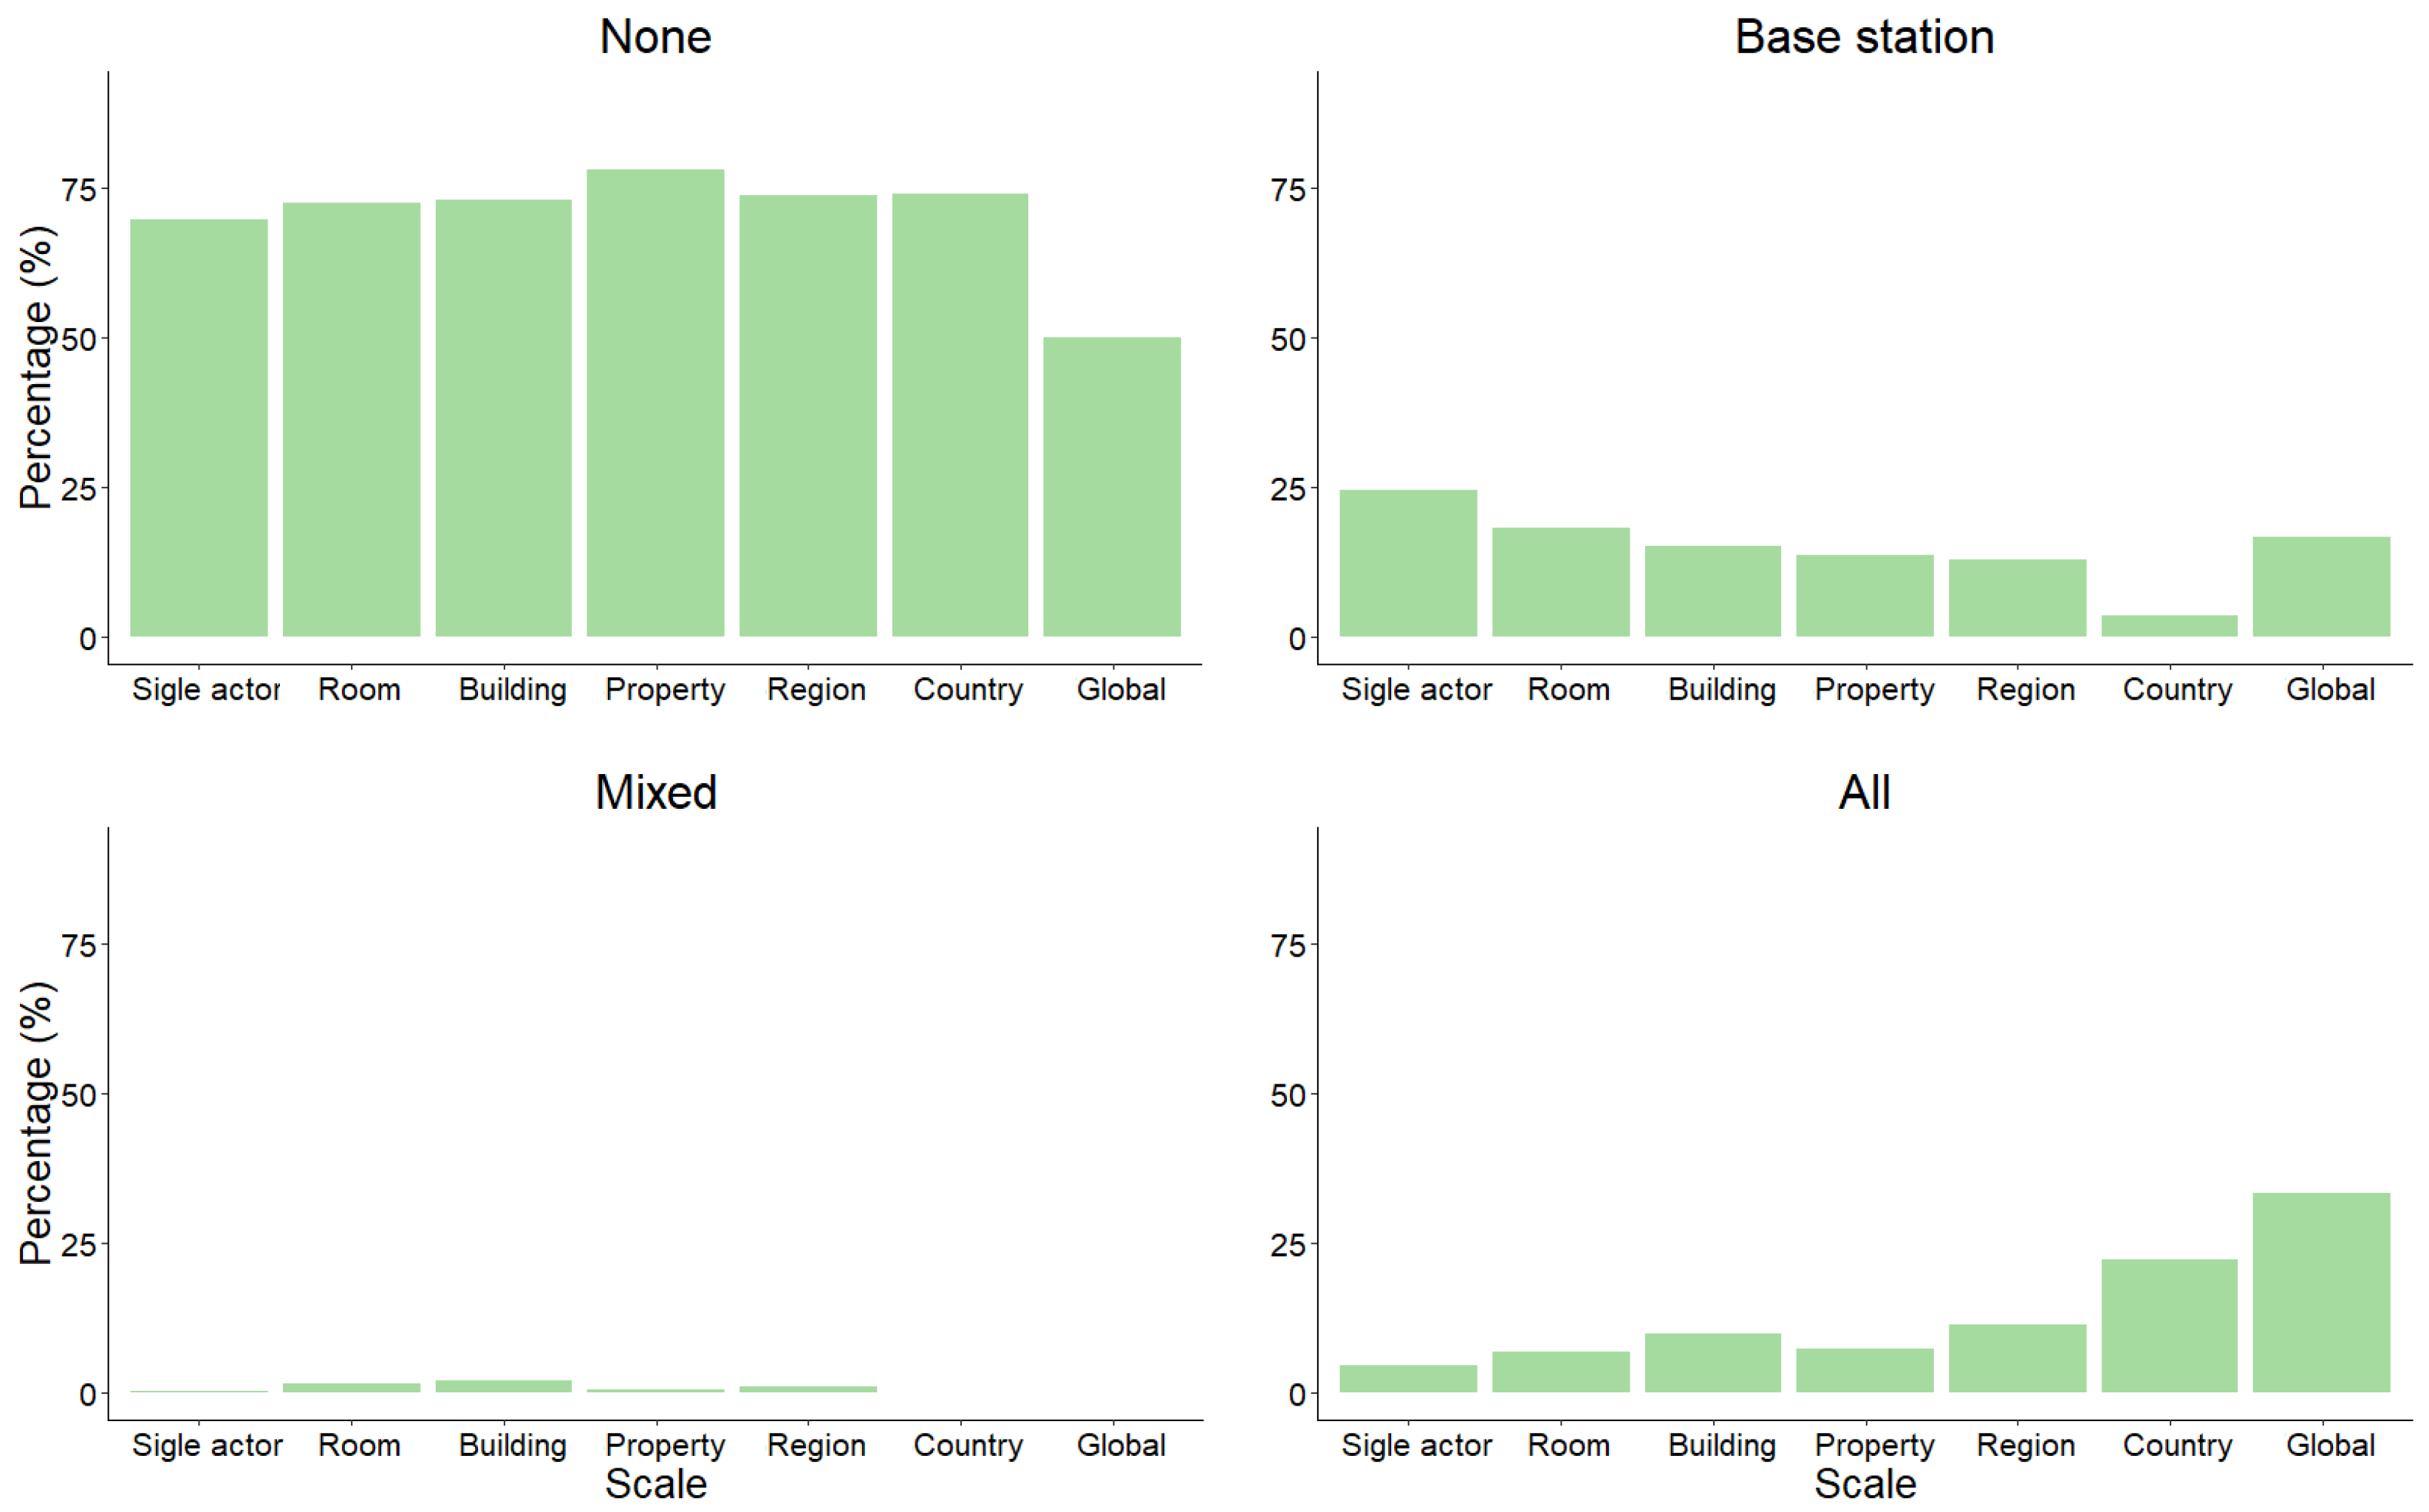
Jsan 11 00068 g016
Figure 17. Deployment scale distribution between usage of rich nodes.
Jsan 11 00068 g017
Figure 18. Deployment distribution between usage of rich nodes and deployment type.
Jsan 11 00068 g018
Figure 19. Deployment distribution between usage of rich nodes and node mobility.
Jsan 11 00068 g019
Figure 20. Deployment distribution between usage of rich nodes and deployment interactivity.
Jsan 11 00068 g020
Figure 21. Deployment distribution between usage of rich nodes and node connection type.
Jsan 11 00068 g021
Figure 22. Deployment distribution between node mobility and deployment field.
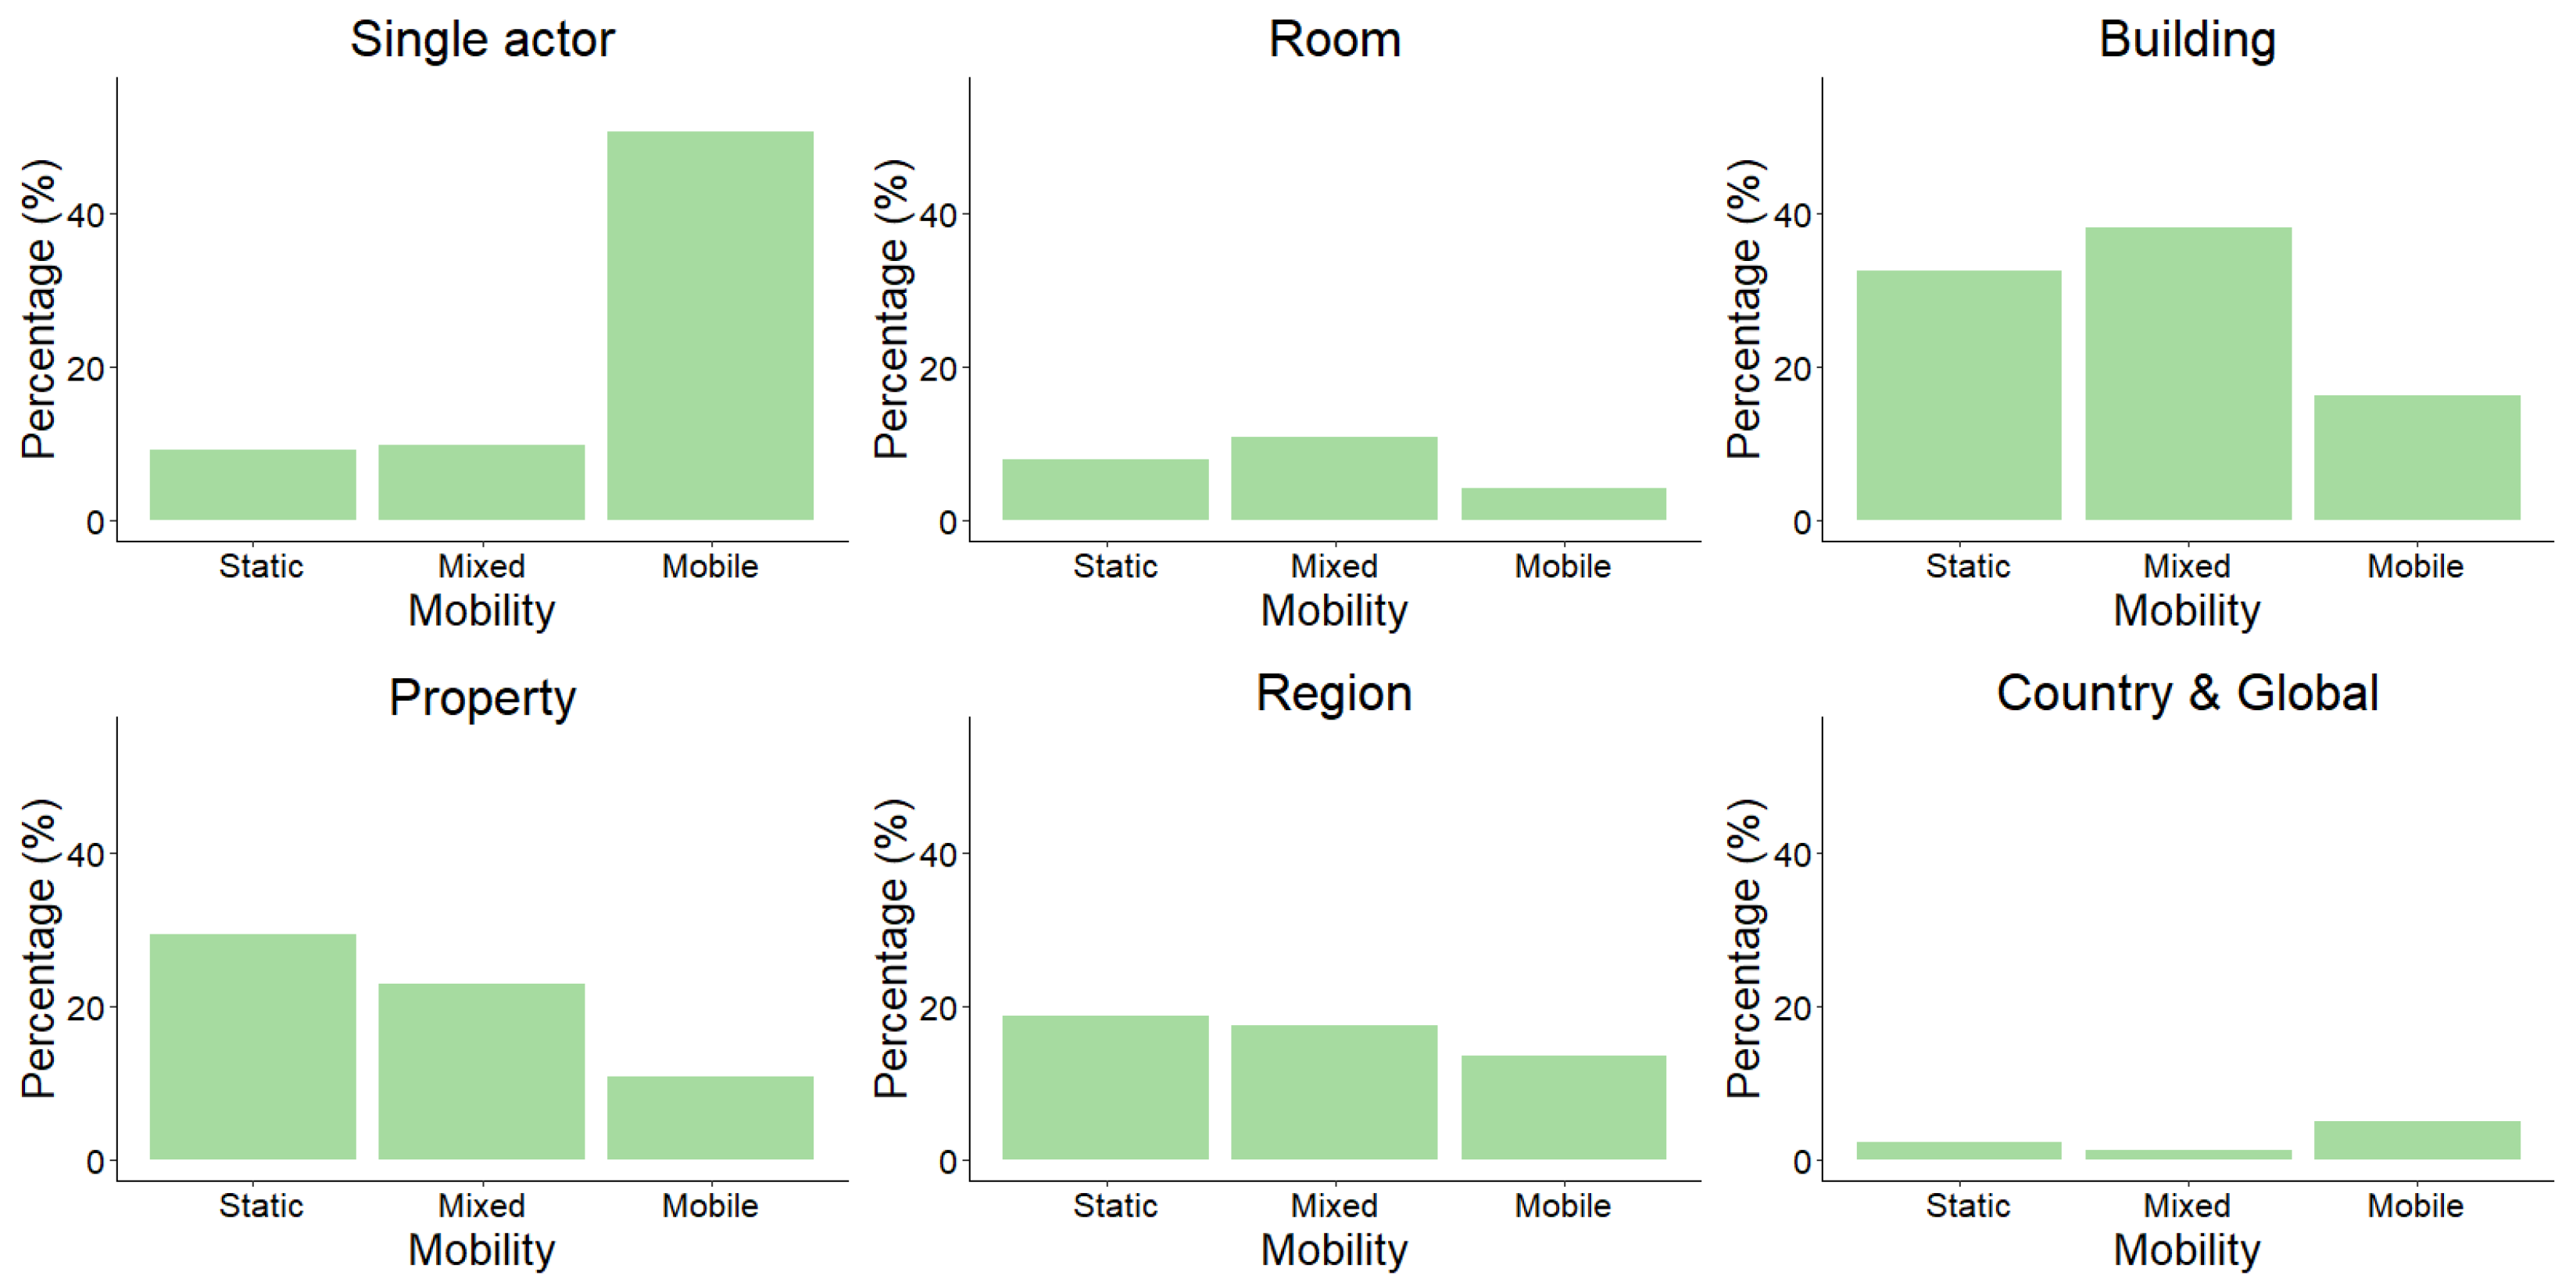
Jsan 11 00068 g022
Figure 23. Deployment distribution between node mobility and deployment scale.
Jsan 11 00068 g023
Figure 24. Deployment distribution between node mobility and deployment subject.
Jsan 11 00068 g024
Figure 25. Deployment distribution between node mobility and deployment interactivity.
Jsan 11 00068 g025
Figure 26. Deployment distribution between node mobility and existence of a goal network.
Jsan 11 00068 g026
Figure 27. Deployment distribution between node mobility and usage of rich nodes.
Jsan 11 00068 g027
Figure 28. Deployment distribution between node mobility and deployment type.
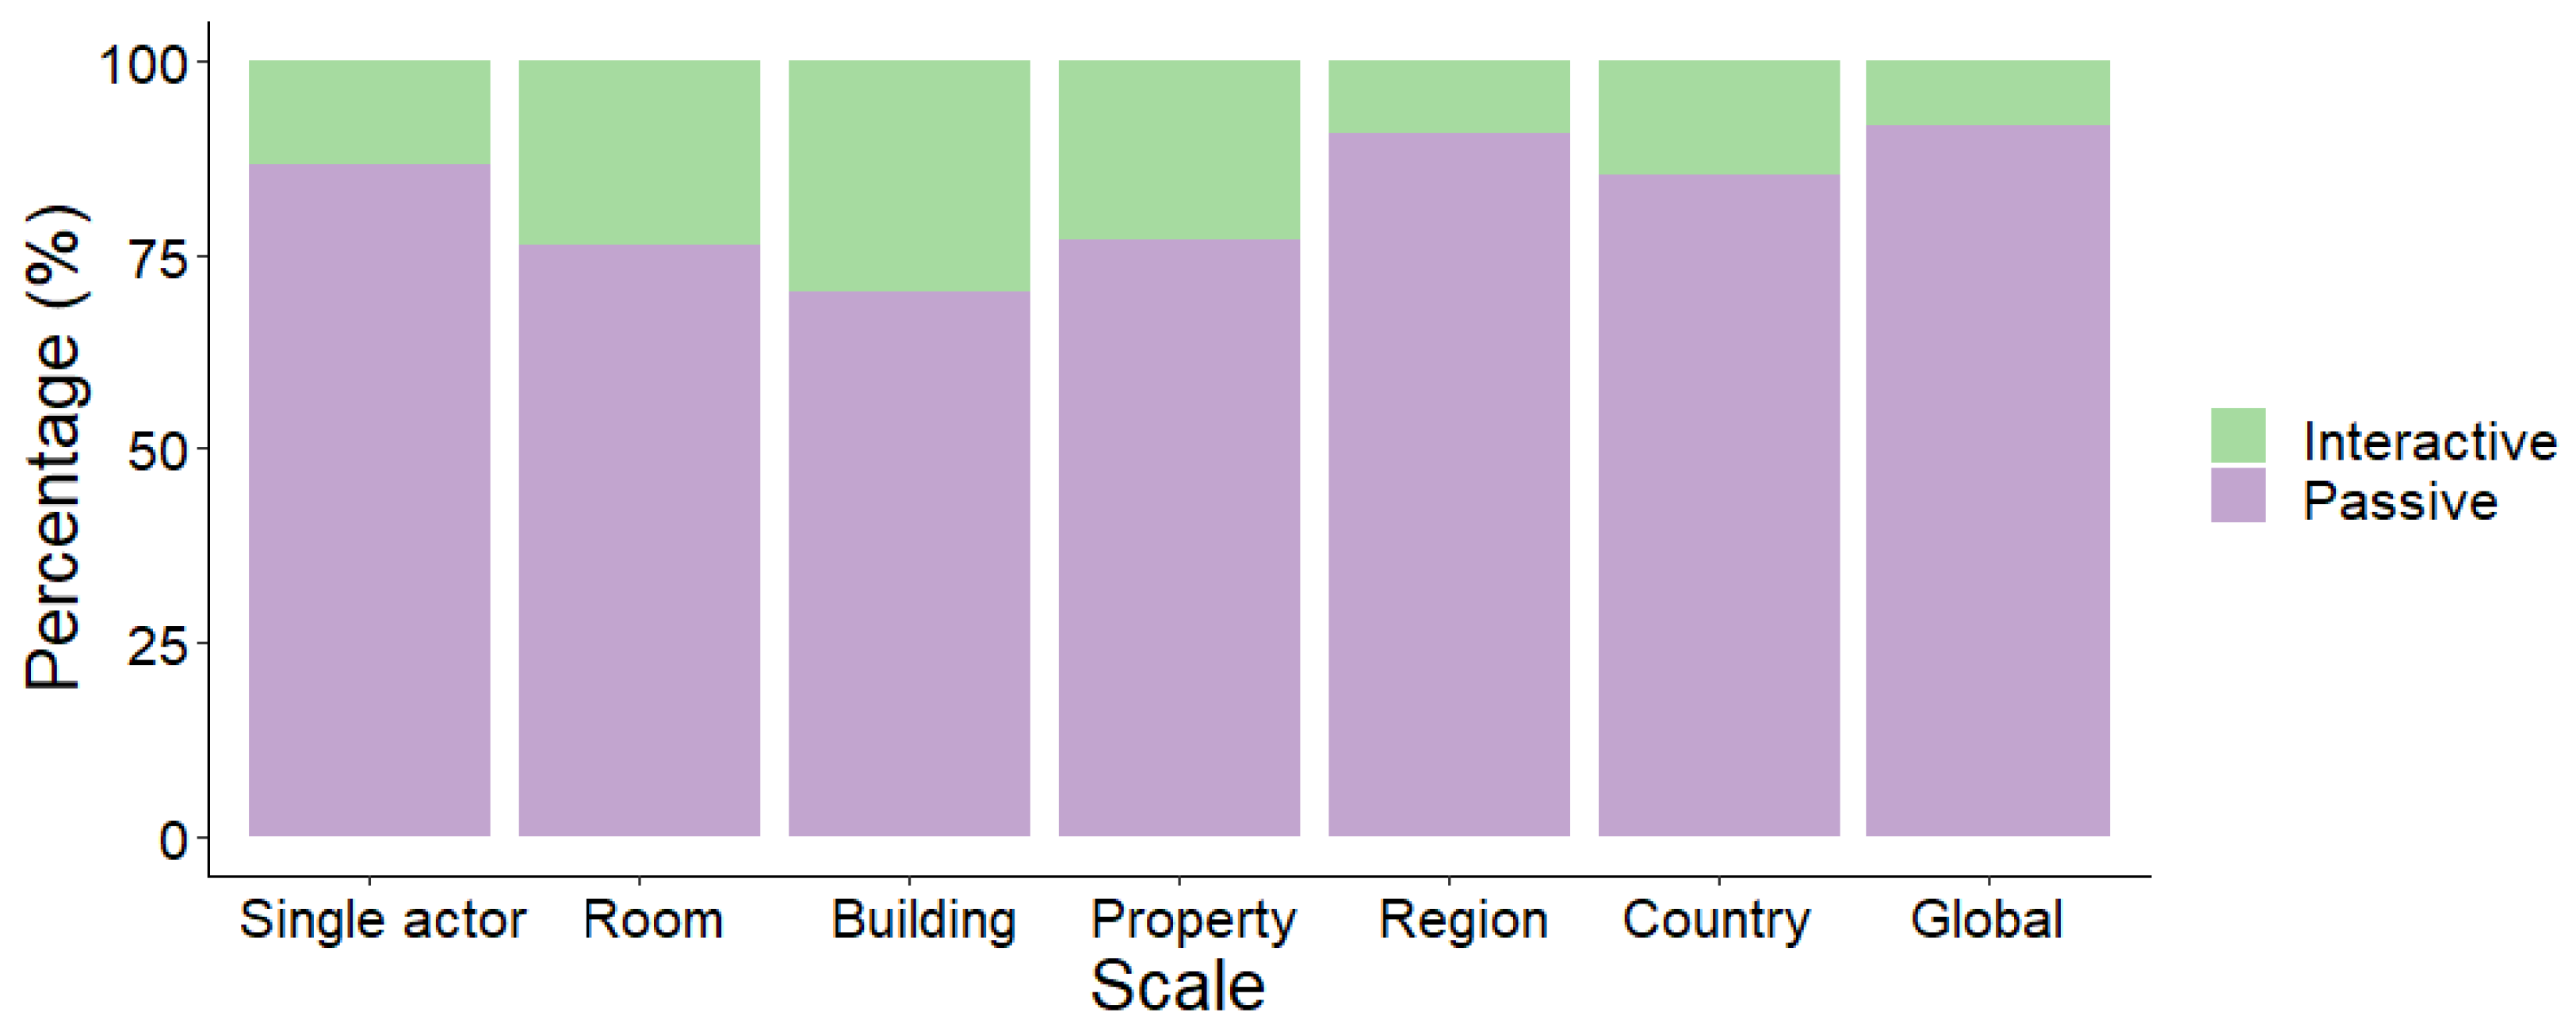
Jsan 11 00068 g028
Figure 29. Deployment distribution between deployment scale and interactivity.
Jsan 11 00068 g029
Figure 30. Deployment distribution between usage of testbed facilities and year.
Jsan 11 00068 g030
Figure 31. Deployment distribution between usage of testbed facilities and deployment type.
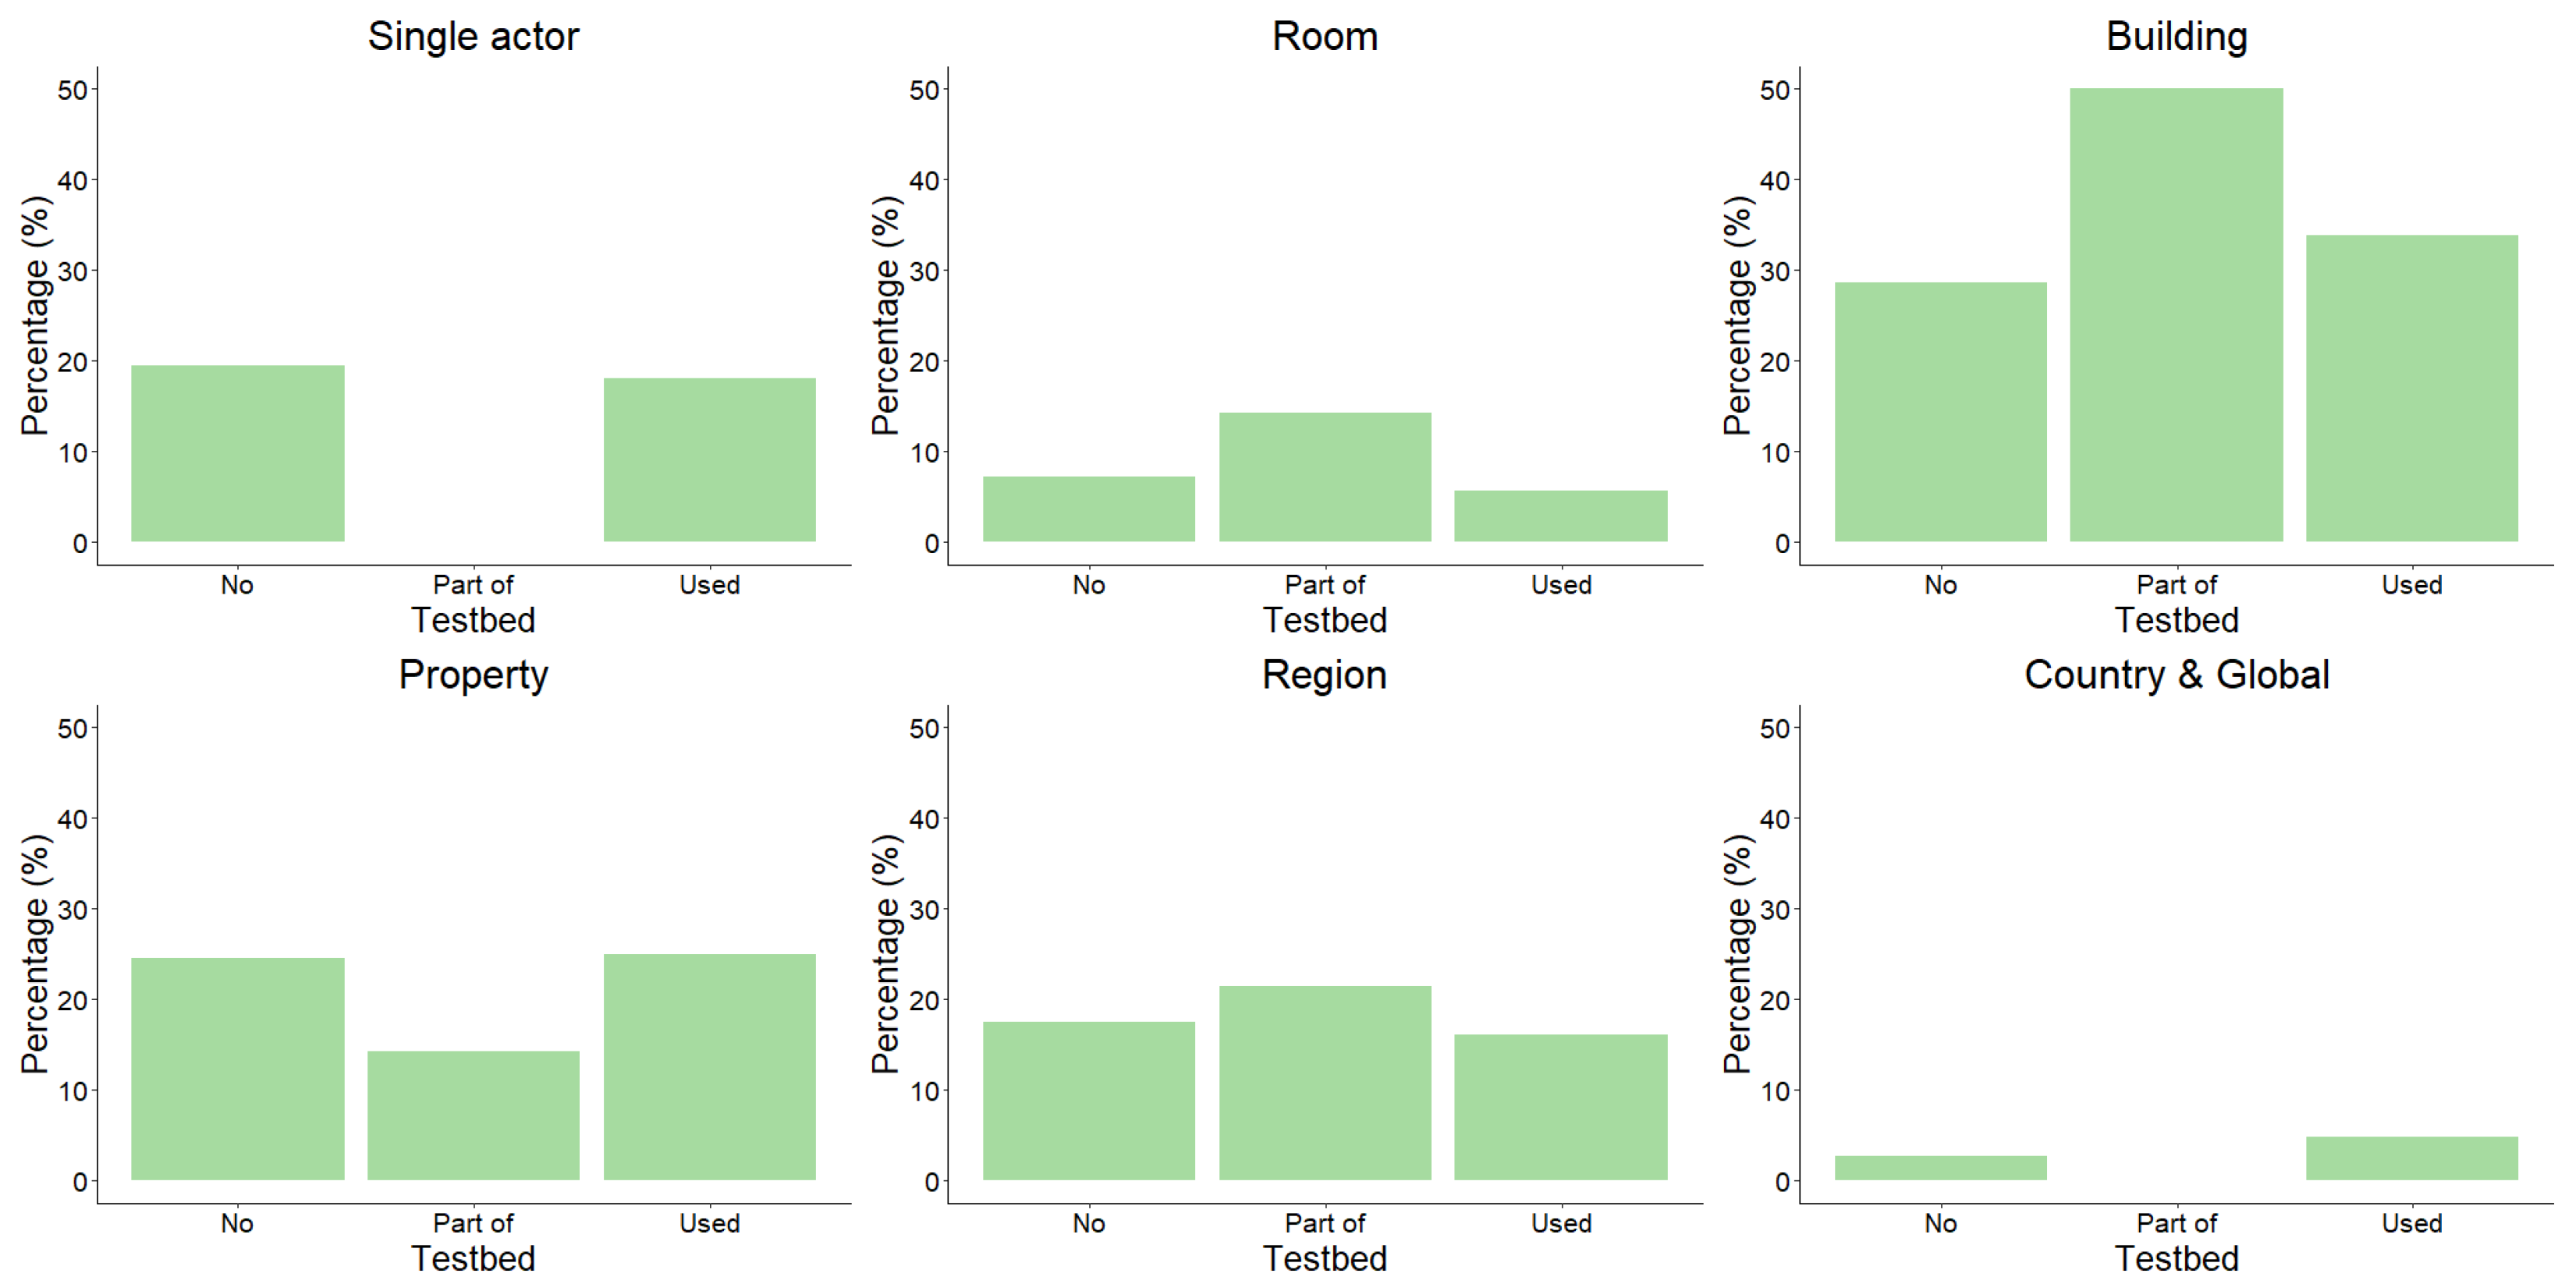
Jsan 11 00068 g031
Figure 32. Deployment distribution between usage of testbed facilities and deployment scale.
Jsan 11 00068 g032
Figure 33. Deployment distribution between usage of testbed facilities and existence of a goal network.
Jsan 11 00068 g033
Figure 34. Deployment distribution between usage of testbed facilities and deployment field. World around us: Agriculture and Environment, Technology we use: Communication, Industry, Infrastructure, Transport, Other: Education, Entertainment, Health and Wellbeing, Multiple, Research, Safety.
Jsan 11 00068 g034
Figure 35. Deployment distribution between usage of rich nodes and usage of testbed facilities.
Jsan 11 00068 g035
Figure 36. Deployment distribution between deployment subject and node connection type.
Jsan 11 00068 g036
Figure 37. Deployment distribution between node connection type and deployment type.
Jsan 11 00068 g037
Figure 38. Deployment distribution between node connection type and existence of a goal network.
Jsan 11 00068 g038
Figure 39. Deployment distribution between subject of the goal network and year.
Jsan 11 00068 g039
Figure 40. Deployment distribution between subject and scale of the goal network.
Jsan 11 00068 g040
Figure 41. Deployment distribution between scale of the goal network and year.
Jsan 11 00068 g041
Figure 42. Deployment distribution between scale and subject of the goal network.
Jsan 11 00068 g042
Table 1. Sensor network deployment distribution by year.
YearRecordsPercentage
201361920.24%
201461620.14%
201560619.81%
201659619.48%
201762220.33%
Table 2. Sensor network deployment distribution by having a goal network.
Goal NetworkRecordsPercentage
True182559.66%
False123440.34%
Table 3. Sensor network deployment distribution by scale of the goal network.
ScaleRecordsPercentage
Building53029.04%
Property44724.49%
Single actor34518.90%
Region31717.37%
Room1317.18%
Country271.48%
Global241.32%
None40.22%
Total1825
Table 4. Sensor network deployment distribution by interactivity of the goal network.
InteractivityRecordsPercentage
Passive144879.34%
Interactive37520.55%
None20.11%
Total1285
Table 5. Deployment distribution between usage of testbed facilities and technology readiness level.
TRLDeployments Using Testbed FacilityDeployments Total
TRL33 (2.9%)103
TRL426 (3.8%)682
TRL5346 (38.9%)888
TRL654 (11.3%)479
TRL744 (5.3%)826
TRL85 (6.2%)81
Total478 (15.63%)3059
Table 6. Deployments between usage of testbed facilities and node mobility.
Testbed FacilitiesStaticMixedMobileTotal
No1836 (74.3%)117 (4.7%)518 (21.0%)2471 (100%)
Part of51 (79.7%)3 (4.7%)10 (15.6%)64 (100%)
Used399 (84.7%)20 (4.2%)52 (11.1%)471 (100%)
Publisher’s Note: MDPI stays neutral with regard to jurisdictional claims in published maps and institutional affiliations.

