Article

Inhibitory Mechanism of Trichoderma virens ZT05 on Rhizoctonia solani

1
College of Forestry, Northeast Forestry University, Harbin 150040, China
2
Institute of Forestry Protection, Heilongjiang Forestry Academy, Harbin 150040, China
3
Beijing DaXing District Forestry Workstation, No. 17 Administrative Street, Huangcun Town, Beijing 102600, China
*
Author to whom correspondence should be addressed.
Plants 2020, 9(7), 912; https://doi.org/10.3390/plants9070912
Submission received: 25 June 2020 / Revised: 15 July 2020 / Accepted: 17 July 2020 / Published: 19 July 2020
(This article belongs to the Special Issue Mechanisms of Resistance to Plant Diseases)

Abstract

:
Trichoderma is a filamentous fungus that is widely distributed in nature. As a biological control agent of agricultural pests, Trichoderma species have been widely studied in recent years. This study aimed to understand the inhibitory mechanism of Trichoderma virens ZT05 on Rhizoctonia solani through the side-by-side culture of T. virens ZT05 and R. solani. To this end, we investigated the effect of volatile and nonvolatile metabolites of T. virens ZT05 on the mycelium growth and enzyme activity of R. solani and analyzed transcriptome data collected from side-by-side culture. T. virens ZT05 has a significant antagonistic effect against R. solani. The mycelium of T. virens ZT05 spirally wraps around and penetrates the mycelium of R. solani and inhibits the growth of R. solani. The volatile and nonvolatile metabolites of T. virens ZT05 have significant inhibitory effects on the growth of R. solani. The nonvolatile metabolites of T. virens ZT05 significantly affect the mycelium proteins of R. solani, including catalase (CAT), superoxide dismutase (SOD), peroxidase (POD), selenium-dependent glutathione peroxidase (GSH-Px), soluble proteins, and malondialdehyde (MDA). Twenty genes associated with hyperparasitism, including extracellular proteases, oligopeptide transporters, G-protein coupled receptors (GPCRs), chitinases, glucanases, and proteases were found to be upregulated during the antagonistic process between T. virens ZT05 and R. solani. Thirty genes related to antibiosis function, including tetracycline resistance proteins, reductases, the heat shock response, the oxidative stress response, ATP-binding cassette (ABC) efflux transporters, and multidrug resistance transporters, were found to be upregulated during the side-by-side culture of T. virens ZT05 and R. solani. T. virens ZT05 has a significant inhibitory effect on R. solani, and its mechanism of action is associated with hyperparasitism and antibiosis.

1. Introduction

The damping-off disease of Mongolian pine (Pinus sylvestris var. mongolica) is affected by pathogenic fungi, including Fusarium oxysporum, Rhizoctonia solani J.G. Kühn, and Pythium, among which R. solani J.G. Kühn is the major pathogenic factor. The damping-off disease of Pinus sylvestris var. mongolica mostly occurs during years 1–3 of seedling caused by R. solani J.G. Kühn infection, resulting in a death rate of 60% or no production [1,2,3]. Chemical controls have been applied during nursery to reduce fungal infections because of their effectiveness, convenience, and economic benefits. However, the overuse of chemicals disrupts the soil microbial balance leading to chemical resistance in pathogens and environmental pollution [4,5,6]. Biological controls use beneficial microorganisms and microbial metabolites to prevent plant diseases. Mechanisms of biological controls in the inhibition of pathogen growth include microbial competition, antibiosis, hyperparasitism, cross-protection, and induced resistance. Biological controls are beneficial to the environment with no pollution or residue and avoid killing natural enemies of pathogens. Biological controls reduce drug resistance in pathogens and are conducive to human and animal safety. Biological controls not only protect plant growth but also effectively treat plant diseases resulting in increased growth and harvest [7,8,9]. Biological controls focus on the virtuous cycle of the ecosystem and protect the environment through the application of biofungi, including Trichoderma, Chaetomium, yeast strains, Paecilomyces lilacinus, Verticillium chlamydosporium, and mycorrhizal fungi. The inhibitory effect of Trichoderma species on plant pathogens has been widely studied and applied [10,11,12,13].
Trichoderma species belong to Deuteromycotina, Hyphomycetes, and Hyphomyceteales. They have wide adaptability and survivability and are widespread [14]. The biological control mechanisms of Trichoderma species include competition for limited nutrients and living space [15,16], hyperparasite infection on plant pathogens [17], inhibitory effect on the growth of plant pathogens [18,19], improvement of plant growth, and the induction of plant resistance to pathogens [20]. Trichoderma species not only grow and reproduce rapidly but also use limited nutrients and rapidly adapt to limited living space. They advantageously inhibit the growth of pathogens via interaction with pathogenic fungi. Previously, Howell et al. [21] showed that Trichoderma occupied culture space quickly under suitable growth conditions and gradually covered the surface of the agar plate to inhibit the growth of the pathogenic fungi R. solani. One of the important methods used by Trichoderma species to kill pathogens is through hyperparasite infections [22,23,24]. During hyperparasite infection, gene expression of proteases associated with host recognition, oligopeptide transporters, and GPCRs was significantly upregulated, which played a vital role in the identification of pathogens and hyperparasite signaling [25,26,27]. The expression of genes related to hydrolase secretion was significantly upregulated during the hyperparasite infection of Trichoderma within hosts. By knocking out these genes, the hyperparasitic ability of Trichoderma, within hosts, was reduced [28,29,30,31]. Barbara et al. showed that the knockout of T. virens gene tgaA on the G protein alpha subunit reduced the hyperparasitic ability of Trichoderma within hosts, while the expression of chitinase genes ech42 and nag1 was significantly reduced [32]. In addition, the knockout of the MPAK gene reduced the hyperparasitic ability of T. atroviride [33]. Antibiosis is the main mechanism of Trichoderma species in biological controls. During the antagonistic interaction between Trichoderma and its hosts, Trichoderma secretes volatile and nonvolatile metabolites to inhibit the growth of pathogenic microorganisms [34,35]. Additionally, Trichoderma degrades toxic substances secreted by pathogenic microorganisms through ABC transporter proteins, heat shock proteins, etc., thereby reducing the inhibitory effect of pathogenic microorganisms on Trichoderma [36,37,38,39].
Transcriptome, also known as “expression profile”, refers to all mRNAs that are involved in protein translation [40,41,42]. RNA-seq is the second generation high-throughput transcriptome sequencing, which has been widely used in recent years. RNA-seq allows high sequencing throughput and covers a wide detection range. It is highly sensitive and can detect new genes. RNA-seq identifies genes that are significantly differentially expressed between samples. The main biological functions and metabolic pathways of these differentially expressed genes are speculated through annotation and gene enrichment analysis. Key functional genes are also identified during gene analysis [43,44,45,46]. Transcriptomics has become an effective method to investigate the biological control of Trichoderma, along with sequencing multiple Trichoderma genomes [47,48]. The study of the molecular mechanism of Trichoderma for inhibiting pathogenic organisms helps to improve the biological control efficiency of Trichoderma and to reduce the economic losses in agriculture and forestry [49,50]. In this paper, T. virens ZT05 strain was studied, which was isolated from the rhizosphere soil of Pinus sylvestris var. mongolica in Zhanggutai (Liaoning Province, China). T. virens ZT05 was cultured side-by-side with R. solani and observed under electron microscopy. The effect of both volatile and nonvolatile metabolites from Trichoderma on the mycelium growth and enzyme activity of R. solani was investigated. The inhibitory effect of T. virens ZT05 on R. solani was discussed based on the results of transcriptome sequencing analysis of the side-by-side cultured T. virens ZT05 and R. solani.

2. Materials and Methods

2.1. Strain and Culture Conditions

Trichoderma virens ZT05 was isolated from the rhizosphere soil of the P. sylvestris var. mongolica forest of the Zhanggutai Experimental Forest Farm of Liaoning Province (42°43′–42°51″ N, 121°53′–122°22″ E), China. Rhizoctonia solani isolated from the rhizosphere soil of the P. sylvestris var. mongolica seedling nursery of the Harbin Weihai forestry bureau nursery of Heilongjiang Province (Strains Trichoderma virens ZT05, Rhizoctonia solani stored in the forest microbiology laboratory of college of forestry, Northeast Forestry University). These two strains were grown on a PDA medium (potato extract 12 g/L, dextrose 20 g/L, agar 14 g/L; Haibo Biotechnology, China) at pH 6.0.

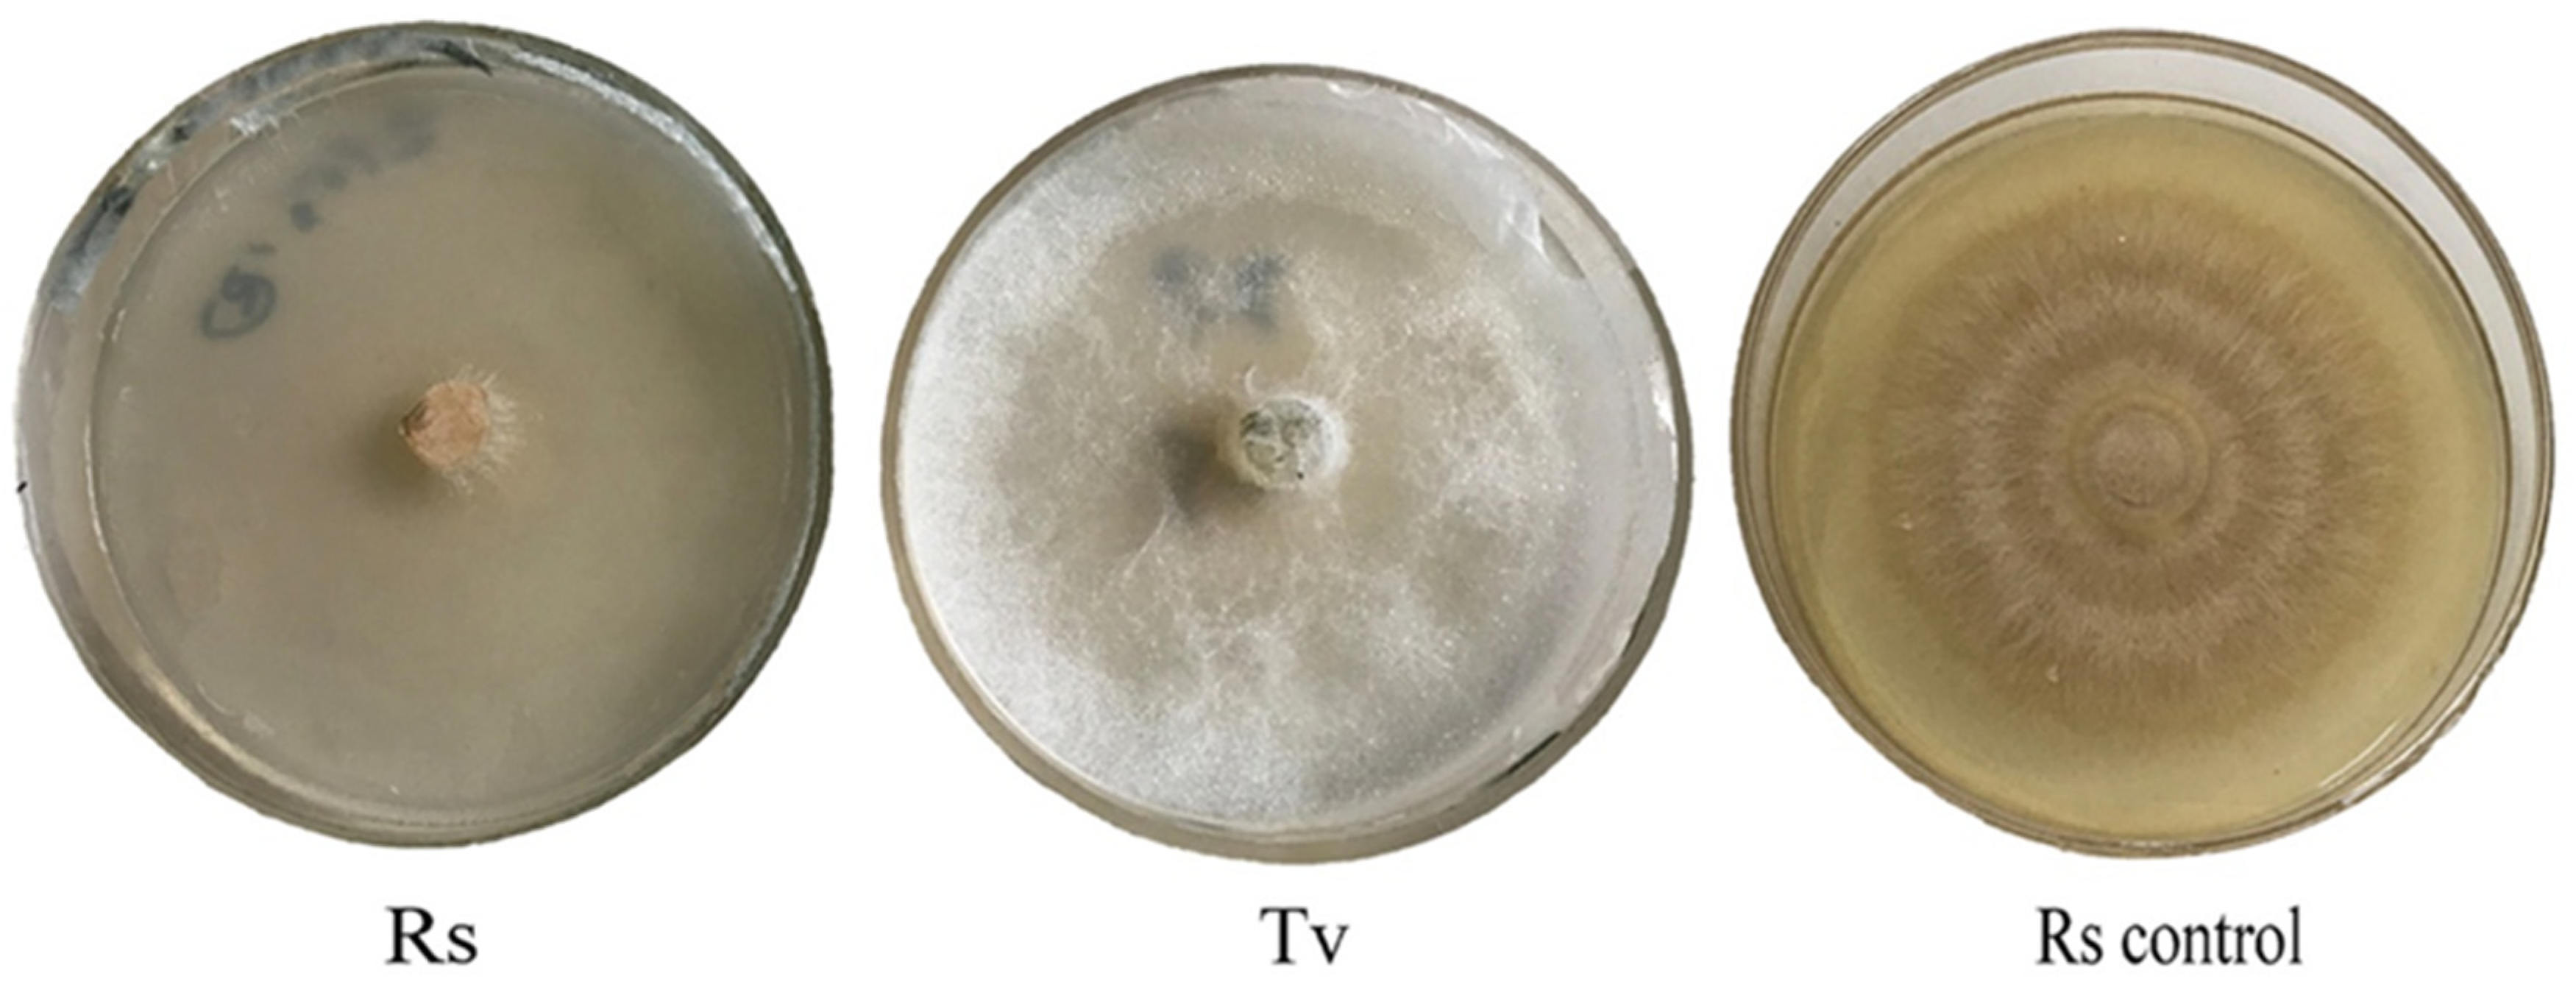
2.2. Antagonistic Effect of T. virens ZT05 against R. solani

T. virens ZT05 was cultured side-by-side with R. solani [51,52,53]. In the experimental group, agar plugs (diameter 10 mm) of T. virens strain ZT05 and R. solani (both cultured for three days) were inoculated on a potato dextrose agar (PDA) plate at 50 mm distance from each other. In the control group, T. virens strain ZT05 and R. solani were grown alone in individual plates. The plates were incubated at 25 °C. The experiments were repeated three times. Pathogen diameters (∅) were measured every 8 h. After 48 h, the inhibitory rate and relative inhibitory rate were calculated and plotted. The antagonistic curve was evaluated, and the competition coefficient was calculated [53,54]. Inhibitory rate and relative inhibitory rate were calculated as:
Inhibitory rate (%) = ((∅ control group − ∅ experimental group)/∅ control group) × 100%
Relative inhibitory rate = Inhibitory rate of R. solani/Inhibitory rate of T. virens
Electron microscopy (Hitachi Japan Ltd., Quantax70) was used to observe the side-by-side culture of T. virens ZT05 and R. solani. The junction area of the two pathogens was cut using a sterile punch with a diameter of 10 mm. The excess area was removed, and the junction cut was placed in a 2% glutaraldehyde solution at 4 °C for 1 h. The junction cut was washed several times with 0.1 mol/L phosphate buffer (PBS, pH 7.0). Ethanol solutions at concentrations of 30%, 50%, 70%, 80%, and 90% (v/v) were used for dehydration (30 min per concentration). The dehydrated samples were placed in a freeze dryer (Freeze Mobile 24, Vertis Company, Inc., Gardiner, NY, USA) for freeze-drying, and then placed on a sample stage for gold spray. The samples were observed using a scanning electron microscope (SEM) [55,56,57].

2.3. Inhibitory Effect of the Metabolites of T. virens ZT05 on R. solani

2.3.1. Inhibitory Effect of Nonvolatile Metabolites of T. virens ZT05 on R. solani

For the preparation of ethyl acetate extract, T. virens ZT05 was inoculated onto a PDA plate for three days, and then cut using a sterile punch with a diameter of 10 mm. Three cuts were made and placed in a 200 mL PD media and shaken at 25 °C for 150 rpm. After seven days, the culture media was filtered through eight layers of gauze. The filtrate and ethyl acetate were extracted at a volume ratio of 1:3 for two days, and then the inorganic phase was removed. The organic phase was removed using a vacuum rotary evaporator. The extract was dissolved in a 1/10 volume solution mixed of the filtrate and 10% Tween 80 solution.
To measure the inhibition effect, mycelium growth inhibition was measured [58,59]. The extract of T. virens ZT05 from the above was added into PDA medium and cultured with shaking to a final concentration of 20%. The 20% culture mix was poured onto plates and was inoculated with R. solani. As a control, a PDA plate without T. virens ZT05 metabolite extract was used. The plates were placed at 25 °C. The diameters of the colonies were measured every 8 h using the diagonal cross method. The inhibitory effect of nonvolatile metabolites of T. virens on R. solani was calculated and plotted. Each experiment was repeated three times. Inhibition rate of pathogens was calculated as:
Inhibition rate of pathogens (%) = ((Control net growth-treatment net growth)/Control net growth) × 100%

2.3.2. Effects of Nonvolatile Metabolites of T. virens ZT05 on the Stress Resistance of R. solani

R. solani was inoculated onto a PDA plate for three days, and then cut using a sterile punch with a diameter of 10 mm. Three cuts were made and placed in 200 mL PD media and shaken at 25 °C for 150 rpm. After seven days, the culture media was filtered through eight layers of gauze, and then washed with sterile water several times to remove the culture medium on the mycelia. The R. solani extract was placed on sterile filter paper for water absorption, and then soaked in ethyl acetate extract prepared as described above at a concentration of 20%. As a control, 20% Tween 80 solution was used without T. virens metabolites. The soaking process was designed for 3, 6, 9, 12, 24, and 48 h. Then, the mycelia were removed and dried using sterile filter paper. The mycelia were ground with liquid nitrogen for tissue sample preparation. The protein expression of CAT, SOD, POD, GSH-Px, MDA, and soluble proteins were detected using a Protein Detection Kit (Jiancheng, Nanjing, China).

2.3.3. Inhibitory Effect of Volatile Metabolites of T. virens ZT05 on R. solani

The up-and-down culture method was used [60]. T. virens ZT05 was inoculated onto a PDA plate for three days, and then the coverslip of the plate was replaced by a coverslip inoculated with R. solani. As a control, an empty PDA plate was topped by a cover inoculated with R. solani. The plates were incubated at 25 °C and observed daily. After five days, the diameter of R. solani was measured by a diagonal cross method. The inhibitory effect of volatile metabolites of T. virens on R. solani was calculated. Each experiment was repeated three times. The inhibition rate of pathogens was calculated as:
Inhibition rate of pathogens (%) = ((∅ Control colony − ∅ treatment colony)/∅ Control colony) × 100%

2.4. Transcriptome Sequencing Analysis of the Side-by-Side Cultured T. virens and R. solani

2.4.1. Mycelium Collection and Total RNA Extraction

T. virens and R. solani (cultured for three days) were cut using a sterile punch to a diameter of 10 mm and were inoculated onto a PDA plate with a gap of 40 mm. As a control, a plate was only inoculated with T. virens. All plates were cultured at 25 °C in an incubator. Each experiment was repeated three times. After the mycelia of T. virens and R. solani formed an antagonistic line together, the mycelia were collected, shown as R. solani and T. virens ZT05 (Rs-Tv) and Tv.
Total RNAs were extracted from the mycelium tissue using a rapid plant RNA extraction kit Plant RNA Purification Reagent (Aidlab, Beijing, China) according the manufacturer’s instructions (Invitrogen). Concentration and purity of the extracted RNA were tested using a Nanodrop 2000 spectrophotometer. RNA integrity was checked through agarose gel electrophoresis, and the RNA integrity number (RIN) values were measured by an Agilent 2100 analyzer. The results satisfied the requirement that the total RNA be more than 5 g, the concentration more than 200 ng/L, and the OD 260/280 between 1.8 and 2.2 [61,62].

2.4.2. Library Preparation and Illumina Sequencing

The cDNA was shotgun sequenced (101-bp paired-end reads) with a Illumina HiSeq 4000 instrument (Illumina, San Diego, CA, USA) using a customer sequencing service (Majorbio Co., Ltd., Shanghai, China). The sequencing reads were statistically analyzed, and quality assessed by FASTQC (http://www.bioinformatics.babraham.ac.uk/pro jects/fastqc/), and then processed by Trimmomatic to remove adapter sequences and low-quality reads with average quality scores lower than 15. Reads that were less than 50 base pairs (bp) after trimming were also excluded from further genome mapping [63,64].
The raw paired end reads were trimmed, and quality controlled by SeqPrep (https://github.com/jstjohn/SeqPrep) and Sickle (https://github.com/najoshi/sickle) with default parameters. Then, clean reads were separately aligned to reference genome with orientation mode using TopHat (http://tophat.cbcb.umd.edu/, version 2.0.0) [65] software. The mapping criteria of bowtie was as follows: sequencing reads should be uniquely matched to the genome allowing up to two mismatches, without insertions or deletions. Then, the region of gene was expanded following depths of sites and the operon was obtained. In addition, the whole genome was split into multiple 15 kbp windows that shared 5 kbp. New transcribed regions were defined as more than two consecutive windows without overlapped region of gene, where at least two reads were mapped per window in the same orientation. We compered the readings of the samples to the Trichoderma_virens (TRIVI v2.0, https://www.ncbi.nlm.nih.gov/genome/?term=txid29875[orgn]), reference genomic sequence using the TopHat software (http://tophat.cbcb.umd.edu/version2.0.0).

2.4.3. Differential Expression Analysis and Function Gene Selection

To identify DEGs (differential expression genes) between two different samples, the expression level of each transcript was calculated according to the fragments per kilobase of exon per million mapped reads (FRKM) method. RSEM (http://deweylab.biostat.wisc.edu/rsem/) [66] was used to quantify gene abundances. R statistical package software EdgeR (Empirical analysis of Digital Gene Expression in R, http://www.bioconductor.org/packages/2.12/bioc/html/edgeR.html) [67] was utilized for differential expression analysis (|log2FC| ≥ 1, p-adjust < 0.05). In addition, functional enrichment analysis Swiss-Prot were performed to identify which DEGs were significantly enriched in Swiss-Prot terms.

2.5. Validation of Quantitative qRT-PCR of the Transcriptome Data

In order to verify the reliability of the transcriptome sequencing, eight upregulated genes were selected for PCR tests, including TRIVIDRAFT_56363, TRIVIDRAFT_178019, TRIVIDRAFT_213202, TRIVIDRAFT_72072, TRIVIDRAFT_226194, TRIVIDRAFT_63956, TRIVIDRAFT_61106, and TRIVIDRAFT_80583. Each gene was detected three times. The primers of the selected genes are described in Table 1. Total RNAs were extracted from the mycelium tissue using a rapid plant RNA extraction kit Plant RNA Purification Reagent (Aidlab, Beijing, China) according to the manufacturer’s instructions (Invitrogen, Carlsbad, CA, USA). The cDNA synthesis was performed following instructions provided in the RevertAid First Strand cDNA Synthesis Kit (Thermo Scientific, Waltham, MA, USA). Each reaction for the cDNA synthesis included 5× qRT SuperMix II 4 µL, the template RNA (total RNA): 1 µg, and RNase Free ddH2O 16 µL. Reactions were done at 50 °C 15 min, followed by 80 °C, for 2 min [68]. The Trans Start® Top Green qPCR SuperMix Kit was used for the qRT-PCR reactions. Each reaction for the qPCR reaction included ChamQ SYBR Color qPCR Master Mix 2 × 10 µL, Primer F 5 µM 0.4 µL, Primer R 5 µM 0.4 µL, Template (DNA) 2 µL, and ddH2O 7.2 µL [69].

2.6. Data Analysis

Data were analyzed using Excel 2017. Origin 2019b (Origin Lab Corporation, MA, United States) was used for graph plotting. Fluorescence quantitative data were analyzed using the 2 – (∆∆Ct) method [70]. The sequencing data were deposited in the NCBI/SRA database (Bioproject: PRJNA526386; Sequence Read Archive Database under accession number SRR8706306–SRR8706311).

3. Results

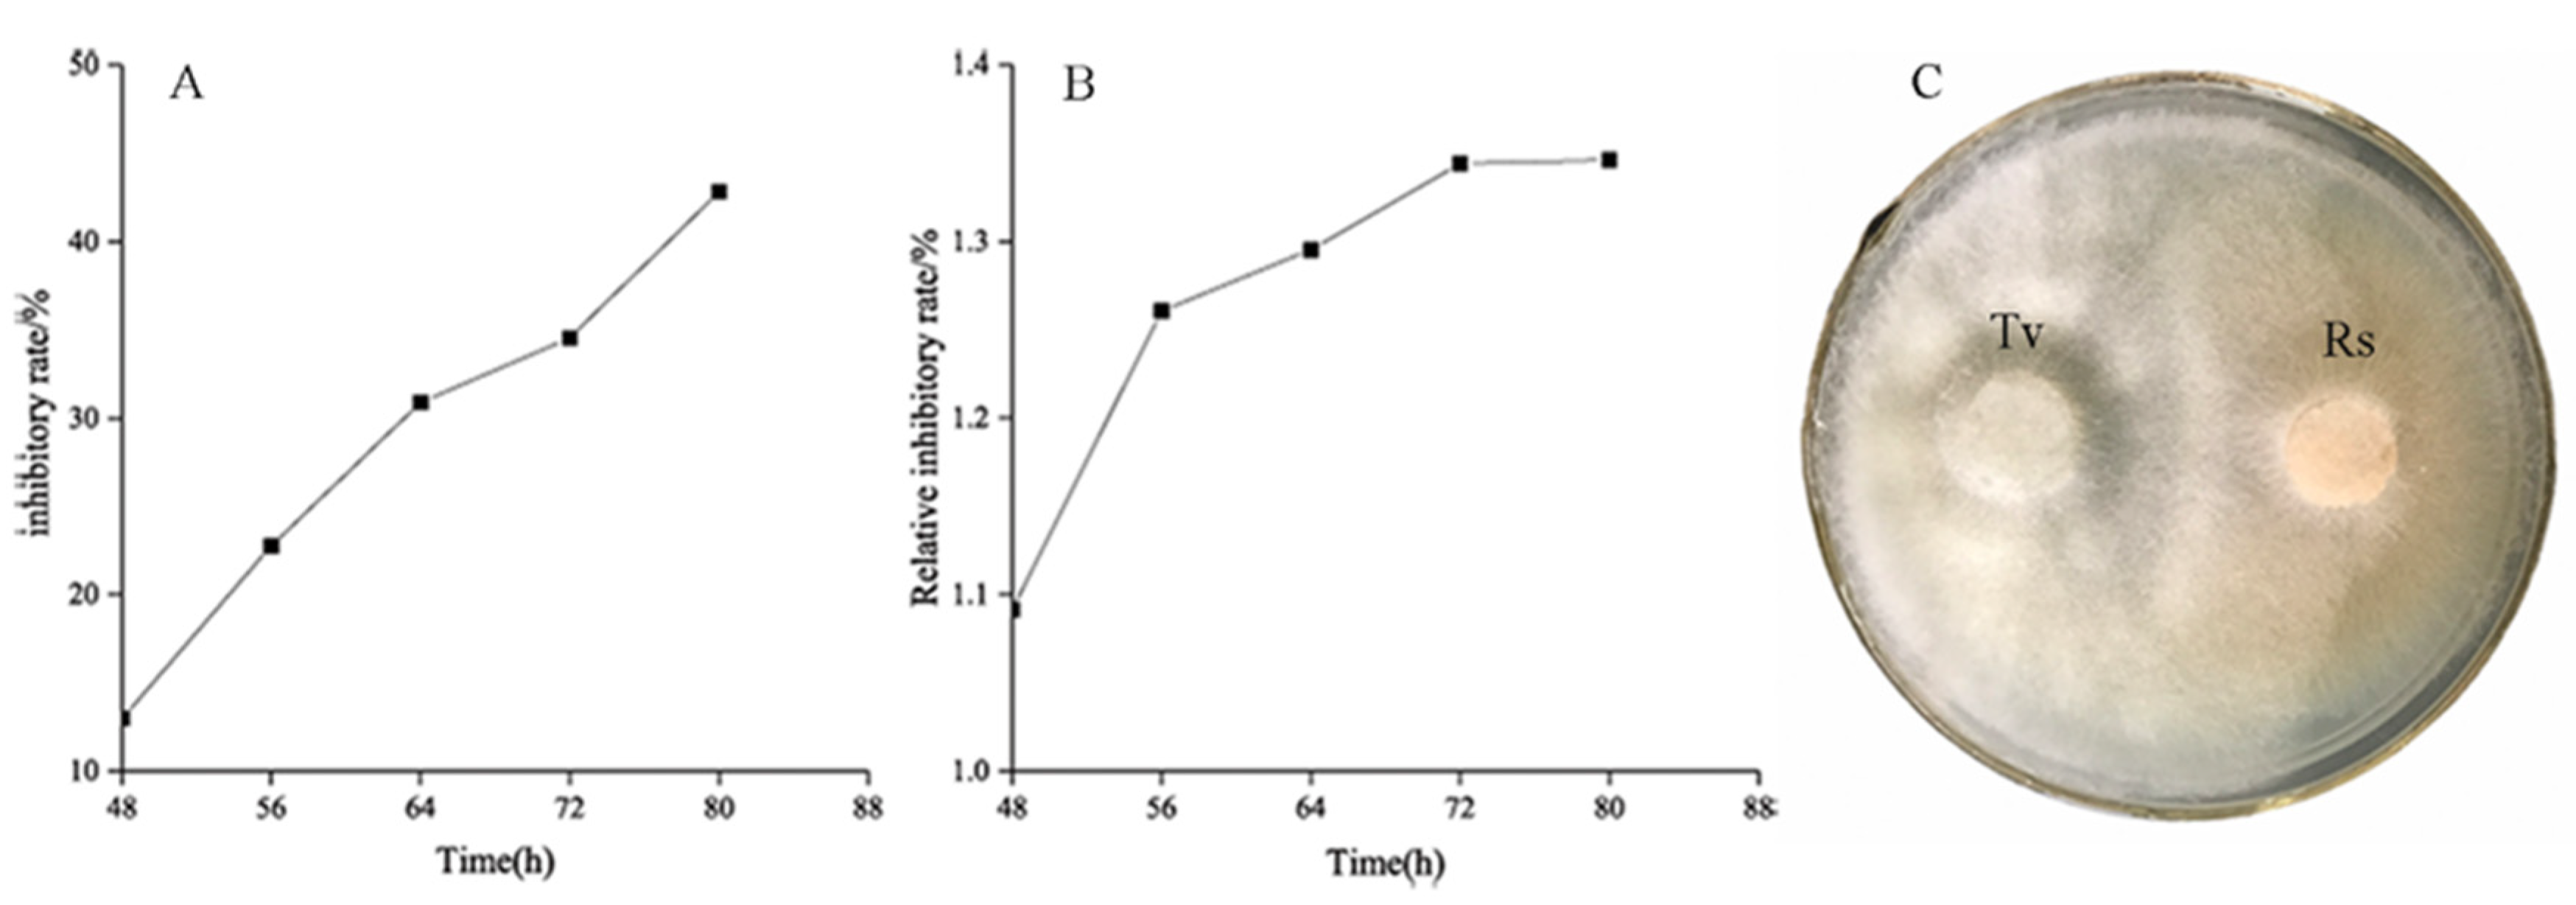
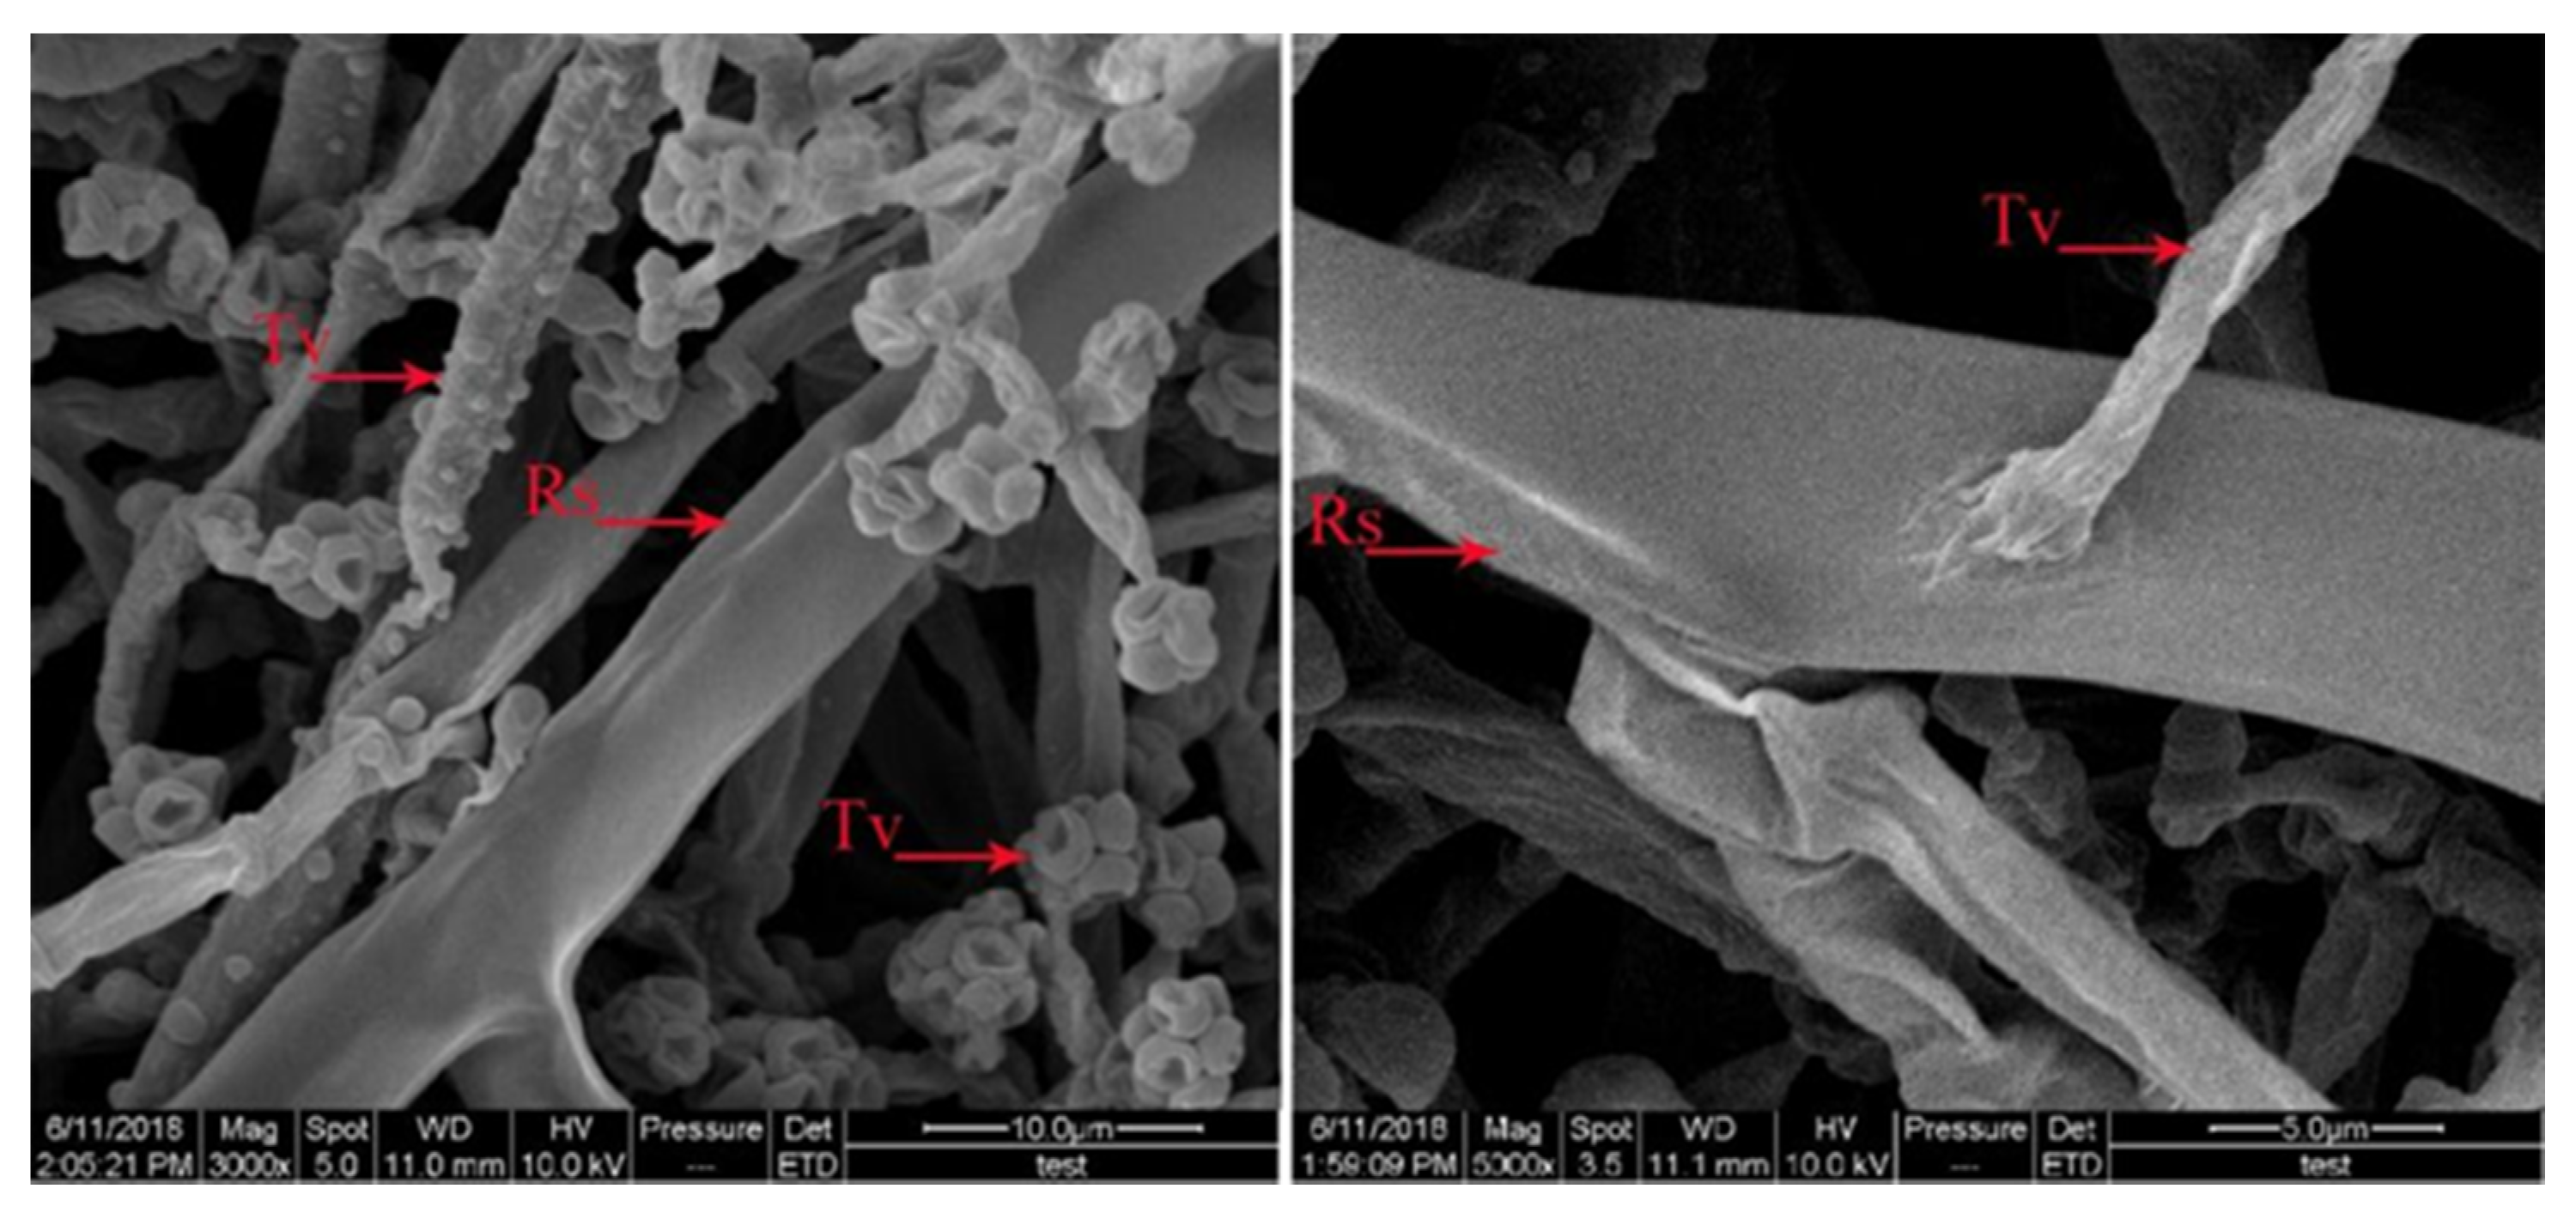
3.1. Antagonistic Effect of T. virens ZT05 against R. solani

T. virens ZT05 showed a significant antagonistic effect against R. solani (Figure 1). After 48 h of side-by-side culture, the inhibitory rate (A) and relative inhibitory rate (B) of T. virens against R. solani increased from 12.99% to 42.82% and from 1.09% to 1.35%, respectively. After contacting T. virens, the inhibitory effect on the growth of R. solani was increased and reached max at 80 h of culture with the inhibitory rate of 42.82% and the relative inhibitory rate of 1.35%. T. virens ZT05 grew fast with a competition coefficient of II. They formed antagonistic lines with R. solani during the side-by-side culture and gradually covered the growth area of R. solani. The aerial mycelium of R. solani shrank and became sparse gradually until growth ceased (C). In addition, T. virens ZT05 had hyperparasitic ability against R. solani. The SEM results showed that the mycelia of T. virens ZT05 grew parallel to the mycelia of R. solani, and then spirally wrapped around or penetrated the pathogenic mycelia of R. solani (Figure 2).

3.2. Inhibitory Effect of the Metabolites of T. virens ZT05 on R. solani

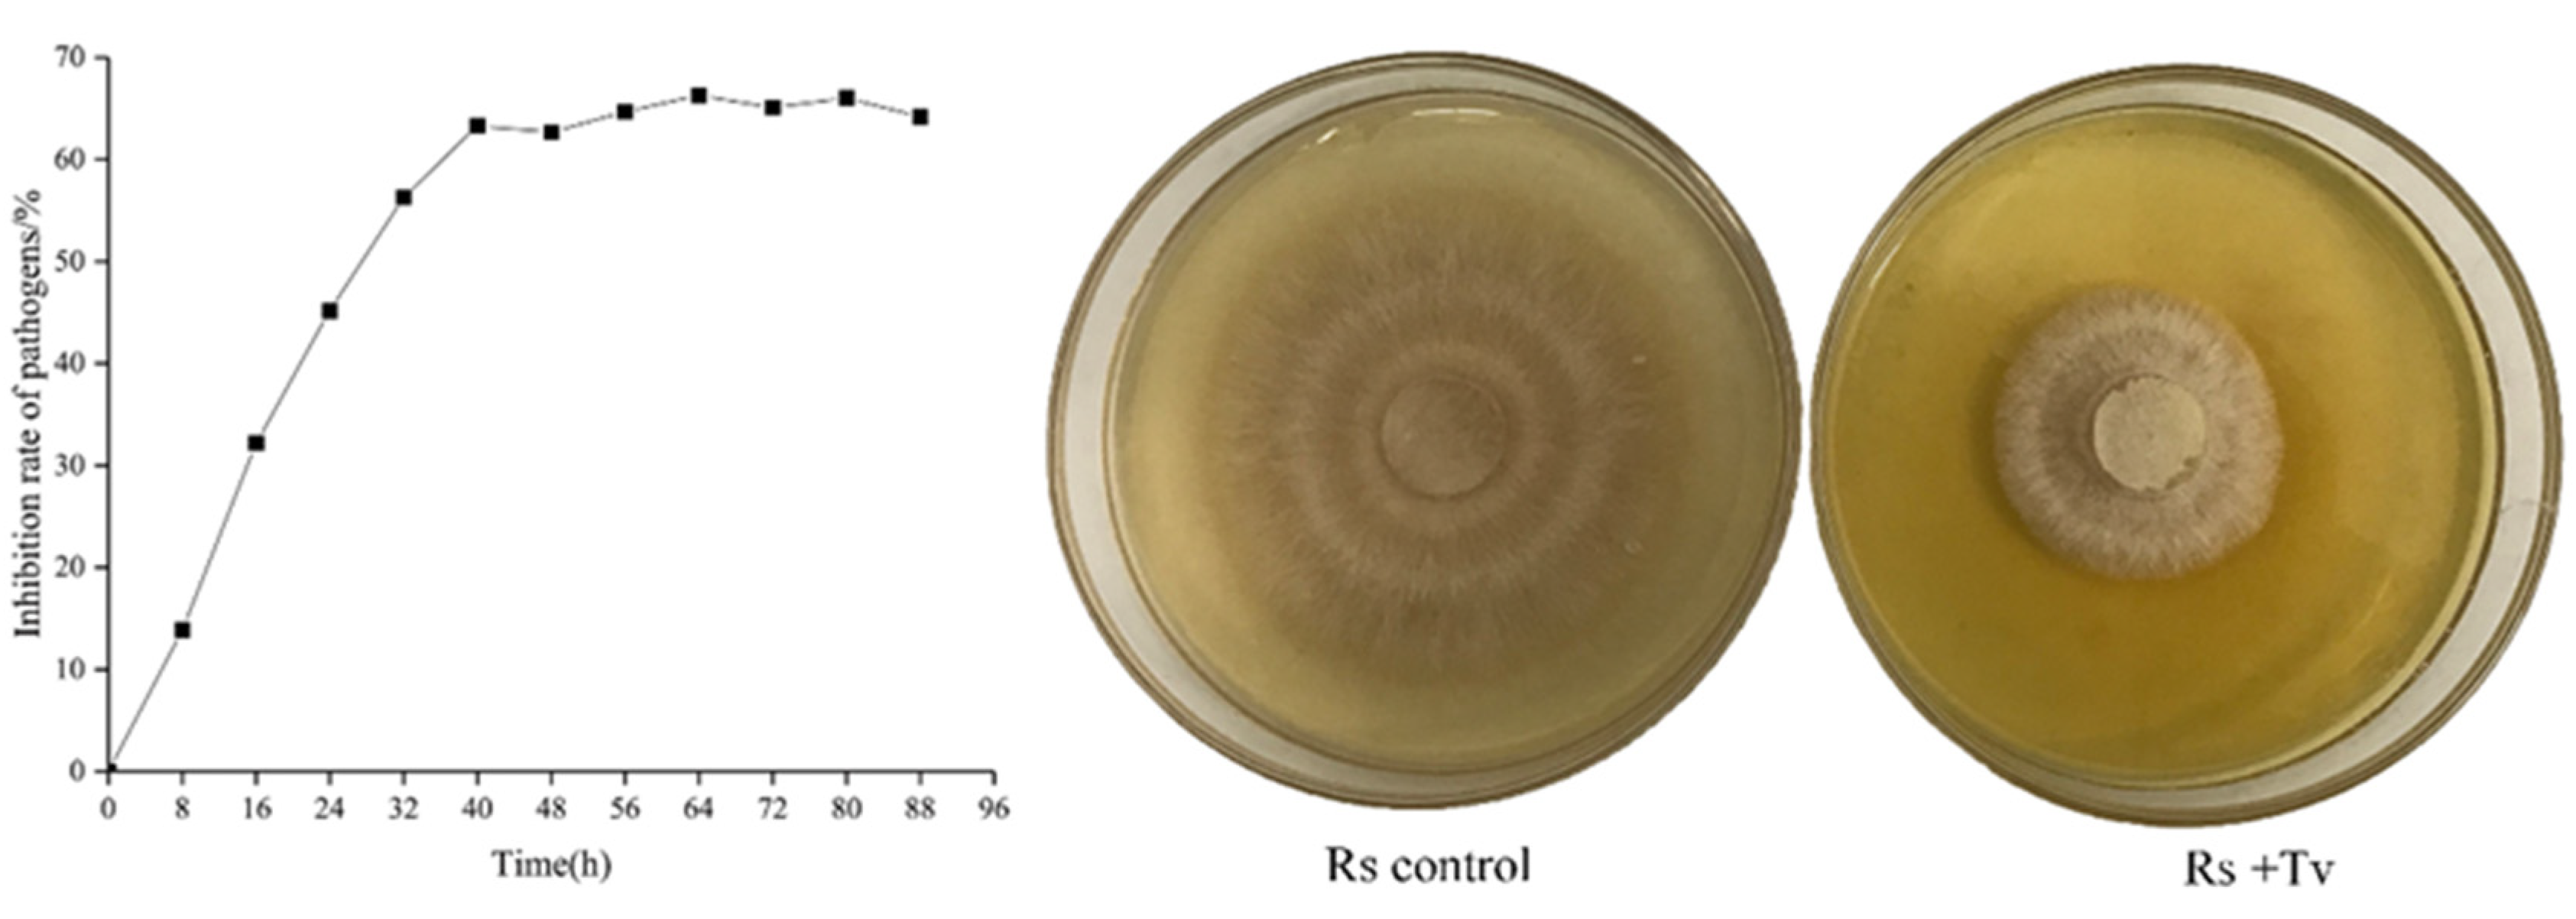
3.2.1. Inhibitory Effect of Nonvolatile Metabolites of T. virens ZT05 on R. solani

The nonvolatile metabolites of T. virens showed a significant inhibitory effect on R. solani (Figure 3). The inhibition rate increased gradually between 0–40 h and reached 63.32% at 40 h. The inhibition rate reached a plateau between 40–88 h with inhibited mycelium growth of R. solani. The mycelium appeared sparse and weak, with ceased growth.

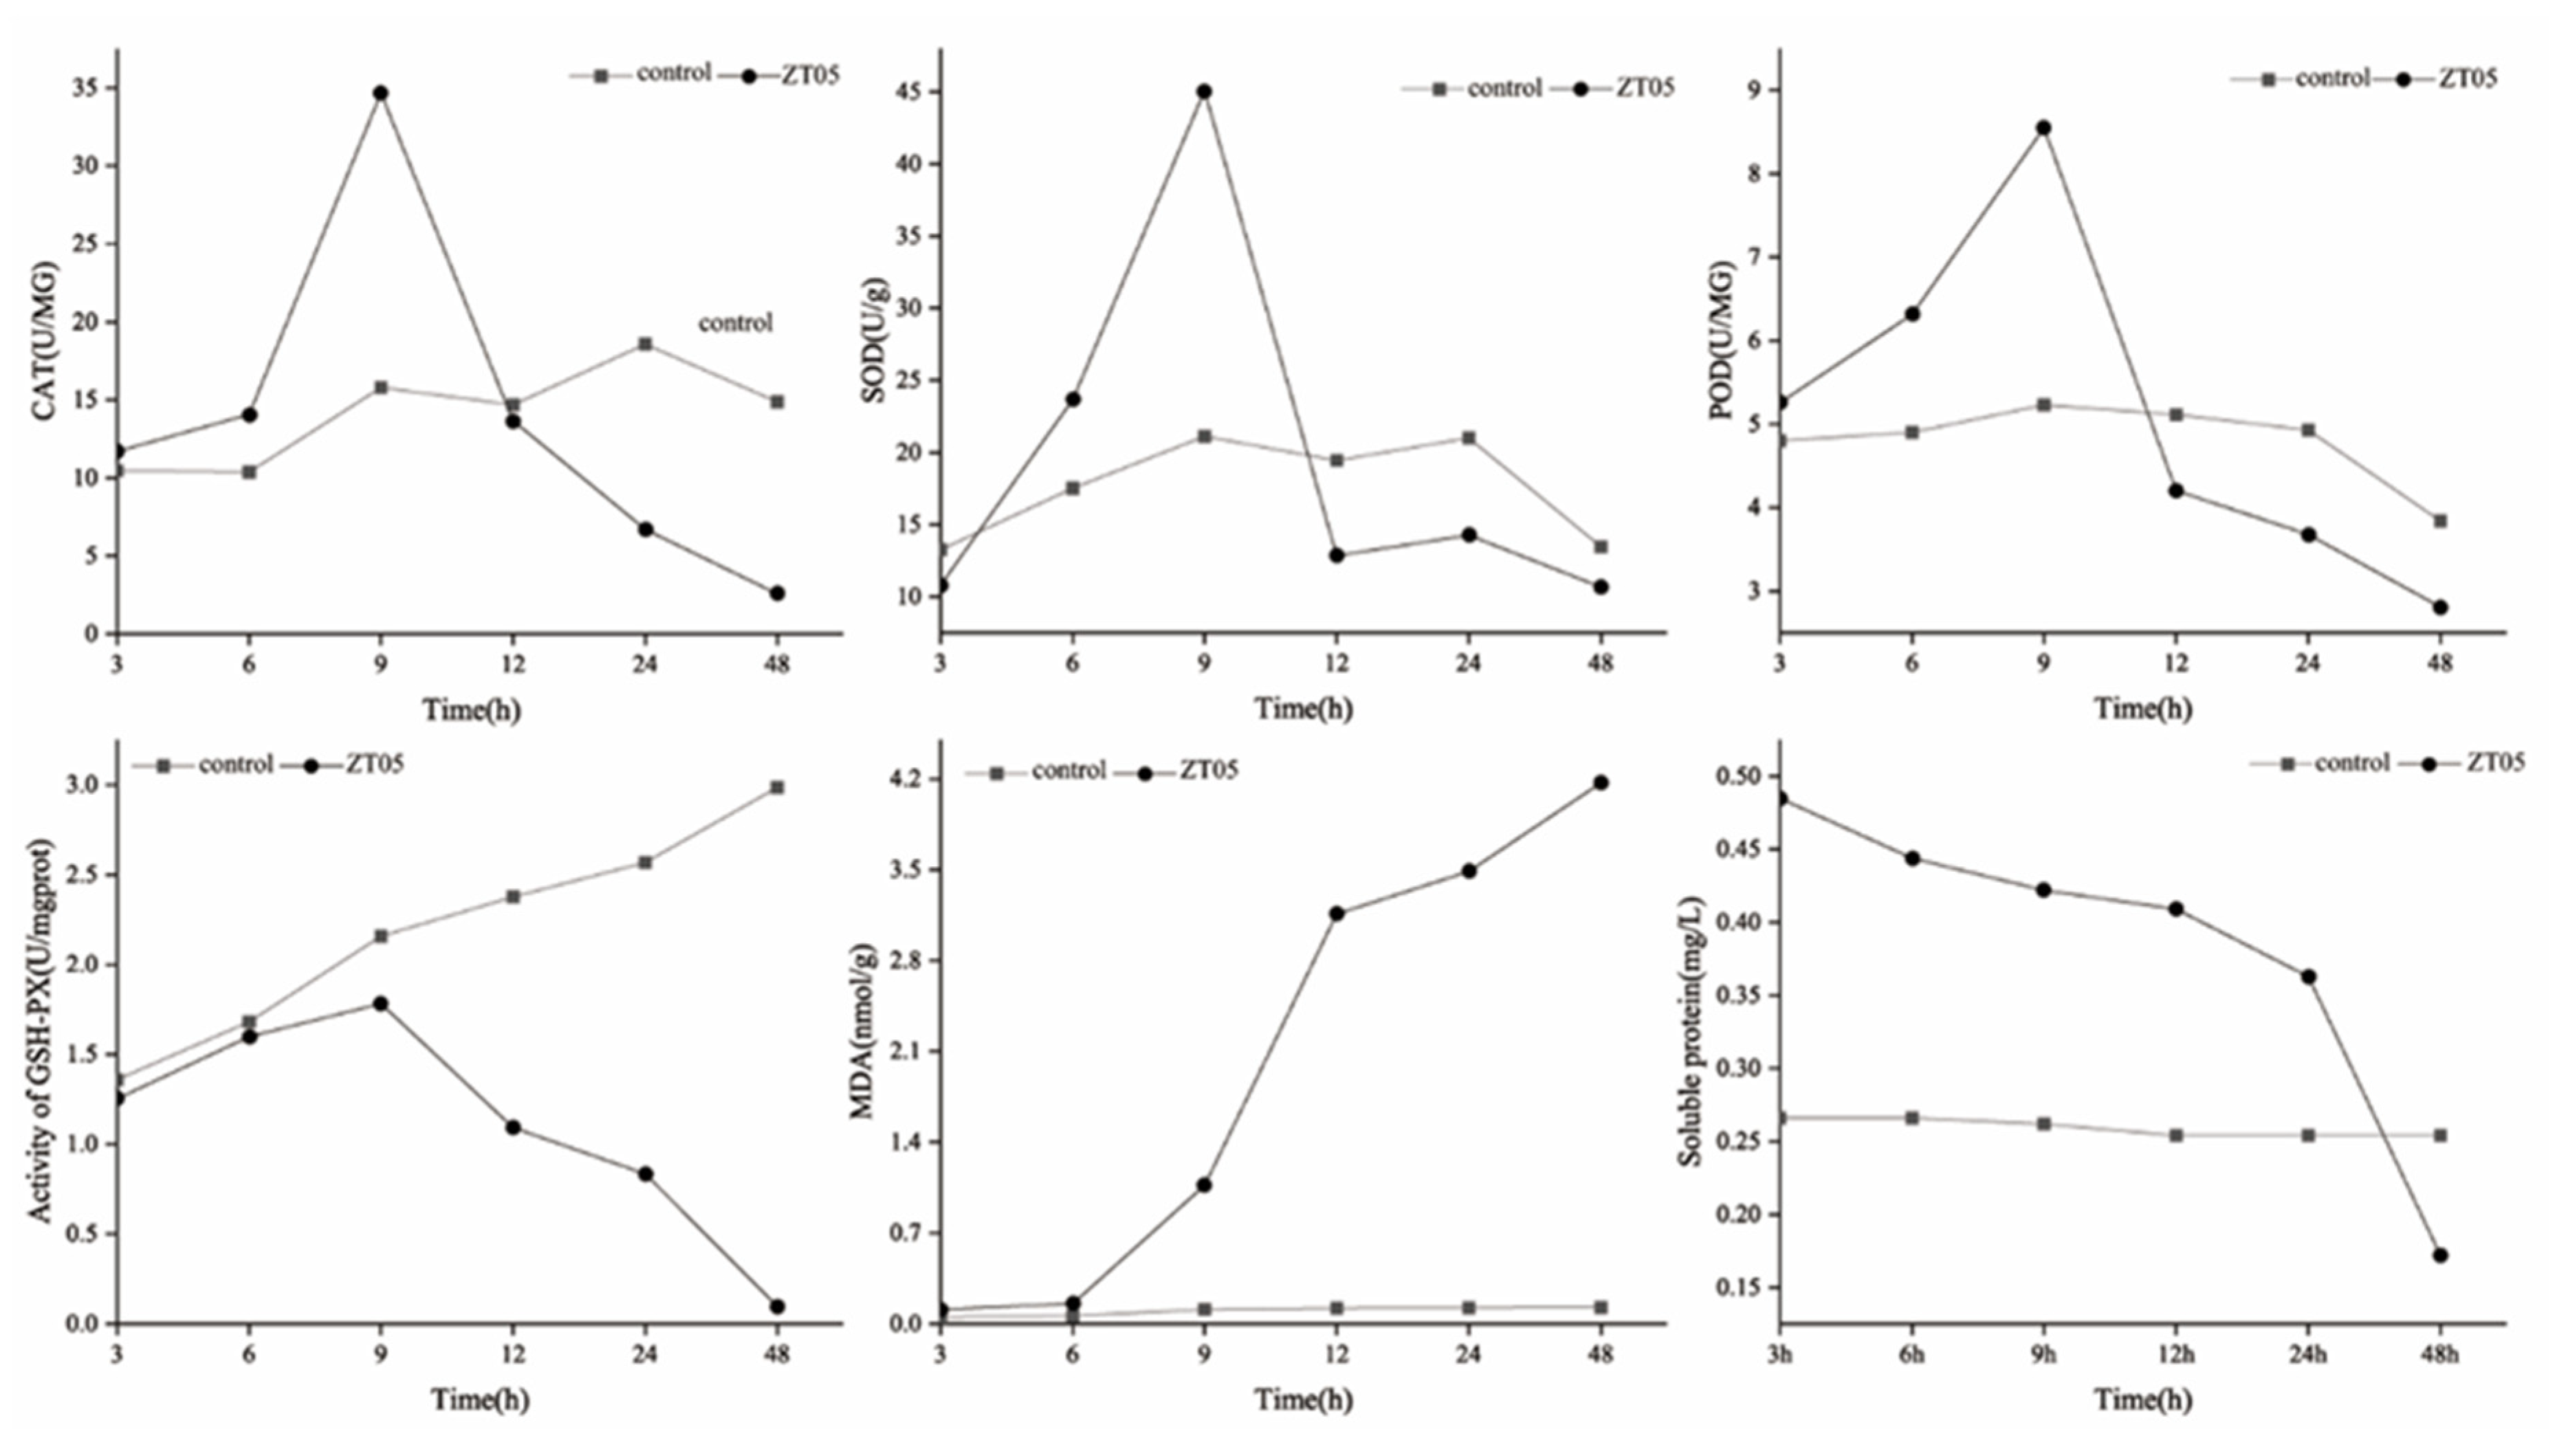
3.2.2. Inhibitory Effect of Nonvolatile Metabolites of T. virens ZT05 on Enzyme Activities of R. solani

The ethyl acetate extract of T. virens ZT05 significantly affected the expression of R. solani mycelium proteins, including CAT, SOD, POD, GSH-Px, MDA, and soluble proteins (Figure 4). In the T. virens ZT05-treated group, the enzyme activities of R. solani CAT, SOD, and POD started to increase at 3 h, reached peaks at 9 h, and then decreased. The maximum values of enzyme activities were 34.66, 45.07, and 8.55 for CAT, SOD, and POD in the treated group. Their enzyme activities started to decrease slowly after 24 h and reached minimum values at 48 h. The minimum values of enzyme activities for CAT, SOD, and POD were 478.02%, 26.02%, and 36.68% less than the control group. The T. virens ZT05-treated group showed decreased GSH-Px enzyme activity than that of the control group. The enzyme activity reached a maximum value of 1.78 at 9 h and gradually decreased until 48 h with a minimum value of 0.10. The T. virens ZT05-treated group showed increasing MDA enzyme activity until 48 h with a maximum value of 4.17. The T. virens ZT05-treated group showed decreasing content of soluble proteins until 48 h, with a minimum value of 0.17, which was 47.67% less than that of the control group.

3.2.3. Inhibitory Effect of Volatile Metabolites of T. virens ZT05 on R. solani

The volatile metabolites of T. virens ZT05 showed an inhibitory effect of R. solani during the up-and-down culture (Figure 5). After five days of up-and-down culture (T. virens ZT05 on the bottom and R. solani on the top), the inhibitory effect on R. solani reached 80.10% with the slow and sparse growth of R. solani.

3.3. Transcriptome Sequencing Analysis of the Side-by-Side Cultured T. virens ZT05 and R. solani

3.3.1. Analysis of Transcriptome Sequencing Data

The junction of T. virens ZT05 and R. solani after 48 h of side-by-side culture was sampled for Illumina sequencing. After filtering the data, a total of 91,307,884.00 clean reads were obtained, which accounted for 99% of the total sequencing sequence (Table 2). The GC content of each sample was between 52.66–54.17%. Q30 was greater than 95%. Their comparison rate to the reference genome was 60.12–92.91%. Hence, the sequencing quality was high and met the requirements of subsequent analysis.

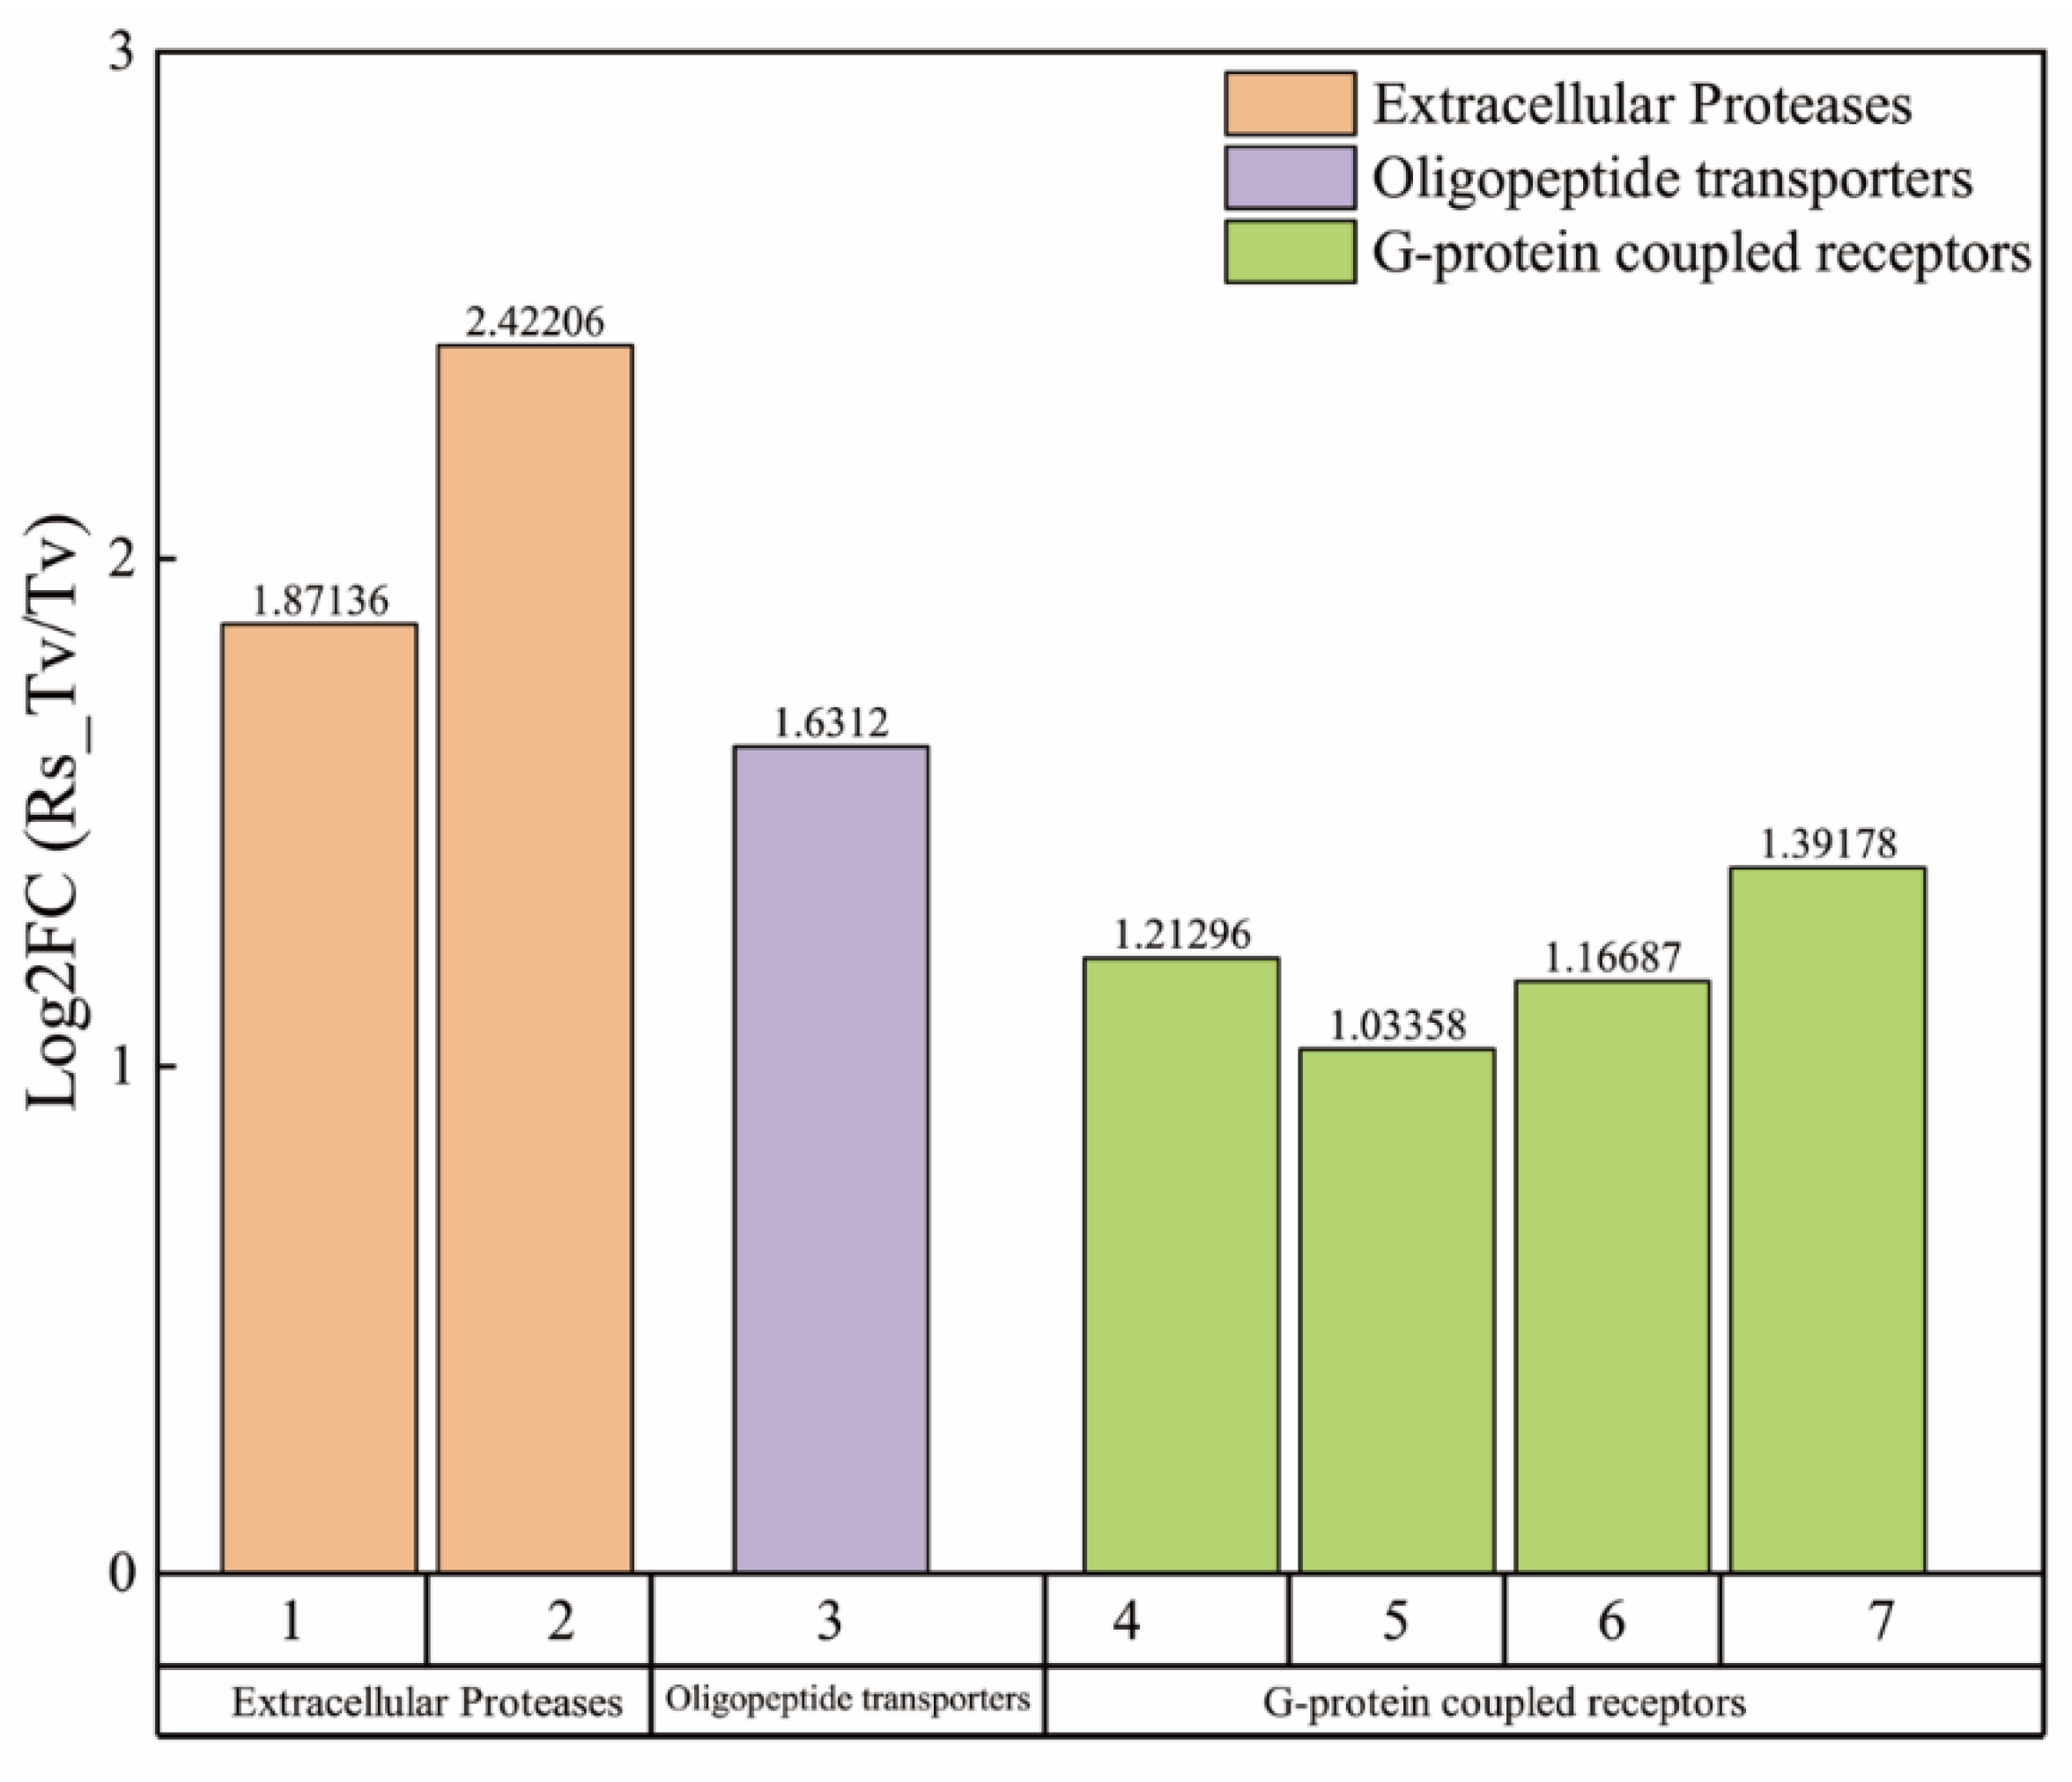
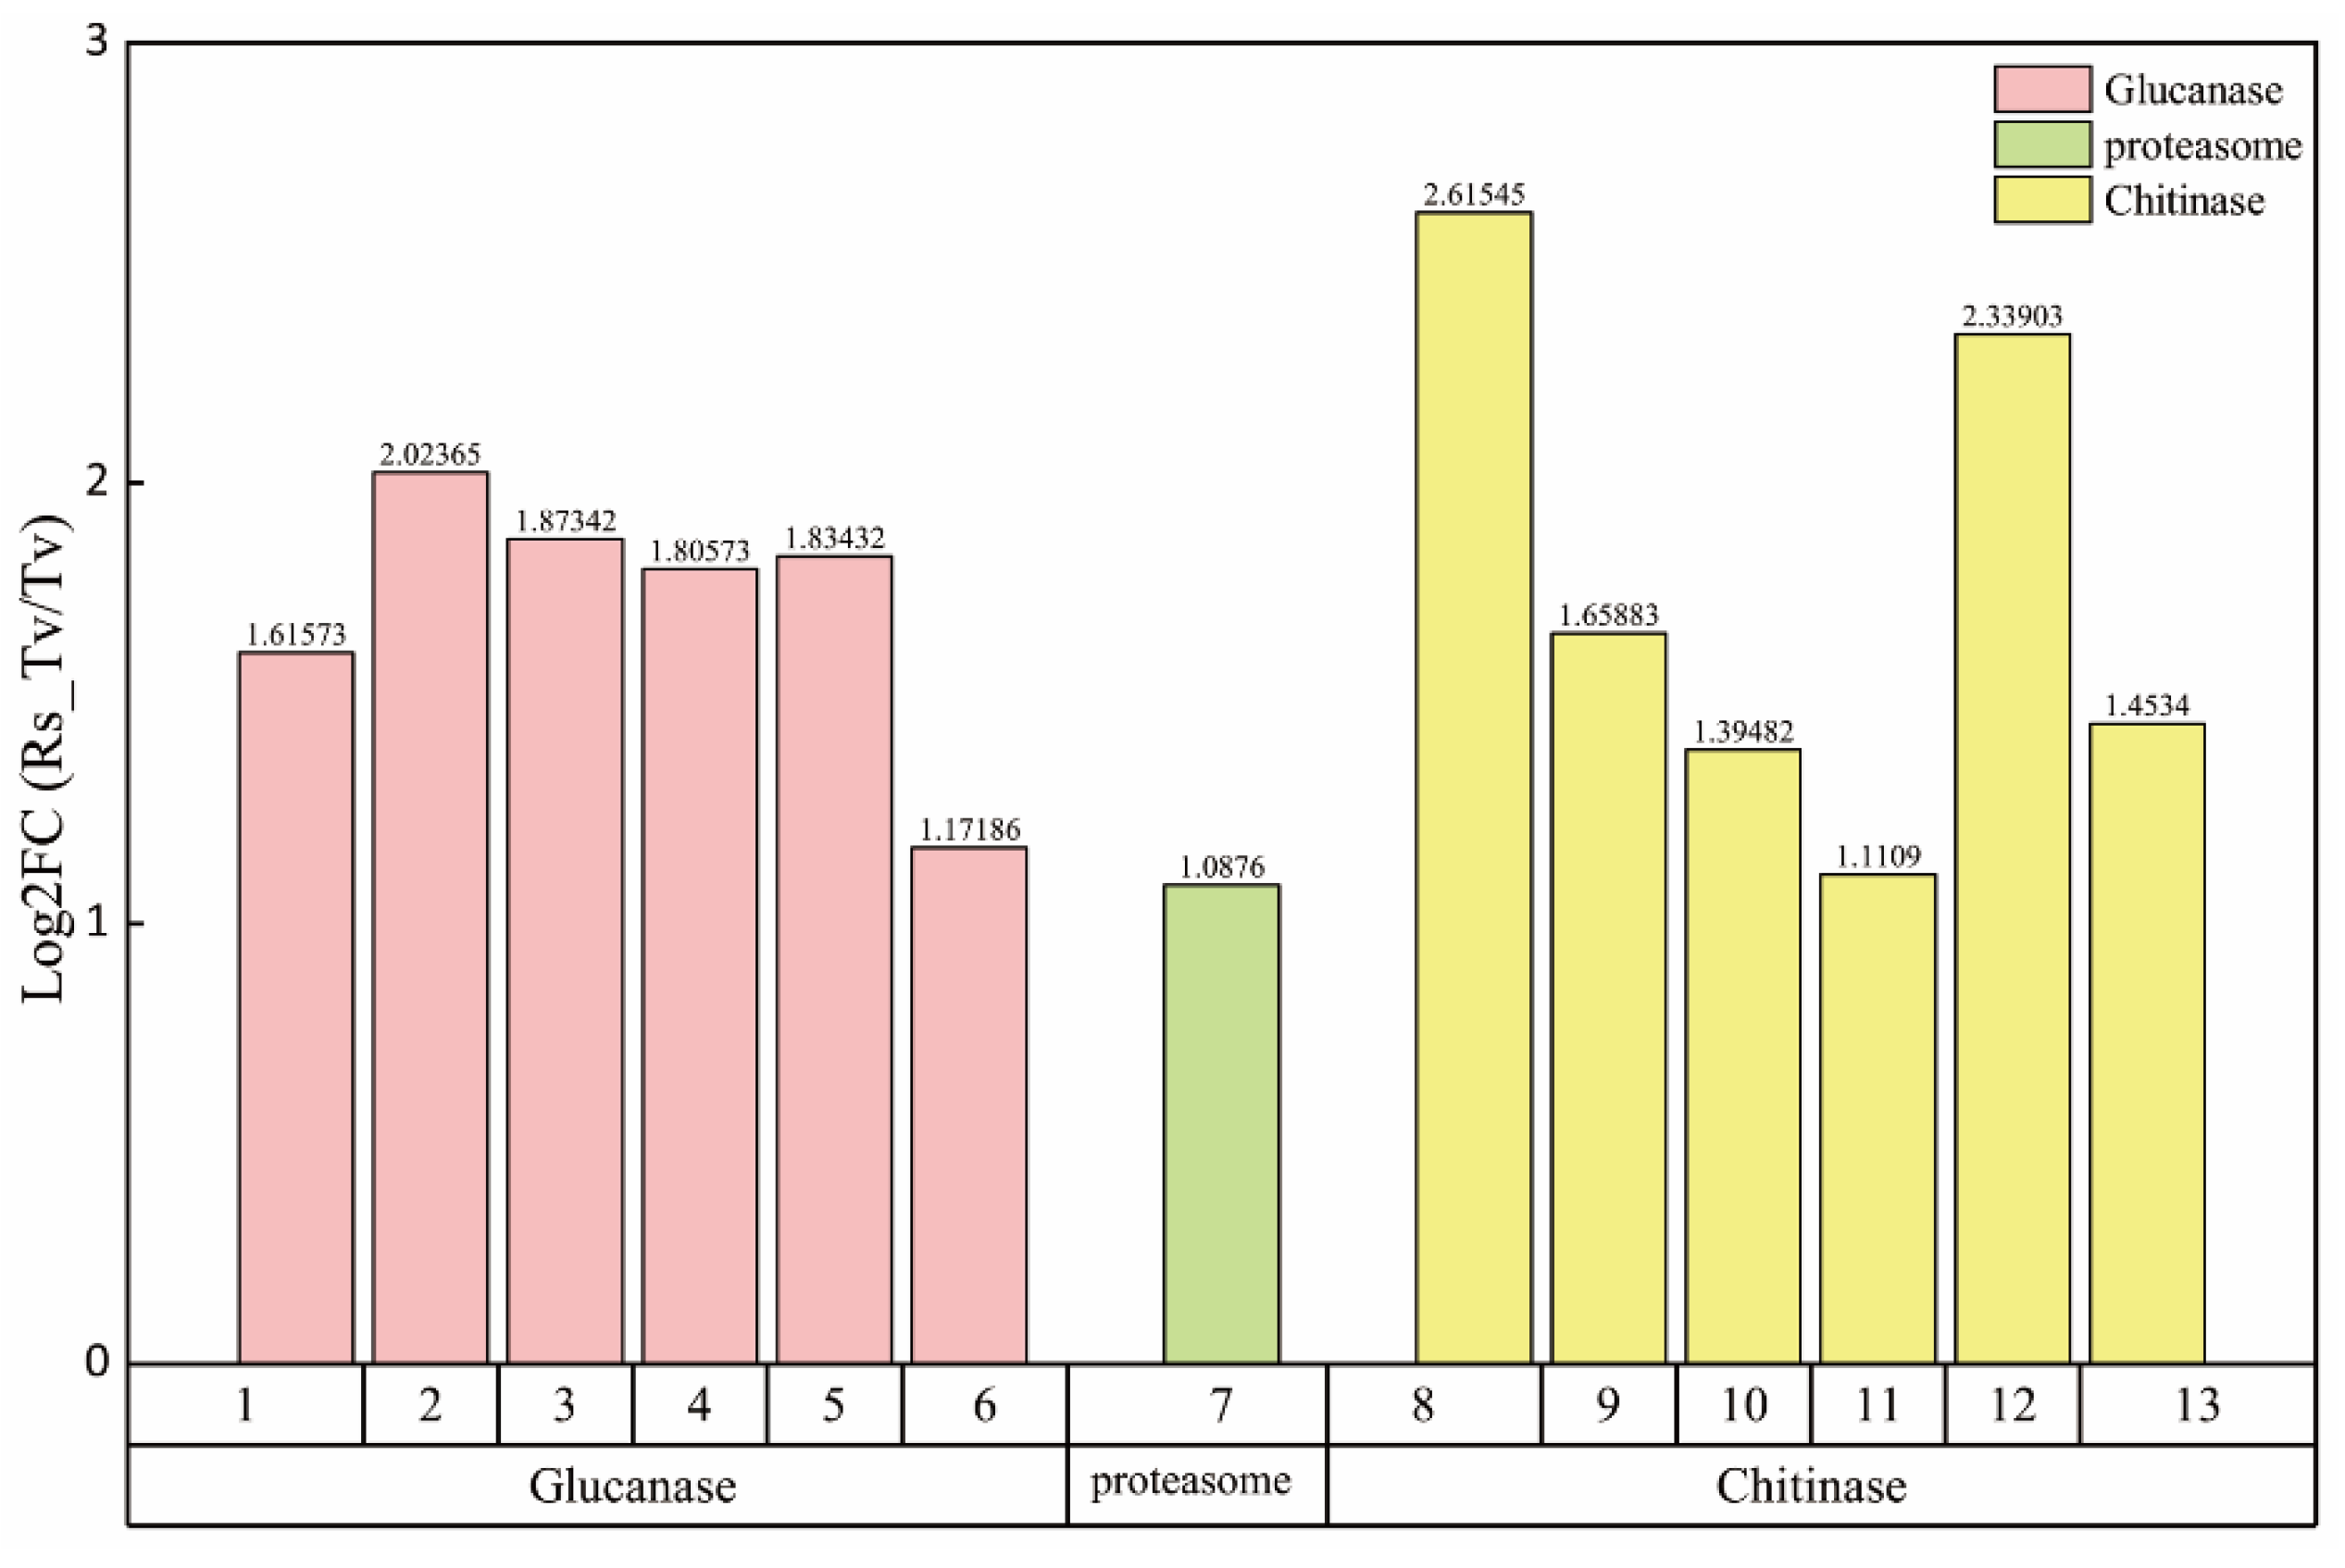
3.3.2. Screening of Hyperparasitic Functional Genes

Seven genes related to pathogen recognition and signal transduction were significantly upregulated during the plate paired culture (Figure 6), among which two genes were extracellular proteases, one gene belonged to oligopeptide transporters, and four genes were G-protein coupled receptors. Thirteen genes related to the hyperparasitic genes, among which, six chitinase genes were identified (Figure 7 and Supplementary Table S1), and Log2FC value of TRIVIDRAFT_178019 was the highest, shown as 2.62. In addition, six glucanase genes were identified, among which the Log2FC value of TRIVIDRAFT_72072 was the highest, shown as 2.02. We also screened one proteasome gene, and its Log2FC value was 1.0876.

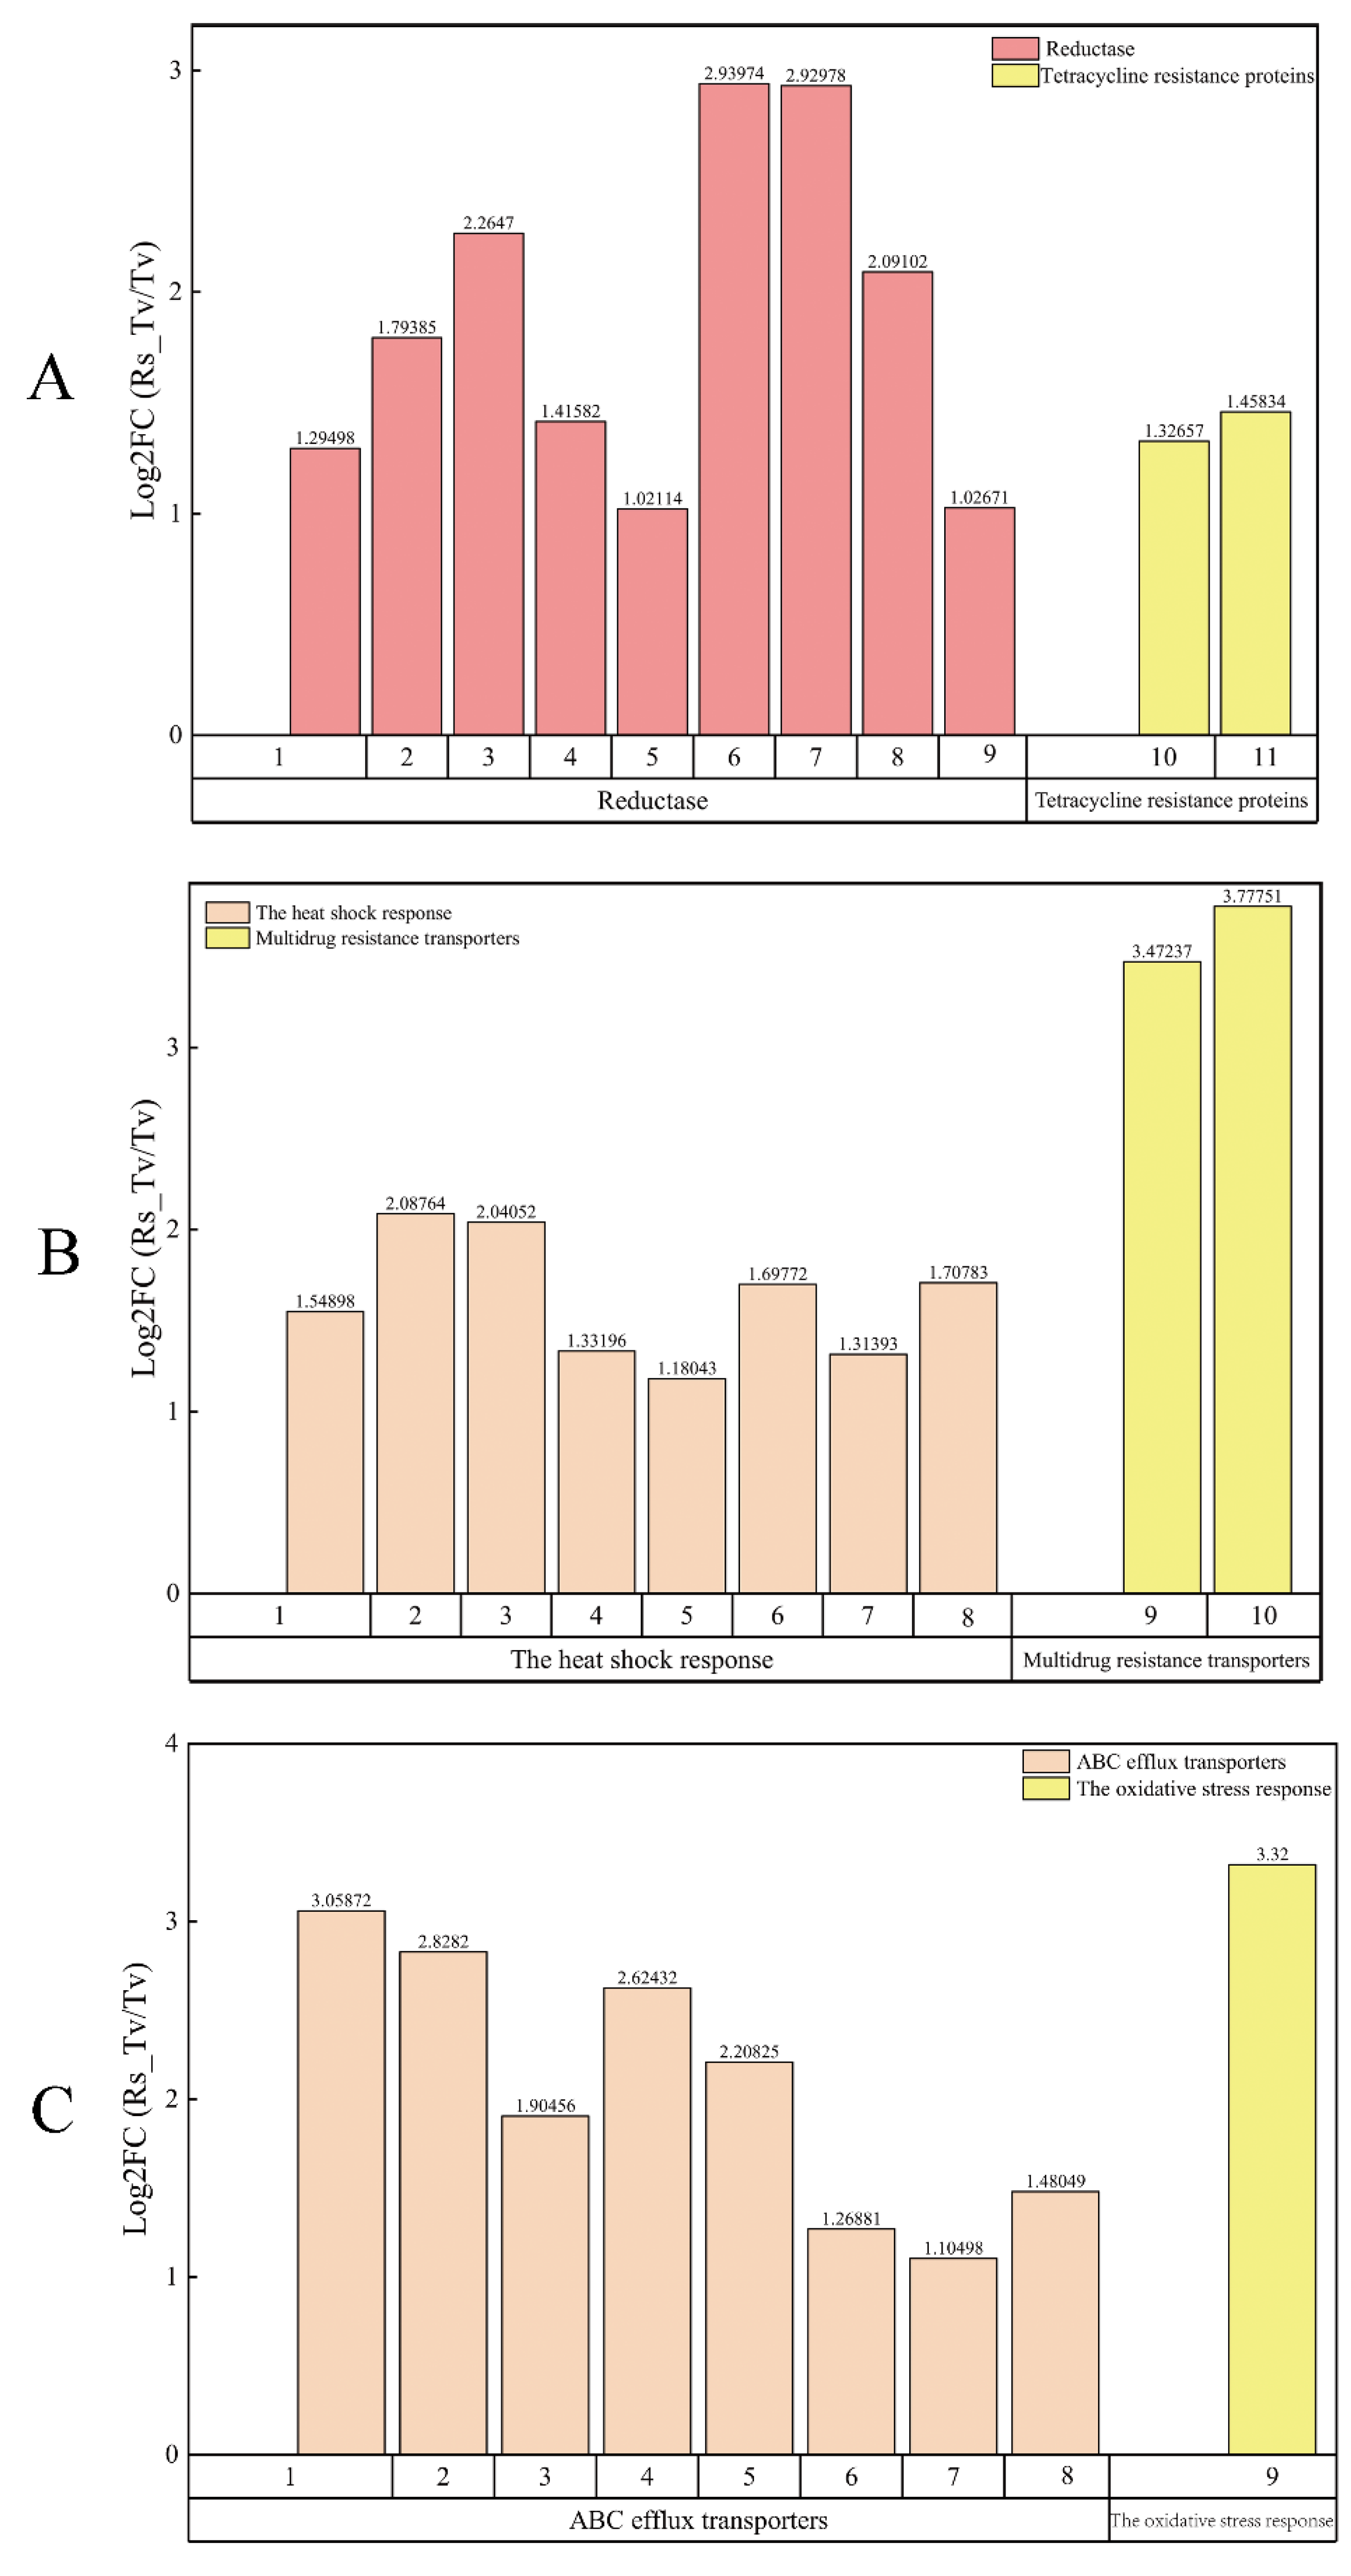
3.3.3. Screening of Antibiosis Functional Genes

The antibiosis function of Trichoderma plays an important role in the antagonistic mechanism. Studies have shown that Trichoderma species metabolized many chemicals and enzymes that were antagonistic. For example, 70 antifungal metabolites have been identified. These metabolites functioned antagonistically via inhibiting the growth of pathogenic fungi. Several antibiosis function genes were identified through the initial screening, nine reductase genes (Figure 8A), including two tetracycline resistance genes (Figure 8A), eight heat shock response genes (Figure 8B), two multidrug resistance transporter genes (Figure 8B), eight ABC efflux transporter genes (Figure 8C), and oxidative stress response gene (Figure 8C). A total of 30 genes related to antibiosis function were identified (Figure 8, Supplementary Tables S2 and S3).

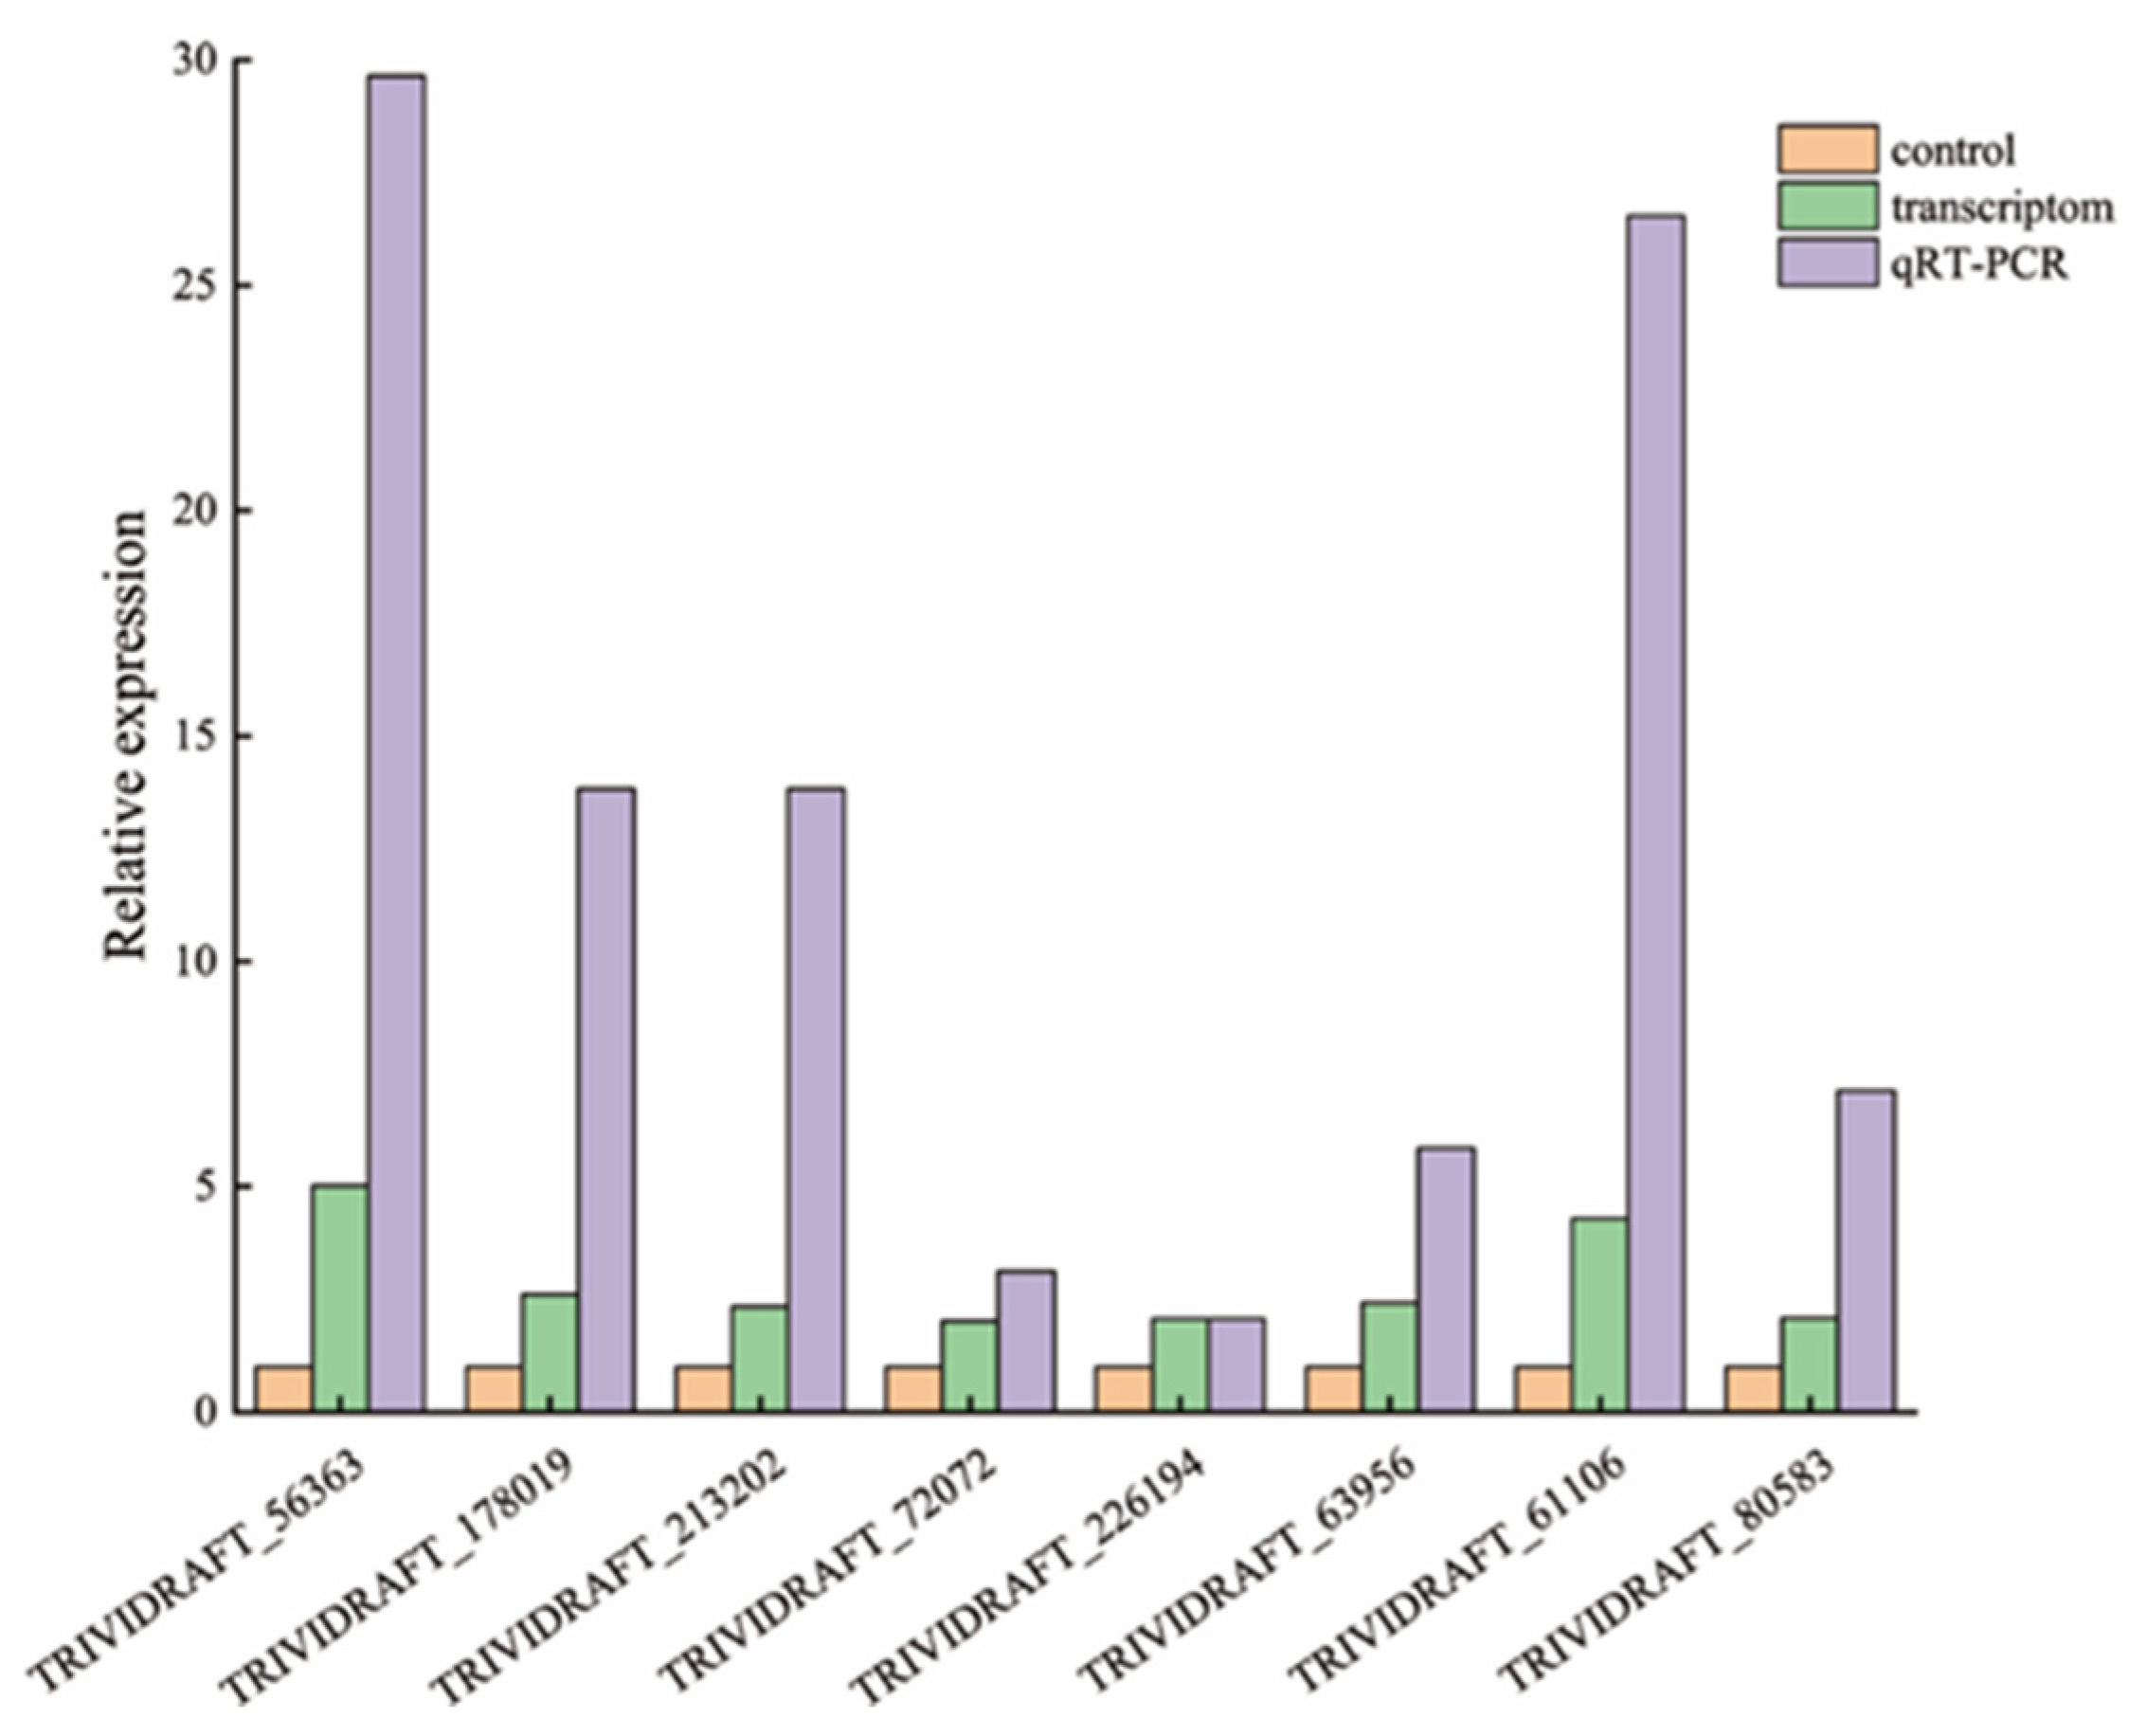
3.3.4. qRT-PCR Quantitative Analysis

In the Trichoderma virens ZT05-treated group (Rs-Tv), several gene expressions were upregulated as compared with the control, consistent with the transcriptome sequencing results, including TRIVIDRAFT_56363, TRIVIDRAFT_178019, TRIVIDRAFT_213202, TRIVIDRAFT_72072, TRIVIDRAFT_226194, TRIVIDRAFT_63956, TRIVIDRAFT_61106, and TRIVIDRAFT_80583 (Figure 9).

4. Discussion

Trichoderma inhibits the growth and reproduction of pathogenic microorganisms mainly via competition, hyperparasitism, and antibiosis. Competition is a process that occurs when an organism lacks nutrients and living space. The “hunger” caused by nutrition deficiency is the most common cause of microbial death. The use of a biological control to compete for limited nutrition is an important way to prevent plant diseases [71]. In this study, T. virens ZT05 and R. solani formed an antagonistic line. With the increase in antagonistic time, the mycelium of R. solani gradually became thinner and stopped growing. The results of electron microscopy showed that the mycelium of T. virens ZT05 was spirally wrapped around and attached to the mycelium of R. solani during the growth phase, consistent with the results of Harwoko et al. [72], Mukherjee et al. [73], and Li et al. [74]. Hyperparasitism is the main mechanism of biological control of the Trichoderma species. Trichoderma recognizes pathogens by identifying the lectin secreted by the pathogens [75,76]. After recognizing the host pathogen, Trichoderma induces a series of hyper parasite-related signaling pathways in the body. Many genes encoding extracellular proteases, oligopeptide transporters, and GPCRs are expressed when the Trichoderma contacts the host pathogen or before the contact [77,78]. Most encoded proteins belong to the subtilisin-like serine protein family. Their coding genes are significantly upregulated during the recognition of host pathogen by Trichoderma [78]. During the hyperparasitic process, Trichoderma secretes cell wall degrading enzymes (CWDEs), including chitinases, cellulases, xylanases, glucanases, and proteinases [79]. CWDEs and secondary metabolites synergistically degrade the cell wall of the pathogen [80]. We found several genes to be upregulated, including seven genes related to recognition and signal transduction, six chitinase genes, six glucanase, and one protease gene. Ravindra et al. [81] showed that T. virens IMI 304061 had a significant antagonistic effect on Sclerotium rolfsii. The pgy1 and ecm33 genes of T. virens IMI 304061 were related to the hyperparasite ability. Knocking out pgy1 and ecm33 genes resulted in the loss of the ability of T. virens IMI 304061 to transmit signals and secrete metabolites. Dautt-Castro et al. [82] showed that T. virens Gv29–8 had a significant antagonistic effect on R. solani, Sclerotium rolfsii, and Fusarium oxysporum. The tbrg-1 gene was associated with the hyperparasitic effect of Trichoderma. The gene spi encoded protease. The gene chtl encoded chitin. The gene gliP encoded secondary metabolites. Saravanakumar et al. [83] showed that genes associated with parasitism and secretion of secondary metabolites in Trichoderma were upregulated during antagonism of T. virens against Macrophomina phaseolina (MP), Fusarium graminearum (FG), and 104 Botrytis cinerea (BC). In addition, the secondary metabolites secreted by Trichoderma have a synergistic effect during the antagonistic process. Ngikoh et al. [84] showed that during culturing of T. virens UKM1 with OPEFB substrate, Trichoderma degraded OPEFB by secreting cellulase and glucanase. The contents of cellulase and glucanase were the highest on the seventh day of culture. Antibiosis is one of the important mechanisms for the biological control of Trichoderma. During the antagonistic process of T. virens against pathogens, T. virens produced volatile metabolites such as ethylene, hydrocyanic acid, ethanol, acetaldehyde, ketones, chloramphenicol, chloramphenicol, and nonvolatile metabolites such as trichome in, antibacterial peptides, chitinase, and β-1,3-glucanase [34,35]. During the interaction between Trichoderma and the host pathogen, the host secreted toxic substances to inhibit the growth of Trichoderma. The Trichoderma degrades the toxic substances through ABC transport proteins, heat shock proteins, etc., thereby alleviating the inhibition induced by the host [37,38]. The ABC transporter contains ATP binding sites and is the primary-secondary transport system of the cell. It transports the bound substrate to the outside of the cell membrane to avoid cell damage. It is directly related to the resistance of an organism to various exogenous substances [85,86]. Ruocco et al. [87] showed that the expression of Taabc2 gene, encoding the ABC transporter, in T. virens was affected by the pathogenic secretions. Knocking out the Taabc2 gene resulted in the loss of resistance to toxic substances secreted by Pythium ultimum and R. solani and the loss of biological control ability of T. virens. In this study, the nonvolatile metabolites of T. virens ZT05 significantly inhibited the growth of R. solani. The enzyme activities of CAT, SOD, POD, and GSH-Px and the expression of soluble proteins gradually decreased till minimum values at 48 h of culture. The volatile metabolites of T. virens ZT05 significantly inhibited the growth of R. solani. After five days of up-and-down culture, the size of R. solani decreased significantly. Several genes were identified during the transcriptome analysis of the side-by-side culture of T. virens ZT05 and R. solani, including two genes encoding tetracycline resistance proteins, nine genes encoding reductases, eight genes for the heat shock responses, one gene for the oxidative stress responses, eight genes encoding ABC efflux transporters, and two genes encoding multidrug resistance transporters. Bae et al. [36] extracted metabolite KACC (Korea Agricultural Culture Collection, 40557) from T. atroviride and metabolite KACC 40929 from T. virens. These two metabolites showed significant inhibitory effects on P. litchii. The expression of genes related to secondary metabolites was upregulated. Ruocco et al. [87] found that the gene Taabc2 encoded the ATP-binding cassette transporter. The expression of Taabc2 gene was upregulated when the level of environmental toxins increased around the mycelium of Trichoderma. Srivastava et al. [88] showed that the antagonistic effect of Trichoderma virens against R. solani and Sclerotium rolfsii resulted in the upregulation of genes TgaA and TgaB. Additionally, the gene TvGST was associated with the antibiosis of T. virens. Montero-Barrientos et al. [89] showed that the expression of T. virens T59 hp23 gene was upregulated after temperature treatment and 4 h of 10 % ethanol immersion, which resulted in improved adaptability to extreme environments and resistance to toxic substances of T. virens T59.

5. Conclusions

T. virens ZT05 has strong competition for nutrients and living space, and hyperparasitism to R. solani. The volatile and nonvolatile metabolites of Trichoderma had significant inhibitory effects on R. solani. During the co-culture, the expression of biocontrol genes from T. virens ZT05 was significantly upregulated, including hyperparasitic functional genes and antibiosis functional genes.

Supplementary Materials

The following are available online at https://www.mdpi.com/2223-7747/9/7/912/s1, Supplementary Table S1, Supplementary Table S2, Supplementary Table S3.

Author Contributions

S.H., X.D., and R.S. conceived and designed the study; S.H. and X.D. performed the experiments; S.H., X.D., X.S. and X.L. contributed to the sample measurement and data analysis; S.H. and X.D. wrote the paper. All authors have read and agreed to the published version of the manuscript.

Funding

This research was funded by the National Key Research and Development Program grant number 2017YFD0600101, and the National Natural Science Foundation of China grant numbers 31670649, 31700564, 31170597, and 31200484.

Conflicts of Interest

The authors declare no conflict of interest.

References

  1. Halifu, S.; Deng, X.; Song, X.S.; Song, R.Q. Effects of Two Trichoderma Strains on Plant Growth, Rhizosphere Soil Nutrients, and Fungal Community of Pinus sylvestris var. mongolica Annual Seedlings. Forests 2019, 10, 758. [Google Scholar] [CrossRef] [Green Version]
  2. Kacprzak, M.; Asiegbu, F.O.; Daniel, G.; Stenlid, J.; ManKa, M.; Johansson, M. Resistance reaction of conifer species (european larch, norway spruce, scots pine) to infection by selected necrotrophic damping-off pathogens. Eur. J. Plant Pathol. 2001, 107, 191–207. [Google Scholar] [CrossRef]
  3. Martín-Pinto, P.; Pajares, J.; Díez, J. In vitro effects of four ectomycorrhizal fungi, Boletus edulis, Rhizopogon roseolus, Laccaria laccataand Lactarius deliciosuson Fusarium damping off in Pinus nigra seedlings. New For. 2006, 32, 323–334. [Google Scholar] [CrossRef]
  4. John, C.J.; Jishma, P.; Karthika, N.R.; Nidheesh, K.S.; Ray, G.J.; Mathew, J.; Radhakrishnan, K.E. Pseudomonas fluorescens R68 assisted enhancement in growth and fertilizer utilization of Amaranthus tricolor (L.). Biotech 2017, 7, 256. [Google Scholar]
  5. Fengge, Z.; Yunqian, H.; Cobb, A.B.; Gongwen, L.; Jiqiong, Z.; Gaowen, Y.; Zhang, J.Q.; Yang, G.W.; Gai, W.T.W.; Zhang, Y.J. Trichoderma biofertilizer links to altered soil chemistry, altered microbial communities, and improved grassland biomass. Front. Microbiol. 2018, 9, 848. [Google Scholar]
  6. Nunzio, F.; Valeria, V.; Woo, S.L.; Pepe, O.; Rosa, A.D.; Gioia, L.; Romano, I.; Lombardi, N.; Napolitano, M.; Colla, G.; et al. Trichoderma-Based Biostimulants Modulate Rhizosphere Microbial Populations and Improve N Uptake Efficiency, Yield, and Nutritional Quality of Leafy Vegetables. Front. Plant Sci. 2018, 9, 743. [Google Scholar]
  7. Eilenberg, J.; Hajek, A.; Lomer, C. Suggestions for unifying the terminology in biological control. Biocontrol 2001, 46, 387–400. [Google Scholar] [CrossRef]
  8. Alabouvette, C.; Olivain, C.; Migheli, Q.; Steinberg, C. Microbiological control of soil-borne phytopathogenic fungi with special emphasis on wilt-inducing Fusarium oxysporum. New Phytol. 2009, 184, 529–544. [Google Scholar] [CrossRef]
  9. Li, Y.; Chen, Z.; He, J.Z.; Wang, Q.; Shen, C.C.; Ge, Y. Ectomycorrhizal fungi inoculation alleviates simulated acid rain effects on soil ammonia oxidizers and denitrifiers in Masson pine forest. Environ. Microbiol. 2019, 21, 299–313. [Google Scholar] [CrossRef] [Green Version]
  10. Zimand, G. Effect of Trichoderma harzianum on Botrytis cinerea Pathogenicity. Phytopathology 1996, 86, 1255–1260. [Google Scholar] [CrossRef]
  11. Harman, G.E. Myths and Dogmas of Biocontrol Changes in Perceptions Derived from Research on Trichoderma harzinum T-22. Plant Dis. 2000, 84, 377–393. [Google Scholar] [CrossRef] [PubMed] [Green Version]
  12. Knudsen, G.R.; Dandurand, L.C. Ecological Complexity and the Success of Fungal Biological Control Agents. Adv. Agric. 2014, 2014, 542703. [Google Scholar] [CrossRef]
  13. Zapata-Sarmiento, D.H.; Palacios-Pala, E.F.; Rodríguez-Hernández, A.; Melchor, D.L.M.M.; Rodríguez-Monroy, M.; Sepúlveda-Jiménez, G. Trichoderma asperellum, a potential biological control agent of Stemphylium vesicarium, on onion (Allium cepa L.). Biol. Control 2019, 140, 104–105. [Google Scholar] [CrossRef]
  14. Harman, G.E.; Howell, C.R.; Viterbo, A.; Chet, I.; Lorito, M. Trichoderma species-opportunistic, avirulent plant symbionts. Nat. Rev. Microbiol. 2004, 2, 43–56. [Google Scholar] [CrossRef]
  15. Morán-Diez, E.; Hermosa, R.; Ambrosino, P.; Cardoza, R.E.; Gutiérrez, S.; Lorito, M.; Monte, E. The ThPG1 Endopolygalacturonase Is Required for the Trichoderma harzianum –Plant Beneficial Interaction. Mol. Plant-Microbe Interact. 2009, 22, 1021–1031. [Google Scholar] [CrossRef] [Green Version]
  16. Rubio, M.B.; Pardal, A.J.; Cardoza, R.E.; Gutiérrez, S.; Monte, E.; Hermosa, R. Involvement of the Transcriptional Coactivator ThMBF1 in the Biocontrol Activity of Trichoderma harzianum. Front. Microbiol. 2017, 8, 2273. [Google Scholar] [CrossRef] [Green Version]
  17. Nawrocka, J.; Małolepsza, U.; Szymczak, K.; Szezech, M. Involvement of metabolic components, volatile compounds, PR proteins, and mechanical strengthening in multilayer protection of cucumber plants against Rhizoctonia solani activated by Trichoderma atroviride TRS25. Protoplasma 2018, 255, 359–373. [Google Scholar] [CrossRef] [Green Version]
  18. Tijerino, A.; Cardoza, R.E.; Moraga, J.; Malmierca, G.M.; Vicente, F.; Aleu, J.; Collado, I.G.; Gutiérrez, S.; Monte, E.; Hermosa, R. Overexpression of the trichodiene synthase gene tri5 increases trichodermin production and antimicrobial activity in Trichoderma brevicompactum. Fungal Genet. Biol. 2011, 48, 285–296. [Google Scholar] [CrossRef]
  19. Leylaie, S.; Zafari, D. Antiproliferative and Antimicrobial Activities of Secondary Metabolites and Phylogenetic Study of Endophytic Trichoderma Species from Vinca Plants. Front. Microbiol. 2018, 9, 1484. [Google Scholar] [CrossRef] [Green Version]
  20. Benítez, T.; Rincón, A.M.; Limón, M.C.; Antonio, C.; Codón, A.C. Biocontrol mechanisms of Trichoderma strains. Int. Microbiol. 2004, 7, 249–260. [Google Scholar]
  21. Howell, C.R. Mechanisms Employed by Trichoderma Species in the Biological Control of Plant Diseases: The History and Evolution of Current Concepts. Plant Dis. 2003, 87, 4–10. [Google Scholar] [CrossRef] [PubMed] [Green Version]
  22. Vargas, W.A.; Mandawe, J.C.; Kenerley, C.M. Multifunctional fungal plant symbionts: New tools to enhance plant growth and productivity. New Phytol. 2011, 190, 806. [Google Scholar]
  23. Woo, S.L.; Lorito, M. Exploiting the interactions between fungal antagonists, pathogens and the plant for biocontrol. In Novel Biotechnologies for Biocontrol Agent Enhancement and Management; Vurro, M., Gressel, J., Eds.; Springer: Dordrecht, The Netherlands; Portici, NA, Italy, 2007. [Google Scholar]
  24. Sharma, P. Biocontrol genes from Trichoderma species: A review. Afr. J. Biotechnol. 2011, 10, 19898–19907. [Google Scholar]
  25. Suárez, M.B.; Vizcaíno, J.A.; Llobell, A.; Monte, E. Characterization of genes encoding novel peptidases in the biocontrol fungus Trichoderma harzianum CECT 2413 using the TrichoEST functional genomics approach. Curr. Genet. 2007, 51, 331–342. [Google Scholar] [CrossRef]
  26. Flores, A.; Chet, I.; Herrera-Estrella, A. Improved biocontrol activity of Trichoderma harzianum by over-expression of the proteinase-encoding gene prb1. Curr. Genet. 1997, 31, 30–37. [Google Scholar] [CrossRef]
  27. Cardoza, R.E.; Malmierca, M.G.; Gutiérrez, S. Overexpression of erg1 gene in Trichoderma harzianum CECT 2413: Effect on the induction of tomato defence-related genes. J. Appl. Microbiol. 2014, 117, 812–832. [Google Scholar] [CrossRef]
  28. Galarza, L.; Akagi, Y.; Takao, K.; Kim, C.S.; Maekawa, N.; Itail, A.; Peralta, E.; Santos, E.; Kodama, M. Characterization of Trichoderma species isolated in Ecuador and their antagonistic activities against phytopathogenic fungi from Ecuador and Japan. J. Gen. Plant Pathol. 2015, 81, 201–210. [Google Scholar] [CrossRef]
  29. Ichiro, M.; Sunhwa, K.; Yamamoto, Y.C.; Ajisaka, K.; Maruyama, J.I.; Nakajima, H.; Kitamoto, K. Cloning and Overexpression of β-N-Acetylglucosaminidase Encoding Genenag A from A spergillus oryzaeand Enzyme-catalyzed Synthesis of Human Milk Oligosaccharide. Biosci. Biotechnol. Biochem. 2014, 20, 646–650. [Google Scholar]
  30. Aires, R.D.S.; Steindorff, A.S.; Ramada, M.H.S.; Siqueira, S.J.L.D.; Ulhoa, C.J. Biochemical characterization of a 27 kDa 1,3-β-d-glucanase from Trichoderma asperellum induced by cell wall of Rhizoctonia solani. Carbohydr. Polym. 2012, 87, 1219–1223. [Google Scholar] [CrossRef] [Green Version]
  31. Olmedo-Monfil, V.; Mendoza-Mendoza, A.I.; Gómez, C.C.; Herrera-Estrella, A. Multiple environmental signals determine the transcriptional activation of the mycoparasitism related gene prb1 in Trichoderma atrovirid. Mol. Genet. Genom. 2002, 267, 703–712. [Google Scholar] [CrossRef]
  32. Reithner, B.; Brunner, K.; Schuhmacher, R.; Peissl, I.; Seidl, V.; Krska, R.; Zeilinger, S. The G protein α-subunit Tga1 of Trichoderma atroviride is involved in chitinase formation and differential production of antifungal metabolites. Fungal Genet. Biol. 2005, 42, 749–760. [Google Scholar] [CrossRef] [PubMed]
  33. Reithner, B.; Schuhmacher, R.; Stoppacher, N.; Pucher, M.; Brunner, K.; Zeilinger, S. Signaling via the Trichoderma atroviride mitogen-activated protein kinase Tmk1 differentially affects mycoparasitism and plant protection. Fungal Genet. Biol. 2007, 44, 1123–1133. [Google Scholar] [CrossRef] [PubMed] [Green Version]
  34. Sivasithamparam, K.; Ghisalberti, E.L. Secondary metabolism in Trichoderma and Gliocladium. In Trichoderma and Gliocladium; Kubicek, C.P., Harman, G.E., Eds.; Taylor & Francis: London, UK, 1998; Volume 1, pp. 139–191. [Google Scholar]
  35. Doan, T.L.; Hajji, M.E.; Rebuffat, S.; Rajesvari, M.R.; Bodo, B. Fluorescence studies of the interaction of trichorzianine A IIIc with model membranes. Biochim. Biophys. Acta 1986, 858, 1–5. [Google Scholar] [CrossRef]
  36. Bae, S.J.; Mohanta, T.K.; Chung, J.Y.; Ryu, M.J.; Park, G.; Shim, S.; Hong, S.B.; Seo, H.C.; Bae, D.W.; Bae, I.; et al. Trichoderma metabolites as Biological Control Agents against Phytophthora Pathogens. Biol. Control 2015, 92, 128–138. [Google Scholar] [CrossRef]
  37. Seidl, V.; Song, L.; Lindquist, E.; Gruber, S.; Koptchinskiy, A.; Sun, J.B.; Grigoriev, I.; Herrera-Estrella, A.; Baker, S.E.; Kubicek, C.P. Transcriptomic response of the mycoparasitic fungus Trichoderma atroviride to the presence of a fungal prey. BMC Genom. 2009, 10, 567. [Google Scholar] [CrossRef] [PubMed] [Green Version]
  38. Lorito, M.; Woo, S.L.; Harman, G.E.; Monte, E. Translational research on Trichoderma: From ‘omics to the field. Annu. Rev. Phytopathol. 2010, 48, 395. [Google Scholar] [CrossRef] [Green Version]
  39. Lorito, M.; Woo, S.L. Trichoderma: A Multi-Purpose Tool for Integrated Pest Management. In Principles of Plant-Microbe Interactions; Springer International Publishing: Portici, NA, Italy, 2015. [Google Scholar]
  40. Wang, Z.; Gerstein, M.; Snyder, M. RNA-Seq: A revolutionary tool for transcriptomics. Nat. Rev. Genet. 2010, 10, 57–63. [Google Scholar] [CrossRef]
  41. Clark, T.A. Genomewide Analysis of mRNA Processing in Yeast Using Splicing-Specific Microarrays. Science 2002, 296, 907–910. [Google Scholar] [CrossRef] [Green Version]
  42. David, L.; Huber, W.; Granovskaia, M.; Toedling, J.; Palm, C.J.; Bofkin, L.; Jones, T.; Davis, R.W.; Steinmetz, L.M. A high-resolution map of transcription in the yeast genome. Proc. Natl. Acad. Sci. USA 2006, 103, 5320–5325. [Google Scholar] [CrossRef] [Green Version]
  43. He, J.; Benedito, V.A.; Wang, M.; Wuray, J.D.; Zhao, P.X.; Tang, Y.H.; Udvardi, M.K. The Medicago truncatula gene expression atlas web server. BMC Bioinform. 2009, 10, 441. [Google Scholar] [CrossRef] [Green Version]
  44. Cloonan, N.; Forrest, A.R.R.; Kolle, G.; Gardiner, B.B.A.; Faulkner, G.J.; Brown, M.K.; Taylor, D.F.; Steptoe, A.L.; Wani, S.; Bethel, G. Stem cell transcriptome profiling via massive-scale mRNA sequencing. Nat. Methods 2008, 5, 613–619. [Google Scholar] [CrossRef]
  45. Morin, R.; Bainbridge, M.; Fejes, A.; Martin, H.; Krzywinski, M.; Pugh, T.J.; Mcdonald, H.; Varhol, R.; Jones, S.J.M.; Marra, M.A. Profiling the HeLa S3 transcriptome using randomly primed cDNA and massively parallel short-read sequencing. Biotechniques 2008, 4, 81–94. [Google Scholar] [CrossRef] [PubMed] [Green Version]
  46. Nagalakshmi, U.; Wang, Z.; Waern, K.; Shou, c.; Raha, D.; Gerstein, M.; Snyder, M. The Transcriptional Landscape of the Yeast Genome Defined by RNA Sequencing. Science 2008, 320, 1344–1349. [Google Scholar] [CrossRef] [PubMed] [Green Version]
  47. Min, Y.; Huang, Y.Y.; Jia, Z.H.; Ge, W.; Zhang, L.; Zhao, Q.; Song, S.S.; Huang, Y.L. Whole RNA-sequencing and gene expression analysis of Trichoderma harzianum Tr-92 under chlamydospore-producing condition. Genes Genom. 2019, 41, 689–699. [Google Scholar]
  48. Laura, L.; Susan, P.M.; Rosa, E.C.; Daren, W.B.; Hye, S.K.; Nancy, J.A.; Robert, H.P.; Santiago, G. Effect of deletion of a trichothecene toxin regulatory gene on the secondary metabolism transcriptome of the saprotrophic fungus Trichoderma arundinaceum. Fungal Genet. Biol. 2018, 8, 26–49. [Google Scholar]
  49. Pradeep, K.D.; Crespo, A.; Wedin, M. Evolution of complex symbiotic relationships in a morphologically derived family of lichen-forming fungi. New Phytol. 2015, 208, 1217–1226. [Google Scholar]
  50. Boddy, L.; Hiscox, J. Fungal Ecology: Principles and Mechanisms of Colonization and Competition by Saprotrophic Fungi. Microbiol. Spectr. 2016, 4, 293–308. [Google Scholar]
  51. Terhonen, E.; Sipari, N.; Asiegbu, F.O. Inhibition of phytopathogens by fungal root endophytes of Norway spruce. Biol. Control 2016, 99, 53–63. [Google Scholar] [CrossRef]
  52. Yin, D.C.; Deng, X.; Ilan, C.H.E.T.; Song, R.Q. Inhibiting effect and mechanism of Trichoderma virens T43 on four major species of forest pathogen. Chin. J. Ecol. 2014, 33, 1911–1919. [Google Scholar]
  53. Deng, X.; Song, X.S.; Yin, D.C.; Song, R.Q.; Ma, X.Q.; Zhang, X. Study on Screening of High Efficient Trichoderma Strains and Its Biocontrol of Seedling Blight. J. Jilin Agric. Univ. 2013, 35, 282–287. [Google Scholar]
  54. Bell, D.K. In Vitro Antagonism of Trichoderma species Against Six Fungal Plant Pathogens. Phytopathology 1982, 72, 379–382. [Google Scholar] [CrossRef]
  55. Qu, Y.; Lian, B. Bioleaching of rare earth and radioactive elements from red mud using Penicillium tricolor RM-10. Bioresour. Technol. 2013, 136, 16–23. [Google Scholar] [CrossRef] [PubMed]
  56. Xia, M.; Bao, P.; Liu, A.; Wang, M.; Shen, L.; Yu, R.; Liu, Y.; Chen, M.; Li, J.K.; Wu, X.L.; et al. Bioleaching of low-grade waste printed circuit boards by mixed fungal culture and its community structure analysis. Resour. Conserv. Recycl. 2018, 136, 267–275. [Google Scholar] [CrossRef]
  57. Hu, L.F. Studies on antifungal actions of cuminum cyminum L. In Seed; Northwest A&F University: Yangling, China, 2008. [Google Scholar]
  58. Deng, X.; Song, X.S.; Yin, D.C.; Song, R.Q. Water-based and dry powder formulation preparation of Trichoderma virens T43 and its field Application. For. Pest Dis. 2014, 33, 8–12. [Google Scholar]
  59. Dubey, S.C.; Suresh, M.; Singh, B. Evaluation of Trichoderma species against Fusarium oxysporum f. sp. ciceris for integrated management of chickpea wilt. Biol. Control 2007, 40, 118–127. [Google Scholar] [CrossRef]
  60. Iquee, S.; Cheong, B.E.; Taslima, K.; Kausar, H.; Hansan, M.M. Separation and Identification of Volatile Compounds from Liquid Cultures of Trichoderma harzianum by GC-MS using Three Different Capillary Columns. J. Chromatogr. Sci. 2012, 50, 358–367. [Google Scholar]
  61. Liu, S.; Lv, Z.; Liu, Y.; Li, L.; Zhang, l.d. Network analysis of ABA-dependent and ABA-independent drought responsive genes in Arabidopsis thaliana. Genet. Mol. Biol. 2018, 41, 624–637. [Google Scholar] [CrossRef] [Green Version]
  62. Bashir, W.; Anwar, S.; Zhao, Q.; Hussain, I.; Xie, F. Interactive effect of drought and cadmium stress on soybean root morphology and gene expression. Ecotoxicol. Environ. Saf. 2019, 175, 90–101. [Google Scholar] [CrossRef]
  63. Bolger, A.M.; Lohse, M.; Usadel, B. Trimmomatic: A flexible trimmer for Illumina sequence data. Bioinformatics 2014, 30, 2114–2120. [Google Scholar] [CrossRef] [Green Version]
  64. Klein, A.M.; Mazutis, L.; Akartuna, I.; Tallapragada, N.; Veres, A.; Li, V.; Kirschner, M.W. Droplet barcoding for single-cell transcriptomics applied to embryonic stem cells. Cell 2015, 161, 1187–1201. [Google Scholar] [CrossRef] [Green Version]
  65. Chu, C.; Wu, Y.F. An SVM-based approach for discovering splicing junctions with RNA-Seq. In Proceedings of the IEEE International Conference on Computational Advances in Bio and Medical Sciences (ICCABS), Miami, FL, USA, 2–4 June 2014. [Google Scholar]
  66. Dewey, C.N.; Bo, L. RSEM: Accurate transcript quantification from RNA-Seq data with or without a reference genome. BMC Bioinform. 2011, 12, 323. [Google Scholar]
  67. Wang, X.; Cairns, M.J. SeqGSEA: A Bioconductor package for gene set enrichment analysis of RNA-Seq data integrating differential expression and splicing. Bioinformatics 2014, 30, 1777–1779. [Google Scholar] [CrossRef] [Green Version]
  68. Velmourougane, K.; Prasanna, R.; Supriya, P.; Ramakrishnan, B.; Thapa, S.; Saxena, A.K. Transcriptome profiling provides insights into regulatory factors involved in Trichoderma viride-Azotobacter chroococcum biofilm formation. Microbiol. Res. 2019, 227, 126–292. [Google Scholar] [CrossRef] [PubMed]
  69. Durechova, D.; Jopcik, M.; Rajninec, M.; Jana, M.; Jana, L. Expression of Drosera rotundifolia Chitinase in Transgenic Tobacco Plants Enhanced Their Antifungal Potential. Mol. Biotechnol. 2019, 61, 916–928. [Google Scholar] [CrossRef] [PubMed]
  70. Livak, K.J.; Schmittgen, T.D. Analysis of relative gene expression data using Real-Time quantitative PCR and the 2 -(∆∆Ct) method. Methods 2001, 25, 402–408. [Google Scholar] [CrossRef] [PubMed]
  71. Sood, M.; Kapoor, D.; Kumar, V.; Sheteiwy, M.S.; Ramakrishnan, M.; Landi, M.; Araniti, F.; Sharma, A. Trichoderma: The “Secrets” of a Multitalented Biocontrol Agent. Plants 2020, 9, 762. [Google Scholar] [CrossRef]
  72. Harwoko, H.; Daletos, G.; Stuhldreier, F.; Lee, J.; Wesselborg, S.; Feldbrügge, M.; Müller, W.E.G.; Kalscheuer, R.; Ancheeva, E.; Proksch, P. Dithiodiketopiperazine derivatives from endophytic fungi Trichoderma harzianum and Epicoccum nigrum. Nat. Prod. Res. 2019, 3, 1–9. [Google Scholar] [CrossRef]
  73. Mukherjee, M.; Mukherjee, P.K.; Horwitz, B.A.; Zachow, C.; Berg, G.; ZEILINGER, S. Trichoderma–Plant–Pathogen Interactions: Advances in Genetics of Biological Control. Indian J. Microbiol. 2012, 52, 522–529. [Google Scholar] [CrossRef] [Green Version]
  74. Li, J.S.; Wu, Y.Z.; Chen, K.; Wang, Y.L.; Hu, J.D.; Wei, Y.L.; Yang, H.T. Trichoderma cyanodichotomus sp. nov. a new soil-inhabiting species with a potential for biological control. Can. J. Microbiol. 2018, 64, 1020–1029. [Google Scholar] [CrossRef]
  75. Macías-Rodríguez, L.; Guzmán-Gómez, A.; García-Juárez, P.; Contreras-Cornejo, H.A. Trichoderma atroviride promotes tomato development and alters the root exudation of carbohydrates, which stimulates fungal growth and the biocontrol of the phytopathogen Phytophthora cinnamomi in a tripartite interaction system. FEMS Microbiol. Ecol. 2018. [Google Scholar] [CrossRef] [Green Version]
  76. Kredics, L.; Liqiong, C.; Orsolya, K.; Rita, B.; Lóránt, H.; Henrietta, A.; Viktor, N.; Khaled, J.M.; Naiyf, S.A.; Alharbi, N.S.; et al. Molecular Tools for Monitoring Trichoderma in Agricultural Environments. Front. Microbiol. 2018, 9, 1599. [Google Scholar] [CrossRef] [PubMed]
  77. Sharma, V.; Salwan, R.; Sharma, P.N. Differential Response of Extracellular Proteases of Trichoderma Harzianum against Fungal Phytopathogens. Curr. Microbiol. 2016, 73, 419–425. [Google Scholar] [CrossRef]
  78. Stappler, E.; Christoph, D.; Tisch, D.; Monika, S. Analysis of Light- and Carbon-Specific Transcriptomes Implicates a Class of G-Protein-Coupled Receptors in Cellulose Sensing. mSphere 2017, 2. [Google Scholar] [CrossRef] [PubMed] [Green Version]
  79. Francesca, B.; Silvia, C.; Franzetti, E.; Congiu, T.; Marinelli, F.; Casartelli, M.; Tettamanti, G. Effects of Trichoderma viride chitinases on the peritrophic matrix of Lepidoptera. Pest Manag. Sci. 2016, 72, 980–989. [Google Scholar]
  80. Xiong, H.; Xue, K.; Qin, W.; Chen, X.; Wang, H.F.; Shi, X.H.; Ma, T.; Sun, Z.H.; Chen, W.G.; Tian, X.Q.; et al. Does Soil Treated with Conidial Formulations of Trichoderma spp. Attract or Repel Subterranean Termites. J. Econ. Entomol. 2018, 111, 808–816. [Google Scholar] [CrossRef]
  81. Ravindra, B.; Mala, M.; Benjamin, A.H.; Prasun, K.M. Regulation of conidiation and antagonistic properties of the soil-borne plant beneficial fungus Trichoderma virens by a novel proline-, glycine-, tyrosine-rich protein and a GPI-anchored cell wall protein. Curr. Genet. 2019, 65, 953–964. [Google Scholar]
  82. Dautt-Castro, M.; Estrada-Rivera, M.; Olguin-Martínez, I.; Rocha-Medina, M.D.C.; Islas-Osuna, M.A.; Casas-Flores, S. TBRG-1 a Ras-like protein in Trichoderma virens involved in conidiation, development, secondary metabolism, mycoparasitism, and biocontrol unveils a new family of Ras-GTPases. Fungal Genet. Biol. 2019, 136, 103292. [Google Scholar] [CrossRef]
  83. Saravanakumar, K.; Wang, M.H. Isolation and molecular identification of Trichoderma species from wetland soil and their antagonistic activity against phytopathogens. Physiol. Mol. Plant Pathol. 2020, 109, 101458. [Google Scholar] [CrossRef]
  84. Ngikoh, B.; Karim, N.A.A.; Jahim, J. Characterisation of Cellulases and Xylanase from Trichoderma virens UKM1 and its Potential in Oil Palm Empty Fruit Bunch (OPEFB) Saccharification. J. Phys. Ence 2017, 28, 171–184. [Google Scholar] [CrossRef] [Green Version]
  85. Kovalchuk, A.; Driessen, A.J.M. Phylogenetic analysis of fungal ABC transporters. BMC Genom. 2010, 11, 177. [Google Scholar] [CrossRef] [Green Version]
  86. Lanzuise, S.; Ruocco, M.; Scala, V.; Woo, S. Cloning of ABC transporter-encoding genes in Trichoderma spp. to determine their involvement in biocontrol. J. Plant Pathol. 2002, 84, 184. [Google Scholar]
  87. Ruocco, M.; Lanzuise, S.; Vinale, F.; Marra, R.; Turrà, D.; Woo, S.L.; Lorito, M. Identification of a New Biocontrol Gene in Trichoderma atroviride: The Role of an ABC Transporter Membrane Pump in the Interaction with Different Plant-Pathogenic Fungi. Mol. Plant Microbe Interact. 2009, 22, 291–301. [Google Scholar] [CrossRef] [Green Version]
  88. Srivastava, M.; Shahid, M. Trichoderma Genome to Genomics: A Review. J. Data Min. Genom. Proteom. 2014, 5, 1–4. [Google Scholar] [CrossRef] [Green Version]
  89. Montero-Barrientos, M.; Cardoza, R.E.; Santiago, G.; Lorito, S.; Monte, E.; Hermosa, R. The heterologous overexpression of hsp23, a small heat-shock protein gene from Trichoderma virens, confers thermotolerance to T. harzianum. Curr. Genet. 2007, 52, 45–53. [Google Scholar] [CrossRef] [PubMed]
Figure 1. Antagonistic effect of T. virens ZT05 against R. solani ((A), inhibition rate of T. virens ZT05 against R. solani; (B), relative inhibition effect of T. virens ZT05 against R. solani; (C), dural culture of T. virens ZT05 and R. solani; Tv, T. virens ZT05; Rs, R. solani).
Plants 09 00912 g001
Figure 2. Electron microscopic observation of T. virens ZT05 and R. solani in dural culture (Tv, T. virens ZT05 and Rs, R. solani).
Plants 09 00912 g002
Figure 3. Inhibitory effect of nonvolatile metabolites of T. virens ZT05 on R. solani (Rs) (Control, 20% Tween 80 solution; Rs + Tv, 20% nonvolatile metabolites solution).
Plants 09 00912 g003
Figure 4. Effect of nonvolatile metabolites on the enzyme activity of R. solani (Control, R. Solani mycelium soaking in 20% Tween 80 solution and ZT05, R. Solani mycelium soaking in 20% nonvolatile metabolites solution of T. virens ZT05).
Plants 09 00912 g004
Figure 5. Inhibitory effect of volatile metabolites of T. virens ZT05 on R. solani (Rs, R. solani; Tv, T. virens ZT05; and Rs control, R. solani control.).
Plants 09 00912 g005
Figure 6. Genes related to recognition and signal transduction in mycoparasitic process of T. virens ZT05. 1, 2, 3, 4, 5, 6, and 7 represent TRIVIDRAFT_81735, TRIVIDRAFT_63956, TRIVIDRAFT_58191, TRIVIDRAFT_35938, TRIVIDRAFT_30459, TRIVIDRAFT_59177, TRIVIDRAFT_138511, respectively.
Plants 09 00912 g006
Figure 7. Chitinase, glucanase, and protease genes from T. virens ZT05. 1, 2, 3, 4, 5, 6, 7, 8, 9, 10, 11, 12, and 13 represent TRIVIDRAFT_89797, TRIVIDRAFT_72072, TRIVIDRAFT_27891, TRIVIDRAFT_42536, TRIVIDRAFT_28149, TRIVIDRAFT_76895, TRIVIDRAFT_176639, TRIVIDRAFT_178019, TRIVIDRAFT_89999, ECH1, TRIVIDRAFT_69839, TRIVIDRAFT_213202, CHT1.1 gene name, respectively.
Plants 09 00912 g007
Figure 8. Resistance protein genes from T. virens ZT05. (A): 1, 2, 3, 4, 5, 6, 7, 8, 9, 10, and 11 represent TRIVIDRAFT_62654, TRIVIDRAFT_211837, TRIVIDRAFT_38645, TRIVIDRAFT_42391, TRIVIDRAFT_45041, TRIVIDRAFT_50977, TRIVIDRAFT_68923, TRIVIDRAFT_69465, TRIVIDRAFT_71556, TRIVIDRAFT_57595, TRIVIDRAFT_219995 gene name respectively. (B): 1,2,3,4,5,6,7,8,9,10 represent TRIVIDRAFT_216898, TRIVIDRAFT_80583, TRIVIDRAFT_215292, TRIVIDRAFT_210885, TRIVIDRAFT_89650, TRIVIDRAFT_195722, TRIVIDRAFT_78895, TRIVIDRAFT_217094, TRIVIDRAFT_76205, TRIVIDRAFT_192676 gene names, respectively. (C): TRIVIDRAFT_33722, TRIVIDRAFT_52608, TRIVIDRAFT_86623, TRIVIDRAFT_36031, TRIVIDRAFT_85589, TRIVIDRAFT_190418, TRIVIDRAFT_45576, TRIVIDRAFT_83793, TRIVIDRAFT_207997 gene names, respectively.
Plants 09 00912 g008
Figure 9. qRT-PCR quantitative analysis.
Plants 09 00912 g009
Table 1. qRT-PCR primer sequences.
GenePrimer NameSequence (5′–3′)
TRIVIDRAFT_563631-TRIVIDRAFT_56363-F
1-TRIVIDRAFT_56363-R
TATATGAGCGCTGCTAAGAT
AAATTGGGACTTGTGAGTGT
TRIVIDRAFT_1780192-TRIVIDRAFT_178019-3F
2-TRIVIDRAFT_178019-3R
GGATCCAGATTCAGTTCTAT
TRIVIDRAFT_2132023-TRIVIDRAFT_213202-3F
3-TRIVIDRAFT_213202-3R
GGATCCAGATTCAGTTCTAT
TRIVIDRAFT_720724-TRIVIDRAFT_72072-F
4-TRIVIDRAFT_72072-R
GGATCCAGATTCAGTTCTAT
TRIVIDRAFT_2261945-TRIVIDRAFT_226194-2F
5-TRIVIDRAFT_226194-2R
GGATCCAGATTCAGTTCTAT
CAGAAATCTGCATTTGCAAG
TRIVIDRAFT_639566-TRIVIDRAFT_63956-F
6-TRIVIDRAFT_63956-R
CAGAAATCTGCATTTGCAAG
CGTGCTTGCGATGTGTAAGT
TRIVIDRAFT_611067-TRIVIDRAFT_61106-F
7-TRIVIDRAFT_61106-R
CTCGGACAACAGCCAGTTTC
TRIVIDRAFT_805838-TRIVIDRAFT_80583-F
8-TRIVIDRAFT_80583-R
CTCGGACAACAGCCAGTTTC
Table 2. Results of transcriptome sequencing.
SampleRaw ReadsClean ReadsError Rate (%)Q30 (%)GC Content (%)Total Mapped
Tv47,012,424.0046,570,488.67 (99.00%)0.0295.9154.1743,264,365.67 (92.91%)
Rs-Tv45,402,895.3344,737,395.33 (99.00%)0.0295.5052.6626,959,925.00 (60.12%)
Total92,415,319.3391,307,884.00 (99.00%)0.0295.7153.4270,224,291.00 (76.52%)

