Article

Seed Total Protein Profiling in Discrimination of Closely Related Pines: Evidence from the Pinus mugo Complex

by
Konrad Celiński
1,*,
Joanna Sokołowska
1,
Agata Zemleduch-Barylska
2,
Roman Kuna
3,
Hanna Kijak
4,
Aleksandra Maria Staszak
5,
Aleksandra Wojnicka-Półtorak
1 and
Ewa Chudzińska
1
1
Department of Genetics, Institute of Experimental Biology, Faculty of Biology, School of Natural Sciences, Adam Mickiewicz University, Uniwersytetu Poznańskiego 6, 61-614 Poznań, Poland
2
Department of Biochemistry and Food Analysis, Faculty of Food and Nutrition Sciences, University of Life Sciences, Mazowiecka 48, 60-623 Poznań, Poland
3
Department of Botany and Genetics, Faculty of Natural Sciences, Constantine the Philosopher University in Nitra, Tr. A. Hlinku 1, 949 74 Nitra, Slovakia
4
Institute of Dendrology, Polish Academy of Sciences, Parkowa 5, 62-035 Kórnik, Poland
5
Laboratory of Plant Physiology, Department of Plant Biology and Ecology, Faculty of Biology, University of Bialystok, Ciołkowskiego 1J, 15-245 Białystok, Poland
*
Author to whom correspondence should be addressed.
Plants 2020, 9(7), 872; https://doi.org/10.3390/plants9070872
Submission received: 12 June 2020 / Revised: 29 June 2020 / Accepted: 7 July 2020 / Published: 9 July 2020
(This article belongs to the Special Issue Systematics and the Conservation of Plant Diversity)

Abstract

:
The Pinus mugo complex includes several dozen closely related European mountain pines. The discrimination of specific taxa within this complex is still extremely challenging, although numerous methodologies have been used to solve this problem, including morphological and anatomical analyses, cytological studies, allozyme variability, and DNA barcoding, etc. In this study, we used the seed total protein (STP) patterns to search for taxonomically interesting differences among three closely-related pine taxa from the Pinus mugo complex and five more distant species from the Pinaceae family. It was postulated that STP profiling can serve as the backup methodology for modern taxonomic research, in which more sophisticated analyses, i.e., based on the DNA barcoding approach, have been found to be useless. A quantitative analysis of the STP profiles revealed characteristic electrophoretic patterns for all the analyzed taxa from Pinaceae. STP profiling enabled the discrimination of closely-related pine taxa, even of those previously indistinguishable by chloroplast DNA barcodes. The results obtained in this study indicate that STP profiling can be very useful for solving complex taxonomic puzzles.

1. Introduction

In all biological research, reliable and unambiguous identification of the analyzed material is fundamental, as inaccuracies in this regard lead to incorrect and misleading conclusions [1]. The complexity of a biological object, founded by both genetic and environmental determinants, makes it challenging to unambiguously define its phylogenetic relationships and taxonomy. Classic approaches are based on the characteristics of the morphological and anatomical features. However, such taxonomy is severely disturbed by the impact of environmental factors that do not reflect the actual discrimination of the species. In contrast, molecular studies, addressing the genetic determinants with high precision, meet the requirements of unambiguous species discrimination and identification. Moreover, a molecular approach enables insight into the various phenomena and evolutionary processes occurring between species, or the determination of their genetic origin.
The use of molecular markers in taxonomy and phylogenetics dates back to the 1960s, when protein markers (mainly seed storage proteins) were used in plant taxonomic research [2]. Consequently, the discovery of allozymes variability and their analysis through gel assays enabled insight into genetic diversity and the genetic structure of many different populations [3,4]. Alongside this, the other molecular compounds entered taxonomical studies, including small-molecular weight metabolites (such as those contained in essential oils) as new taxonomical descriptors, leading to the rapid development of chemotaxonomy [5,6,7,8]. Other recent studies have shown that the current taxonomic problems can be successfully addressed using protein pattern analysis for distinguishing Nepenthes L. species [9].
Around the 1980s, the spectrum of tools used in taxonomic and phylogenetic research began to expand rapidly, mainly because of the development of various types of DNA markers [10]. Recently, a very interesting concept of DNA barcoding emerged [11,12], relying on the use of one or several highly polymorphic DNA regions for the simple and unambiguous identification and discrimination of species [13,14,15]. Currently, the DNA barcoding approach is being replaced by a comparative analysis of the whole genomes enabled by the advanced sequencing techniques and bioinformatic tools [16]. The so called “super-barcoding” operating at whole genomes was successfully applied to discriminate several taxa [17,18]. Still, as evidenced in the previous reports [1], the use of DNA barcoding does not guarantee a solution to all taxonomic problems. This particularly applies to the discrimination of individual taxa in a group of closely related organisms (species complex). Hence, backup methodologies addressing the other molecular parameters are still welcomed. Moreover, all of the above mentioned methodologies differ in terms of the species discrimination rate (resolution of the given method), level of difficulty, availability and required quantity of the material for the research, or the cost of the analysis.
Seed total protein (STP) profiling has been used in taxonomic and evolutionary studies since around the 1960s [2]. Using this technique, it has been possible to determine the level of genetic diversity and to estimate thephylogenetic relationships of many species and genera, including Opuntia Mill. [19], Crotalaria L. [20], Capsium L. [21], Bauhinia L. [22], Lathyrus L. [23], Consolida Gray [24], or Hordeum L. [25], demonstrating its usefulness in this regard. However, this method has not been widely used in the studies of gymnosperms, including the members of the Pinaceae family. Therefore, little is known about its usefulness in the discrimination of pine taxa.
Pinus mugo complex refers to an aggregate of European mountain pines, covering several dozens of different taxa. The most known and the best studied are Pinus mugo Turra, Pinus uncinata Ramond, and Pinus uliginosa Neumann ex Wimmer. The taxonomic and evolutionary status in this complex is still not resolved, which is founded by the following: common usage of synonymous names describing probably the same taxa, sympatric occurrence of the taxa accompanied by the presence of hybrid individuals, and ongoing hybridization processes [26,27,28], which altogether led to difficulties in the discrimination of species with a similar morphology, or inaccurate assigning of individuals to a particular taxa. Taxonomic and evolutionary relationships among closely related taxa in the Pinus mugo complex have been studied in detail for many years using various tools and methods, i.e., serological [29], allozymatic [30,31], RAPD markers [32], molecular cytogenetics, and flow cytometry [33,34], as well as the DNA barcoding approach [1]. The obtained results show a similar genetic background and a lack of distinct genetic differences among them. The origins, reciprocal relationships, species discrimination, and the rank of individual taxa in the Pinus mugo complex remain puzzling and require further research in order to reach the consensus. On the other hand, recent chemotaxonomic studies on some representatives of the Pinus mugo complex revealed species-specific differences in the composition of the essential oils and volatile compounds extracted from needles [35,36], suggesting the need for further research using alternative approaches.
The present research was undertaken to examine the pattern of STPs of selected taxa from the Pinus mugo complex, and to determine the potential usefulness of the STPs profiling method in the discrimination of closely related pine taxa, which has not been previously addressed. The specific goals of this work comprise the following: (1) STP profiling in selected members of the Pinaceae family, including closely related Pinus mugo, Pinus uliginosa, and Pinus × rhaetica Brügger from the Pinus mugo complex; (2) identification of diagnostic bands, useful in the discrimination of the taxa; (3) conducting cluster analysis and phylogenetic inference based on STP patterns; and finally (4) conclusions on whether the STP-based results obtained here confirm, complement, or contradict our previously obtained data on DNA barcoding and chemotaxonomy in these taxa.

2. Results and Discussion

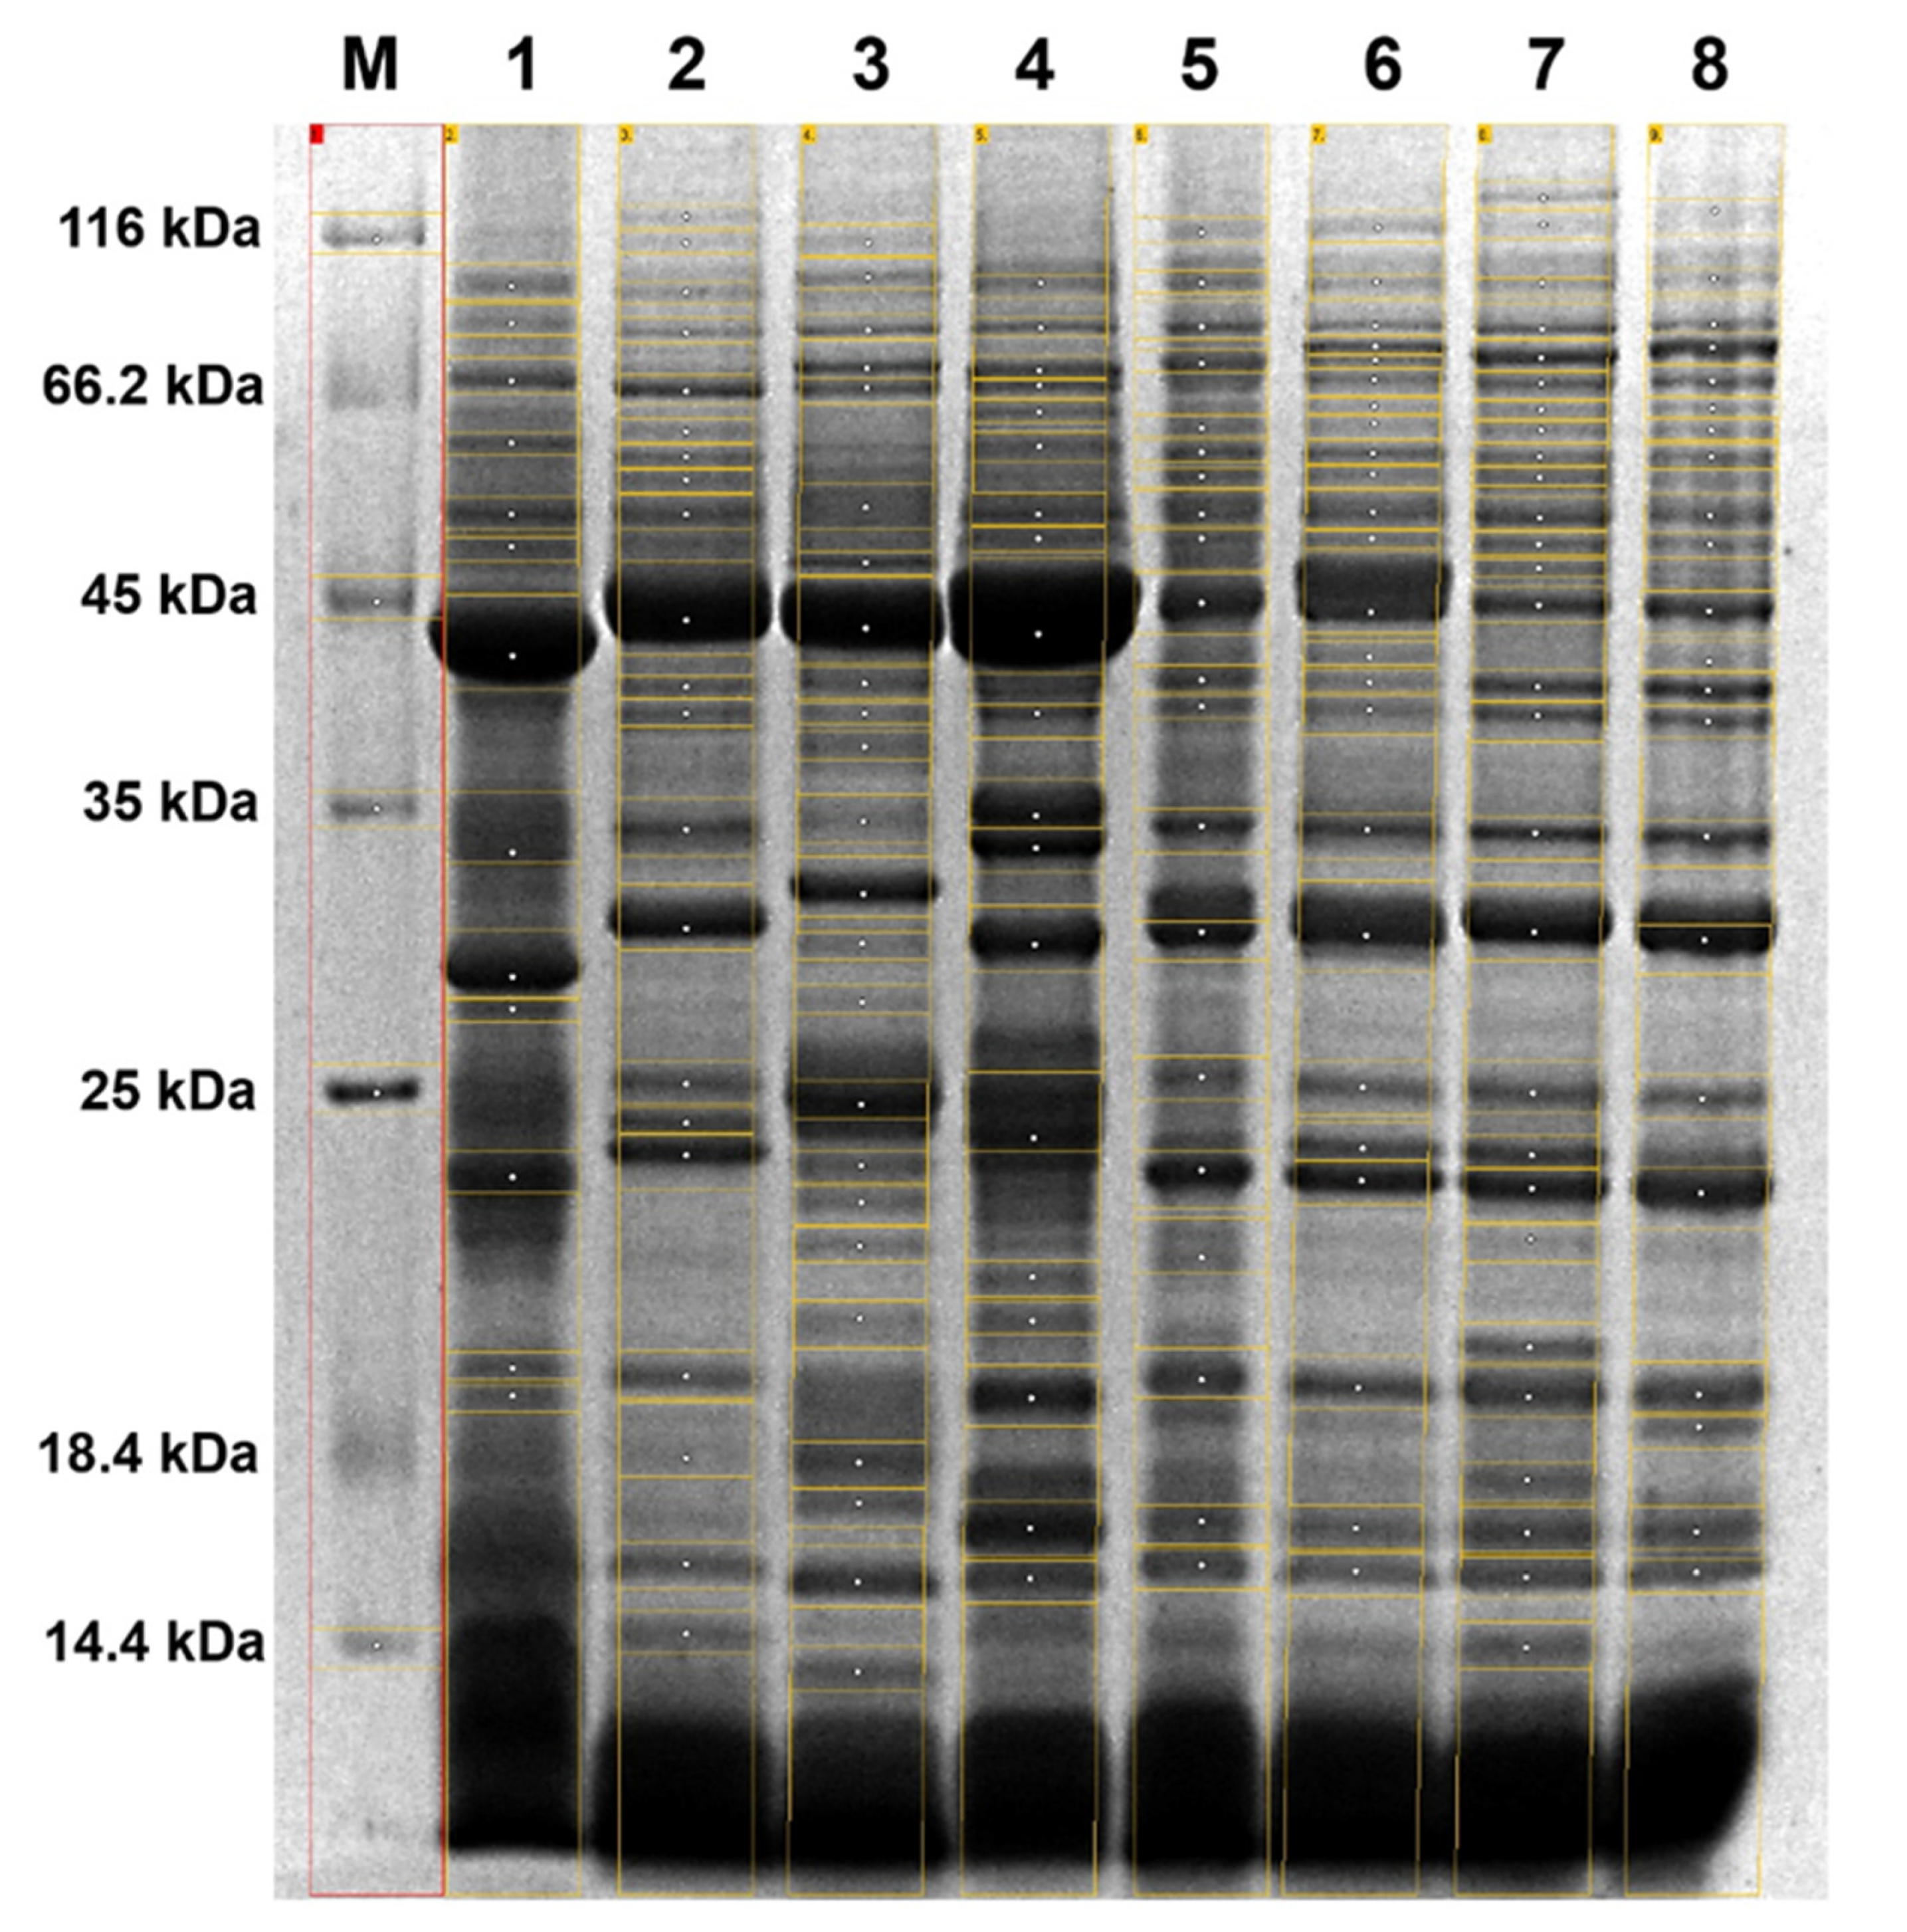
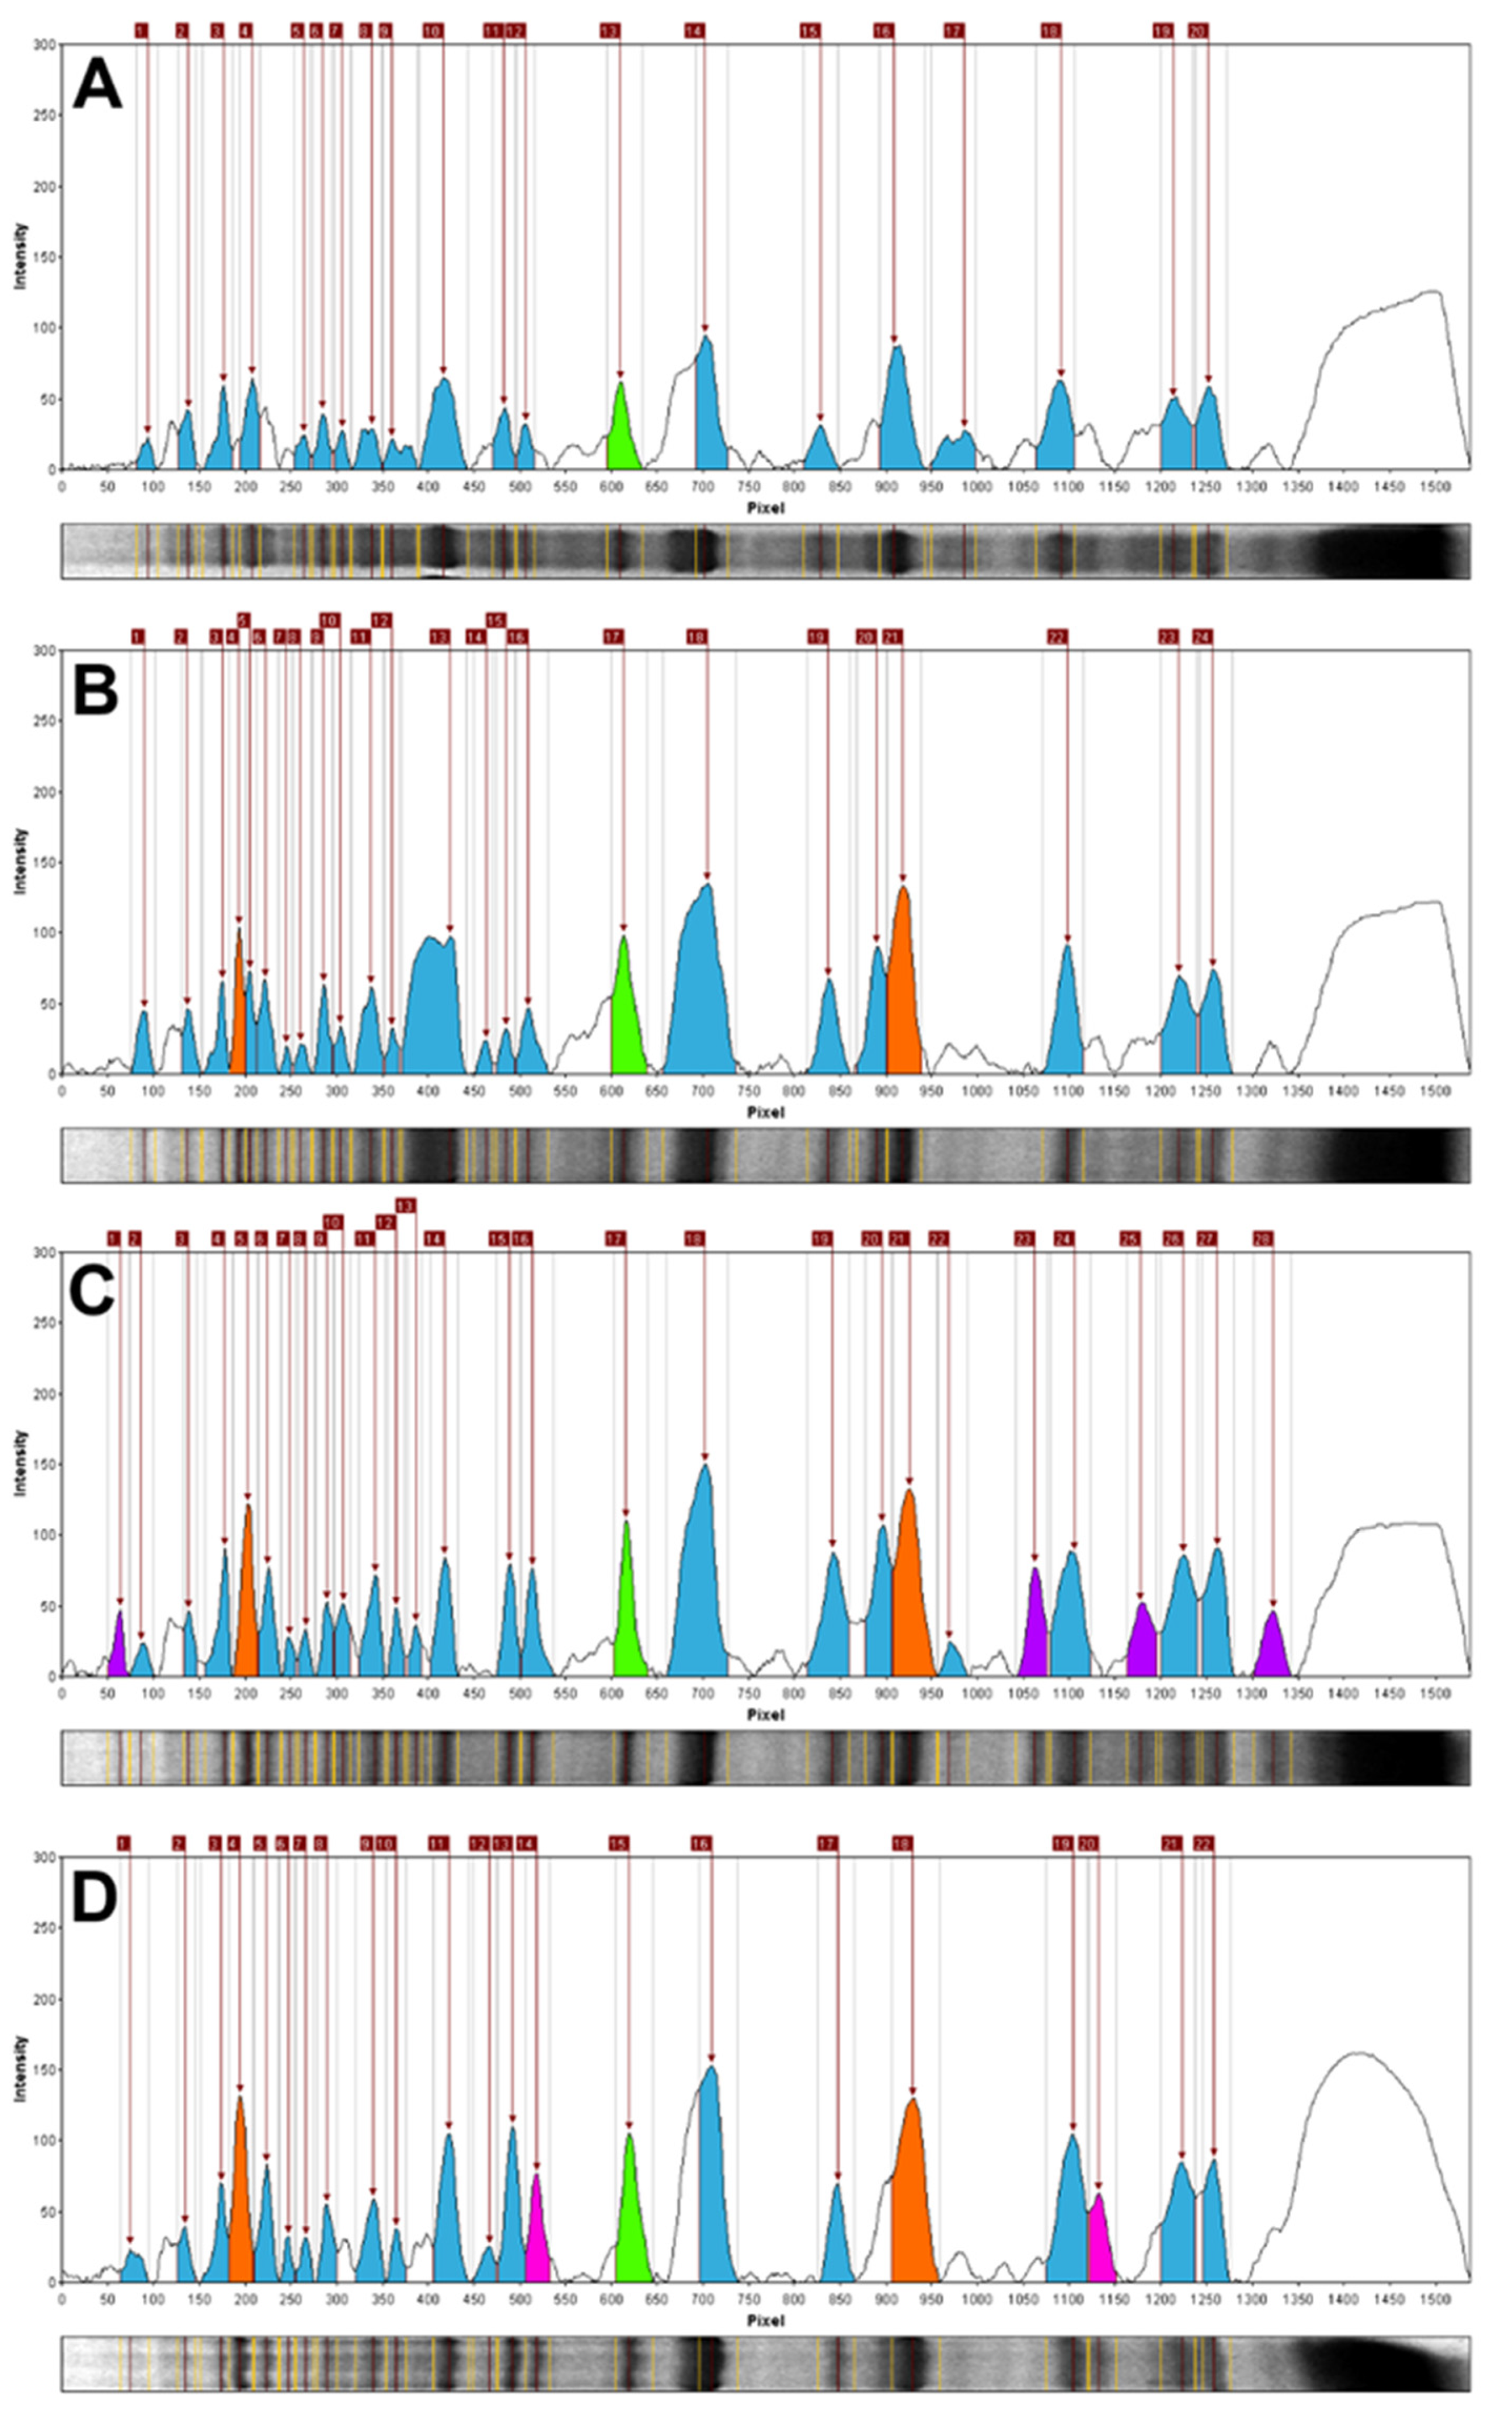
2.1. STPs Profiling—Interspecific Comparative Analysis

A quantitative analysis of the STP profiles from the eight taxa under study revealed interspecific variations in terms of the band number and their relative mobility value (Rf; Figure 1).
The macroscopically observed variation between the STP profiles was confirmed using digital image processing tools. The number of bands for individual STPs varied from 13 for Abies koreana E.H. Wilson to 28 for Pinus uliginosa (Table 1), with the average number of 21.375 bands per separated STP preparation. In total, 66 bands with a different relative mobility value (Rf) were identified, ranging from Rf of 0.04 to 0.87, which correspond to molecular weights from 14.3 kDa to 130.8 kDa.
Surprisingly, only one band out of those 66 (assigned a specific Rf value = 0.22) was present in all of the analyzed STP profiles. Unique bands were identified for seven of the eight analyzed taxa (87.5%), and their numbers ranged from two bands for Abies koreana, Pinus sylvestris L., and Pinus mugo, to seven bands identified for Pinus strobus L. Overall, the STP profiles of the Pinus taxa were more complex, represented by more bands than the STP profiles of the other analyzed taxa from the Pinaceae family.
As postulated previously, common bands in the protein profile may indicate a hybrid origin of taxa. The usefulness of STP intermediate (hybrid) profiles as a proof of a hybrid origin of species was demonstrated in studies on Amaranthus L. [37]. In the present study, one taxon (Pinus × rhaetica) did not have any species specific protein band, despite the presence of 24 bands in the protein profile, which is a relatively high number. In the scientific literature, Pinus × rhaetica is sometimes used as a synonymous name of Pinus uliginosa, suggesting the existence of only one taxon [27]. In other reports, Pinus × rhaetica and Pinus uliginosa are considered to be hybrid individuals, representing two separate taxa [34]. Even more puzzling, the postulated parental species for the two above-mentioned taxa are exactly the same, i.e., monocormic (Pinus sylvestris) and polycormic (Pinus mugo) [27].
Previously conducted research clearly indicates the possibility of crossings between taxa from the Pinus mugo complex with Pinus sylvestris, and the formation of hybrid individuals [28,38,39,40]. The absence of species specific bands in the Pinus × rhaetica STP profile may not necessarily be evidence of its hybrid origin and intermediate profile (a hybrid of parental taxa profiles). It may equally well indicate that it is a young taxon that has not yet accumulated the relevant mutations, as observable in the STP pattern. However, the higher number of common bands of Pinus × rhaetica with Pinus sylvestris STP profiles (15), than between Pinus × rhaetica and Pinus mugo (13), suggests a closer phylogenetic relationship with the former. Interestingly, Pinus uliginosa STPs profile shares 10 and 16 common bands with its putative parents, i.e., Pinus sylvestris and Pinus mugo, respectively, indicating closer phylogenetic relationship with Pinus mugo than with Pinus sylvestris. This is the opposite to the second postulated hybrid descendant of the two species—Pinus × rhaetica.
Notably, the densitometric analysis of the STP profiles of Pinus × rhaetica and Pinus uliginosa showed their clear dissimilarity. Both taxa differed in terms of the total number of bands (24 and 28, respectively), as well as in their relative mobility range (Rf of 0.06–0.82 for Pinus × rhaetica and 0.04–0.86 for Pinus uliginosa). Correspondingly, the number of unique bands was different for the two STPs profiles; no bands for Pinus × rhaetica and four bands for Pinus uliginosa (Table 1 and Figure 2).
Importantly, these results are consistent with our previous findings, where the cytogenetic analysis demonstrated some differences in the DNA content and C-banding pattern of chromosome sets between Pinus × rhaetica and P. uliginosa, suggesting that the interchangeable use of their names as synonyms is unsupported [34]. Nevertheless, the unambiguous determination of their taxonomic status and phylogenetic origin requires further research, as it is clear that this challenging problem still remains unresolved. Recently, the same methodological approach, i.e., STP profiling and cytological analysis, was sufficient for the evaluation of the genetic diversity of species belonging to the Solanaceae Juss. family (S. melongena L., S. xanthocarpum L., Datura alba L., Lycopersicon esculantum L., and Capsium annum L.) [41].
While the densitometric analysis conducted here differentiates Pinus × rhaetica and Pinus uliginosa from each other, diagnostic bands for all three representatives of the Pinus mugo complex (Table 1) could be identified (Figure 2; in orange). The STP profiles of all three taxa from this complex represent two common bands with a relative mobility of Rf = 0.13 and Rf = 0.60. While the band Rf = 0.60 was also present in Abies koreana, it is still accurate to use it as a semi-diagnostic band for the Pinus mugo complex, as it is difficult to confuse Abies with Pinus, considering their morphology. Importantly, a specific diagnostic band (Rf = 0.40) of the entire Pinus section was identified, which was not present in either Abies koreana, Pseudotsuga menziesii, or Pinus strobus from the Strobus section. Corresponding observations on the existence of shared diagnostic bands in STPs profiles of closely related pines (P. sylvestris, Pinus mugo, and Pinus uncinata) from amongst twelve analyzed taxa were done by Schirone et al. [42]. The current analysis enabled the identification of diagnostic bands for the Pinus mugo complex and for the section Pinus.

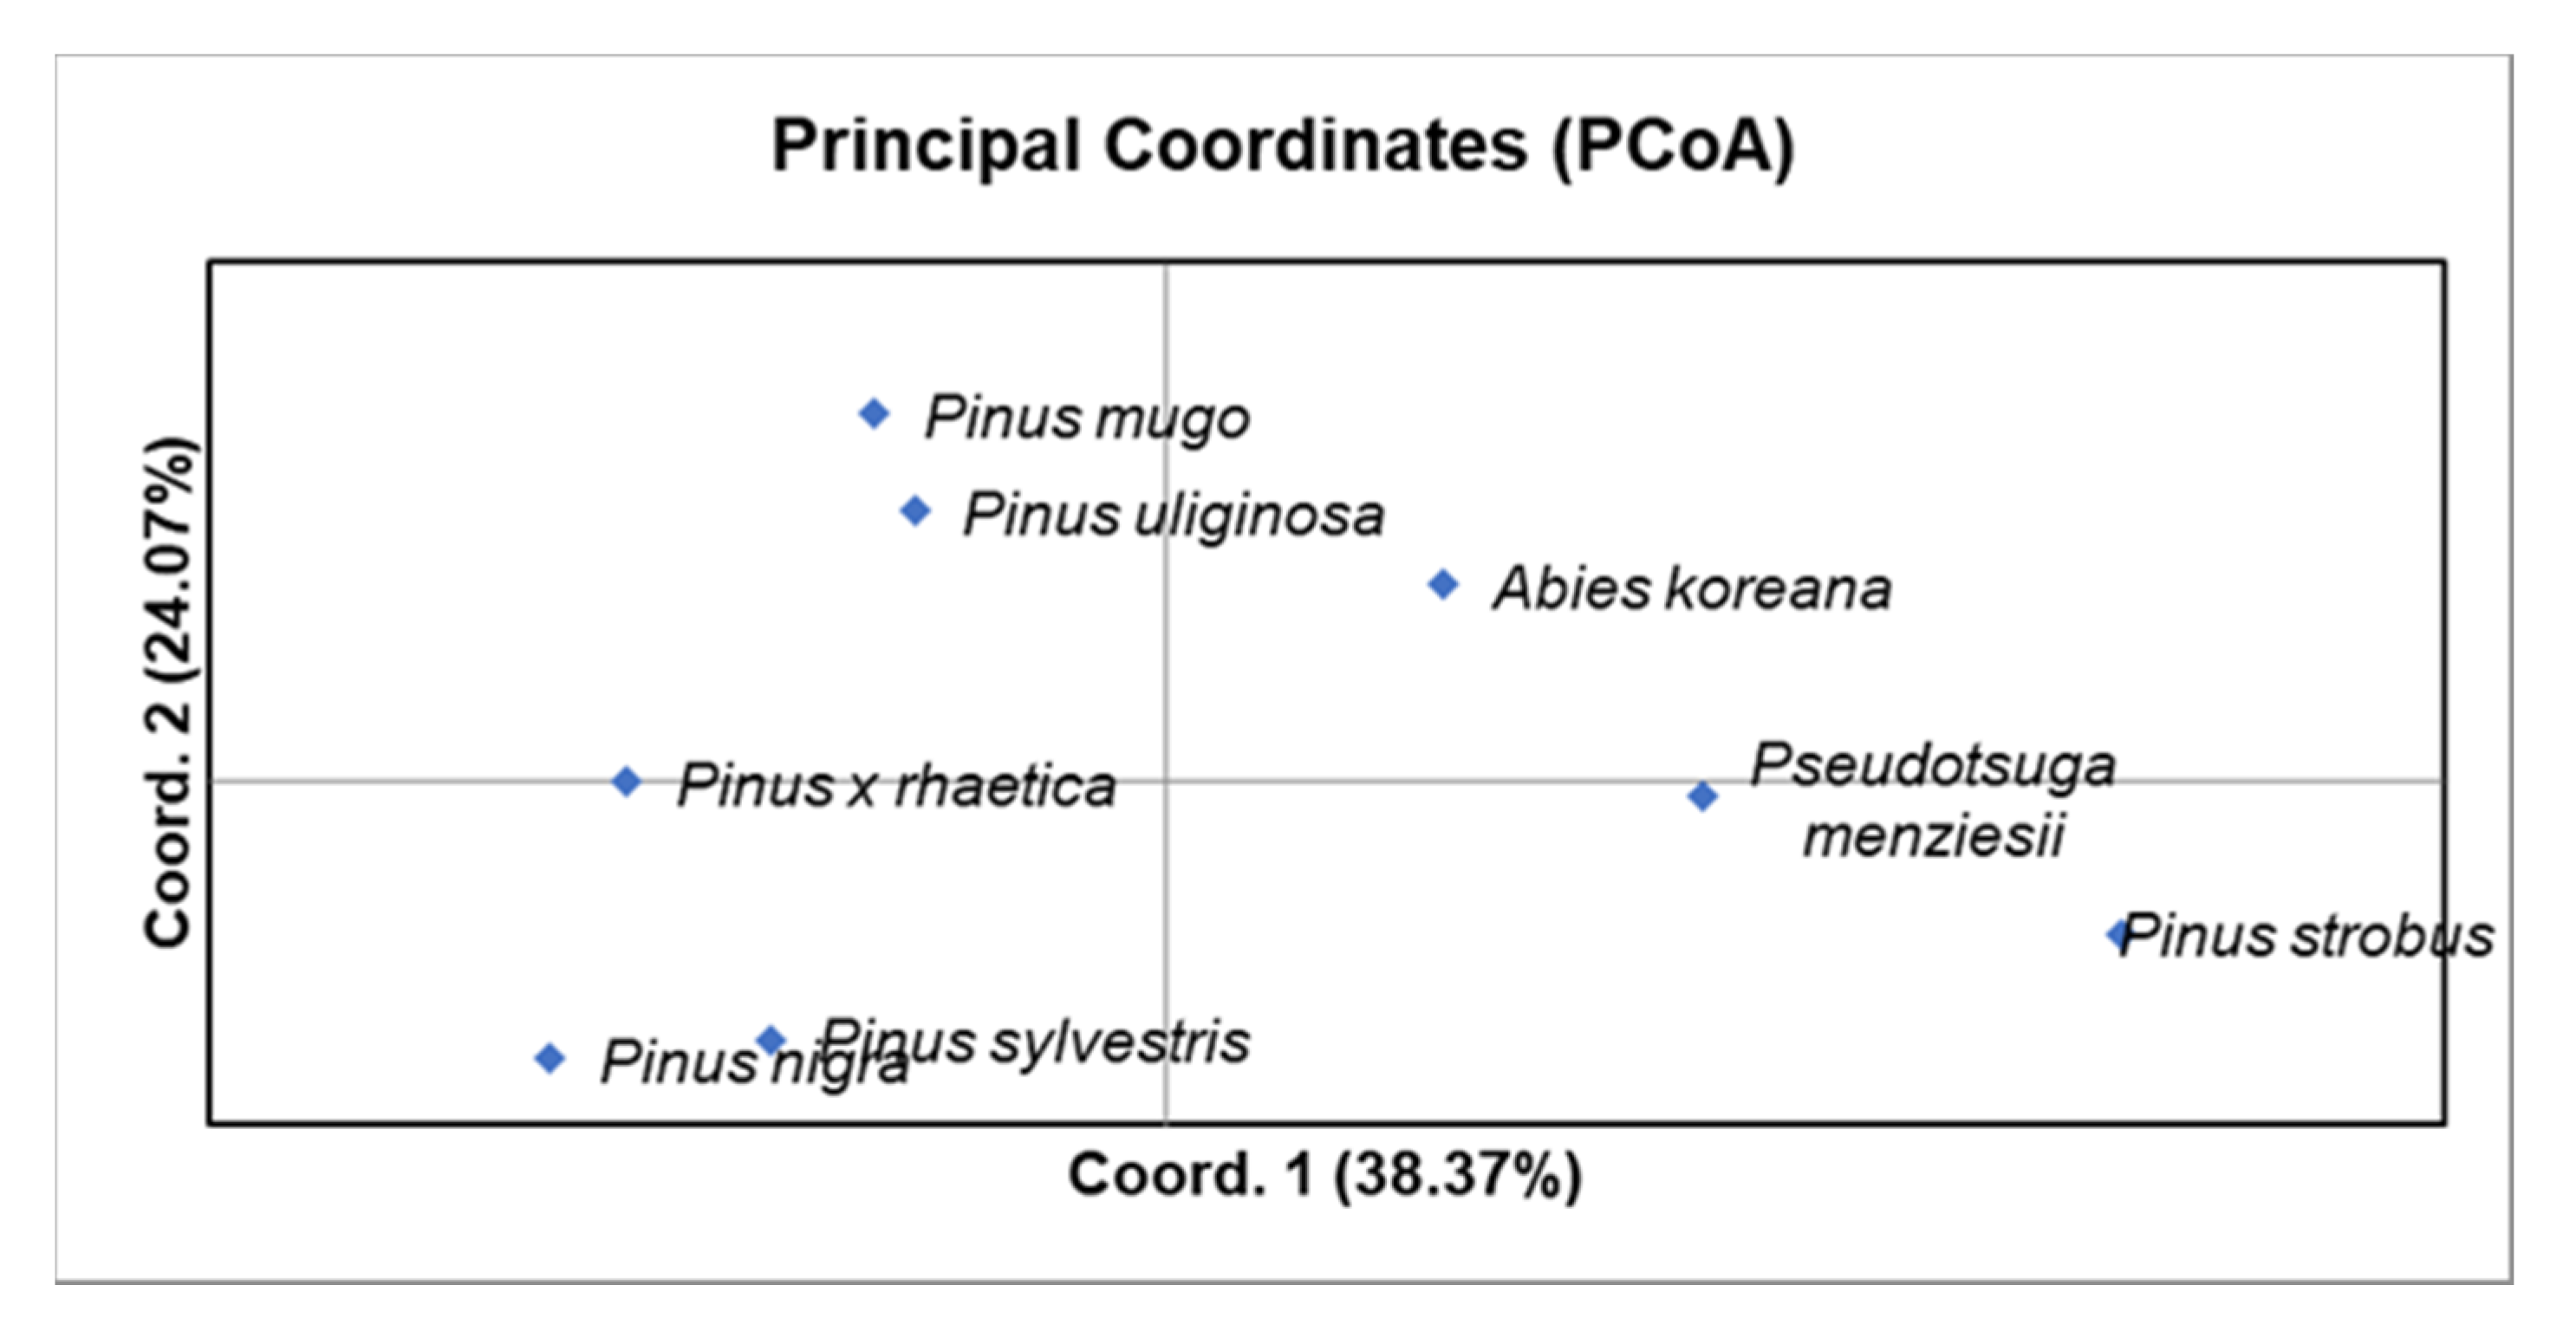
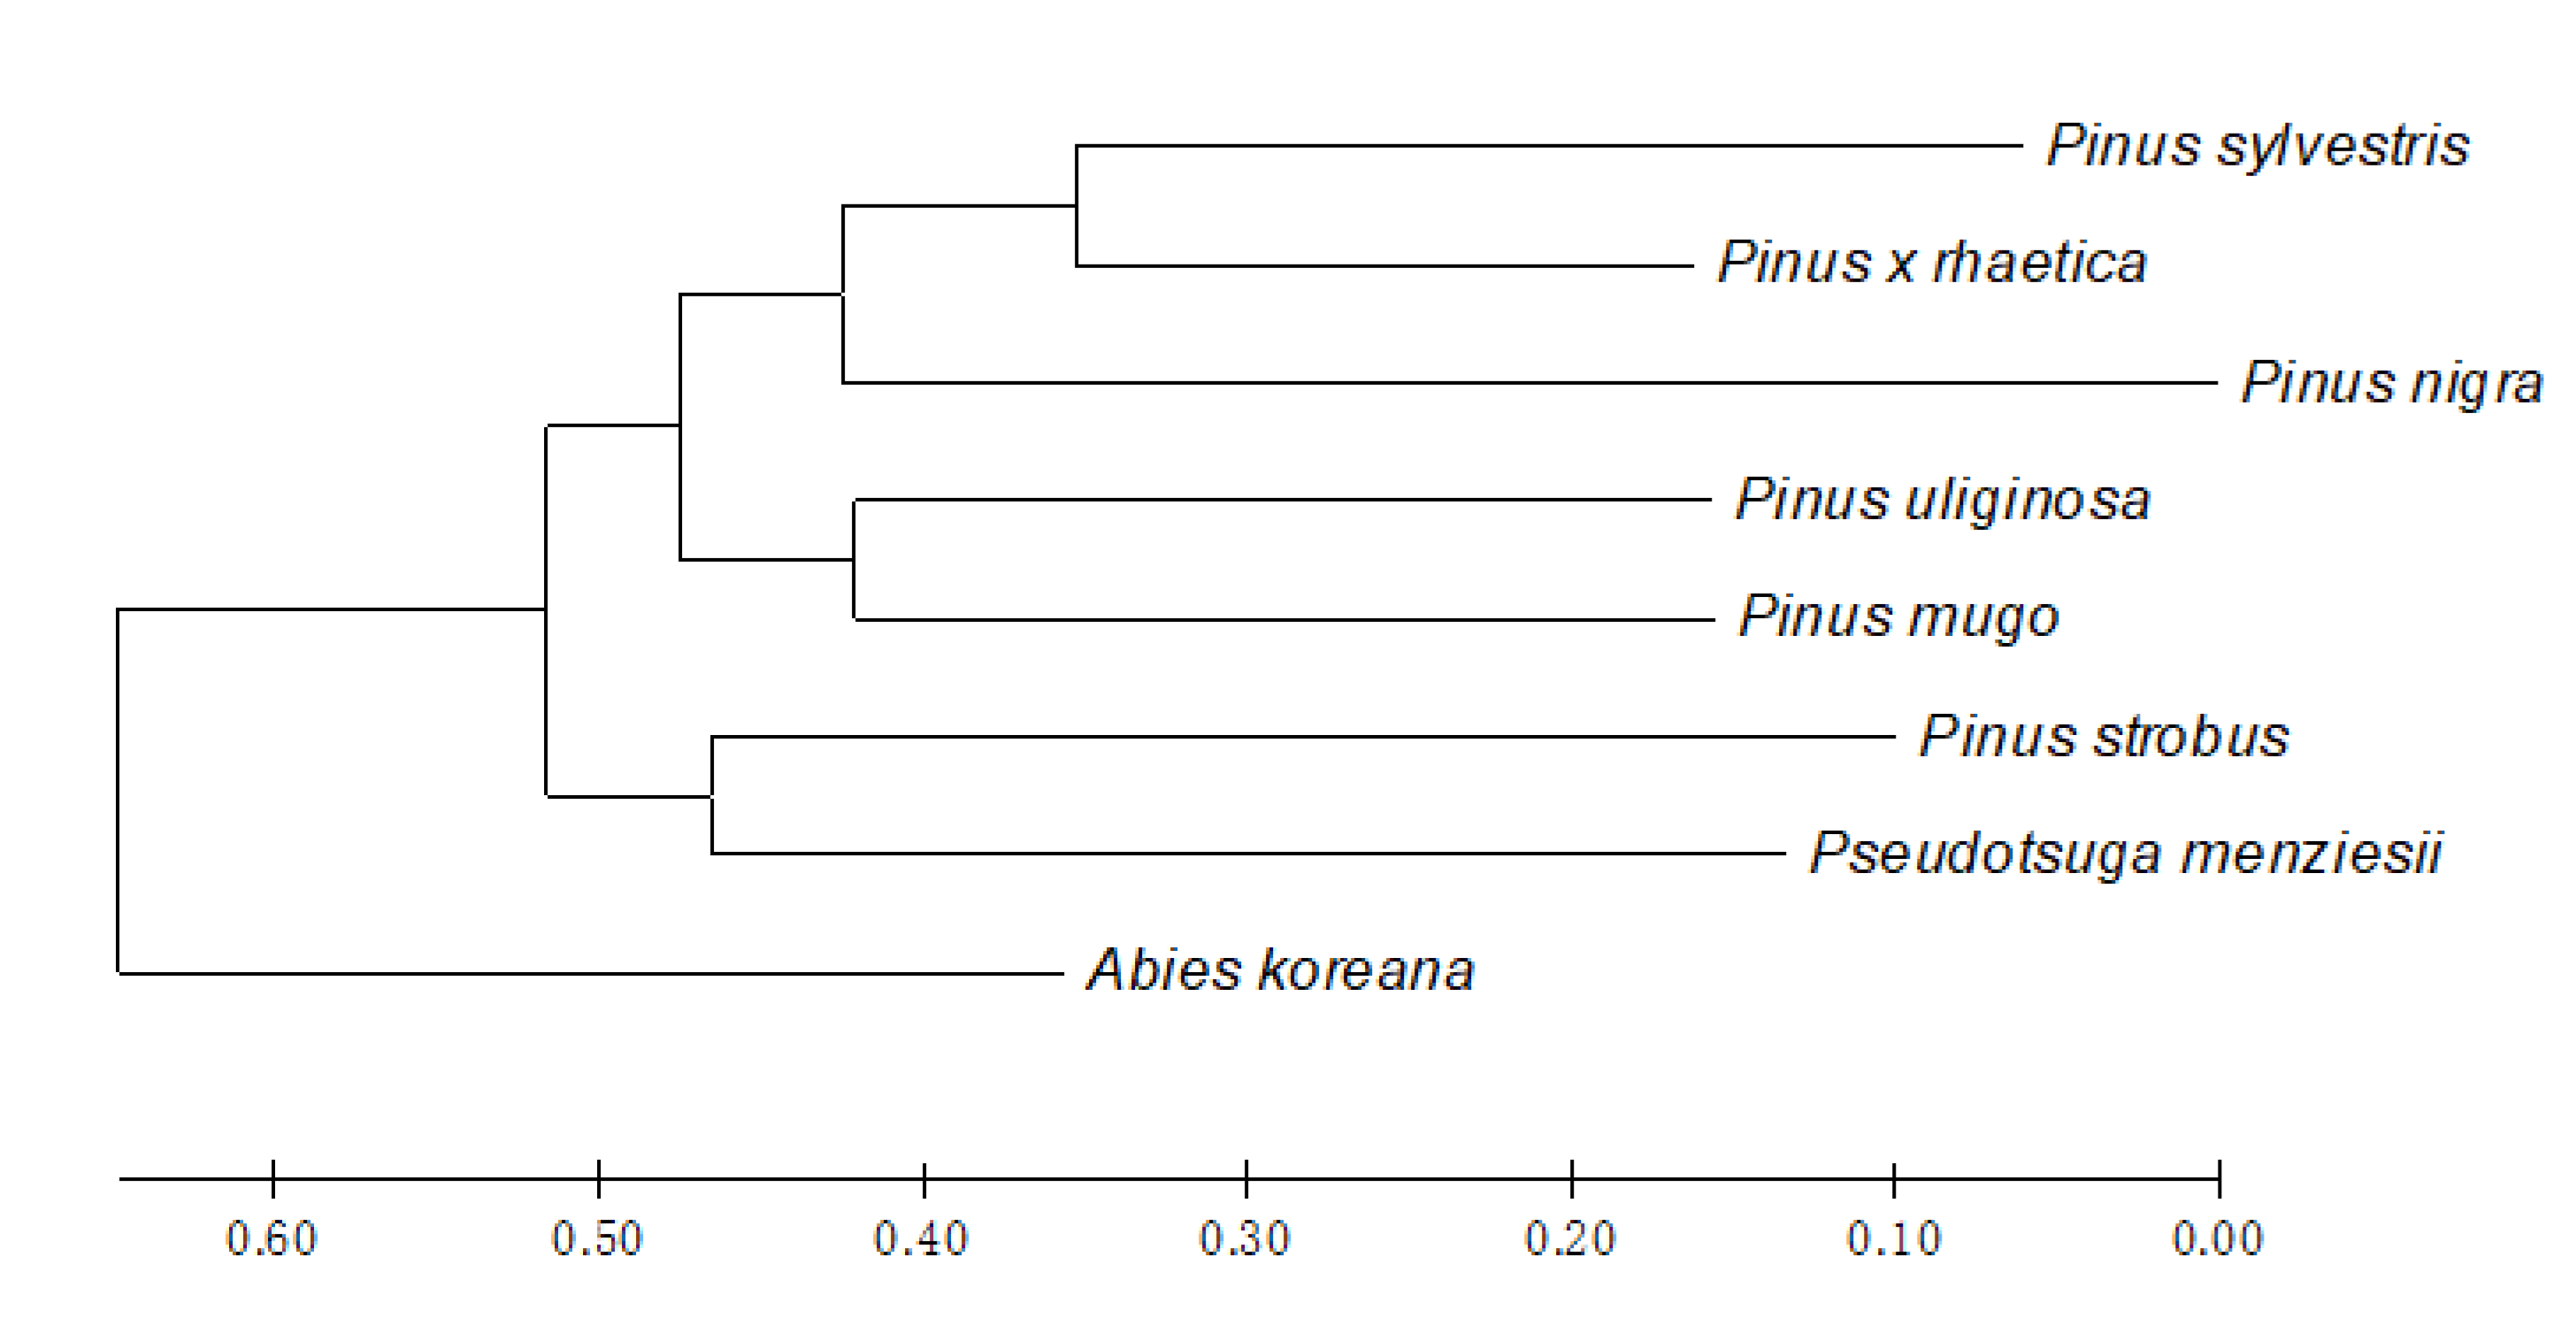
2.2. Genetic Distance and Cluster Analysis

The obtained STPs profiles (Figure 1 and Figure 2) were transformed into a binary matrix to enable the calculation of Nei‘s genetic distance (GD) and the Jaccard similarity coefficient (JS) values, given in Table 2. The average value of the genetic distance was 0.506, which ranged from 0.238 for the pair Pinus sylvestris and Pinus × rhaetica, to 0.693 for the pair Pinus nigra/Pinus strobus. The genetic distance between Pinus × rhaetica and Pinus uliginosa equaled 0.361, while the two taxa were less distant from Pinus mugo (GD = 0.318), thus being their putative parent. As discussed earlier, Pinus × rhaetica was found to be more closely related to Pinus sylvestris than to Pinus mugo. It is noteworthy that the calculated genetic distance values were the largest among different taxa inside the genus Pinus, rather than between the taxa originating from different genera.
The Jaccard similarity coefficient oscillated between 6.7 and 51.7%, with an average for the eight taxa of 23.7%. The results showed that the largest similarity existed between Pinus sylvestris and Pinus × rhaetica (51.7%), and between P. uliginosa and P. mugo (47.1%); thus proving them to be the putative parent and the more similar descendant, respectively. Expectedly, the lowest Jaccard similarity coefficient was observed for the pair Abies koreana and Pinus nigra.
Based on the principal coordinates analysis (PCoA; Figure 3), Pinus uliginosa is phylogenetically closer to Pinus mugo than to Pinus sylvestris, and Pinus × rhaetica is closer to Pinus sylvestris than to Pinus mugo. These results are consistent with the data derived directly from the analysis of the number of bands (Table 1), the Nei’s genetic distance, or the Jaccard similarity coefficient (Table 2). Overall, the two first coordinates of the PCA explained 62.44% of the observed variation.
Finally, based on the Jaccard distance (JD), cluster analysis of the taxa was conducted and represented by the Neighbor Joining (NJ) dendrogram (Figure 4). The STP profiling divided the eight Pinaceae taxa into two main clusters. Cluster I is further divided into the following two subclusters: (i) comprising Pinus mugo and Pinus uliginosa, (ii) where Pinus × rhaetica is grouped with Pinus sylvestris and Pinus nigra. Cluster II groups two species, i.e., Pinus strobus and Pseudotsuga menziesii, while Abies koreana represent an outgroup.
The evolutionary relationships revealed by the STP profiling conducted here are generally consistent with the commonly accepted taxonomic division of the Pinaceae family, with one exception, namely the position Pinus strobus. Based on the current data, Pinus strobus is subgrouped with Pseudotsuga menziesii, while it is typically grouped with the other taxa of the Pinus genus. Still, its distinct character is commonly known, and was the rationale behind dissecting separate sections: Pinus and Strobus inside the Pinus genus.
The topology of the phylogenetic NJ tree provides interesting results regarding the position of Pinus × rhaetica and its relationship with the other pines, including postulated parental species. As shown in Figure 4, Pinus × rhaetica is grouped with Pinus sylvestris, and not with the remaining representatives of the Pinus mugo complex, i.e., Pinus uliginosa and Pinus mugo, as expected. Such grouping complies with the observations from the direct bands comparison (Table 1). In previous studies, the DNA sequence analysis of almost 6000 nt showed no differences between the taxa from the Pinus mugo complex [1]. However, in this study, the STP profiling showed that these closely related taxa differ, and, according to the tree-building method, they represent separate taxa. The corresponding conclusions were withdrawn from our previous chemotaxonomy studies, comprising essential oils and volatiles profiling in the pine species [35,36]. The qualitative and quantitative differences between the taxa in terms of essential oils and volatiles composition were high enough to propose a special chemotaxonomic key for the discrimination of Pinus uliginosa, Pinus mugo, and Pinus uncinata from the Pinus mugo complex

3. Materials and Methods

3.1. Plant Material

The Pinaceae taxa investigated in the present study are listed in Table 3. The experiments were conducted using six representatives of the Pinoideae subfamily and a single representative from each Abietoideae and Laricoideae families. Figure 5 presents the Pinus mugo, Pinus uliginosa, and Pinus × rhaetica morphology. The seeds for the studies were kindly provided by the Botanical Garden in Lodz (BGL) and by the Dendrological Garden, Poznan University of Life Sciences (DGP), both located in Poland.

3.2. Seed Total Protein (STP) Extraction

The STPs were extracted from air-dried seeds without coats using 0.05 M Tris-HCl buffer (pH 8.0) and 2% 2-mercaptoethanol, according to the procedure by Tomooka [44]. After thorough vortexing, the homogenate was shaken for 1 h at 150 rpm at room temperature, followed by centrifugation at 12,000 rpm for 5 min at 4 °C. The total protein concentration in the supernatant was measured according to Popov et al. [45], using the precipitation method with an acidic, methanolic amido black 10B solution. The extracted STPs were kept at −20 °C until further use.

3.3. SDS-PAGE Electrophoresis

The STP extracts were separated in 14% polyacrylamide (PAA) gel under denaturating conditions (SDS-PAGE—sodium dodecyl sulfate polyacrylamide gel electrophoresis), according to the Laemmli [46] method. Eighty µg of the STP extracts were loaded on the gel. Unstained protein molecular weight marker (14.4 kDa to 116 kDa; Thermo Fisher Scientific, Inc.) was used as an electrophoretic mobility marker. Electrophoresis was conducted under 90V for approximately 6 h in Hoefer™ SE 600 Chroma Vertical Electrophoresis System (Thermo Fisher Scientific, Inc.). The gels were stained with Coomassie Brilliant Blue R-250 (Bio-Rad), according to Hames and Rickwood [47]. Image acquisition was done using The Quantum documentation imaging system (Vilber). All of the analyses were conducted in biological triplicate. Computational analysis was conducted using bands that were unambiguously identified and clearly separated in all of the replicates.

3.4. Band Scoring and Data Analysis

GelAnalyzer 19.1 [48] software was used to analyze the acquired images of the SDS-PAGE gels, using the following settings: detect peaks on all of the lanes (peak threshold: 1; peak min. height: 10; peak max. width in % on lane profile length: 5%) and detect background on all lines option (rolling ball and peak width tolerance in % of lane profile length: 10%). The STP profiles were transformed into a binary system of 0 (absence) and 1 (presence), according to their relative mobility value (Rf) [42]. The obtained binary matrix was used to calculate the Nei genetic distance (GD) and Jaccard similarity coefficient (JS). The Jaccard distance (JD) was calculated using the following formula: 1 − value of the Jaccard similarity coefficient. Cluster analysis was also performed using the Neighbor Joining Method (NJ) and Jaccard distance, as well as principal coordinates analysis (PCoA) based on Nei‘s genetic distance. All of the analyzes and calculations were carried out using the following programs: GenAIEx 6.501 [49,50], MVSP 3.22 [51], and MEGA X [43].

4. Conclusions

In this study, we used the STP patterns to search for taxonomically interesting differences among three closely-related pine taxa from the Pinus mugo complex and five more distant species from the Pinaceae family. Based on the obtained results, it can be concluded that the STP profiling revealed diagnostic electrophoretic patterns for all of the analyzed taxa from the Pinaceae family, and also allowed for discriminating closely related pine taxa, even those indistinguishable by chloroplast DNA barcodes. The results of the STPs patterns obtained here corroborate our previous findings conducted using the chemotaxonomic approach. It would be interesting to challenge this methodology with the other taxonomic puzzles occurring in the other plants groups.

Author Contributions

Conceptualization, K.C.; methodology, K.C. and A.Z-B.; investigation, K.C., J.S., and A.Z-B.; resources, K.C.; data curation, K.C. and J.S.; writing (original draft preparation), K.C. and J.S.; writing (critical revision), R.K., H.K., A.M.S., and A.W.-P., writing (review and editing), K.C. and J.S.; visualization, K.C. and A.Z.-B.; supervision, K.C.; project administration, K.C.; funding acquisition, K.C. and E.C. All authors have read and agreed to the published version of the manuscript.

Funding

This research was partially financially supported by the Ministry of Science and Higher Education in Poland (no. NN304060339).

Acknowledgments

The authors would like to thank Aleksandra Rosochacka from the Botanical Garden in Lodz (BGL) for her help in obtaining seeds for this research.

Conflicts of Interest

The authors declare no conflict of interest. The funders had no role in the design of the study; in the collection, analyses, or interpretation of data; in the writing of the manuscript; or in the decision to publish the results.

References

  1. Celiński, K.; Kijak, H.; Wojnicka-Półtorak, A.; Buczkowska-Chmielewska, K.; Sokołowska, J.; Chudzińska, E. Effectiveness of the DNA Barcoding Approach for Closely Related Conifers Discrimination: A Case Study of the Pinus Mugo Complex. Comptes Rendus Biol. 2017, 340, 339–348. [Google Scholar] [CrossRef] [PubMed]
  2. Ladizinsky, G.; Hymowitz, T. Seed Protein Electrophoresis in Taxonomic and Evolutionary Studies. Theor. Appl. Genet. 1979, 54, 145–151. [Google Scholar] [CrossRef] [PubMed]
  3. Slavov, G.T.; Zhelev, P. Allozyme Variation, Differentiation, and Inbreeding in Populations of Pinus Mugo in Bulgaria. Can. J. For. Res. 2004, 34, 2611–2617. [Google Scholar] [CrossRef] [Green Version]
  4. Goncharenko, G.G.; Silin, A.E.; Padutov, V.E. Allozyme Variation in Natural Populations of Eurasian Pines. 3.Population Structure, Diversity, Differentiation and Gene Flow in Central and Isolated Populations of Pinus Sylvestris L. in Eastern Europe and Siberia. Silvae Genet. 1994, 43, 119–131. [Google Scholar]
  5. Orav, A.; Kapp, K.; Raal, A. Chemosystematic markers for the essential oils in leaves of Mentha species cultivated or growing naturally in Estonia. Proc. Est. Acad. Sci. 2013, 62, 175–186. [Google Scholar] [CrossRef]
  6. Wawrzyniak, R.; Wasiak, W.; Ba̧czkiewicz, A.; Buczkowska, K. Volatile Compounds in Cryptic Species of the Aneura Pinguis Complex and Aneura Maxima (Marchantiophyta, Metzgeriidae). Phytochemistry 2014, 105, 115–122. [Google Scholar] [CrossRef] [PubMed]
  7. Kaundun, S.S.; Lebreton, P. Taxonomy and Systematics of the Genus Pinus Based on Morphological, Biogeographical and Biochemical Characters. Plant Syst. Evol. 2010, 284, 1–15. [Google Scholar] [CrossRef]
  8. Ioannou, E.; Koutsaviti, A.; Tzakou, O.; Roussis, V. The Genus Pinus: A Comparative Study on the Needle Essential Oil Composition of 46 Pine Species. Phytochem. Rev. 2014, 13, 741–768. [Google Scholar] [CrossRef]
  9. Biteau, F.; Nisse, E.; Miguel, S.; Hannewald, P.; Bazile, V.; Gaume, L.; Mignard, B.; Hehn, A.; Bourgaud, F. A Simple SDS-PAGE Protein Pattern from Pitcher Secretions as a New Tool to Distinguish Nepenthes Species (Nepenthaceae). Am. J. Bot. 2013, 100, 2478–2484. [Google Scholar] [CrossRef] [PubMed]
  10. Schlötterer, C. The Evolution of Molecular Markers—Just a Matter of Fashion? Nat. Rev. Genet. 2004, 5, 63–69. [Google Scholar] [CrossRef] [PubMed]
  11. Hebert, P.D.N.; Cywinska, A.; Ball, S.L.; DeWaard, J.R. Biological Identifications through DNA Barcodes. Proc. R. Soc. B Biol. Sci. 2003, 270, 313–321. [Google Scholar] [CrossRef] [Green Version]
  12. Hollingsworth, M.L.; Andra Clark, A.; Forrest, L.L.; Richardson, J.; Pennington, R.T.; Long, D.G.; Cowan, R.; Chase, M.W.; Gaudeul, M.; Hollingsworth, P.M. Selecting Barcoding Loci for Plants: Evaluation of Seven Candidate Loci with Species-Level Sampling in Three Divergent Groups of Land Plants. Mol. Ecol. Resour. 2009, 9, 439–457. [Google Scholar] [CrossRef]
  13. Han, Y.W.; Duan, D.; Ma, X.F.; Jia, Y.; Liu, Z.L.; Zhao, G.F.; Li, Z.H. Efficient Identification of the Forest Tree Species in Aceraceae Using DNA Barcodes. Front. Plant Sci. 2016, 7. [Google Scholar] [CrossRef] [PubMed] [Green Version]
  14. Little, D.P.; Knopf, P.; Schulz, C. DNA Barcode Identification of Podocarpaceae-The Second Largest Conifer Family. PLoS ONE 2013, 8. [Google Scholar] [CrossRef] [Green Version]
  15. von Cräutlein, M.; Korpelainen, H.; Pietiläinen, M.; Rikkinen, J. DNA Barcoding: A Tool for Improved Taxon Identification and Detection of Species Diversity. Biodivers. Conserv. 2011, 20, 373–389. [Google Scholar] [CrossRef]
  16. Li, X.; Yang, Y.; Henry, R.J.; Rossetto, M.; Wang, Y.; Chen, S. Plant DNA Barcoding: From Gene to Genome. Biol. Rev. Camb. Philos. Soc. 2015, 90, 157–166. [Google Scholar] [CrossRef] [PubMed]
  17. Li, J.; Xie, D.F.; Guo, X.L.; Zheng, Z.Y.; He, X.J.; Zhou, S.D. Comparative Analysis of the Complete Plastid Genome of Five Bupleurum Species and New Insights into Dna Barcoding and Phylogenetic Relationship. Plants 2020, 9. [Google Scholar] [CrossRef] [PubMed]
  18. Zhang, Z.; Zhang, Y.; Song, M.; Guan, Y.; Ma, X. Species Identification of Dracaena Using the Complete Chloroplast Genome as a Super-Barcode. Front. Pharmacol. 2019, 10. [Google Scholar] [CrossRef] [PubMed]
  19. Samah, S.; Ventura-Zapata, E.; Valadez-Moctezuma, E. Fractionation and Electrophoretic Patterns of Seed Protein of Opuntia Genus. A Preliminary Survey as a Tool for Accession Differentiation and Taxonomy. Biochem. Syst. Ecol. 2015, 58, 187–194. [Google Scholar] [CrossRef]
  20. Raj, L.J.M.; Britto, S.J.; Prabhu, S.; Senthilkumar, S.R. Phylogenetic Relationships of Crotalaria Species Based on Seed Protein Polymorphism Revealed by SDS-PAGE. Plant Sci. 2011, 2, 119–128. [Google Scholar]
  21. Aniel Kumar, O.; Subba Tata, S. SDS-Page Seed Storage Protein Profiles in Chili Peppers (Capsicum L.). Not. Sci. Biol. 2010, 2, 86–90. [Google Scholar] [CrossRef] [Green Version]
  22. Sinha, K.N. Electrophoretic Study of Seed Storage Protein in Five Species of Bauhinia. IOSR J. Pharm. Biol. Sci. 2012, 4, 8–11. [Google Scholar] [CrossRef]
  23. Emre, I.; Turgut-Balik, D.; Genç, H.; Şahin, A. Total Seed Storage Protein Patterns of Some Lathyrus Species Growing in Turkey Using SDS-Page. Pak. J. Bot. 2010, 42, 3157–3163. [Google Scholar]
  24. Ertugrul, K.; Arslan, E.; Tugay, O. Characterization of Conolida S.F. Gray (Ranunculaceae) taxa in Turkey by seed storage protein electrophoresis. Turk. J. Biochem. 2010, 35, 99–104. [Google Scholar]
  25. El Rabey, H.A.; Al-Malki, A.L.; Abulnaja, K.O.; Ebrahim, M.K.; Kumosani, T.; Khan, J.A. Phylogeny of Ten Species of the Genus Hordeum L. as Revealed by AFLP Markers and Seed Storage Protein Electrophoresis. Mol. Biol. Rep. 2014, 41, 364–372. [Google Scholar] [CrossRef]
  26. Christensen, K. Taxonomic Revision of the Pinus Mugo Complex and P. Rhaetica (P. Mugo Sylvestris) (Pinaceae). Nord. J. Bot. 1987, 7, 383–408. [Google Scholar] [CrossRef]
  27. Hamerník, J.; Musil, I. The Pinus Mugo Complex—Its Structuring and General Overview of the Used Nomenclature. J. For. Sci. 2007, 53, 253–266. [Google Scholar] [CrossRef] [Green Version]
  28. Wachowiak, W.; Prus-Głowacki, W. Hybridisation Processes in Sympatric Populations of Pines Pinus sylvestris L., P. mugo Turra and P. uliginosa Neumann. Plant Syst. Evol. 2008, 271, 29–40. [Google Scholar] [CrossRef]
  29. Prus-Głowacki, W.; Szweykowski, J.; Nowak, R. Serotaxonomical Investigation of the European Pine Species. Silvae Genet. 1985, 34, 162–170. [Google Scholar]
  30. Lewandowski, A.; Boratyński, A.; Mejnartowicz, L. Allozyme Investigations on the Genetic Differentiation between Closely Related Pines—Pinus sylvestris, P. mugo, P. uncinata, and P. uliginosa (Pinaceae). Plant Syst. Evol. 2000, 221, 15–24. [Google Scholar] [CrossRef]
  31. Prus-Głowacki, W.; Bujas, E.; Ratyńska, H. Taxonomic Position of Pinus Uliginosa Neumann as Related to Other Taxa of Pinus Mugo Complex. Acta Soc. Bot. Pol. 1998, 67, 269–274. [Google Scholar] [CrossRef] [Green Version]
  32. Monteleone, I.; Ferrazzini, D.; Belletti, P. Effectiveness of Neutral RAPD Markers to Detect Genetic Divergence between the Subspecies uncinata and mugo of Pinus mugo Turra. Silva Fenn. 2006, 40, 391–406. [Google Scholar] [CrossRef] [Green Version]
  33. Bogunić, F.; Siljak-Yakovlev, S.; Muratović, E.; Pustahija, F.; Medjedović, S. Molecular Cytogenetics and Flow Cytometry Reveal Conserved Genome Organization in Pinus Mugo and P. Uncinata. Annals Forest Sci. 2011, 68, 179–187. [Google Scholar] [CrossRef] [Green Version]
  34. Celiński, K.; Chudzińska, E.; Gmur, A.; Piosik, Ł.; Wojnicka-Półtorak, A. Cytological Characterization of Three Closely Related Pines—Pinus Mugo, P. Uliginosa and P. × Rhaetica from the Pinus Mugo Complex (Pinaceae). Biologia 2019, 74, 751–756. [Google Scholar] [CrossRef] [Green Version]
  35. Bonikowski, R.; Celiński, K.; Wojnicka-Półtorak, A.; Maliński, T. Composition of Essential Oils Isolated from the Needles of Pinus Uncinata and P. Uliginosa Grown in Poland. Nat. Prod. Commun. 2015, 10, 371–373. [Google Scholar] [CrossRef] [PubMed] [Green Version]
  36. Celiński, K.; Bonikowski, R.; Wojnicka-Półtorak, A.; Chudzińska, E.; Maliński, T. Volatiles as Chemosystematic Markers for Distinguishing Closely Related Species within the Pinus Mugo Complex. Chem. Biodivers. 2015, 12, 1208–1213. [Google Scholar] [CrossRef] [PubMed]
  37. Juan, R.; Pastor, J.; Alaiz, M.; Vioque, J. Electrophoretic Characterization of Amaranthus L. Seed Proteins and Its Systematic Implications. Bot. J. Linn. Soc. 2007, 155, 57–63. [Google Scholar] [CrossRef] [Green Version]
  38. Lewandowski, A.; Wiśniewska, M. Short Note: Crossability between Pinus Uliginosa and Its Putative Parental Species Pinus Sylvestris and Pinus Mugo. Silvae Genet. 2006, 55, 52–54. [Google Scholar] [CrossRef] [Green Version]
  39. Kormutak, A.; Demankova, B.; Gömöry, D. Spontaneous Hybridization between Pinus Sylvestris L. and P. Mugo Turra in Slovakia. Silvae Genet. 2008, 57, 76–82. [Google Scholar] [CrossRef] [Green Version]
  40. Wachowiak, W.; Celiński, K.; Prus-Głowacki, W. Evidence of Natural Reciprocal Hybridisation between Pinus Uliginosa and P. Sylvestris in the Sympatric Population of the Species. Flora Morphol. Distrib. Funct. Ecol. Plants 2005, 200, 563–568. [Google Scholar] [CrossRef]
  41. Bhat, T.M.; Kudesia, R. Evaluation of Genetic Diversity in Five Different Species of Family Solanaceae Using Cytological Characters and Protein Profiling. Genet. Eng. Biotechnol. J. 2011, 1–8. Available online: http://astonjournals.com/gebj (accessed on 10 June 2020).
  42. Schirone, B.; Piovesan, G.; Bellarosa, R.; Pelosi, C. A Taxonomic Analysis of Seed Proteins in Pinus Spp. (Pinaceae). Plant Syst. Evol. 1991, 178, 43–53. [Google Scholar] [CrossRef]
  43. Kumar, S.; Stecher, G.; Li, M.; Knyaz, C.; Tamura, K. MEGA X: Molecular Evolutionary Genetics Analysis across Computing Platforms. Mol. Biol. Evol. 2018, 35, 1547–1549. [Google Scholar] [CrossRef] [PubMed]
  44. Tomooka, N. Experimental Manual of SDS-PAGE (Slab Method): Progress Report; Tropical Agriculture Research Center: Okinawa, Japan, 1989; p. 13. [Google Scholar]
  45. Popov, N.; Schmitt, M.; Schulzeck, S.; Matthies, H. Reliable Micromethod for Determination of the Protein Content in Tissue Homogenates. Acta Biol. Med. Ger. 1975, 34, 1441–1446. [Google Scholar]
  46. Laemmli, U.K. Cleavage of Structural Proteins during the Assembly of the Head of Bacteriophage T4. Nature 1970, 227, 680–685. [Google Scholar] [CrossRef]
  47. Hames, B.D.; Rickwood, D. One dimensional polyacrylamide gel electrophoresis. In Gel Electrophoresis of Proteins, 2nd ed.; Hames, B.D., Rickwood, D., Eds.; Oxford University Press: New York, NY, USA, 1990; p. 382. [Google Scholar]
  48. GelAnalyzer. Available online: http://www.gelanalyzer.com/?i=1 (accessed on 12 June 2020).
  49. Peakall, R.; Smouse, P.E. GenALEx 6.5: Genetic Analysis in Excel. Population Genetic Software for Teaching and Research-an Update. Bioinformatics 2012, 28, 2537–2539. [Google Scholar] [CrossRef] [Green Version]
  50. Peakall, R.; Smouse, P.E. GENALEX 6: Genetic Analysis in Excel. Population Genetic Software for Teaching and Research. Mol. Ecol. Notes 2006, 6, 288–295. [Google Scholar] [CrossRef]
  51. Kovach, W.L. MVSP—A MultiVariate Statistical Package for Windows, ver. 3.1. Kovach Computing Services; Pentraeth: Wales, UK, 2007. [Google Scholar]
Figure 1. Representative SDS-PAGE image showing seed total protein (STP) profiles from the eight taxa under study. Lane 1: Abies koreana, 2: Pinus nigra Arn., 3: Pinus strobus, 4: Pseudotsuga menziesii (Mirbell) Franco, 5: Pinus sylvestris, 6: Pinus × rhaetica, 7: Pinus uliginosa, 8: Pinus mugo, M: Unstained Protein Molecular Weight Marker (14.4 kDa–116 kDa; Thermo Fisher Scientific, Inc.).
Plants 09 00872 g001
Figure 2. Relative line image plots (densitograms) based on the STP profiling. (A): Pinus sylvestris, (B): Pinus × rhaetica, (C): Pinus uliginosa, and (D): Pinus mugo. Color code: orange—specific and semi specific bands for the Pinus mugo complex members (Rf = 0.13 and Rf = 0.60); green—a band specific to the Pinus section (Rf = 0.40; purple—diagnostic bands for Pinus uliginosa (Rf = 0.04, 0.69, 0.77, and 0.86); magenta—bands specific for Pinus mugo (Rf = 0.34 and 0.74); blue—represents the other bands identified in the given profile.
Plants 09 00872 g002
Figure 3. Principle coordinates analysis (PCoA) using Nei’s genetic distance (GD) for the eight taxa from the Pinaceae family.
Plants 09 00872 g003
Figure 4. Evolutionary relationships of the Pinaceae taxa under study. The evolutionary history was inferred using the Neighbor-Joining method (NJ), based on the Jaccard distance (JD). The optimal tree with the sum of the branch length = 2.82700000 is shown. The tree is drawn to scale, with the branch lengths in the same units as those of the evolutionary distances used to infer the phylogenetic tree. Evolutionary analyses were conducted in MEGA X [43].
Plants 09 00872 g004
Figure 5. Morphology of the representatives of the Pinus mugo complex analyzed in this study. (A): Pinus × rhaetica, (B): Pinus uliginosa, (C): Pinus mugo.
Plants 09 00872 g005
Table 1. Summary of STP profiles for the Pinaceae taxa under study. Unique bands for taxa are given in bold. The single band common to all of the taxa is given in italics. NB—number of bands; NUB—number of unique bands.
No.TaxonNBRf RangeBands Relative Mobility Value (Rf)NUB
1A. koreana130.09–0.720.09, 0.11, 0.15, 0.18, 0.22, 0.24, 0.30, 0.41, 0.48, 0.50, 0.60, 0.70, 0.722
2P. nigra210.05–0.850.05, 0.07, 0.10, 0.12, 0.15, 0.17, 0.19, 0.20, 0.22, 0.28. 0.32. 0.33, 0.40, 0.45, 0.54, 0.56, 0.58, 0.71, 0.75, 0.81, 0.855
3P. strobus240.07–0.870.07, 0.09, 0.12, 0.14, 0.15, 0.22, 0.25, 0.29, 0.32, 0.33, 0.35, 0.39, 0.44, 0.46, 0.50, 0.55, 0.59, 0.61, 0.63, 0.67, 0.76, 0.78, 0.82, 0.877
4P. menziesii190.09–0.820.09, 0.12, 0.14, 0.15, 0.16, 0.18, 0.22, 0.23, 0.29, 0.33, 0.39, 0.41, 0.46, 0.57, 0.65, 0.68, 0.72, 0.79, 0.823
5P. sylvestris200.06–0.810.06, 0.09, 0.11, 0.14, 0.17, 0.19, 0.20, 0.22, 0.23, 0.27, 0.31, 0.33, 0.40, 0.46, 0.54, 0.59, 0.64, 0.71, 0.79, 0.812
6P. × rhaetica240.06–0.820.06, 0.09, 0.11, 0.12, 0.13, 0.14, 0.16, 0.17, 0.19, 0.20, 0.22, 0.23, 0.28, 0.30, 0.32, 0.33, 0.40, 0.46, 0.54, 0.58, 0.60, 0.71, 0.79, 0.820
7P. uliginosa280.04–0.860.04, 0.06, 0.09, 0.12, 0.13, 0.15, 0.16, 0.17, 0.19, 0.20, 0.22, 0.24, 0.25, 0.27, 0.32, 0.33, 0.40, 0.46, 0.55, 0.58, 0.60, 0.63, 0.69, 0.72, 0.77, 0.80, 0.82, 0.864
8P. mugo220.05–0.820.05, 0.09, 0.11, 0.13, 0.15, 0.16, 0.17, 0.19, 0.22, 0.24, 0.28, 0.30, 0.32, 0.34, 0.40, 0.46, 0.55, 0.60, 0.72, 0.74, 0.80, 0.822
Table 2. Nei’s genetic distance (GD; below diagonal) and Jaccard similarity coefficient (JS; above diagonal) based on the STP profiles analysis.
A. koreanaP. nigraP. strobusP. menziesiiP. sylvestrisP. × rhaeticaP. uliginosaP. mugo
A. koreana-0.0670.1210.2310.1000.1560.1710.296
P. nigra0.606-0.1030.0860.2580.2650.2050.171
P. strobus0.5790.693-0.3030.1580.2000.2680.179
P. menziesii0.3610.6630.428-0.2190.3030.2370.206
P. sylvestris0.5260.4280.6630.476-0.5170.2630.200
P. × rhaetica0.5260.3830.6630.4280.238-0.4440.438
P. uliginosa0.5790.5790.6060.5790.5520.361-0.471
P. mugo0.3400.5260.6630.5260.5520.3180.318-
Table 3. The Pinaceae taxa investigated in the present study. The seeds origin: BGL—The Botanical Garden in Lodz (Poland); DGP—The Dendrological Garden, Poznan University of Life Sciences (Poland). * taxa belonging to the Pinus mugo complex.
No.TaxonSubfamilyGenusSubgenus/SectionSeeds Origin
1Abies koreana E.H. WilsonAbietoideaeAbies-BGL
2Pinus nigra Arn.PinoideaePinusPinusBGL
3Pinus strobus L.PinoideaePinusStrobusBGL
4Pseudotsuga menziesii (Mirbel) FrancoLaricoideaePseudotsuga-BGL
5Pinus sylvestris L.PinoideaePinusPinusBGL
6Pinus × rhaetica Brügger*PinoideaePinusPinusDGP
7Pinus uliginosa Neumann ex Wimmer*PinoideaePinusPinusDGP
8Pinus mugo Turra*PinoideaePinusPinusDGP

