Article

The Assessment and the Within-Plant Variation of the Morpho-Physiological Traits and VOCs Profile in Endemic and Rare Salvia ceratophylloides Ard. (Lamiaceae)

by
Rosa Vescio
1,
Maria Rosa Abenavoli
1,
Fabrizio Araniti
2,
Carmelo Maria Musarella
1,
Adriano Sofo
3,
Valentina Lucia Astrid Laface
1,
Giovanni Spampinato
1 and
Agostino Sorgonà
1,*
1
Department of Agricultural Sciences, “Mediterranea” University of Reggio Calabria, Feo di Vito, 89124 Reggio Calabria, Italy
2
Department of Agricultural and Environmental Sciences—Production, Landscape, Agroenergy, Università Degli Studi di Milano, Via G. Celoria 2, 20133 Milan, Italy
3
Department of European and Mediterranean Cultures, Architecture, Environment, Cultural Heritage (DiCEM), University of Basilicata, Via Lanera 20, 75100 Matera, Italy
*
Author to whom correspondence should be addressed.
Plants 2021, 10(3), 474; https://doi.org/10.3390/plants10030474
Submission received: 13 February 2021 / Revised: 23 February 2021 / Accepted: 26 February 2021 / Published: 3 March 2021
(This article belongs to the Special Issue Systematics and the Conservation of Plant Diversity)

Abstract

:
Salvia ceratophylloides (Ard.) is an endemic and rare plant species recently rediscovered as very few individuals at two different Southern Italy sites. The study of within-plant variation is fundamental to understand the plant adaptation to the local conditions, especially in rare species, and consequently to preserve plant biodiversity. Here, we reported the variation of the morpho-ecophysiological and metabolic traits between the sessile and petiolate leaf of S. ceratophylloides plants at two different sites for understanding the adaptation strategies for surviving in these habitats. The S. ceratophylloides individuals exhibited different net photosynthetic rate, maximum quantum yield, light intensity for the saturation of the photosynthetic machinery, stomatal conductance, transpiration rate, leaf area, fractal dimension, and some volatile organic compounds (VOCs) between the different leaf types. This within-plant morpho-physiological and metabolic variation was dependent on the site. These results provide empirical evidence of sharply within-plant variation of the morpho-physiological traits and VOCs profiles in S. ceratophylloides, explaining the adaptation to the local conditions.

1. Introduction

Salvia ceratophylloides Ard. is a perennial herbaceous species endemic to Southern Calabria, Italy, which was declared extinct in 1997 [1] and recently rediscovered a hundred mature individuals distributed in two sites, 2 Km apart, around the Reggio Calabria hills [2,3]. Nowadays, the S. ceratophylloides populations are threatened with extinction because of the habitat modification and destruction by wild urbanization and agriculture [3]. Spread of alien species, such as Cascabela thevetia, Ipomoea setosa subsp. pavonii, and Tecoma stans, favored by climate change, establishes an additional threat factor [4,5]. Despite its vulnerability, no quantitative information on the morphological and ecophysiological traits of S. ceratophylloides are available, although they are pivotal for understanding the habitat requirements for the conservation of the endemic species.
The viability of endangered and rare species, such as S. ceratophylloides, depends on their capability to maintain or even increase their fitness under short- and/or long-term continuous climate change. Because of its rarity, this endemic species usually pointed out specific and narrow habitat requirements suggesting that their responses must occur only in the actual habitat determining local adaptation through phenotypic plasticity and/or genetic variation [6].
Although the results sometimes appeared conflicting, the plant phenotypic plasticity assumed a significant role in the viability of rare and endangered species. For example, Noel et al. [7] observed a high degree of phenotypic plasticity that conferred an increase of the fitness in Ranunculus nodiflorus Ten. suggesting the maintenance of the micro-environment heterogeneity as a habitat-based strategy for its conservation. On the contrary, Westerband et al. [8] observed low phenotypic plasticity in response to drought stress in Schiedea obovate (Sherff) W.L. Wagner & Weller, an endangered, endemic Hawaiian shrub, showing a high risk of extinction in the future climate change scenarios. Based on earlier works of the Winn [9,10] and De Kroon’s hypothesis [11], which dealt with plant phenotypic variation at sub-individual level (i.e., organ or module), the ‘within-plant’ rather than “among-plant” phenotypic variation could represent the major source of population-level diversity in several functional traits [12,13]. Recent works pointed out the multiple ecological aspects of the ‘within-plant variation’ such as the improvement of the exploitation of the heterogeneous-distributed resource [14,15], the adaptation to biotic and biotic gradients [16], the spreading of the ecological breadth of species and individuals [17,18], the increase of the functional diversity of populations [17], and the alteration of plant-antagonist interactions [19,20,21,22]. However, no quantitative characterization of the within-plant variation in endangered and rare plant species has been assayed yet.
In this respect, we started a two-year field study (2016–2017) to characterize the S. ceratophylloides through a leaf-level morpho-ecophysiological and metabolic approach from its natural habitat. In particular, this species exhibited a leaf morphology characterized by contemporary presence (petiolate leaf) and the absence of petiole (sessile leaf) in the basal and upper part of the shoot, respectively, suggesting a potential within-plant variation. Furthermore, individuals of this species were in two different sites, at a distance of <2 km from each other and preliminary results by SSR, pointed out that the populations of S. ceratophylloides exhibited a low level of genetic variability between the two populations [23] and indicating the phenotypic plasticity is the main driver for the local adaptation. In particular, we focused on the photosynthetic performances as a marker of tolerance and growth of species to predict the optimum habitat conditions for the conservation of rare species [24] but also to provide the capacity of plant adaptation to new conditions associated with climate change and the likely changes in plant communities [25]. Further, we considered the leaf mass per area (LMA) as a morphological trait strictly correlated with the functional syndrome and consequently to plant growth and development and, ultimately, plant fitness [26]. Simultaneously, the metabolic profiles of volatile organic compounds (VOCs) could provide information on the plant status and the plant-, microbial- and arthropode-plant communications [27]. The evaluation of all these functional traits could offer useful information for effectively promoting translocation and mitigation operations to restore Salvia ceratophylloides rare plant species.
In this framework, the present study was addressed to assess the morpho-ecophysiological and metabolic traits of S. ceratophylloides from its natural habitat and investigate the following questions: (1) does the within-plant variation of the photosynthetic performance, morphological traits, and metabolic profiles occur? (2) is the within-plant morpho-physiological and metabolic variation of S. ceratophylloides modified between the two localities?

2. Results

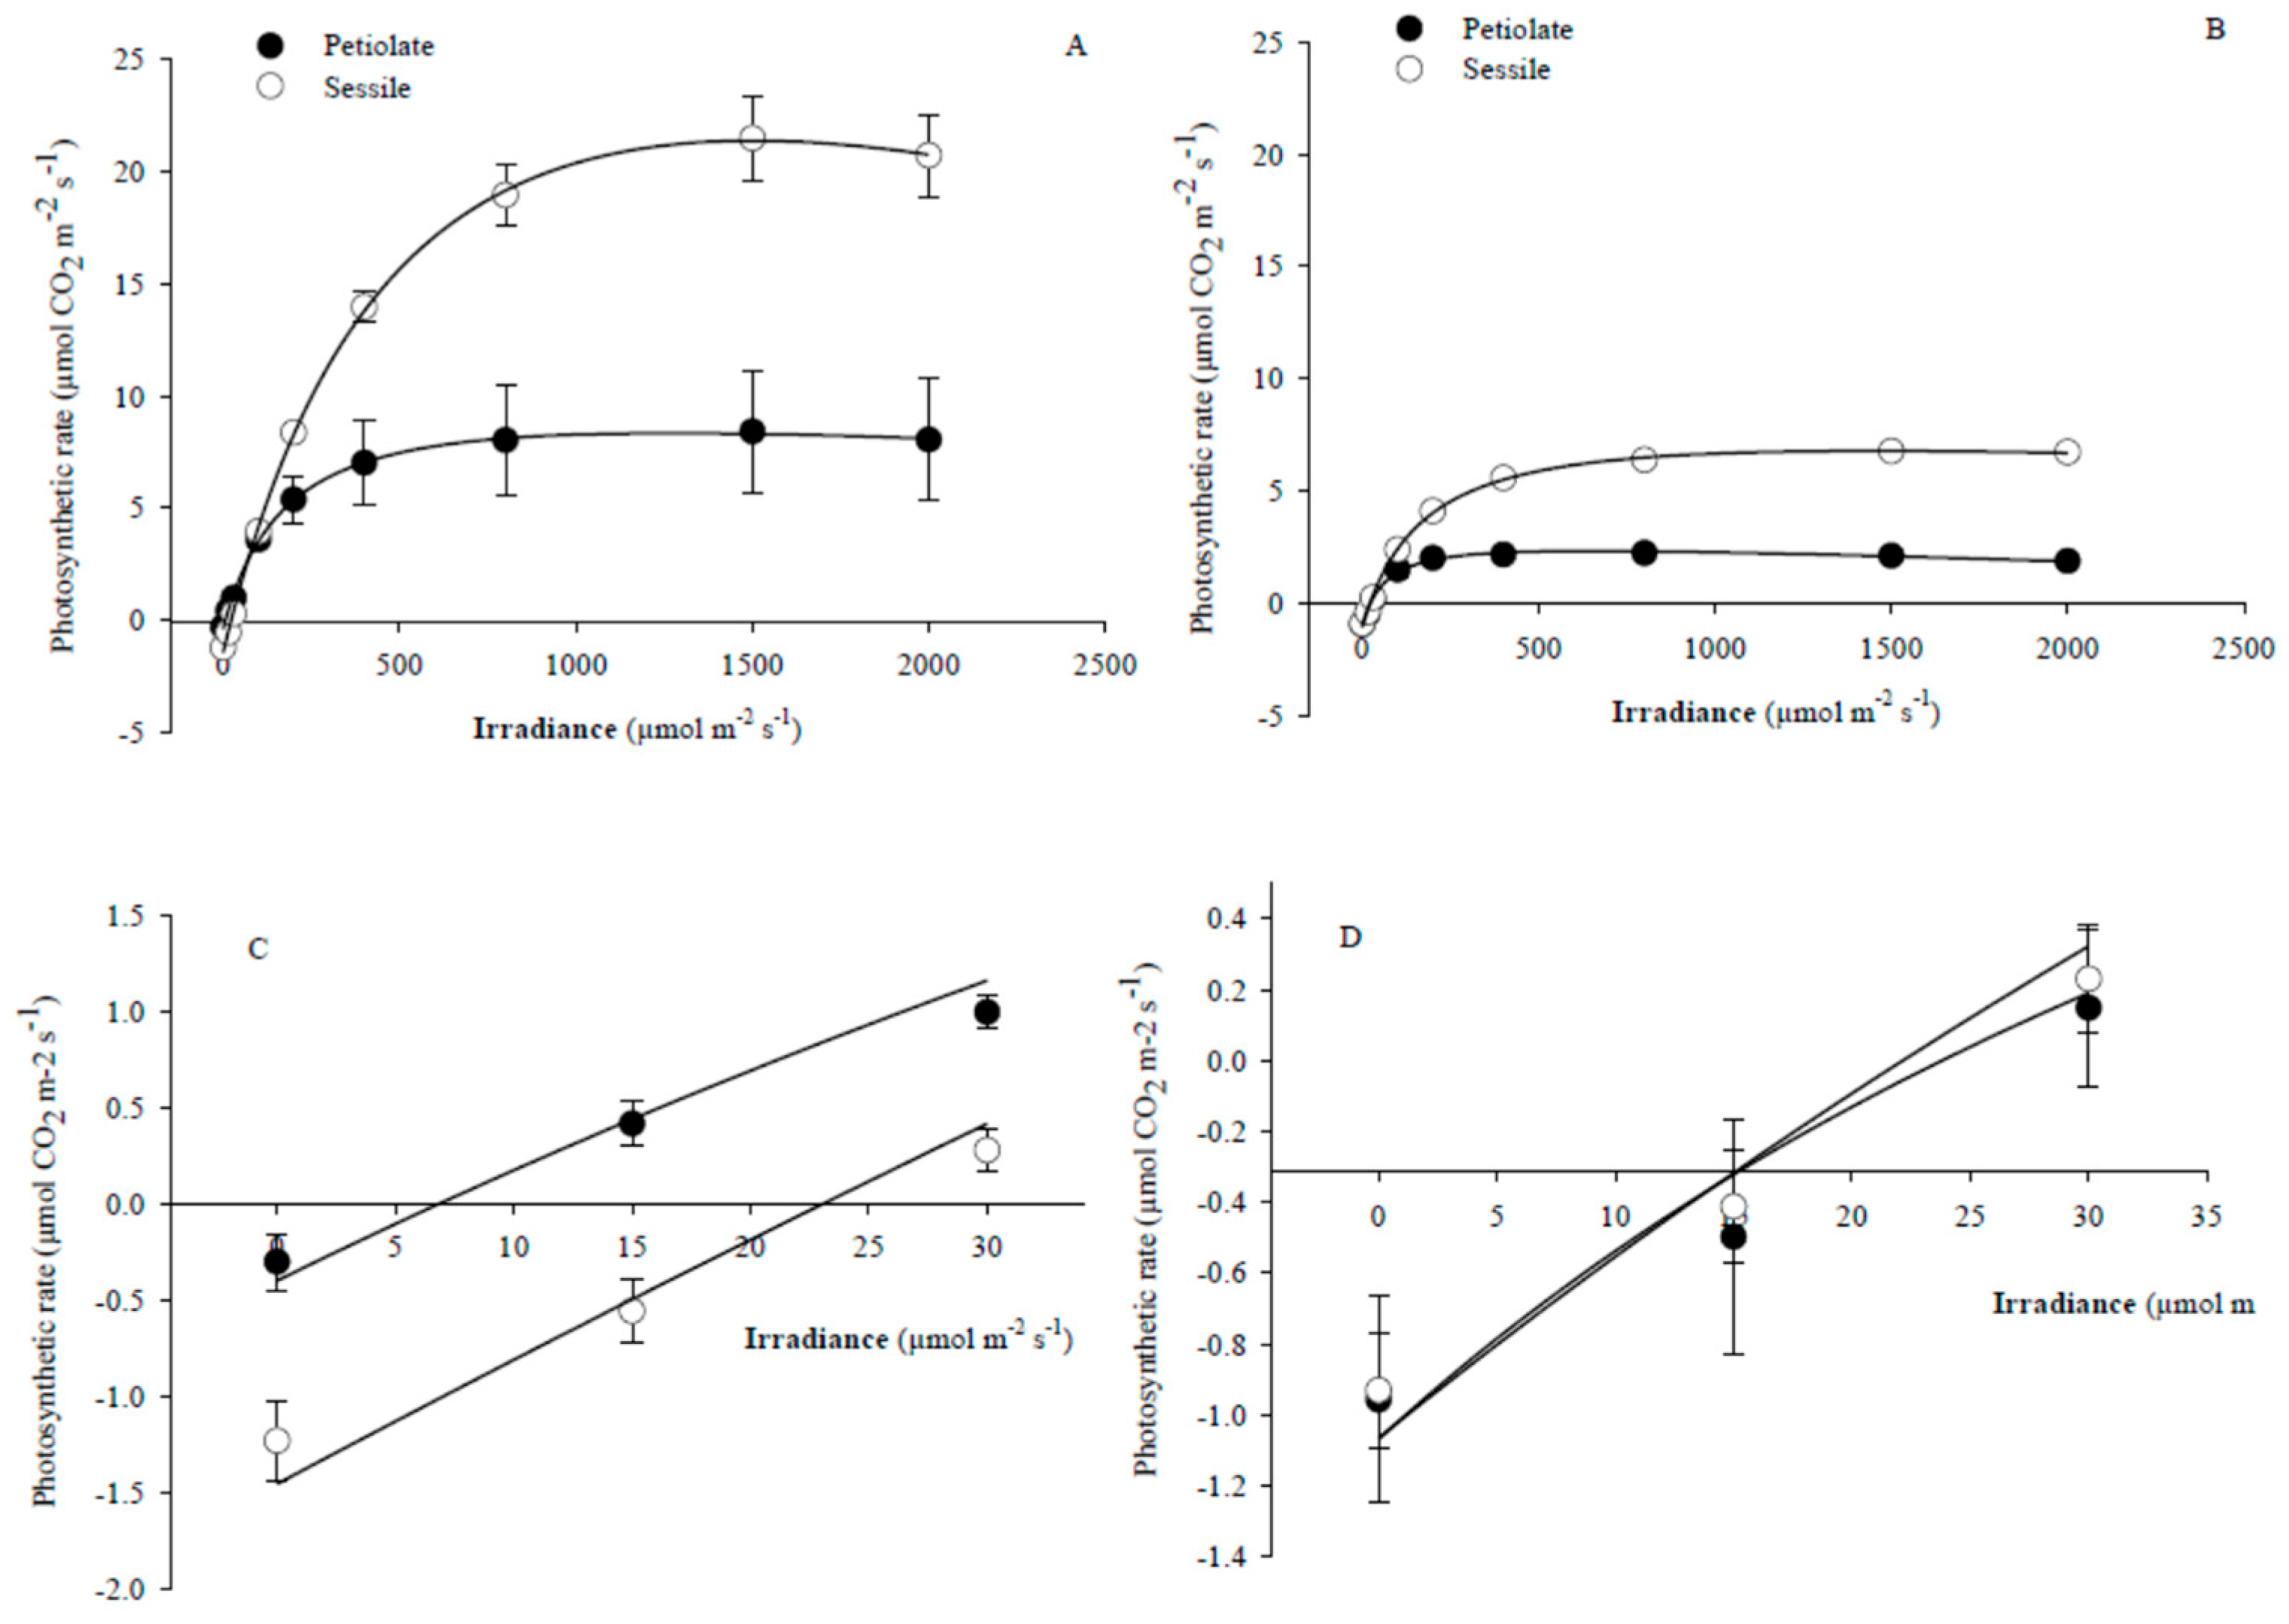
2.1. Physiological Performances and Morphological Traits of S. ceratophylloides

The net photosynthetic rate (PN) and the photosynthetic photon flux density (I) curves of S. ceratophylloides leaves were well-fitted (R2 > 0.95 and p < 0.05) and –described by Ye mathematical model [28] (Figure 1). The parameters estimated by non-linear regression have been reported in Table 1. As observed, the leaf type produced a significant and strong effect on most photosynthetic parameters. In particular, the sessile leaves showed a higher Isat (1578 μmol(photon) m−2 s−1), Imax (766 μmol(photon) m−2 s−1), PNmax (11.22 μmol(CO2) m−2 s−1) and ϕ(I0 – Icomp) (0.030 µmol(CO2) µmol(photon) −1) level than petiolate ones which showed a lower dark respiration rate (RD) (0.69 µmol(CO2) m−2 s−1). This pattern was observed in both sites except for the PNmax, which was statistically different between the two leaf types in relation to the site (p < 0.05 LT × Sit interaction, Table 1): the petiolate leaves (6.85 µmol(CO2) m−2 s−1) showed a lower value of PNmax respect to the sessile ones (19.70 µmol(CO2) m−2 s−1) at Mo site. Further, the significant LT × Sit interaction observed for the Icomp and RD indicated that the parameters difference between the leaf types was affected by the site factor. Indeed, the Icomp of the sessile leaf was higher than petiolate ones (8 vs. 22 µmol(photon) m−2 s−1) at Mo site only, and the same pattern was observed for the RD (0.53 vs. 1.40 µmol(CO2) m−2 s−1) (Table 1).
The comparisons of the Isat and Icomp of S. ceratophylloides with those of different functional plant groups are shown in Figure S1. The minimum Isat value of S. ceratophylloides fell between that of schlerophylls in habitat at a high light intensity and heliophytes, while the maximum one was within the range between heliophytes and C4 plants. The minimum Icomp value of S. ceratophylloides was between epiphytes and spring geophytes, while the maximum was between spring geophytes and heliophytes.
The stomatal conductance and transpiration rate of both leaves of S. ceratophylloides, measured at 200 and 800 µmol(photon) m−2 s−1 corresponding to the light intensities around to the Imax values of the P and S leaves, respectively, are reported in Table 2 and Table 3. Like photosynthetic pattern, the P leaves pointed out a significantly lower stomatal conductance and transpiration rate than S at both light intensities. However, this effect was different between the sites (p < 0.01 for LT × Sit interaction, Table 2 and Table 3): the S leaves showed higher levels of the stomatal conductance and transpiration rate with respect to the P ones only in the Mo site while any difference between the leaf type has been produced in Pu site. The site’s effect was highly significant (p < 0.001, Table 2 and Table 3) for both ecophysiological parameters, evidencing higher values for the Mo site than Pu.
The leaf morphology of S. ceratophylloides was reported in Table 4. Leaf type affected the leaf fresh weight, leaf area, leaf water content, and fractal dimension, which were higher in P leaves. This pattern, however, was modified in relation to the site for the LFW and LA only with higher values in the petiolate in Pu site only (p < 0.05 LT × Sit interaction, Table 4). Finally, the site factor affected the LFW, LDW, and LWC showing higher values in the Mo site (Table 4).
Value average (±SD) of LMA of S. ceratophylloides in comparison with that of the sun- and shade-species herbs, evergreen angiosperm, evergreen species, herbs, and different Salvia species are shown in Figure S2. The LMA range of S. ceratophylloides fell in that of the herbs, evergreen species, S. mellifera, S. hispanica, S. officinalis, and sun species.

2.2. VOCs Analysis of Salvia ceratophylloides in Its Habitat

The PCA of GC-MS spectra of different leaves and sites of Salvia ceratophylloides are shown in Figure 2. The two-dimensional PCA score plot revealed a separation in VOCs profile induced by leaf type, clearer in Mo site than Pu ones. The VOCs profile was also different between the two Salvia sites.
VOCs detected by GC-MS are summarized in Table S1. Thirty-nine compounds belonging to different chemical classes were identified. Among them the most representative were monoterpenes (17), sesquiterpenes (7), monoterpene alcohols (4), aldehydes (4), ketons (3), alcohols (2), aliphatic esters (1) and ether (1).
Comparing the amount of the XCMS-extracted peak intensities of each chemical between the S and P leaf types, 13 compounds emitted by both P and S were statistically different (Table 5). In particular, p-cymene, sabinene, terpinolene, β-pinene, γ-terpinene, α-terpineol, α-cubebene, α-muurolene, isovaleraldehyde, 5-methylheptan-3-one, pentan-3-one, β-tujone, and dimethyl sulfide were higher in S than P leaves. However, the higher emission of β-tujone and α-terpineol in S leaves was only observed in Mo site (significant LT × Sit interaction, Table 5). The same pattern was revealed for D-germacrene, which was not modified by both leaf type and the site as single factors. Only six compounds were differently affected by sites: p-cymene, α-terpineol, α-copaene and α-cubebene, emitted in Pu more than Mo site which, conversely, produced more β-tujone and dimethyl sulfide (Table 5).

3. Discussion

3.1. The Assessment of the Morpho-Physiological Traits of the Rare Salvia ceratophylloides Ard.

Salvia ceratophylloides Ard., an endemic, rare, and critically endangered plant species, has been recently rediscovered on some sites around the Reggio Calabria hills [2,3]. The knowledge of its morphological and ecophysiological traits is very important for understanding the habitat requirements for the conservation [24] and providing its capacity to adapt to climate change conditions and, consequently, to the plant communities distribution [25]. The responses of these traits in S. ceratophylloides are reported here for the first time. We mainly focused on two functional traits, the photosynthetic light-response curve and leaf mass per area, which indicate the habitat preferences and responsiveness to environmental conditions [24,29,30]. The photosynthetic response curves to the PAR photon flux and, in particular, the Isat (818–1588 µmol(photon) m−2 s−1) and Icomp values (8–26 µmol(photon) m−2 s−1) suggested that S. ceratophylloides was well adapted to the sunny habitat. Indeed, the minimum and maximum values of the Isat fell within the range defined by sclerophyll of sunny habitat and C4 plants and, the Icomp values were included between spring geophytes and heliophytes. The LMA values (44.1–55.4 g m−2) of S. ceratophylloides were comprised in the LMA range of the herbs [29] and evergreen species [30]. Among the different Salvia species, the LMA of S. ceratophylloides was similar to S. mellifera, S. hispanica and S. officinalis [31,32,33], lower than S. mohavensis and S. dorrii var. dorrii [31], and higher than S. glutinosa and S. pratensis [34,35]. The different ranges of the LMA of S. ceratophylloides with respect to that of some Salvia species, were probably correlated with its functional response to the environmental conditions, such as water and light availability [29,30]. For example, S. mohavensis and S. dorrii var. dorrii showed a higher LMA value because of the adaptation to their native desert area (mountain ranges of the Mojave Desert of southern California, south-western Nevada, and northern Baja California Norte, Mexico) [31]. Although the S. pratensis was strictly related to S. ceratophylloides (belonging to the same sect. Plethiosphace: [36]) as distributed to the similar area (native from Europe: [37]), it showed lower LMA value [34] probably due to the different growing conditions of S. pratensis (pot and growth chamber) in Mommer’s experiments. Finally, the LMA values (57 g m−2) of S. ceratophylloides fell in the range of sun species confirming its preference to the open sunny habitat as reported for the most Salvia species [32,38].

3.2. Does the Within-Plant Variation of the Photosynthetic Performance, Morphological Traits and Metabolic Profiles Occured?

Recently, the within-plant variation as an expression of intraspecific phenotypic plasticity is strongly taken into account for its role in plant evolution and ecology at the individual, population, and community levels [12,13]. For example, the within-plant variation in leaf morpho-physiological traits allows the adaptation of each individual to optimize (i) its capturing structures to the heterogeneous local environmental conditions such as light, temperature, and CO2 gradients within plant canopy in trees [14] and perennial herbs [17], and (ii) its cost-expensive defenses against herbivory and pathogens [39,40]. Further, the knowledge of the leaf-level photosynthetic performances within the plant allow to scale at canopy level [41] and understand the competitive strategies for exploring the within-canopy heterogeneous light and CO2 availability. In this respect, the within-plant variation of S. ceratophylloides by comparing the morpho-physiological and metabolic traits of petiole and sessile leaves were here tested, for the first time.
The S. ceratophylloides individuals exhibited a clear within-plant variation determined by the differences in most functional traits [Isat, Imax, PNmax, ϕ(I0 – Icomp), RD, stomatal conductance, transpiration rate, leaf fresh weight, leaf area, leaf water content, fractal dimension, and VOCs] between sessile and petiolate leaves. Indeed, comparing the leaf types, S pointed out a better photosynthetic performance pointing out a higher net photosynthetic rate, maximum quantum yield, and Isat [1578 vs. 911 µmol(photon) m−2 s−1]. Conversely, they exhibited a lower leaf area and capacity to fill the space, as evidenced by FD, respect than the P ones.
Hence, a within-plant efficient subdivision of the functional traits for the resource acquisition and use (light, CO2) was observed in S. ceratophylloides with the short-term low-expensive physiological traits in S leaves (uppermost) and the long-term high-expensive morphological traits in P leaves (lowest). Hence, the S. ceratophylloides leaves, placed at the top of the shoot and facing high light intensity, temperature, and vapor pressure deficit, could use higher photon and CO2 fluxes for increased their carbon gains by high Isat and stomatal conductance. The spatial distribution of more efficient structures or functions within plants to fit the micro-environmental heterogeneous conditions and maximize photosynthesis and carbon gain was already known in different plant species [42]. Besides the functional traits linked to the resource acquisition, the two leaf types of S. ceratophylloides pointed out difference in the stomatal conductance and transpiration with the S leaf showing higher values, limiting the leaf overheating, as reported by Lin et al. [43] in dry areas species. The lower aerodynamic resistance caused by the smaller size and shape of the sessile leaves (lower leaf area and fractal dimension) was further beneficially allied for avoiding leaf overheating [43,44] but also for reducing the water loss by smaller total leaf area. Overall, the leaf position in the S. ceratophylloides canopy showed different strategies to cope with the fine-scaled environmental gradients: from higher to lower light intensity and from dry to wet conditions along the uppermost sessile and lowest petiolate leaf gradient.
The within-plant variation of S. ceratophylloides was also observed in the VOCs composition and emission. Indeed, the S and P leaves were sharply separated by VOC-based metabolic profiles suggesting different intensity and composition between them. Further, the emission of 14 out of 39 identified VOCs was statistically increased in S leaves respect than P ones, including monoterpenes (p-Cymene, Sabinene, Terpinolene, β-Pinene, γ-Terpinene, and α-Terpineol), sesquiterpenes (D-Germacrene, α-Cubebene, α-Muurolene) and green leaf volatiles ((3z)-3-Hexenyl acetate) mostly involved in defenses against herbivory and pathogens [45] and in responses to abiotic stress [46]. The within-plant variation of VOCs emission in response to herbivory has been already observed in wild and crop species [47,48], but no evidence at the field level has been reported yet. Why do S. ceratophylloides plants defend the S more than P leaves by higher VOCs emission? Probably, the upper, younger, sessile leaves are more protected in views of their high-performing photosynthetic machinery and nutritive value (high leaf dry content, although not statistically supported) as suggested by the optimal defense hypothesis [39,40]. Overall, these results pointed out the within-plant functional subdivision at morpho-physiological and metabolic levels of S. ceratophylloides mimicking what has been already observed in the wide crown of trees for heat tolerance [49], light acquisition, and differential expression of genetic polymorphisms in the sun and shade leaves of trees [50] and defense responses to herbivory [51].
The within-plant variation of morpho-physiological and metabolic traits was affected by the site suggesting that Salvia plants were adapted to local conditions. Indeed, the S and P leaves’ morpho-physiological patterns changed between the two sites for most traits (on 12 that showed the leaf type factor as statistically significant, nine traits pointed out LT × Sit interaction). The S leaves pointed out a higher photosynthetic rate, stomatal conductance, and transpiration rate associated with higher dark respiration and Icomp than P ones in the Mo site only. These results explained the phenotypic plasticity response to the local conditions [52,53] because preliminary results showed a low genetic variability of S. ceratophylloides populations [23]. It has been observed that the within-plant phenotypic variation responded to the microhabitat environmental heterogeneity or fine-grained (small-scale) environmental variations [9,11,14,15] rather than macro-geographical or coarse-grained environmental variations [17,54,55]. In this respect, we hypothesized that the S. ceratophylloides individuals in the Mo site, characterized by a significant within-plant variation of the leaf morpho-physiological traits, could face with a higher microhabitat environmental heterogeneity, especially for light intensity and/or temperature gradients (the most important abiotic stresses affecting the leaf growth), than Pu site. Opedal et al. [56] observed that the microhabitat environmental heterogeneity increased with the topographically complex sites changing the intraspecific traits of 16 plant species. In accordance, the Pu site is characterized by flatter, more open terrains and higher altitude than Mo ones, which conversely is placed at a lower altitude at the base of the valley, closed and with rough terrains likely determining a short duration of light and steeply thermal and light gradients.
Unlike the morpho-physiological traits, the within-plant variation of metabolic profiles was lesser affected by the different sites. Indeed, the PCA pointed out that S and P leaves’ metabolic profiles were separated at both sites, and only 4 out 13VOCs exhibited a statistically significant Lt × Sit interaction. Since the VOCs emission is more involved to the biotic stress (plant-plant, plant-herbivory, and plant-pathogen interactions) [27], probably the Salvia plants in both sites are faced to similar biotic environment heterogeneity or variability (predation, competition, etc.) differently to the abiotic ones (light, temperature, etc.), determining thus the maintaining of the same within-plant VOCs emission in S. ceratophylloides at both sites.
Finally, the metabolite profiling and physiological traits (10 out of 10 parameters, considering the LT × Sit interaction also; Table 1, Table 2 and Table 3, Figure 2) varied more than morphological features (4 out 7 parameters; Table 4). Why do S. ceratophylloides plants choose to invest in the physiological and metabolic capacity more than morphological-related traits in S and P leaves? The physiological plasticity has a low cost and more rapid response with respect to the cost-expensive morphological plasticity, allowing the expression of the most adequate plant phenotype in response to the variable climatic conditions. For example, the plant physiological plasticity is strictly related to an enhanced ability to colonize gaps and open areas and, hence, exploiting the transient environmental resources at low cost by short-term adjustments, such as plant acclimatization [47,48,49,50,51,52,53,54,55,56,57,58,59,60]. Conversely, the plant morphological plasticity is more functional for the plant adaptation in the long-term and probably useful for growing in forest understories [57,61]. The choice to invest in higher plasticity of the physiological traits than morphological ones has also been reported by Herrera et al. [17], which observed that the within-ramet variation in Helleborus foetidus L. was more due to the stomatal features than leaf size- and area-related traits causing an increase of seed number produced by each individual [13].

4. Materials and Methods

4.1. Species and Sites

Salvia ceratophylloides Ard. rediscovered by Crisafulli et al. [2], is a perennial herb, scapose hemicryptophyte, with woody and upright stems with a dense pubescence of glandular and simple patent hairs (Figure S3C). Leaves are opposite pinnate-partite with toothed lobes and morphologically distinct in petiolate (basal, 12 × 4 cm long and less discrete pinnate lobes and presence of the petiole) and sessile (cauline, 3–4 × 1–2 cm long and more incise pinnate lobes, clasp the stem) (Figure S3C). Inflorescences are 20–30 cm in length with 5–6 verticillasters, each with 4–6 flowers.
S. ceratophylloides plants were identified in two small hilly and closer sites (<2 Km) around the city of Reggio Calabria, Mosorrofa (Mo), and Puzzi (Pu) (Southern Italy) (Figure S4). Each site consisted of around 60 and 240 individuals for Mosorrofa and Puzzi, respectively. Further, Mosorrofa site is topographically complex in a little valley, while Puzzi pointed out open and flatter terrains (Figure S3A,B). Both sites are characterized by layers of loose sand alternating with benches of soft calcarenites of Pliocene origin. Soils have a sandy texture with a basic pH falling into the group Calcaric Cambisols [62].
Species identification is in agreement with Pignatti [63], and the specimens are deposited in the Herbarium of Mediterranean University of Reggio Calabria (acronym REGGIO).
The S. ceratophylloides location pointed out a Mediterranean climate with average annual temperatures of 18 °C and an average annual rainfall of 600 mm mostly in autumn-winter and a dry summer period. According to Rivas-Martínez [64], the macro-bioclimate is “Mediterranean pluviseasonal oceanic” (upper thermo-Mediterranean thermotype and lower subhumid ombrotype).

4.2. Measurements and Samplings

Measurements and samplings have been carried out in the early summer (May–June) of 2016 and 2017 on two leaf types: (1) the upper sessile (S) (two to three nodes from the apex) and (2) the lower petiolate (P) (from fifth to sixth nodes from the apex) (Figure 1C). For the morphological and physiological analysis, 4–9 and 5–9 samples for petiolate and sessile leaves, respectively, have been collected from each site; while the metabolic analysis has been carried out on 3 leaves of each type and site.

4.3. Physiological Analysis

The net photosynthetic light response curves have been determined using LI-6400XT portable photosynthesis system (Li-Cor, Inc. Lincoln, Nebraska, USA) at 2000, 1500, 800, 400, 200, 100, 30, 15, and 0 µmol m−2 s−1 irradiance levels. The net photosynthesis has been measured at 500 cm3 min−1 flow rate, 26 °C leaf temperature, 400 μmol(CO2) mol(air)−1 CO2 concentration (controlled by CO2 cylinder). Each measurement was made with a minimum and maximum wait time of 120 and 200 s, respectively, and matching the infrared gas analyzers for 50 μmol(CO2) mol(air)−1 difference in the CO2 concentration between the sample and reference before any change in irradiance levels. The leaf-to-air vapor pressure difference has been set at 1.5 kPa, continuously monitored around the leaf during the measurements and maintained at a constant level by manipulating incoming air humidity as needed. The measurements were carried out on sunny days between 8:30–11:30 am. Finally, stomatal conductance (gs, mol H2O m−2 s−1) and transpiration rate measurements (T, mmol H2O m−2 s−1) have been evaluated at each light intensity.

4.4. Morphological Analysis

After the physiological analysis, the same leaves were used for the morphological analysis. In particular, leaf fresh weight (LFW, g) and dry weight (LDW, g), were determined after oven-drying at 70 °C for 2 days, while leaf area (LA, cm2) were scanned at a resolution of 300 dpi (WinRhizo STD 1600) and measured using WinRhizo Pro v. 4.0 software package (Instruments Régent Inc., Chemin Sainte-Foy, Québec, Canada). Further, the leaf fractal dimension (FD) was obtained by the “fractal analysis module” (WinRhizo software), based on the box-counting method with the following settings: maximal pixel size (2.0 mm), box sizes ranging from 2 to 32, filters, and a length/width ratio smaller than 2.00. The FD provides information on the object’s space occupation: the fractal dimension approaches the value of 2 as the leaves become dense to the point of “filling in” a shape. For this reason, the FD has been used both for correlating the root architecture to the soil resource acquisition [65], and in the LAI-Light interception models as the correction parameter [66].
Through these parameters, we also calculated the leaf mass per area (LMA, g LDW cm−2 LA), strongly related to photosynthetic rate [67], growth rate [68] and decomposition rate [69]; the leaf dry content (LDC, g dry weight/g fresh weight), strongly related with relative growth rate [70], flammability [71], and post-fire regeneration strategy [72]; and the leaf water content or leaf succulence (LWC, g H2O/cm2 leaf area], directly correlated with the plant responses to abiotic stresses [73].

4.5. VOC Analysis: HeadSpace/Solid-Phase Micro-Extraction (HS/SPME) GC-MS Analysis

The volatiles (VOCs) produced by petiolate and sessile leaves of S. ceratophylloides have been characterized using the HS/SPME method. One gram of plant material, per sample and replicate (N = 3), was sealed in a 20 mL vial and allowed to equilibrate for 20 min at room temperature. Successively, the SPME gray fiber (StableFlex, divinylbenzene/Carboxen on polydimethylsiloxane coating; 50/30 μm coating; Supleco) was exposed to plant VOCs for 20 min to allow the VOCs adsorption on the fiber.
VOCs were identified using a Thermo Fisher gas chromatography apparatus (Trace 1310) coupled with a single quadrupole mass spectrometer (ISQ LT). The capillary column was a TG-5MS 30 m × 0.25 mm × 0.25 µm. Helium was used as carrier gas with a flow of 1 mL/min. Samples were injected in a split mode with a split ratio of 60. Injector and source were settled at the temperature of 200 °C and 260 °C, respectively. The temperature ramp was settled as follow: 7 min at 45 °C, from 45 °C to 80 °C with a rate of 10 °C × min, from 80 °C to 200 °C with a rate of 20 °C × min then isocratic for 3 min 200 °C. Mass spectra were recorded in electronic impact (EI) mode at 70 eV, scanning the 45–500 m/z range.
Native raw chromatograms (RAW), previously converted in mzXML using the tool MSconvert of proteowizard [74], were normalized for TIC intensity, aligned, deconvoluted, and peak intensities extracted using the open-source software XCMS [75]. For peak analysis the GC/Single Quad (matchedFilter) pre-settled method was applied.
After chromatograms processing and peak picking, features and normalized peak areas were imported to Excel for further statistical analysis. Compounds identification was carried out comparing the relative retention time and mass spectra of molecules with those of commercial libraries (NIST Mass Spectral Reference Library) and open-source EI spectral libraries (Mass Bank of North America, Golm Metabolome Database) [76,77].

4.6. Statistical Analysis

Light curves were fitted by nonlinear regression using the Ye et al. [28] model equation:
P N = ϕ ( I 0 I comp ) × 1 β × I 1 + γ × I × ( I I comp )
where: PN is the net photosynthetic rate [μmol(CO2) m−2 s−1]; I is the photosynthetic photon flux density [μmol(photon) m−2 s−1]; Icomp is the light compensation point [μmol(photon) m−2 s−1]; β is the adjusting factor (dimensionless); γ is the adjusting factor (dimensionless); ϕ(I0–Icomp) is the quantum yield obtained at the range between I0 and Icomp [μmol(CO2) μmol(photon)−1]. The following leaf-level photosynthetic parameters were calculated by these equations [28]:
P g m a x = ϕ ( I 0 I comp ) × 1 β × I 1 + γ × I × ( I I comp ) + R D
R D = ϕ ( I 0 I comp ) × I comp
I sat = ( β + γ ) × ( 1 + γ × I comp ) β 1 γ
Isat is the light saturation point [μmol(photon) m−2 s−1]; Pgmax is the asymptotic estimate of the maximum gross photosynthetic rate [μmol(CO2) m−2 s−1]; RD is the dark respiration rate [μmol(CO2) m−2 s−1]. Finally, the ϕ(Icomp–I200) was calculated as the slope of the linear regression of PN for values of I between Icomp and 200 μmol (photon) m−2 s−1 representing the “maximum quantum yield”.
Finally, according to Lobo et al. [78], we reported the Imax (μmol(photon) m−2 s−1) (light saturation point beyond which there is no significant change in PN) and the PN (Imax) (μmol(CO2) m−2 s−1) (maximum value of PN obtained at I = Imax) instead of Isat and Pgmax as more realistically adequate. We used a simple routine to minimize the error sum of squares (SSE) for fitting the models, allowing the determination of equation parameters using the Microsoft Excel spreadsheet and Solver function (Microsoft Excel 2010). Non-linear regressions were repeated several times in order to minimize the sum of square of deviation between predicted and experimental values to less than 0.01% between two consecutive fits [79].
In order to evaluate the effect of the Years (Y) (2016 and 2017), we used the one-way ANOVA on the gas exchange parameters, which quickly respond to the environmental conditions. Since the Years factor was not significant (p > 0.05) for almost all the gas exchange traits (Table S2), all the morpho-physiological parameters were analyzed by two-way analysis of variance with the Leaf Type (LT) (sessile and petiolate) and Site (Sit) (Mosorrofa and Puzzi) as main factors and their interaction Lt × Sit. Then, Tukey’s test was used to compare the means of all the parameters of each LT and Sit. All the data were tested for normality (Kolmogorov–Smirnoff test) and homogeneity of variance (Levene median test) and, where required, the data were transformed.
For the comparison of the LMA and PN of S. ceratophylloides with that of different plant functional groups and Salvia spp., we used the Isat and Icomp data obtained from [80,81] for evergreen angiosperm, [29] for evergreen shrub, [30] for evergreen species, [82] for S. officinalis, [34] for S. pratensis, [35] for S. glutinosa, [33] for S. hispanica, [31] for S. mohavensis, S. leucophylla, S. dorrii var. dorrii and S. mellifera.
The TIC intensity normalized dataset obtained from metabolomic data analysis were classified through unsupervised Principal Component Analysis (PCA) where the output consisted of score plots to visualize the contrast among different samples. PCA analysis was carried out on all the features detected by the analysis. Successively, identified and annotated compounds were statistically analyzed through univariate two-way analysis of variance with the LT (sessile and petiolate) and Sit (Mosorrofa and Puzzi) as major factors. Then, the Tukey’s test was used to compare the compound means of each leaf type and site (p < 0.05).

5. Conclusions

The eco-physiological adaptation of S. ceratphylloides, a rare and endangered plant species, to its habitat by functional traits was studied. The higher light saturation and compensation point and leaf mass per area indicated a sunny habitat preference of S. ceratophylloides. These results suggested that lower competition (low density and diversity), especially with woody species (trees and shrubs), should be favored for its in situ conservation. However, the S. ceratophylloides habitat has been destroyed and continuously fragmented because of anthropogenic disturbance and environmental deterioration. Consequently, further and deepening study needs to identify the main stressful factors that threaten its growth, development, and fitness. Due to the objective difficulty to preserve the taxon in situ and pending further experimental data on its ecology, as indicated for other nationally threatened CWRs species [83], ex situ conservation actions are recommended. For the ex situ propagation, we recommend growing the seedlings at least half sunlight (1200 µmol (photons) m−2 s−1).
Further, for the first time, the “continuous within-plant variation” of the morpho-physiological traits and metabolic profiles of this species was assessed in the field. The results indicated that the physiologic and metabolic traits explained most of its within-plant plasticity, which was also affected by the location. Indeed, the sessile and petiolate leaves of S. ceratophylloides showed different photosynthetic performances and metabolic profiles, but the sub-individual variation of the photosynthetic-related parameters, differently to the volatilome, was exhibited in one site only. These within-plant patterns, probably related to the micro-environmental heterogeneity, could optimize the growth and defense machinery for the fitness’s improvement to specific habitats. Overall, the magnitude of the within-plant variation should be taken into consideration when designing sampling schemes for the ecological studies of S. ceratophylloides.

Supplementary Materials

The following are available online at https://www.mdpi.com/2223-7747/10/3/474/s1, Figure S1: Plants of Salvia ceratophylloides in the two sites, Mosorrofa [Mo] (A) and Puzzi [Pu] (B). The red circles indicate the places where the Salvia ceratophylloides plants have been discovered. (C) Individual plant of Salvia ceratophylloides and different leaves: petiolate (P) and sessile leaf (S), Figure S2: Distribution map of Salvia ceratophylloides, Figure S3: Light saturation point (µmol(photons) m−2 s−1) (upper panel) and light compensation point (µmol(photons) m−2 s−1) (bottom panel) of different plant functional groups. The data [minimum (▮) and maximum value ()] are derived from Larcher [80]. The dotted lines are drawn for a better comparison with the minimum and maximum value of Salvia ceratophylloides, Figure S4: Leaf mass per area (g m−2) of sun- and shade-species herbs, evergreen angiosperm and species, herbs and different Salvia species. The data of LMA of Salvia species, herbs, evergreen angiosperm and species are indicated by minimum (▮) and maximum value () or by the average (black plot point and the standard deviation where reported)] and have been derived from Martins et al. [82] for S. officinalis, Mommer et al. [34] for S. pratensis, Paź-Dyderska et al. [35] for S. glutinosa, Goergen et al. [33] for S. hispanica, Knight and Ackerley [31] for S. mohavensis, S. leucophylla, S. dorrii var. dorrii and S. mellifera, Poorter et al. [29] for herbs, Duursma et al. [81] for evergreen angiosperm and de la Riva et al. [30] for evergreen species. Box plots point out the distribution of LMA values as observed for a wide range of sun- and shade-species herbs both annual and perennial, with the bottom and top part of the box indicating the 25th and 75th percentile, respectively, the two whiskers the 10th and the 90th percentile, respectively, and the horizontal line within the box the median value. The data for the box plot are derived by scientific literature as indicated in Table S1. The dotted lines have been drawn for better comparisons and pointed out the range of LMA values of S. ceratophylloides, Table S1: Two-way ANOVA results and chemical characterization (average and error standard within brackets) of volatile organic compounds in fresh sessile and petiolate leaves of Salvia ceratophylloides harvested in two different sites [Mosorrofa (Mo) and Puzzi, (Pu)]. Different lower-case letters indicated significant differences at p < 0.05 among the average along the rows (Tukey’ test) and they have been only reported when the LT × Sit interaction was significant. The bold identify the statistically significant factors and/or their interaction, Table S2: F statistic and p values (within brackets) of one-way ANOVA of the leaf-level photosynthetic parameters of Salvia ceratophylloides measured in 2016 and 2017.

Author Contributions

Conceptualization, R.V. and A.S. (Agostino Sorgonà); Investigation, R.V., C.M.M., F.A. and V.L.A.L.; Methodology, R.V., C.M.M., F.A. and V.L.A.L.; Formal Analysis, F.A., M.R.A. and A.S. (Adriano Sofo); Writing—Original Draft Preparation, R.V.; Writing—Review & Editing, F.A., M.R.A., A.S. (Adriano Sofo), G.S. and A.S. (Agostino Sorgonà); Visualization, A.S. (Adriano Sofo); Resources, G.S. and A.S. (Agostino Sorgonà); Project administration, A.S. (Agostino Sorgonà); Supervision, A.S. (Agostino Sorgonà); Validation, A.S. (Agostino Sorgonà). All authors have read and agreed to the published version of the manuscript.

Funding

This research received no external funding.

Institutional Review Board Statement

Not applicable.

Informed Consent Statement

Not applicable.

Data Availability Statement

The data presented in this study are available on request from the corresponding author.

Acknowledgments

The Authors are grateful to the Marino Antonio for its support in the field study and for its lovely conservation care of the Salvia ceratophylloides at Puzzi (RC) location. We also acknowledge funding from the PhD course “Agricultural, Food and Forestry Science” of the University “Mediterranea” of Reggio Calabria and the Department AGRARIA of the University “Mediterranea” of Reggio Calabria for supporting R.V. research activity.

Conflicts of Interest

The authors declare no conflict of interest.

References

  1. Conti, F.; Manzi, A.; Pedrotti, F. Liste Rosse Regionali delle Piante d’Italia, WWF; Società Botanica Italiana: Camerino, Italy, 1997. [Google Scholar]
  2. Crisafulli, A.; Cannavò, S.; Maiorca, G.; Musarella, C.M.; Signorino, G.; Spampinato, G. Aggiornamenti floristici per la Calabria. Informatore Botanico Italiano 2010, 42, 431–442. [Google Scholar]
  3. Bonsignore, C.P.; Laface, V.L.A.; Vono, G.; Marullo, R.; Musarella, C.M.; Spampinato, G. Threats Posed to the Rediscovered and Rare Salvia ceratophylloides Ard. (Lamiaceae) by Borer and Seed Feeder Insect Species. Diversity 2021, 13, 33. [Google Scholar] [CrossRef]
  4. Laface, V.L.A.; Musarella, C.M.; Ortiz, A.C.; Canas, R.Q.; Cannavò, S.; Spampinato, G. Three New Alien Taxa for Europe and a Chorological Update on the Alien Vascular Flora of Calabria (Southern Italy). Plants 2020, 9, 1181. [Google Scholar] [CrossRef]
  5. Musarella, C.M.; Stinca, A. New data on the alien vascular flora of Calabria (Southern Italy). Annali di Botanica 2020, 10, 55–66. [Google Scholar] [CrossRef]
  6. Franks, S.J.; Weber, J.J.; Aitken, S.N. Evolutionary and plastic responses to climate change in terrestrial plant populations. Evol. Appl. 2014, 7, 123–139. [Google Scholar] [CrossRef]
  7. Noel, F.; Machon, N.; Porcher, E. No genetic diversity at molecular markers and strong phenotypic plasticity in populations of Ranunculus nodiflorus, an endangered plant species in France. Ann. Bot. 2007, 99, 1203–1212. [Google Scholar] [CrossRef] [PubMed] [Green Version]
  8. Westerband, A.C.; Bialic-Murphy, L. Intraspecific variation in seedling drought tolerance and associated traits in a critically endangered, endemic Hawaiian shrub. Plant Ecol. Div. 2020. [Google Scholar] [CrossRef]
  9. Winn, A.A. Adaptation to fine-grained environmental variation: An analysis of within-individual leaf variation in an annual plant. Evolution 1996, 50, 1111–1118. [Google Scholar] [CrossRef]
  10. Winn, A.A. The contributions of programmed developmental change and phenotypic plasticity to within-individual variation in leaf traits in Dicerandra linearifolia. J. Evol. Biol. 1996, 9, 737–752. [Google Scholar] [CrossRef]
  11. de Kroon, H.; Huber, H.; Stuefer, J.F. A modular concept of phenotypic plasticity in plants. New Phytol. 2005, 166, 73–82. [Google Scholar] [CrossRef]
  12. Herrera, C.M. Multiplicity in Unity: Plant Subindividual Variation and Interactions with Animals; University of Chicago Press: Chicago, IL, USA, 2009. [Google Scholar]
  13. Herrera, C.M. The ecology of subindividual variability in plants: Patterns, processes, and prospects. Web Ecol. 2017, 17, 51–64. [Google Scholar] [CrossRef] [Green Version]
  14. Osada, N.; Yasumura, Y.; Ishida, A. Leaf nitrogen distribution in relation to crown architecture in the tall canopy species, Fagus crenata. Oecologia 2014, 175, 1093–1106. [Google Scholar] [CrossRef] [PubMed]
  15. Ponce-Bautista, A.; Valverde, P.L. Photosynthetically active radiation and carbon gain drives the southern orientation of Myrtillocactus geometrizans fruits. Plant Biol. 2017, 19, 279–285. [Google Scholar] [CrossRef]
  16. Hidalgo, J.; Rubio de Casas, R.; Muñoz, M.A. Environmental unpredictability and inbreeding depression select for mixed dispersal syndromes. BMC Evol. Biol. 2016, 16, 71. [Google Scholar] [CrossRef] [Green Version]
  17. Herrera, C.M.; Medrano, M.; Bazaga, P. Continuous within plant variation as a source of intraspecific functional diversity: Patterns, magnitude, and genetic correlates of leaf variability in Helleborus foetidus (Ranunculaceae). Am. J. Bot. 2015, 102, 225–232. [Google Scholar] [CrossRef] [PubMed] [Green Version]
  18. Dai, C.; Liang, X.J. The mean and variability of a floral trait have opposing effects on fitness traits. Ann. Bot. 2016, 117, 421–429. [Google Scholar] [CrossRef] [PubMed] [Green Version]
  19. Sobral, M.; Guitián, J. Seed predators exert selection on the subindividual variation of seed size. Plant Biol. 2014, 16, 836–842. [Google Scholar] [CrossRef] [Green Version]
  20. Shimada, T.; Takahashi, A. Effects of within plant variability in seed weight and tannin content on foraging behavior of seed consumers. Funct. Ecol. 2015, 29, 1513–1521. [Google Scholar] [CrossRef]
  21. Wetzel, W.C.; Kharouba, H.M. Variability in plant nutrients reduces insect herbivore performance. Nature 2016, 539, 425–427. [Google Scholar] [CrossRef]
  22. Wetzel, W.C.; Meek, M.H. Physical defenses and herbivory vary more within plants than among plants in the tropical understory shrub Piper polytrichum. Botany 2019, 97, 113–121. [Google Scholar] [CrossRef] [Green Version]
  23. Di Iorio, A.; Vescio, R. The rediscovery of an endemic sage species in Calabria (Italy): An assessment of genetic diversity and structure in Salvia ceratophylloides Ard. (Lamiaceae). In Proceedings of the Congresso della Società Botanica Italiana, V International Plant Science Conference (IPSC), Fisciano, SA, Italy, 12–15 September 2018; p. 61, ISBN 978-88-85915-22-0. [Google Scholar]
  24. Aleric, K.M.; Kirkman, L.K. Growth and photosynthetic responses of the federally endangered shrub, Lindera melissifolia (Lauraceae), to varied light environments. Am. J. Bot. 2005, 92, 682–689. [Google Scholar] [CrossRef]
  25. Tkemaladze, G.S.; Makhashvili, K.A. Climate changes and photosynthesis. Ann. Agrar. Sci. 2016, 14, 119–126. [Google Scholar] [CrossRef] [Green Version]
  26. Díaz, S.; Kattge, J. The global spectrum of plant form and function. Nature 2016, 529, 167–171. [Google Scholar] [CrossRef] [PubMed]
  27. Holopainen, J.K.; Gershenzon, J. Multiple stress factors and the emission of plant VOCs. Trends Plant Sci. 2010, 15, 176–184. [Google Scholar] [CrossRef] [PubMed]
  28. Ye, Z.P. A new model for relationship between irradiance and the rate of photosynthesis in Oryza sativa. Photosynthetica 2007, 45, 637–640. [Google Scholar] [CrossRef]
  29. Poorter, H.; Niinemets, U. Causes and consequences of variation in leaf mass per area (LMA): A meta-analysis. New Phytol. 2009, 182, 565–588. [Google Scholar] [CrossRef]
  30. de la Riva, E.G.; Olmo, M. Leaf Mass per Area (LMA) and Its Relationship with Leaf Structure and Anatomy in 34 Mediterranean Woody Species along a Water Availability Gradient. PLoS ONE 2016, 11, e0148788. [Google Scholar] [CrossRef] [Green Version]
  31. Knight, C.A.; Ackerly, D.D. An ecological and evolutionary analysis of photosynthetic thermotolerance using the temperature dependent increase in fluorescence. Oecologia 2002, 130, 505–514. [Google Scholar] [CrossRef]
  32. Castrillo, M.; Vizcaino, D.; Moreno, E. Specific leaf mass, fresh: Dry weight ratio, sugar and protein contents in species of Lamiaceae from different light environments. Rev. Biol. Trop. 2005, 53, 23–28. [Google Scholar] [CrossRef]
  33. Goergen, P.C.H.; Lago, I. Performance of Chia on Different Sowing Dates: Characteristics of Growth Rate, Leaf Area Index, Shoot Dry Matter Partitioning and Grain Yield. J. Agric. Sci. 2019, 11, 252–263. [Google Scholar] [CrossRef]
  34. Mommer, L.; Wolters-Arts, M. Submergence-induced leaf acclimation in terrestrial species varying in flooding tolerance. New Phytol. 2007, 176, 337–345. [Google Scholar] [CrossRef]
  35. Paź-Dyderska, S.; Dyderski, M.K. Leaf Traits and Aboveground Biomass Variability of Forest Understory Herbaceous Plant Species. Ecosystems 2020, 23, 555–569. [Google Scholar] [CrossRef] [Green Version]
  36. Hedge, I.C. Notes on Salvia. Flora Europaea; Tutin, T.G., Ed.; Cambridge University Press: Cambridge, UK, 1972; Volume 3, pp. 188–192. [Google Scholar]
  37. Govaerts, R. World Checklist of Selected Plant Families Database in Access: 1-216203; The Board of Trustees of the Royal Botanic Gardens, Kew: London, UK, 2003. [Google Scholar]
  38. Nikolova, M.; Aneva, I. European Species of Genus Salvia: Distribution, Chemodiversity and Biological Activity. In Salvia Biotechnology; Georgiev, V., Pavlov, A., Eds.; Springer: Cham, Switzerland, 2017; pp. 1–30. [Google Scholar]
  39. McKey, D. Adaptive patterns in alkaloid physiology. Am. Nat. 1974, 108, 305–320. [Google Scholar] [CrossRef]
  40. Meldau, S.; Erb, M.; Baldwin, I.T. Defence on demand: Mechanisms behind optimal defence patterns. Ann. Bot. 2012, 110, 1503–1514. [Google Scholar] [CrossRef] [PubMed] [Green Version]
  41. Medrano, H.; Tomás, M. From leaf to whole-plant water use efficiency (WUE) in complex canopies: Limitations of leaf WUE as a selection target. Crop J. 2015, 3, 220–228. [Google Scholar] [CrossRef] [Green Version]
  42. Schurr, U.; Walter, A.; Rascher, U. Functional dynamics of plant growth and photosynthesis–from steady-state to dynamics–from homogeneity to heterogeneity. Plant Cell Environ. 2006, 29, 340–352. [Google Scholar] [CrossRef]
  43. Lin, H.; Chen, Y. Stronger cooling effects of transpiration and leaf physical traits of plants from a hot dry habitat than from a hot wet habitat. Funct. Ecol. 2017, 31, 2202–2211. [Google Scholar] [CrossRef] [Green Version]
  44. Leuzinger, S.; Korner, C. Tree species diversity affects canopy leaf temperatures in a mature temperate forest. Agr. For. Meteorol. 2007, 146, 29–37. [Google Scholar] [CrossRef]
  45. Pichersky, E.; Raguso, R.A. Why do plants produce so many terpenoid compounds? New Phytol. 2018, 220, 692–702. [Google Scholar] [CrossRef]
  46. Loreto, F.; Schnitzler, J.P. Abiotic stresses and induced BVOCs. Trends Plant Sci. 2010, 15, 154–166. [Google Scholar] [CrossRef]
  47. Frost, C.J.; Appel, H.M. Within-plant signalling via volatiles overcomes vascular constraints on systemic signalling and primes responses against herbivores. Ecol. Lett. 2007, 10, 490–498. [Google Scholar] [CrossRef]
  48. Rodriguez-Saona, C.R.; Rodriguez-Saona, L.E.; Frost, C. Herbivore-Induced Volatiles in the Perennial Shrub, Vaccinium corymbosum, and Their Role in Inter-branch Signaling. J. Chem. Ecol. 2009, 35, 163–175. [Google Scholar] [CrossRef]
  49. Slot, M.; Krause, G.H. Photosynthetic heat tolerance of shade and sun leaves of three tropical tree species. Photosynth. Res. 2019, 141, 119–130. [Google Scholar] [CrossRef]
  50. de Casas, R.R.; Vargas, P. Sun and shade leaves of Olea europaea respond differently to plant size, light availability and genetic variation. Funct. Ecol. 2011, 25, 802–812. [Google Scholar] [CrossRef]
  51. Girón-Calva, P.S.; Li, T. A Role for Volatiles in Intra- and Inter-Plant Interactions in Birch. J. Chem. Ecol. 2014, 40, 1203–1211. [Google Scholar] [CrossRef] [PubMed]
  52. Alberto, F.J.; Aitken, S.N. Potential for evolutionary responses to climate change–evidence from tree populations. Glob. Chang. Biol. 2013, 19, 1645–1661. [Google Scholar] [CrossRef] [Green Version]
  53. Aitken, S.N.; Whitlock, M.C. Assisted gene flow to facilitate local adaptation to climate change. Annu. Rev. Ecol. Evol. Syst. 2013, 44, 367–388. [Google Scholar] [CrossRef]
  54. Sobral, M.; Guitiàn, J.; Guitiàn, P. Selective larchure along a Latitudinal Gradient Affects Subindividual Variation in Plants. PLoS ONE 2013, 8, 74356. [Google Scholar] [CrossRef] [PubMed] [Green Version]
  55. Bruschi, P.; Grossoni, P.; Bussotti, F. Within- and among-tree variation in leaf morphology of Quercus petraea (Matt.) Liebl. natural populations. Trees 2003, 17, 164–172. [Google Scholar] [CrossRef]
  56. Opedal, Ø.H.; Armbruster, W.S.; Graae, B.J. Linking small-scale topography with microclimate, plant species diversity and intra-specific trait variation in an alpine landscape. Plant Ecol. Div. 2015, 8, 305–315. [Google Scholar] [CrossRef] [Green Version]
  57. Niinemets, U.; Valladares, F. Photosynthetic acclimation to simultaneous and interacting environmental stresses along natural light gradients: Optimality and constraints. Plant Biol. 2004, 6, 254–268. [Google Scholar] [CrossRef] [PubMed]
  58. Meier, I.C.; Leuschner, C. Genotypic variation and phenotypic plasticity in the drought response of fine roots of European beech. Tree Physiol. 2008, 28, 297–309. [Google Scholar] [CrossRef]
  59. Marchiori, P.E.R.; Machado, E.C. Physiological Plasticity Is Important for Maintaining Sugarcane Growth under Water Deficit. Front. Plant Sci. 2017, 8, 2148. [Google Scholar] [CrossRef] [Green Version]
  60. Puglielli, G.; Catoni, R.L. Short-term physiological plasticity: Trade-off between drought and recovery responses in three Mediterranean Cistus species. Ecol. Evol. 2017, 7, 10880–10889. [Google Scholar] [CrossRef]
  61. Valladares, F.; Martinez-Ferri, E. Low leaf-level response to light and nutrients in Mediterranean evergreen oaks: A conservative resource-use strategy? New Phytol. 2000, 148, 79–91. [Google Scholar] [CrossRef] [Green Version]
  62. ARSSA. I Suoli Della Calabria—Carta dei Suoli in Scala 1:250.000 Della Regione Calabria; Rubettino Editore: Soveria Mannelli, Italy, 2003; p. 387. [Google Scholar]
  63. Pignatti, S. Flora d’Italia. In 4 Volumi. Volume 3: Flora d’Italia & Flora Digitale, 2nd ed.; Edagricole-Edizioni Agricole di New Business Media srl: Milano, Italy, 2018; ISBN 978-88-506-5244-0. [Google Scholar]
  64. Rivas-Martínez, S. Global Bioclimatics (Clasificación Bioclimática de la Tierra). Available online: http://www.globalbioclimatics.org/book/publications.htm (accessed on 26 September 2019).
  65. Doussan, C.; Pagès, L.; Pierret, A. Soil exploration and resource acquisition by plant roots: An architectural and modelling point of view. Agronomie 2003, 23, 419–431. [Google Scholar] [CrossRef]
  66. Jonckheere, I.; Nackaerts, K. A fractal dimension-based modelling approach for studying the effect of leaf distribution on LAI retrieval in forest canopies. Ecol. Model 2006, 97, 179–195. [Google Scholar] [CrossRef]
  67. Quero, J.L.; Villar, R.; Marañon, T.; Zamora, R. Interactions of drought and shade effects on seedlings of four Quercus species: Physiological and structural leaf responses. New Phytol. 2006, 170, 819–834. [Google Scholar] [CrossRef] [Green Version]
  68. Ruíz-Robleto, J.; Villar, R. Relative growth rate and biomass allocation in ten woody species with different leaf longevity using phylogenetic independent contrasts (PICs). Plant Biol. 2005, 7, 484–494. [Google Scholar] [CrossRef] [PubMed]
  69. Cornelissen, J.H.C.; Pérez-Hargundeguy, N. Leaf structure and defence control litter decomposition rate across species and life forms in regional floras on two continents. New Phytol. 1999, 143, 191–200. [Google Scholar] [CrossRef]
  70. Ryser, P.; Aeschlimann, U. Proportional dry-mass content as an underlying trait for the variation in relative growth rate among 22 Eurasian populations of Dactylis glomerata s.l. Funct. Ecol. 1999, 13, 473–482. [Google Scholar] [CrossRef]
  71. Pérez-Harguindeguy, N.; Diaz, S. New handbook for standardized measurement of plant functional traits worldwide. Aust. J. Bot. 2013, 61, 167–234. [Google Scholar] [CrossRef]
  72. Saura-Mas, S.; Shipley, B.; Lloret, F. Relationship between post-fire regeneration and leaf economics spectrum in Mediterranean woody species. Funct. Ecol. 2009, 23, 103–110. [Google Scholar] [CrossRef]
  73. Cruz, A.F.S.; Adiel, F. Stress index, water potentials and leaf succulence in cauliflower cultivated hydroponically with brackish water. Rev. Bras. Eng. Agrícola Amb. 2018, 22, 622–627. [Google Scholar] [CrossRef]
  74. Chambers, M.C.; Maclean, B. A cross-platform toolkit for mass spectrometry and proteomics. Nat. Biotechnol. 2012, 30, 918–920. [Google Scholar] [CrossRef] [PubMed]
  75. Tautenhahn, R.; Patti, G.J. XCMS Online: A web-based platform to process untargeted metabolomic data. Anal. Chem. 2012, 84, 5035–5039. [Google Scholar] [CrossRef] [PubMed] [Green Version]
  76. Kopka, J.; Schauer, N. GMD@ CSB. DB: The Golm metabolome database. Bioinformatics 2005, 21, 1635–1638. [Google Scholar] [CrossRef] [Green Version]
  77. Horai, H.; Arita, M. MassBank: A public repository for sharing mass spectral data for life sciences. J. Mass Spectrom. 2010, 45, 703–714. [Google Scholar] [CrossRef] [PubMed]
  78. Lobo, F.; de Barros, M.P. Fitting net photosynthetic light-response curves with Microsoft Excel—A critical look at the models. Photosynthetica 2013, 51, 445–456. [Google Scholar] [CrossRef]
  79. Press, W.H.; Teukosky, S.A. Numerical Recipes in C. The Art of Scientific Computing, 2nd ed.; Cambridge University Press: Cambridge, UK, 1992. [Google Scholar]
  80. Larcher, W. Physiological Plant Ecology. Ecophysiology and Stress Physiology of Functional Groups, 4th ed.; Springer: Heidelberg, Germany, 2003. [Google Scholar]
  81. Duursma, R.A.; Falster, D.S. Leaf mass per area, not total leaf area, drives differences in above-ground biomass distribution among woody plant functional types. New Phytol. 2016, 212, 368–376. [Google Scholar] [CrossRef] [Green Version]
  82. Martins, F.; Oliveira, İ. Leaf morpho-physiological dynamics in Salvia officinalis L. var. purpurascens. Turk. J. Biol. 2017, 41, 134–144. [Google Scholar] [CrossRef] [Green Version]
  83. Perrino, E.V.; Wagensommer, R.P. Crop wild relatives (CWR) priority in Italy: Distribution, ecology, in situ and ex situ conservation and expected actions. Sustainability 2021, 13, 1682. [Google Scholar] [CrossRef]
Figure 1. Leaf photosynthetic light-response curves measured on petiolate (●) and sessile leaves (○) of the Salvia ceratophylloides at (A,C) Mosorrofa site (Mo) and (B,D) Puzzi site (Pu). The (C,D) panels showed the curves at the lowest irradiance values. Data points represent means (n = 4–9). Light curves have been fitted by non-linear regression using the Ye et al. model [28].
Plants 10 00474 g001
Figure 2. Principal component analysis of untargeted metabolomics data from different leaves (sessile and petiolate) and sites [Mosorrofa (Mo) and Puzzi (Pu)] of Salvia ceratophylloides individuals: Mo-sessile (red), Mo-petiolate (green), Pu-sessile (blue) and Pu-petiolate (purple).
Plants 10 00474 g002
Table 1. Leaf-level photosynthetic parameters of different leaf types (P: petiolate; S: sessile) of Salvia ceratophylloides individuals of two sites (Mosorrofa, Mo; Puzzi, Pu) estimated by non-linear regression using the Ye et al. model [28]. Different lower-case letters represent significant differences at p < 0.05 among the average within the column (Tukey’s test). Different capital case letters represent statistically significant differences among the means along the rows (p < 0.05, Tukey’s test).
Site (Sit)
Leaf Type (LT)MoPuLeaf Type Average
Icomp
[µmol(photon) m−2 s−1]
P8b26a18x
S22a22a22x
Site average16A23A
Imax
[µmol(photon) m−2 s−1]
P312b310b311y
S839a725a766x
Site average655A577A
Isat
[µmol(photon) m−2 s−1]
P1027b818b911y
S1559a1588a1578 x
Site average1323A1313A
PN(Imax)
[µmol(CO2) m−2 s−1]
P6.85b2.17b4.25y
S19.70a6.51b11.22x
Site average14.00A4.96B
RD
[µmol(CO2) m−2 s−1]
P0.53b1.07ab0.69 y
S1.40a1.09ab1.19 x
Site average1.01A1.08A
ϕ(I0-comp)
[µmol(CO2) µmol(photon) −1]
P0.025b0.0095c0.016y
S0.046a0.021b0.030x
Site average0.037A0.016B
Table 2. Leaf-level stomatal conductance and transpiration rate of different leaf types (P: petiolate; S: sessile) of Salvia ceratophylloides individuals of two sites (Mosorrofa, Mo; Puzzi, Pu) measured at a light intensity of 200 µmol m−2 s−1. Different lower-case letters represent significant differences atp< 0.05 among the average within the column (Tukey’s test). Different capital case letters represent statistically significant differences among the means along the rows (p < 0.05, Tukey’s test).
Sites (Sit)
Leaf Type (LT)MoPuLeaf Type Average
Stomatal conductance
(mol H2O m−2 s−1)
P0.032b0.016b0.023y
S0.113a0.029b0.059x
Site average0.077A0.025B
Transpiration rate
(mol H2O m−2 s−1)
P0.87b0.55b0.69y
S2.59a0.92b1.52x
Site average1.82A0.79B
Table 3. Leaf-level stomatal conductance and transpiration rate of different leaf types (P: petiolate; S: sessile) of Salvia ceratophylloides individuals of two sites (Mosorrofa, Mo; Puzzi, Pu) measured at a light intensity of 800 µmol m−2 s−1. Different lower-case letters represent significant differences atp< 0.05 among the average within the column (Tukey’s test). Different capital case letters represent statistically significant differences among the means along the rows (p < 0.05, Tukey’s test).
Sites (Sit)
Leaf Type (LT)MoPuLeaf Type Average
Stomatal conductance
(mol H2O m−2 s−1)
P0.032b0.016b0.023y
S0.107a0.032b0.059x
Site average0.074A0.026B
Transpiration rate
(mol H2O m−2 s−1)
P0.83b0.55b0.67y
S2.44a1.03b1.53x
Site average1.72A0.86B
Table 4. Biometric and morphological parameters of different leaf types (P: petiolate; S: sessile) of Salvia ceratophylloides individuals of two sites (Mosorrofa, Mo; Puzzi, Pu). Different lower-case letters indicated significant differences atp< 0.05 among the average within the column (Tukey’s test). Different capital case letters indicated statistically significant differences among the means along the rows (p < 0.05, Tukey’s test).
Sites (Sit)
Leaf Type (LT)MoPuLeaf Type Average
Leaf fresh weight
[g leaf−1]
P1.33a1.38a1.36x
S1.40a0.43b0.78y
Site average1.37A0.77B
Leaf dry weight
[g leaf]
P0.23a0.22b0.22x
S0.27a0.12b0.17x
Site average0.25A0.16B
Leaf area
[cm2]
P41.4ab54.4a48.6x
S43.6ab19.9b28.3y
Site average32.2A42.6A
Leaf mass x area
[g m−2]
P55.4a44.1a49.1x
S62.3a61.6a 61.8x
Site average59.2A55.3A
Leaf dry content
[g dry weight g−1 fresh weight]
P0.17a0.18a0.18x
S0.19a0.28a0.25x
Site average0.18A0.24A
Leaf water content
[g H2O cm−2 leaf area]
P0.027a0.020a0.023x
S0.025b0.016b0.019y
Site average0.026A0.017B
Fractal dimensionP1.67a1.73a1.70x
S1.51b1.65b1.56y
Site average1.69A1.59A
Table 5. Chemical characterization of volatile organic compounds in fresh sessile and petiolate leaves of two sites [Mosorrofa (Mo) and Puzzi (Pu)] of Salvia ceratophylloides plants.
Compound# StatisticsSessilePetiolate
PuMoPuMo
1p-CymeneLT 7.78 *
Sit 14.16 **
LT × Sit 0.21 NS
195,813 82,392108,569 19,607
2PinocarvoneLT 0.04 NS
Sit 6.57 *
LT × Sit 0.07 NS
24069872444696
3SabineneLT 11.80 **
Sit 0.34 NS
LT × Sit 1.70 NS
554,775 873,306 195,242 73,210
4TerpinoleneLT 12.40 **
Sit 0.40 NS
LT × Sit 3.09 NS
128,554 218,320 62,198 19,784
5β-PineneLT 7.30 *
Sit 0.47 NS
LT × Sit 1.73 NS
92,968 150,052 53,391 35,502
6γ-TerpineneLT 5.40 *
Sit 0.19 NS
LT × Sit 0.04 NS
16,341 13,366 4610 3508
7α-Terpineol LT 8.13 *
Sit 12.91 **
LT × Sit 9.04 *
10,220b80,003a11,854b18,054b
8D-GermacreneLT 0.11 NS
Sit 3.47 NS
LT × Sit 4.22 *
2554a169b1102a1218a
9α-CopaeneLT 0.62 NS
Sit 11.05 *
LT × Sit 0.67 NS
35176012385625
10α-CubebeneLT 8.21 *
Sit 19.35 **
LT × Sit 1.02
4,460,2011,371,7052,247,264312,465
11α-MuuroleneLT 9.49 *
Sit 0.56 NS
LT × Sit 0.99 NS
14,38215,23671051038
12IsovaleraldehydeLT 6.10 *
Sit 0.52 NS
LT × Sit 0.52 NS
81,876,77046,391,3413,426,7893,466,464
135-Methylheptan-3-oneLT 5.70 *
Sit 0.21 NS
LT × Sit 0.08 NS
7776820415783291
14Pentan-3-oneLT 7.73 *
Sit 2.44 NS
LT × Sit 1.20 NS
321,989649,080114,170171,753
15β-tujone LT 17.37 **
Sit 6.21 *
LT × Sit 12.54 **
65,370b168,599a54,660b36,692b
16(3z)-3-Hexenyl acetateLT 3.58 NS
Sit 5.09 NS
LT × Sit 5.46 *
1253a0b99ab122ab
17Dimethyl SulfideLT 23.77 **
Sit 5.34 *
LT × Sit 1.40 NS
29,866,63354,386,8373,926,18111,857,751
# Statistical analysis: two-way ANOVA with 4–9 replications (LT: leaf type; Sit: sites; LT × Sit: Leaf type × Sites interaction); * 0.05 >p< 0.01; ** 0.01 >p< 0.001; NS: not significant; Different letters along the row indicated significant differences among the means (p < 0.05, Tukey’s test).
Publisher’s Note: MDPI stays neutral with regard to jurisdictional claims in published maps and institutional affiliations.

