Article

Comparative Transcriptome Analysis of Iron and Zinc Deficiency in Maize (Zea mays L.)

by
Mallana Gowdra Mallikarjuna
1,*,
Nepolean Thirunavukkarasu
1,†,
Rinku Sharma
1,‡,
Kaliyugam Shiriga
1,§,
Firoz Hossain
1,
Jayant S Bhat
2,
Amitha CR Mithra
3,
Soma Sunder Marla
4,
Kanchikeri Math Manjaiah
5,
AR Rao
6 and
Hari Shanker Gupta
1,*
1
Maize Research Lab, Division of Genetics, ICAR-Indian Agricultural Research Institute, New Delhi 110012, India
2
IARI-Regional Research Centre, Dharwad, Karnataka 580005, India
3
ICAR-National Institute for Plant Biotechnology, New Delhi 110012, India
4
ICAR-National Bureau of Plant Genetic Resources, New Delhi 110012, India
5
Division of Soil Science and Agricultural Chemistry, ICAR-Indian Agricultural Research Institute, New Delhi 110012, India
6
ICAR-Indian Agricultural Statistics Research Institute, New Delhi 110012, India
*
Authors to whom correspondence should be addressed.
Present address: ICAR-Indian Institute of Millet Research, Hyderabad, Telangana 500030, India.
Present address: Department of Life Sciences, Shiv Nadar University, Gautam Buddha Nagar, Uttar Pradesh 201314, India.
§
Present address: Nu-genes seeds company Pvt. Ltd., Hyderabad, Telangana 500003, India.
Plants 2020, 9(12), 1812; https://doi.org/10.3390/plants9121812
Submission received: 13 November 2020 / Revised: 30 November 2020 / Accepted: 30 November 2020 / Published: 21 December 2020

Abstract

:
Globally, one-third of the population is affected by iron (Fe) and zinc (Zn) deficiency, which is severe in developing and underdeveloped countries where cereal-based diets predominate. The genetic biofortification approach is the most sustainable and one of the cost-effective ways to address Fe and Zn malnutrition. Maize is a major source of nutrition in sub-Saharan Africa, South Asia and Latin America. Understanding systems’ biology and the identification of genes involved in Fe and Zn homeostasis facilitate the development of Fe- and Zn-enriched maize. We conducted a genome-wide transcriptome assay in maize inbred SKV616, under –Zn, –Fe and –Fe–Zn stresses. The results revealed the differential expression of several genes related to the mugineic acid pathway, metal transporters, photosynthesis, phytohormone and carbohydrate metabolism. We report here Fe and Zn deficiency-mediated changes in the transcriptome, root length, stomatal conductance, transpiration rate and reduced rate of photosynthesis. Furthermore, the presence of multiple regulatory elements and/or the co-factor nature of Fe and Zn in enzymes indicate their association with the differential expression and opposite regulation of several key gene(s). The differentially expressed candidate genes in the present investigation would help in breeding for Fe and Zn efficient and kernel Fe- and Zn-rich maize cultivars through gene editing, transgenics and molecular breeding.

1. Introduction

Iron (Fe) and zinc (Zn) are essential elements for all living organisms, including plants and animals. Fe and Zn also act as co-factors of numerous enzymes and in turn play vital roles in various physiological process, viz., photosynthesis, respiration, electron transport, protein metabolism, chlorophyll synthesis and hormonal regulations [1,2]. Therefore, any deficiency in Fe and Zn affects the economic yield in crops and thereafter manifests in the form of micronutrient malnutrition in humans [3]. The development of Fe- and Zn-efficient cultivars is one of the effective approaches to sustain crop production and to alleviate widespread micronutrient-malnutrition. Hence, understanding the functional genomics of Fe and Zn homeostasis and identification of target genes and pathways in major staple crops will help in the genetic biofortification of crop plants for Fe and Zn.
Plants adapt a complex network of homeostatic mechanisms to regulate Fe and Zn uptake, transport and accumulation [4]. The uptake of Fe ions in plants occurs through two important strategies viz., the reduction-based strategy (strategy-I) and chelation-based strategy (strategy-II). The strategy-I is present in all the plants except those from the Poaceae family. Under Fe deficiency, the strategy-I plants release the protons into the rhizosphere by H+-ATPases and makes the Fe more soluble by lowering the soil pH. Subsequently, the NADPH-dependent ferric chelate reductase (FRO2), reduces Fe3+ to Fe2+ form and which can then be transported into the root epidermis by the divalent metal transporter, iron regulated transporter 1 (IRT1). On the other hand, plants of Poaceae family mostly follow a mugineic acid (MA) pathway-based chelation strategy (Strategy-II) to uptake the Fe from soil [5]. It has been reported that in the mugineic acid pathway, nicotianamine synthase (NAS) [6], nicotianamine aminotranferase (NAAT) [7] and deoxymugineic acid synthase (DMAS) [8] mediate the synthesis of deoxymugineic acid (DMA) from S-adenosyl-methionine via a series of reactions [9]. The grass plants release derivatives of deoxymugineic acid (DMA) called phytosiderophores (PS) which make the complex with the ferric ions (Fe3+). The efflux of PS is facilitated by transporters of the mugineic acid family phytosiderophores (TOM1 and TOM2) whereas the influx of PS–Fe3+ is mediated through yellow stripe like-1 (YS1) transporters [10,11]. Among Poaceae members, rice possesses both strategy I and II for the uptake of Fe [2,3,4]. Interestingly, in maize, the recent finding showed the presence of strategy-I genes for the uptake of Fe [12].
Plants absorb the Zn, mainly in divalent cationic form (Zn2+) [13]. The Zn uptake mechanisms in plants are equipped with a dual-transporter system, viz., high-affinity transport system (HATS) and low-affinity transport system (LATS) [14,15,16]. The LATS mechanism operates when the Zn is in high concentration and the HATS operates when the Zn concentration is low [16]. Several transporters viz., ZRT-IRT-like protein (ZIP) family [17], HMA (heavy metal ATPase) family [18], MTP (metal tolerance protein) family [19], vacuolar iron transporter (VIT) family, and plant cadmium resistance family (PCR) proteins mediate the Zn transport across the root plasma membrane into root cells [14,20]. Additionally, in plants many researchers also reported the chelation-based Zn uptake mechanism [20,21].
Various transporters and chelation agents viz., oligopeptide transporters (OPT) and yellow stripe like (YSL) [22,23], ZIP [24,25,26,27], ferric reductase defective protein (FRD) transporters [28], DMA [29], nicotianamine (NA) [22,30], and citrate [31] have been reported to be involved in the mobilization of Fe and Zn ions. Furthermore, genome-wide transcriptome assays have been employed to understand the expression pattern of genes and pathways associated with Fe and Zn deficiencies in rice [32], Arabidopsis [33], maize [34], and several other crops [35]. The deficiency of Fe and Zn is known to activate distinct functional gene modules such as the ‘transportome’ which, encompasses genes encoding metal transporters, root system modifications, primary metabolic pathways and hormonal metabolism [33]. Under Fe deficiency, Li et al. [34] reported the induced regulation of genes associated with plant hormones, protein kinases and phosphatase in maize roots; whereas, Zanin et al. [36] showed the presence of strategy-I components, which is most prominent in dicot plant. Like Fe, Zn deficiency results in the higher expression of ZIP and NAS genes in maize [37]. The chlorophyll biosynthesis and rate of photosynthesis are severely affected through the altered expression of genes associated with chloroplast biosynthesis and photosynthesis under Fe and Zn deficiency [9,32,38]. Studies by Garnica et al. [38] in wheat and García et al. [39] in Arabidopsis revealed the coordinated action of indole acetic acid (IAA), ethylene and nitrate oxide (NO) in the signalling networks of Fe deficiency. Phytohormones viz., abscisic acid (ABA), and salicylic acid (SA) regulate the expression pattern of ZmNAS in maize seedlings [40]. Similarly, ethylene increases the transcripts abundance of genes viz., bHLH (BASIC HELIX-LOOP-HELIX), IRO2 (IRON-RELATED TRANSCRIPTION FACTOR 2), NAS1 (NICOTIANAMINE SYNTHASE 1), NAS2 (NICOTIANAMINE SYNTHASE 2), YSL15 (YELLOW STRIPE LIKE 15) and IRT1 (IRON REGULATED TRANSPORTER 1) associated with Fe2+ and Fe3+-phytosiderophore uptake systems in rice [41]. In Arabidopsis, NO enhances the expression of genes for Fe-acquisition and ethylene synthesis in roots [42,43] and the interaction between the auxin and NO modulates the root growth under Fe deficiency in rice [44]. Apart from root growth, Fe deficiency induced auxin signalling, which results in photosynthesis inhibition and defective shoot growth in rice seedlings [45].
The comparative analysis of nutrients and their interactions are crucial for the simultaneous improvement of multi-nutrient use efficiency and enrichment in crops. Few of the interaction studies at whole-genome transcriptome strata are available in crops for Fe and P [32] and Zn and P [46]. However, there are hardly any reports on the genome-wide expression studies under Fe and Zn deficiency interactions, in both root and shoot tissues of crops in general and maize in specific. Therefore, the present investigation was designed to study the transcriptome response to Fe, and Zn deficiencies individually and together to understand Fe and Zn homeostasis and metabolism in maize.

2. Results

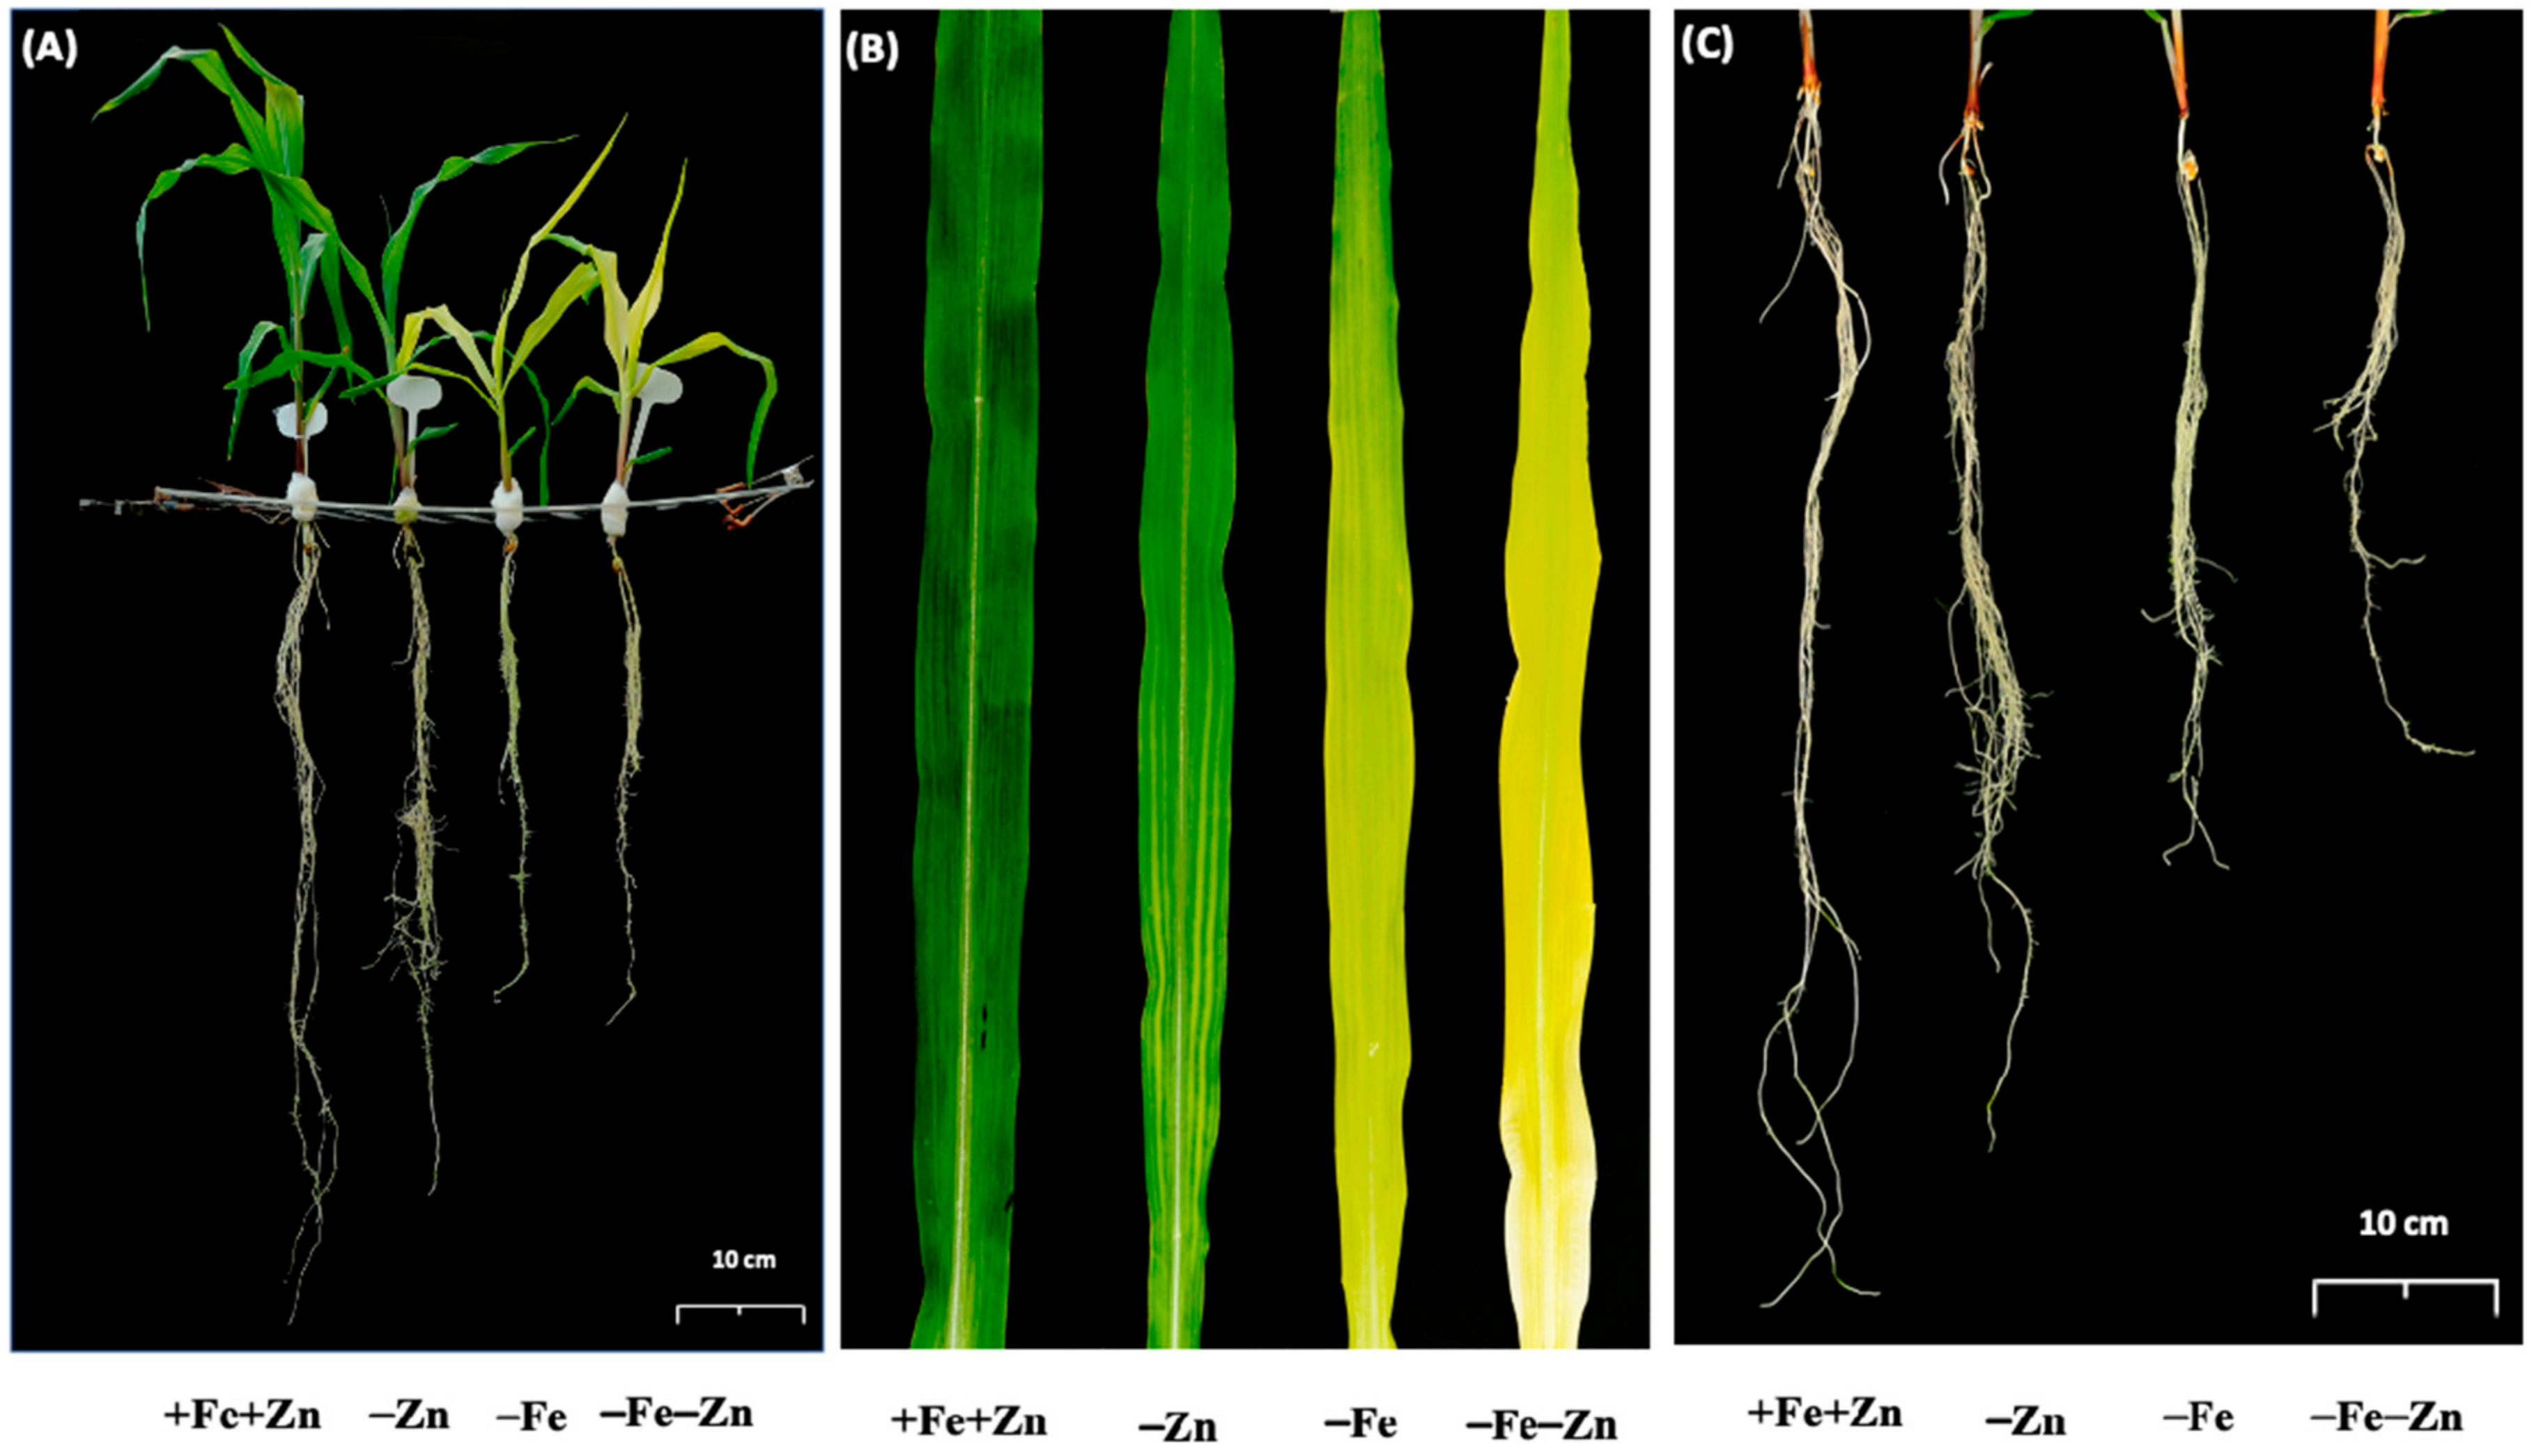
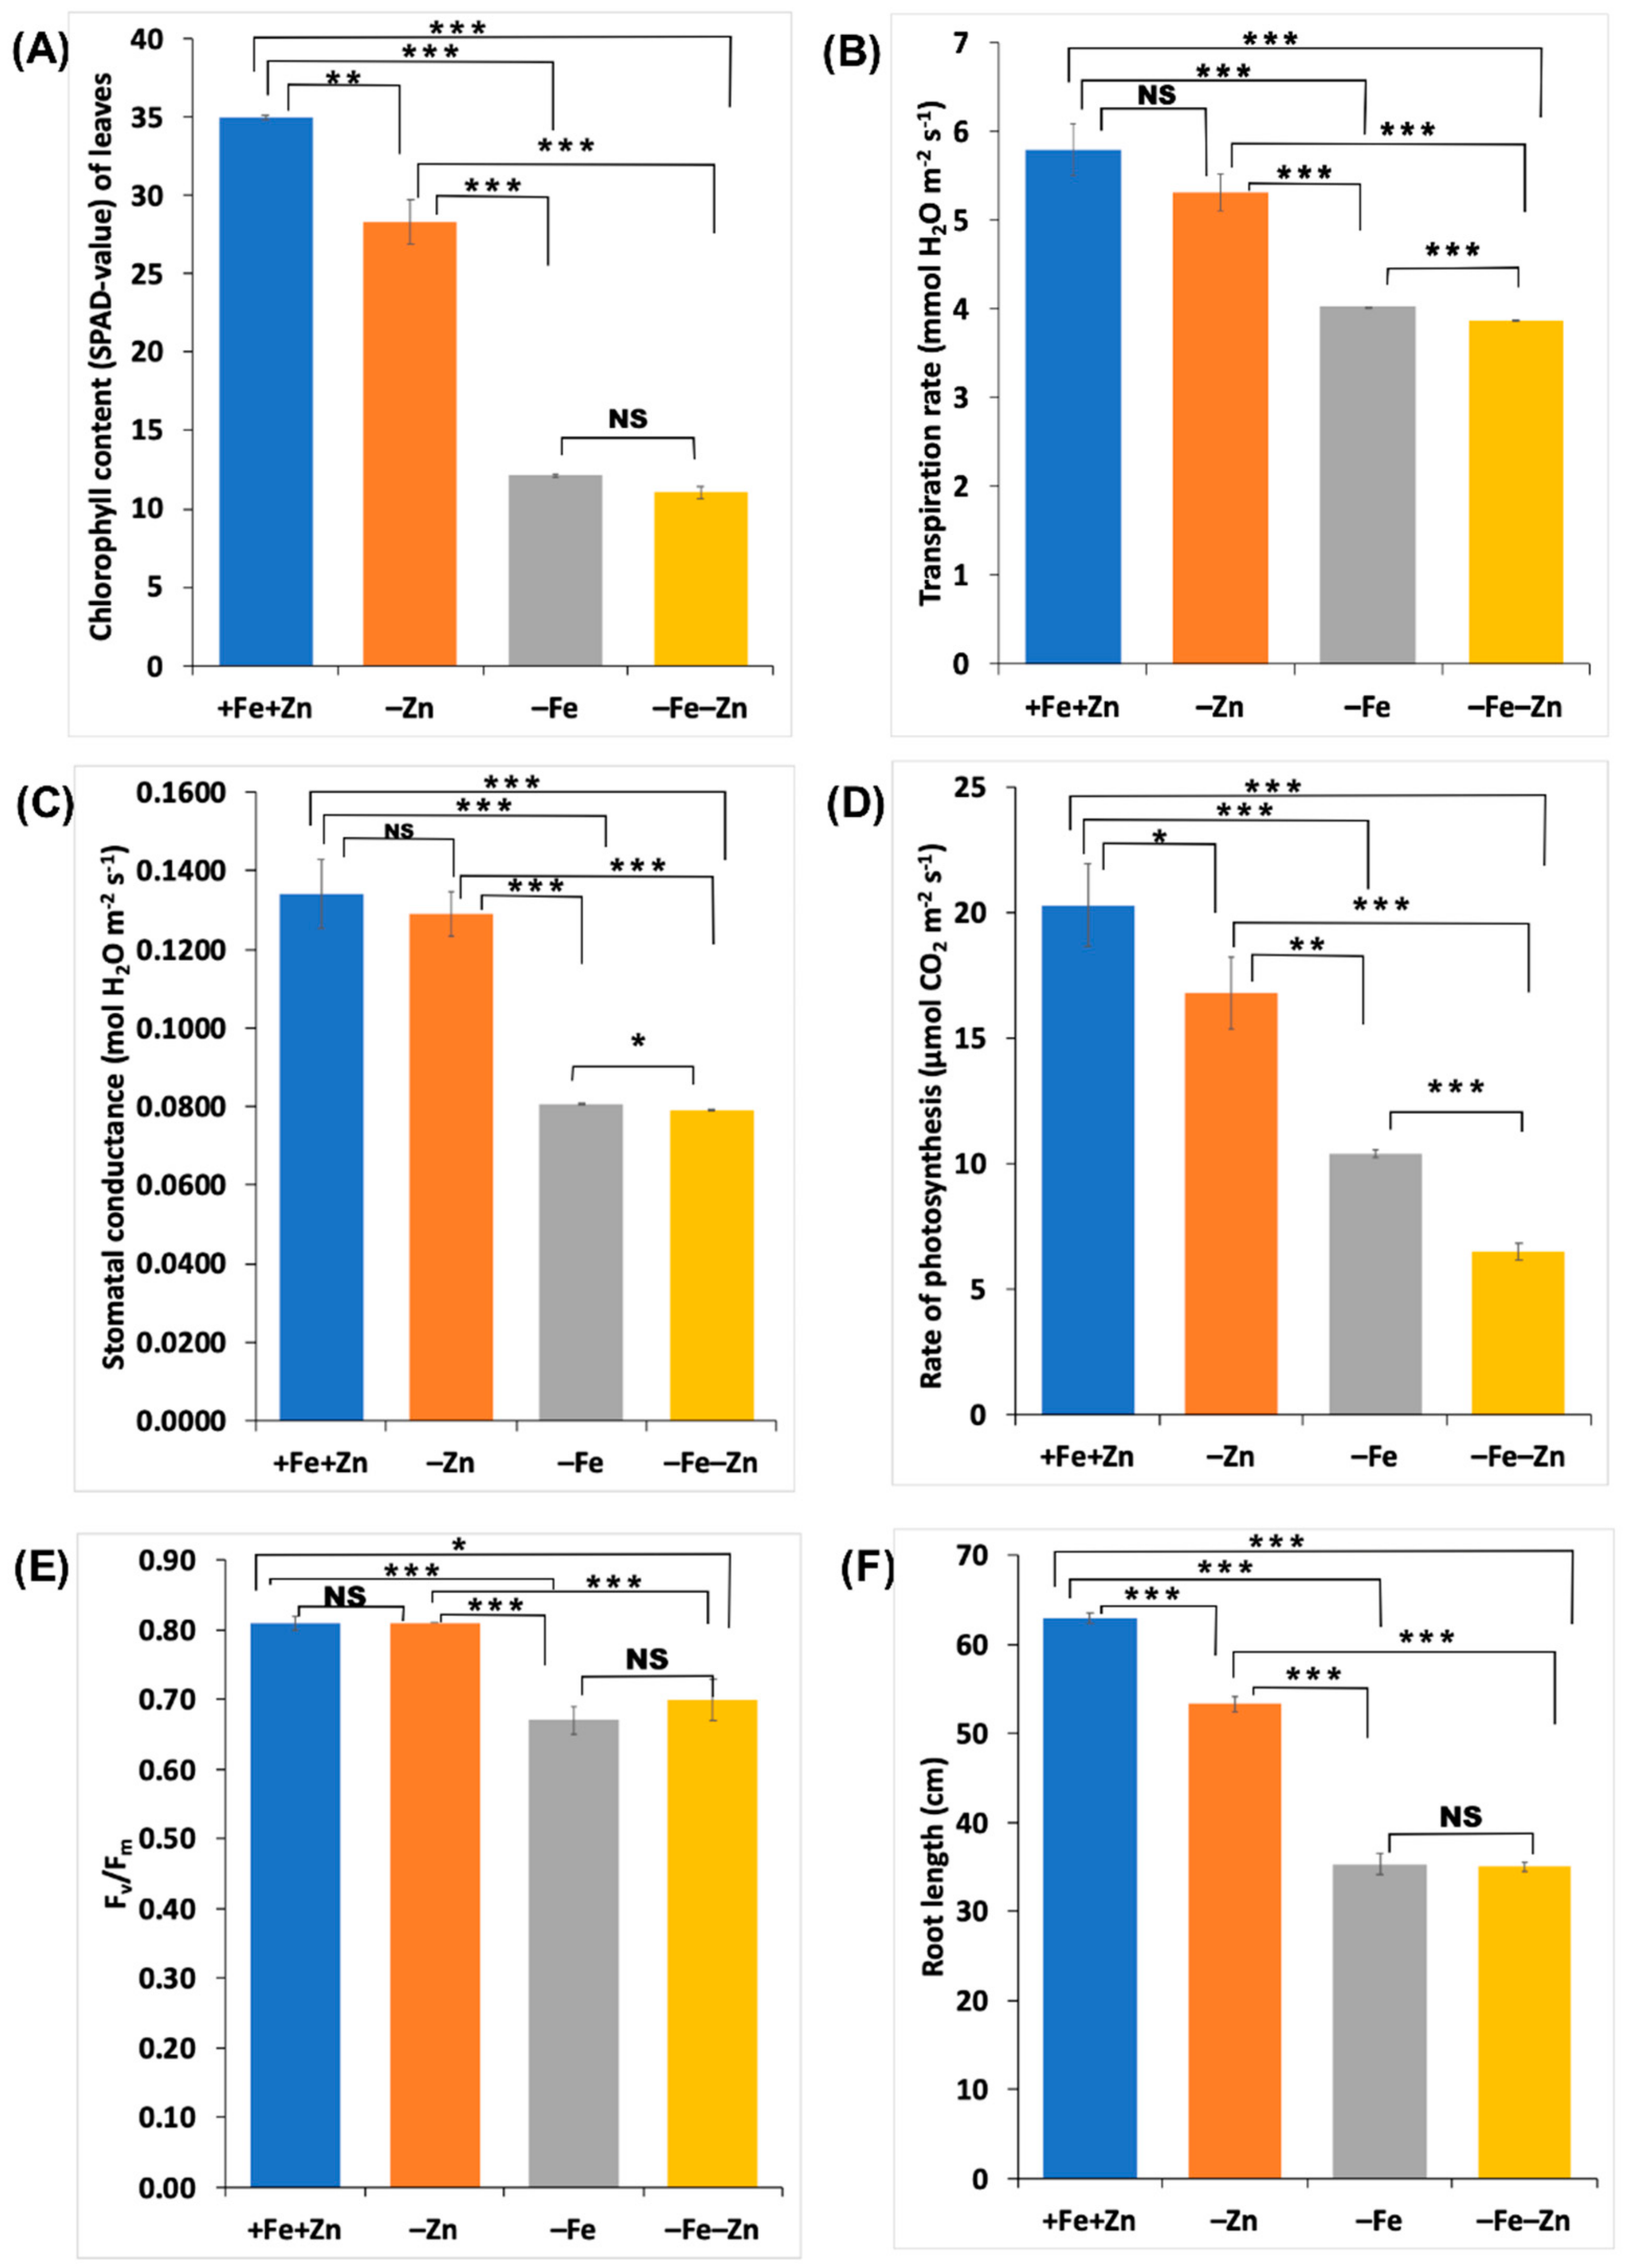
2.1. Morpho-Physiological Evidence for Fe and Zn Interaction

Maize seedlings when tested under Fe and Zn deficiencies individually and together (–Zn, –Fe and –Fe–Zn) along with control (+Fe+Zn). The stress treatments started showing Fe and Zn deficiency symptoms from the fourth and fifth days after transplanting (DAT), respectively. However, the typical stress symptoms were prominent among the stress treatments at 10 DAT (Figure 1). Seedlings showed chlorosis under Fe deficiency (–Fe), interveinal chlorosis in the lower half of the top leaves under Zn deficiency (–Zn), and severe chlorosis coupled with slight whitish blotches near the base of top leaves under combined Fe and Zn deficiencies (–Fe–Zn). Furthermore, reduced root length and induced root hair formation were observed under stress treatments (Figure 1).
Plants in Fe (–Fe), and Fe and Zn (–Fe–Zn) deficiencies started showing chlorosis from the fourth DAT; in contrast, the chlorophyll content of leaves increased significantly in the seedlings of the control treatment (+Fe+Zn) (Figure S1). However, no significant variation in the chlorophyll content was observed between –Fe and –Fe–Zn deficiencies (Figure 2A). Zn starved the seedlings in comparison to the control which did not show a significant reduction in stomatal conductance and transpiration rate. In contrast, as compared to the control and Zn deficiency (–Zn), the Fe (–Fe) and Fe and Zn (–Fe–Zn) deficiencies recorded a significantly reduced transpiration rate and stomatal conductance (Figure 2B,C).
Additionally, the reduced rate of photosynthesis was observed in all the stress treatments as compared to the control (Figure 2D). The –Fe and –Fe–Zn stresses showed a significant reduction in the maximum photochemical efficiency of PSII (FV/FM), whereas no significant decrease was observed under –Zn stress (Figure 2E). Furthermore, –Fe and –Fe–Zn stressed seedlings showed a similar level of photochemical efficiency of PSII (Figure 2E).
Roots are the absorption points for nutrients and showed variation in the root length under nutrient stresses. The reduction in root lengths was significant for all the stress treatments. However, –Fe and –Fe–Zn treatments did not show any difference in root length. Therefore, Fe deficiency (–Fe and –Fe–Zn) is the major contributor for root length reduction as compared to Zn deficiency (–Zn) (Figure 2F). All the morpho-physiological traits showed a high degree of correlation (p < 0.01 and p < 0.001) owing to interdependency on each other at physiological level. The stomatal conductance and transpiration rate, and chlorophyll content and root length showed the maximum correlation coefficients (r = 0.99, p < 0.001) (Figure S2).

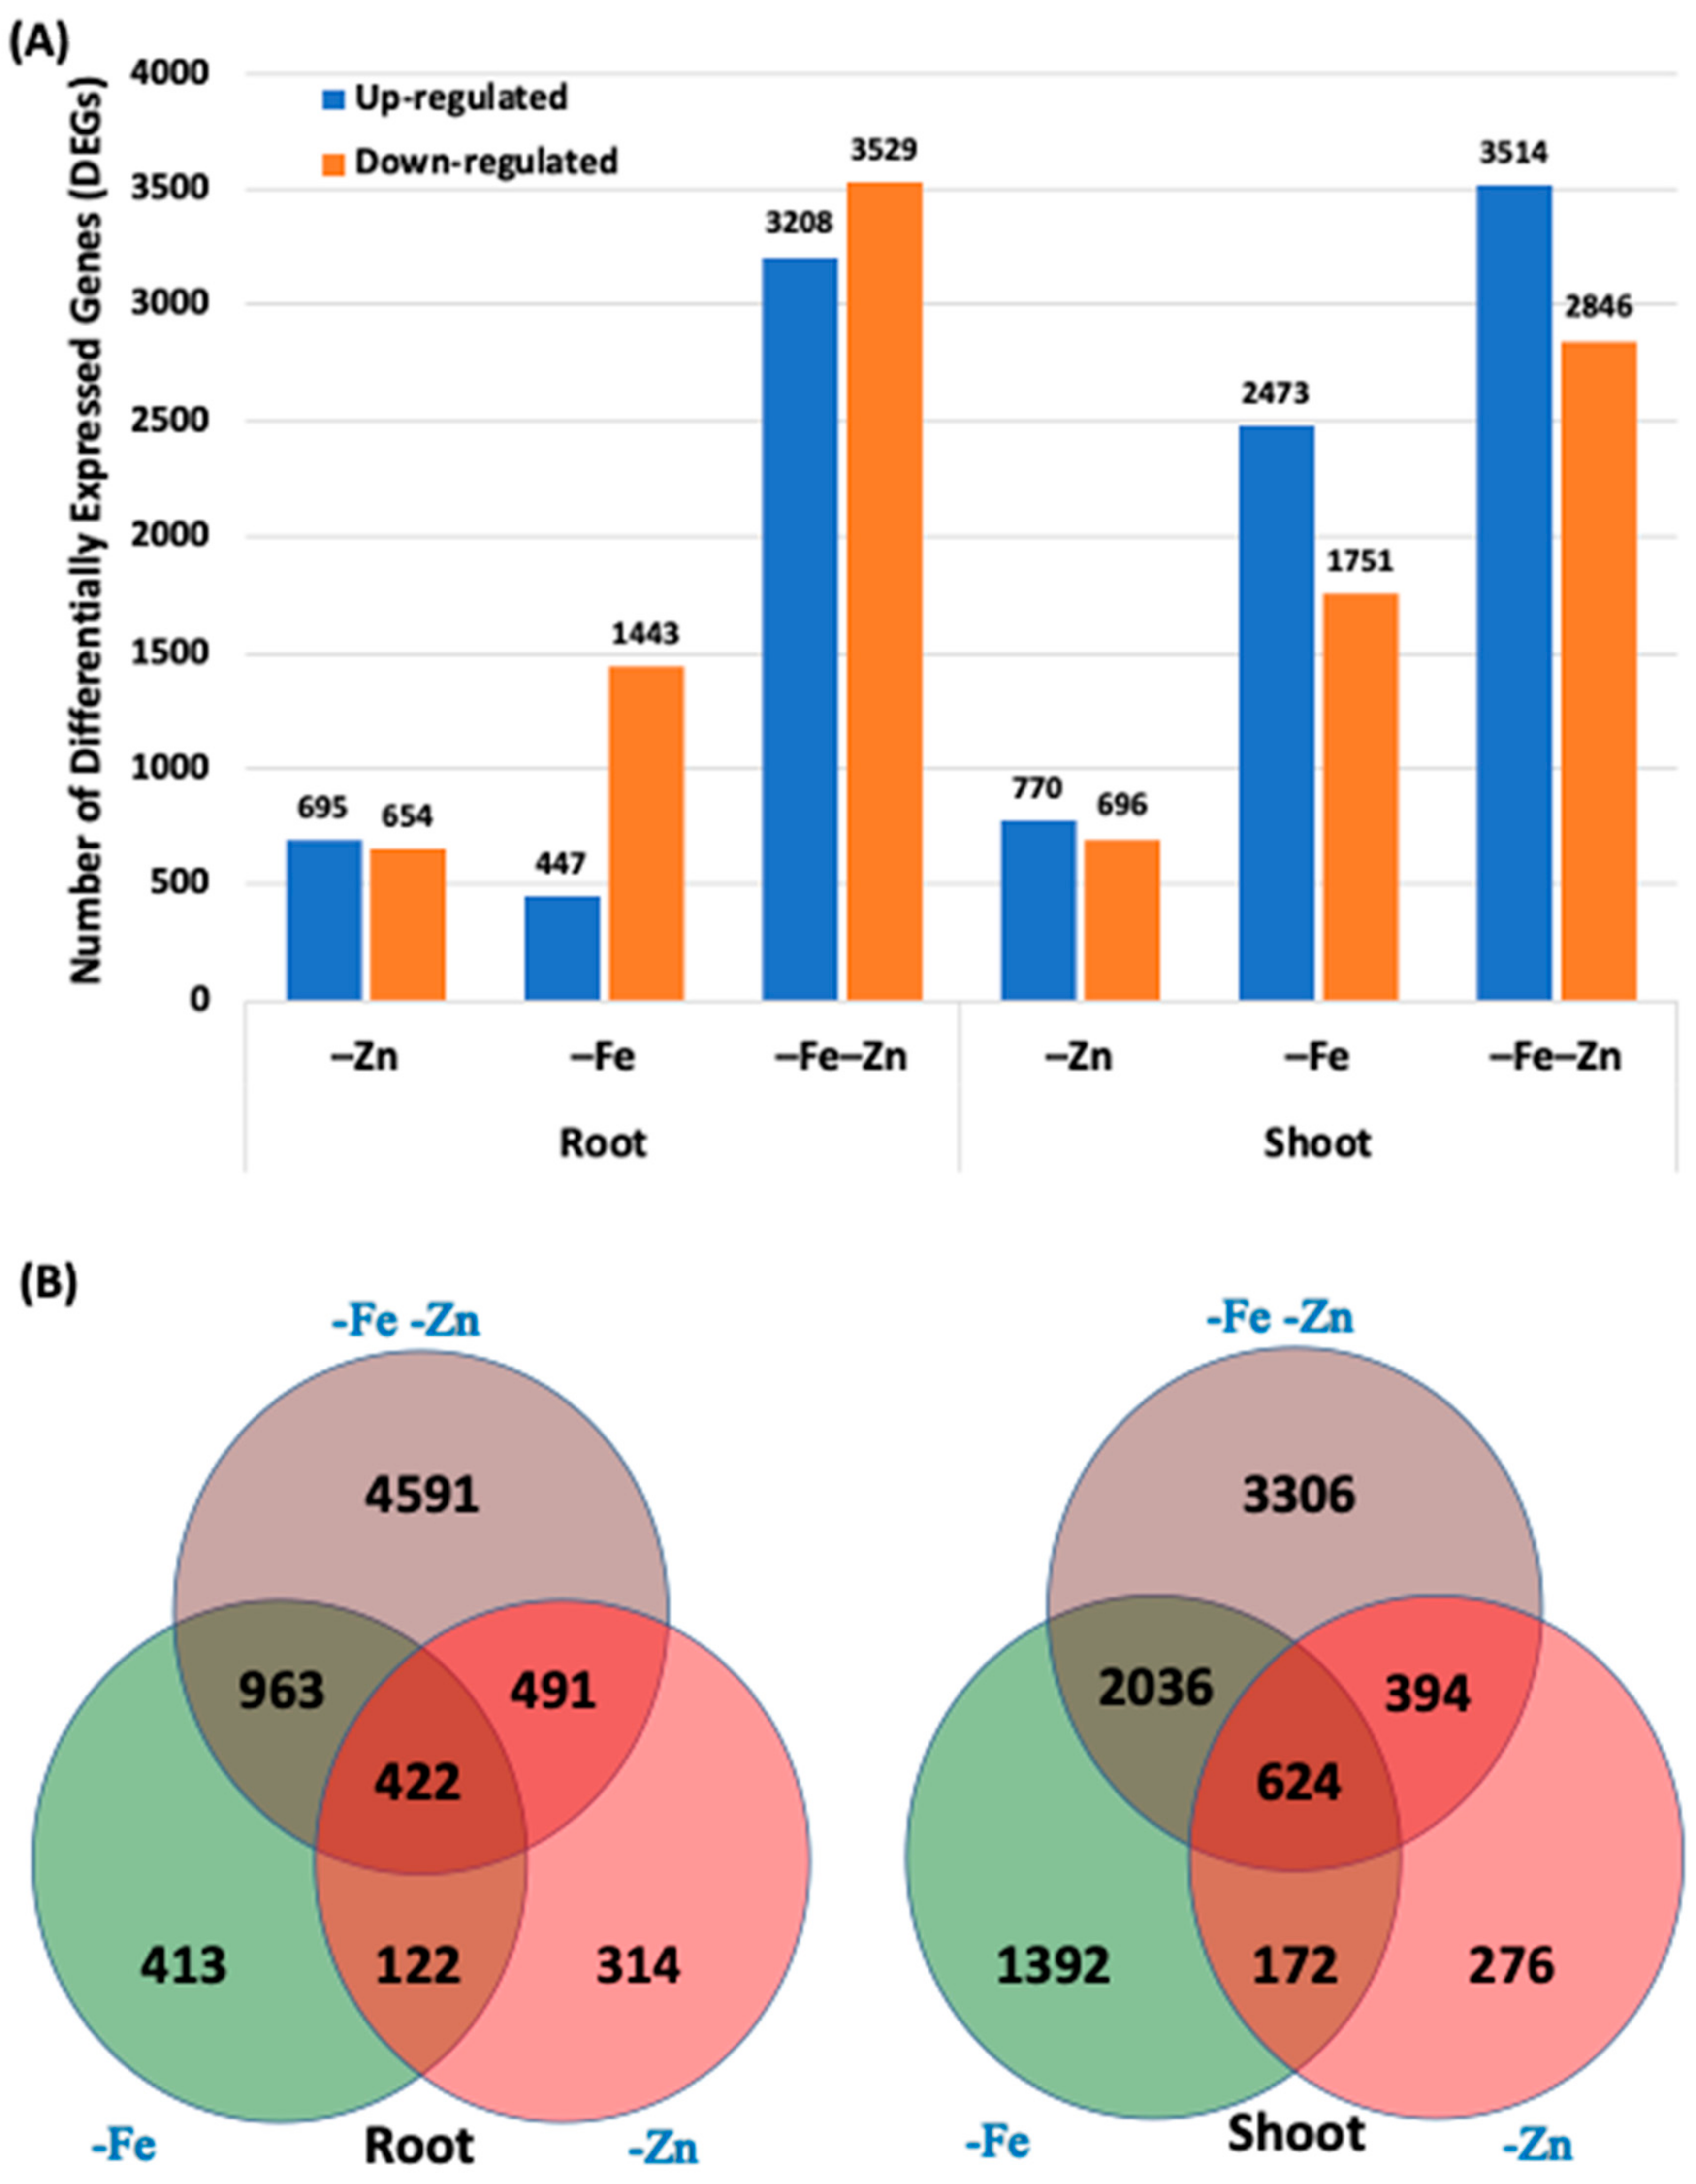
2.2. Maize Transcriptome Profiles in Response to Fe and Zn Deficiencies

Root and shoot tissues collected from hydroponically grown maize seedlings under treatments and control were analysed for a genome-wide transcriptome assay using the Affymetrix GeneChip maize genome arrays (Affymetrix Inc., Santa Clara, California, USA). The transcriptome snapshots of stress treatments were compared against control seedlings. Genome-wide transcriptome analysis under –Zn, –Fe and –Fe–Zn stresses identified differential expression of 1349, 1920 and 6467 genes, respectively, in root and 1466, 4224 and 6360 genes in the shoot, respectively (Figure 3). In both the root and shoot, –Fe–Zn resulted in a higher number of differentially expressed genes (DEGs) as compared to individual stress (–Zn or –Fe). The roots of –Fe–Zn treatment showed a relatively higher number of DEGs (6467) as compared to the shoot (6360) (Figure 3). Conversely, the overall transcriptome snapshot showed a greater number of DEGs in the shoot (8200) as compared to the root (7316).

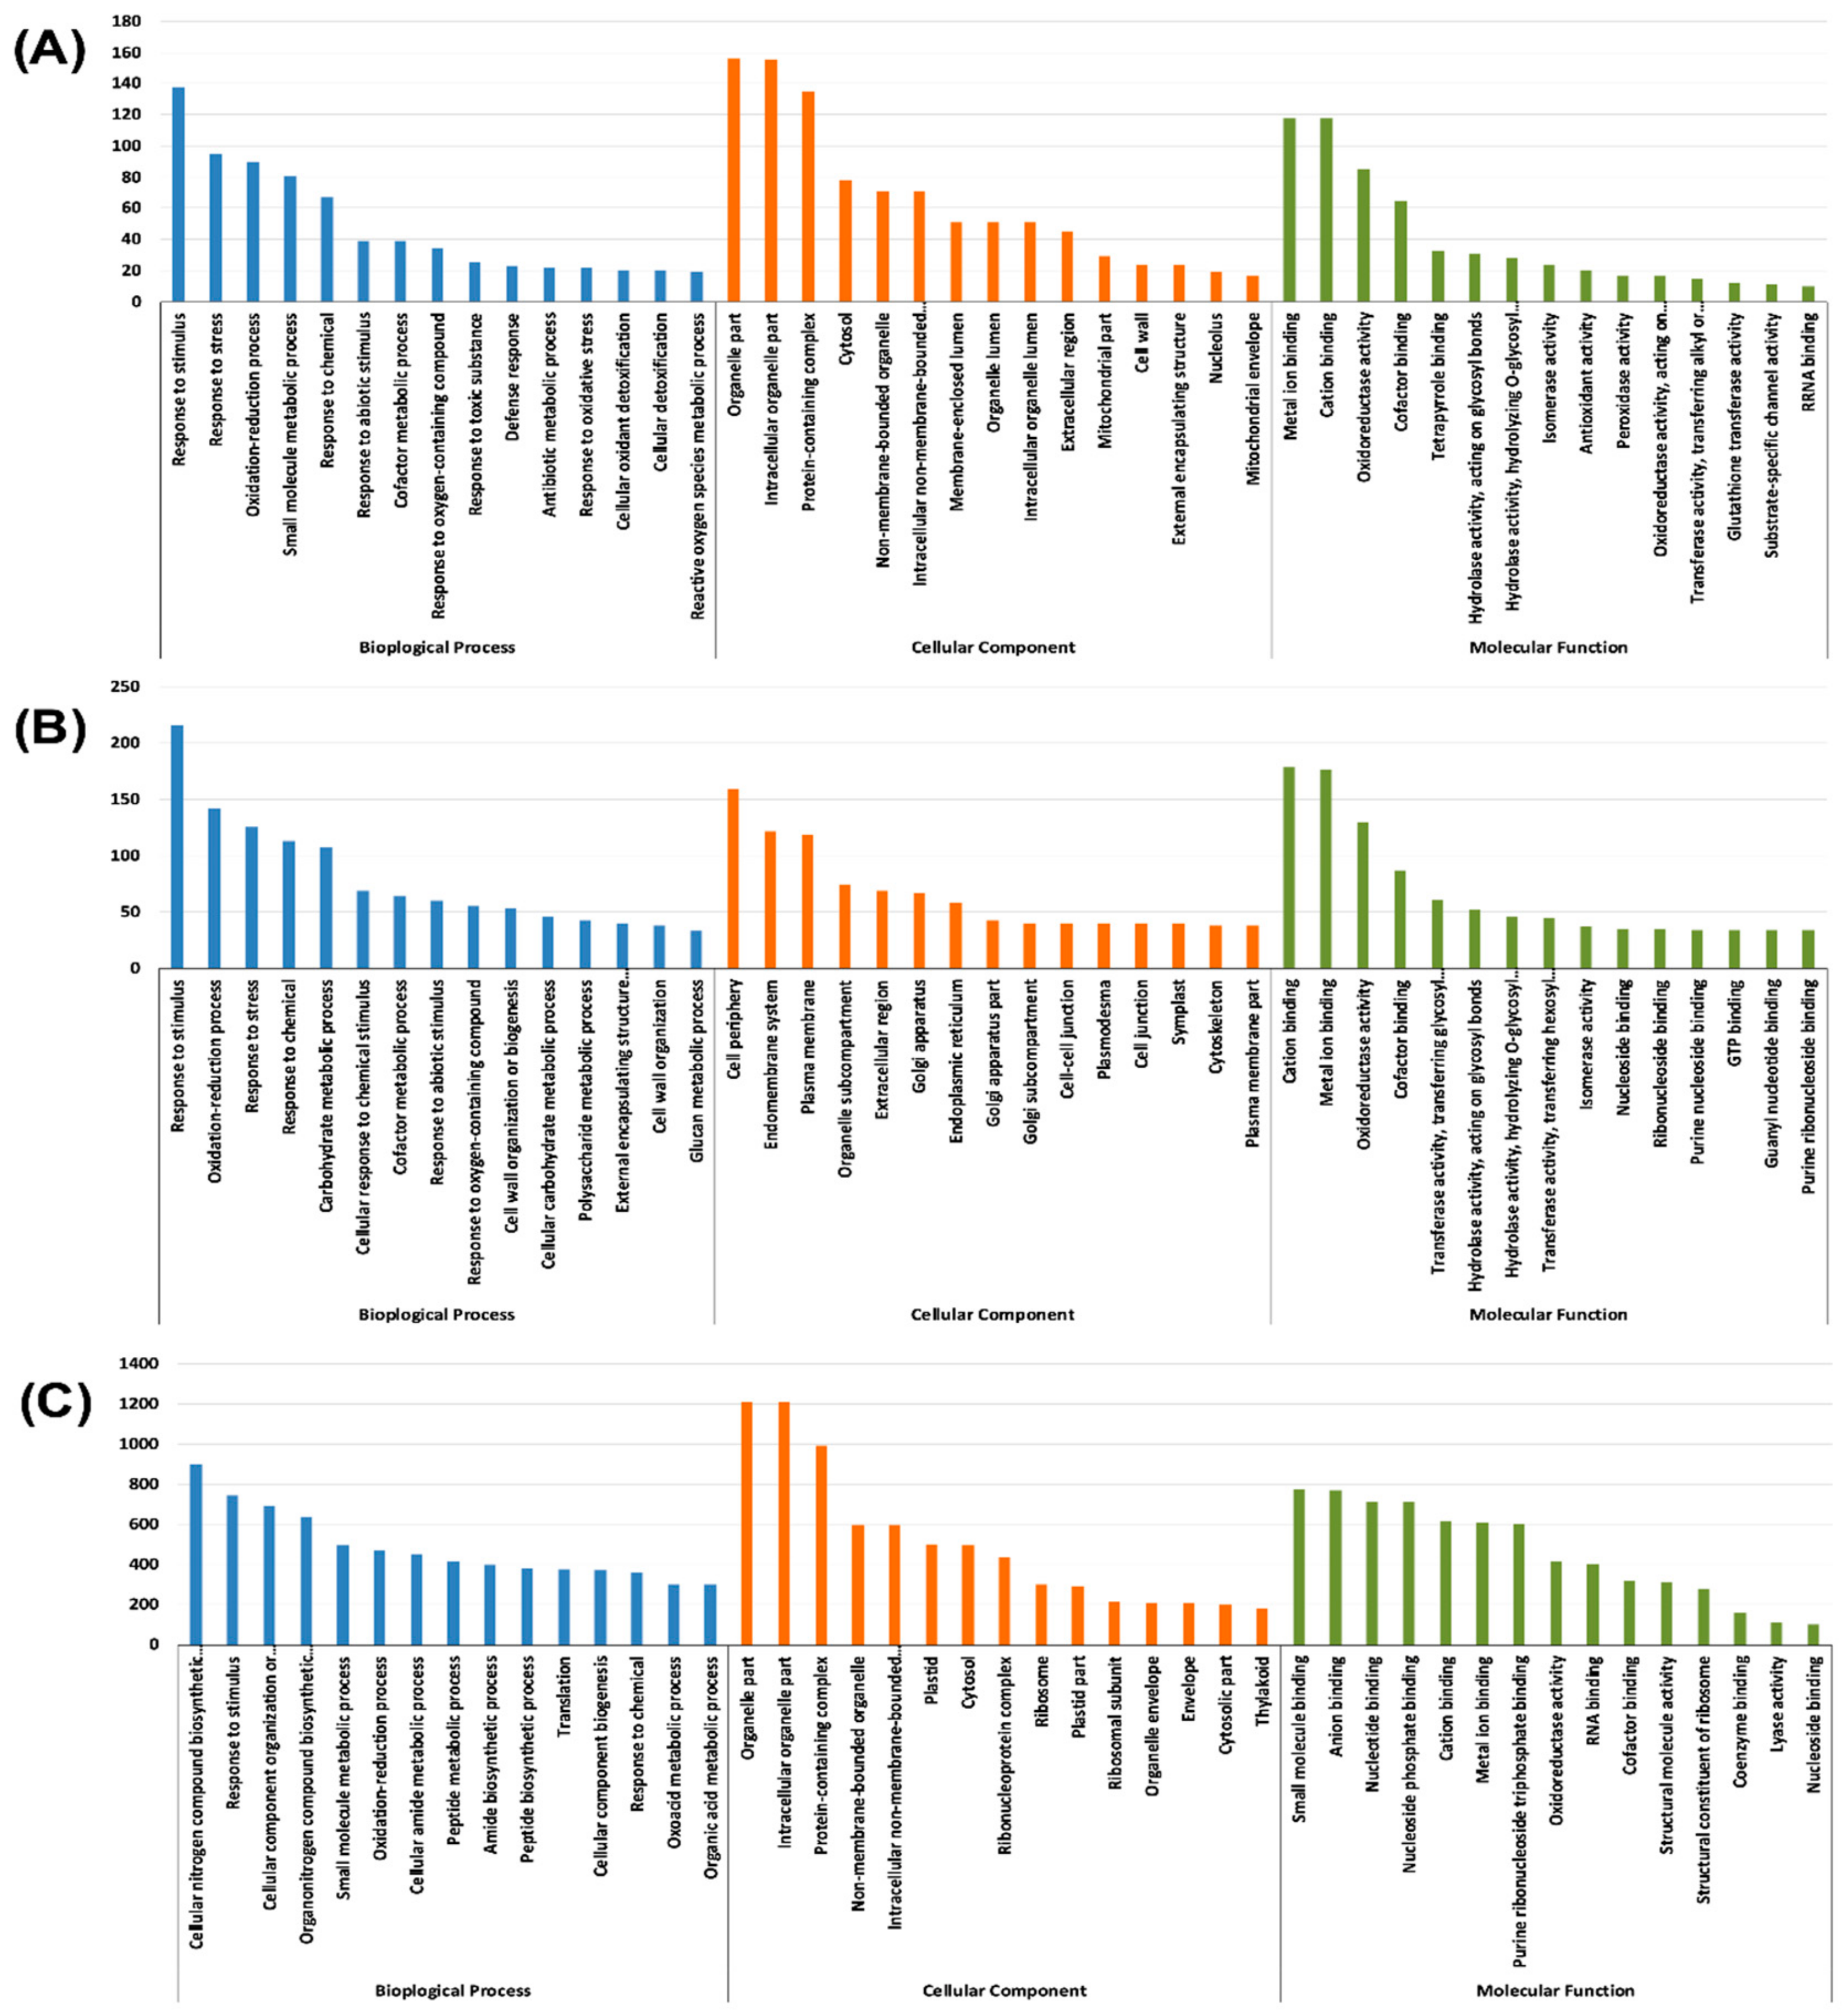
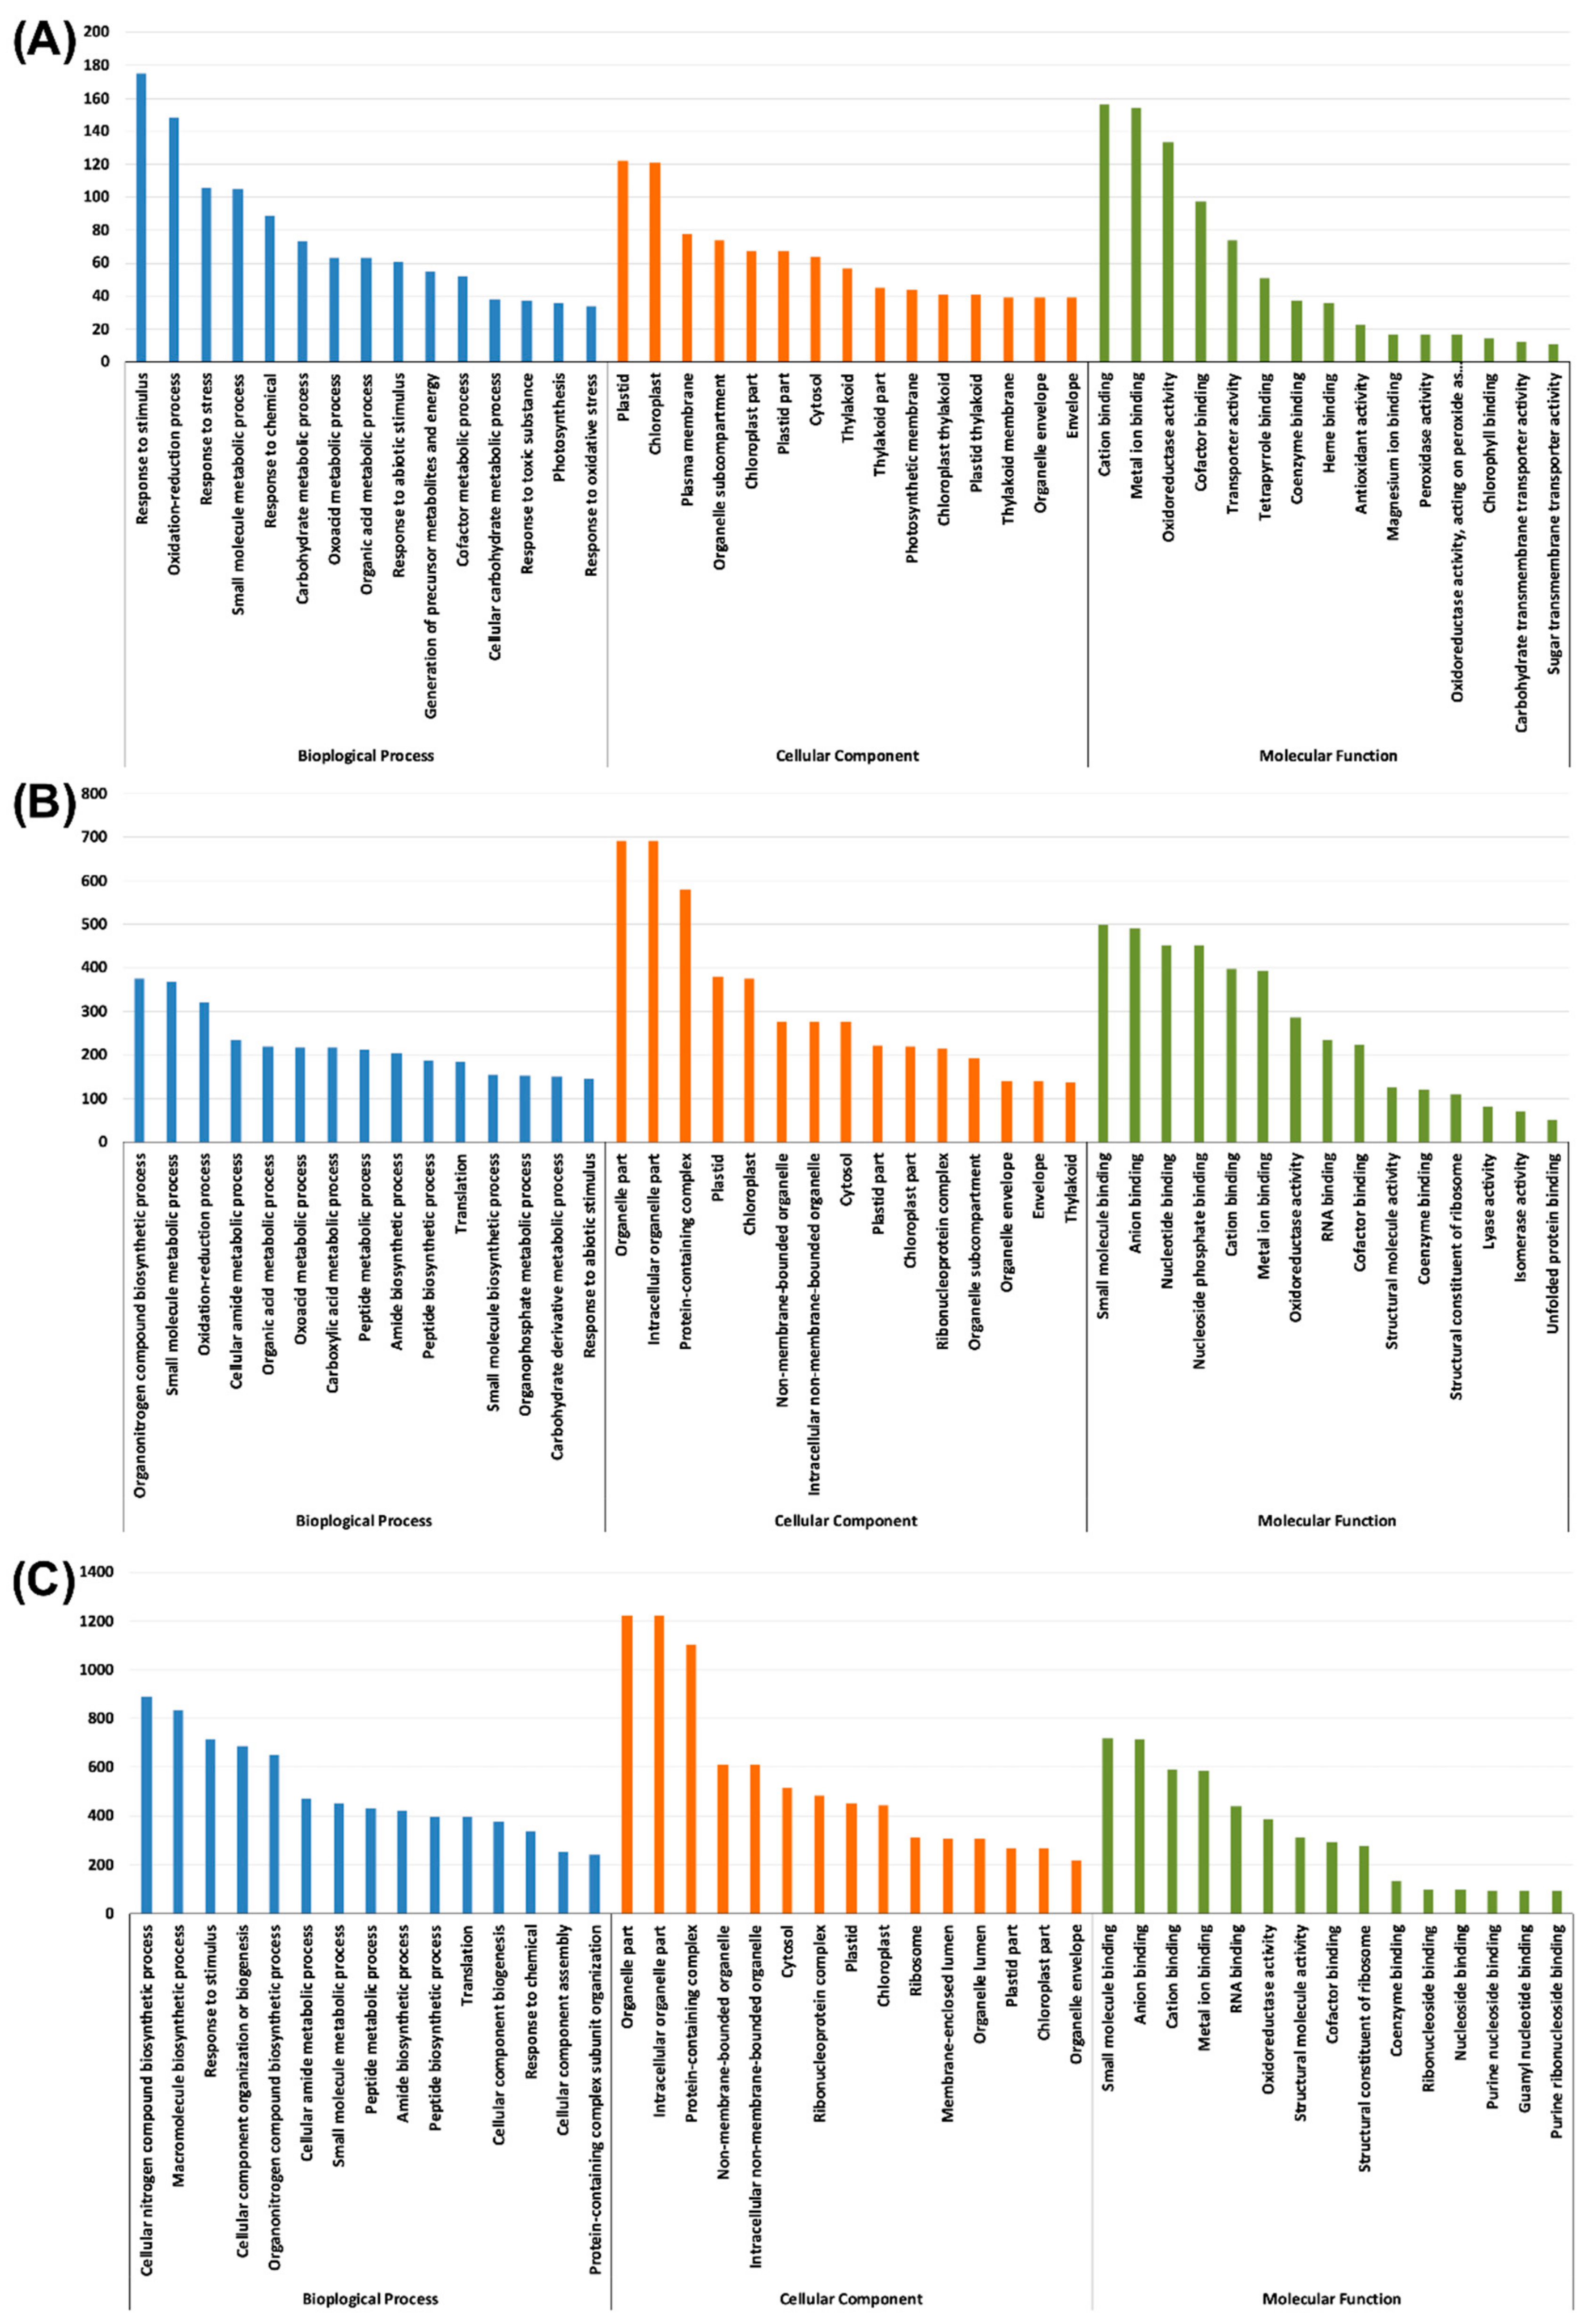
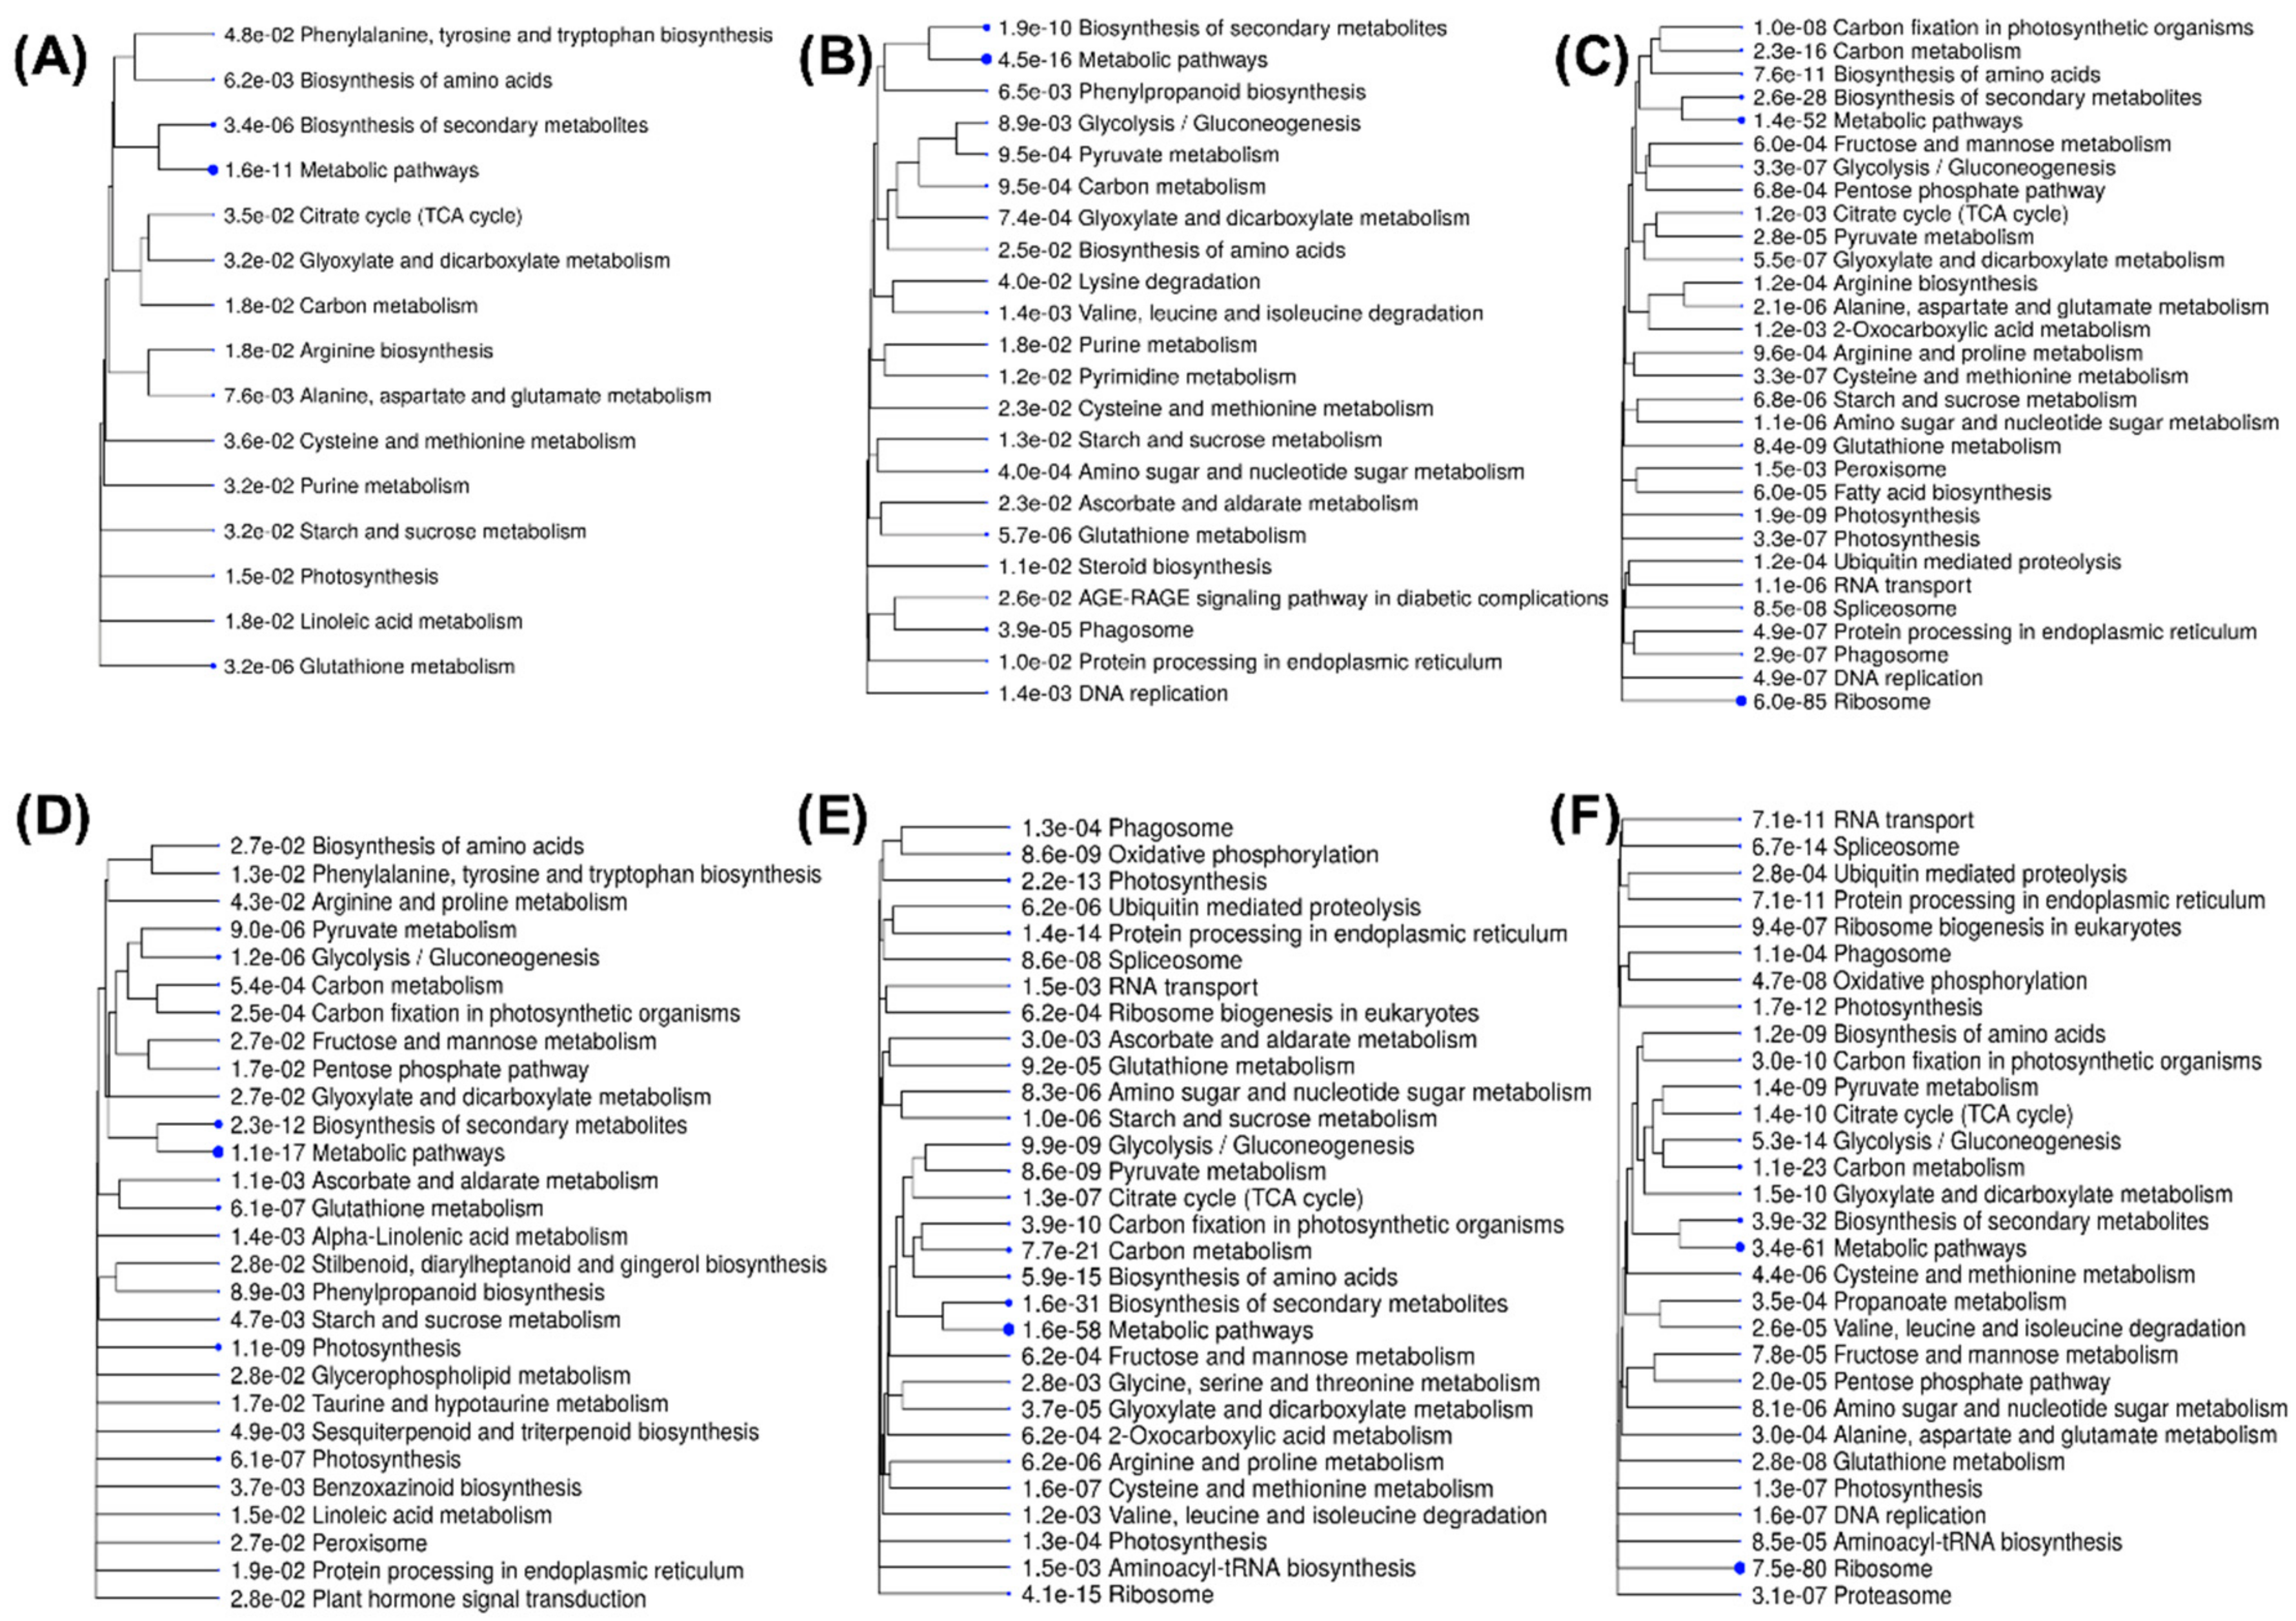
2.3. Gene Ontology Assignments and KEGG Enrichment Analyses

Gene ontology (GO) assignments viz., the cellular component, molecular function, and the biological process were used to classify the annotated DEGs based on the biological process, cellular localisation and molecular functions. The top 15 sub-components in each of the categories were depicted as bar graphs (Figure 4 and Figure 5) and all the subcomponents of the categories with a p-value for false discovery rate (FDR) enrichment is mentioned in Table S1. Under the biological process category, a co-factor metabolic process and response to abiotic stimulus were common across the stress treatments in both root and shoot tissues (Table S1).
In the cellular component category, Zn and Fe stresses in the root shared the sub-components viz., the extracellular region, cell wall, external encapsulating structure, apoplast and protein storage vacuole membrane. Similarly, in the shoot, all the stress treatments showed the cellular components subcategories viz., plastid, chloroplast, cytosol, plastid part, organelle envelope, envelope, photosynthetic membrane and chloroplast thylakoid (Table S1).
Furthermore, the molecular function terms viz., cation binding, metal ion binding, oxidoreductase activity and the co-factor binding across the stress treatments and tissues (Figure 4 and Figure 5, Table S1). The numbers of GO terms under cation binding, metal ion binding, oxidoreductase activity and co-factor binding were high in –Fe–Zn stress as compared to the individual –Fe and –Zn stresses in both the root and shoot tissues (Table S1). Which confirms that the co-occurrence of Fe and Zn stresses (–Fe–Zn) causes more physiological disturbance than individual stresses. Additionally, a greater number of DEGs in the shoot as compared to the root tissue suggests the presence of diverse physiological and metabolic activities in shoot. Moreover, the significant number of DEGs associated with these mineral homeostasis GO terms indicates the metabolic and physiological demands for Fe and Zn ions under stressed conditions.
The Kyoto Encyclopedia of Genes and Genomes (KEGG) enrichment analysis categorised DEGs into 15, 22 and 30 functional categories in the root under –Zn, –Fe and –Fe–Zn stresses, respectively (Table S2). Similarly, in shoot 28, 30 and 30 functional categories were identified for –Zn, –Fe and –Fe–Zn stress treatments, correspondingly (Table S2). The KEGG enrichment analysis and hierarchical clustering of pathways were undertaken to visualize the relatedness in the enrichment results. In this hierarchical clustering tree, related GO terms were grouped based on the number of common genes. The size of the solid circle corresponds to the enrichment FDR (Figure 6). The KEGG-enriched DEGs in the root are majorly related to themes such as amino acid, carbon and carbohydrate metabolism. Similarly, in the shoot, the major themes fall under amino acid metabolism, carbon and carbohydrate metabolism, photosynthesis and nucleic acid metabolism (Figure 6).

2.4. Genes Expression in Response to Fe and Zn Deficiency

Fe and Zn are the vital micronutrients for various metabolisms and the survival of plants. During Fe and Zn deficiency, several genes are known to regulate Fe and Zn homeostasis, phytohormonal regulation and morpho-physiological adaptation. The present investigation recorded the DEGs associated with the mugineic acid pathway, transporters, phytohormone metabolism, photosynthesis and carbohydrate metabolism (Table 1).

2.4.1. Mugineic Acid Pathway and Transporter Genes

The stress treatments (–Zn, –Fe and –Fe–Zn) showed a differential expression of mugineic acid pathway genes in maize seedlings (Figure S3). S-adenosyl-L-homocysteine hydrolysing enzyme ADENOSYL HOMOCYSTEINASE (GRMZM2G015295; –Fe: 7.51-fold and –Fe–Zn: 30.81-fold) showed the upregulated expression under Fe deficiency in the shoot. O-methyltransferases mediate the conversion of homocysteine to methionine and it serves as a precursor for derivatives of the mugineic acid pathway. METHYL TRANSFERASES (GRMZM2G567452) showed the upregulation under Fe and Zn deficiency treatments. The SAMS1 (GRMZM2G054123) is known to mediate the conversion of methionine to S-adenosylmethionine (SAM) showed an increased transcript abundance under –Fe (3.92-fold) and –Fe–Zn (–Fe–Zn: 9.42-fold) deficiencies in the shoot. Furthermore, the roots showed a differential expression of NAS3 (GRMZM2G054123) in response to the stress treatments. The upregulation of YELLOW STRIPE 1 (ZmYS1; GRMZM2G156599) was observed under Fe deficiency in both roots (8.55-fold) and shoot (2.09-fold). However, in response to the –Fe–Zn treatment, the opposite regulation of ZmYS1 was observed in the root (35.45-fold) and shoot (–38.26 fold). The expression pattern of ZmYS1 suggests its higher affinity towards PS-Fe3+ and the prominent activity in roots.
In addition to mugineic acid pathway genes, Fe and Zn deficiencies resulted in the differential expression of several transporters. The upregulation of membrane-localised natural resistance associated macrophage protein (NRAMP), NRAMP TRANSPORTER 1 (GRMZM2G069198) have been observed in both root and shoot. In plants, vacuoles serve as a sequestering site for minerals, including Fe and Zn. Various tonoplast-located transporters mediate Fe and Zn homeostasis in plants. Vacuolar transporters such as V-type ATPases, vacuolar proton pumps (VPPs), tonoplast intrinsic proteins (TIPs) were differentially expressed under the Fe and Zn deficiency. Two TIPs viz., Zm.9197.1.A1_at and GRMZM2G027098, were specifically upregulated in response to Fe deficiency (–Fe and –Fe–Zn) and Zn (–Zn and –Fe–Zn) deficiencies, respectively. Similarly, vacuolar-type H+-ATPase (V-TYPES ATPASE; GRMZM2G070360) showed Fe responsive expression in the shoot. Interestingly, VPP3 (GRMZM2G421857) showed Zn (–Zn and –Fe–Zn) and Fe (–Fe and –Fe–Zn) specific upregulation in the root and shoot, respectively. Ferric chelate reductases (FRO) are the critical component of strategy-I of Fe homeostasis, which showed the upregulated (GRMZM2G157263) expression in both roots and shoot under all the stress treatments. Citrate is one of the potent chelators for the mineral transportation in xylem [47]. CITRATE SYNTHASE 2 (GRMZM2G064023) showed a 6.89-fold and 5.41-fold increased expression under –Fe and –Fe–Zn stresses, respectively, in the roots. Among the ABC transporters, the expression of ABC TRANSPORTER C FAMILY MEMBER 14 (GRMZM2G142870) increased the expression by 2.09-fold and 15.46-fold in the root under the –Zn and –Fe–Zn stresses, respectively. The ZIP-like transporter (ZIP5; GRMZM2G064382) showed Zn stress-specific upregulation (–Zn: 5.53-fold; –Fe–Zn: 3.85-fold) in the root, whereas the metal ion transmembrane transporter activity (GRMZM2G178190) was observed under Fe deficiencies only. Fe deficiency in the shoot (–Fe and –Fe–Zn) resulted in the upregulation of MITOCHONDRIAL PHOSPHATE TRANSPORTER (GRMZM2G015401; –Fe: 3.46-fold and –Fe–Zn: 10.28-fold).

2.4.2. Phytohormones

Phytohormone metabolism shows the dynamic responses to Fe and Zn availability, which enable the plants to adapt to Fe and Zn deficiencies. In the present investigation, Fe and Zn deficiencies have altered the expression of various genes associated with various phytohormone metabolism viz., ethylene, auxin, gibberellins, cytokinin (Figure S4). The roots under Zn (–Zn and –Fe–Zn) and Fe (–Fe and –Fe–Zn) deficiencies upregulated the CYTOKININ OXIDASE 2 (GRMZM2G050997) and CYTOKININ OXIDASE 3 (GRMZM2G167220) expressions, respectively. The CYTOKININ-O-GLUCOSYLTRANSFERASE 2 (GRMZM2G041699) showed downregulation across the stress treatments.
The upregulation of Aux/IAA genes IAA13 (GRMZM2G077356) and IAA24 (GRMZM2G115354) in the shoot (–Zn: 2.59-fold; –Fe–Zn: 9.07-fold) and root (–Zn: 2.06-fold; –Fe–Zn: 2.13-fold), respectively, was observed specifically to Zn deficiency. Similarly, IAA17 (GRMZM2G147243) showed Zn-deficiency induced expression in root tissue (–Zn: 41.19-fold; –Fe–Zn: 11.45-fold). The pin-formed (PIN) protein PIN1b (GRMZM2G074267) crucial for the polar transport of auxins showed the downregulated expression under –Fe (–3.48) and –Fe–Zn (–5.35) in the root. The repression or non-significant expression of AIR12 (GRMZM2G427451) was observed in the root under –Fe and –Fe–Zn stresses.
Ethylene is another important class of hormones mediating plants’ adaptation under Fe and Zn deficiencies. The –Fe and –Fe–Zn stresses resulted in the high expression of ETHYLENE RECEPTOR (GRMZM2G102601) in the shoot (–Fe: 5.50-fold; –Fe–Zn: 3.43-fold). On the contrary, ETHYLENE RESPONSE FACTOR (GRMZM2G052667) showed an upregulation in the roots under –Fe (2.86-fold) and –Fe–Zn (3.61-fold) stresses. Ethylene responsive factors (ERF) mediate stress signals. The repression of ERFs has been recorded in response to Fe and Zn deficiencies in a tissue-specific manner. ERF-LIKE PROTEIN (GRMZM2G025062) was downregulated only in roots, whereas ETHYLENE-RESPONSIVE FACTOR-LIKE PROTEIN 1 (GRMZM2G053503) was downregulated in both the root and shoot. Furthermore, Zn stresses in the shoot (–Zn and –Fe–Zn) upregulated the gibberellin receptor gene GID1L2 (GRMZM5G831102; –Zn: 5.00-fold; –Fe–Zn: 15.97-fold).

2.4.3. Photosynthesis and Carbohydrate Metabolism

Several photosynthesis and carbohydrate metabolism-related genes showed differential expression under Fe and Zn stresses (Figure S5). Under –Fe (2.35-fold) and –Fe–Zn (20.44-fold) stresses, FERROCHELATASE (GRMZM2G113325) showed the upregulated expression in roots. In photosynthesis, ferredoxins transfer the electrons from photo-reduced photosystem-I to ferredoxin NADP+ reductase in which NADPH is produced for CO2 assimilation. FERREDOXIN 3 (GRMZM2G053458) showed the enhanced expression under –Fe (25.82-fold) and –Fe–Zn (17.88-fold) stress in the shoot. Similarly, the cytochrome complexes mediate the electron transfer between PSII and PSI. Fe stresses in the shoot (–Fe, –Fe–Zn) resulted in the increased accumulation of APOCYTOCHROME F PRECURSOR transcripts (GRMZM2G448174) in the shoot. Carbonic anhydrases (CAs) are Zn metalloenzymes that catalyse the interconversion of CO2 and HCO3- in plants. The root under –Zn and –Fe–Zn deficiencies and shoot under –Zn and –Fe deficiencies upregulated the CARBONIC ANHYDRASE (GRMZM2G121878), whereas –Fe–Zn stress in the shoot showed the downregulation of CARBONIC ANHYDRASE (GRMZM2G121878). The activity of carbonic anhydrase mediates the supply of CO2 to Rubisco (Ribulose bisphosphate carboxylase). The –Fe and –Fe–Zn deficiencies resulted in higher RIBULOSE BISPHOSPHATE CARBOXYLASE SMALL SUBUNIT 2 (GRMZM2G113033) transcripts accumulation. However, as compared to combined Fe and Zn deficiency (–Fe–Zn), Fe deficiency (–Fe) showed very high expressions. The chlorophyll a/b-binding proteins are the apoproteins of the light-harvesting complex of photosystem II. In the present investigation, the CHLOROPHYLL A-B BINDING PROTEIN 6A (ZmAffx.1219.1.S1_s_at) was upregulated under all the stresses in the shoot. The various proteins associated with photosynthesis co-translationally targeted the chloroplast via signal recognition particles. The transcripts of CHLOROPLAST SIGNAL RECOGNITION PARTICLE SUBUNIT (GRMZM2G145460; cpSRP54) were repressed across the stresses.
Fe stress resulted in a higher expression of DEGs associated with carbohydrate metabolism. The Fe deficiency (–Fe, –Fe–Zn) showed a consistently greater accumulation of transcripts of the glycolysis pathway in the shoot. The majority of glycolytic enzymes viz., PHOSPHOGLYCERATE KINASE (GRMZM2G382914), ENOLASES (GRMZM2G064302, GRMZM2G048371), PHOSPHOHEXOSE ISOMERASE (GRMZM2G065083), TRIOSEPHOSPHATE ISOMERASE (GRMZM2G030784), GLYCERALDEHYDE-3-PHOSPHATE DEHYDROGENASE (GRMZM2G051004) showed an enhanced expression in the shoots under –Fe and –Fe–Zn deficiencies. However, Zn deficiency did not show any consistent expression of glycolysis-associated transcripts. Furthermore, the roots enhanced the transcripts of CARBOHYDRATE TRANSPORTER (GRMZM2G336448) in response to Fe deficiency (–Fe: 4.22-fold; –Fe–Zn: 2.12-fold). On the other hand, genes associated with polysaccharide synthesis and cell wall biogenesis viz., UDP-GLUCOSE 6-DEHYDROGENASE (GRMZM2G328500; GRMZM5G862540), UDP-GLUCURONIC ACID DECARBOXYLASE 1 (predicted; GRMZM2G165357) and POLYGALACTURONATE 4-ALPHA-GALACTURONOSYLTRANSFERASE (GRMZM2G076276) showed increased transcripts accumulation in the shoot under –Fe and –Fe–Zn stresses. The Zn stresses in the shoot (–Zn and –Fe–Zn) resulted in the higher expression of CELLULOSE SYNTHASES in the shoot (GRMZM2G424832, GRMZM2G018241, GRMZM2G142898).

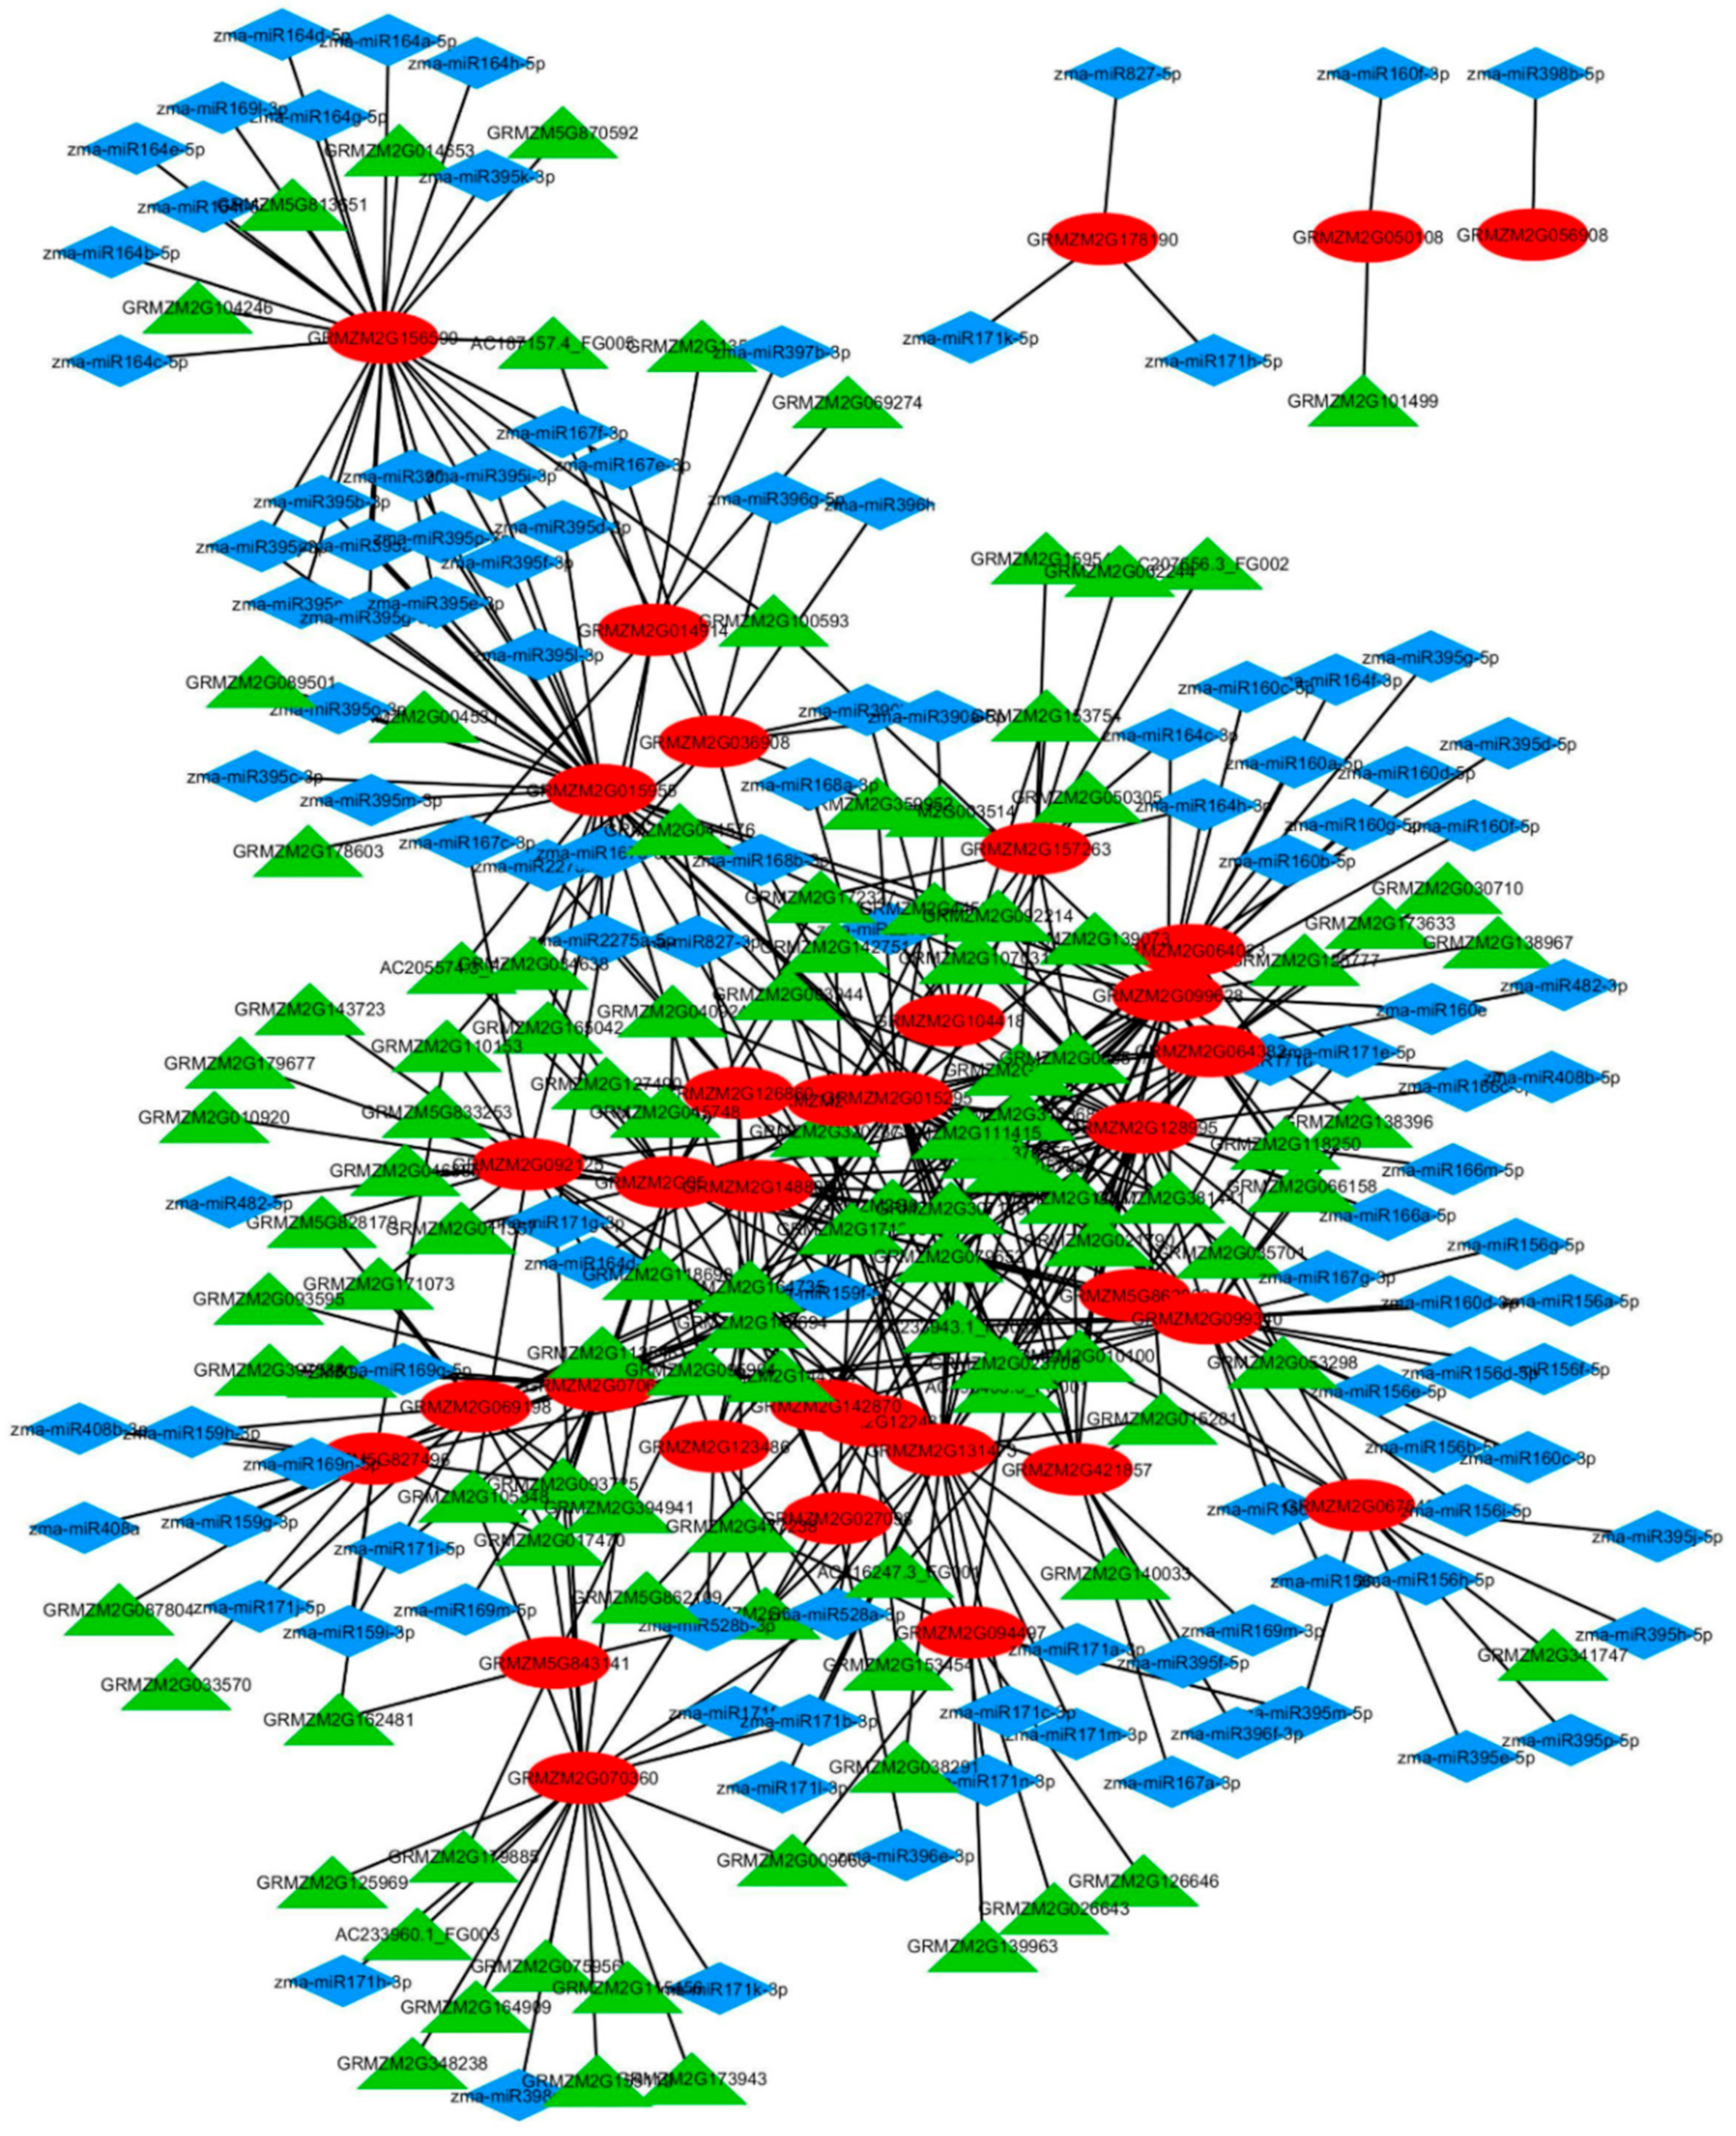
2.5. Regulation and Interaction of Fe and Zn Transporters in Maize

The gene-regulatory network (GRN) is constructed to visualize the regulatory relationships of miRNA and the transcription factors with their downstream differentially expressed transporter and mugineic acid pathway genes under Fe and Zn deficiency. GRN revealed a total of 454 interactions of transporters with miRNA and transcription factors (TFs) (Tables S3 and S4; Figure 7). The highest number of total degrees (31) were observed for the ZINC TRANSPORTER 4 (GRMZM2G015955), METALLOTHEIONINE LIKE PROTEIN (GRMZM2G099340) and METHIONINE t-RNA LIGASE (GRMZM2G099628). However, the ZmYS1 (GRMZM2G156599) and VACUOLAR PROTON-TRANSPORTING V-TYPE ATPASE, V1 DOMAIN (GRMZM2G128995) showed the highest degrees (23) with miRNAs and TFs, respectively. Therefore, these genes are the potential hub nodes in the regulation of the Fe and Zn homeostasis in maize. TF and miRNA and their interactions are adding the regulatory complexity to transporters genes. The regulatory network showed the highest gene–miRNA interactions with miRNAs of the zma-miR395 family (36) and the highest gene–TF interactions with ERFs (104). Hence, zma-miR395 and ERFs are the major regulatory elements in transporter and mugineic acid pathway regulatory network of maize. Furthermore, transporters’ regulatory network in the present investigation showed the regulation of genes with a common expression pattern by a common transporter under Fe and Zn deficiency although this may not be a universal phenomenon (Figure 7; Table S3). For instance, six transporter genes (GRMZM2G015295, GRMZM2G067546, GRMZM2G070605, GRMZM2G099340, GRMZM2G099628, GRMZM2G128995) showing Fe specific upregulation showed a common TF-mediated regulation through EREB142 (GRMZM2G010100). Conversely, many of the transporter genes’ expression is regulated by several miRNA and TFs.

3. Discussion

3.1. Fe and Zn Deficiencies Shifted the Expression Pattern of the Transcriptome in Root and Shoot

The current investigation presents a genome-wide transcriptome response of individual and simultaneous Fe and Zn deficiencies in both the root and shoot tissues. The experiments were performed with the aim of understanding the changes in the global transcripts’ level under –Zn, –Fe and –Fe–Zn stresses, and to decipher the expression of transcripts associated with Fe and Zn homeostasis, phytohormone metabolism, photosynthesis and carbohydrate metabolism. Genome-wide expression assay revealed a higher number of DEGs in the shoot (8200) as compared to root (7316) for –Fe and –Zn stresses indicating greater physiological demand for Fe and Zn minerals in the shoot over the root. The shoot controls most of the essential physiological activities viz., photosynthesis, chlorophyll biosynthesis, carbohydrate and cytochrome biosynthesis, and that of several plant pigments. Moreover, several enzymes employed in the shoot physiological activities required Fe and/or Zn as co-factor(s) or their integral component(s) [48,49]. On the other hand, high metabolic and physiological pressure on the root transportome and membrane-bound proteins to meet the Fe and Zn ions under –Fe–Zn stress could have resulted in contrasting trends of a higher number of DEGs in the roots as compared to shoot. The results of the present investigations are in contrast with those of Zheng et al. [32], who reported a higher number of DEGs in the root as compared to the shoot under Fe and P interactions in rice. The functional classification of DEGs in the current investigation revealed many of the GO terms associated with ion uptake and homeostasis viz., cation binding, metal ion binding, oxidoreductase activity etc. The deficiency of Fe and Zn alters the expression of genes associated with Fe and Zn homeostasis to regulate the plant physiological and metabolic requirement of Fe and Zn ions [2,3,23,26,27].

3.2. Fe and Zn Stresses Alter the Root Length via Differential Expression of Phytohormonal Genes

The plant root system is a vital component for the uptake and transport of nutrients from the soil and also exhibits considerable plasticity in response to endogenous and environmental signals [50]. The notable changes in the root length of maize inbred line SKV-616 under –Zn, –Fe and –Fe–Zn stresses were associated with the differential expressions of several genes of hormonal metabolism (Figure 1C, Table 1). Owing to Zn stresses (–Zn, –Fe–Zn), the upregulated expression of IAA17 (GRMZM2G147243) and IAA24 (GRMZM2G115354) was observed in the root tissue. IAA17 prevents the initiation of lateral roots by preventing the binding of AXR3 to auxin-responsive element (ARE) [51]. Similarly, the IAA3 gain of function in rice causes growth defects in crown roots [52,53]. Furthermore, AtIAA8 is an ortholog of ZmIAA24 in Arabidopsis which has also been reported as a negative regulator of lateral root formation [54]. In addition to the regulation of root phenotype, auxins also serve as signalling molecules in mineral deficiency in plants. The enhanced expression of IAA13 (GRMZM2G077356) and IAA17 (GRMZM2G147243) in –Zn and –Fe stress-specific manner in the shoot indicate their probable role in a shoot-to-root auxin signalling under Zn and Fe deficiency, respectively. In wheat, the application of IAA to shoots of Fe-sufficient plants resulted in the enhanced release of PS in roots [38]. Furthermore, the opposite regulation pattern IAA genes could be associated with variation in the spatial responses. In contrast to auxins, cytokinins play an inhibitory role in the lateral root initiation and development [55,56]. The maize seedlings showed Zn and Fe stress-specific expression of CYTOKININ OXIDASES (CKXs) in root tissues. Remarkably, CKX3 (GRMZM2G167220) showed a higher upregulation in response to Fe stresses (–Fe, –Fe–Zn) as compared to CKX2 (GRMZM2G050997) under Zn stresses (–Zn, –Fe–Zn). In Arabidopsis, the overexpression of cytokinin-degrading enzyme encoding gene CKX in the lateral root primordia (LRP) results in reduced cytokinin levels and the elimination of cytokinin signalling [57,58], thereafter which enhances the lateral root density by reducing the distance between the adjacent LRP cells [59,60].
The synthesis of ethylene is perceived by membrane-bound ethylene receptors that initiate the ethylene signalling pathway. The higher expression of ETHYLENE RESPONSE FACTOR (GRMZM2G052667) in –Fe and –Fe–Zn stresses of the root appear to have contributed towards reduced root length. In maize, ethylene-responsive factors (ERF1) play a vital role in stress signalling pathways [61]. Similarly, in tomato, the overexpression of ethylene-responsive factors LeERF2/TERF2 showed the increased synthesis of ethylene [62]. Furthermore, the inverse association between higher ethylene biosynthesis and primary root growth through decreased cell proliferation and elongation in root apical meristem was observed in Arabidopsis [63,64].
Gibberellins increase primary root length through the cell elongation and proliferation of root meristem and reduced levels of GAs result in shorter primary roots [65]. GA signalling in plants involves the GA receptor GIBBERELLIN INSENSITIVE DWARF1 (GID1), GA signalling repressor DELLA proteins and ubiquitin ligase complex [66]. The binding of GID1 to bioactive GA, causing the degradation of DELLA proteins, which subsequently initiates the GA signalling in plants. In the absence of bioactive GA, DELLA proteins repress the GA responses [67]. Hence, the downregulation of GID1L2 (GRMZM5G831102) under –Fe and –Fe–Zn stresses in the root indicate a direct association between the reduced root length and of GA signalling in maize. Previous findings also reported an association between the reduced root growth and endogenous GA level under Zn and Fe deficiency in maize [68] and rice [67], respectively.

3.3. Fe and Zn Deficiency Affect Photosynthesis and Carbohydrate Metabolism Through Altered Expression of Key Genes

In the present investigation, the enhanced expression of FERROCHELATASES (GRMZM2G113325), APOCYTOCHROME F (GRMZM2G448174), CHLOROPHYLL A-B BINDING PROTEIN 6A (ZmAffx.1219.1.S1_s_at) were observed under Fe deficiency stresses (–Fe and –Fe–Zn). APOCYTOCHROME F (GRMZM2G448174) is the precursor of cytochrome b6-f complex, which facilitates electron transfer between photosystem II (PSII) and PSI [69]. Similarly, ferredoxins involved in electron transport from the photo-reduced photosystem-I to NADP+ reductases. The chlorophyll a-b binding protein 6A (ZmAffx.1219.1.S1_s_at) acts as a component of the light-harvesting complex (LHC) which is involved in the formation of a full-size NAD(P)H dehydrogenase-PSI super complex (NDH-PSI) that triggers cyclic and chlororespiratory electron transport in chloroplast thylakoids, especially under stress conditions [70]. Therefore, the Fe and Zn deficiency-induced overexpression of APOCYTOCHROME F, CHLOROPHYLL A-B BINDING PROTEIN 6A and FERREDOXIN 3 affects photosynthesis by disrupting the cellular redox poise and electron transfer mechanisms [69,71].
The increased expression of CARBONIC ANHYDRASE (CA; GRMZM2G121878) during Zn deficiency (–Zn and –Fe–Zn) requires Zn2+ ions as co-factors for its functional activity. CA catalyses the first biochemical step of the carbon fixation in C4 plants. As a co-factor in CA, Zn creates a proton H+ and a nucleophilic hydroxide ion. The nucleophilic water molecules attack the carbonyl group of carbon dioxide to convert it into bicarbonate. Additionally, the H+ ions reduce the pH, and inactivate the enzymes associated with the hydrolysis of starch and glucose, and subsequently reduce the osmotic gradient of cells and stomatal closure [72].
Rubisco is the most prominent protein on the Earth and serves as the primary engine of carbon assimilation through photosynthesis. Fe deficiency resulted in higher accumulation of RuBisCO subunit transcripts (GRMZM2G113033, GRMZM2G095252) in the shoot. However, previous reports in soybean and sugar beet pointed the reduced as well as increased RuBisCO protein content under Fe deficiency, respectively [73,74]. Fe and Zn deficiency-induced the disruption in the protein synthesis machinery, which could be the reason for reduced RuBisCO proteins’ accumulation. In barley and rice, the accumulation of RuBisCO was higher in the older leaves of Fe-deficient plants than in the older control leaves, which suggests that RuBisCO accumulation is not decreased significantly by Fe deficiency. Therefore, there is a non-significant association between chlorophyll concentration and RuBisCO accumulation [75,76]. Overall, the photosynthetic machinery is known to be highly sensitive to Fe deficiency as compared to Zn owing to the role of Fe ions as co-factors in the key components of the photosynthetic machinery. There are two or three Fe atoms per PSII, 12 Fe atoms per PSI, five Fe atoms per cytochrome complex b6–f (Cyt b6–f) and two Fe atoms per ferredoxin molecule as reported by Briat et al. [77] and Krohling et al. [71].
The upregulation of glycolytic pathways genes viz., PHOSPHOGLYCERATE KINASE (GRMZM2G382914), ENOLASES (GRMZM2G064302, GRMZM2G048371), PHOSPHOHEXOSE ISOMERASE (GRMZM2G065083), TRIOSEPHOSPHATE ISOMERASE (GRMZM2G030784), and GLYCERALDEHYDE-3-PHOSPHATE DEHYDROGENASE (GRMZM2G051004) under Fe deficiency is associated with Fe deficiency-associated metabolic pressure. The Fe deficiency increases the demand for reducing power, and ATP owing to the enhanced expression of Fe acquisition mechanisms and increased organic acids content [76]. Fe deficiency enhanced the activity of the glycolysis pathway to meet the reducing ATP and the enhanced carboxylation. However, the uptake and transport of Fe demand the chelators and organic acids from the carbohydrate metabolism as compared to free ionic movement of Zn and which could be one of the reasons for the greater response of the glycolytic pathway to Fe deficiency as compared to Zn deficiency in plants.
The Zn deficiency in the present investigation resulted in the enhanced expression of cellulose synthase enzymes (CESAs) (GRMZM2G424832, GRMZM2G018241, GRMZM2G142898) to meet the Zn requirement for cellulose synthesis. The flexibility of primary cell walls in plants is necessary to adapt the plants under stress conditions to withstand the turgor pressure. Cellulose is the main constituent of the cell wall and is directly synthesized at the plasma membrane [78]. The CESAs carry the terminal Zn-binding domain, which oligomerizes the CESAs under oxidative stress [78,79]. Likewise, Fe deficiency treatments (–Fe, –Fe–Zn) also enhanced the accumulation of the transcripts of other non-cellulosic constituents of cell walls viz., pectins (POLYGALACTURONATE 4-ALPHA-GALACTURONOSYLTRANSFERASE: GRMZM2G076276), xylans (PREDICTED UDP-GLUCURONIC ACID DECARBOXYLASE 1: GRMZM2G165357), arabinoses (UDP-ARABINOPYRANOSE MUTASE 3: GRMZM2G073725).
Sucrose-phosphate synthases (GRMZM5G875238, GRMZM2G140107) involved in sucrose biosynthesis showed higher upregulation under Fe deficiency. The Fe deficiency in Arabidopsis increases sucrose accumulation in the roots and subsequently promotes the auxin signalling cascades [80]. Therefore, the enhanced accumulation of sucrose may act as one of the junctions between carbohydrate metabolism and phytohormonal signalling under Fe and Zn deficiency in plants.

3.4. Differential Expression of Transporters under Fe and Zn Stresses in Maize

The release of Fe and Zn chelators are crucial in root tissues. The expression pattern of ADENOSYL HOMOCYSTEINASE (GRMZM2G015295), O-METHYL TRANSFERASES (GRMZM2G567452), SAMS (GRMZM2G054123) and ZmYS1 (GRMZM2G156599) suggest higher sensitivity to Fe deficiency. Furthermore, the upregulation of NAS3 (GRMZM2G050108) was observed under –Zn and –Fe–Zn treatments, whereas the NAS1 (GRMZM2G034956) expression was induced under –Fe deficiency only. Interestingly, NAS3 expression was highly repressed in the shoot under –Fe–Zn treatment suggesting the possible spatial regulation of NAS3. The upregulation of the mugineic acid pathway genes is an adaptive strategy in grasses to overcome the Fe and Zn starvation [81,82]. Furthermore, the activity of transporter and chelator genes during Fe and Zn deficiencies occurs in a stress-specific spatiotemporal manner. Nicotianamine is the potent chelator and mediates the uptake and transport of Fe and Zn in plants [8]. The dual regulation of NAS genes in response to Fe deficiency has also been reported in maize [83]. In addition to uptake and transport, NAS genes also known to be engaged in the accumulation of Fe into the seed [84]. Hence, NA could be one of the significant contributors to the long-distance transport of Fe and Zn in maize. The root tissue showed an enhanced expression of NRAMP TRANSPORTER 1 (GRMZM2G069198) under Zn deficiency. However, for Fe deficiency, the expression was prominent in the shoot. Similarly enhanced upregulation was also observed in maize under Fe deficiency [36]. In Arabidopsis and rice, NRAMP1 is a key transporter for Fe homeostasis [85,86]. Additionally, NRAMP1 showed to translocate both divalent and trivalent ions in peanut [87] and Arabidopsits [88].
Among Fe and Zn chelating complexes, the upregulated expression of CITRATE SYNTHASE 2 (GRMZM2G064023) was observed in response to Zn (–Zn, –Fe–Zn) and Fe (–Fe, –Fe–Zn) deficiencies in the root and shoot, respectively, whereas the expression levels were very high under Fe deficiency in the shoot (–Fe). Both strategy-I and II plants hold Fe–citrate complexes in the xylem sap [89,90]. Fe starvation has been reported to increase the citric acid level in the xylem to enhance Fe mobility in plants [91,92]. In maize, Fe3+–citrate and Fe3+–phytosiderophore are the Fe form in the xylem sap [93]. Similarly, the xylem of Thlaspi caerulescen showed ~21% of total cellular Zn as Zn-citrate complex [94].
The reduction of Fe3+ to more soluble Fe2+ ions by membrane bound FERRIC CHELATE REDUCTASE 2 (GRMZM2G157263) is crucial for the subsequent Fe transport as Fe2+-NA and electron transfer mechanism. Oligopeptide transporter family proteins can transport minerals in the form of metal–NA complexes. OPT (GRMZM2G148800) showed an upregulated expression response to Fe deficiency (–Fe, –Fe–Zn) in the root. However, the downregulation was observed in the shoot under Zn deficiency (–Zn, –Fe–Zn). The accumulation of ZINC-TRANSPORTER 4 (GRMZM2G015955) transcripts under Zn deficiency in the root and shoot indicates the major function in Zn homeostasis. Similarly, the transcripts of ZIP5 (GRMZM2G064382) were enhanced under Zn deficiency in the roots (–Zn, –Fe–Zn), whereas anti-directional regulation was observed in the shoot. Several authors reported a role of ZIP transporters in the homeostasis of divalent ions viz., Fe, Zn, Mg [17,25,26,27,95]. In maize, Li et al. [96] showed that the overexpression of ZmZIP5 enhances the Zn and Fe accumulation. Similarly, the overexpression of ZIP5 and ZIP9 genes in rice showed an increased accumulation of Zn over the control plants [25,26,27].
Vacuoles in the cell help to regulate Fe and Zn flux. Transporters located in the vacuole membrane play an important role in long-distance transport in addition to intracellular metal homeostasis [97]. During Fe and Zn deficiencies, the enhanced expression of vacuole transporters is necessary for the mobilisation of stored Fe and Zn ions to meet the metabolic demands [98]. The enhanced expression of TIPs in the shoot showed a possible association of Zm.9197.1.A1_at and GRMZM2G027098 in regulating Fe and Zn homeostasis, respectively. Studies showed that the enhanced expression of ZmTIP1 facilitates the rapid intracellular osmotic equilibration and permits quick water flow through the vacuoles [99]. The VACUOLAR PROTON PUMP 3 (GRMZM2G421857) transcripts increased in response to Zn and Fe deficiencies in the root and shoot, respectively; and Fe deficiency enhanced the expression of V-TYPE PROTON ATPASE SUBUNIT E3 (GRMZM2G070360), VACUOLAR ATP SYNTHASE SUBUNIT B (GRMZM2G094497), and VACUOLAR PROTON-TRANSPORTING V-TYPE ATPASE, V1 DOMAIN (GRMZM2G128995) in the shoot. The specialized functions of vacuoles depend on the tissue and cell type and their developmental stage. All vacuoles seem to hold the majority of the proton pump transporters and differ in their function, depending on the type of vacuole in which they reside [100].

3.5. Hormonal Signalling and Homeostasis Networks Involved in the Fe and Zn Deficiency Regulatory Network

Transcriptome response to Fe and Zn interaction helps in understanding the association and crosstalk of Fe and Zn metabolism in maize. Very few attempts have been made to decipher Fe and Zn interactions in crops at the transcriptome strata. At the transcriptome level, the Fe and Zn stresses acted additively as the number of genes differentially expressed were quite high in the combined Fe and Zn stress (–Fe–Zn) as compared to the individual Fe (–Fe) or Zn (–Zn) stress. However, the direction of the individual gene(s) expression pattern varied with the genes. Many of the key genes associated with Fe and Zn metabolisms were highly downregulated and showed an opposite regulation pattern under both Fe and Zn (–Fe–Zn) deficiencies in the shoot (Table 1). It is known that Fe and Zn act as co-factors of enzymes associated with various metabolic processes and the expression of key genes [48,49]. The simultaneous deficiency of both Fe and Zn could hinder the deficiency-responsive enhanced expression of key genes through altering the respective regulatory enzymes expression. Furthermore, the exertion of high regulatory and metabolic pressure during Fe and Zn stresses to sustain the key metabolisms in the shoot could have resulted in the downregulation and opposite regulation of various key genes. As a support to the findings, the inverse regulation of auxin metabolism by Fe and Zn deficiency was reported in bean [49] as well as in rice [101].
The expression of transporter genes under Fe and Zn deficiency is regulated by various regulatory miRNA and TFs. The binding of miRNA to respective transcripts suppresses the expression of target genes. The maximum interactions was observed for zm-miR395 family miRNAs. The zm-miR395, is a regulator of key proteins viz., low-affinity sulphate transporter (AST68) and ATP sulfurylases (APS1, APS3 and APS4) associated with sulphur homeostasis [102] and Fe–S clusters in plants. Fe is present in the centre of Fe–S clusters which act as electron acceptors and donors in several cellular processes including photosynthesis, respiration, sulphate assimilation and ethylene biosynthesis [77]. Furthermore, the binding of Zn ions to scaffold assembly protein ISU1 is more crucial for the stability of Fe–S cluster [103]. Fe deficiency results in the downregulation of miR395 in Arabidopsis [104]. The Fe and Zn deficiency-induced downregulation of miR395 is associated with the upregulation of its target genes viz., ZIP4 (GRMZM2G015955), ZmYS1 (GRMZM2G156599), VACUOLAR SORTING RECEPTOR HOMOLOG 1 (GRMZM2G067546), VACUOLAR PROTON PUMP 3 (GRMZM2G421857), CITRATE SYNTHASE 2 (GRMZM2G064023).
Similarly, among all the transcription factors, ERFs showed the highest interactions (104) with transporters and mugineic acid pathway genes. In the present and previous investigations, Fe and Zn deficiency resulted in differential expression ERFs [34]. Ethylene acts as an important signalling molecule in the regulatory networks of transporter and hormones. The regulatory network showed gene–ERF interactions with ZINC TRANSPORTER 4 (GRMZM2G015955), ZRT-IRT-LIKE PROTEIN 5 (GRMZM2G064382), METAL ION TRANSPORTER (GRMZM2G122437), VACUOLAR PROTON-TRANSPORTING V-TYPE ATPASE, V1 DOMAIN (GRMZM2G128995), ABC TRANSPORTER C FAMILY MEMBER 14 (GRMZM2G142870), OLIGOPEPTIDE TRANSMEMBRANE TRANSPORTER (GRMZM2G148800), FERRIC-CHELATE REDUCTASE (GRMZM2G157263), VACUOLAR PROTON PUMP 3 (GRMZM2G421857) and MITOCHONDRIAL PHOSPHATE TRANSPORTER (GRMZM2G015401). Many of the ERFs are known to acts as repressor proteins for transporters and ethylene biosynthesis through feedback inhibition [105]. Therefore, the downregulation of ERFs (GRMZM2G025062, GRMZM2G053503) could be associated with the enhanced regulation of transporters and ethylene synthesis under Fe and Zn deficiencies. Furthermore, in rice, the upregulated expression of Fe and Zn transporters was observed under enhanced ethylene synthesis [41]. Additionally, the ethylene is known to alter the auxin signalling cascades in plants [106]. The sensitivity and spatiotemporal expression of regulatory elements could also play a role in the dual regulation of transporter genes. Furthermore, the regulation of genes associated with different adaptive physiological pathways by miRNA and TFs enhances the system’s complexity. In addition to regulatory elements, regulatory enzyme systems also increase the interactions in plants. Fe and Zn deficiency has been reported to alter the hormonal signalling through the accumulation of sugars [80]. These complex crosstalks and interactions through various pathways need to be addressed through reverse genetic approaches.

4. Materials and Methods

4.1. Plant Material and Stress Treatment

Genotype SKV-616, a quality protein maize (QPM with superior protein quality) inbred line was selected to carry out the genome-wide expression assay owing to its ability to accumulate a moderately high level of Fe and Zn concentration [107]. The seeds of a maize inbred SKV-616 were surface sterilised with 1% NaClO solution for 5 min followed by six rinses with Milli-Q water (18.2 MΩ). Seeds were germinated on a Milli-Q water (18.2 MΩ)-soaked filter paper roll. The seedlings were germinated and grown for seven days in the darkroom at 25 °C. The uniform seedlings were transferred to a nutrient solution containing 0.7 mM K2SO4, 0.1 mM KCl, 0.1 mM KH2PO4, 2.0 mM Ca(NO3)2, 0.5 mM MgSO4, 10 μM H3BO3, 0.5 μM MnSO4, 0.2 μM CuSO4, 0.5 μM ZnSO4, 0.05 μM Na2MoO4, and 0.1 mM Fe3+-EDTA. The pH of the nutrient solution was maintained at 5.5 throughout the experiment with 1 M HCl [108]. Fe3+-EDTA and ZnSO4 were excluded from the media to induce Fe (–Fe +Zn) and Zn (+Fe–Zn) deficiencies, respectively. For induction of simultaneous Fe and Zn stresses (–Fe–Zn), both Fe3+-EDTA and ZnSO4 were removed from the complete solution. After the seeds germinated, the plants were transferred to the respective treatment solution and grown until the clear expression of Fe and Zn deficiency symptoms (12 days).

4.2. Morpho-Physiological Characterisation

All the morphophysiological parameters were recorded on five plants grown in hydroponic culture with three data points per seedling. The chlorophyll content was measured with soil plant analysis development (SPAD) chlorophyll meter (SPAD-502 Plus chlorophyll meter, Konica Minolta Sensing Inc., Osaka, Japan). The readings were taken on the top, middle and base of the fully expanded top leaf in each seedling. The same leaf was used for measuring the photosynthesis rate, transpiration rate and stomatal conductance with a portable photosynthesis system (LI-6400, Nebraska, USA). The maximal quantum efficiency of the photo-system II (PS II) photochemistry (Fv/Fm) was recorded on 30 min dark-adapted leaves using a portable photosynthesis system with fluorescence attachment (LI-6400, LI-COR, Nebraska, USA). The root length was measured manually with the measuring scale. The statistical analysis was performed with a two-sample t test with the assumption of unequal variances with all possible comparisons among the control and treatments.

4.3. Genome-Wide Expression Assay Using Affymetrix GeneChip Maize Genome Array

The microarray experiment was designed as a two-factor experiment with the four possible treatments among Fe and Zn combination viz., 1) +Fe+Zn, 2) –Zn, 3) –Fe and 4) –Fe–Zn. The total RNA was isolated in triplicates separately from the control and stress-treated root and shoot tissues of 19 day-old seedlings with a stress period of 12 days (50 mg each) using the RNeasy Mini Kit (Qiagen, Hilden, North Rhine-Westphalia, Germany) as per manufacturer’s guidelines. The RNase free DNAse treatment with a Thermo Scientific kit (La layette, USA) was given to each RNA sample to eliminate the residual DNA present in RNA samples. Each DNAse-treated RNA sample obtained was examined for quantity using a NanoDrop 1000 spectrophotometer (Thermo Scientific, Wilmington, Delaware, USA). RNA samples with a A260/280 ratio of 1.8 to 2.1 in were considered for further analysis. Affymetrix GeneChip maize genome arrays (Affymetrix Inc., Santa Clara, California, USA) were used in three replications for each treatment to ensure the reproducibility and quality of the chip hybridisation using standard Affymetrix protocols (3’IVT protocol on GeneChip Fluidics Station 450; scanning on Affymetrix GSC3000). For the microarray experiment, ~300 ng of total RNA was biotin-labelled for GeneChip analysis and 10 µg of purified fragmented cRNA was used for hybridisation. All expression data were derived based on the Minimum Information About a Microarray Experiment (MIAME) guidelines [109].

4.4. Microarray Data Analyses

The GeneChip Operating Software (GCOS, Affymetrix GeneChip operating software with autoloader ver. 1.4, manual) was used to generate the CEL file for each of the scanned microarray chips. The raw CEL files containing probe hybridisation intensities from 24 chips were imported into the R platform using the affy package [110]. The GeneChip Robust Multiarray Average (GCRMA) algorithm was used for background correction, normalisation, and probe set summarisation [111]. The arrayQualityMetrics package was employed to generate microarray quality metrics reports [112]. The linear modelling of the microarray data and the identification of DEGs was performed with the limma package [113]. The limma computes t-statistics and log-odds of differential expression by the empirical Bayes shrinkage of the standard errors toward a common value. Probe sets having a p-value of < 0.05 and a 2-fold expression change were considered as differentially expressed under mineral stress treatments compared to the control. The gene model IDs for the probes were retrieved from the Gramene database [114] for subsequent analyses. Where the gene model IDs are not available, the Affymetrix probe IDs were used to mention the genes.

4.5. Gene Ontology, KEGG Enrichment and Gene-Regulatory Network (GRN) Analyses

Gene ontology (GO) and KEGG enrichment analyses were performed using ShinyGO v 0.61 [115]. The function categories of the genes were selected with the enrichment FDR (false discover rate) of p < 0.05. The transcription factors (TFs) regulating the expression of transporters (DEGs) were retrieved from the PlantRegMap database and the miRNAs regulating the expression of stress responsive genes at post-transcriptional level were predicted by the psRNATarget tool [116,117]. The complete Fe and Zn transporters regulatory network was realised using Cytoscape [118] and furthermore, the network was analysed to find important nodes (genes) that played a major role in the flow of information within the biological system and helping plants’ adaptation during Fe and Zn deficiencies.

4.6. Validation and Expression Correlation of DEGs

A total of 16 expression data points was validated using four genes through the qRT-PCR assay (Agilent Technologies, Santa Clara, CA, USA) (Table S5; Figure S2). The first-strand cDNA was synthesised from 250 ng of total RNA using an Affinity Script qRT-PCR cDNA synthesis kit (Stratagene, Agilent Technologies, Santa Clara, CA, USA). With the help of the IDT server [119], gene-specific primers were designed (Table S5). The qRT-PCR reaction was performed using Stratagene MX3005P (Agilent Technologies, Santa Clara, CA, USA) with the following PCR conditions: 10 min at 95 °C (preheating), followed by 40 cycles of amplification with denaturation for 30 s at 60 °C, primer annealing for 1 min at 58 °C and primer extension for 30 s at 72 °C [120,121].

5. Conclusions

The current investigation uncovered Fe and Zn-deficiency-responsive transcriptome signatures of transporters, phytohormone and carbohydrate metabolisms in maize. The Fe and Zn deficiencies altered the morpho-physiological and molecular responses through the differential expression of genes associated with phytohormonal regulations, transporters and photosynthesis. The result of the present investigation also revealed the dual regulation and anti-directional expression of key transporter genes suggesting something more than a direct/inverse association between Fe and Zn at transcriptome levels through regulatory proteins. Furthermore, the GRN analysis revealed the interactions among genes associated with hormone signalling and Fe and Zn transporters. The various DEGs regulating Fe and Zn homeostasis could be employed as candidate genes for enhancing Fe and Zn efficiency in maize through marker-assisted breeding, genetic engineering and genome editing approaches. Furthermore, this investigation sets the stage for the use of reverse genetic tools to analyse the stress-hormone signalling pathways and the interaction of various metabolic processes in the maize under Fe and Zn deficiencies and their interactions.

Supplementary Materials

The following are available online at https://www.mdpi.com/2223-7747/9/12/1812/s1, Figure S1. Initial and final chlorophyll content in the leaves of SKV616 maize inbred under complete (+Fe+Zn) hydroponic solution (*significant at p < 0.5); Figure S2. Correlation coefficients among morpho-physiological parameters under Fe and Zn stresses in maize. (CC: chlorophyll content (SPAD-value); PR: photosynthesis rate; TR: transpiration rate; SC: stomatal conductance; Fv/Fm: quantum efficiency of PS II photochemistry; and RL: Root length; **, *** significant at p < 0.01 and p < 0.001, respectively); Figure S3. Heatmap of differentially expressed transporters and mugineic acid pathways genes. The z-scores are computed for all genes that are differentially expressed with p < 0.05 and > 2-fold expression; Figure S4. Heatmap of differentially expressed phytohormonal metabolism genes. The z-scores are computed for all genes that are differentially expressed with p < 0.05 and > 2-fold expression; Figure S5. Heatmap of differentially expressed photosynthesis and carbohydrate metabolism genes. The z-scores are computed for all genes that are differentially expressed with p < 0.05 and > 2-fold expression; Table S1. Gene ontology terms for differentially expressed genes in the root and shoot under the –Zn, –Fe and –Fe–Zn treatments; Table S2. KEGG-enriched functional categories of differentially expressed genes in the root and shoot under –Zn, –Fe and –Fe–Zn stress treatments; Table S3. The predicted miRNA–gene and TF–gene interactions used to construct the gene regulatory network for the transporter and mugineic acid pathway genes; Table S4. The GRN features of the transporter and mugineic acid pathway genes; Table S5. Primer* sequences of DEGs selected from microarray analyses for qRT-PCR validation; Figure S6. Validation of DEGs from microarray analysis through qRT-PCR. The x axis represents the probes and the y axis represents the fold change expression values of genes. Error bars in the column represent the standard error. The letters ‘S’ and ‘R’ in the stress name on the x axis refer to the shoot and root, respectively. The reactions were performed using the Stratagene MX3005P (Agilent Technologies, Santa Clara, California, USA) Real-Time PCR system with the following PCR conditions: 10 min, at 95 °C (preheating), followed by 40 cycles of amplification with denaturation for 30 s at 60 °C, primer annealing for 1 min at 58 °C and primer extension for 30 s at 72 °C.

Author Contributions

H.S.G., N.T. and M.G.M. conceived and designed the experiments; M.G.M., K.S., N.T., F.H., J.S.B., and K.M.M. performed the experiments; M.G.M., R.S., A.C.R.M., S.S.M. and A.R.R. analysed the data; M.G.M., H.S.G. and N.T. contributed to manuscript preparation. All authors have read and agreed to the published version of the manuscript.

Funding

The experiment was funded by the National Agricultural Innovation Project (NAIP, Component IV), the ICAR Network Project on Transgenics in Crop Plants (Maize Functional Genomics Component) and DST grant (DST/INSPIRE/2011/IF110504). Bioinformatic analyses were supported by a network project on “Computational Biology and Agricultural Bioinformatics (Agril.Edn.14(44)/2014-A&P)”. The funding agencies had no role in the study design, data collection and analysis, the decision to publish, or the preparation of the manuscript.

Acknowledgments

We are thankful to the National Phytotron Facility, IARI, New Delhi, for extending the glasshouse facility for the experiment, and to the Division of Plant Pathology for providing GeneChip Fluidics service and Madan Pal, from the Division of Plant Physiology, for extending the IRGA instrument facility.

Conflicts of Interest

The authors declare that the research was conducted in the absence of any commercial or financial relationships that could be construed as a potential conflict of interest.

Data Availability

The raw microarray expression data files of the present study have been deposited in GEO (Accession No. GSE122581; Sample No. GSM3474993 to GSM3475016). All other supporting data are included as supplementary files.

References

  1. Mallikarjuna, M.G.; Thirunavukkarasu, N.; Hossain, F.; Bhat, J.S.; Jha, S.K.; Rathore, A.; Agrawal, P.K.; Pattanayak, A.; Reddy, S.S.; Gularia, S.K.; et al. Stability performance of inductively coupled plasma mass spectrometry-phenotyped kernel minerals concentration and grain yield in maize in different agro-climatic zones. PLoS ONE 2015, 10, e0139067. [Google Scholar] [CrossRef] [Green Version]
  2. Kobayashi, T.; Nozoye, T.; Nishizawa, N.K. Iron transport and its regulation in plants. Free Radic. Biol. Med. 2019, 133, 11–20. [Google Scholar] [CrossRef] [PubMed]
  3. Gupta, H.S.; Hossain, F.; Nepolean, T.; Vignesh, M.; Mallikarjuna, M.G. Understanding genetic and molecular bases of Fe and Zn accumulation towards development of micronutrient-enriched maize. In Nutrient Use Efficiency: From Basics to Advances; Rakshit, A., Singh, H., Sen, A., Eds.; Springer India: New Delhi, India, 2015; pp. 255–282. ISBN 9788132221692. [Google Scholar]
  4. Clemens, S. Molecular mechanisms of plant metal tolerance and homeostasis. Planta 2001, 212, 475–486. [Google Scholar] [CrossRef] [PubMed]
  5. Römheld, V.; Marschner, H. Evidence for a specific uptake system for iron phytosiderophores in roots of grasses. Plant Physiol. 1986, 80, 175–180. [Google Scholar] [CrossRef] [PubMed] [Green Version]
  6. Higuchi, K.; Suzuki, K.; Nakanishi, H.; Yamaguchi, H.; Nishizawa, N.K.; Mori, S. Cloning of nicotianamine synthase genes, novel genes involved in the biosynthesis of phytosiderophores. Plant Physiol. 1999, 119, 471–479. [Google Scholar] [CrossRef] [PubMed] [Green Version]
  7. Takahashi, M.; Yamaguchi, H.; Nakanishi, H.; Shioiri, T.; Nishizawa, N.K.; Mori, S. Cloning two genes for nicotianamine aminotransferase, a critical enzyme in iron acquisition (strategy II) in graminaceous plants. Plant Physiol. 1999, 121, 947–956. [Google Scholar] [CrossRef] [PubMed] [Green Version]
  8. Bashir, K.; Inoue, H.; Nagasaka, S.; Takahashi, M.; Nakanishi, H.; Mori, S.; Nishizawa, N.K. Cloning and characterization of deoxymugineic acid synthase genes from graminaceous plants. J. Biol. Chem. 2006, 281, 32395–32402. [Google Scholar] [CrossRef] [Green Version]
  9. Kawakami, Y.; Bhullar, N.K. Molecular processes in iron and zinc homeostasis and their modulation for biofortification in rice. J. Integr. Plant Biol. 2018, 60, 1181–1198. [Google Scholar] [CrossRef]
  10. Nozoye, T.; Nagasaka, S.; Kobayashi, T.; Takahashi, M.; Sato, Y.; Sato, Y.; Uozumi, N.; Nakanishi, H.; Nishizawa, N.K. Phytosiderophore efflux transporters are crucial for iron acquisition in graminaceous plants. J. Biol. Chem. 2011, 286, 5446–5454. [Google Scholar] [CrossRef] [Green Version]
  11. Nozoye, T.; Nagasaka, S.; Kobayashi, T.; Sato, Y.; Uozumi, N.; Nakanishi, H.; Nishizawa, N.K. The phytosiderophore efflux transporter TOM2 is involved in metal transport in rice. J. Biol. Chem. 2015, 290, 27688–27699. [Google Scholar] [CrossRef] [Green Version]
  12. Li, S.; Zhou, X.; Chen, J.; Chen, R. Is there a strategy I iron uptake mechanism in maize? Plant Signal. Behav. 2018, 13, 1–4. [Google Scholar] [CrossRef] [PubMed] [Green Version]
  13. Ramesh, S.A. Differential metal selectivity and gene expression of two zinc transporters from rice. Plant Physiol. 2003, 133, 126–134. [Google Scholar] [CrossRef] [PubMed] [Green Version]
  14. Hacisalihoglu, G. Zinc (Zn): The last nutrient in the alphabet and shedding light on zn efficiency for the future of crop production under suboptimal zn. Plants 2020, 9, 1471. [Google Scholar] [CrossRef] [PubMed]
  15. Marschner, H. Mineral Nutrition of Higher Plants, 2nd ed.; Academic Press: Cambridge, MA, USA, 1995; Volume 66, ISBN 9780124735439. [Google Scholar]
  16. Hacisalihoglu, G.; Hart, J.J.; Kochian, L.V. High- and low-affinity zinc transport systems and their possible role in zinc efficiency in bread wheat. Plant Physiol. 2001, 125, 456–463. [Google Scholar] [CrossRef] [PubMed] [Green Version]
  17. Guerinot, M. Lou The ZIP family of metal transporters. Biochim. Biophys. Acta Biomembr. 2000, 1465, 190–198. [Google Scholar] [CrossRef] [Green Version]
  18. Takahashi, R.; Bashir, K.; Ishimaru, Y.; Nishizawa, N.K.; Nakanishi, H. The role of heavy-metal ATPases, HMAs, in zinc and cadmium transport in rice. Plant Signal. Behav. 2012, 7, 1605–1607. [Google Scholar] [CrossRef]
  19. Ricachenevsky, F.K.; Menguer, P.K.; Sperotto, R.A.; Williams, L.E.; Fett, J.P. Roles of plant metal tolerance proteins (MTP) in metal storage and potential use in biofortification strategies. Front. Plant Sci. 2013, 4, 1–16. [Google Scholar] [CrossRef] [Green Version]
  20. Gupta, N.; Ram, H.; Kumar, B. Mechanism of Zinc absorption in plants: Uptake, transport, translocation and accumulation. Rev. Environ. Sci. Biotechnol. 2016, 15, 89–109. [Google Scholar] [CrossRef]
  21. Zhang, F.S.; Römheld, V.; Marschner, H.; Zhang, F.S. Diurnal rhythm of release of phytosiderophores and uptake rate of zinc in iron-deficient wheat. Soil Sci. Plant Nutr. 1991, 37, 671–678. [Google Scholar] [CrossRef]
  22. Waters, B.M.; Chu, H.-H.; DiDonato, R.J.; Roberts, L.A.; Eisley, R.B.; Lahner, B.; Salt, D.E.; Walker, E.L. Mutations in arabidopsis Yellow Stripe-Like1 and Yellow Stripe-Like3 reveal their roles in metal ion homeostasis and loading of metal ions in seeds. Plant Physiol. 2006, 141, 1446–1458. [Google Scholar] [CrossRef] [Green Version]
  23. Mallikarjuna, M.G.; Nepolean, T.; Mittal, S.; Hossain, F.; Bhat, J.S.; Manjaiah, K.M.; Marla, S.S.; Mithra, A.C.; Agrawal, P.K.; Rao, A.R.; et al. In-silico characterisation and comparative mapping of yellow stripe like transporters in five grass species. Indian J. Agric. Sci. 2016, 86, 721–727. [Google Scholar]
  24. Lin, Y.F.; Liang, H.M.; Yang, S.Y.; Boch, A.; Clemens, S.; Chen, C.C.; Wu, J.F.; Huang, J.L.; Yeh, K.C. Arabidopsis IRT3 is a zinc-regulated and plasma membrane localized zinc/iron transporter. New Phytol. 2009, 182, 392–404. [Google Scholar] [CrossRef] [PubMed]
  25. Yang, M.; Li, Y.; Liu, Z.; Tian, J.; Liang, L.; Qiu, Y.; Wang, G.; Du, Q.; Cheng, D.; Cai, H.; et al. A high activity zinc transporter OsZIP9 mediates zinc uptake in rice. Plant J. 2020, 103, 1695–1709. [Google Scholar] [CrossRef] [PubMed]
  26. Tan, L.; Qu, M.; Zhu, Y.; Peng, C.; Wang, J.; Gao, D.; Chen, C. ZINC TRANSPORTER 5 and ZINC TRANSPORTER 9 function synergistically in zinc/cadmium uptake. Plant Physiol. 2020, 183, 1235–1249. [Google Scholar] [CrossRef] [PubMed]
  27. Huang, S.; Sasaki, A.; Yamaji, N.; Okada, H.; Mitani-Ueno, N.; Ma, J.F. The ZIP transporter family member OsZIP9 contributes to root zinc uptake in rice under zinc-limited conditions. Plant Physiol. 2020, 183, 1224–1234. [Google Scholar] [CrossRef]
  28. Rogers, E.E.; Guerinot, M.L. FRD3, a member of the multidrug and toxin efflux family, controls iron deficiency responses in arabidopsis. Plant Cell 2002, 14, 1787–1799. [Google Scholar] [CrossRef] [Green Version]
  29. Inoue, H.; Takahashi, M.; Kobayashi, T.; Suzuki, M.; Nakanishi, H.; Mori, S.; Nishizawa, N.K. Identification and localisation of the rice nicotianamine aminotransferase gene OsNAAT1 expression suggests the site of phytosiderophore synthesis in rice. Plant Mol. Biol. 2008, 66, 193–203. [Google Scholar] [CrossRef]
  30. Curie, C.; Cassin, G.; Couch, D.; Divol, F.; Higuchi, K.; Le Jean, M.; Misson, J.; Schikora, A.; Czernic, P.; Mari, S. Metal movement within the plant: Contribution of nicotianamine and yellow stripe 1-like transporters. Ann. Bot. 2008, 103, 1–11. [Google Scholar] [CrossRef] [Green Version]
  31. Brown, J.C.; Chaney, R.L. Effect of iron on the transport of citrate into the xylem of soybeans and tomatoes. Plant Physiol. 1971, 47, 836–840. [Google Scholar] [CrossRef] [Green Version]
  32. Zheng, L.; Huang, F.; Narsai, R.; Wu, J.; Giraud, E.; He, F.; Cheng, L.; Wang, F.; Wu, P.; Whelan, J.; et al. Physiological and transcriptome analysis of iron and phosphorus interaction in rice seedlings. Plant Physiol. 2009, 151, 262–274. [Google Scholar] [CrossRef] [Green Version]
  33. Yang, T.J.W.; Lin, W.D.; Schmidt, W. Transcriptional profiling of the arabidopsis iron deficiency response reveals conserved transition metal homeostasis networks. Plant Physiol. 2010, 152, 2130–2141. [Google Scholar] [CrossRef] [PubMed] [Green Version]
  34. Li, Y.; Wang, N.; Zhao, F.; Song, X.; Yin, Z.; Huang, R.; Zhang, C. Changes in the transcriptomic profiles of maize roots in response to iron-deficiency stress. Plant Mol. Biol. 2014, 85, 349–363. [Google Scholar] [CrossRef] [PubMed]
  35. Zamboni, A.; Zanin, L.; Tomasi, N.; Avesani, L.; Pinton, R.; Varanini, Z.; Cesco, S. Early transcriptomic response to Fe supply in Fe-deficient tomato plants is strongly influenced by the nature of the chelating agent. BMC Genomics 2016, 17, 1–17. [Google Scholar] [CrossRef] [PubMed] [Green Version]
  36. Zanin, L.; Venuti, S.; Zamboni, A.; Varanini, Z.; Tomasi, N.; Pinton, R. Transcriptional and physiological analyses of Fe deficiency response in maize reveal the presence of strategy I components and Fe/P interactions. BMC Genomics 2017, 18, 1–15. [Google Scholar] [CrossRef] [Green Version]
  37. Mager, S.; Schönberger, B.; Ludewig, U. The transcriptome of zinc deficient maize roots and its relationship to DNA methylation loss. BMC Plant Biol. 2018, 18, 1–16. [Google Scholar] [CrossRef] [Green Version]
  38. Garnica, M.; Bacaicoa, E.; Mora, V.; San Francisco, S.; Baigorri, R.; Zamarreño, A.M.; Garcia-Mina, J.M. Shoot iron status and auxin are involved in iron deficiency-induced phytosiderophores release in wheat. BMC Plant Biol. 2018, 18, 1–14. [Google Scholar] [CrossRef]
  39. García, M.J.; Suárez, V.; Romera, F.J.; Alcántara, E.; Pérez-Vicente, R. A new model involving ethylene, nitric oxide and Fe to explain the regulation of Fe-acquisition genes in strategy I plants. Plant Physiol. Biochem. 2011, 49, 537–544. [Google Scholar] [CrossRef]
  40. Zhou, M.L.; Qi, L.P.; Pang, J.F.; Zhang, Q.; Lei, Z.; Tang, Y.X.; Zhu, X.M.; Shao, J.R.; Wu, Y.M. Nicotianamine synthase gene family as central components in heavy metal and phytohormone response in maize. Funct. Integr. Genomics 2013, 13, 229–239. [Google Scholar] [CrossRef]
  41. Wu, J.; Wang, C.; Zheng, L.; Wang, L.; Chen, Y.; Whelan, J.; Shou, H. Ethylene is involved in the regulation of iron homeostasis by regulating the expression of iron-acquisition-related genes in Oryza sativa. J. Exp. Bot. 2011, 62, 667–674. [Google Scholar] [CrossRef] [Green Version]
  42. Chen, W.W.; Yang, J.L.; Qin, C.; Jin, C.W.; Mo, J.H.; Ye, T.; Zheng, S.J. Nitric oxide acts downstream of auxin to trigger root ferric-chelate reductase activity in response to iron deficiency in arabidopsis. Plant Physiol. 2010, 154, 810–819. [Google Scholar] [CrossRef] [Green Version]
  43. García, M.J.; Lucena, C.; Romera, F.J.; Alcántara, E.; Pérez-Vicente, R. Ethylene and nitric oxide involvement in the up-regulation of key genes related to iron acquisition and homeostasis in Arabidopsis. J. Exp. Bot. 2010, 61, 3885–3899. [Google Scholar] [CrossRef] [PubMed]
  44. Sun, H.; Feng, F.; Liu, J.; Zhao, Q. The interaction between auxin and nitric oxide regulates root growth in response to iron deficiency in rice. Front. Plant Sci. 2017, 8, 1–14. [Google Scholar] [CrossRef] [PubMed]
  45. Liu, K.; Yue, R.; Yuan, C.; Liu, J.; Zhang, L.; Sun, T.; Yang, Y.; Tie, S.; Shen, C. Auxin signaling is involved in iron deficiency-induced photosynthetic inhibition and shoot growth defect in rice (Oryza sativa L.). J. Plant Biol. 2015, 58, 391–401. [Google Scholar] [CrossRef]
  46. Bouain, N.; Shahzad, Z.; Rouached, A.; Khan, G.A.; Berthomieu, P.; Abdelly, C.; Poirier, Y.; Rouached, H. Phosphate and zinc transport and signalling in plants: Toward a better understanding of their homeostasis interaction. J. Exp. Bot. 2014, 65, 5725–5741. [Google Scholar] [CrossRef] [PubMed] [Green Version]
  47. Conte, S.S.; Walker, E.L. Transporters contributing to iron trafficking in plants. Mol. Plant 2011, 4, 464–476. [Google Scholar] [CrossRef] [PubMed] [Green Version]
  48. Balk, J.; Schaedler, T.A. Iron cofactor asembly in plants. Annu. Rev. Plant Biol. 2014, 65, 125–153. [Google Scholar] [CrossRef] [PubMed]
  49. Cakmak, I.; Marschner, H.; Bangerth, F. Effect of zinc nutritional status on growth, protein metabolism and levels of indole-3-acetic acid and other phytohormones in bean (Phaseolus vulgaris L.). J. Exp. Bot. 1989, 40, 405–412. [Google Scholar] [CrossRef]
  50. Ivanchenko, M.G.; Muday, G.K.; Dubrovsky, J.G. Ethylene-auxin interactions regulate lateral root initiation and emergence in Arabidopsis thaliana. Plant J. 2008, 55, 335–347. [Google Scholar] [CrossRef]
  51. Luo, J.; Zhou, J.J.; Zhang, J.Z. Aux/IAA gene family in plants: Molecular structure, regulation, and function. Int. J. Mol. Sci. 2018, 19, 259. [Google Scholar] [CrossRef] [Green Version]
  52. Nakamura, A.; Umemura, I.; Gomi, K.; Hasegawa, Y.; Kitano, H.; Sazuka, T.; Matsuoka, M. Production and characterization of auxin-insensitive rice by overexpression of a mutagenized rice IAA protein. Plant J. 2006, 46, 297–306. [Google Scholar] [CrossRef]
  53. Zhang, Z.; Li, J.; Tang, Z.; Sun, X.; Zhang, H.; Yu, J.; Yao, G.; Li, G.; Guo, H.; Li, J.; et al. Gnp4/LAX2, a RAWUL protein, interferes with the OsIAA3–OsARF25 interaction to regulate grain length via the auxin signaling pathway in rice. J. Exp. Bot. 2018, 69, 4723–4737. [Google Scholar] [CrossRef] [PubMed]
  54. Arase, F.; Nishitani, H.; Egusa, M.; Nishimoto, N.; Sakurai, S.; Sakamoto, N.; Kaminaka, H. IAA8 involved in lateral root formation interacts with the TIR1 auxin receptor and ARF transcription factors in Arabidopsis. PLoS ONE 2012, 7. [Google Scholar] [CrossRef] [PubMed] [Green Version]
  55. Jing, H.; Strader, L.C. Interplay of auxin and cytokinin in lateral root development. Int. J. Mol. Sci. 2019, 20, 486. [Google Scholar] [CrossRef] [PubMed] [Green Version]
  56. Li, X.; Mo, X.; Shou, H.; Wu, P. Cytokinin-mediated cell cycling arrest of pericycle founder cells in lateral root initiation of arabidopsis. Plant Cell Physiol. 2006, 47, 1112–1123. [Google Scholar] [CrossRef] [PubMed] [Green Version]
  57. Werner, T.; Motyka, V.; Strnad, M.; Schmülling, T. Regulation of plant growth by cytokinin. Proc. Natl. Acad. Sci. USA 2001, 98, 10487–10492. [Google Scholar] [CrossRef] [Green Version]
  58. Werner, T.; Motyka, V.; Laucou, V.; Smets, R.; Van Onckelen, H.; Schmülling, T. Cytokinin-deficient transgenic arabidopsis plants show multiple developmental alterations indicating opposite functions of cytokinins in the regulation of shoot and root meristem activity. Plant Cell 2003, 15, 2532–2550. [Google Scholar] [CrossRef] [Green Version]
  59. Chang, L.; Ramireddy, E.; Schmülling, T. Cytokinin as a positional cue regulating lateral root spacing in Arabidopsis. J. Exp. Bot. 2015, 66, 4759–4768. [Google Scholar] [CrossRef] [Green Version]
  60. Mahonen, A.P. Cytokinin signaling and its inhibitor AHP6 regulate cell fate during cascular development. Science 2006, 311, 94–98. [Google Scholar] [CrossRef]
  61. Shi, Q.; Dong, Y.; Qiao, D.; Wang, Q.; Ma, Z.; Zhang, F.; Zhou, Q.; Xu, H.; Deng, F.; Li, Y. Isolation and characterization of ZmERF1 encoding ethylene responsive factor-like protein 1 in popcorn (Zea mays L.). Plant Cell Tissue Organ Cult. 2015, 120, 747–756. [Google Scholar] [CrossRef]
  62. Zhang, Z.; Huang, R. Enhanced tolerance to freezing in tobacco and tomato overexpressing transcription factor TERF2/LeERF2 is modulated by ethylene biosynthesis. Plant Mol. Biol. 2010, 73, 241–249. [Google Scholar] [CrossRef]
  63. Street, I.H.; Aman, S.; Zubo, Y.; Ramzan, A.; Wang, X.; Shakeel, S.N.; Kieber, J.J.; Eric Schaller, G. Ethylene inhibits cell proliferation of the arabidopsis root meristem. Plant Physiol. 2015, 169, 338–350. [Google Scholar] [CrossRef] [PubMed] [Green Version]
  64. Vaseva, I.I.; Qudeimat, E.; Potuschak, T.; Du, Y.; Genschik, P.; Vandenbussche, F.; Van Der Straeten, D. The plant hormone ethylene restricts Arabidopsis growth via the epidermis. Proc. Natl. Acad. Sci. USA 2018, 115, E4130–E4139. [Google Scholar] [CrossRef] [PubMed] [Green Version]
  65. Li, J.; Zhao, Y.; Chu, H.; Wang, L.; Fu, Y.; Liu, P.; Upadhyaya, N.; Chen, C.; Mou, T.; Feng, Y.; et al. SHOEBOX modulates root meristem size in rice through dose-dependent effects of gibberellins on cell elongation and proliferation. PLoS Genet. 2015, 11, e1005464. [Google Scholar] [CrossRef] [PubMed]
  66. Shimada, A.; Ueguchi-Tanaka, M.; Nakatsu, T.; Nakajima, M.; Naoe, Y.; Ohmiya, H.; Kato, H.; Matsuoka, M. Structural basis for gibberellin recognition by its receptor GID1. Nature 2008, 456, 520–523. [Google Scholar] [CrossRef] [PubMed]
  67. Wang, B.; Wei, H.; Xue, Z.; Zhang, W.H. Gibberellins regulate iron deficiency-response by influencing iron transport and translocation in rice seedlings (Oryza sativa). Ann. Bot. 2017, 119, 945–956. [Google Scholar] [CrossRef] [PubMed] [Green Version]
  68. Sekimoto, H.; Hoshi, M.; Nomura, T.; Yokota, T. Zinc deficiency affects the levels of endogenous gibberellins in Zea mays L. Plant Cell Physiol. 1997, 38, 1087–1090. [Google Scholar] [CrossRef]
  69. Schöttler, M.A.; Tóth, S.Z.; Boulouis, A.; Kahlau, S. Photosynthetic complex stoichiometry dynamics in higher plants: Biogenesis, function, and turnover of ATP synthase and the cytochrome b6f complex. J. Exp. Bot. 2015, 66, 2373–2400. [Google Scholar] [CrossRef]
  70. Grouneva, I.; Gollan, P.J.; Kangasjärvi, S.; Suorsa, M.; Tikkanen, M.; Aro, E.M. Phylogenetic viewpoints on regulation of light harvesting and electron transport in eukaryotic photosynthetic organisms. Planta 2013, 237, 399–412. [Google Scholar] [CrossRef] [Green Version]
  71. Krohling, C.A.; Eutrópio, F.J.; Bertolazi, A.A.; Dobbss, L.B.; Campostrini, E.; Dias, T.; Ramos, A.C. Ecophysiology of iron homeostasis in plants. Soil Sci. Plant Nutr. 2016, 62, 39–47. [Google Scholar] [CrossRef] [Green Version]
  72. Escudero-Almanza, D.J.; Ojeda-Barrios, D.L.; Hernández-Rodríguez, O.A.; Sánchez Chávez, E.; Ruíz-Anchondo, T.; Sida-Arreola, J.P. Carbonic anhydrase and zinc in plant physiology. Chil. J. Agric. Res. 2012, 72, 140–146. [Google Scholar] [CrossRef] [Green Version]
  73. Muneer, S.; Ryong, B. Silicon decreases Fe deficiency responses by improving photosynthesis and maintaining composition of thylakoid multiprotein complex proteins in soybean plants (Glycine max L.). J. Plant Growth Regul. 2015, 34, 485–498. [Google Scholar] [CrossRef]
  74. Andaluz, S.; López-Millán, A.-F.; De las Rivas, J.; Aro, E.-M.; Abadía, J.; Abadía, A. Proteomic profiles of thylakoid membranes and changes in response to iron deficiency. Photosynth. Res. 2006, 89, 141–155. [Google Scholar] [CrossRef] [PubMed] [Green Version]
  75. Higuchi, K.; Saito, A.; Mikami, Y.; Miwa, E. Modulation of macronutrient metabolism in barley leaves under iron-deficient condition. Soil Sci. Plant Nutr. 2011, 57, 233–247. [Google Scholar] [CrossRef] [Green Version]
  76. López-Millán, A.F.; Grusak, M.A.; Abadía, A.; Abadía, J. Iron deficiency in plants: An insight from proteomic approaches. Front. Plant Sci. 2013, 4, 1–7. [Google Scholar] [CrossRef] [PubMed] [Green Version]
  77. Briat, J.F.; Curie, C.; Gaymard, F. Iron utilization and metabolism in plants. Curr. Opin. Plant Biol. 2007, 10, 276–282. [Google Scholar] [CrossRef] [PubMed]
  78. Kesten, C.; Menna, A.; Sánchez-Rodríguez, C. Regulation of cellulose synthesis in response to stress. Curr. Opin. Plant Biol. 2017, 40, 106–113. [Google Scholar] [CrossRef]
  79. Kurek, I.; Kawagoe, Y.; Jacob-Wilk, D.; Doblin, M.; Delmer, D. Dimerization of cotton fiber cellulose synthase catalytic subunits occurs via oxidation of the zinc-binding domains. Proc. Natl. Acad. Sci. USA 2002, 99, 11109–11114. [Google Scholar] [CrossRef] [Green Version]
  80. Lin, X.Y.; Ye, Y.Q.; Fan, S.K.; Jin, C.W.; Zheng, S.J. Increased sucrose accumulation regulates iron-deficiency responses by promoting auxin signaling in Arabidopsis plants. Plant Physiol. 2016, 170, 907–920. [Google Scholar] [CrossRef] [Green Version]
  81. Kobayashi, T. Understanding the complexity of iron sensing and signaling cascades in plants. Plant Cell Physiol. 2019, 60, 1440–1446. [Google Scholar] [CrossRef]
  82. Nozoye, T. The nicotianamine synthase gene is a useful candidate for improving the nutritional qualities and Fe-deficiency tolerance of various crops. Front. Plant Sci. 2018, 9, 1–7. [Google Scholar] [CrossRef]
  83. Mizuno, D.; Higuchi, K.; Sakamoto, T.; Nakanishi, H.; Mori, S.; Nishizawa, N.K. Three nicotianamine synthase genes isolated from maize are differentially regulated by iron nutritional status. Plant Physiol. 2003, 132, 1989–1997. [Google Scholar] [CrossRef] [PubMed] [Green Version]
  84. Klatte, M.; Schuler, M.; Wirtz, M.; Fink-Straube, C.; Hell, R.; Bauer, P. The analysis of arabidopsis nicotianamine synthase mutants reveals functions for nicotianamine in seed iron loading and iron deficiency responses. Plant Physiol. 2009, 150, 257–271. [Google Scholar] [CrossRef] [PubMed] [Green Version]
  85. Curie, C.; Alonso, J.M.; Le Jean, M.; Ecker, J.R.; Briat, J.F. Involvement of NRAMP1 from Arabidopsis thaliana in iron transport. Biochem. J. 2000, 347, 749–755. [Google Scholar] [CrossRef] [PubMed]
  86. Castaings, L.; Caquot, A.; Loubet, S.; Curie, C. The high-affinity metal transporters NRAMP1 and IRT1 team up to take up iron under sufficient metal provision. Sci. Rep. 2016, 6, 1–11. [Google Scholar] [CrossRef] [PubMed] [Green Version]
  87. Xiong, H.; Kobayashi, T.; Kakei, Y.; Senoura, T.; Nakazono, M.; Takahashi, H.; Nakanishi, H.; Shen, H.; Duan, P.; Guo, X.; et al. AhNRAMP1 iron transporter is involved in iron acquisition in peanut. J. Exp. Bot. 2012, 63, 4437–4446. [Google Scholar] [CrossRef] [PubMed] [Green Version]
  88. Tiwari, M.; Sharma, D.; Dwivedi, S.; Singh, M.; Tripathi, R.D.; Trivedi, P.K. Expression in Arabidopsis and cellular localization reveal involvement of rice NRAMP, OsNRAMP1, in arsenic transport and tolerance. Plant Cell Environ. 2014, 37, 140–152. [Google Scholar] [CrossRef]
  89. Rellán-Álvarez, R.; Giner-Martínez-Sierra, J.; Orduna, J.; Orera, I.; Rodríguez-Castrilln, J.Á.; García-Alonso, J.I.; Abadía, J.; Álvarez-Fernández, A. Identification of a tri-Iron(III), tri-citrate complex in the xylem sap of iron-deficient tomato resupplied with iron: New insights into plant iron long-distance transport. Plant Cell Physiol. 2010, 51, 91–102. [Google Scholar] [CrossRef] [Green Version]
  90. Saridis, G.; Chorianopoulou, S.N.; Ventouris, Y.E.; Bouranis, D.L.; Sigalas, P.P. An exploration of the roles of ferric iron chelation-strategy components in the leaves and roots of maize plants. Plants 2019, 8, 133. [Google Scholar] [CrossRef] [Green Version]
  91. Brown, J.C. Fe and Ca uptake as related to root-sap and stem-exudate citrate in soybeans. Physiol. Plant. 1966, 19, 968–976. [Google Scholar] [CrossRef]
  92. Lopez-Millan, A.F.; Morales, F.; Abadia, A.; Abadia, J. Effects of iron deficiency on the composition of the leaf apoplastic fluid and xylem sap in sugar beet. Implications for iron and carbon transport. Plant Physiol. 2000, 124, 873–884. [Google Scholar] [CrossRef] [Green Version]
  93. Ariga, T.; Hazama, K.; Yanagisawa, S.; Yoneyama, T. Chemical forms of iron in xylem sap from graminaceous and non-graminaceous plants. Soil Sci. Plant Nutr. 2014, 60, 460–469. [Google Scholar] [CrossRef] [Green Version]
  94. Salt, D.E.; Prince, R.C.; Baker, A.J.M.; Raskin, I.; Pickering, I.J. Zinc ligands in the metal hyperaccumulator Thlaspi caerulescens as determined using x-ray absorption spectroscopy. Environ. Sci. Technol. 1999, 33, 713–717. [Google Scholar] [CrossRef]
  95. Yang, J.; Wang, M.; Li, W.; He, X.; Teng, W.; Ma, W.; Zhao, X.; Hu, M.; Li, H.; Zhang, Y.; et al. Reducing expression of a nitrate-responsive bZIP transcription factor increases grain yield and N use in wheat. Plant Biotechnol. J. 2019, 1, 1–11. [Google Scholar] [CrossRef] [PubMed]
  96. Li, S.; Liu, X.; Zhou, X.; Li, Y.; Yang, W.; Chen, R. Improving zinc and iron accumulation in maize grains using the zinc and iron transporter ZmZIP5. Plant Cell Physiol. 2019, 60, 2077–2085. [Google Scholar] [CrossRef]
  97. Thomine, S.; Lelièvre, F.; Debarbieux, E.; Schroeder, J.I.; Barbier-Brygoo, H. AtNRAMP3, a multispecific vacuolar metal transporter involved in plant responses to iron deficiency. Plant J. 2003, 34, 685–695. [Google Scholar] [CrossRef]
  98. Lanquar, V.; Lelièvre, F.; Bolte, S.; Hamès, C.; Alcon, C.; Neumann, D.; Vansuyt, G.; Curie, C.; Schröder, A.; Krämer, U.; et al. Mobilization of vacuolar iron by AtNRAMP3 and AtNRAMP4 is essential for seed germination on low iron. EMBO J. 2005, 24, 4041–4051. [Google Scholar] [CrossRef]
  99. Barrieu, F.; Chaumont, F.; Chrispeels, M.J. High expression of the tonoplast aquaporin ZmTIP1 in epidermal and conducting tissues of maize. Plant Physiol. 1998, 117, 1153–1163. [Google Scholar] [CrossRef] [Green Version]
  100. Martinoia, E.; Maeshima, M.; Neuhaus, H.E. Vacuolar transporters and their essential role in plant metabolism. J. Exp. Bot. 2007, 58, 83–102. [Google Scholar] [CrossRef]
  101. Shen, C.; Yue, R.; Sun, T.; Zhang, L.; Yang, Y.; Wang, H. OsARF16, a transcription factor regulating auxin redistribution, is required for iron deficiency response in rice (Oryza sativa L.). Plant Sci. 2015, 231, 148–158. [Google Scholar] [CrossRef]
  102. Jagadeeswaran, G.; Li, Y.F.; Sunkar, R. Redox signaling mediates the expression of a sulfate-deprivation-inducible microRNA395 in arabidopsis. Plant J. 2014, 77, 85–96. [Google Scholar] [CrossRef] [Green Version]
  103. Lewis, B.E.; Mason, Z.; Rodrigues, A.V.; Nuth, M.; Dizin, E.; Cowan, J.A.; Stemmler, T.L. Unique roles of iron and zinc binding to the yeast Fe-S cluster scaffold assembly protein “Isu1. ” Metallomics 2019, 11, 1820–1835. [Google Scholar] [CrossRef] [PubMed]
  104. Kong, W.W.; Yang, Z.M. Identification of iron-deficiency responsive microRNA genes and cis-elements in Arabidopsis. Plant Physiol. Biochem. 2010, 48, 153–159. [Google Scholar] [CrossRef] [PubMed]
  105. Thirugnanasambantham, K.; Durairaj, S.; Saravanan, S.; Karikalan, K.; Muralidaran, S.; Islam, V.I.H. Role of ethylene response transcription factor (ERF) and its regulation in response to stress encountered by plants. Plant Mol. Biol. Report. 2015, 33, 347–357. [Google Scholar] [CrossRef]
  106. Parry, G.; Estelle, M. Auxin receptors: A new role for F-box proteins. Curr. Opin. Cell Biol. 2006, 18, 152–156. [Google Scholar] [CrossRef] [PubMed]
  107. Mallikarjuna, M.G.; Nepolean, T.; Hossain, F.; Manjaiah, K.M.; Singh, A.M.; Gupta, H.S. Genetic variability and correlation of kernel micronutrients among exotic quality protein maize inbreds and their utility in breeding programme. Indian J. Genet. Plant Breed. 2014, 74, 166–173. [Google Scholar] [CrossRef]
  108. Nozoye, T.; Nakanishi, H.; Nishizawa, N.K. Characterizing the crucial components of iron homeostasis in the maize mutants ys1 and ys3. PLoS ONE 2013, 8, e62567. [Google Scholar] [CrossRef] [Green Version]
  109. Brazma, A.; Hingamp, P.; Quackenbush, J.; Sherlock, G.; Spellman, P.; Stoeckert, C.; Aach, J.; Ansorge, W.; Ball, C.A.; Causton, H.C.; et al. Minimum information about a microarray experiment (MIAME) - Toward standards for microarray data. Nat. Genet. 2001, 29, 365–371. [Google Scholar] [CrossRef]
  110. Gentile, A.; Dias, L.I.; Mattos, R.S.; Ferreira, T.H.; Menossi, M. MicroRNAs and drought responses in sugarcane. Front. Plant Sci. 2015, 6, 58. [Google Scholar] [CrossRef] [Green Version]
  111. Wu, Z.; Irizarry, R.A.; Gentleman, R.; Martinez-Murillo, F.; Spencer, F. A model-based background adjustment for oligonucleotide expression arrays. J. Am. Stat. Assoc. 2004, 99, 909–917. [Google Scholar] [CrossRef] [Green Version]
  112. Kauffmann, A.; Gentleman, R.; Huber, W. arrayQualityMetrics - A bioconductor package for quality assessment of microarray data. Bioinformatics 2009, 25, 415–416. [Google Scholar] [CrossRef] [Green Version]
  113. Smyth, G.K. limma: Linear models for microarray data. In Bioinformatics and Computational Biology Solutions Using R and Bioconductor; Springer-Verlag: New York, NY, USA, 2005; pp. 397–420. ISBN 1431-8776. [Google Scholar]
  114. Tello-Ruiz, M.K.; Naithani, S.; Stein, J.C.; Gupta, P.; Campbell, M.; Olson, A.; Wei, S.; Preece, J.; Geniza, M.J.; Jiao, Y.; et al. Gramene 2018: Unifying comparative genomics and pathway resources for plant research. Nucleic Acids Res. 2018, 46, D1181–D1189. [Google Scholar] [CrossRef] [PubMed] [Green Version]
  115. Ge, S.X.; Jung, D.; Jung, D.; Yao, R. ShinyGO: A graphical gene-set enrichment tool for animals and plants. Bioinformatics 2020, 36, 2628–2629. [Google Scholar] [CrossRef] [PubMed]
  116. Jin, J.; Tian, F.; Yang, D.C.; Meng, Y.Q.; Kong, L.; Luo, J.; Gao, G. PlantTFDB 4.0: Toward a central hub for transcription factors and regulatory interactions in plants. Nucleic Acids Res. 2017, 45, D1040–D1045. [Google Scholar] [CrossRef] [PubMed] [Green Version]
  117. Dai, X.; Zhuang, Z.; Zhao, P.X. PsRNATarget: A plant small RNA target analysis server (2017 release). Nucleic Acids Res. 2018, 46, W49–W54. [Google Scholar] [CrossRef] [PubMed] [Green Version]
  118. Shannon, P.; Markiel, A.; Ozier, O.; Baliga, N.S.; Wang, J.T.; Ramage, D.; Amin, N.; Schwikowski, B.; Idekar, T. Cytoscape: A software environment for integrated models of biomolecular interaction networks. Genome Res. 2003, 13, 2498–2504. [Google Scholar] [CrossRef] [PubMed]
  119. IDT Server. Available online: https://www.idtdna.com (accessed on 10 April 2018).
  120. Thirunavukkarasu, N.; Hossain, F.; Mohan, S.; Shiriga, K.; Mittal, S.; Sharma, R.; Singh, R.K.; Gupta, H.S. Genome-wide expression of transcriptomes and their co-expression pattern in subtropical maize (Zea mays L.) under waterlogging stress. PLoS ONE 2013, 8, e70433. [Google Scholar] [CrossRef] [Green Version]
  121. Van Gioi, H.; Mallikarjuna, M.G.; Shikha, M.; Pooja, B.; Jha, S.K.; Dash, P.K.; Basappa, A.M.; Gadag, R.N.; Rao, A.R.; Nepolean, T. Variable level of dominance of candidate genes controlling drought functional traits in maize hybrids. Front. Plant Sci. 2017, 8. [Google Scholar] [CrossRef] [Green Version]
Figure 1. Phenotypic expression of 19 days-old maize SKV616 seedlings in response to 12 days exposure to Zn and Fe deficiencies (–Zn, –Fe and –Fe–Zn): (A) whole plant; (B) leaves; and (C) roots.
Plants 09 01812 g001
Figure 2. The morpho-physiological response of maize seedlings to –Zn, –Fe and –Fe–Zn deficiencies at 12 days after transplanting (DAT): (A) change in the chlorophyll content (soil plant analysis development (SPAD) value) of the leaves in response to the (B) transpiration rate; (C) stomatal conductance; (D) photosynthesis rate; (E) quantum efficiency of PS II photochemistry (Fv/Fm); and (F) root length (*, **, *** significant at p < 0.05, p < 0.01 and p < 0.001, respectively; NS: non-significant).
Plants 09 01812 g002
Figure 3. The overview of the spatial transcriptome responses to Fe and Zn stresses in the maize inbred line of SKV616 seedlings. The genes showing > 2-fold expression under stress treatments and p < 0.05 are considered as differentially expressed genes (DEGs) in stress treatments as compared to the control: (A) total number of upregulated and downregulated genes in response to –Zn, –Fe and –Fe–Zn stresses in the root and shoot; and (B) the Venn diagram depicting the stress-specific and common DEGs in response to –Zn, –Fe and –Zn–Fe stresses in the root and shoot tissues.
Plants 09 01812 g003
Figure 4. Functional gene ontology annotations of differentially expressed genes (DEGs) under Fe and Zn stresses in the root: (A) –Zn; (B) –Fe; and (C) –Fe–Zn. For graphical representation, we have the top 15 significant terms under each category viz., biological process (blue), cellular component (orange), and molecular function (green). The complete list of terms along with significance of false discovery rate (FDR) < 0.05 are mentioned in Table S1.
Plants 09 01812 g004
Figure 5. Functional gene ontology annotations of differentially expressed genes (DEGs) under Fe and Zn stresses in the shoot: (A)–Zn; (B)–Fe; and (C)–Fe–Zn. For graphical representation, we have the top 15 significant terms under each category viz., biological process (blue), cellular component (orange), and molecular function (green). The complete list of terms along with the significance of FDR < 0.05 are mentioned in the Table S1.
Plants 09 01812 g005
Figure 6. The clustering of KEGG-enriched functional categories of DEGs in the root and shoot under Fe and Zn stresses: (A) –Zn in root; (B) –Fe in root; (C) –Fe–Zn in the root; (D). –Zn in the shoot; (E) –Fe in shoot; and (F) –Fe–Zn in shoot.
Plants 09 01812 g006
Figure 7. The transcription factors (TFs) and miRNAs mediated the regulation of differentially expressed transporters under Fe and Zn deficiency in maize: the regulatory network is characterized by 148 miRNA–target gene and 306 TF–target genes interactions. The green triangles represent the TFs, the red ovals represent the target transporters and mugineic acid pathway genes, and the blue diamonds represent miRNAs.
Plants 09 01812 g007
Table 1. Differential expression of genes associated with the mugineic acid pathway, transporters, phytohormones, photosynthesis and carbohydrate metabolism in response to –Zn, –Fe and –Zn–Fe stresses in the root and shoot tissues. A minimum of a 2-fold change with p < 0.05 were considered for further analysis. The grey colour values indicate a non-significant p-value. Positive and negative values indicate increases and decreases in gene expression, respectively.
S. No.Gene ModelsProbe IDFold ChangeAnnotation
RootShoot
–Zn–Fe–Fe–Zn–Zn–Fe–Fe–Zn
Transporters and Mugineic Acid Pathway
1GRMZM2G142870Zm.17901.1.S1_at2.091.1815.461.93−0.74−1.21ABC transporter C family member 14
2GRMZM2G015295Zm.10189.1.A1_at2.10−1.23−9.121.257.5130.81Adenosylhomocysteinase
3GRMZM5G843141ZmAffx.1313.1.S1_s_at1.132.65−1.772.062.802.83ATP synthase subunit alpha (atp1-a2)
4GRMZM2G036908Zm.15922.1.S1_at−1.13−2.3810.631.53−2.48−6.57Cation transmembrane transporter
5GRMZM5G862882Zm.18006.1.A1_at2.143.717.692.03−1.37−6.30Cation transmembrane transporter
6GRMZM2G064023Zm.5927.2.A1_a_at3.041.031.92−1.266.895.41Citrate synthase 2
7GRMZM2G157263Zm.3964.1.A1_a_at2.352.452.831.442.713.46Ferric-chelate reductase
8GRMZM2G123486Zm.4621.1.A1_at−4.04−3.91−3.581.17−1.072.00Heavy metal transport/detoxification superfamily protein
9GRMZM2G178190Zm.13647.1.S1_at−1.235.077.22−3.762.10−3.66Metal ion transmembrane transporter activity
10GRMZM2G122437Zm.6067.2.A1_at−2.54−2.33−14.221.59−1.349.14Metal ion transporter
11GRMZM2G099340Zm.1356.2.S1_a_at−1.40−3.907.202.742.152.99Metallothionein-like protein type 2
12GRMZM2G131473Zm.4989.1.A1_at1.85−1.051.48−1.236.148.11Methionine aminopeptidase
13GRMZM2G015401Zm.198.1.S1_at2.78−1.45−1.931.083.4610.28Mitochondrial phosphate transporter
14GRMZM2G034956Zm.8336.1.S1_x_at1.024.98−1.291.06−1.011.97Nicotianamine synthase 1
15GRMZM2G050108Zm.9637.1.A1_at2.07−2.3120.781.35−1.18−100.67Nicotianamine synthase 3
16GRMZM2G069198Zm.12619.1.A1_at3.151.567.282.343.381.67NRAMP transporter1
17GRMZM5G827496Zm.17744.1.A1_at−2.581.0710.361.203.93−14.55NRT1/ PTR family 3.1
18GRMZM2G567452Zm.10825.1.A2_at1.341.141.422.912.541.56O-methyltransferase
19GRMZM2G148800Zm.19137.1.A1_at−1.046.7225.37−48.72−0.75−126.24Oligopeptide transmembrane transporter
20GRMZM2G092125Zm.605.1.S1_a_at2.07−1.85−4.81−1.027.213.86Plasma membrane intrinsic protein 2
21GRMZM2G014914Zm.14436.1.A1_at−1.70−1.45−1.611.3718.028.85Plasma membrane intrinsic protein 2
22GRMZM2G099628Zm.15800.5.A1_a_at1.83−2.40−2.35−1.0615.8326.41Probable methionine-tRNA ligase
23GRMZM2G104418Zm.12750.2.A1_x_at1.16−1.67−1.251.0519.238.65Proton-transporting V-type ATPase, V0 domain
24GRMZM2G070605Zm.14951.4.S1_at1.992.262.77−1.336.682.82S-adenosylmethionine decarboxylase proenzyme
25GRMZM2G054123Zm.5785.1.S1_at1.15−1.17−1.57−1.323.929.42S-adenosylmethionine synthetase 1
26Zm.9197.1.A1_at−2.23−1.61−2.50−1.166.863.34Tonoplast intrinsic protein 1
27GRMZM2G027098Zm.613.1.A1_at−2.26−6.54−4.773.911.704.49Tonoplast intrinsic protein 2
28GRMZM2G056908Zm.614.1.A1_at−2.27−9.93−636.101.62−1.29120.97Tonoplast intrinsic protein 2
29GRMZM2G070360Zm.3314.2.A1_a_at1.911.442.891.1821.506.22V-type proton ATPase subunit E3
30GRMZM2G094497Zm.6859.1.A1_at1.501.051.00−1.239.842.00Vacuolar ATP synthase subunit B
31GRMZM2G421857Zm.6945.1.A1_at2.01−1.227.50−2.4019.022.91Vacuolar proton pump 3
32GRMZM2G128995Zm.4630.2.A1_a_at1.48−1.321.431.2411.897.92Vacuolar proton-transporting V-type ATPase, V1 domain
33GRMZM2G126860Zm.12751.1.S1_at1.12−1.151.93−1.135.052.05Vacuolar sorting protein 4b
34GRMZM2G067546Zm.3321.1.A1_a_at1.331.234.311.898.574.03Vacuolar sorting receptor homolog 1
35GRMZM2G156599Zm.582.1.S1_at−2.128.5535.45−10.902.09−38.26Yellow stripe 1
36GRMZM2G015955Zm.13452.2.A1_at1.641.2610.593.621.191.39Zinc transporter 4
37GRMZM2G064382Zm.18511.1.S1_at5.531.153.858.72-1.82-4.10ZRT-IRT-like protein 5
Phytohormonal Metabolism
1GRMZM2G074267Zm.7858.1.A1_at−1.25−3.48−5.351.26−1.503.40Auxin efflux carrier component PIN1bA: J
2GRMZM2G427451Zm.16735.1.A1_at1.57−1.96−99.75−1.304.24112.22Auxin induced in root cultures 12
3GRMZM2G035465Zm.2321.2.A1_a_at2.081.329.133.871.03−1.35Auxin-responsive protein
4GRMZM2G077356Zm.4896.1.A1_at1.30−2.17−9.122.591.309.07Auxin-responsive Aux/IAA family member IAA 13
5GRMZM2G147243Zm.2321.3.A1_a_at1.801.1910.431.4041.1911.45Auxin-responsive Aux/IAA family member IAA 17
6GRMZM2G115354Zm.7611.2.A1_at2.06−1.012.131.401.57−1.17Auxin-responsive Aux/IAA family member IAA 24
7GRMZM2G141903Zm.5181.2.A1_a_at2.39−1.235.461.1510.646.42CK2 protein kinase alpha 2
8GRMZM2G050997Zm.9754.1.A1_at2.39−1.1221.32−1.101.67−32.91Cytokinin oxidase 2
9GRMZM2G167220Zm.16971.1.A1_at1.002.0111.57−3.13−1.09−23.68Cytokinin oxidase 3
10GRMZM2G167220Zm.16971.1.A1_s_at1.875.1223.03−2.88−1.12−35.98Cytokinin oxidase 3
11GRMZM2G041699Zm.15533.1.S1_at−1.54−2.01−1.93−4.77−2.15−5.99Cytokinin-O-glucosyltransferase 2
12GRMZM2G065694Zm.13139.1.A1_a_at−1.11−2.273.401.17−1.58−4.02EREBP-4 like protein
13GRMZM2G025062Zm.10181.1.A1_at−4.27−8.86−8.921.85−1.23−1.07ERF-like protein
14GRMZM2G102601Zm.14806.1.A1_at1.26−2.121.431.465.503.43Ethylene receptor
15GRMZM2G052667Zm.6775.1.A1_at1.462.863.612.511.26−2.48Ethylene response factor
16GRMZM2G053503Zm.11441.1.S1_at−1.43−2.61−4.86−4.02−4.16−5.74Ethylene-responsive factor-like protein 1
17GRMZM5G831102Zm.8468.1.A1_at−1.35−5.78−8.205.00−1.9615.97Gibberellin receptor GID1L2
18GRMZM2G165901Zm.2157.6.S1_x_at−1.25−1.50−17.02−1.3413.028.67Responsive to abscisic acid 15
Photosynthesis and Carbohydrate Metabolism
1GRMZM2G448174ZmAffx.1483.1.S1_at1.811.28−3.47−1.2715.002.92Apocytochrome f precursor
2GRMZM2G385635ZmAffx.1092.1.A1_at−1.474.19−2.341.292.324.10ATPase beta chain
3GRMZM2G336448Zm.19239.1.A1_at1.134.222.12−4.79−1.33−8.81Carbohydrate transporter/sugar porter/transporter
4GRMZM2G029219Zm.3331.1.A1_at−1.49−2.2824.022.815.37−2.63Carbohydrate transporter/sugar porter/transporter
5GRMZM2G121878Zm.1079.1.A1_a_at6.241.16804.183.1413.05−129.47Carbonic anhydrase
6GRMZM2G424832Zm.520.1.S1_x_at−1.49−2.11−4.063.91−1.662.04Cellulose synthase 4
7GRMZM2G018241Zm.523.1.S1_at−1.46−2.08−9.332.24−1.283.77Cellulose synthase 9
8GRMZM2G142898ZmAffx.5.1.S1_at1.11−1.77−7.572.07−1.842.85Cellulose synthase catalytic subunit 12
9GRMZM2G047513Zm.7289.1.A1_at1.001.145.87−1.57−4.78−32.62Chloroplast 30S ribosomal protein S10
10ZmAffx.1219.1.S1_s_at6.832.12−2.139.497.0018.67Chlorophyll a-b binding protein 6A
11GRMZM2G145460Zm.15915.1.S1_at−1.10−1.42−2.38−1.78−7.22−5.92Chloroplast SRP54 receptor 1
12GRMZM2G064302Zm.14043.3.S1_a_at5.182.35−2.881.4846.5235.20Enolase 1
13GRMZM2G048371Zm.410.1.A1_at1.39−1.02−2.32−2.007.7924.38Enolase 2
14GRMZM2G053458Zm.4.1.S1_at1.351.71−2.32−1.2125.8217.88Ferredoxin 3
15GRMZM2G106190Zm.136.1.S1_at−1.24−8.66−2.283.47−1.503.73Ferredoxin 6, chloroplastic
16GRMZM2G113325Zm.1691.1.S1_a_at−1.382.3520.441.121.11−9.52Ferrochelatase
17GRMZM2G051004Zm.8992.2.A1_a_at2.86−1.56−4.311.063.4134.02Glyceraldehyde-3-phosphate dehydrogenase
18GRMZM2G415359Zm.5727.1.S1_a_at2.37−1.011.362.3721.1415.47Malate dehydrogenase 5
19GRMZM2G142873Zm.8962.1.A1_at2.55−1.153.491.404.291.20Opaque endosperm 5
20GRMZM2G065083Zm.3318.1.S1_at1.42−2.861.79−1.0615.222.71Phosphohexose isomerase 1
21GRMZM2G382914Zm.6780.1.A1_a_at−1.14−1.79−1.06−1.22104.0936.76Phosphoglycerate kinase
22GRMZM2G382914Zm.6780.3.A1_x_at−1.25−1.41−1.07−1.3425.9011.82Phosphoglycerate kinase
23GRMZM2G076276Zm.15933.1.A1_at1.89−1.29−1.183.891.217.50Predicted polygalacturonate 4-alpha-galacturonosyltransferase
24GRMZM2G165357Zm.730.3.A1_x_at1.70−1.53−4.901.493.5011.60Predicted UDP-glucuronic acid decarboxylase 1
25GRMZM2G059151Zm.2422.1.A1_at1.17−1.49−2.162.07−1.533.21Pyrophosphate--fructose 6-phosphate 1-phosphotransferase subunit beta
26GRMZM2G113033Zm.6763.4.S1_a_at1.562.39−1.091.87520.3027.36Ribulose bisphosphate carboxylase small subunit 2
27GRMZM2G095252Zm.3461.1.A1_a_at1.32−1.191.14−1.15104.808.52RuBisCO large subunit-binding protein subunit beta
28GRMZM5G875238Zm.26.1.A1_at−1.242.96308.219.083.65−31.29Sucrose phosphate synthase 1
29GRMZM2G140107Zm.18317.1.A1_at1.322.4468.25−1.202.11−80.91Sucrose-phosphate synthase-like
30GRMZM2G134256Zm.2199.1.A1_a_at2.15−1.082.352.035.683.10Transaldolase 2
31GRMZM2G030784Zm.3889.1.A1_at1.911.38−1.221.366.9710.31Triosephosphate isomerase
32GRMZM2G073725Zm.752.1.S1_a_at2.15−1.47−2.33−1.2525.3823.42UDP-arabinopyranose mutase 3
33GRMZM2G328500Zm.4986.1.S1_at1.14-3.00−4.23−1.805.4711.70UDP-glucose 6-dehydrogenase
34GRMZM5G862540Zm.4986.2.S1_at1.09−2.44−5.64−1.403.004.10UDP-glucose 6-dehydrogenase
35GRMZM2G042179Zm.12322.1.A1_at−1.17−3.17−1.082.182.303.02UDP-glucuronic acid 4-epimerase
36GRMZM2G067707Zm.4793.1.S1_a_at2.991.351.491.3222.0324.99Ubiquinol-cytochrome c reductase complex
37GRMZM5G833389Zm.5548.1.A1_x_at2.37−1.32−6.95−1.0412.3813.282,3-bisphosphoglycerate-independent phosphoglycerate mutase
Publisher’s Note: MDPI stays neutral with regard to jurisdictional claims in published maps and institutional affiliations.

