
Transcriptome Analysis Reveals Key Genes Involved in the Response of Pyrus betuleafolia to Drought and High-Temperature Stress
 , , and
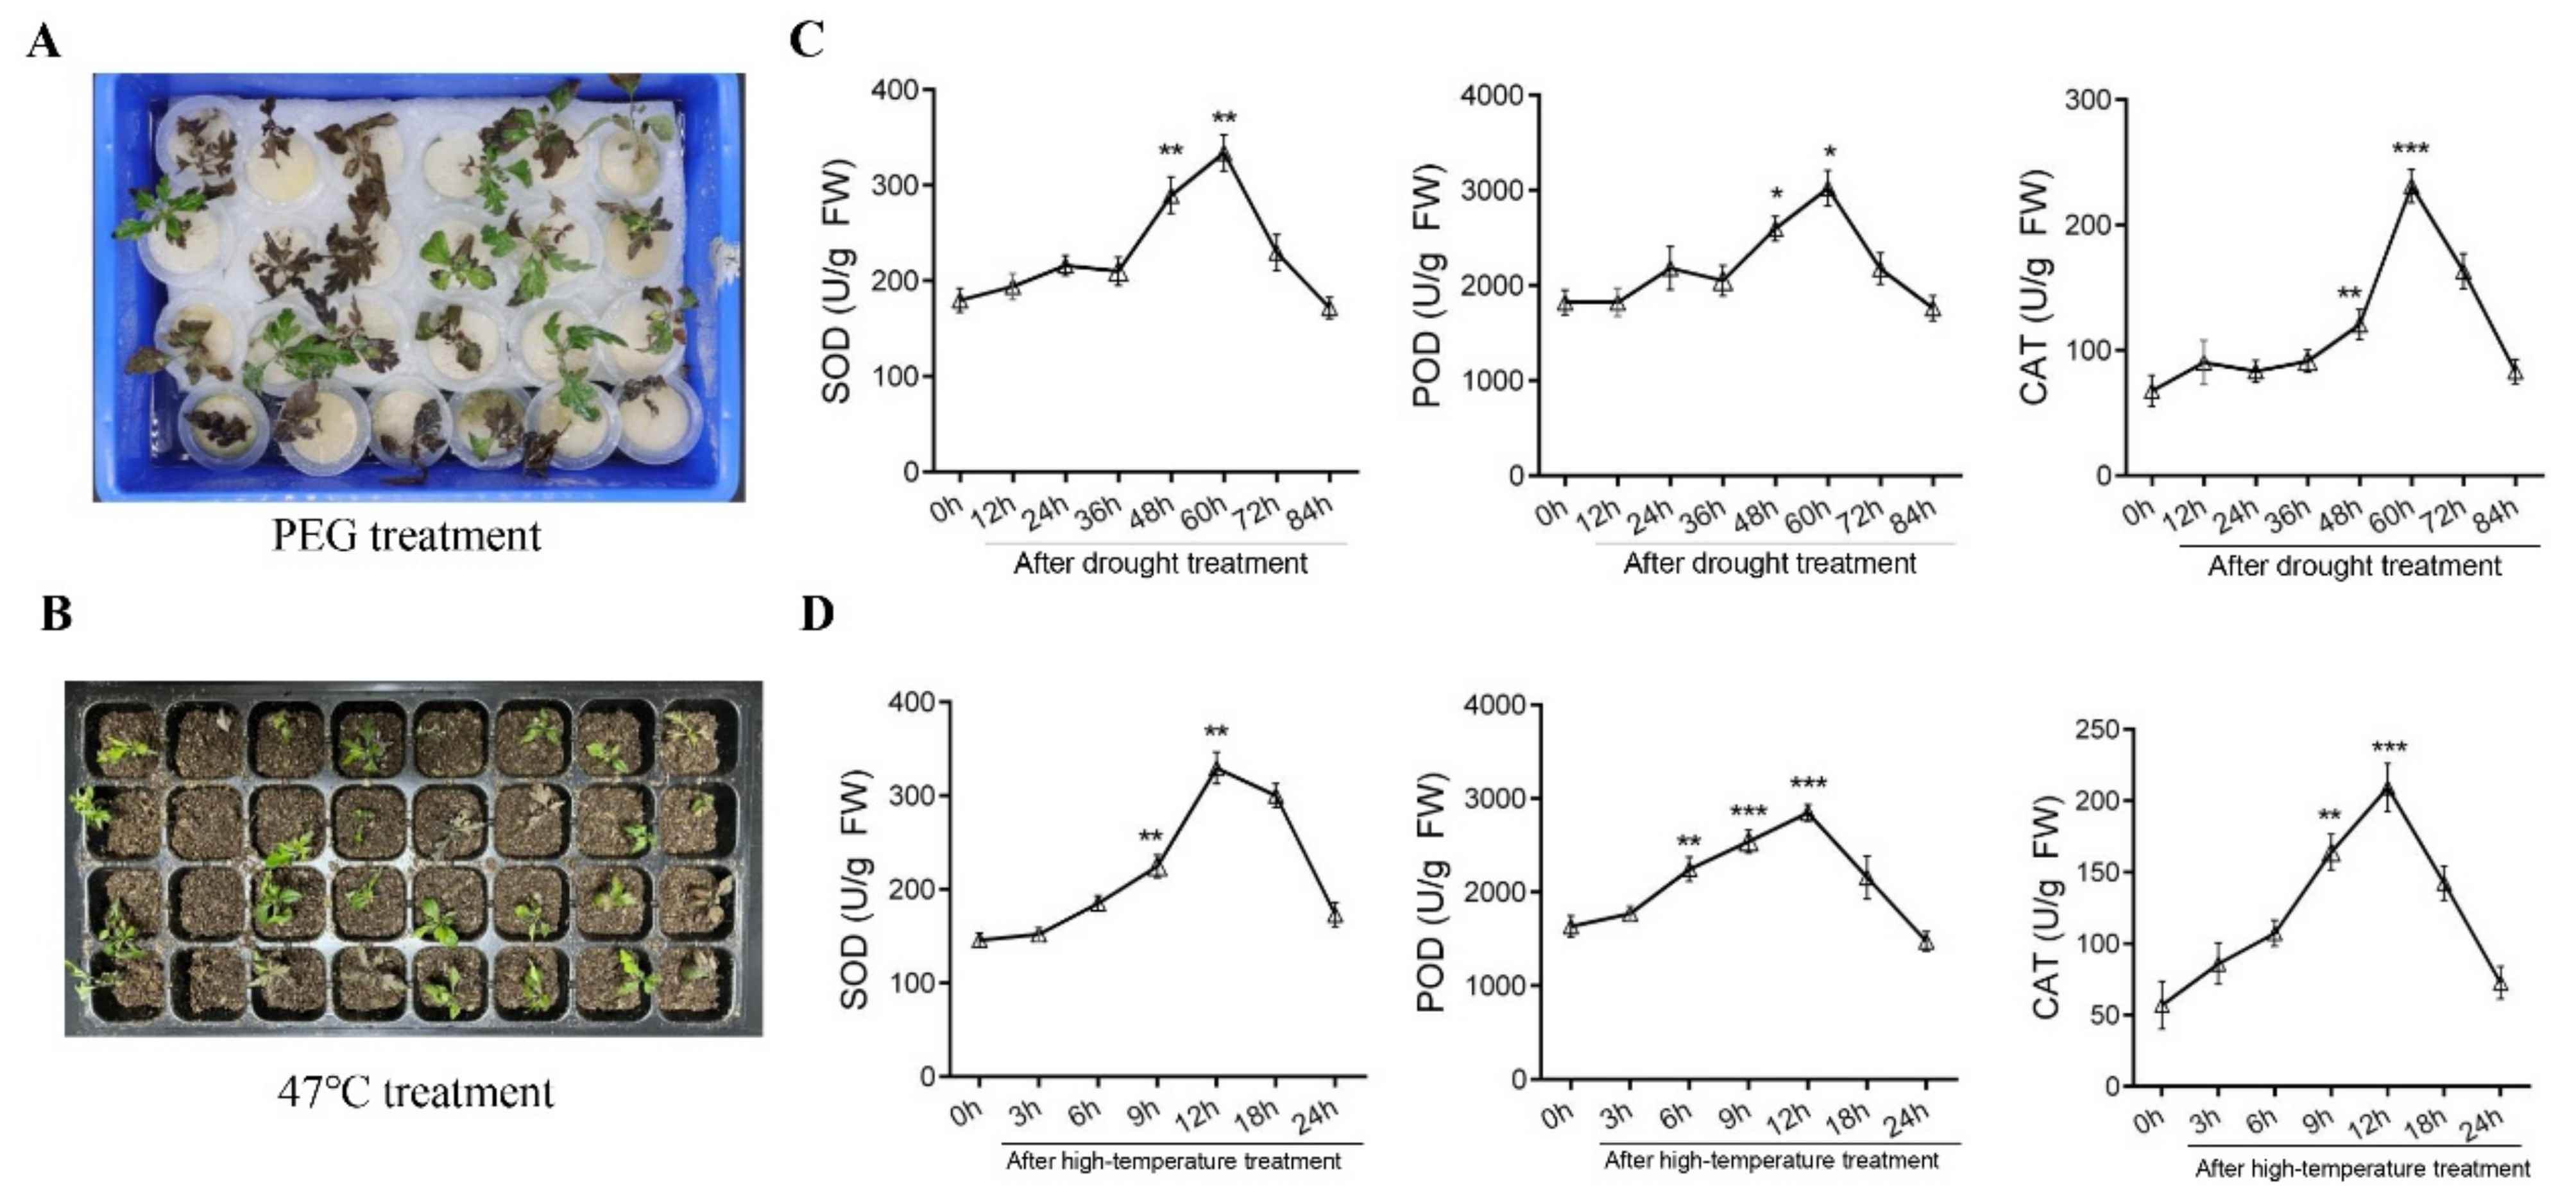
Abstract
:1. Introduction
2. Results
2.1. Detection of Antioxidant Enzyme Activity in Resistant Pyrus betuleafolia Seedlings after Drought or High-Temperature Treatment
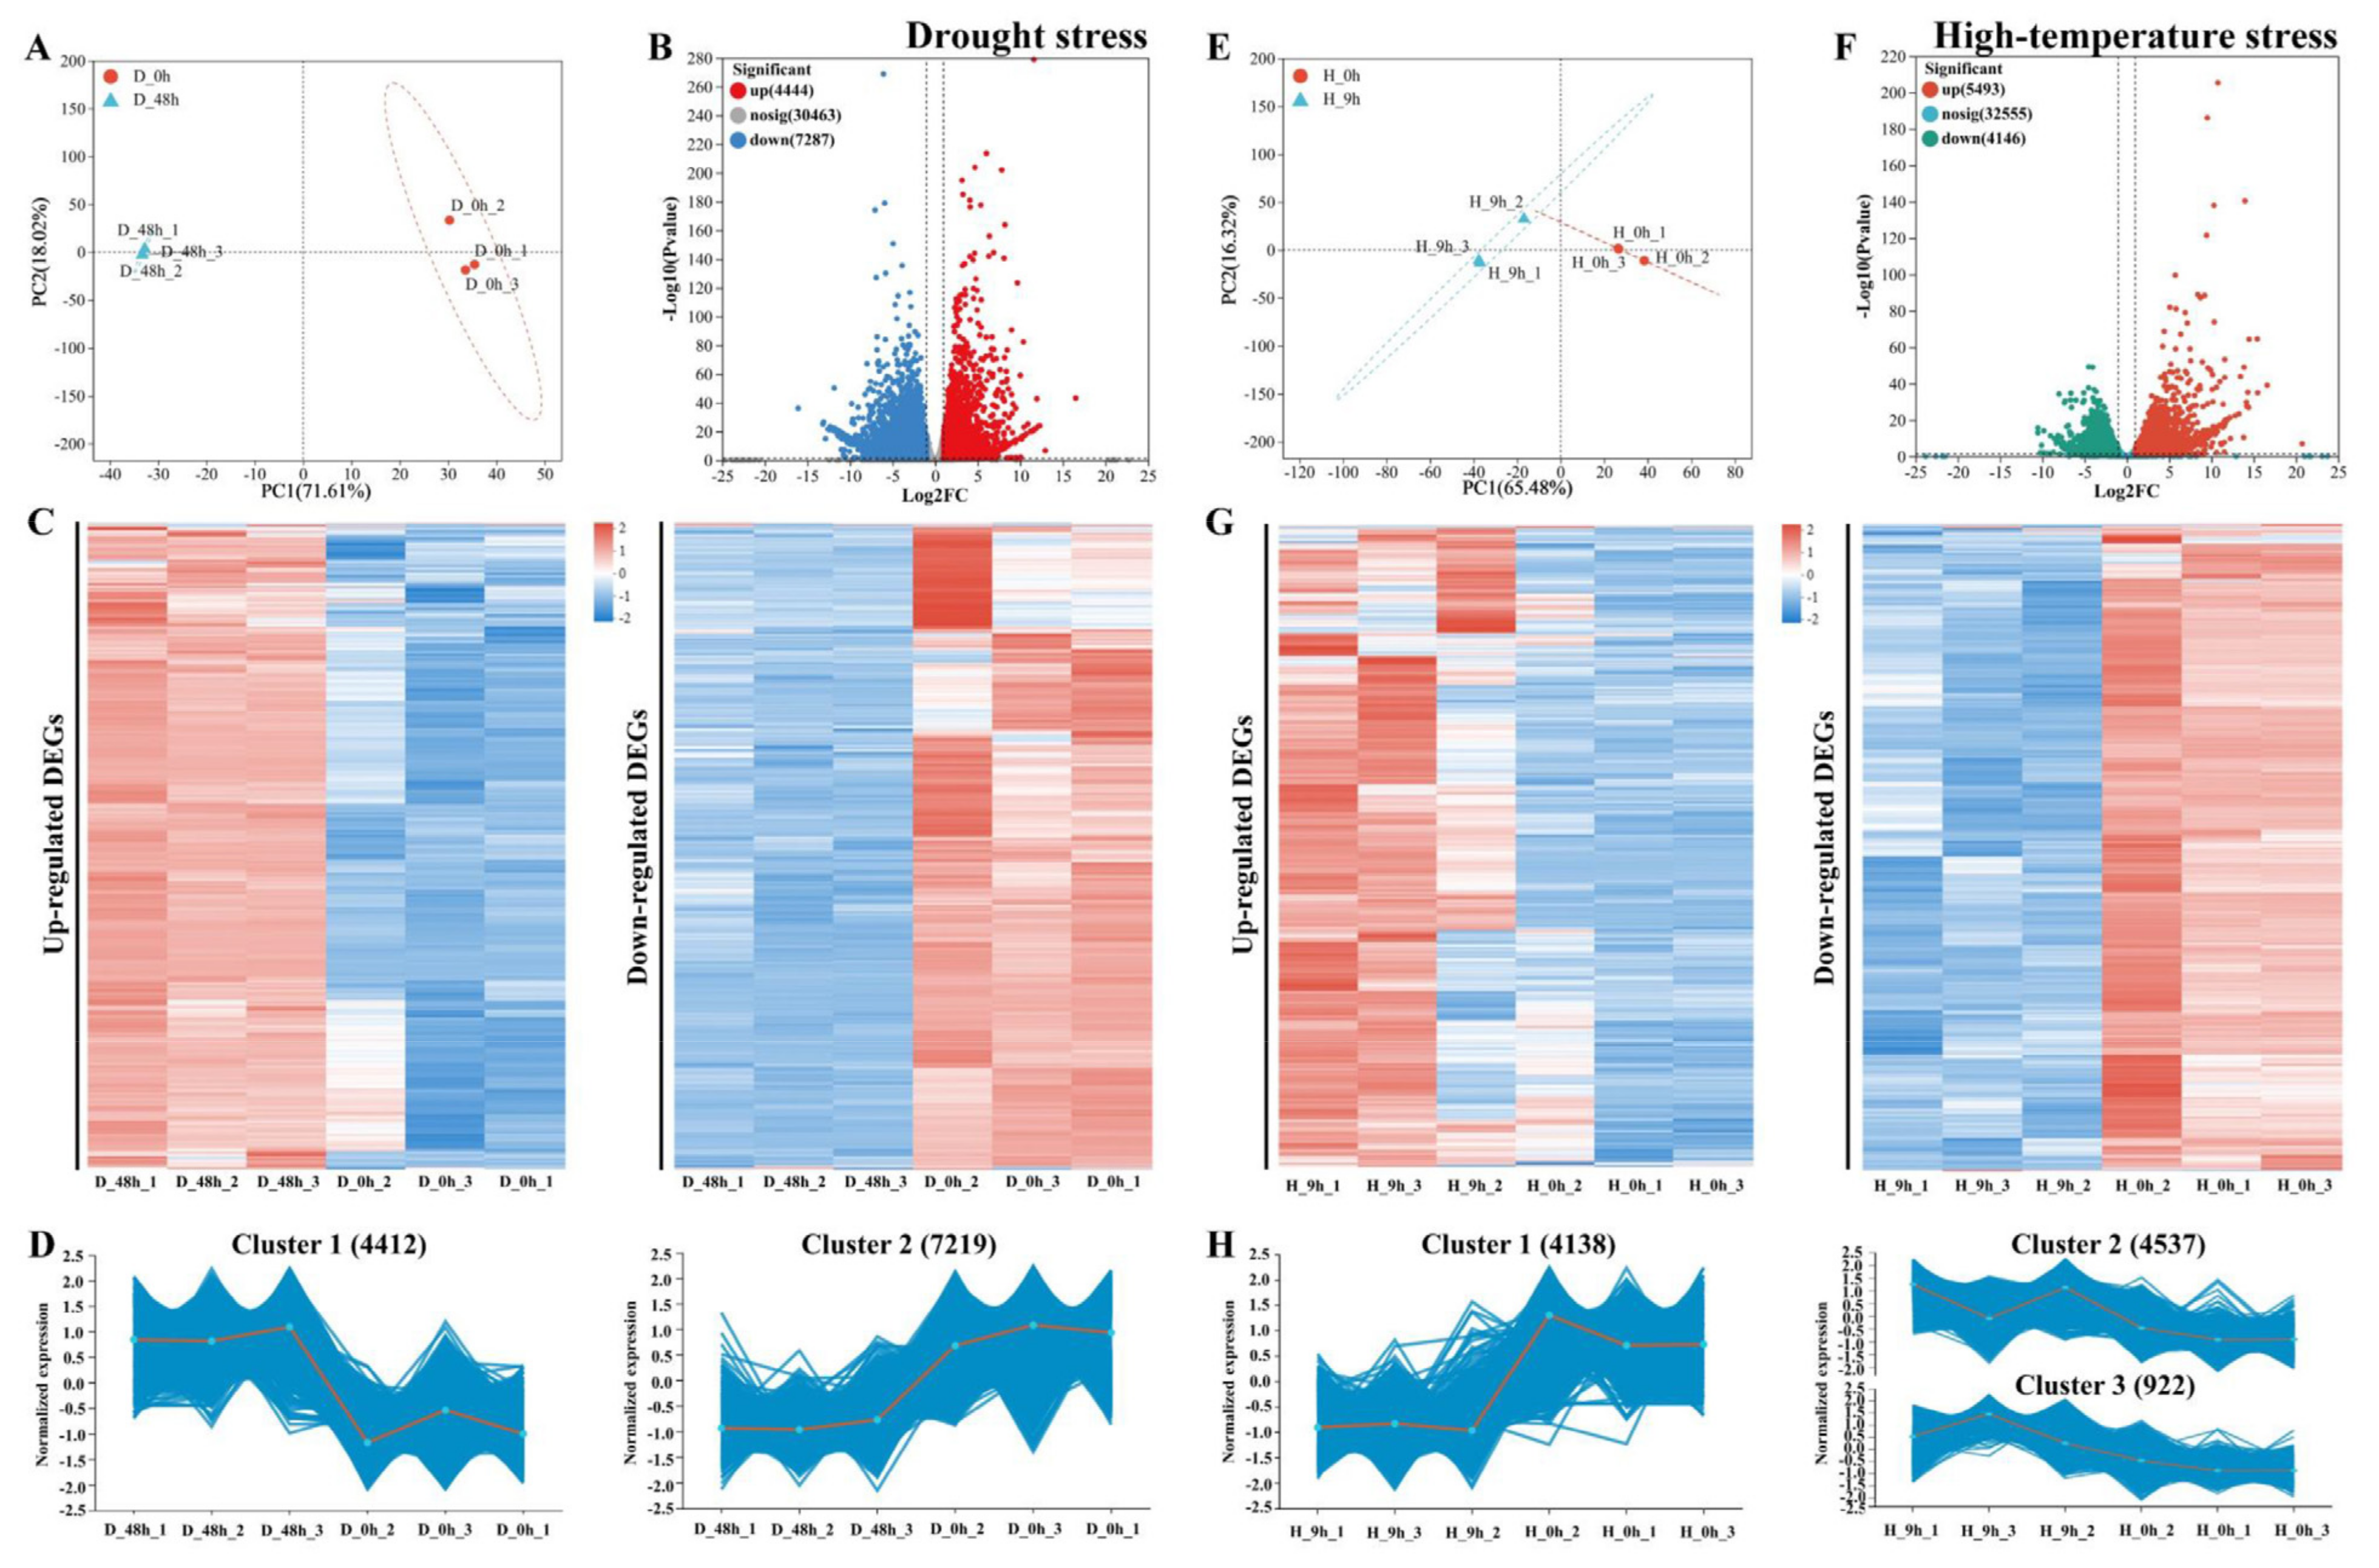
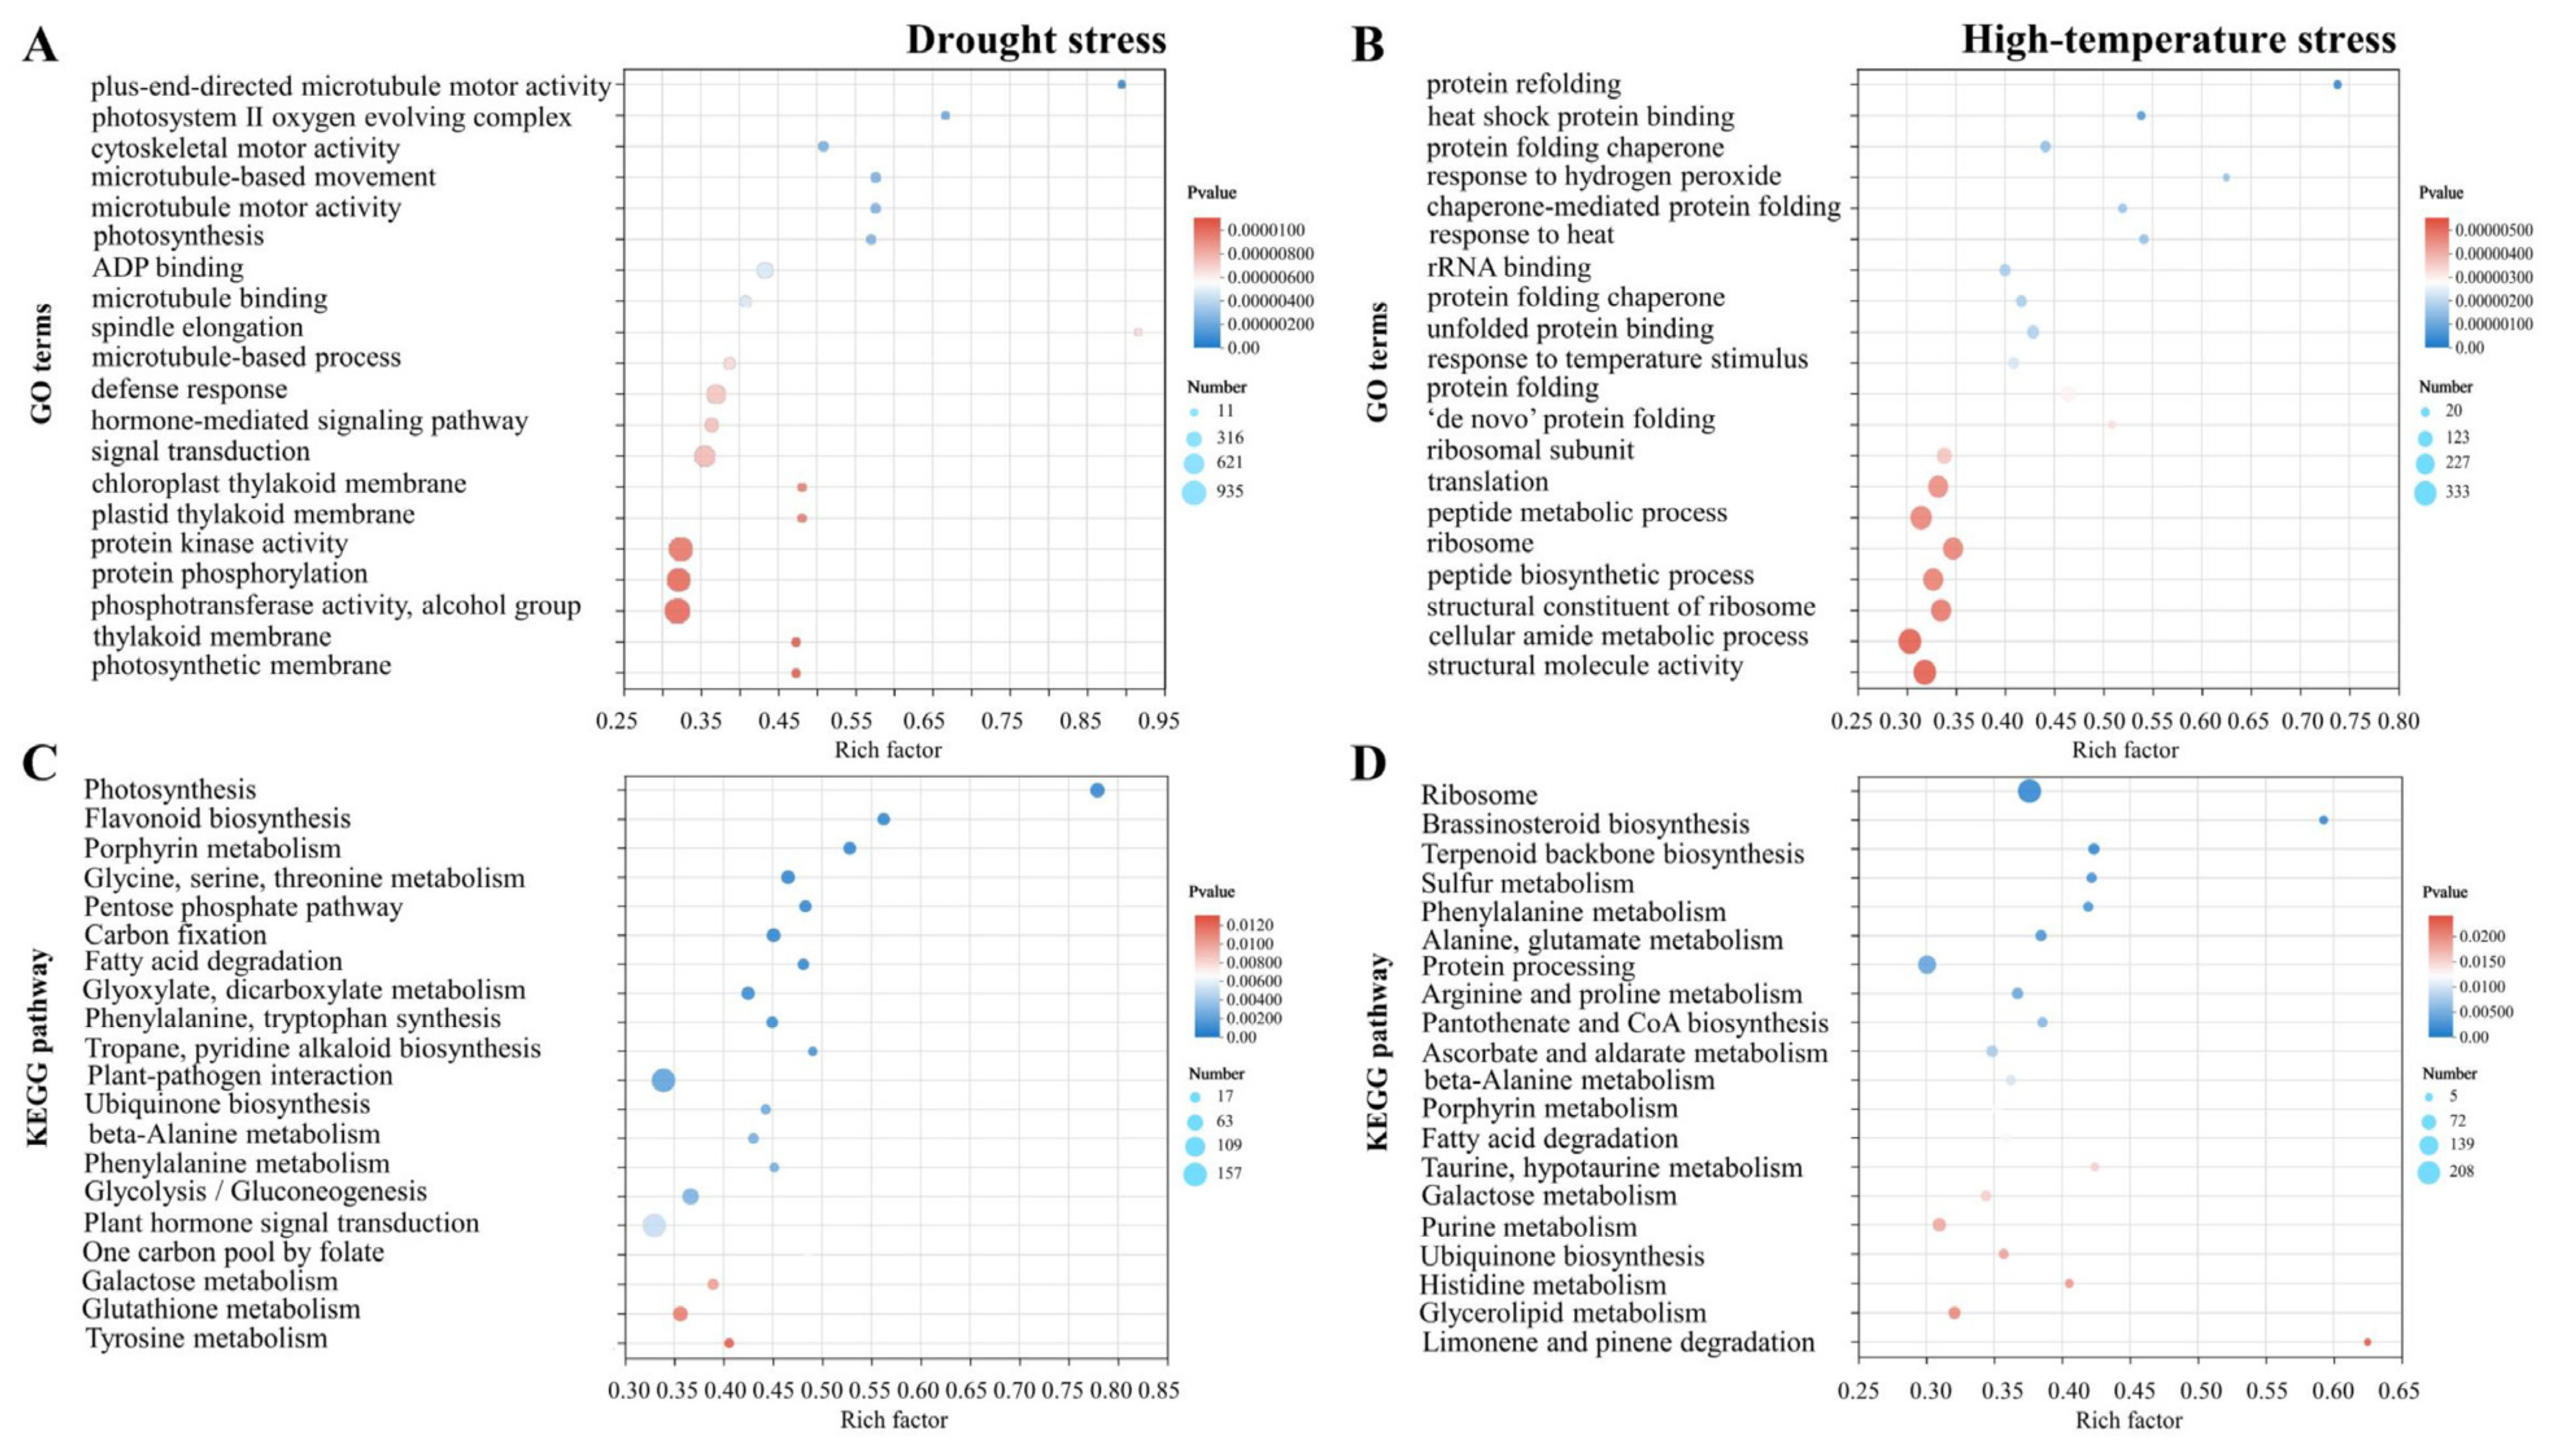
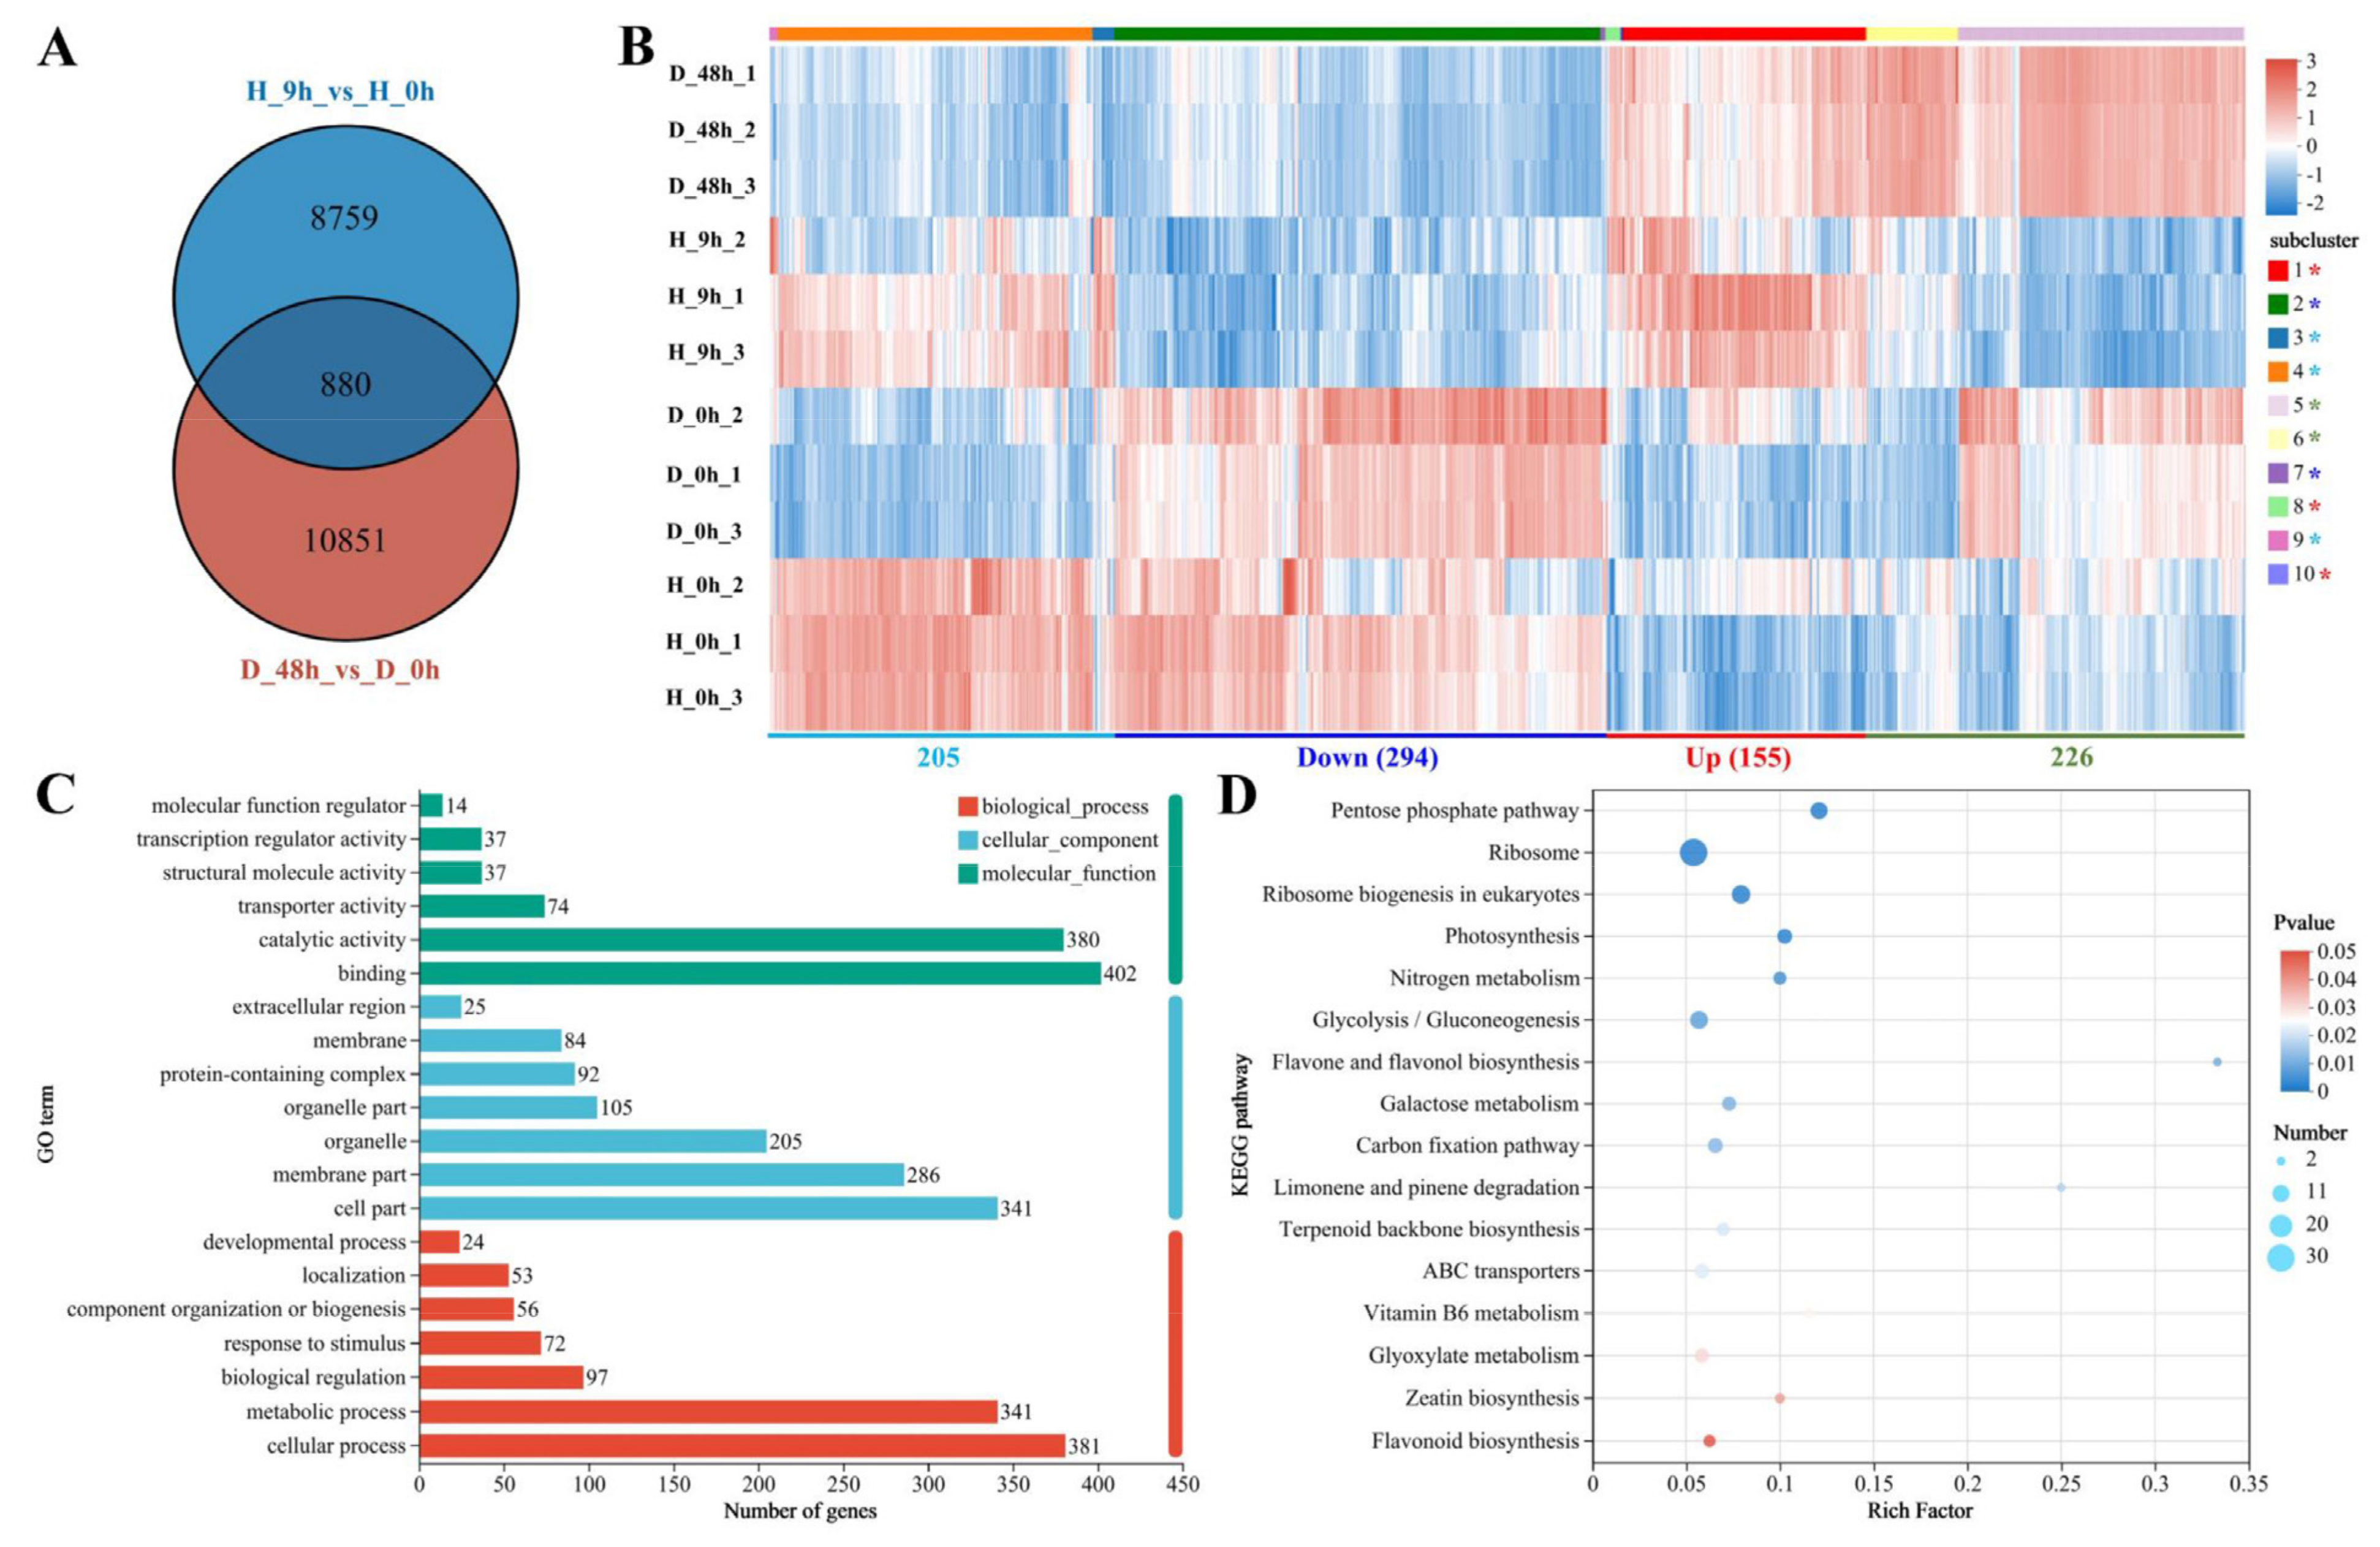
2.2. Transcriptome Analysis of Pyrus betulifolia in Response to Drought or High-Temperature Stress
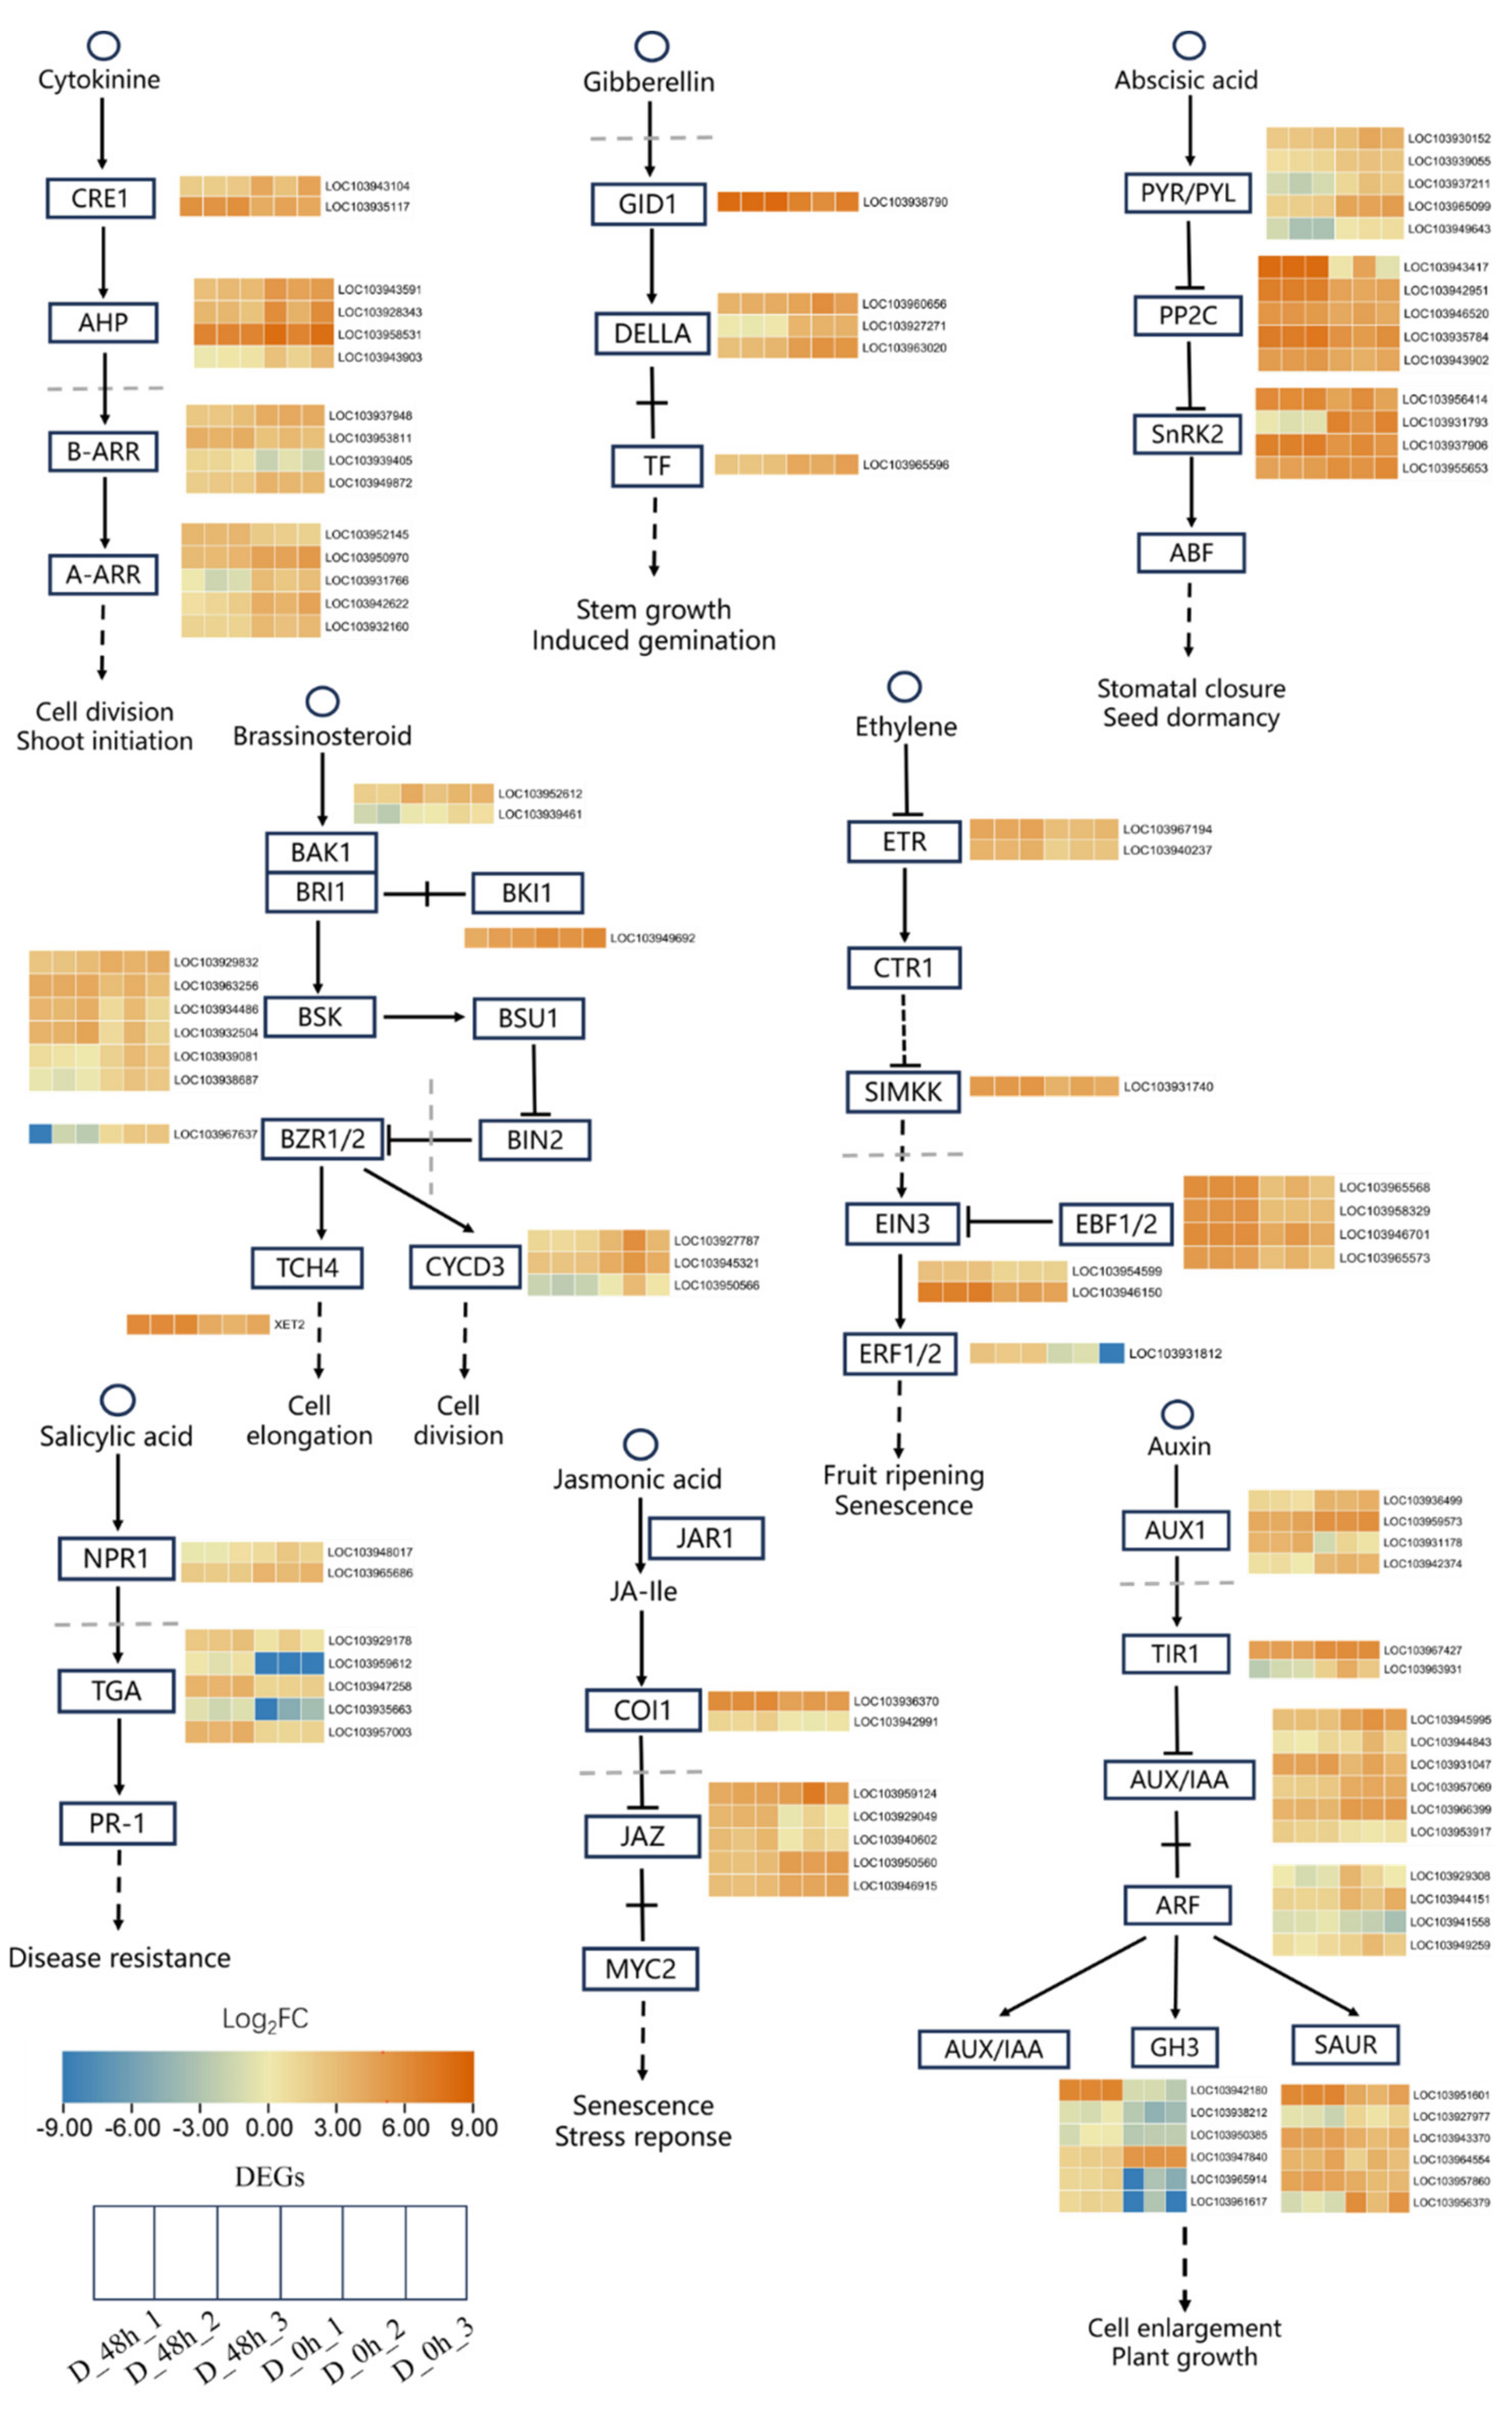
2.3. Plant Hormone Signal Transduction Pathways Were Involved in Response to Drought Stress
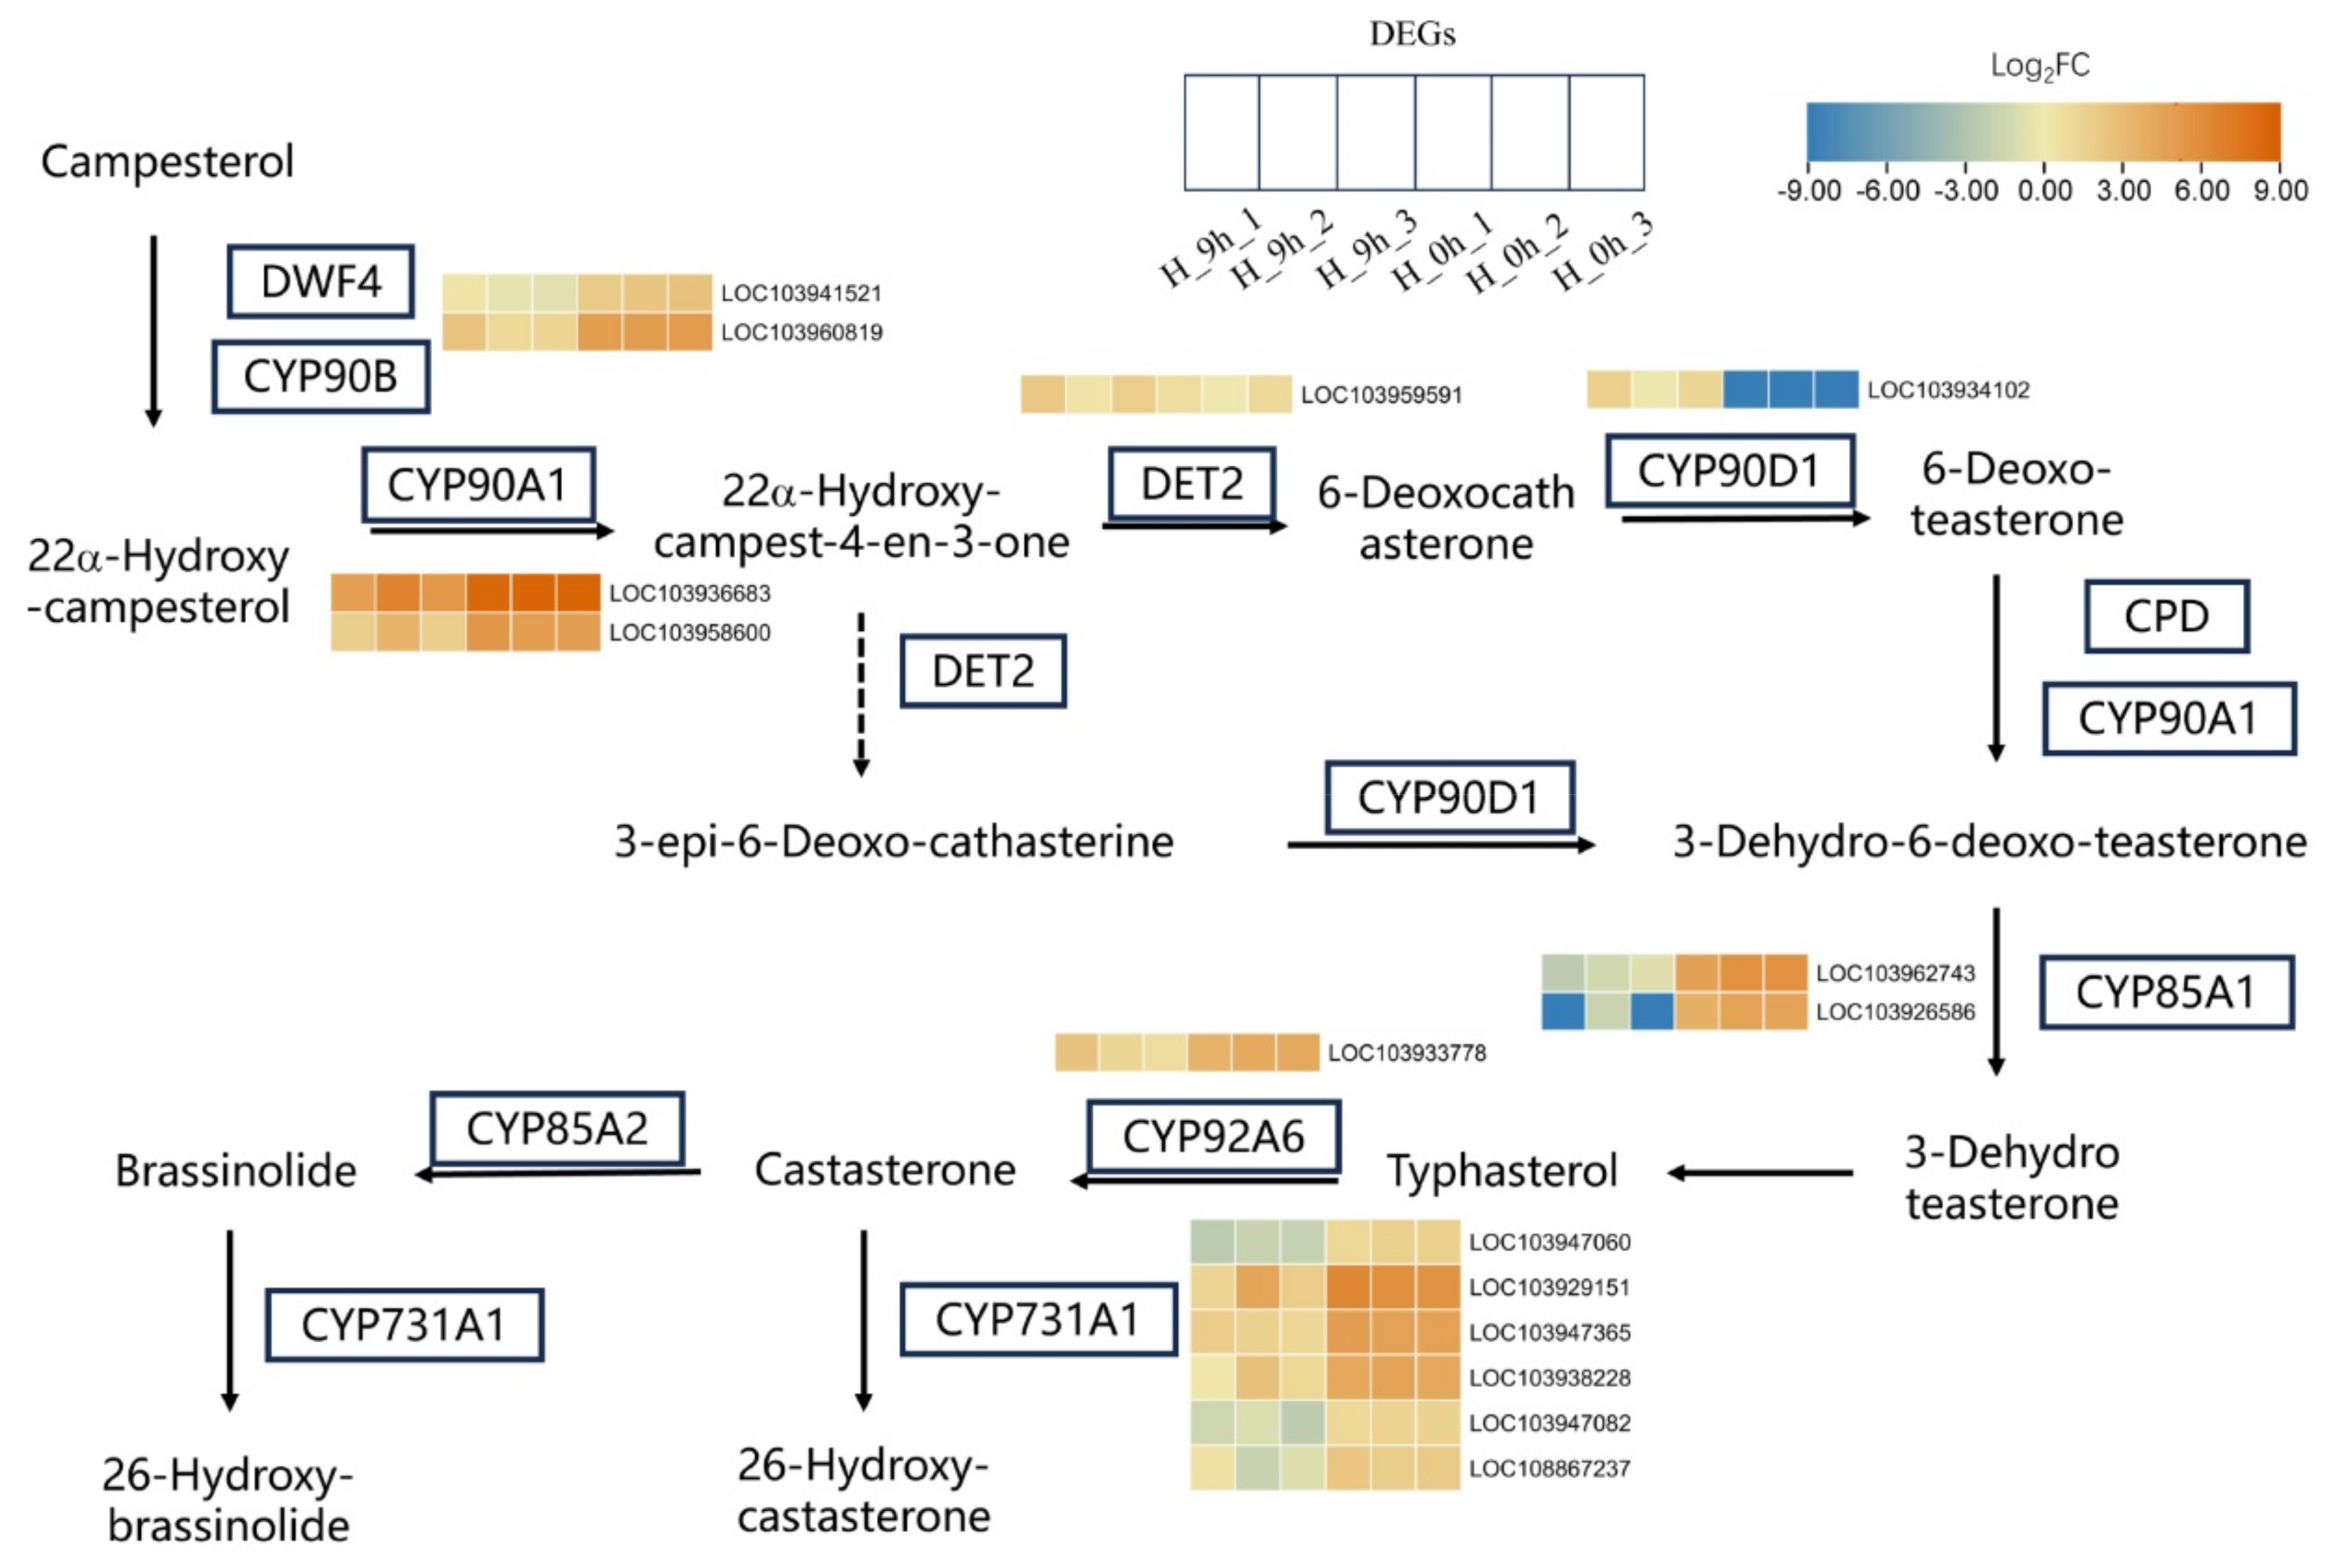
2.4. Brassinosteroids Biosynthetic Pathway Is Involved in the Response to High-Temperature Stress
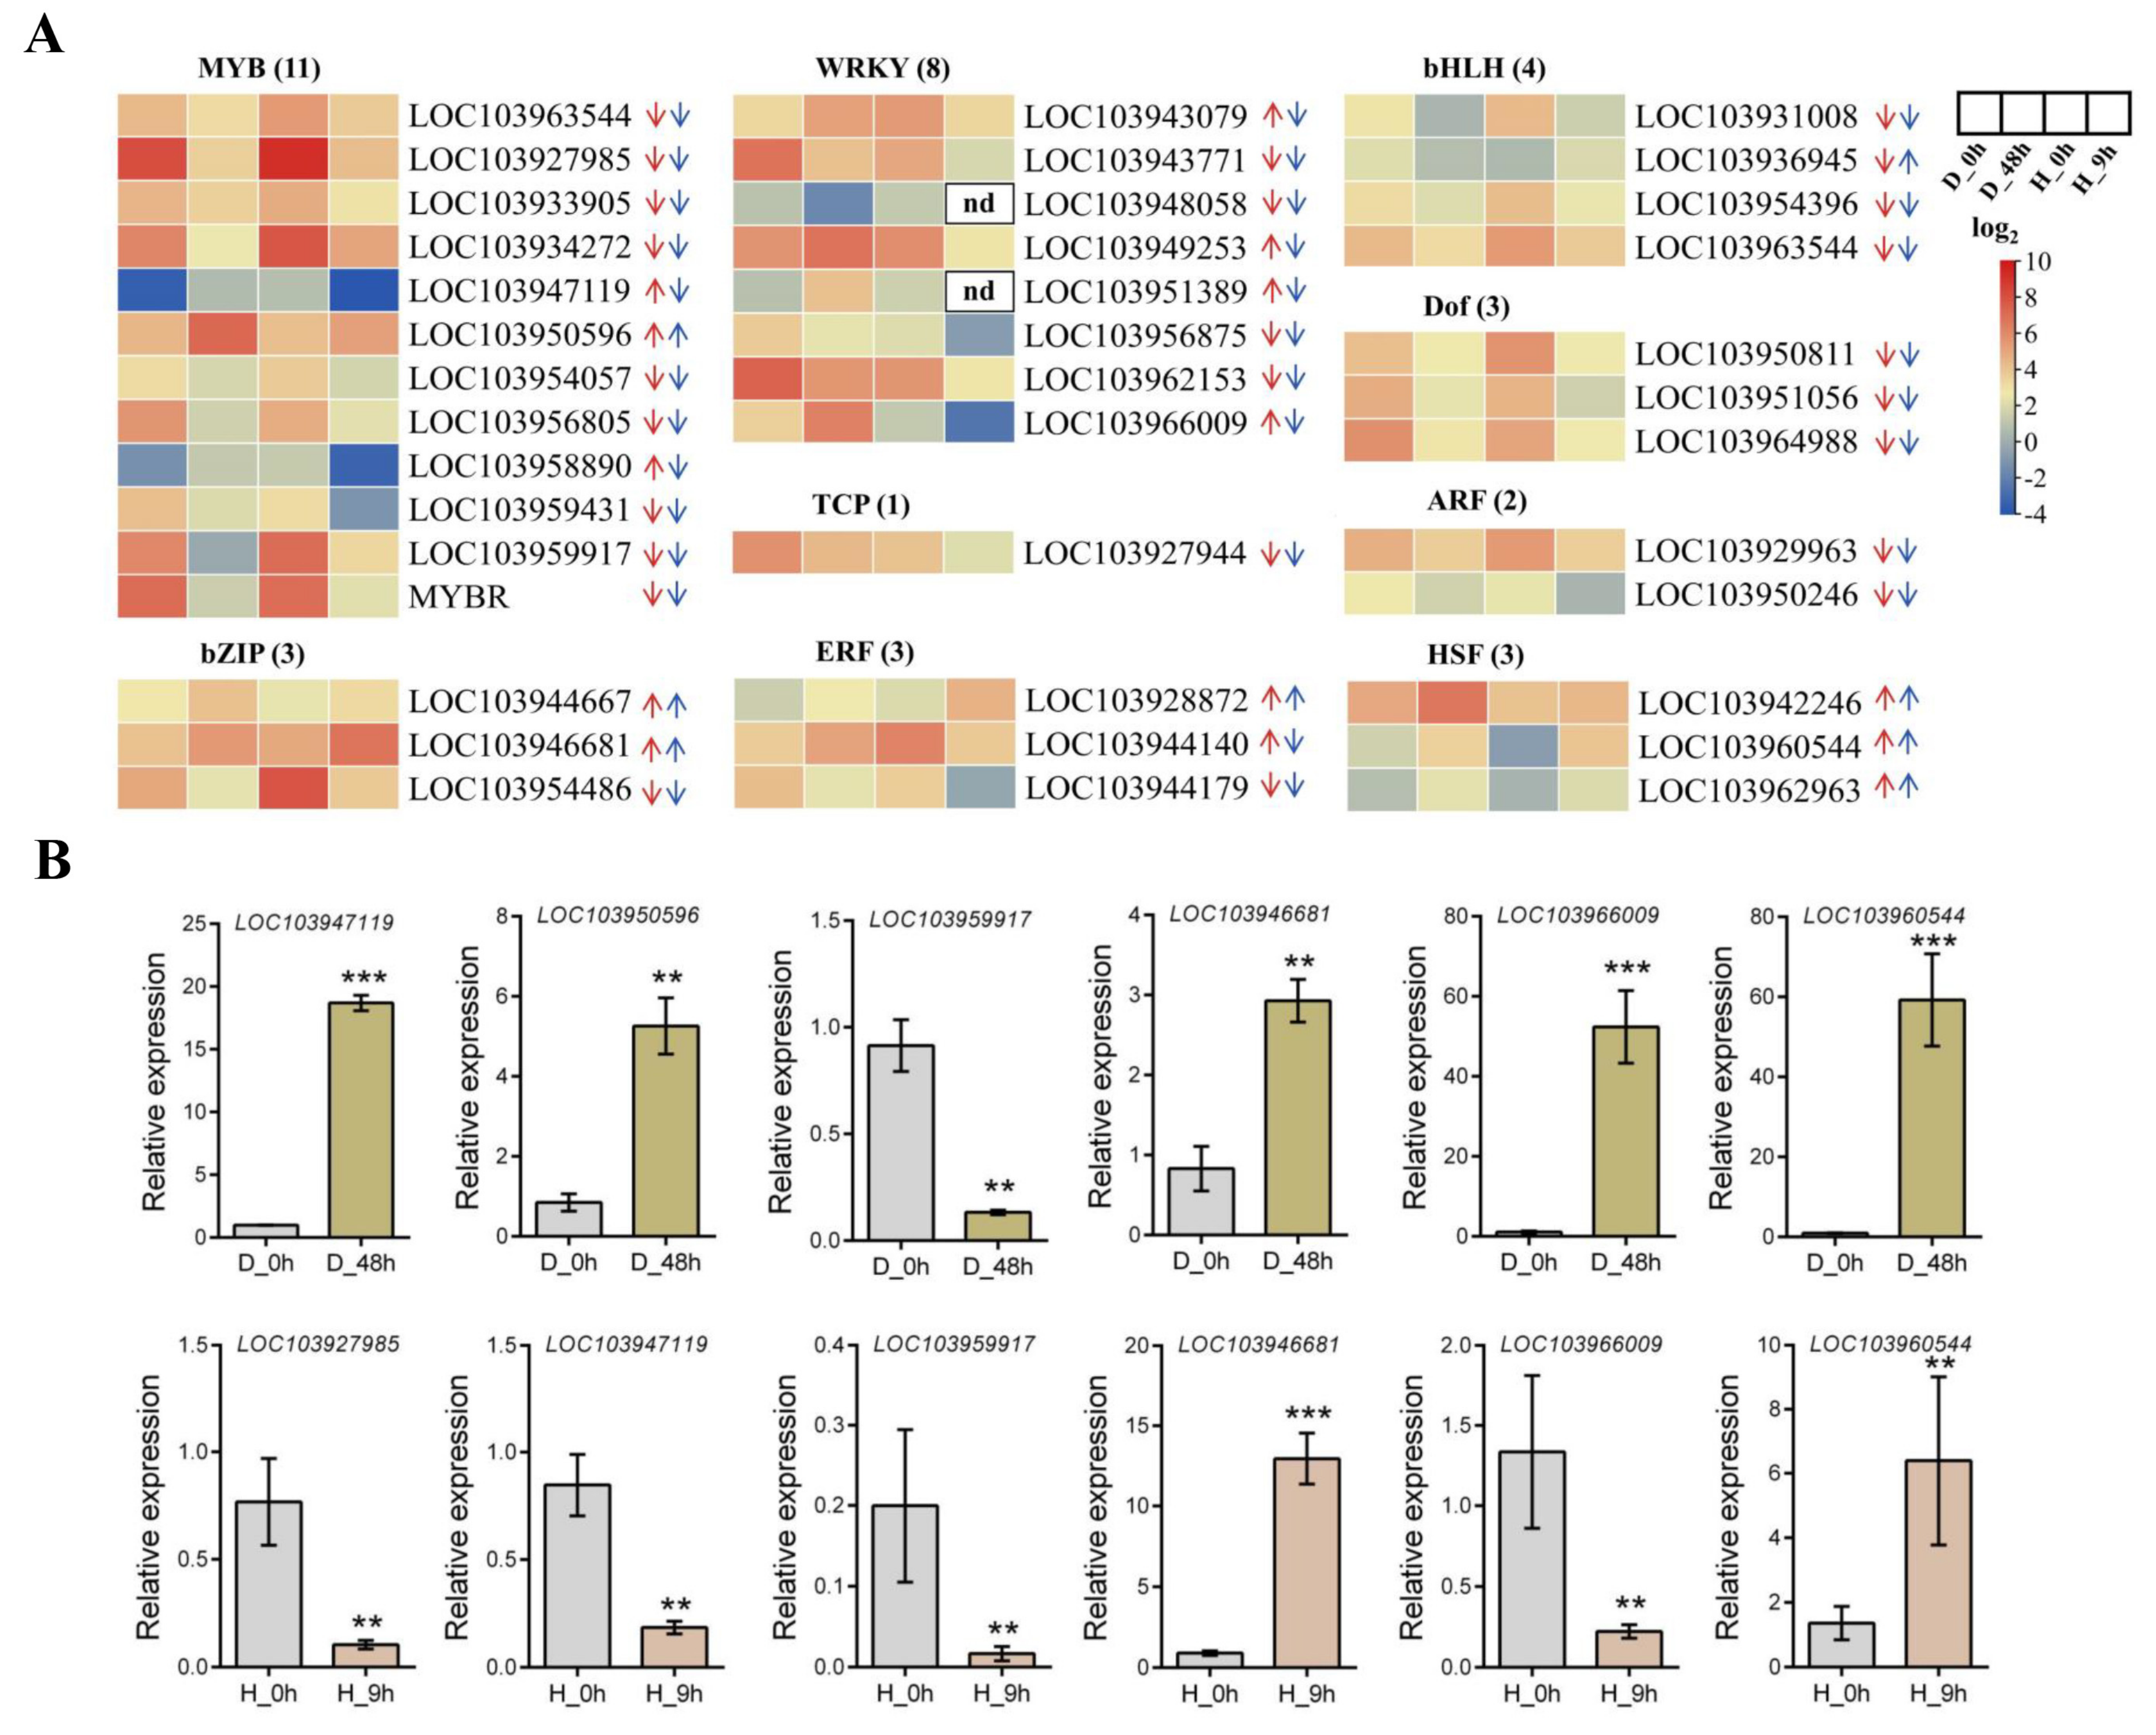
2.5. Transcriptome of Pyrus betulaefolia in Response to Both Drought and High-Temperature Stress
3. Discussion
4. Material and Methods
4.1. Plant Materials and Growth Conditions
4.2. Treatment of Drought Stress and High Temperatures and Sample Collection
4.3. Total RNA Extraction, Construction of the cDNA Library, and Illumina-Sequencing
4.4. Quantitative Real-Time PCR Analysis
4.5. Analysis of Antioxidant Enzyme Activities
5. Conclusions
Supplementary Materials
Author Contributions
Funding
Data Availability Statement
Acknowledgments
Conflicts of Interest
References
- Zhu, J.-K. Abiotic Stress Signaling and Responses in Plants. Cell 2016, 167, 313–324. [Google Scholar] [CrossRef]
- Gupta, A.; Rico-Medina, A.; Cano-Delgado, A.I. The physiology of plant responses to drought. Science 2020, 368, 266–269. [Google Scholar] [CrossRef] [PubMed]
- Seki, M.; Umezawa, T.; Urano, K.; Shinozaki, K. Regulatory metabolic networks in drought stress responses. Curr. Opin. Plant Biol. 2007, 10, 296–302. [Google Scholar] [CrossRef]
- Hong, E.; Xia, X.; Ji, W.; Li, T.; Xu, X.; Chen, J.; Chen, X.; Zhu, X. Effects of High Temperature Stress on the Physiological and Biochemical Characteristics of Paeonia ostii. Int. J. Mol. Sci. 2023, 2, 11180. [Google Scholar] [CrossRef] [PubMed]
- Bita, C.E.; Gerats, T. Plant tolerance to high temperature in a changing environment: Scientific fundamentals and production of heat stress-tolerant crops. Front. Plant Sci. 2013, 4, 273. [Google Scholar] [CrossRef]
- Wu, B.; Li, P.; Hong, X.; Xu, C.; Wang, R.; Liang, Y. The receptor-like cytosolic kinase RIPK activates NADP-malic enzyme 2 to generate NADPH for fueling ROS production. Mol. Plant 2022, 15, 887–903. [Google Scholar] [CrossRef]
- Lü, X.-P.; Gao, H.-J.; Zhang, L.; Wang, Y.-P.; Shao, K.-Z.; Zhao, Q.; Zhang, J.-L. Dynamic responses of Haloxylon ammodendron to various degrees of simulated drought stress. Plant Physiol. Biochem. 2019, 139, 121–131. [Google Scholar] [CrossRef] [PubMed]
- Wang, J.; Zhang, L.; Cao, Y.; Qi, C.; Li, S.; Liu, L.; Wang, G.; Mao, A.; Ren, S.; Guo, Y.-D. CsATAF1 Positively Regulates Drought Stress Tolerance by an ABA-Dependent Pathway and by Promoting ROS Scavenging in Cucumber. Plant Cell Physiol. 2018, 59, 930–945. [Google Scholar] [CrossRef] [PubMed]
- Sadura, I.; Janeczko, A. Physiological and molecular mechanisms of brassinosteroid-induced tolerance to high and low temperature in plants. Biol. Plant. 2018, 62, 601–616. [Google Scholar] [CrossRef]
- Perez-Borroto, L.S.; Guzzo, M.C.; Posada, G.; Peña Malavera, A.N.; Castagnaro, A.P.; Gonzalez-Olmedo, J.L.; Coll-García, Y.; Pardo, E.M. A brassinosteroid functional analogue increases soybean drought resilience. Sci. Rep. 2022, 12, 11294. [Google Scholar] [CrossRef] [PubMed]
- Gupta, A.; Hisano, H.; Hojo, Y.; Matsuura, T.; Ikeda, Y.; Mori, I.C.; Senthil-Kumar, M. Global profiling of phytohormone dynamics during combined drought and pathogen stress in Arabidopsis thaliana reveals ABA and JA as major regulators. Sci. Rep. 2017, 7, 4017. [Google Scholar] [CrossRef] [PubMed]
- Lima, A.A.; Santos, I.S.; Torres, M.E.L.; Cardon, C.H.; Caldeira, C.F.; Lima, R.R.; Davies, W.J.; Dodd, I.C.; Chalfun-Junior, A. Drought and re-watering modify ethylene production and sensitivity, and are associated with coffee anthesis. Environ. Exp. Bot. 2021, 181, 104289. [Google Scholar] [CrossRef]
- Sun, T.-T.; Su, Z.-H.; Wang, R.; Liu, R.; Yang, T.; Zuo, W.-T.; Wen, S.-S.; Wang, L.-Q. Transcriptome and metabolome analysis reveals the molecular mechanisms of Tamarix taklamakanensis under progressive drought and rehydration treatments. Environ. Exp. Bot. 2022, 195, 104766. [Google Scholar] [CrossRef]
- Joshi, R.; Wani, S.H.; Singh, B.; Bohra, A.; Dar, Z.A.; Lone, A.A.; Pareek, A.; Singla-Pareek, S.L. Transcription Factors and Plants Response to Drought Stress: Current Understanding and Future Directions. Front. Plant Sci. 2016, 7, 1029. [Google Scholar] [CrossRef] [PubMed]
- Zhang, S.; He, C.; Wei, L.; Jian, S.; Liu, N. Transcriptome and metabolome analysis reveals key genes and secondary metabolites of Casuarina equisetifolia ssp. incana in response to drought stress. BMC Plant Biol. 2023, 23, 200. [Google Scholar] [CrossRef]
- An, X.; Jin, G.; Luo, X.; Chen, C.; Li, W.; Zhu, G. Transcriptome analysis and transcription factors responsive to drought stress in Hibiscus cannabinus. PeerJ 2020, 8, e8470. [Google Scholar] [CrossRef]
- Shi, Z.; Han, X.; Wang, G.; Qiu, J.; Zhou, L.-j.; Chen, S.; Fang, W.; Chen, F.; Jiang, J. Transcriptome analysis reveals chrysanthemum flower discoloration under high-temperature stress. Front. Plant Sci. 2022, 13, 1003635. [Google Scholar] [CrossRef]
- Li, M.; Li, H.; Sun, A.; Wang, L.; Ren, C.; Liu, J.; Gao, X. Transcriptome analysis reveals key drought-stress-responsive genes in soybean. Front. Genet. 2022, 13, 1060529. [Google Scholar] [CrossRef] [PubMed]
- Li, K.-Q.; Xu, X.-Y.; Huang, X.-S. Identification of Differentially Expressed Genes Related to Dehydration Resistance in a Highly Drought-Tolerant Pear, Pyrus betulaefolia, as through RNA-Seq. PLoS ONE 2016, 11, e0149352. [Google Scholar] [CrossRef] [PubMed]
- Aghaie, P.; Tafreshi, S.A.H. Central role of 70-kDa heat shock protein in adaptation of plants to drought stress. Cell Stress Chaperones 2020, 25, 1071–1081. [Google Scholar] [CrossRef]
- Jacob, P.; Hirt, H.; Bendahmane, A. The heat-shock protein/chaperone network and multiple stress resistance. Plant Biotechnol. J. 2017, 15, 405–414. [Google Scholar] [CrossRef] [PubMed]
- Zhou, Y.; Xu, F.; Shao, Y.; He, J. Regulatory Mechanisms of Heat Stress Response and Thermomorphogenesis in Plants. Plants 2022, 11, 3410. [Google Scholar] [CrossRef]
- Fuentes-Merlos, M.I.; Bamba, M.; Sato, S.; Higashitani, A. Comparative Transcriptome Analysis of Grafted Tomato with Drought Tolerance. Plants 2022, 11, 1947. [Google Scholar] [CrossRef] [PubMed]
- Liu, R.; Shu, B.; Wang, Y.; Yu, B.; Wang, Y.; Gan, Y.; Liang, Y.; Qiu, Z.; Yang, J.; Yan, S.; et al. Transcriptome analysis reveals key genes involved in the eggplant response to high-temperature stress. Environ. Exp. Bot. 2023, 211, 105369. [Google Scholar] [CrossRef]
- Li, X.-l.; Yang, X.; Hu, Y.-x.; Yu, X.-d.; Li, Q.-l. A novel NAC transcription factor from Suaeda liaotungensis K. enhanced transgenic Arabidopsis drought, salt, and cold stress tolerance. Plant Cell Rep. 2014, 33, 767–778. [Google Scholar] [CrossRef]
- Dou, H.; Xv, K.; Meng, Q.; Li, G.; Yang, X. Potato plants ectopically expressing Arabidopsis thaliana CBF3 exhibit enhanced tolerance to high-temperature stress. Plant Cell Environ. 2014, 38, 61–72. [Google Scholar] [CrossRef]
- Wen, J.; Jiang, F.; Weng, Y.; Sun, M.; Shi, X.; Zhou, Y.; Yu, L.; Wu, Z. Identification of heat-tolerance QTLs and high-temperature stress-responsive genes through conventional QTL mapping, QTL-seq and RNA-seq in tomato. BMC Plant Biol. 2019, 19, 398. [Google Scholar] [CrossRef] [PubMed]
- Jiang, Y.; Peng, X.; Zhang, Q.; Liu, Y.; Li, A.; Cheng, B.; Wu, J. Regulation of Drought and Salt Tolerance by OsSKL2 and OsASR1 in Rice. Rice 2022, 15, 46. [Google Scholar] [CrossRef]
- Park, J.-R.; Kim, E.-G.; Jang, Y.-H.; Kim, K.-M. Screening and identification of genes affecting grain quality and spikelet fertility during high-temperature treatment in grain filling stage of rice. BMC Plant Biol. 2021, 21, 263. [Google Scholar] [CrossRef] [PubMed]
- Zhu, Y.; Liu, Y.; Zhou, K.; Tian, C.; Aslam, M.; Zhang, B.; Liu, W.; Zou, H. Overexpression of ZmEREBP60 enhances drought tolerance in maize. J. Plant Physiol. 2022, 275, 153763. [Google Scholar] [CrossRef] [PubMed]
- Mao, H.; Li, S.; Wang, Z.; Cheng, X.; Li, F.; Mei, F.; Chen, N.; Kang, Z. Regulatory changes in TaSNAC8-6A are associated with drought tolerance in wheat seedlings. Plant Biotechnol. J. 2019, 18, 1078–1092. [Google Scholar] [CrossRef] [PubMed]
- Wang, J.; Tian, W.; Tao, F.; Wang, J.; Shang, H.; Chen, X.; Xu, X.; Hu, X. TaRPM1 Positively Regulates Wheat High-Temperature Seedling-Plant Resistance to Puccinia striiformis f. sp. tritici. Front. Plant Sci. 2020, 10, 1679. [Google Scholar] [CrossRef]
- Dong, X.; Wang, Z.; Tian, L.; Zhang, Y.; Qi, D.; Huo, H.; Xu, J.; Li, Z.; Liao, R.; Shi, M.; et al. De novo assembly of a wild pear (Pyrus betuleafolia) genome. Plant Biotechnol. J. 2019, 18, 581–595. [Google Scholar] [CrossRef] [PubMed]
- Li, Y.; Zhang, X.; Jiang, J.; Zhao, T.; Xu, X.; Yang, H.; Li, J. Virus-induced gene silencing of SlPYL4 decreases the drought tolerance of tomato. Hortic. Plant J. 2022, 8, 361–368. [Google Scholar] [CrossRef]
- Lim, C.W.; Lim, J.; Baek, W.; Lee, S.C. Pepper clade A PP2C, CaSIP1, negatively modulates drought resistance by suppressing CaSnRK2.6 kinase activity. Environ. Exp. Bot. 2023, 209, 105275. [Google Scholar] [CrossRef]
- Huang, Y.-C.; Niu, C.-Y.; Yang, C.-R.; Jinn, T.-L. The heat-stress factor HSFA6b connects ABA signaling and ABA-mediated heat responses. Plant Physiol. 2016, 172, 1182–1199. [Google Scholar] [CrossRef]
- Zandalinas, S.I.; Balfagón, D.; Arbona, V.; Gómez-Cadenas, A.; Inupakutika, M.A.; Mittler, R. ABA is required for the accumulation of APX1 and MBF1c during a combination of water deficit and heat stress. J. Exp. Bot. 2016, 67, 5381–5390. [Google Scholar] [CrossRef] [PubMed]
- Li, L.; Li, Y.; Quan, W.; Ding, G. Effects of PmaIAA27 and PmaARF15 genes on drought stress tolerance in pinus massoniana. BMC Plant Biol. 2023, 23, 478. [Google Scholar] [CrossRef]
- Huang, X.; Bao, Y.N.; Wang, B.; Liu, L.J.; Chen, J.; Dai, L.J.; Peng, D.X. Identification and expression of Aux/IAA, ARF, and LBD family transcription factors in Boehmeria nivea. Biol. Plant. 2016, 60, 244–250. [Google Scholar] [CrossRef]
- Salehin, M.; Li, B.; Tang, M.; Katz, E.; Song, L.; Ecker, J.R.; Kliebenstein, D.J.; Estelle, M. Auxin-sensitive Aux/IAA proteins mediate drought tolerance in Arabidopsis by regulating glucosinolate levels. Nat. Commun. 2019, 10, 4021. [Google Scholar] [CrossRef] [PubMed]
- Wang, F.; Niu, H.; Xin, D.; Long, Y.; Wang, G.; Liu, Z.; Li, G.; Zhang, F.; Qi, M.; Ye, Y.; et al. OsIAA18, an Aux/IAA Transcription Factor Gene, Is Involved in Salt and Drought Tolerance in Rice. Front. Plant Sci. 2021, 12, 738660. [Google Scholar] [CrossRef] [PubMed]
- Fu, J.; Wu, H.; Ma, S.; Xiang, D.; Liu, R.; Xiong, L. OsJAZ1 Attenuates Drought Resistance by Regulating JA and ABA Signaling in Rice. Front. Plant Sci. 2017, 8, 2108. [Google Scholar] [CrossRef]
- Koh, H.; Joo, H.; Lim, C.W.; Lee, S.C. Roles of the pepper JAZ protein CaJAZ1-03 and its interacting partner RING-type E3 ligase CaASRF1 in regulating ABA signaling and drought responses. Plant Cell Environ. 2023, 46, 3242–3257. [Google Scholar] [CrossRef] [PubMed]
- Eremina, M.; Unterholzner, S.J.; Rathnayake, A.I.; Castellanos, M.; Khan, M.; Kugler, K.G.; May, S.T.; Mayer, K.F.X.; Rozhon, W.; Poppenberger, B. Brassinosteroids participate in the control of basal and acquired freezing tolerance of plants. Proc. Natl. Acad. Sci. USA 2016, 113, E5982–E5991. [Google Scholar] [CrossRef] [PubMed]
- Marková, H.; Tarkowská, D.; Čečetka, P.; Kočová, M.; Rothová, O.; Holá, D. Contents of endogenous brassinosteroids and the response to drought and/or exogenously applied 24-epibrassinolide in two different maize leaves. Front. Plant Sci. 2023, 14, 1848. [Google Scholar] [CrossRef] [PubMed]
- Chen, Y.; Chen, Y.; Shi, Z.; Jin, Y.; Sun, H.; Xie, F.; Zhang, L. Biosynthesis and Signal Transduction of ABA, JA, and BRs in Response to Drought Stress of Kentucky Bluegrass. Int. J. Mol. Sci. 2019, 20, 1289. [Google Scholar] [CrossRef]
- Cui, X.-Y.; Gao, Y.; Guo, J.; Yu, T.-F.; Zheng, W.-J.; Liu, Y.-W.; Chen, J.; Xu, Z.-S.; Ma, Y.-Z. BES/BZR Transcription Factor TaBZR2 Positively Regulates Drought Responses by Activation of TaGST1. Plant Physiol. 2019, 180, 605–620. [Google Scholar] [CrossRef] [PubMed]
- Li, Y.; Zhang, H.; Zhang, Y.; Liu, Y.; Li, Y.; Tian, H.; Guo, S.; Sun, M.; Qin, Z.; Dai, S. Genome-wide identification and expression analysis reveals spinach brassinosteroid-signaling kinase (BSK) gene family functions in temperature stress response. BMC Genom. 2022, 23, 453. [Google Scholar] [CrossRef]
- Janeczko, A.; Gruszka, D.; Pociecha, E.; Dziurka, M.; Filek, M.; Jurczyk, B.; Kalaji, H.M.; Kocurek, M.; Waligórski, P. Physiological and biochemical characterisation of watered and drought-stressed barley mutants in the HvDWARF gene encoding C6-oxidase involved in brassinosteroid biosynthesis. Plant Physiol. Biochem. 2016, 99, 126–141. [Google Scholar] [CrossRef] [PubMed]
- Guo, G.; Yu, T.; Zhang, H.; Chen, M.; Dong, W.; Zhang, S.; Tang, X.; Liu, L.; Heng, W.; Zhu, L.; et al. Evidence That PbrSAUR72 Contributes to Iron Deficiency Tolerance in Pears by Facilitating Iron Absorption. Plants 2023, 12, 2173. [Google Scholar] [CrossRef] [PubMed]
- Li, K.; Xing, C.; Yao, Z.; Huang, X. PbrMYB21, a novel MYB protein of Pyrus betulaefolia, functions in drought tolerance and modulates polyamine levels by regulating arginine decarboxylase gene. Plant Biotechnol. J. 2017, 15, 1186–1203. [Google Scholar] [CrossRef] [PubMed]
- Qi, C.; Lin, X.; Li, S.; Liu, L.; Wang, Z.; Li, Y.; Bai, R.; Xie, Q.; Zhang, N.; Ren, S.; et al. SoHSC70 positively regulates thermotolerance by alleviating cell membrane damage, reducing ROS accumulation, and improving activities of antioxidant enzymes. Plant Sci. 2019, 283, 385–395. [Google Scholar] [CrossRef] [PubMed]


Disclaimer/Publisher’s Note: The statements, opinions and data contained in all publications are solely those of the individual author(s) and contributor(s) and not of MDPI and/or the editor(s). MDPI and/or the editor(s) disclaim responsibility for any injury to people or property resulting from any ideas, methods, instructions or products referred to in the content. |
© 2024 by the authors. Licensee MDPI, Basel, Switzerland. This article is an open access article distributed under the terms and conditions of the Creative Commons Attribution (CC BY) license (https://creativecommons.org/licenses/by/4.0/).
Share and Cite
Ma, P.; Guo, G.; Xu, X.; Luo, T.; Sun, Y.; Tang, X.; Heng, W.; Jia, B.; Liu, L. Transcriptome Analysis Reveals Key Genes Involved in the Response of Pyrus betuleafolia to Drought and High-Temperature Stress. Plants 2024, 13, 309. https://doi.org/10.3390/plants13020309
Ma P, Guo G, Xu X, Luo T, Sun Y, Tang X, Heng W, Jia B, Liu L. Transcriptome Analysis Reveals Key Genes Involved in the Response of Pyrus betuleafolia to Drought and High-Temperature Stress. Plants. 2024; 13(2):309. https://doi.org/10.3390/plants13020309
Chicago/Turabian StyleMa, Panpan, Guoling Guo, Xiaoqian Xu, Tingyue Luo, Yu Sun, Xiaomei Tang, Wei Heng, Bing Jia, and Lun Liu. 2024. "Transcriptome Analysis Reveals Key Genes Involved in the Response of Pyrus betuleafolia to Drought and High-Temperature Stress" Plants 13, no. 2: 309. https://doi.org/10.3390/plants13020309