

Characterization of Corn Silk Extract Using HPLC/HRMS/MS Analyses and Bioinformatic Data Processing

Abstract
:1. Introduction
2. Results
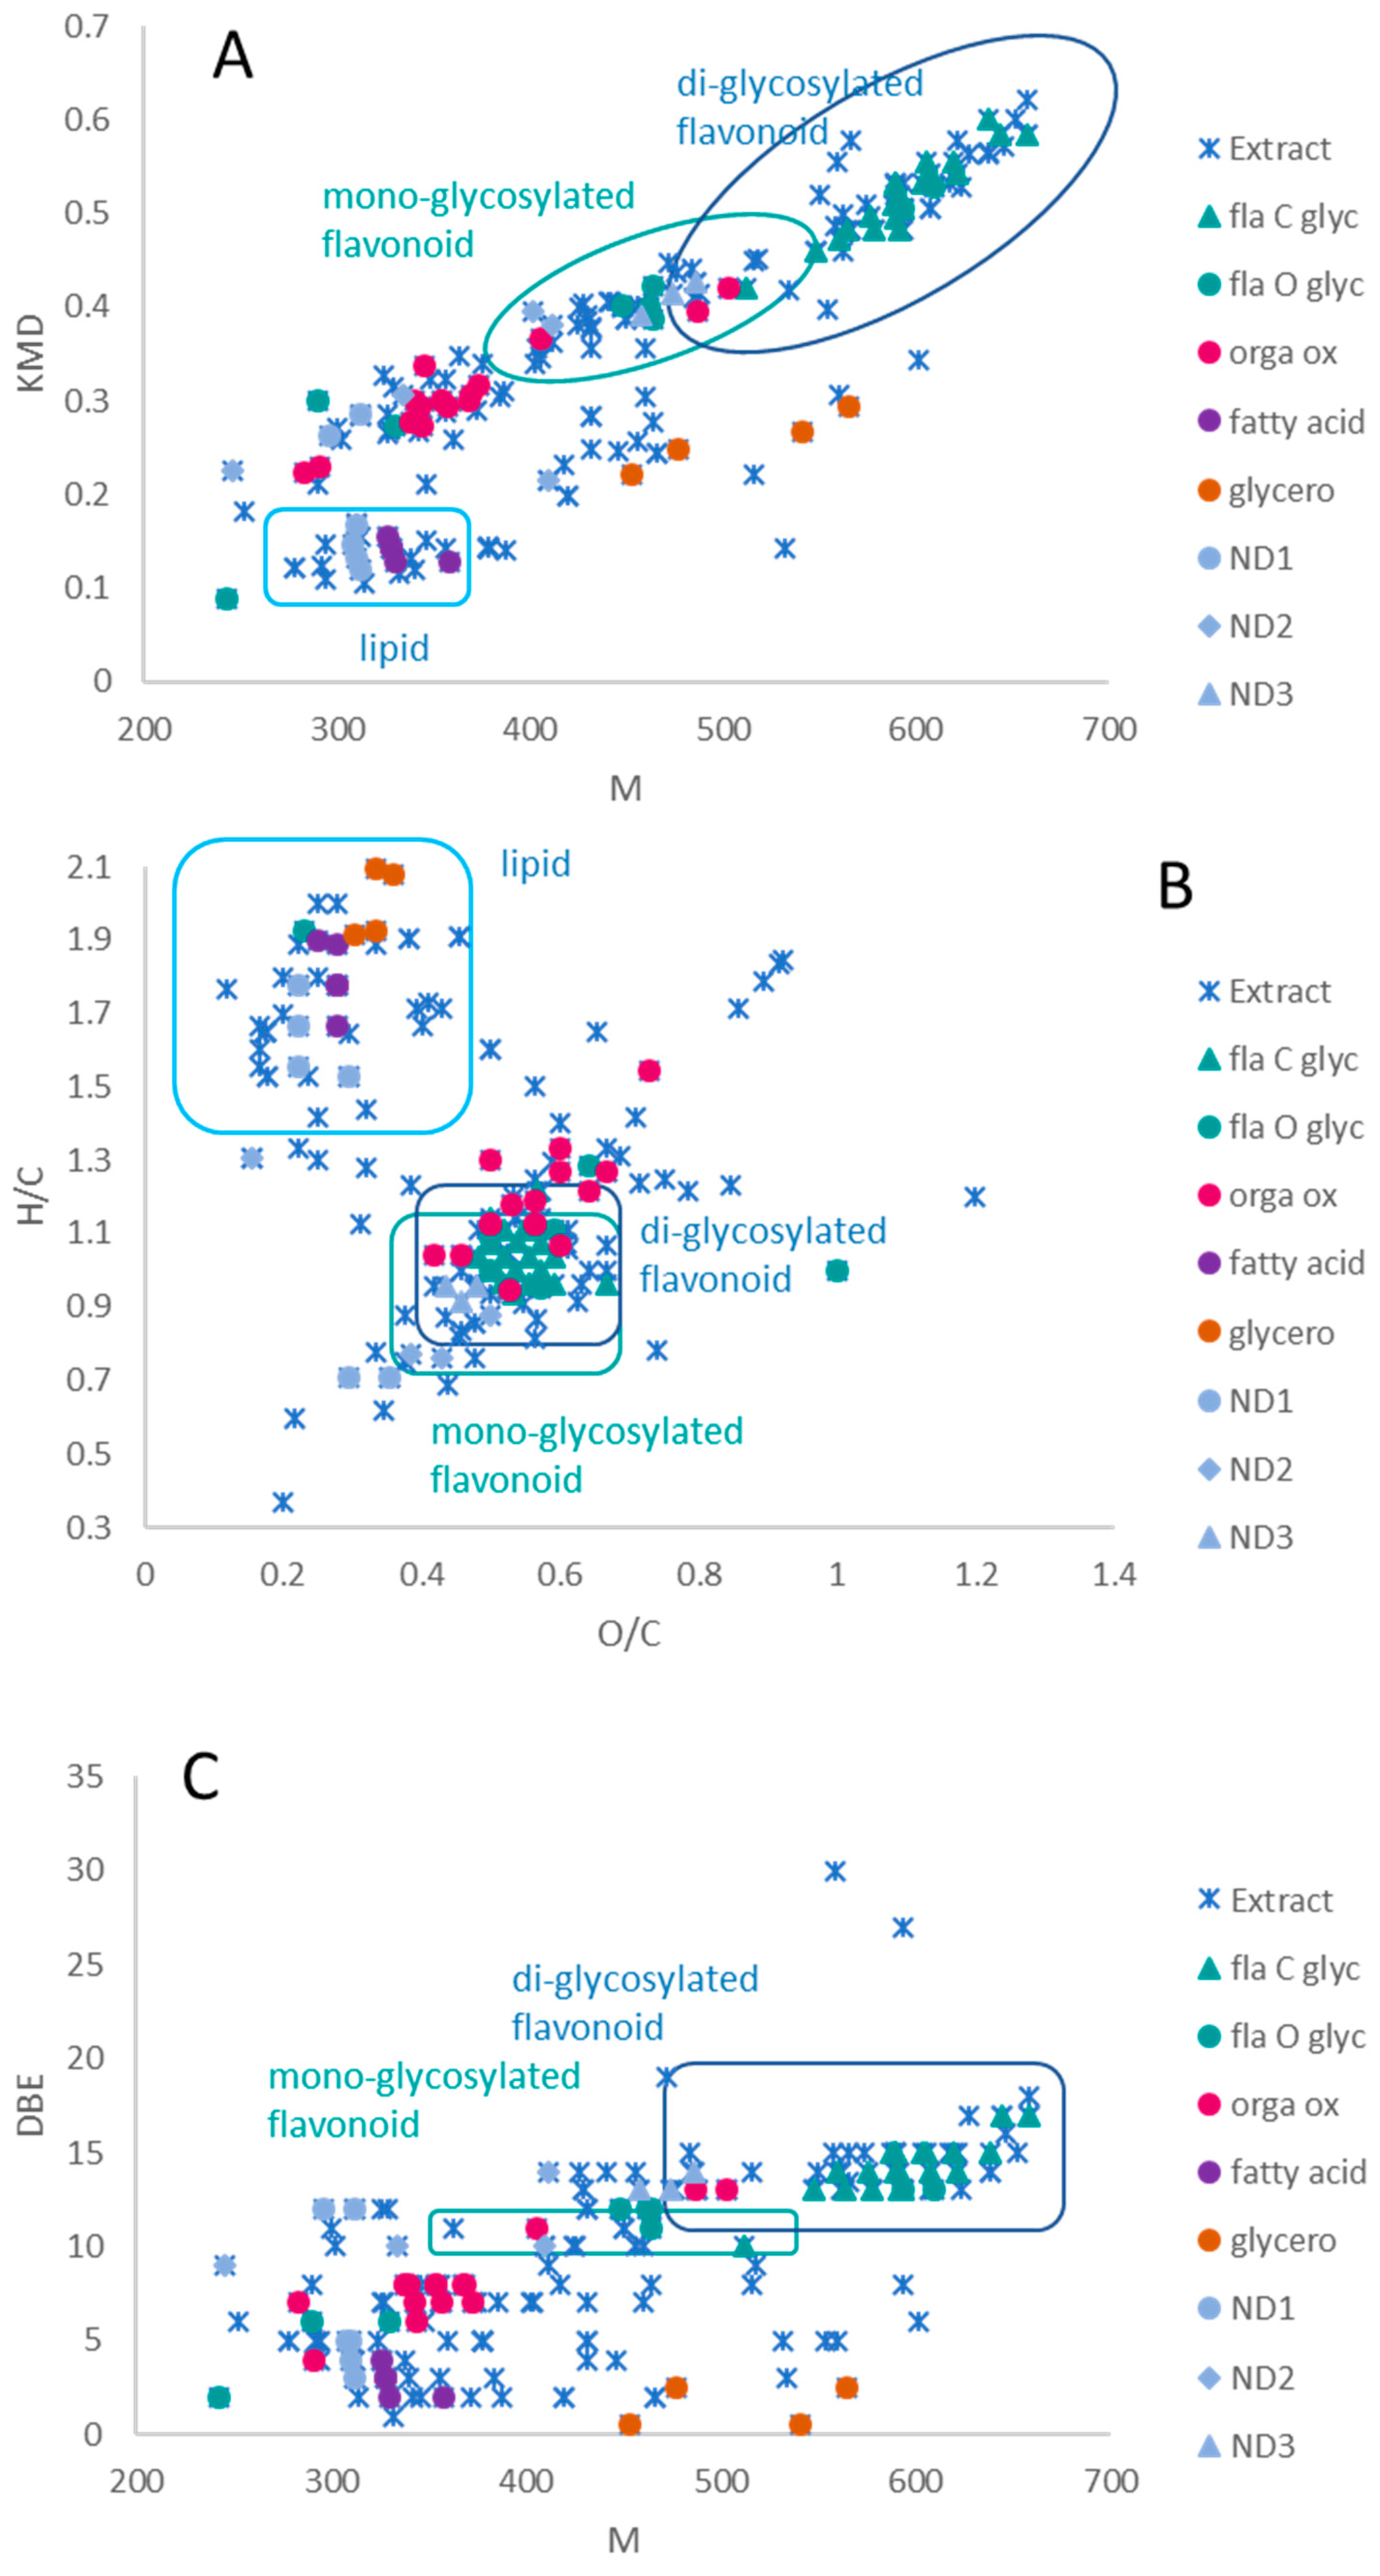
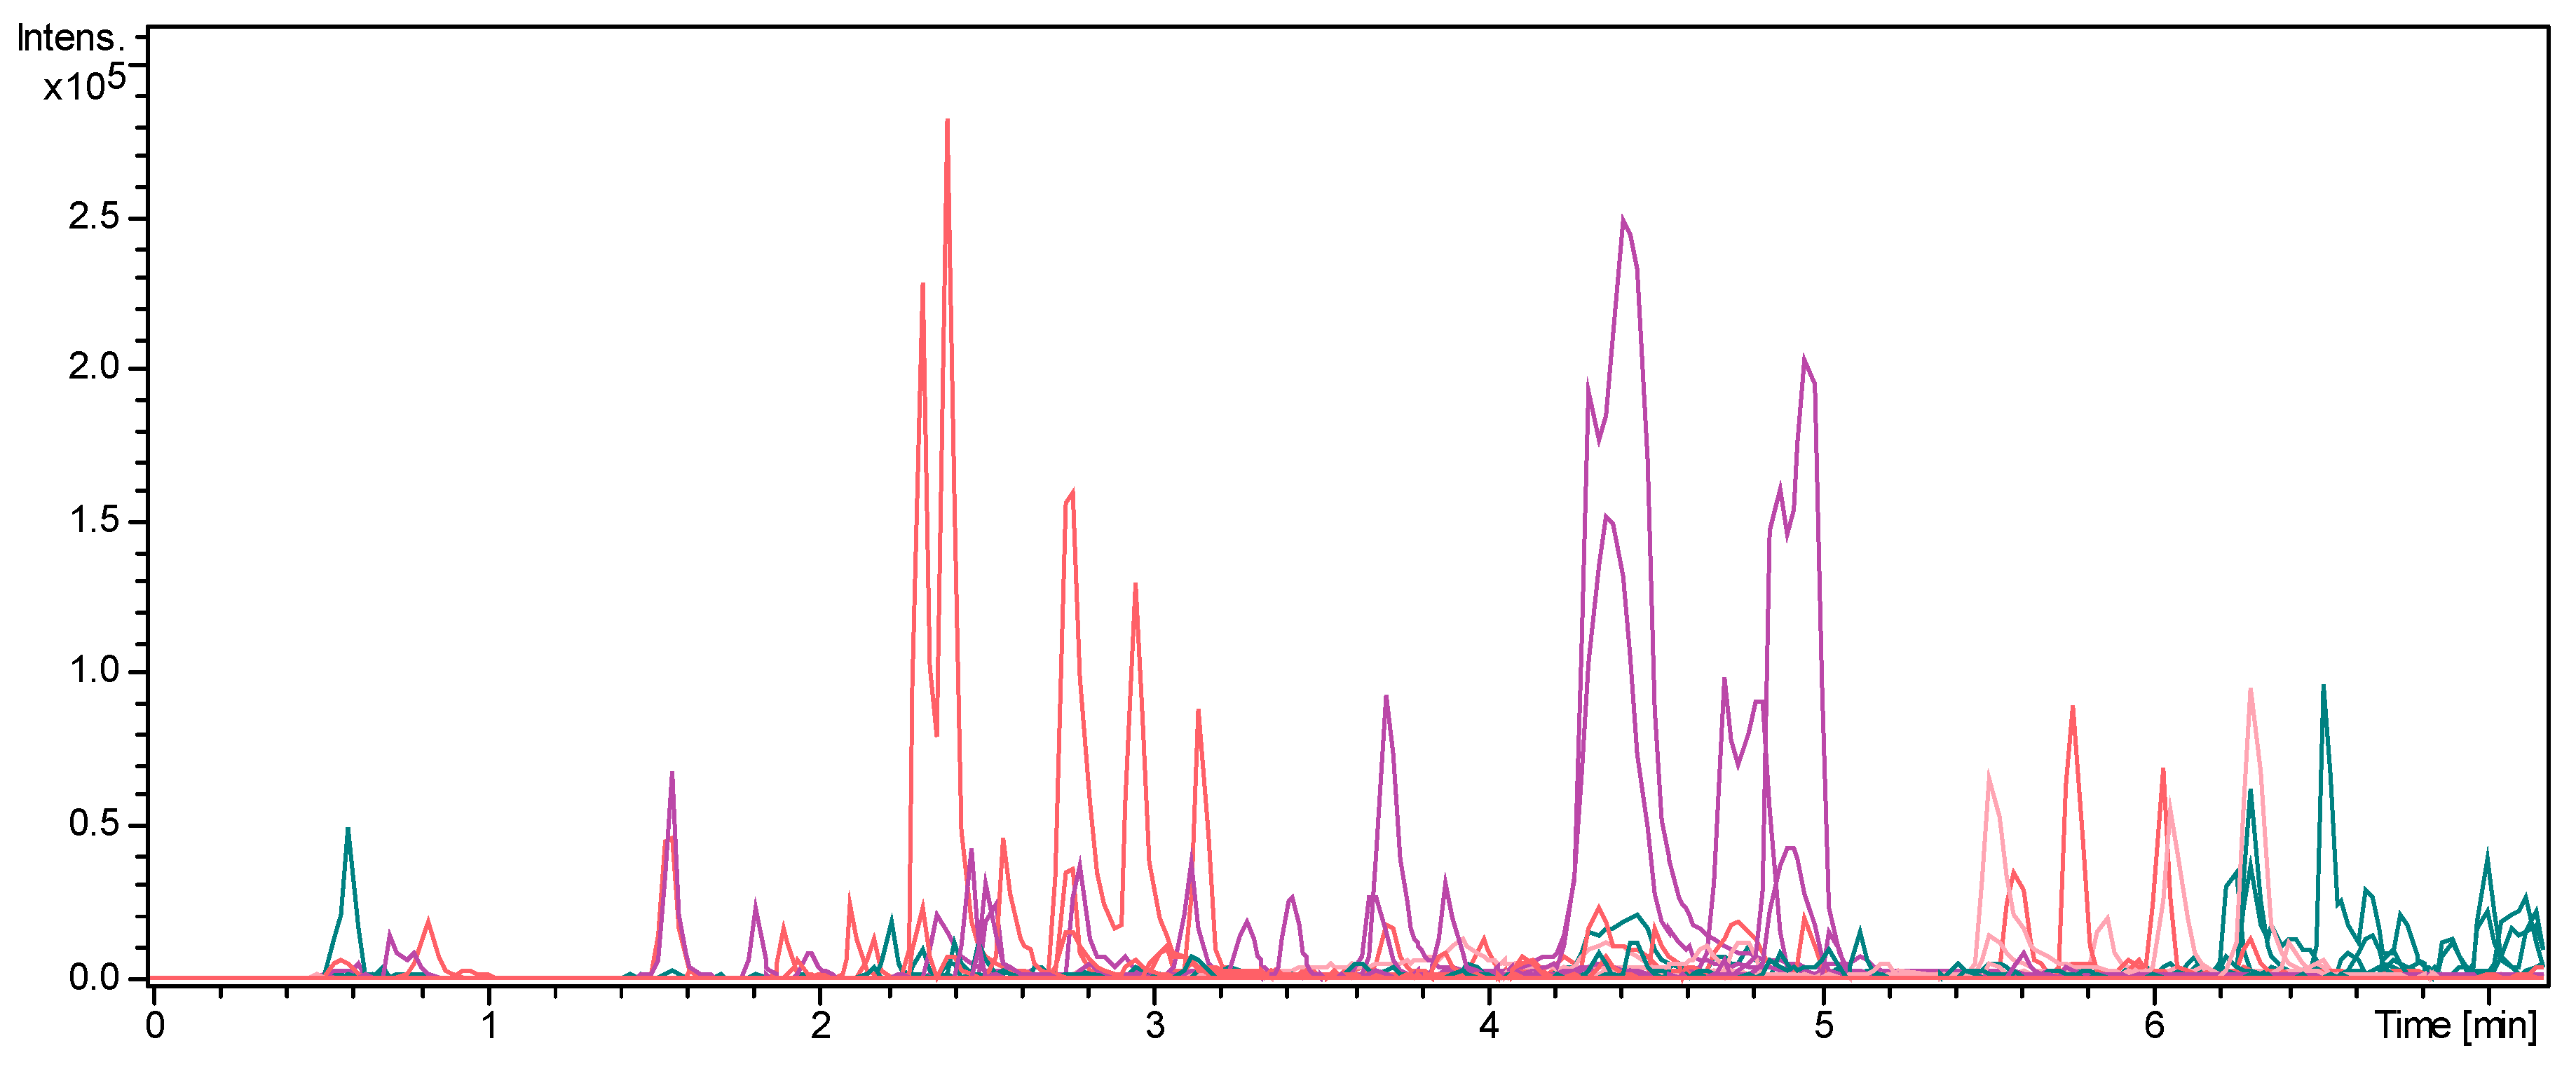
2.1. MS Mapping
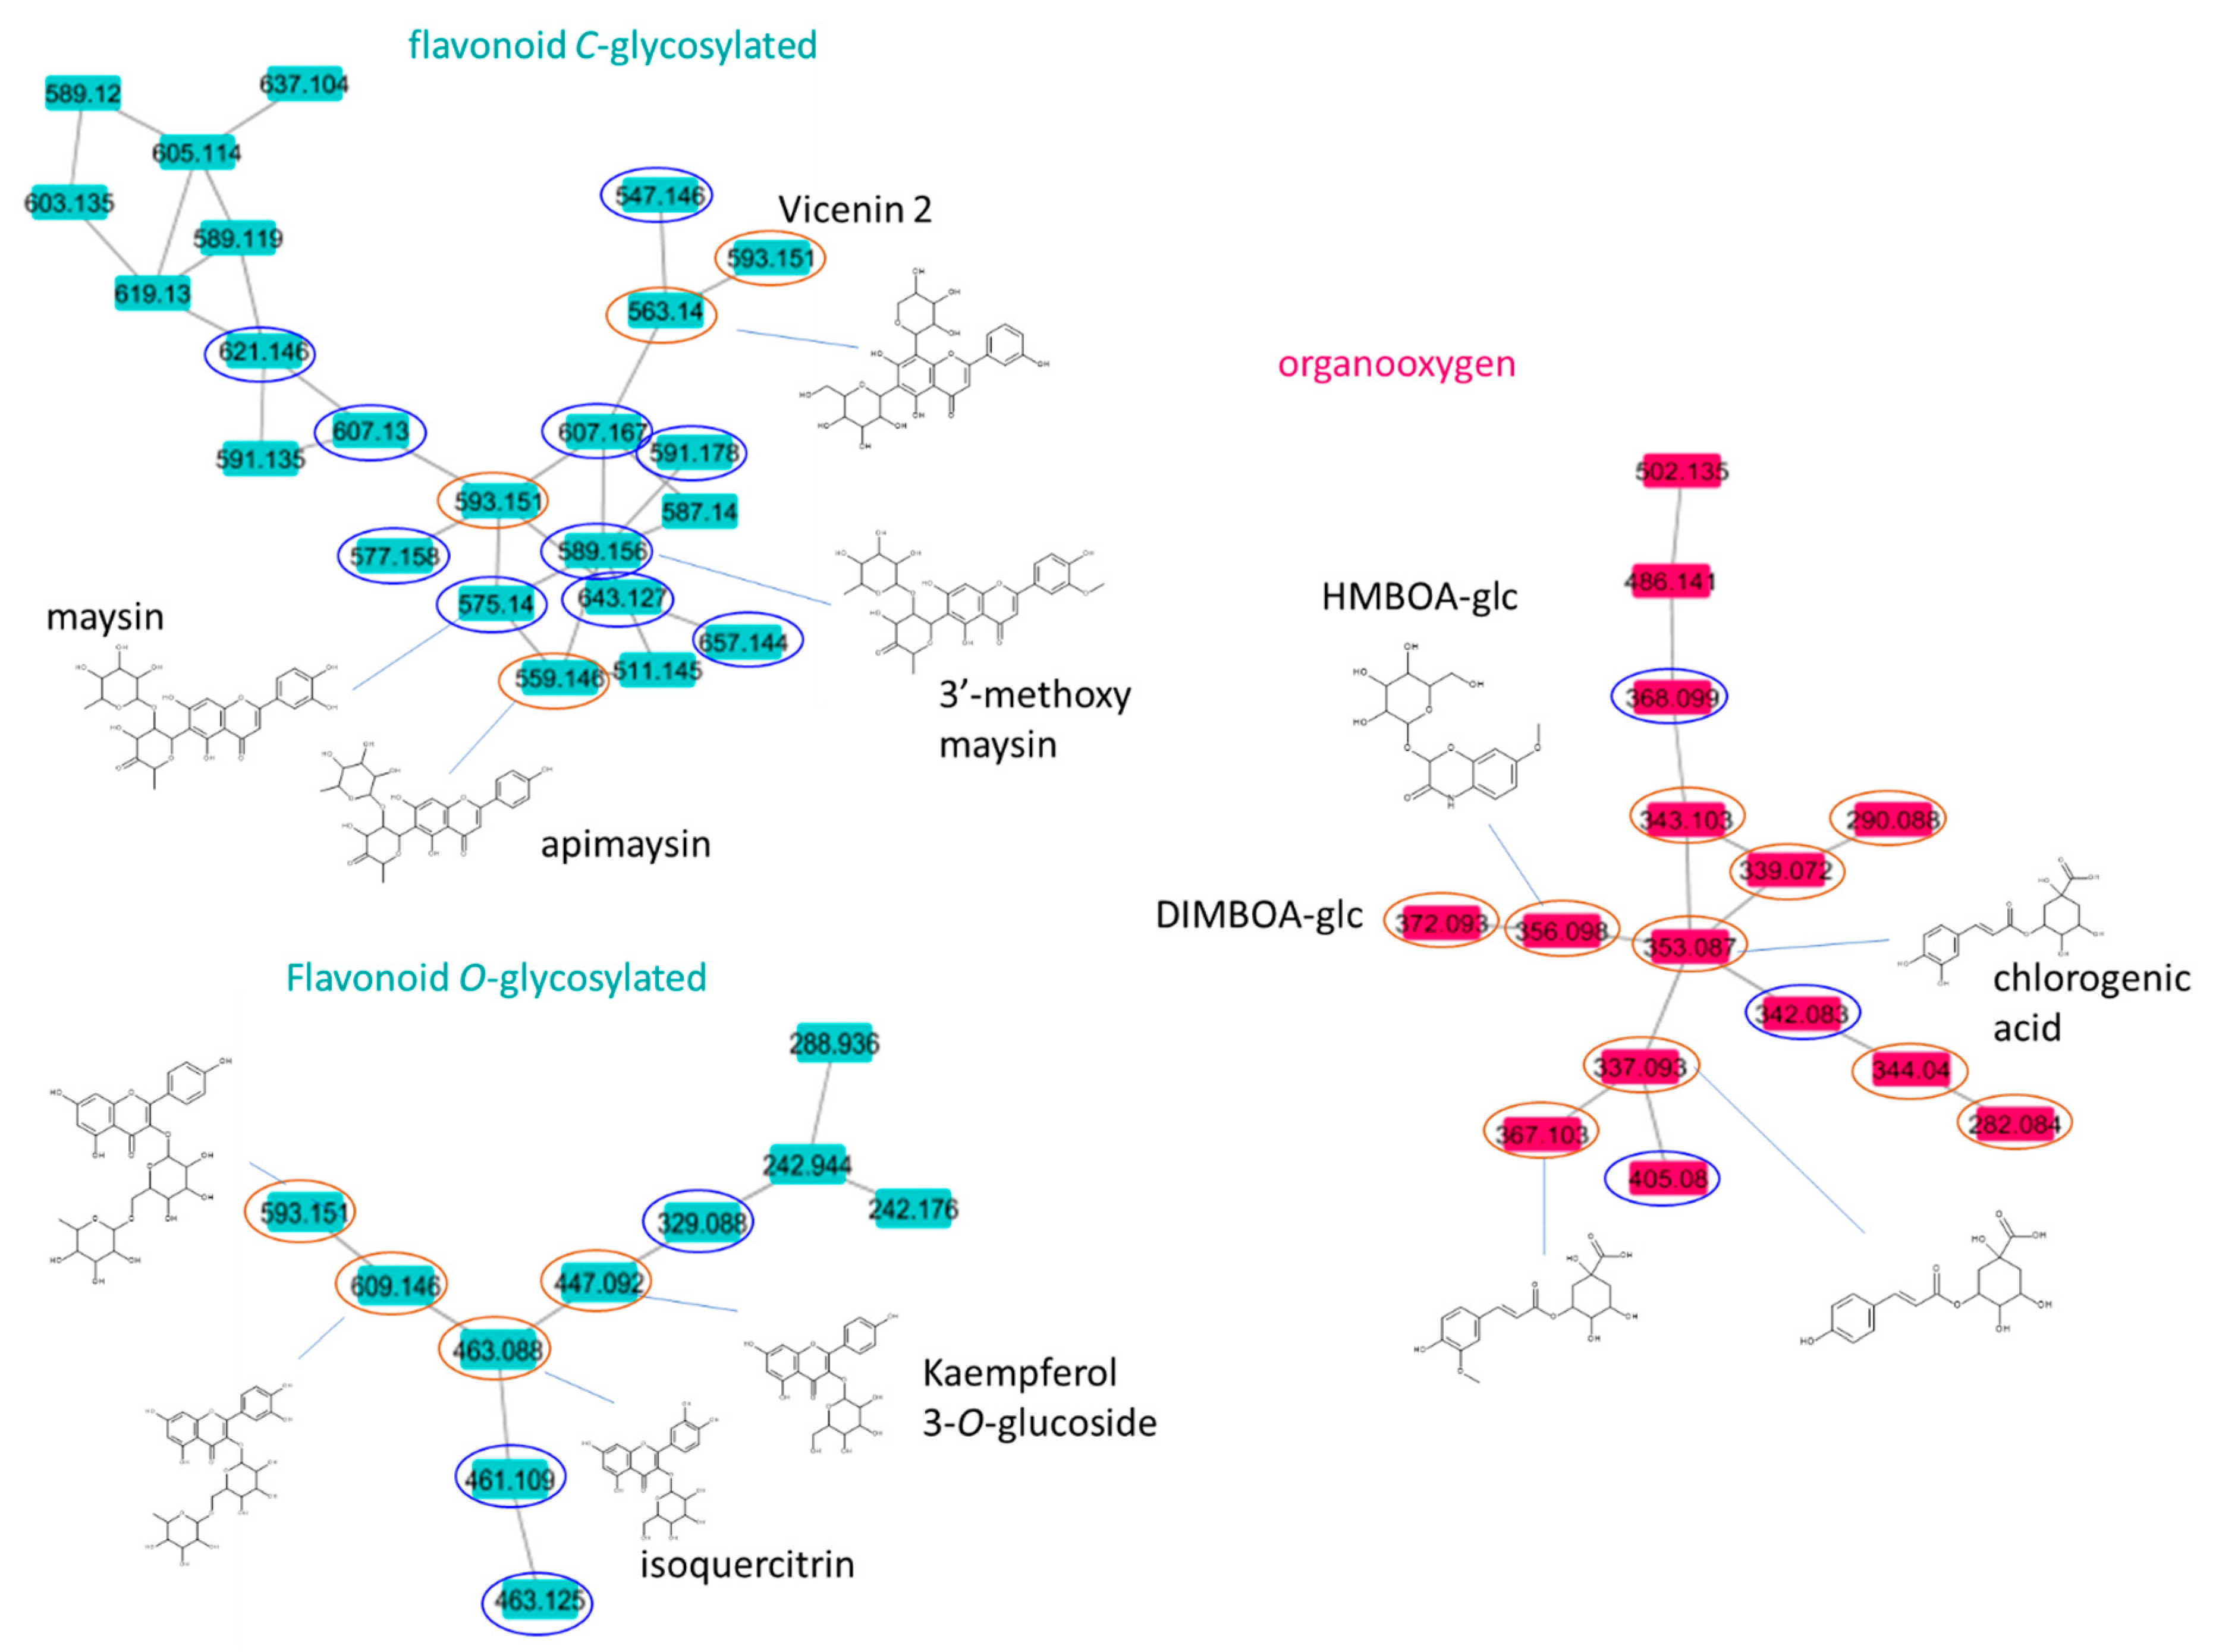
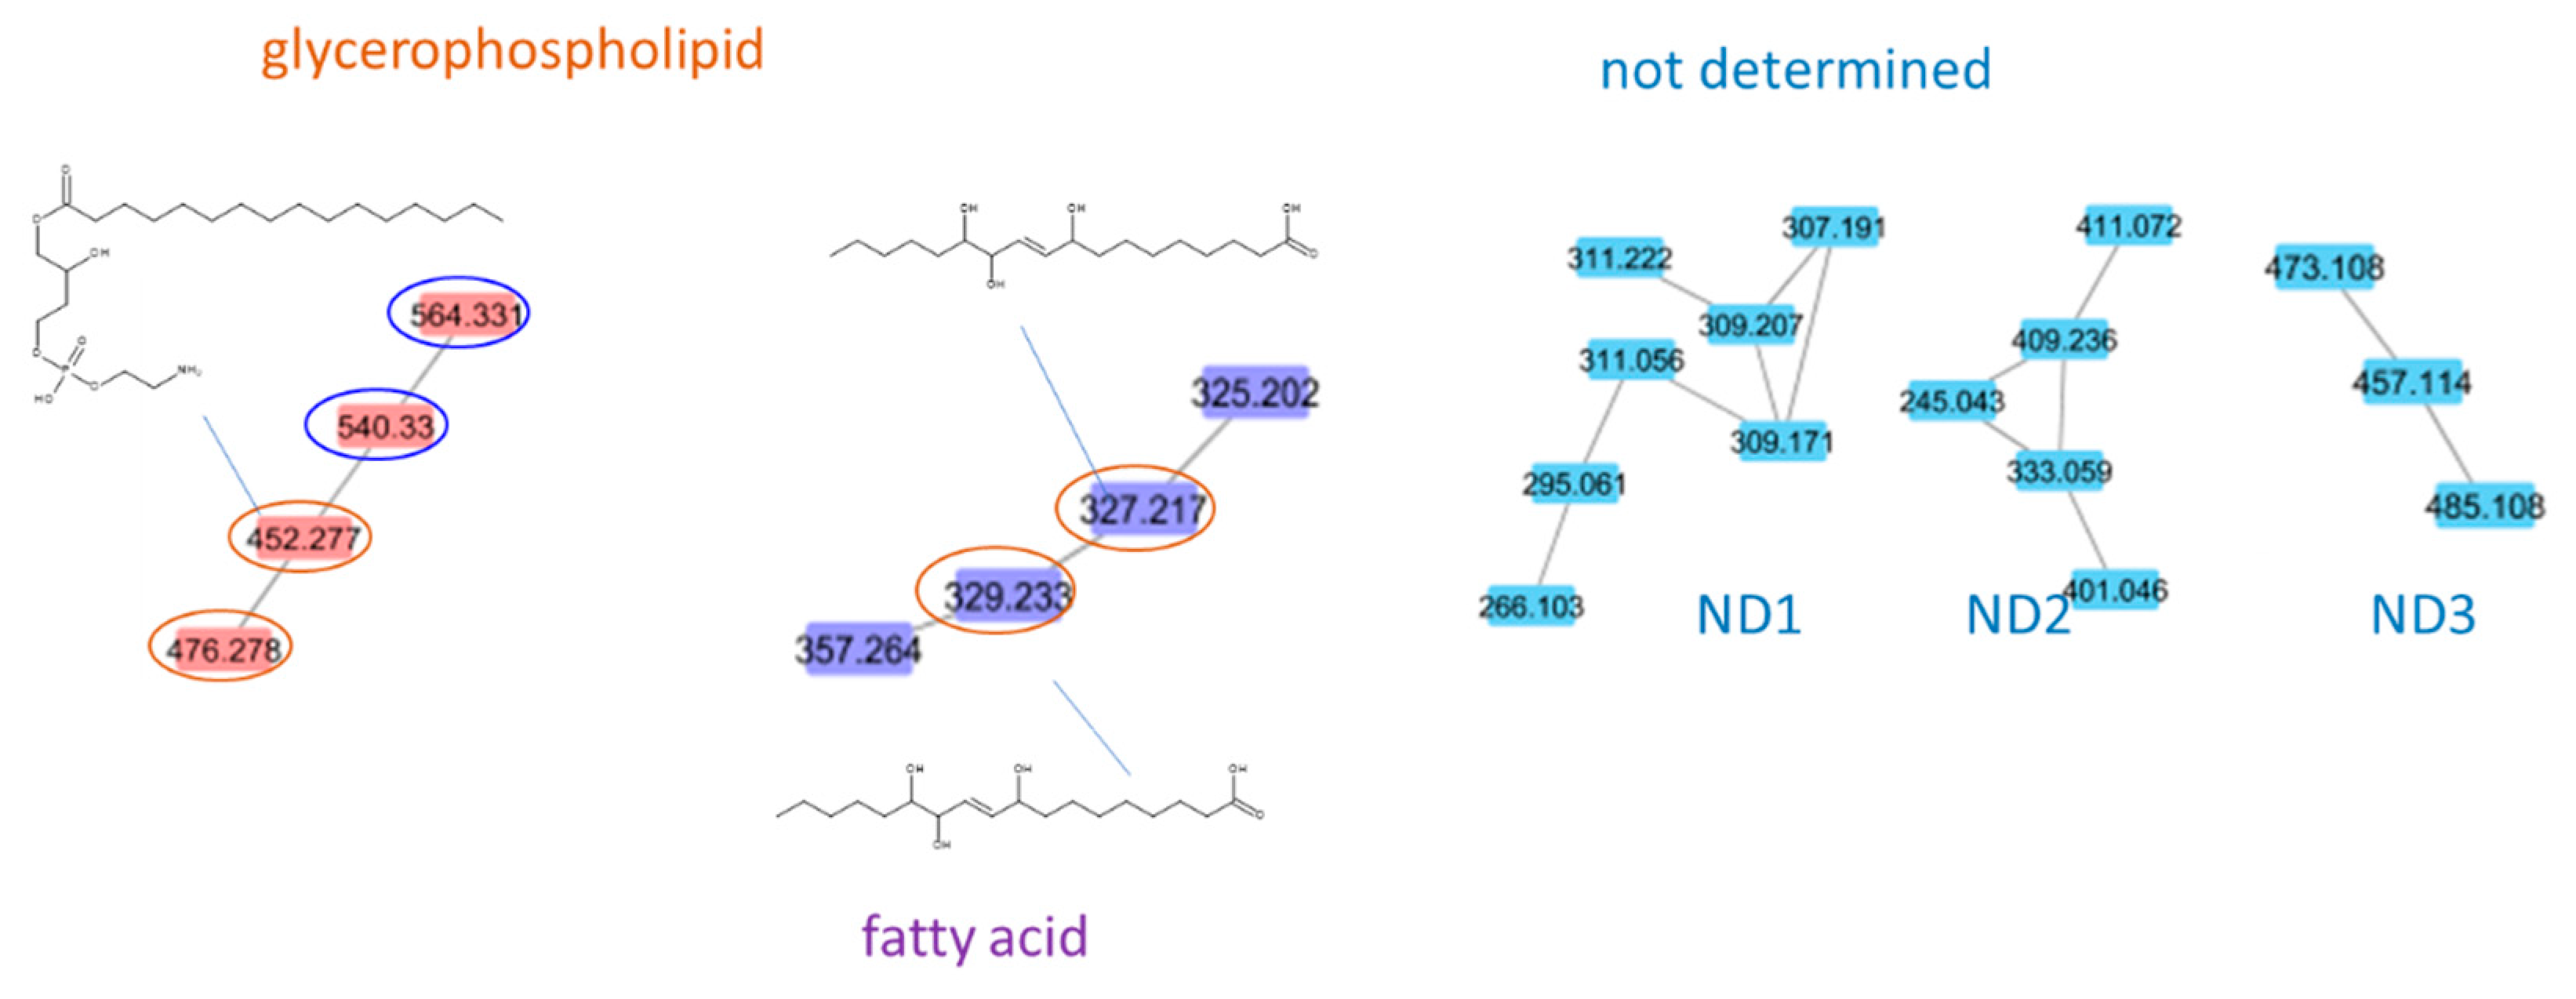
2.2. Mass Spectral Similarity Networking
3. Discussion
4. Materials and Methods
4.1. Chemicals
4.2. Plant Materials
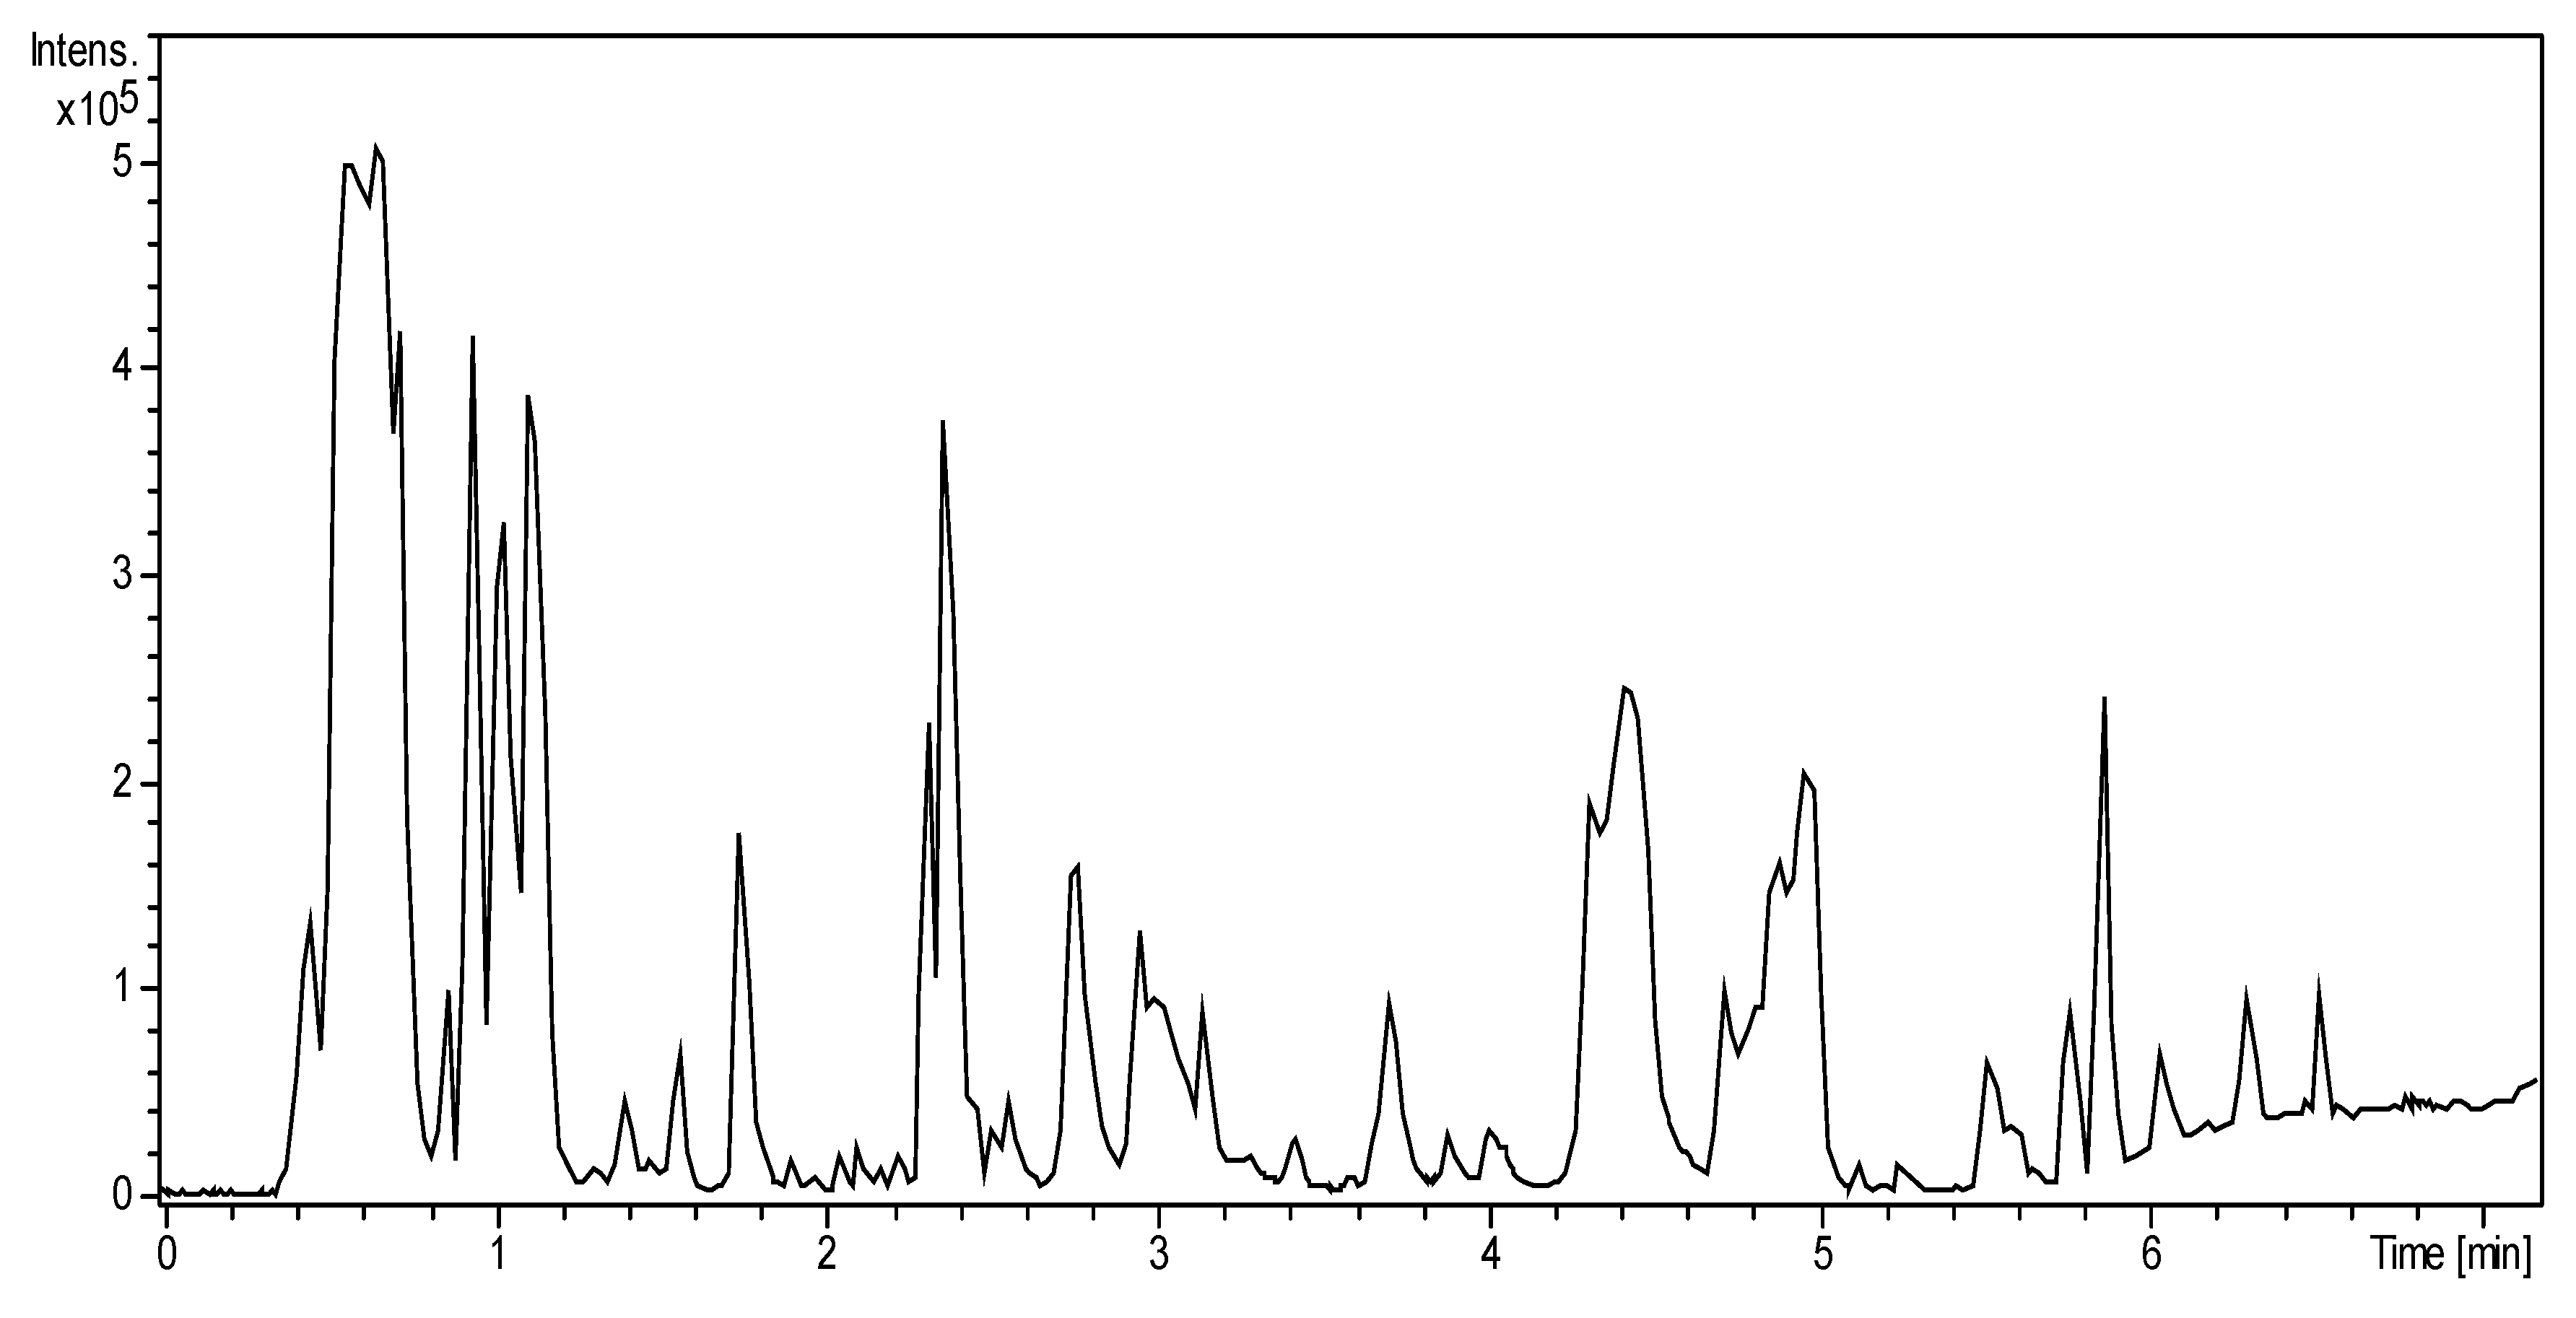
4.3. UHPLC/HRMS/MS
4.4. Bioinformatic Analysis
- https://gnps.ucsd.edu/ProteoSAFe/status.jsp?task=eb3a182150904040aadfc6dff7f135ca (accessed on 7 February 2022)
- https://gnps.ucsd.edu/ProteoSAFe/status.jsp?task=38dd1d6c49814e64ba1a6565a75e8b88 (accessed on 7 February 2022)
- https://gnps.ucsd.edu/ProteoSAFe/status.jsp?task=5deefe17fed148d49cf194bc2501ddb9 (accessed on 7 February 2022)
5. Conclusions
Author Contributions
Funding
Data Availability Statement
Acknowledgments
Conflicts of Interest
References
- Wynn, S.G.; Fougère, B.J. Veterinary Herbal Medicine; Mosby: Maryland Heights, MO, USA, 2007; Chapter 20; pp. 291–409. [Google Scholar]
- Rau, O.; Wurglics, M.; Dingermann, T.; Abdel-Tawab, M.; Schubert-Zsilavecz, M. Screening of herbal extracts for activation of the human peroxisome proliferator-activated receptor. Pharm. Int. J. Pharm. Sci. 2006, 61, 952–956. [Google Scholar]
- Kim, K.A.; Choi, S.-K.; Choi, H.-S. Corn silk induces nitric oxide synthase in murine macrophages. Exp. Mol. Med. 2004, 36, 545–550. [Google Scholar] [CrossRef]
- Zeringue, H.J., Jr. Identification and effects of maize silk volatiles on cultures of Aspergillus flavus. J. Agric. Food Chem. 2000, 48, 921–925. [Google Scholar] [CrossRef]
- El-Ghorab, A.; El-Massry, K.F.; Shibamoto, T. Chemical composition of the volatile extract and antioxidant activities of the volatile and nonvolatile extracts of Egyptian corn silk (Zea mays L.). J. Agric. Food Chem. 2007, 55, 9124–9127. [Google Scholar] [CrossRef]
- Maksimović, Z.A.; Kovačević, N. Preliminary assay on the antioxidative activity of Maydis stigma extracts. Fitoterapia 2003, 74, 144–147. [Google Scholar] [CrossRef]
- Namba, T.; Xu, H.; Kadota, S.; Hattori, M.; Takachi, T.; Kojima, Y. Inhibition of IgE formation in mice by glycoproteins from corn silk. Phytother. Res. 1993, 7, 227–230. [Google Scholar] [CrossRef]
- Da Hora, N.R.S.; Santana, L.F.; da Dilva, V.D.A.; Costa, S.L.; Zambotti-Villela, L.; Colepicolo, P.; Ferraz, C.G.; Ribeiro, P.R. Identification of bioactive metabolites from corn silk extracts by a combination of metabolite profiling, univariate statistical analysis and chemometrics. Food Chem. 2021, 365, 130479. [Google Scholar] [CrossRef]
- Hasanudin, K.; Hashim, P.; Mustafa, S. Corn silk (Stigma Maydis) in healthcare: A phytochemical and pharmacological review. Molecules 2012, 17, 9697–9715. [Google Scholar] [CrossRef]
- Bhaigyabati, T.; Kirithika, T.; Ramya, J.; Usha, K. Phytochemical constituents and antioxidant activity of various extract of corn silk (Zea mays. L). Res. J. Pharm. Biol. Chem. Sci. 2011, 2, 986–993. [Google Scholar]
- Snook, M.E.; Widstrom, N.W.; Wiseman, B.R.; Byrne, P.F.; Harwood, J.S.; Costello, C.E. New C4’ hydroxy derivatives of maysin and 3’ methoxymaysin isolated from corn silks. J. Agric. Food Chem. 1995, 43, 2740–2745. [Google Scholar] [CrossRef]
- Elliger, C.A.; Chan, B.G.; Waiss, A.C., Jr.; Lundin, R.E.; Haddon, W.F. C-glycosylflavones from zea mays that inhibit insect development. Phytochemistry 1980, 19, 293–297. [Google Scholar] [CrossRef]
- Ren, S.C.; Qiao, Q.Q.; Ding, X.L. Antioxidative activity of five flavones glycosides from corn silks. Czech J. Food Sci. 2013, 31, 148–155. [Google Scholar] [CrossRef] [Green Version]
- Suzuki, R.; Okada, Y.; Okuyama, T. A new flavone C glycoside from the zea mays with glycation inhibitory activity. Chem. Pharm. Bull. 2003, 51, 1186–1188. [Google Scholar] [CrossRef]
- Kim, S.L.; Kim, M.; Lee, Y.Y.; Jung, G.H.; Son, B.Y.; Lee, J.S.; Kwon, Y.U.; Park, Y.I. Isolation and identification of flavonoids from corn silk. Korean J. Crop Sci. 2014, 59, 435–444. [Google Scholar] [CrossRef]
- Žilić, S.; Janković, M.; Basić, Z.; Vančetović, J.; Maksimović, V. Antioxidant activity, phenolic profile, chlorophyll and mineral matter content of corn silk (Zea mays L): Comparison with medicinal herbs. .J. Cereal Sci. 2016, 69, 363–370. [Google Scholar] [CrossRef]
- Cambier, V.; Hance, T.; de Hoffmann, E. Variation of DIMBOA and related compounds content in relation to the age and plant organ in maize. Phytochemistry 2000, 53, 223–229. [Google Scholar] [CrossRef]
- Glauser, G.; Marti, G.; Villard, N.; Doyen, G.A.; Wolfender, J.L.; Turlings, T.C.J.; Erb, M. Induction and detoxification of maize 1,4-benzoxazin-3-ones by insect herbivores. Plant J. 2011, 68, 901–911. [Google Scholar] [CrossRef]
- Treutter, D. Significance of flavonoids in plant resistance: A review. Environ. Chem. Lett. 2006, 4, 147–157. [Google Scholar] [CrossRef]
- Rector, B.G.; Liang, G.; Guo, Y. Effect of maysin on wild-type, deltamethrin-resistant, and Bt-resistant Helicoverpa armigera (Lepidoptera: Noctuidae). J. Econ. Entomol. 2003, 96, 909–913. [Google Scholar] [CrossRef]
- Elliger, C.A.; Chan, B.C.; Waiss, A.C., Jr. C. Flavonoids as larval growth inhibitors. Naturwissenschaften 1980, 67, 358–360. [Google Scholar] [CrossRef]
- Rhino, B.; Verchere, A.; Thibaut, C.; Ratnadass, A. Field evaluation of sweet corn varieties for their potential as a trap crop for Helicoverpa zea under tropical conditions. Int. J. Pest Manag. 2016, 62, 3–10. [Google Scholar] [CrossRef]
- Fougère, L.; Rhino, B.; Elfakir, C.; Destandau, E. Comparison of the flavonoid profiles of corn silks to select efficient varieties as trap plants for Helicoverpa zea. J. Agric. Food Chem. 2020, 68, 5356–5364. [Google Scholar] [CrossRef] [PubMed]
- Kaur, P.; Singh, J.; Kaur, M.; Rasane, P.; Kaur, S.; Kaur, J.; Nanda, V.; Mehta, C.M.; Sowdhanya, D. Corn silk as an agricultural waste: A comprehensive review on its nutritional composition and bioactive potential. Waste Biomass Valorization 2022, 1–20. [Google Scholar] [CrossRef]
- Aukkanit, N.; Kemngoen, T.; Ponharn, N. Utilization of corn silk in low fat meatballs and its characteristics. Procedia Soc. Behav. Sci. 2015, 195, 1403–1410. [Google Scholar] [CrossRef]
- Rathahao-Paris, E.; Alves, S.; Junot, C.; Tabet, J.C. High resolution mass spectrometry for structural identification of metabolites in metabolomics. Metabolomics 2016, 12, 10. [Google Scholar] [CrossRef]
- Yang, J.Y.; Sanchez, L.M.; Rath, C.M.; Liu, X.; Boudreau, P.D.; Bruns, N.; Glukhov, E.; Wodtke, A.; de Felicio, R.; Fenner, A.; et al. Molecular networking as a dereplication strategy. J. Nat. Prod. 2013, 76, 1686–1699. [Google Scholar] [CrossRef]
- Said, I.H.; Truex, J.D.; Heidorn, C.; Retta, M.B.; Petrov, D.D.; Haka, S.; Kuhnert, N. LC-MS/MS based molecular networking approach for the identification of cocoa phenolic metabolites in human urine. Food Res. Int. 2020, 132, 109119. [Google Scholar] [CrossRef]
- Kuhnert, N.; Dairpoosh, F.; Yassin, G.; Golon, A.; Jaiswal, R. What is under the hump? Mass spectrometry based analysis of complex mixtures in processed food—Lessons from the characterisation of black tea thearubigins, coffee melanoidines and caramel. Food Funct. 2013, 4, 1130–1147. [Google Scholar] [CrossRef]
- Frost, S.; Lerno, L.A.; Zweigenbaum, J.; Heymann, H.; Ebeler, S.E. Characterization of red wine proanthocyanidins using a putative proanthocyanidin database, amide hydrophilic interaction liquid chromatography (HILIC), and time-of-flight mass spectrometry. Molecules 2018, 23, 2687. [Google Scholar] [CrossRef]
- Kendrick, E. A mass scale based on CH2=14.0000 for high resolution mass spectrometry of organic compounds. Anal. Chem. 1963, 35, 2146–2154. [Google Scholar] [CrossRef]
- Watrous, J.D.; Niiranen, T.J.; Lagerborg, K.A.; Henglin, M.; Xu, Y.J.; Rong, J.; Sharma, S.; Vasan, R.S.; Larson, M.G.; Armando, A.; et al. Directed non-targeted mass spectrometry and chemical networking for discovery of eicosanoids and related oxylipins. Cell Chem. Biol. 2019, 26, 433–442. [Google Scholar] [CrossRef]
- Kim, S.; Kramer, R.W.; Hatcher, P.G. Graphical method for analysis of ultrahigh-resolution broadband mass spectra of natural organic matter, the van Krevelen diagram. Anal. Chem. 2003, 75, 5336–5344. [Google Scholar] [CrossRef]
- Kuhnert, N. Unraveling the structure of the black tea thearubigins. Arch. Biochem. Biophys. 2010, 501, 37–51. [Google Scholar] [CrossRef]
- Rivas-Ubach, A.; Liu, Y.; Bianchi, T.S.; Tolić, N.; Jansson, C.; Paša-Tolić, L. Moving beyond the van Krevelen diagram: A new stoichiometric approach for compound classification in organisms. Anal. Chem. 2018, 90, 6152–6160. [Google Scholar] [CrossRef]
- Extrasynthese. Available online: https://www.extrasynthese.com/ (accessed on 1 December 2019).
- Rutz, A.; Liu, Y.; Sorokina, M.; Galgonek, J.; Mietchen, D.; Willighagen, E.; Gaudry, A.; Graham, J.; Stephan, R.; Page, R.; et al. The LOTUS initiative for open natural products research: Knowledge management through wikidata. bioRxiv 2021, 0228, 433265. [Google Scholar] [CrossRef]
- Tinte, M.M.; Masike, K.; Steenkamp, P.A.; Huyser, J.; van der Hooft, J.J.J.; Tugizimana, F. Computational metabolomics tools reveal metabolic reconfigurations underlying the effects of biostimulant seaweed extracts on maize plants under drought stress conditions. Metabolites 2022, 12, 487. [Google Scholar] [CrossRef]
- Nurraihana, H.; Wan Rosli, W.I.; Sabreena, S.; Norfarizan-Hanoon, N.A. Optimisation extraction procedure and identification of phenolic compounds from fractional extract of corn silk (Zea maus hair) using LC-TOF/MS system. J. Food Meas. Charac. 2018, 12, 1852–1862. [Google Scholar] [CrossRef]
- Desmet, S.; Saeys, Y.; Verstaen, K.; Dauwe, R.; Kim, H.; Niculaes, C.; Fukushima, A.; Goeminne, G.; Vanholme, R.; Ralph, J.; et al. Maize specialized metabolome networks reveal organ-preferential mixed glycosides. Comput. Struct. Biotech. J. 2021, 19, 1127–1144. [Google Scholar] [CrossRef]
- Wolfender, J.L.; Allard, P.M.; Kubo, M.; Queiroz, E.F. Metabolomics strategies for the dereplication of polyphenols and other metabolites in complex natural extracts. In Recent Advances in Polyphenol Research, 1st ed.; Halbwirth, H., Stich, K., Cheynier, V., Quideau, S., Eds.; Wiley: Hoboken, NJ, USA, 2019; Volume 6, pp. 183–205. [Google Scholar] [CrossRef]
- Pilon, A.C.; Gu, H.; Raftery, D.; da Silva Bolzani, V.; Lopes, N.P.; Castro-Gamboa, I.; Neto, F.C. Mass spectral similarity networking and gas-phase fragmentation reactions in the structural analysis of flavonoid glycoconjugates. Anal. Chem. 2019, 91, 10413–10423. [Google Scholar] [CrossRef]
- Kouamé, T.; Okpekon, T.; Bony, N.F.; Ferron, S.; Bonnaffé, D.; Vanheuverzwijn, J.; Zhou, Z.; Fontaine, V.; N’Tanon, A.D.; Gallard, J.-F.; et al. Anticipate, target and characterize: MS²-anticipated C-glycosylflavones from Erythrococaa anomala. Planta Med. Int. Open 2021, 8, e131–e142. [Google Scholar] [CrossRef]
- Miao, Y.; Lu, J.; Huang, H.; Cao, D.; Zhang, S. Molecular characterization of root exudates using Fourier transform ion cyclotron resonance mass spectrometry. J. Environ. Sci. 2020, 98, 22–30. [Google Scholar] [CrossRef] [PubMed]
- Wang, M.; Carver, J.J.; Phelan, V.V.; Sanchez, L.M.; Garg, N.; Peng, Y.; Nguyen, D.D.; Wartrous, J.; Kapono, C.A.; Luzzatto-Knaan, T.; et al. Sharing and community curation of mass spectrometry data with Global Natural Products Social Molecular Networking. Nat. Biotechnol. 2016, 34, 828–837. [Google Scholar] [CrossRef] [PubMed]
- Van der Hooft, J.J.J.; Wandy, J.; Barret, M.P.; Burgess, K.E.V.; Rogers, S. Topic modeling for untargeted substructure exploration in metabolomics. Proc. Natl. Acad. Sci. USA 2016, 113, 13738–13743. [Google Scholar] [CrossRef]
- Ernst, M.; Kang, K.B.; Caraballo-Rodríguez, A.M.; Nothias, L.F.; Chen, C.; Wang, M.; Rogers, S.; Medema, M.H.; Dorrestein, P.C.; van der Hooft, J.J.J. MolNetEnhancer: Enhanced molecular networks by integrating metabolome mining and annotation tools. Metabolites 2019, 9, 144. [Google Scholar] [CrossRef] [PubMed] [Green Version]


| O/C | H/C | N/C | |
|---|---|---|---|
| Carbohydrates | ≥0.8 | ≥1.65, <2.7 | |
| Terpenes | ≥0.2, ≤0.5 | ≥0.8, ≤1.7 | |
| Lipids | ≤0.6 | ≥1.32 | ≤0.126 |
| Phenolic compounds | ≥0.3, ≤0.9 | ≥0.6, ≤1.5 |
| Compound | Retention Time (min) | m/z | Molecular Mass (Da) | Kendric Mass Defect (KMD) | Molecular Formula | H/C | O/C | Double Bond Equivalent (DBE) | Lipid (C: Double Bond + O off Acid) |
|---|---|---|---|---|---|---|---|---|---|
| 1 | 6.96 | 277.1808 | 278 | 0.123 | C17H26O3 | 1.53 | 0.18 | 5 | FA 17:4 + O |
| 2 | 7.00 | 277.1808 | 278 | 0.123 | C17H26O3 | 1.53 | 0.18 | 5 | FA 17:4 + O |
| 3 | 6.24 | 293.1754 | 294 | 0.146 | C17H26O4 | 1.53 | 0.24 | 5 | FA 17:4 + 2O |
| 4 | 5.96 | 309.1725 | 310 | 0.167 | C17H26O5 | 1.53 | 0.29 | 5 | FA 17:4 + 3O |
| 5 | 6.25 | 309.1703 | 310 | 0.169 | C17H26O5 | 1.53 | 0.29 | 5 | FA 17:4 + 3O |
| 6 | 6.10 | 311.1862 | 312 | 0.155 | C17H28O5 | 1.65 | 0.29 | 4 | FA 17:3 + 3O |
| 7 | 6.88 | 291.196 | 292 | 0.123 | C18H28O3 | 1.56 | 0.17 | 5 | FA 18:4 + O |
| 8 | 6.65 | 307.1911 | 308 | 0.146 | C18H28O4 | 1.56 | 0.22 | 5 | FA 18:4 + 2O |
| 9 | 7.64 | 293.2117 | 294 | 0.11 | C18H30O3 | 1.67 | 0.17 | 4 | FA 18:3 + O |
| 10 | 6.75 | 309.2068 | 310 | 0.132 | C18H30O4 | 1.67 | 0.22 | 4 | FA 18:3 + 2O |
| 11 | 5.83 | 325.2014 | 326 | 0.156 | C18H30O5 | 1.67 | 0.28 | 4 | FA 18:3 + 3O |
| 12 | 6.49 | 325.2016 | 326 | 0.155 | C18H30O5 | 1.67 | 0.28 | 4 | FA 18:3 + 3O |
| 13 | 6.61 | 311.2222 | 312 | 0.119 | C18H32O4 | 1.78 | 0.22 | 3 | FA 18:2 + 2O |
| 14 | 6.98 | 311.2223 | 312 | 0.119 | C18H32O4 | 1.78 | 0.22 | 3 | FA 18:2 + 2O |
| 15 | 5.59 | 327.2173 | 328 | 0.142 | C18H32O5 | 1.78 | 0.28 | 3 | FA 18:2 + 3O |
| 16 | 6.01 | 327.2171 | 328 | 0.142 | C18H32O5 | 1.78 | 0.28 | 3 | FA 18:2 + 3O |
| 17 | 6.3 | 327.2165 | 328 | 0.143 | C18H32O5 | 1.78 | 0.28 | 3 | FA 18:2 + 3O |
| 18 | 6.95 | 313.2383 | 314 | 0.105 | C18H34O4 | 1.89 | 0.22 | 2 | FA 18:1 + 2O |
| 19 | 5.73 | 329.2327 | 330 | 0.129 | C18H34O5 | 1.89 | 0.28 | 2 | FA 18:1 + 3O |
| 20 | 6.20 | 331.2488 | 332 | 0.115 | C18H36O5 | 2 | 0.28 | 1 | FA 18:0 + 3O |
| 21 | 7.57 | 337.2374 | 338 | 0.133 | C20H34O4 | 1.7 | 0.2 | 4 | FA 20:3 + 2O |
| 22 | 7.83 | 339.2532 | 340 | 0.119 | C20H36O4 | 1.8 | 0.2 | 3 | FA 20:2 + 2O |
| 23 | 6.72 | 355.2484 | 356 | 0.142 | C20H36O5 | 1.8 | 0.25 | 3 | FA 20:2 + 3O |
| 24 | 6.42 | 357.2642 | 358 | 0.129 | C20H38O5 | 1.9 | 0.25 | 2 | FA 20:1 + 3O |
| 25 | 5.91 | 377.2708 | 378 | 0.144 | C23H38O4 | 1.65 | 0.17 | 5 | FA 23:4 + 2O |
| 26 | 6.08 | 377.2716 | 378 | 0.144 | C23H38O4 | 1.65 | 0.17 | 5 | FA 23:4 + 2O |
| 27 | 6.30 | 377.272 | 378 | 0.143 | C23H38O4 | 1.65 | 0.17 | 5 | FA 23:4 + 2O |
| 28 | 6.52 | 377.272 | 378 | 0.143 | C23H38O4 | 1.65 | 0.17 | 5 | FA 23:4 + 2O |
| 29 | 6.74 | 377.2722 | 378 | 0.143 | C23H38O4 | 1.65 | 0.17 | 5 | FA 23:4 + 2O |
| Compound | Retention Time (min) | m/z | Molecular Mass (Da) | Kendric Mass Defect (KMD) | Molecular Formula | H/C | O/C | Double Bond Equivalent (DBE) | Description |
|---|---|---|---|---|---|---|---|---|---|
| 1 | 3.69 | 547.1455 | 548 | 0.459 | C26H28O13 | 1.077 | 0.500 | 13 | flavone + 3O digly |
| 2 | 3.99 | 547.146 | 548 | 0.459 | C26H28O13 | 1.077 | 0.500 | 13 | flavone + 3O digly |
| 3 | 2.77 | 563.1402 | 564 | 0.482 | C26H28O14 | 1.077 | 0.538 | 13 | flavone + 3O digly * Schaftoside |
| 4 | 5.06 | 557.1299 | 558 | 0.486 | C27H26O13 | 0.963 | 0.481 | 15 | |
| 5 | 4.79 | 573.1248 | 574 | 0.509 | C27H26O14 | 0.963 | 0.519 | 15 | |
| 6 | 3.90 | 589.12 | 590 | 0.531 | C27H26O15 | 0.963 | 0.556 | 15 | flavone + 4O digly |
| 7 | 6.05 | 589.119 | 590 | 0.532 | C27H26O15 | 0.963 | 0.556 | 15 | flavone + 4O digly |
| 8 | 5.48 | 605.114 | 606 | 0.554 | C27H26O16 | 0.963 | 0.593 | 15 | |
| 9 | 5.55 | 621.1088 | 622 | 0.579 | C27H26O17 | 0.963 | 0.629 | 15 | flavone + 4O digly |
| 10 | 5.53 | 637.104 | 638 | 0.601 | C27H26O18 | 0.963 | 0.667 | 15 | |
| 11 | 4.76 | 559.1453 | 560 | 0.473 | C27H28O13 | 1.037 | 0.481 | 14 | flavone + 3O digly * apimaysin |
| 12 | 4.25 | 575.1401 | 576 | 0.496 | C27H28O14 | 1.037 | 0.519 | 14 | flavone + 4O digly * maysin |
| 13 | 4.79 | 591.1344 | 592 | 0.519 | C27H28O15 | 1.037 | 0.556 | 14 | flavone + 4O digly |
| 14 | 4.34 | 607.1299 | 608 | 0.542 | C27H28O16 | 1.037 | 0.592 | 14 | flavone + 4O digly |
| 15 | 4.57 | 561.1614 | 562 | 0.459 | C27H30O13 | 1.111 | 0.481 | 13 | flavone + 3O digly |
| 16 | 3.05 | 577.1559 | 578 | 0.482 | C27H30O14 | 1.111 | 0.519 | 13 | flavone + 3O digly |
| 17 | 3.11 | 577.1563 | 578 | 0.482 | C27H30O14 | 1.111 | 0.519 | 13 | flavone + 3O digly |
| 18 | 4.09 | 577.1552 | 578 | 0.483 | C27H30O14 | 1.111 | 0.519 | 13 | flavone + 3O digly |
| 19 | 2.54 | 593.1511 | 594 | 0.505 | C27H30O15 | 1.111 | 0.556 | 13 | flavone + 3O digly * vicenin 2 |
| 20 | 2.79 | 593.1511 | 594 | 0.505 | C27H30O15 | 1.111 | 0.556 | 13 | flavone + 3O digly |
| 21 | 3.65 | 593.1511 | 594 | 0.505 | C27H30O15 | 1.111 | 0.556 | 13 | flavone + 4O digly * luteolin 7-O-neohesperidoside |
| 22 | 3.82 | 593.1511 | 594 | 0.505 | C27H30O15 | 1.111 | 0.556 | 13 | flavone + 4O digly * isoorientin 2″-O-rhamnoside |
| 23 | 3.12 | 609.146 | 610 | 0.528 | C27H30O16 | 1.111 | 0.593 | 13 | flavone + 5O digly * calendoflavobioside |
| 24 | 5.21 | 587.1399 | 588 | 0.509 | C28H28O14 | 1.000 | 0.5 | 15 | |
| 25 | 4.63 | 603.135 | 604 | 0.532 | C28H28O15 | 1.000 | 0.536 | 15 | |
| 26 | 6.29 | 619.13 | 620 | 0.555 | C28H28O16 | 1.000 | 0.571 | 15 | |
| 27 | 3.71 | 651.1204 | 652 | 0.600 | C28H28O18 | 1.000 | 0.643 | 15 | flavone + 4O digly * luteolin 3′-methylether 7-flucuronosyl-(1–>2)-glucuronide |
| 28 | 4.91 | 589.1559 | 590 | 0.496 | C28H30O14 | 1.071 | 0.500 | 14 | flavone + 4O digly * 3′-methoxymaysin |
| 29 | 4.96 | 621.1459 | 622 | 0.542 | C28H30O16 | 1.071 | 0.571 | 14 | flavone + 4O digly |
| 30 | 3.62 | 637.1414 | 638 | 0.564 | C28H30O17 | 1.071 | 0.607 | 14 | flavone + 4O digly |
| 31 | 3.97 | 637.1408 | 638 | 0.564 | C28H30O17 | 1.071 | 0.607 | 14 | flavone + 4O digly |
| 32 | 5.06 | 591.1723 | 592 | 0.482 | C28H32O14 | 1.143 | 0.5 | 13 | flavone + 4O digly * ax-4″-hydroxy-3′-methoxymaysin |
| 33 | 3.84 | 607.1664 | 608 | 0.505 | C28H32O15 | 1.143 | 0.536 | 13 | flavone + 4O digly * 2″-O-L-rhamnosyl-6-C-fucosyl-3′-methoxylluteolin |
| 34 | 4.34 | 607.1663 | 608 | 0.506 | C28H32O15 | 1.143 | 0.536 | 13 | flavone + 4O digly |
| 35 | 2.65 | 623.1612 | 624 | 0.528 | C28H32O16 | 1.143 | 0.571 | 13 | flavonol + 5O digly * isorhamnetin 3-O-neohesperidoside |
| 36 | 5.71 | 411.0725 | 412 | 0.380 | C21H16O9 | 0.762 | 0.429 | 14 | |
| 37 | 5.42 | 427.0666 | 428 | 0.404 | C21H16O10 | 0.762 | 0.476 | 14 | |
| 38 | 5.24 | 429.088 | 430 | 0.385 | C21H18O10 | 0.857 | 0.476 | 13 | flavone + 4O monogly |
| 39 | 4.42 | 429.0818 | 430 | 0.391 | C21H18O10 | 0.857 | 0.476 | 13 | flavone + 4O monogly |
| 40 | 3.25 | 431.098 | 432 | 0.377 | C21H20O10 | 0.952 | 0.476 | 12 | flavone + 4O monogly |
| 41 | 4.52 | 431.0966 | 432 | 0.379 | C21H20O10 | 0.952 | 0.476 | 12 | flavone + 4O monogly |
| 42 | 2.82 | 447.0942 | 448 | 0.399 | C21H20O11 | 0.952 | 0.524 | 12 | flavone + 4O monogly |
| 43 | 3.86 | 447.0924 | 448 | 0.401 | C21H20O11 | 0.952 | 0.524 | 12 | flavonol + 3O monogly * kaempferol 3-O-glucoside |
| 44 | 3.30 | 463.0881 | 464 | 0.423 | C21H20O12 | 0.952 | 0.571 | 12 | flavonol + 4O monogly * isoquercitrin |
| 45 | 3.72 | 449.1087 | 450 | 0.387 | C21H22O11 | 1.048 | 0.524 | 11 | |
| 46 | 2.66 | 449.1083 | 450 | 0.387 | C21H22O11 | 1.048 | 0.524 | 11 | |
| 47 | 5.79 | 441.0812 | 442 | 0.405 | C22H18O10 | 0.818 | 0.455 | 14 | |
| 48 | 4.65 | 475.0868 | 476 | 0.438 | C22H20O12 | 0.909 | 0.545 | 13 | flavone + 4O monogly |
| 49 | 3.89 | 461.1086 | 462 | 0.400 | C22H22O11 | 1.000 | 0.500 | 12 | flavone + 4O monogly * chrysoeriol O-hexoside |
| 50 | 4.12 | 463.1246 | 464 | 0.386 | C22H24O11 | 1.091 | 0.500 | 11 | flavanone + 4O monogly |
| 51 | 0.62 | 455.1005 | 456 | 0.402 | C23H20O10 | 0.870 | 0.435 | 14 | |
| 52 | 5.13 | 457.1135 | 458 | 0.391 | C23H22O10 | 0.957 | 0.435 | 13 | |
| 53 | 5.45 | 483.0931 | 484 | 0.440 | C24H20O11 | 0.833 | 0.458 | 15 | |
| 54 | 5.61 | 299.0561 | 300 | 0.272 | C16H12O6 | 0.75 | 0.375 | 11 | flavone + 4O * chrysoeriol |
| 55 | 1.91 | 329.088 | 330 | 0.274 | C14H18O9 | 1.286 | 0.643 | 6 | |
| 56 | 2.18 | 339.0721 | 340 | 0.300 | C15H16O9 | 1.067 | 0.600 | 8 | organic acid |
| 57 | 2.23 | 325.0922 | 326 | 0.265 | C15H18O8 | 1.200 | 0.533 | 7 | organic acid |
| 58 | 2.11 | 343.1035 | 344 | 0.273 | C15H20O9 | 1.333 | 0.600 | 6 | organic acid * dihydroxyphenylpropanoic acid + hexose |
| 59 | 2.36 | 337.0926 | 338 | 0.278 | C16H18O8 | 1.125 | 0.500 | 8 | organic acid * quinic acid + coumaric acid |
| 60 | 2.63 | 337.0924 | 338 | 0.278 | C16H18O8 | 1.125 | 0.500 | 8 | organic acid quinic acid + coumaric acid |
| 61 | 2.94 | 337.0927 | 338 | 0.278 | C16H18O8 | 1.125 | 0.500 | 8 | organic acid |
| 62 | 2.12 | 353.0877 | 354 | 0.300 | C16H18O9 | 1.125 | 0.563 | 8 | organic acid * quinic acid + caffeic acid |
| 63 | 2.36 | 353.0872 | 354 | 0.301 | C16H18O9 | 1.125 | 0.563 | 8 | organic acid * quinic acid + caffeic acid |
| 64 | 2.46 | 355.1031 | 356 | 0.287 | C16H20O9 | 1.250 | 0.563 | 7 | organic acid |
| 65 | 2.74 | 367.1029 | 368 | 0.301 | C17H20O9 | 1.176 | 0.529 | 8 | organic acid * feruloylquinic acid |
| 66 | 3.09 | 367.1033 | 368 | 0.300 | C17H20O9 | 1.176 | 0.529 | 8 | organic acid * feruloylquinic acid |
| 67 | 2.49 | 405.0797 | 406 | 0.366 | C19H18O10 | 0.947 | 0.526 | 11 | hypothamnolic acid |
| Family | Compound | Rt (min) | [M-H]− | Molecular Formula | Library GNPS | Putative Identification |
|---|---|---|---|---|---|---|
| Flavonoid O glycoside | 23 | 3.12 | 609.146 | C27H30O16 | rutin | Calendoflavobioside * |
| 21 | 3.65 | 593.151 | C27H30O15 | nicotiflorin | luteolin 7-O-neohesperidoside * | |
| 50 | 4.12 | 463.125 | C22H24O11 | hesperetin O-hexoside | ||
| 44 | 3.30 | 463.088 | C21H20O12 | isoquercitrin | Isoquercitrin * | |
| 49 | 3.89 | 461.109 | C22H22O11 | chrysoeriol O-hexoside * | ||
| 43 | 3.86 | 447.092 | C21H20O11 | kaempferol-3-O-glucoside | kaempferol-3-O-glucoside * | |
| 55 | 1.91 | 329.088 | C14H18O9 | glucosyl trihydroxyacetophenone | ||
| Flavonoid C glycoside | 5.53 | 637.104 | C28H30O17 | series homologous to methoxymaysin | ||
| 29 | 4.96 | 621.146 | C28H30O16 | chrysoeriol O-deoxyhexose C-glucuronide | ||
| 26 | 6.29 | 619.13 | C28H28O16 | series homologous to luteolin 3′-methylether 7-flucuronosyl-(1–>2)-glucuronide | ||
| 33 | 3.84 | 607.167 | C28H32O15 | 2″-O-L-rhamnosyl-6-C-fucosyl-3′-methoxylluteolin * diosmetin 8-C-(2′’-rhamnosylglucoside) | ||
| 14 | 4.34 | 607.13 | C27H28O16 | luteolin O-deoxyhexose C-glucuronide | ||
| 8 | 5.48 | 605.114 | C27H26O16 | flavone + 4O digly | ||
| 25 | 4.63 | 603.135 | C28H28O15 | series homologous to luteolin 3′-methylether 7-flucuronosyl-(1–>2)-glucuronide | ||
| 22 | 3.82 | 593.151 | C27H30O15 | flavone +4O C-hex dHex | isoorientin 2″-O-rhamnoside | |
| 19 | 2.54 | 593.151 | C27H30O15 | MassBank: PR307067 NP-000002(10) | vicenin 2 * | |
| 32 | 5.06 | 591.178 | C28H32O14 | ax-4″-hydroxy-3′-methoxymaysin * | ||
| 13 | 4.79 | 591.135 | C27H28O15 | series homologous to maysin | ||
| 28 | 4.91 | 589.156 | C28H30O14 | 3′-methoxy maysin * | ||
| 6 | 3.90 | 589.12 | C27H26O15 | flavone + 4O digly | ||
| 7 | 6.05 | 589.119 | C27H26O15 | flavone + 4O digly | ||
| 24 | 5.21 | 587.14 | C28H28O14 | series homologous to luteolin 3′-methylether 7-flucuronosyl-(1–>2)-glucuronide | ||
| 18 | 4.09 | 577.158 | C27H30O14 | apigenin C-hexose 2″-O-deoxyhexoside | ||
| 12 | 4.25 | 575.14 | C27H28O14 | maysin * | ||
| 3 | 2.77 | 563.14 | C26H28O14 | isoschaftoside | schaftoside * | |
| 11 | 4.76 | 559.146 | C27H28O13 | 5,7-dihydroxy-6-[(2S,3R,4R,6R)-4-hydroxy-6-methyl-5-oxo-3-[(2S,3R,4R,5R,6S)-3,4,5-trihydroxy-6-methyloxan-2-yl]oxyoxan-2-yl]-2-(4-hydroxyphenyl)chromen-4-one | apimaysin * | |
| 2 | 3.99 | 547.146 | C26H28O13 | apigenin 6-C-deoxyhexose 8-C-pentoside * | ||
| Organo-oxygen | 4.47 | 502.135 | C24H25NO11 | |||
| 5.04 | 486.141 | C24H25NO10 | ||||
| 67 | 2.49 | 405.08 | C19H18O10 | hypothamnolic acid | ||
| 2.51 | 372.093 | C15H19NO10 | DIMBOA + O-Hex | DIMBOA-Glucoside * | ||
| 1.95 | 368.099 | C16H19NO9 | 7-hydroxy-2-oxoindole-3-acetic acid 7′-O-glucopyranoside * | |||
| 65 | 2.74 | 367.103 | C17H20O9 | (1R,3R,4S,5R)-1,3,4-trihydroxy-5-[(E)-3-(4-hydroxy-3-methoxyphenyl)prop-2-enoyl]oxycyclohexane-1-carboxylic acid | feruloylquinic acid * | |
| 2.46 | 356.096 | C15H19NO9 | HMBOA + O-Hex | HMBOA-Glucoside * | ||
| 62 | 2.12 | 353.087 | C16H18O9 | neochlorogenic acid | chlorogenic acid * | |
| 1.55 | 344.04 | C10H12N5O7P | guanosine-3′,5′-cyclic monophosphate (cGMP) | guanosine-3′,5′-cyclic monophosphate (cGMP) | ||
| 58 | 2.11 | 343.103 | C15H20O9 | 3-[3-hydroxy-2-[(2S,3R,4S,5S,6R)-3,4,5-trihydroxy-6-(hydroxymethyl)oxan-2-yl]oxyphenyl]proponoic acid | dihydrocaffeic acid hexoside * | |
| 1.60 | 342.083 | C14H17NO9 | DIBOA-Glucoside * | |||
| 56 | 2.18 | 339.072 | C15H16O9 | 6,7-dihydroxycoumarin-glucoside | esculin * | |
| 60 | 2.63 | 337.093 | C16H18O8 | (1R,3R,4S,5R)-1,3,4-trihydroxy-5-[(E)-3-(4-hydroxyphenyl)prop-2-enoyl]oxycyclohexane-1-carboxylic acid | coumaroylquinic acid * | |
| 0.85 | 290.088 | C11H17NO8 | N-fructosyl pyroglutamate | N-fructosyl pyroglutamate | ||
| 0.81 | 282.084 | C10H13N5O5 | guanosine | guanosine * | ||
| Glycero phospholipid | 7.25 | 564.331 | C27H52NO9P | LPC 18:2 | eicosadienoyl-glycero-(1,2-dihydroxyethoxy)-3-phosphoethanolamine | |
| 7.54 | 540.33 | C25H52NO9P | LPC 16:0 | [2-(1,2-dihydroxyethoxy)-3-[2-(dimethylamino)ethoxy-hydroxyphosphoryl]oxypropyl] hexadecanoate | ||
| 7.17 | 476.278 | C23H44NO7P | 1-(9Z,12Z-octadecadienoyl)-2-hydroxy-sn-glycero-3-phosphoethanolamine | linoleoyl-glycero-phosphoethanolamine | ||
| 7.45 | 452.277 | C21H44NO7P | 1-palmitoyl-2-hydroxy-sn-glycero-3-phosphoethanolamine | palmitoyl-glycero-phosphoethanolamine | ||
| Fatty acid | 24 | 6.42 | 357.264 | C20H38O5 | FA 20:1 + 3O | |
| 19 | 5.73 | 329.233 | C18H34O5 | FA 18:1 + 3O | 9,12,13-triHOME * | |
| 15 | 5.86 | 327.217 | C18H32O5 | (10E,15E)-9,12,13-trihydroxyoctadeca-10,15-dienoic acid | 9,12,13-triHODE * FA 18:2 + 3O | |
| 11 | 5.83 | 325.202 | C18H30O5 | FA 18:3 + 3O |
Disclaimer/Publisher’s Note: The statements, opinions and data contained in all publications are solely those of the individual author(s) and contributor(s) and not of MDPI and/or the editor(s). MDPI and/or the editor(s) disclaim responsibility for any injury to people or property resulting from any ideas, methods, instructions or products referred to in the content. |
© 2023 by the authors. Licensee MDPI, Basel, Switzerland. This article is an open access article distributed under the terms and conditions of the Creative Commons Attribution (CC BY) license (https://creativecommons.org/licenses/by/4.0/).
Share and Cite
Fougère, L.; Zubrzycki, S.; Elfakir, C.; Destandau, E. Characterization of Corn Silk Extract Using HPLC/HRMS/MS Analyses and Bioinformatic Data Processing. Plants 2023, 12, 721. https://doi.org/10.3390/plants12040721
Fougère L, Zubrzycki S, Elfakir C, Destandau E. Characterization of Corn Silk Extract Using HPLC/HRMS/MS Analyses and Bioinformatic Data Processing. Plants. 2023; 12(4):721. https://doi.org/10.3390/plants12040721
Chicago/Turabian StyleFougère, Laëtitia, Sandrine Zubrzycki, Claire Elfakir, and Emilie Destandau. 2023. "Characterization of Corn Silk Extract Using HPLC/HRMS/MS Analyses and Bioinformatic Data Processing" Plants 12, no. 4: 721. https://doi.org/10.3390/plants12040721