
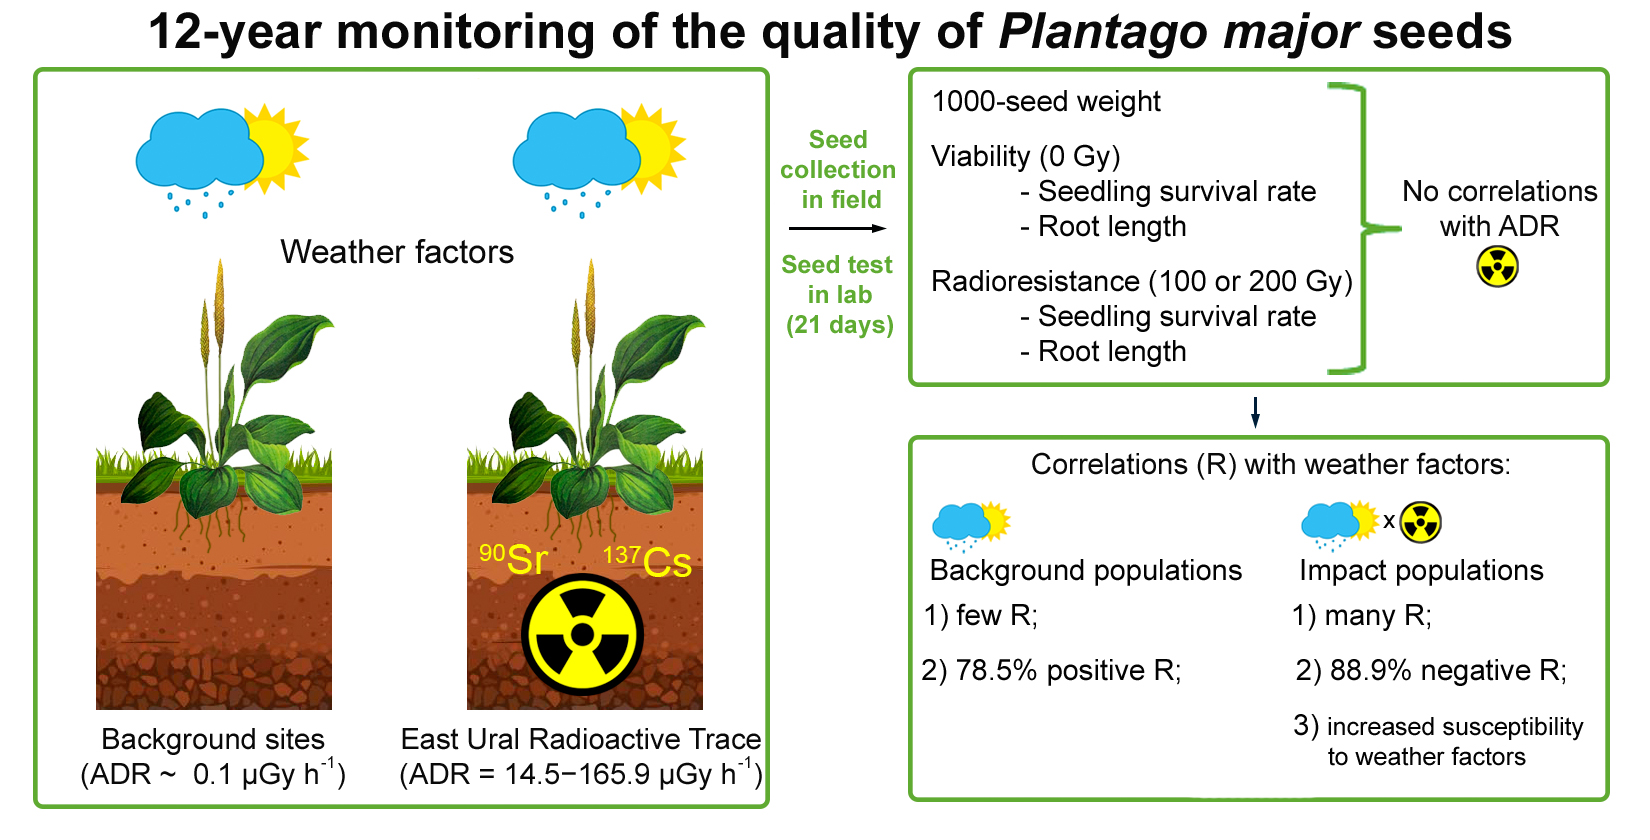
Multiannual Assessment of Quality of Plantago major L. Seed Progeny from Kyshtym Radiation Accident Area: Weather-Dependent Effects


Abstract
:
1. Introduction
2. Results
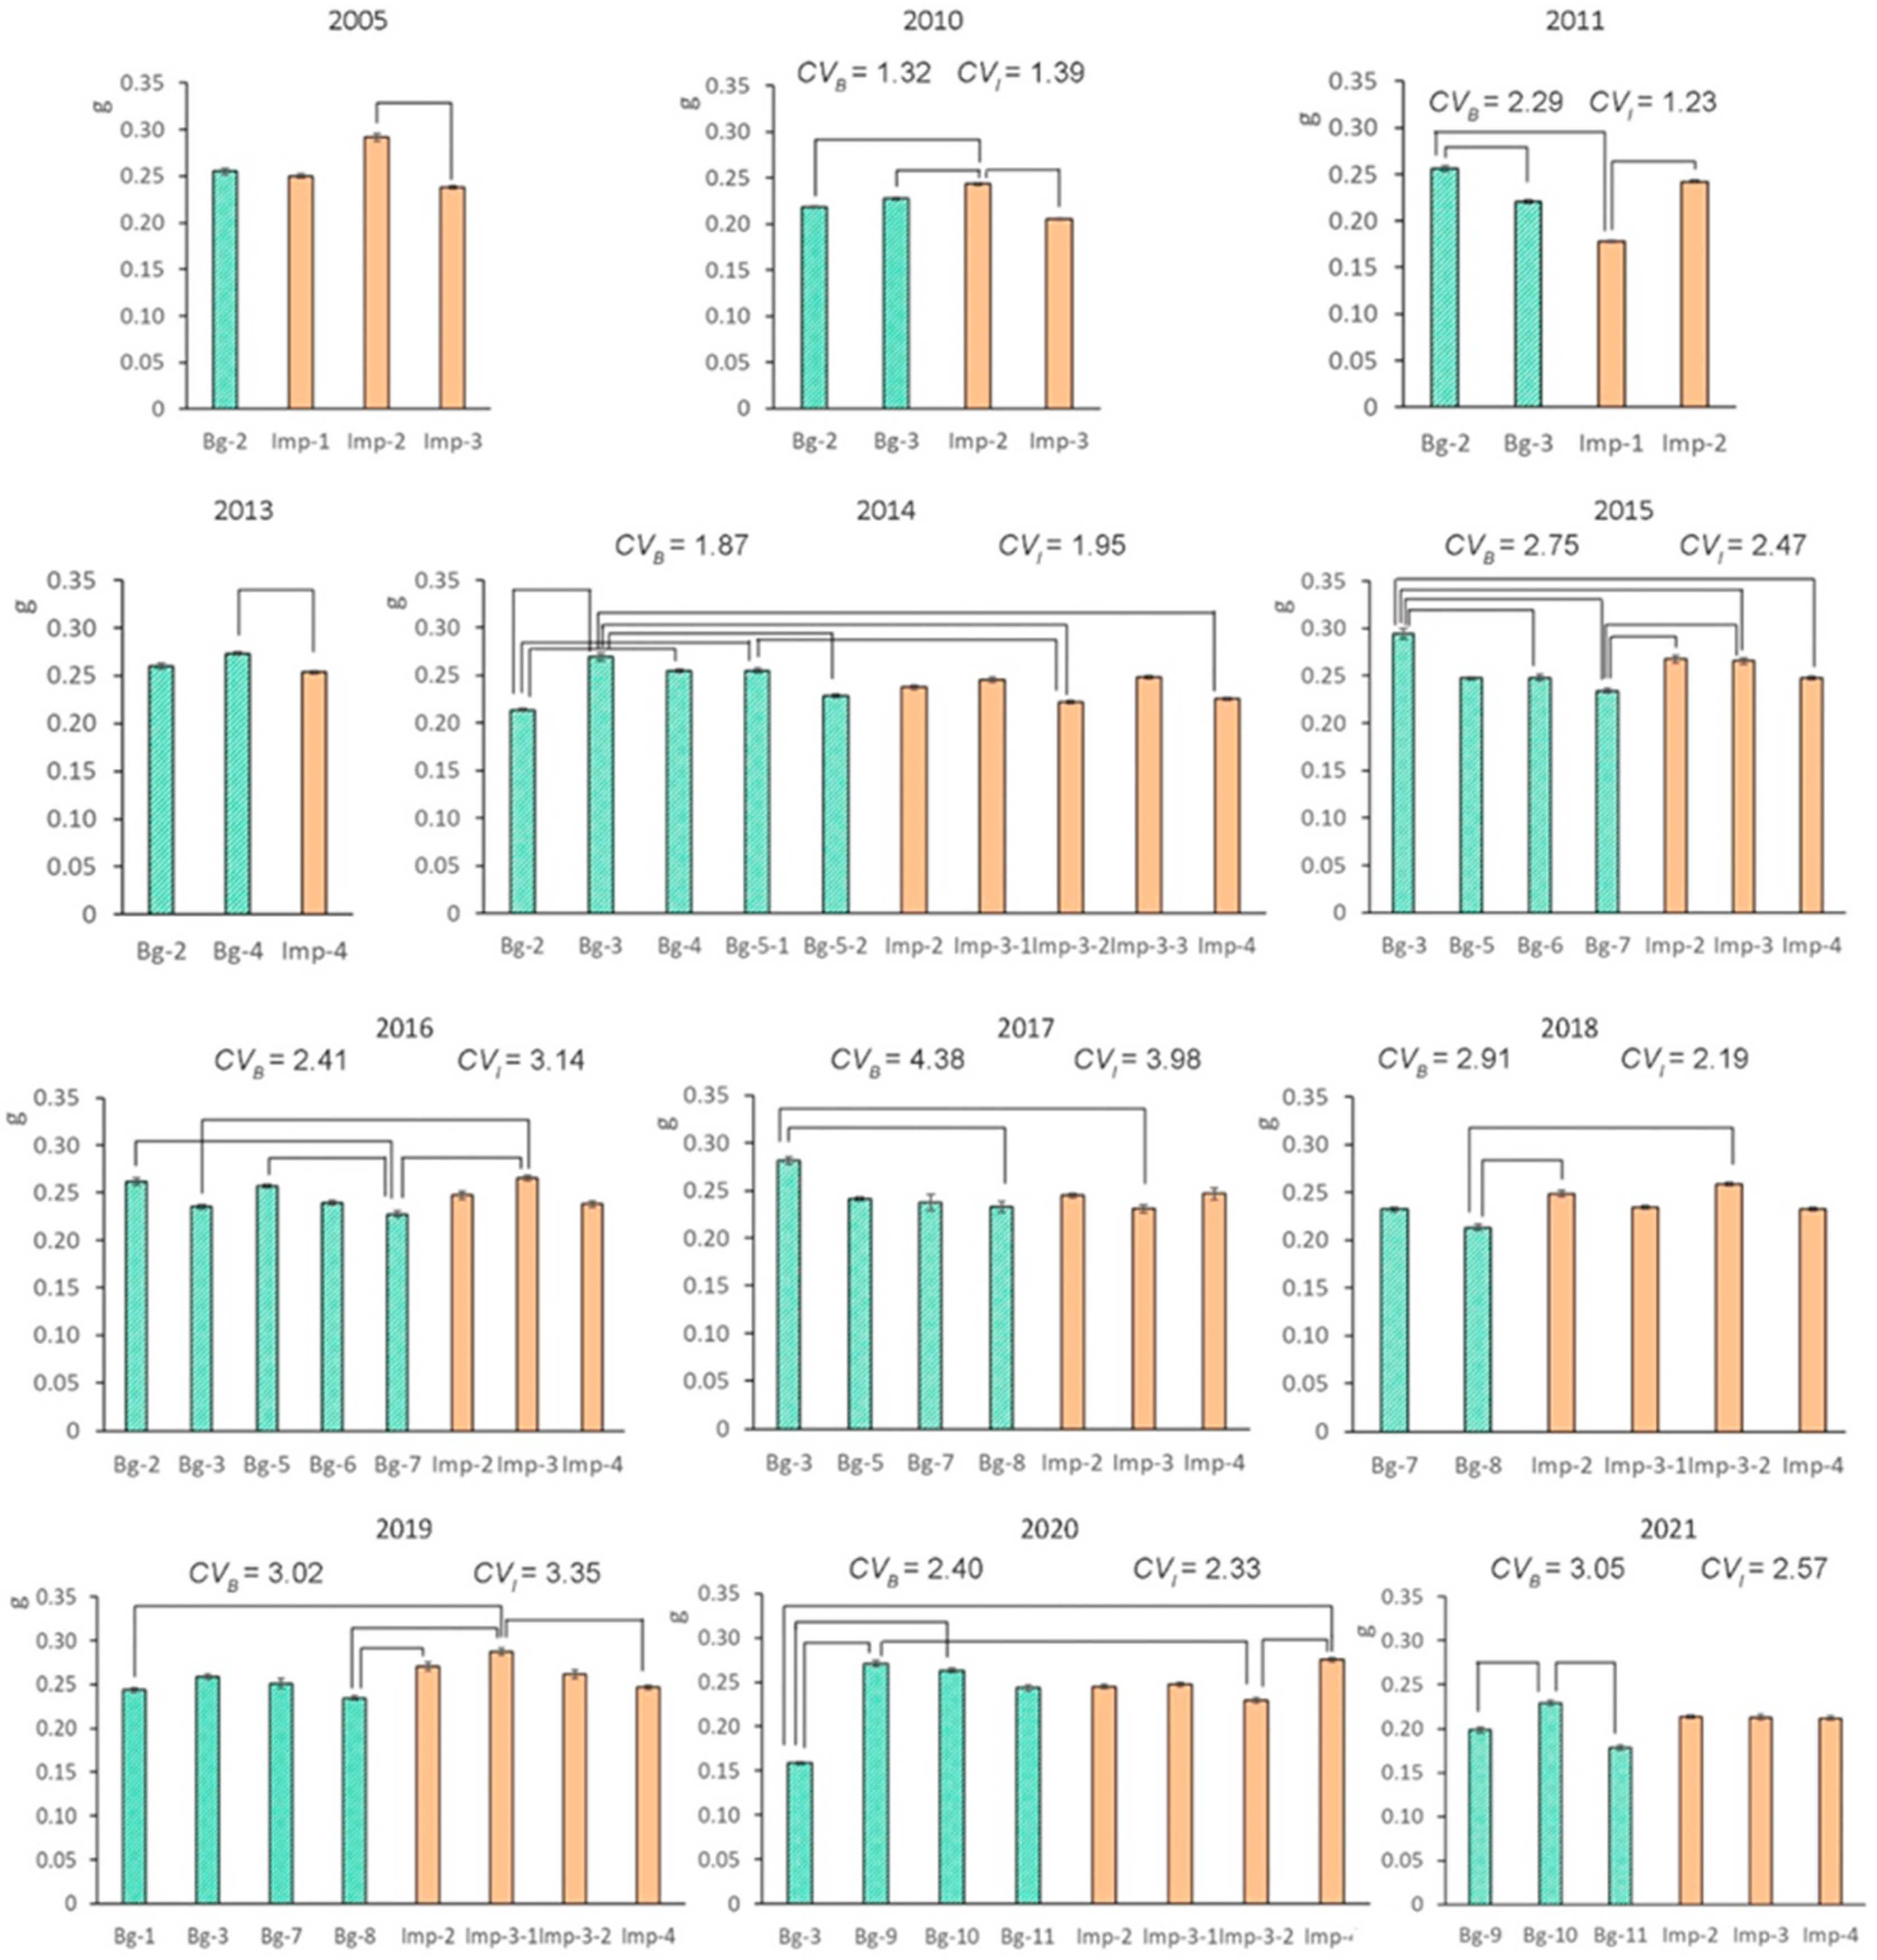
2.1. Interannual Variability in 1000-Seed Weight
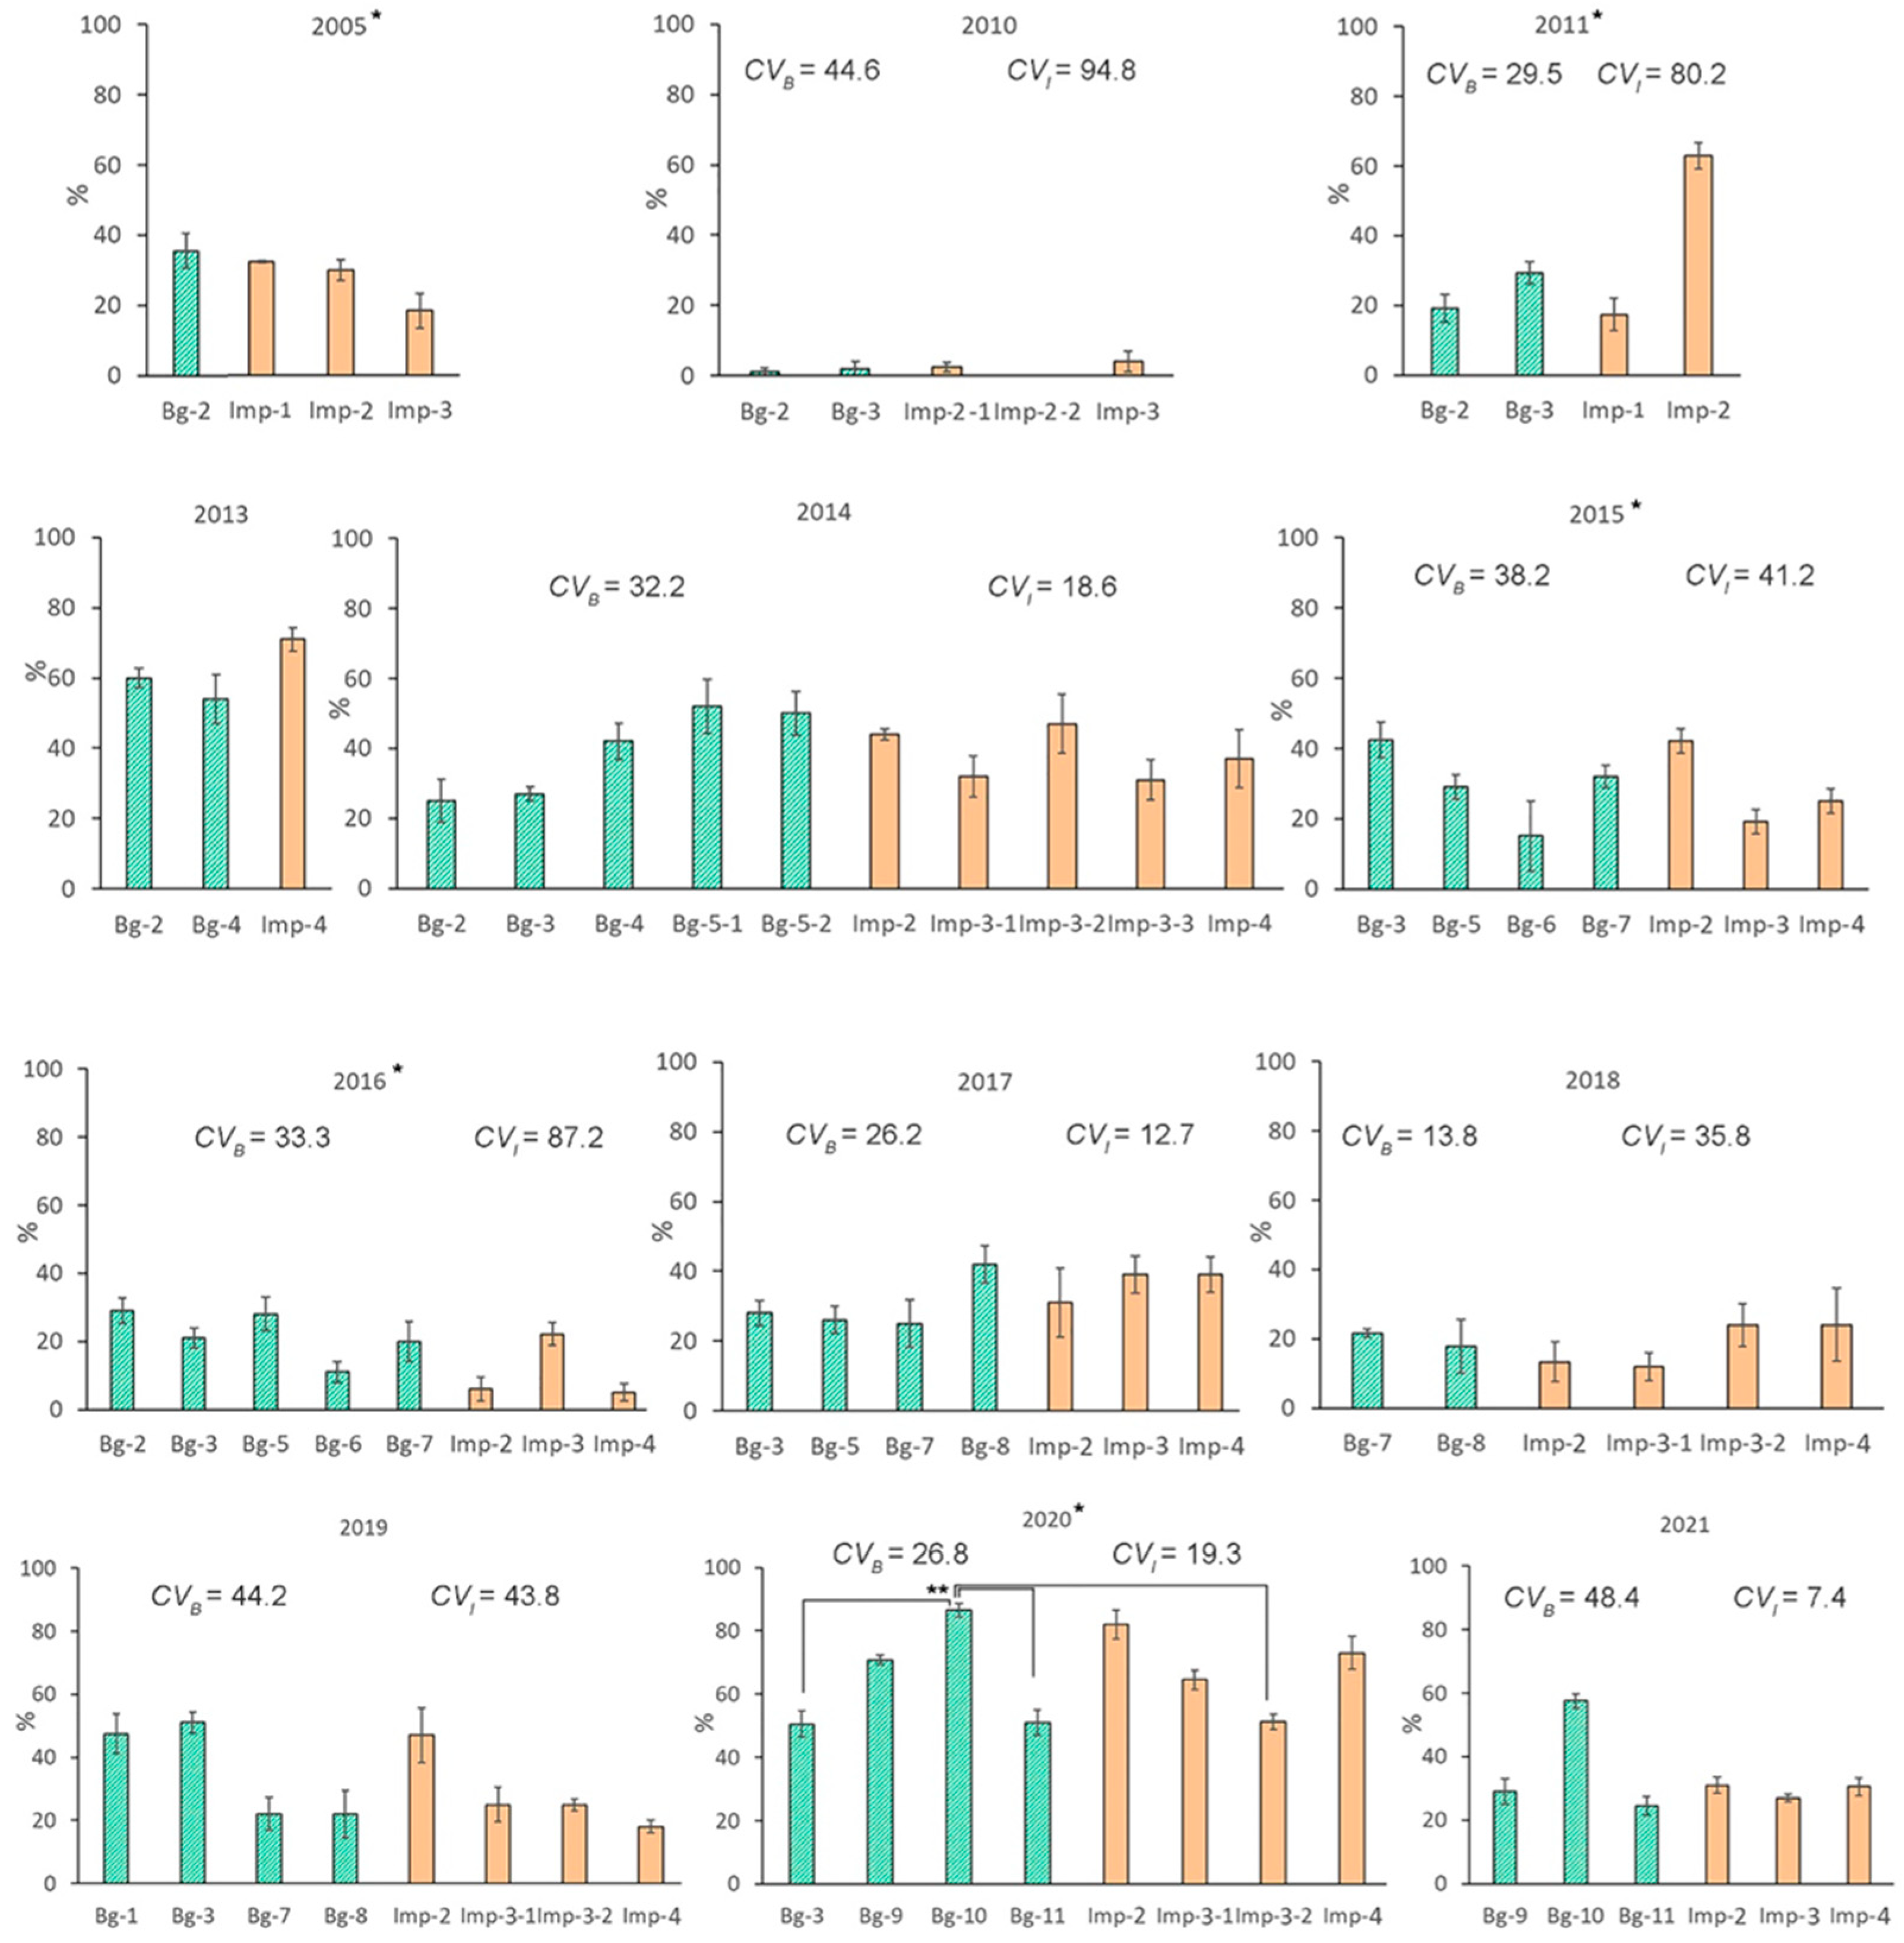
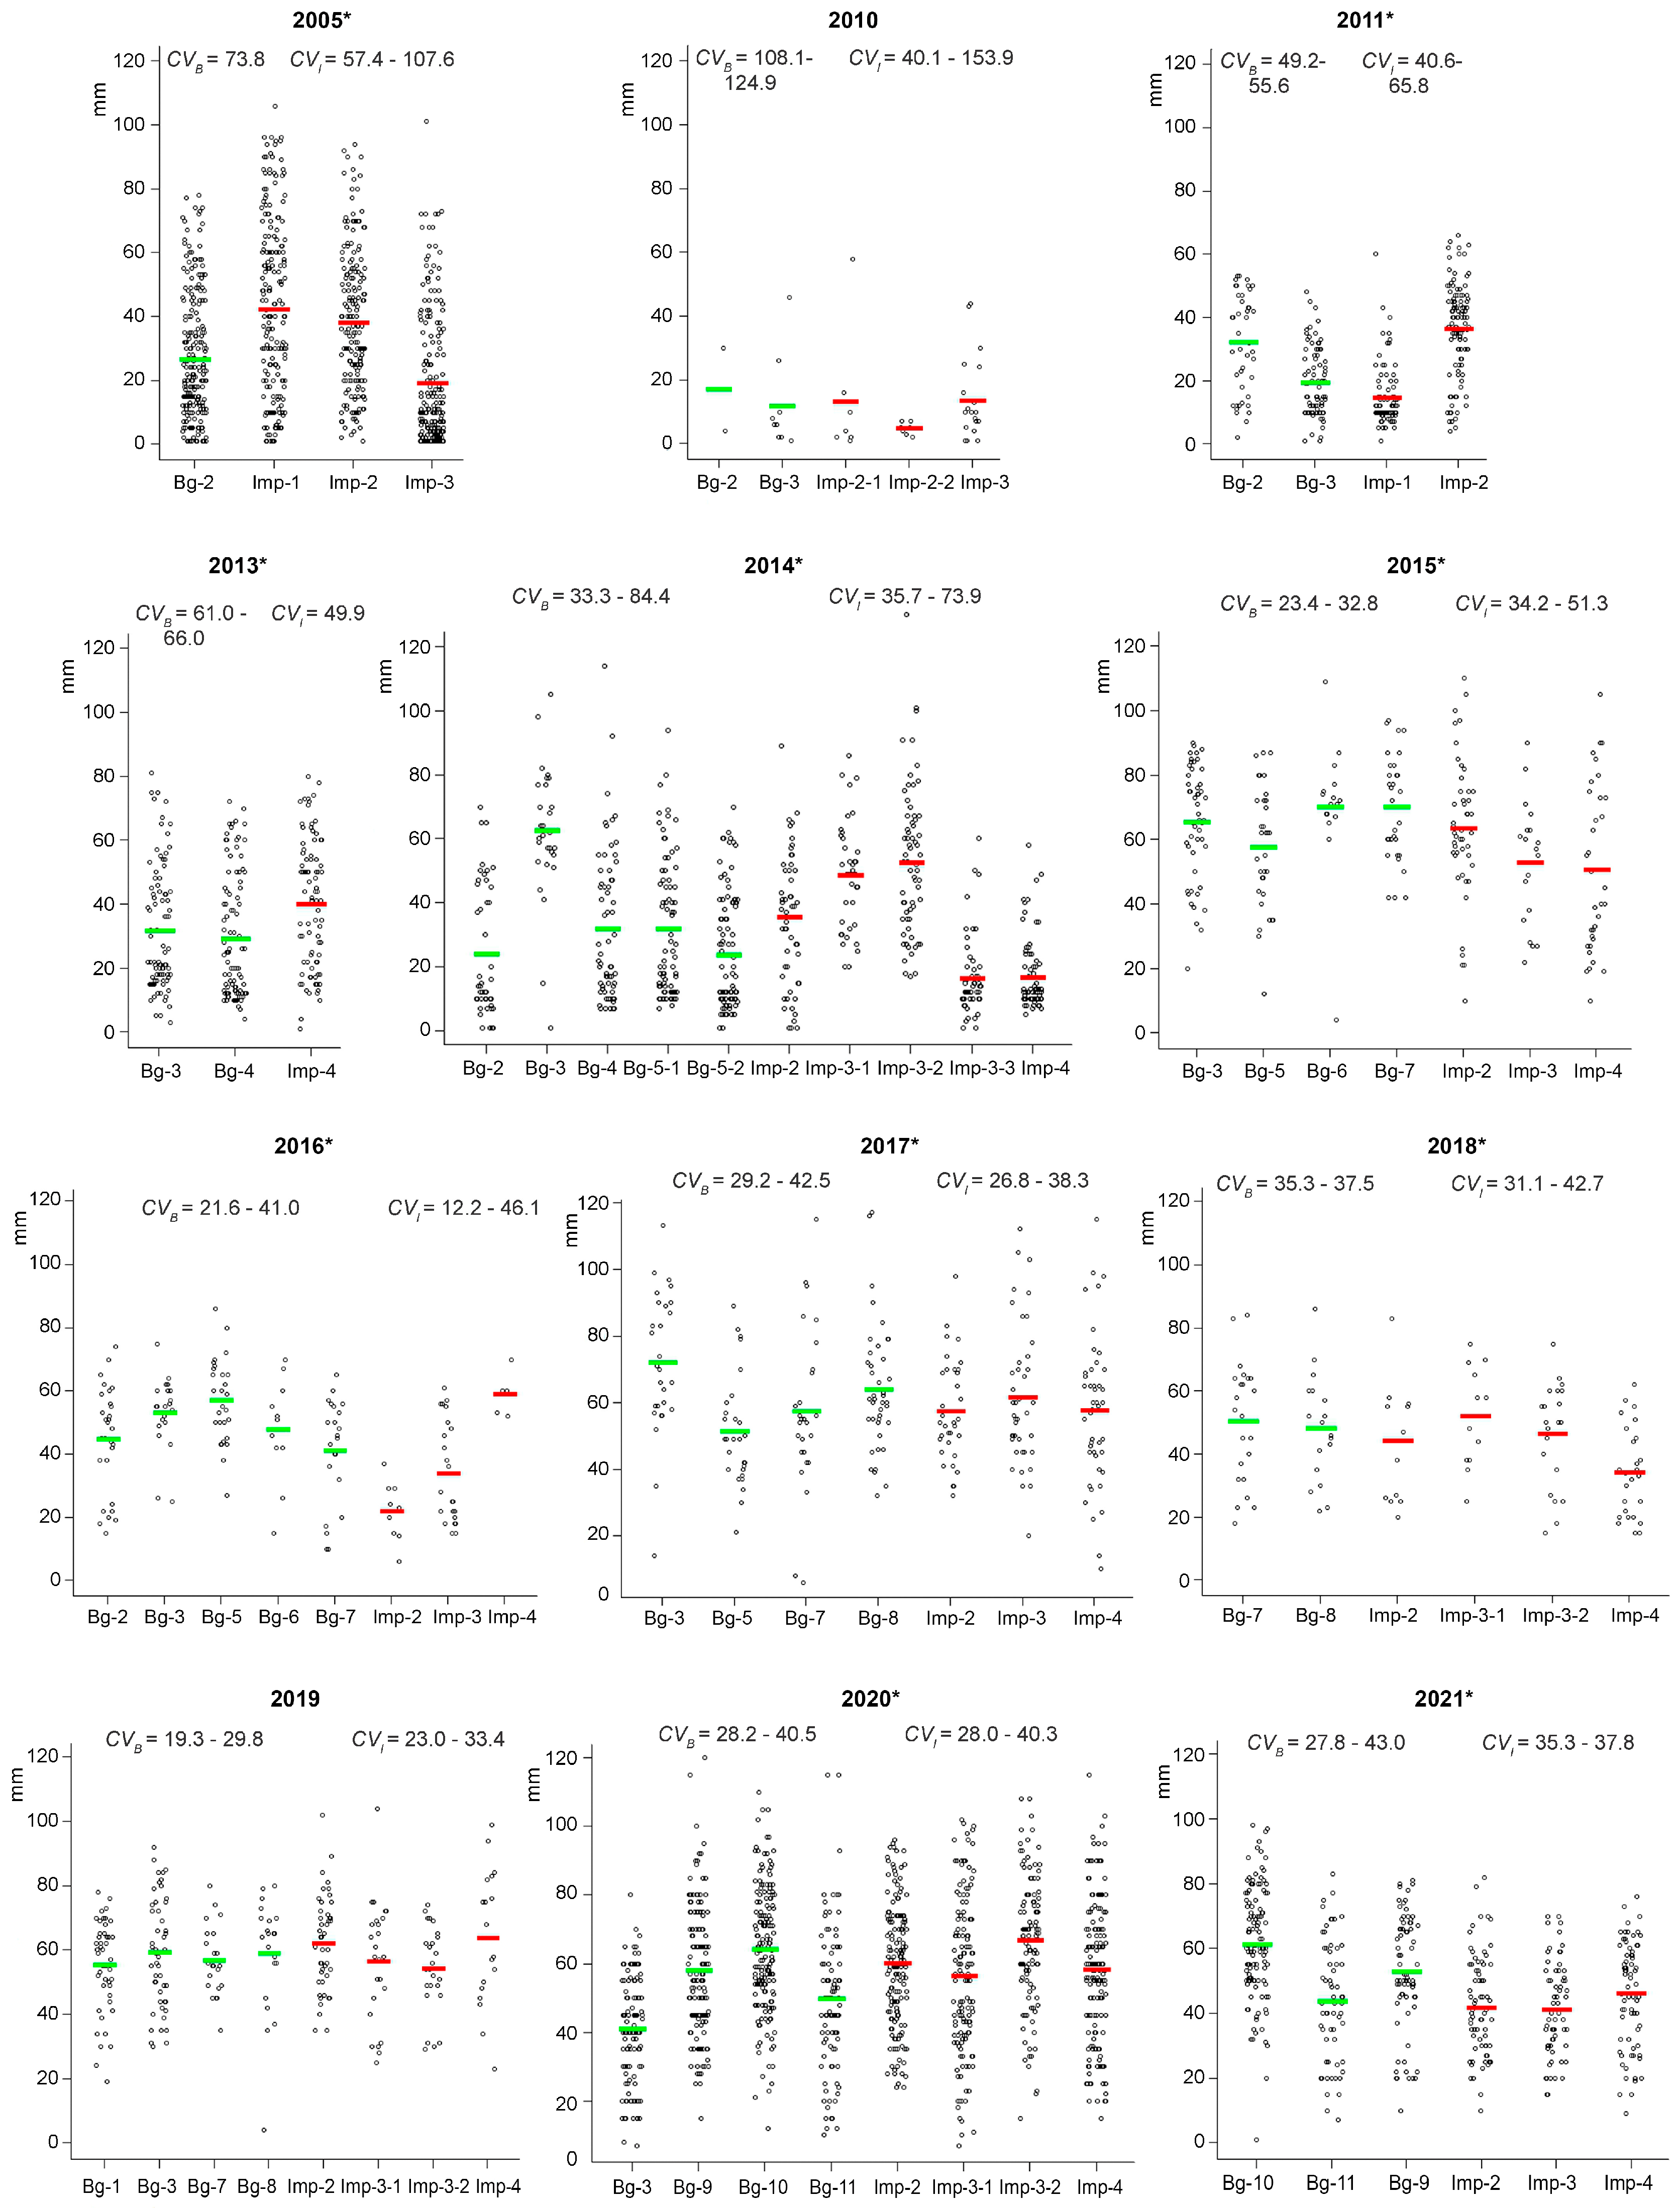
2.2. Interannual Variations in Viability of Seed Progeny
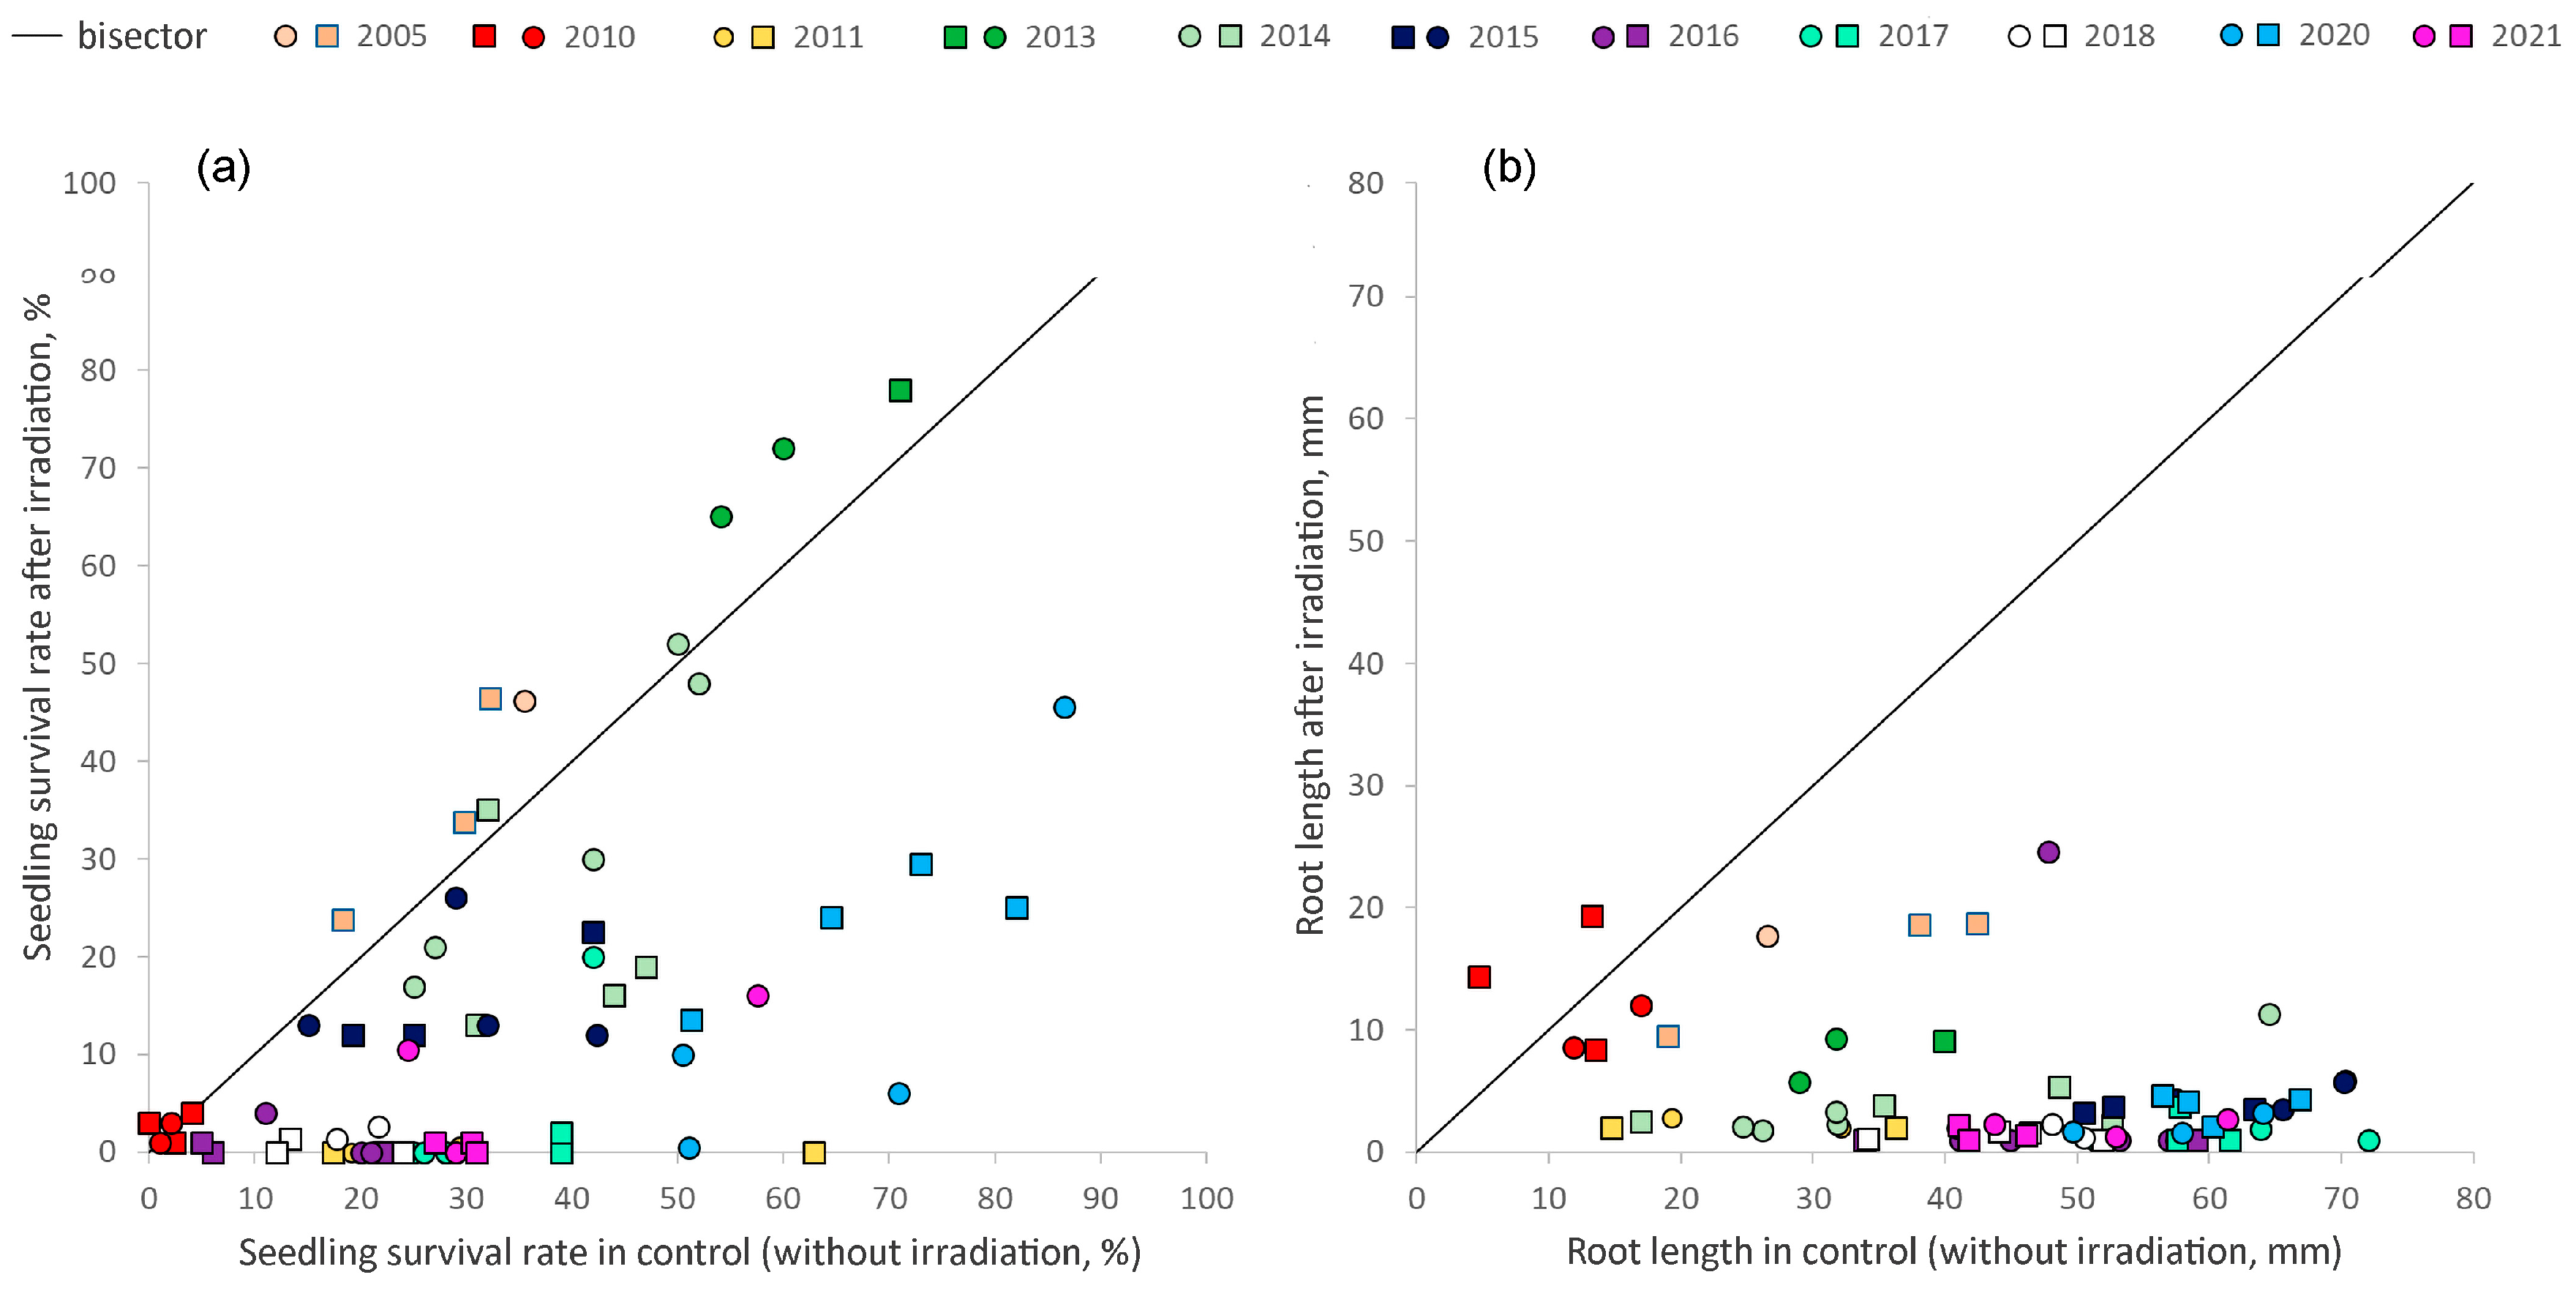
2.3. Variability in Radioresistance of Seed Progeny from Different Zones
2.4. The Effect of Weather Factors on Seed Weight
2.5. The Influence of Weather Factors on the Viability of Seed Progeny
2.6. The Influence of Weather Parameters on Radioresistance of Seed Progeny
3. Discussion
4. Materials and Methods
4.1. Materials
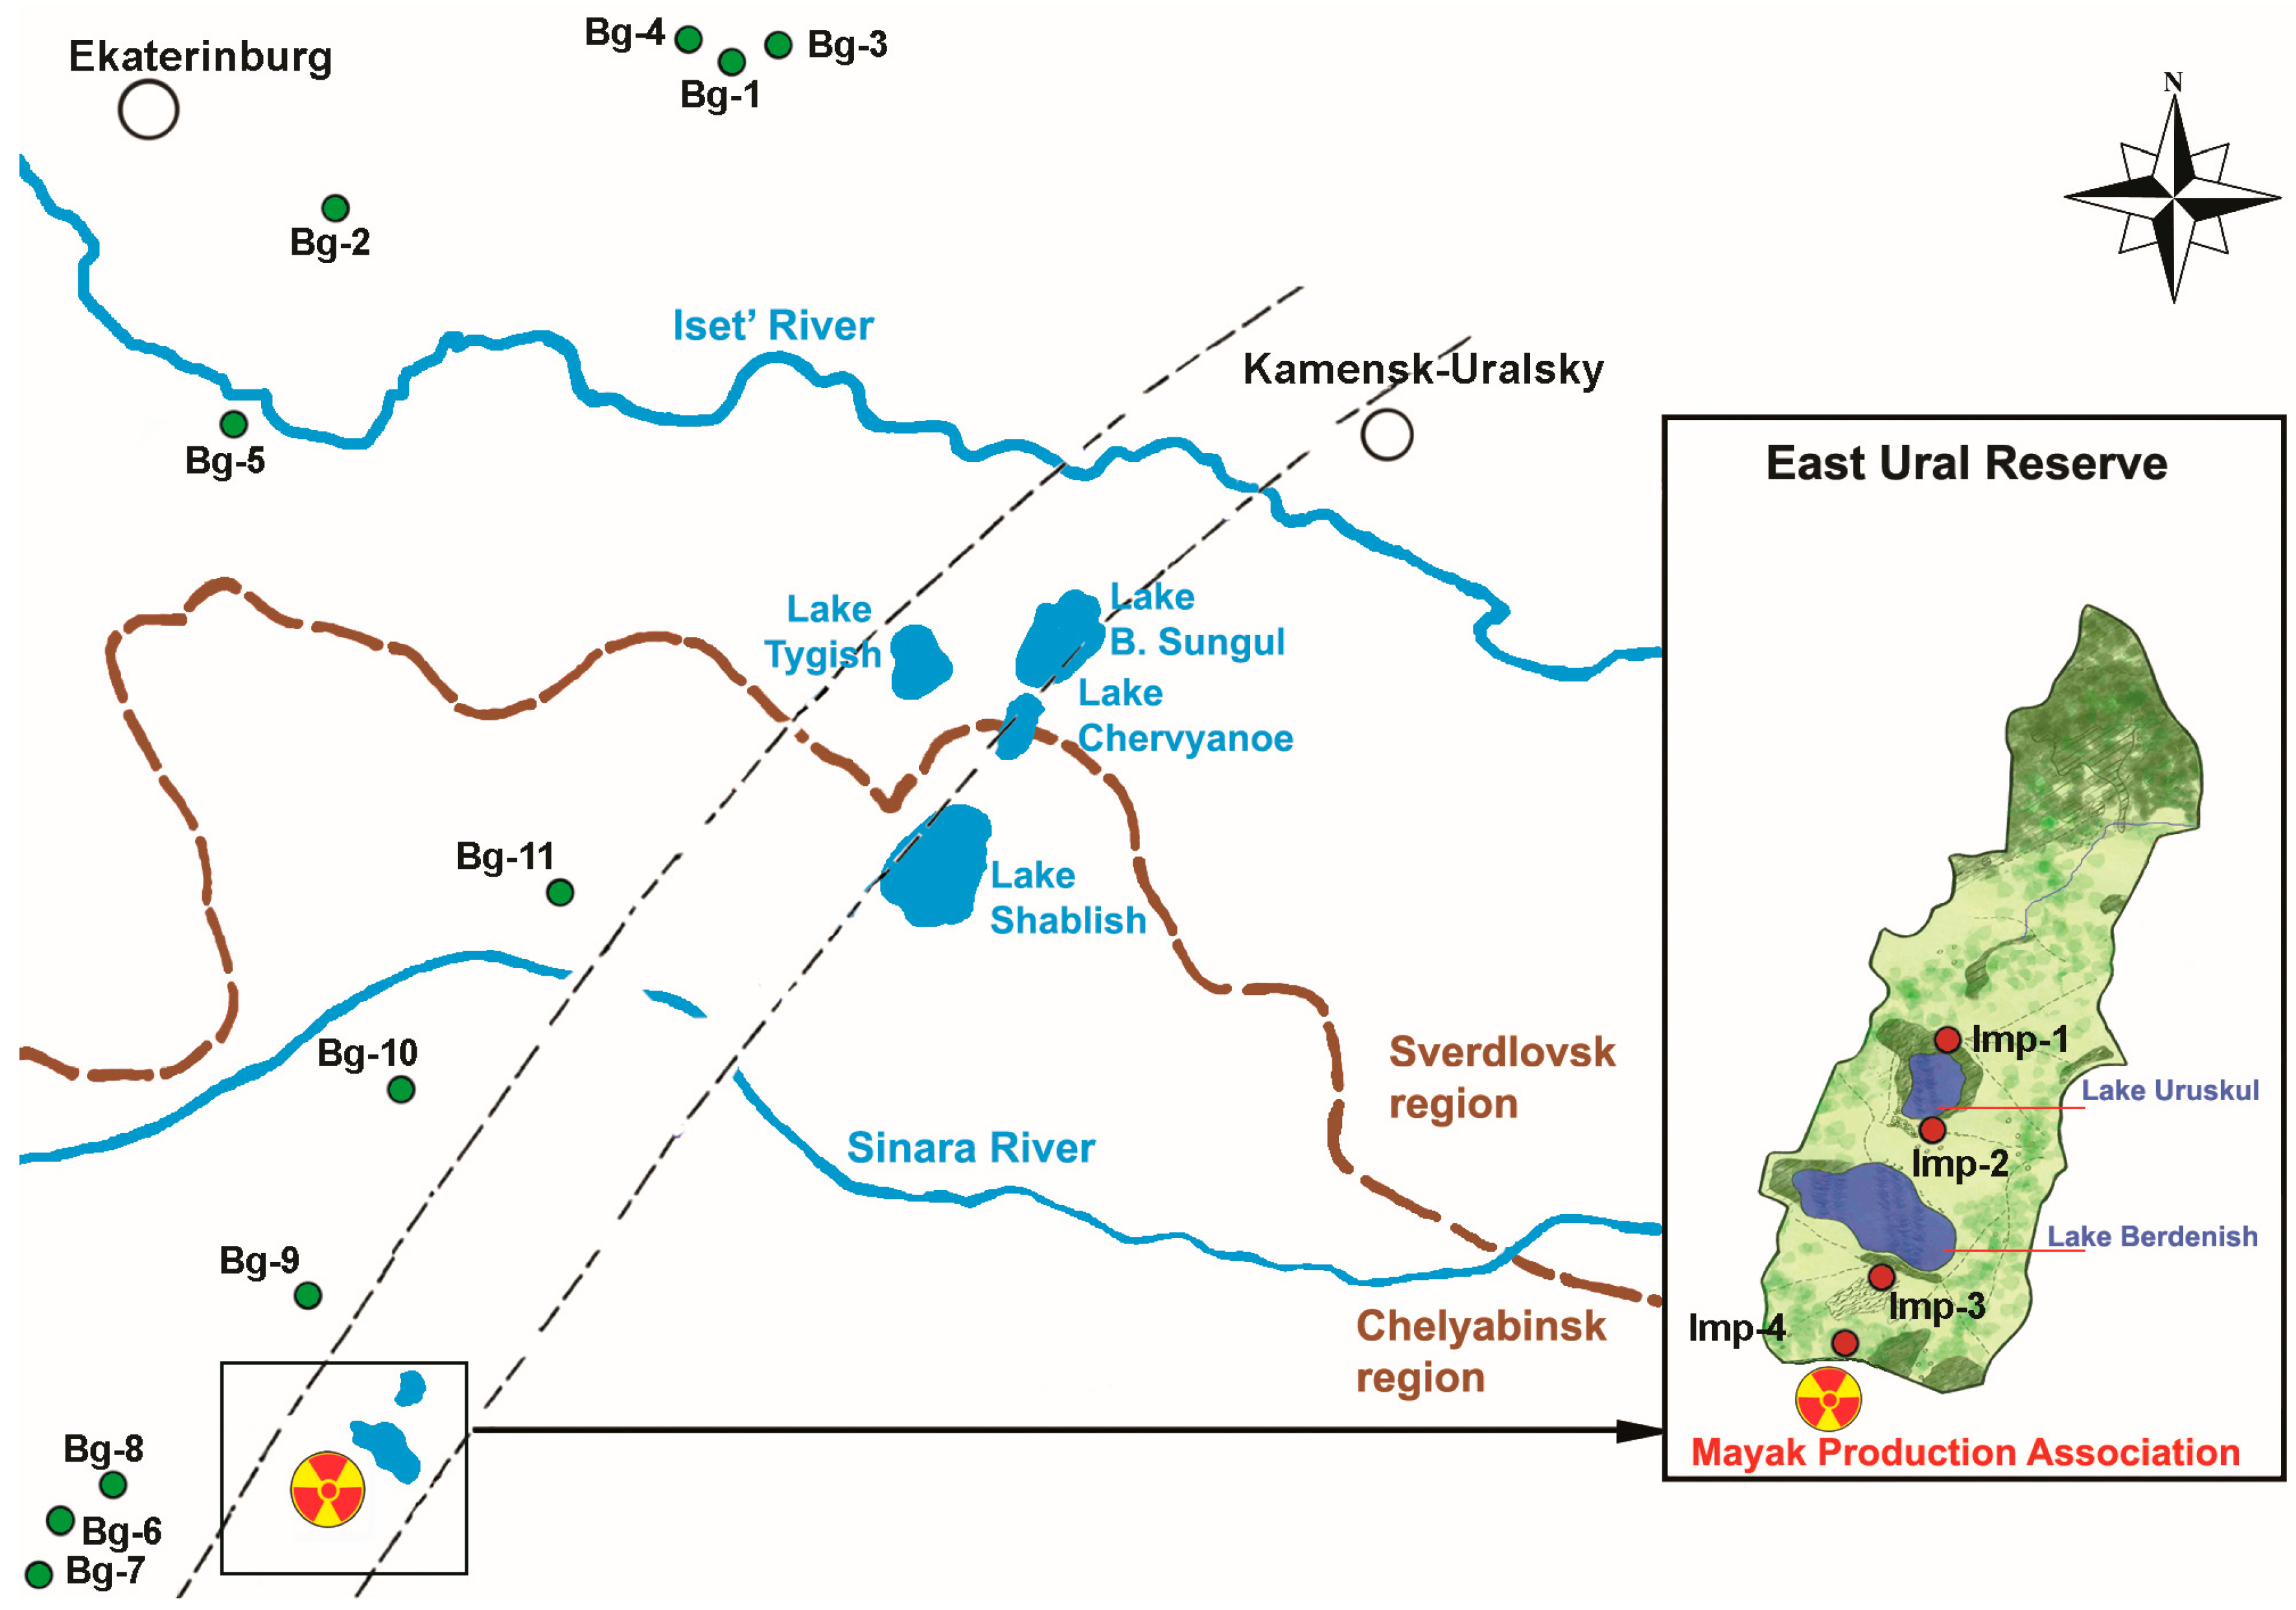
4.2. The Study Area
4.3. Collection of Seeds
4.4. Calculation of Dose Rates on Parental Plants of P. major
4.5. Pre-Sowing Treatment and Estimation of 1000-Seed Weight
4.6. Laboratory Germination of Seeds and Selection of Parameters for the Evaluation of Various Effects
4.7. Assessment of Seed Progeny Radioresistance
4.8. Weather Data Collection and Calculation of Weather Indices
4.9. Statistical Hypothesis Testing
5. Conclusions
Author Contributions
Funding
Data Availability Statement
Acknowledgments
Conflicts of Interest
Appendix A

| Year | ΣTef6–8 | ΣP-Tef6–8 | HTC6–8 |
|---|---|---|---|
| #28541 (Verkhny Ufaley) | |||
| 2005 | 1370.5 | 182.7 | 1.33 |
| 2010 | 1648.5 | 55.3 | 0.34 |
| 2011 | 1321.1 | 254.8 | 1.93 |
| 2013 | 1502.7 | 151.3 | 1.01 |
| 2014 | 1292.1 | 221.0 | 1.71 |
| 2015 | 1321.4 | 249.4 | 1.89 |
| 2016 | 1645.8 | 140.6 | 0.85 |
| 2017 | 1395.8 | 206.4 | 1.48 |
| 2018 | 1317.1 | 156.5 | 1.19 |
| 2019 | 1338.6 | 215.5 | 1.61 |
| 2020 | 1435.4 | 222.5 | 1.55 |
| 2021 | 1573.5 | 203.2 | 1.29 |
| Mean | 1423.2 | 190.4 | 1.37 |
| #28440 (Ekaterinburg) | |||
| 2005 | 1542.3 | 357.4 | 2.32 |
| 2010 | 1765.1 | 262.3 | 1.49 |
| 2011 | 1530.3 | 347.6 | 2.27 |
| 2013 | 1715.1 | 147.8 | 0.86 |
| 2014 | 1400.2 | 255.2 | 1.82 |
| 2015 | 1409.4 | 247.2 | 1.75 |
| 2016 | 1866.7 | 100.0 | 0.54 |
| 2017 | 1554.1 | 256.8 | 1.65 |
| 2018 | n.o. * | n.o. | n.o. |
| 2019 | 1531.5 | 248.0 | 1.62 |
| 2020 | 1632.3 | 146.9 | 0.90 |
| 2021 | n.o. | n.o. | n.o. |
| Mean | 1594.7 | 236.9 | 1.52 |
| 2005 | Bg-2 | Imp-1 | Imp-2 | Imp-3 |
|---|---|---|---|---|
| Bg-2 | 5.577 | 4.915 | 4.575 | |
| Imp-1 | <0.001 * | 0.551 | 9.915 | |
| Imp-2 | <0.001 * | 1.000 | 9.193 | |
| Imp-3 | <0.001 * | <0.001 * | <0.001 * |
| 2011 | Bg-2 | Bg-3 | Imp-1 | Imp-2 |
|---|---|---|---|---|
| Bg-2 | 4.264 | 6.179 | 1.238 | |
| Bg-3 | <0.001 * | 2.378 | 7.121 | |
| Imp-1 | <0.001 * | 0.105 | 9.574 | |
| Imp-2 | 1.000 | <0.001 * | <0.001 * |
| 2013 | Bg-2 | Bg-4 | Imp-4 |
|---|---|---|---|
| Bg-2 | 1.306 | 2.613 | |
| Bg-4 | 0.575 | 4.012 | |
| Imp-4 | 0.027 * | <0.001 * |
| 2014 | Bg-2 | Bg-3 | Bg-4 | Bg-5-1 | Bg-5-2 | Imp-2 | Imp-3-1 | Imp-3-2 | Imp-3-3 | Imp-4 |
|---|---|---|---|---|---|---|---|---|---|---|
| Bg-2 | 6.630 | 2.177 | 2.490 | 0.145 | 2.911 | 5.399 | 6.564 | 1.369 | 1.523 | |
| Bg-3 | <0.001 * | 5.185 | 5.142 | 7.305 | 4.268 | 1.481 | 1.361 | 8.061 | 8.607 | |
| Bg-4 | 1.000 | <0.001 * | 0.254 | 2.450 | 0.914 | 3.785 | 4.862 | 3.795 | 4.235 | |
| Bg-5-1 | 0.575 | <0.001 * | 1.000 | 2.871 | 0.715 | 3.704 | 4.847 | 4.202 | 4.734 | |
| Bg-5-2 | 1.000 | <0.001 * | 0.642 | 0.184 | 3.274 | 6.018 | 7.716 | 1.768 | 2.034 | |
| Imp-2 | 0.162 | 0.001 * | 1.000 | 1.000 | 0.048 * | 2.850 | 3.679 | 4.477 | 4.934 | |
| Imp-3-1 | <0.001 * | 1.000 | 0.007 * | 0.010 * | <0.001 * | 0.197 | 0.316 | 6.894 | 7.437 | |
| Imp-3-2 | <0.001 * | 1.000 | <0.001 * | <0.001 * | <0.001 * | 0.011 * | 1.000 | 8.411 | 9.336 | |
| Imp-3-3 | 1.000 | <0.001 * | 0.007 * | 0.001 * | 1.000 | <0.001 * | <0.001 * | <0.001 * | 0.040 | |
| Imp-4 | 1.000 | <0.001 * | 0.001 * | <0.001 * | 1.000 | <0.001 * | <0.001 * | <0.001 * | 1.000 |
| 2015 | Bg-3 | Bg-5 | Bg-6 | Bg-7 | Imp-2 | Imp-3 | Imp-4 |
|---|---|---|---|---|---|---|---|
| Bg-3 | 1.884 | 0.919 | 0.779 | 0.851 | 2.469 | 2.943 | |
| Bg-5 | 1.000 | 2.246 | 2.405 | 1.096 | 0.843 | 0.944 | |
| Bg-6 | 1.000 | 0.518 | 0.287 | 1.505 | 2.732 | 3.018 | |
| Bg-7 | 1.000 | 0.340 | 1.000 | 1.517 | 2.898 | 3.359 | |
| Imp-2 | 1.000 | 1.000 | 1.000 | 1.000 | 1.808 | 2.130 | |
| Imp-3 | 0.284 | 1.000 | 0.132 | 0.079 | 1.000 | 0.042 | |
| Imp-4 | 0.068 | 1.000 | 0.053 | 0.016 * | 0.697 | 1.000 |
| 2016 | Bg-2 | Bg-3 | Bg-5 | Bg-6 | Bg-7 | Imp-2 | Imp-3 | Imp-4 |
|---|---|---|---|---|---|---|---|---|
| Bg-2 | 1.826 | 2.569 | 0.442 | 0.801 | 3.074 | 2.139 | 1.871 | |
| Bg-3 | 1.000 | 0.528 | 0.986 | 2.458 | 4.257 | 3.740 | 0.770 | |
| Bg-5 | 0.286 | 1.000 | 1.463 | 3.187 | 4.841 | 4.610 | 0.478 | |
| Bg-6 | 1.000 | 1.000 | 1.000 | 1.037 | 2.957 | 2.046 | 1.390 | |
| Bg-7 | 1.000 | 0.391 | 0.040 * | 1.000 | 2.391 | 1.222 | 2.286 | |
| Imp-2 | 0.059 | 0.001 * | <0.001 * | 0.087 | 0.470 | 1.515 | 3.727 | |
| Imp-3 | 0.908 | 0.005 * | <0.001 * | 1.000 | 1.000 | 1.000 | 3.041 | |
| Imp-4 | 1.000 | 1.000 | 1.000 | 1.000 | 0.622 | 0.005 * | 0.066 |
| 2017 | Bg-3 | Bg-5 | Bg-7 | Bg-8 | Imp-2 | Imp-3 | Imp-4 |
|---|---|---|---|---|---|---|---|
| Bg-3 | 4.193 | 2.828 | 1.724 | 2.948 | 2.467 | 3.013 | |
| Bg-5 | 0.001 * | 1.327 | 2.870 | 1.443 | 2.127 | 1.663 | |
| Bg-7 | 0.098 | 1.000 | 1.388 | 0.040 | 0.653 | 0.168 | |
| Bg-8 | 1.000 | 0.086 | 1.000 | 1.439 | 0.831 | 1.413 | |
| Imp-2 | 0.067 | 1.000 | 1.000 | 1.000 | 0.653 | 0.134 | |
| Imp-3 | 0.286 | 0.702 | 1.000 | 1.000 | 1.000 | 0.564 | |
| Imp-4 | 0.054 | 1.000 | 1.000 | 1.000 | 1.000 | 1.000 |
| 2018 | Bg-7 | Bg-8 | Imp-2 | Imp-3-1 | Imp-3-2 | Imp-4 |
|---|---|---|---|---|---|---|
| Bg-7 | 0.512 | 1.119 | 0.290 | 0.714 | 3.317 | |
| Bg-8 | 1.000 | 0.624 | 0.709 | 0.169 | 2.571 | |
| Imp-2 | 1.000 | 1.000 | 1.227 | 0.490 | 1.652 | |
| Imp-3-1 | 1.000 | 1.000 | 1.000 | 0.880 | 3.016 | |
| Imp-3-2 | 1.000 | 1.000 | 1.000 | 1.000 | 2.502 | |
| Imp-4 | 0.014 * | 0.152 | 1.000 | 0.038 * | 0.185 |
| 2020 | Bg-3 | Bg-9 | Bg-10 | Bg-11 | Imp-2 | Imp-3-1 | Imp-3-2 | Imp-4 |
|---|---|---|---|---|---|---|---|---|
| Bg-3 | 6.731 | 9.651 | 3.157 | 8.096 | 6.141 | 10.011 | 7.291 | |
| Bg-9 | <0.001 * | 2.951 | 3.142 | 1.310 | 0.441 | 3.922 | 0.491 | |
| Bg-10 | <0.001 * | 0.089 | 5.857 | 1.678 | 3.311 | 1.288 | 2.498 | |
| Bg-11 | 0.045 * | 0.047 * | <0.001 * | 4.378 | 2.667 | 6.537 | 3.627 | |
| Imp-2 | <0.001 * | 1.000 | 1.000 | <0.001 * | 1.720 | 2.792 | 0.829 | |
| Imp-3-1 | <0.001 * | 1.000 | 0.026 * | 0.215 | 1.000 | 4.233 | 0.925 | |
| Imp-3-2 | <0.001 * | 0.002* | 1.000 | <0.001 * | 0.147 | 0.001 * | 3.525 | |
| Imp-4 | <0.001 * | 1.000 | 0.350 | 0.008 * | 1.000 | 1.000 | 0.012 * |
| 2021 | Bg-10 | Bg-11 | Bg-9 | Imp-2 | Imp-3 | Imp-4 |
|---|---|---|---|---|---|---|
| Bg-10 | 5.936 | 2.884 | 5.257 | 7.244 | 7.223 | |
| Bg-11 | <0.001 * | 2.967 | 0.832 | 1.042 | 0.793 | |
| Bg-9 | 0.059 | 0.045 * | 2.207 | 4.108 | 3.953 | |
| Imp-2 | <0.001 * | 1.000 | 0.410 | 1.924 | 1.696 | |
| Imp-3 | <0.001 * | 1.000 | 0.001 * | 0.816 | 0.285 | |
| Imp-4 | <0.001 * | 1.000 | 0.001 * | 1.000 | 1.000 |
References
- Steinhauser, G.; Brandl, A.; Johnson, T.E. Comparison of the Chernobyl and Fukushima Nuclear Accidents: A Review of the Environmental Impacts. Sci. Total Environ. 2014, 470–471, 800–817. [Google Scholar] [CrossRef] [PubMed]
- Alexakhin, R.M.; Buldakov, L.A.; Gubanov, V.A.; Drozhko, Y.G.; Ilyin, L.A.; Kryshev, I.I.; Linge, I.I.; Romanov, G.N.; Savkin, M.N.; Saurov, M.M.; et al. Large Radiation Accidents: Consequences and Protective Countermeasures; IzdAt: Moscow, Russia, 2004; ISBN 5866561646. [Google Scholar]
- Mousseau, T.A.; Møller, A.P. Plants in the Light of Ionizing Radiation: What Have We Learned from Chernobyl, Fukushima, and Other “Hot” Places? Front. Plant Sci. 2020, 11, 552. [Google Scholar] [CrossRef] [PubMed]
- Makarenko, E.S.; Shesterikova, E.M.; Kazakova, E.A.; Bitarishvili, S.V.; Volkova, P.Y.; Blinova, Y.A.; Lychenkova, M.A. White Clover from the Exclusion Zone of the Chernobyl NPP: Morphological, Biochemical, and Genetic Characteristics. J. Environ. Radioact. 2023, 262, 107152. [Google Scholar] [CrossRef] [PubMed]
- Shimalina, N.S.; Orekhova, N.A.; Pozolotina, V.N. Features of Prooxidant and Antioxidant Systems of Greater Plantain Plantago major Growing for a Long Time under Conditions of Radioactive Contamination. Russ. J. Ecol. 2018, 49, 375–383. [Google Scholar] [CrossRef]
- Pozolotina, V.N.; Antonova, E.V. Temporal Variability of the Quality of Taraxacum officinale Seed Progeny from the East-Ural Radioactive Trace: Is There an Interaction between Low Level Radiation and Weather Conditions? Int. J. Radiat. Biol. 2017, 93, 330–339. [Google Scholar] [CrossRef]
- Shevchenko, V.A.; Kal’chenko, V.A.; Abramov, V.I.; Rubanovich, A.V.; Shevchenko, V.V.; Grinikh, L.I. Genetic Effects in Populations of Plants Growing in the Zone of Kyshtym and Chernobyl Accidents. Radiatsionnaia Biol. Radioecol. 1999, 39, 162–176. [Google Scholar]
- Geras’kin, S.A.; Fesenko, S.V.; Volkova, P.Y.; Isamov, N.N. What Have We Learned about the Biological Effects of Radiation from the 35 Years of Analysis of the Consequences of the Chernobyl NPP Accident? Biol. Bull. 2021, 48, 2105–2126. [Google Scholar] [CrossRef]
- Grodzinsky, D.M.; Gudkov, I.N. Radiation Damage of Plants in the Chernobyl Nuclear Accident Impact Zone. In 20 Years after the Chernobyl Accident: Past, Present and Future; Nova Publishers: Hauppauge, NY, USA, 2006; pp. 231–246. [Google Scholar]
- Pozolotina, V.N. Long-Term Consequences of Radiation Impact on Plants; Akademkniga: Ekaterinburg, Russia, 2003; 244p, ISBN 5-93472-100-3. (In Russian) [Google Scholar]
- Horemans, N.; Spurgeon, D.J.; Lecomte-Pradines, C.; Saenen, E.; Bradshaw, C.; Oughton, D.; Rasnaca, I.; Kamstra, J.H.; Adam-Guillermin, C. Current Evidence for a Role of Epigenetic Mechanisms in Response to Ionizing Radiation in an Ecotoxicological Context. Environ. Pollut. 2019, 251, 469–483. [Google Scholar] [CrossRef]
- Shimalina, N.S.; Pozolotina, V.N.; Orekhova, N.A. Stress Memory in Two Generations of Plantago major from Radioactive and Chemical Contaminated Areas after the Cessation of Exposure. Int. J. Radiat. Biol. 2022. [Google Scholar] [CrossRef]
- Volkova, P.Y.; Duarte, G.T.; Soubigou-Taconnat, L.; Kazakova, E.A.; Pateyron, S.; Bondarenko, V.S.; Bitarishvili, S.V.; Makarenko, E.S.; Churyukin, R.S.; Lychenkova, M.A.; et al. Early Response of Barley Embryos to Low- and High-Dose Gamma Irradiation of Seeds Triggers Changes in the Transcriptional Profile and an Increase in Hydrogen Peroxide Content in Seedlings. J. Agron. Crop Sci. 2020, 206, 277–295. [Google Scholar] [CrossRef]
- Møller, A.P.; Mousseau, T.A. Interactive Effects of Ionizing Radiation and Climate Change on the Abundance of Breeding Birds. Ecol. Indic. 2019, 99, 178–182. [Google Scholar] [CrossRef]
- Morozova, V.; Kashparova, E.; Levchuk, S.; Bishchuk, Y.; Kashparov, V. The Progeny of Chernobyl Arabidopsis thaliana Plants Does Not Exhibit Changes in Morphometric Parameters and Cellular Antioxidant Defence System of Shoots. J. Environ. Radioact. 2020, 211, 106076. [Google Scholar] [CrossRef] [PubMed]
- Geras’kin, S.; Oudalova, A.; Dikareva, N.; Spiridonov, S.; Hinton, T.; Chernonog, E.; Garnier-Laplace, J. Effects of Radioactive Contamination on Scots Pines in the Remote Period after the Chernobyl Accident. Ecotoxicology 2011, 20, 1195–1208. [Google Scholar] [CrossRef]
- Bréchignac, F.; Oughton, D.; Mays, C.; Barnthouse, L.; Beasley, J.C.; Bonisoli-Alquati, A.; Bradshaw, C.; Brown, J.; Dray, S.; Geras’ kin, S. Addressing Ecological Effects of Radiation on Populations and Ecosystems to Improve Protection of the Environment against Radiation: Agreed Statements from a Consensus Symposium. J. Environ. Radioact. 2016, 158, 21–29. [Google Scholar] [CrossRef] [PubMed] [Green Version]
- Antonova, E.V.; Pozolotina, V.N. Interannual Quality Variability in Motherwort (Leonurus quinquelobatus) Seed Progeny under Chronic Radiation Exposure. Russ. J. Ecol. 2020, 51, 417–429. [Google Scholar] [CrossRef]
- Caplin, N.; Willey, N. Ionizing Radiation, Higher Plants, and Radioprotection: From Acute High Doses to Chronic Low Doses. Front. Plant Sci. 2018, 9, 847. [Google Scholar] [CrossRef]
- Geras’kin, S.; Vasiliyev, D.; Makarenko, E.; Volkova, P.; Kuzmenkov, A. Influence of Long-Term Chronic Exposure and Weather Conditions on Scots Pine Populations. Environ. Sci. Pollut. Res. 2017, 24, 11240–11253. [Google Scholar] [CrossRef]
- Pozolotina, V.N.; Antonova, E.V.; Karimullina, E.M. Assessment of Radiation Impact on Stellaria graminea Cenopopulations in the Zone of the Eastern Ural Radioactive Trace. Russ. J. Ecol. 2010, 41, 459–468. [Google Scholar] [CrossRef]
- Antonova, E.V.; Pozolotina, V.N.; Karimullina, E.M. Viability of Plant Seed Progeny from the East-Ural Radioactive Trace: Radiation and Weather Conditions. In Genetics, Evolution and Radiation: Crossing Borders, The Interdisciplinary Legacy of Nikolay, W. Timofeeff-Ressovsky; Korogodina, V.L., Mothersill, C.E., Inge-Vechtomov, S.G., Seymour, C.B., Eds.; Springer International Publishing: Cham, Switzerland, 2016; pp. 267–275. ISBN 978-3-319-48838-7. [Google Scholar]
- Pozolotina, V.N.; Molchanova, I.V.; Mikhailovskaya, L.N.; Ul’yanova, E.V. Recent Levels of Radionuclide Contamination in the Eastern Ural Radioactive Trace and Biological Effects in Local Populations of Plantago major L. Russ. J. Ecol. 2005, 36, 320–328. [Google Scholar] [CrossRef]
- Shimalina, N.S.; Antonova, E.V.; Pozolotina, V.N. Genetic Polymorphism of Plantago major Populations from the Radioactive and Chemical Polluted Areas. Environ. Pollut. 2020, 257, 113607. [Google Scholar] [CrossRef]
- Karimullina, E.M.; Mikhailovskaya, L.N.; Antonova, E.V.; Pozolotina, V.N. Radionuclide Uptake and Dose Assessment of 14 Herbaceous Species from the East-Ural Radioactive Trace Area Using the ERICA Tool. Environ. Sci. Pollut. Res. 2018, 25, 13975–13987. [Google Scholar] [CrossRef] [PubMed]
- Garnier-Laplace, J.; Geras’kin, S.; Della-Vedova, C.; Beaugelin-Seiller, K.; Hinton, T.G.; Real, A.; Oudalova, A. Are Radiosensitivity Data Derived from Natural Field Conditions Consistent with Data from Controlled Exposures? A Case Study of Chernobyl Wildlife Chronically Exposed to Low Dose Rates. J. Environ. Radioact. 2013, 121, 12–21. [Google Scholar] [CrossRef]
- ICRP Protection of the Environment under Different Exposure Situations; ICRP Publication 124, Ann. ICRP; ICRP: Ottawa, ON, Canada, 2014; Volume 43.
- US Department of Energy. A Graded Approach for Evaluating Radiation Doses to Aquatic and Terrestrial Biota; US Department of Energy: Washington, DC, USA, 2002. [Google Scholar]
- Omar-Nazir, L.; Shi, X.; Moller, A.; Mousseau, T.; Byun, S.; Hancock, S.; Seymour, C.; Mothersill, C. Long-Term Effects of Ionizing Radiation after the Chernobyl Accident: Possible Contribution of Historic Dose. Environ. Res. 2018, 165, 55–62. [Google Scholar] [CrossRef] [PubMed]
- Boratyński, Z.; Arias, J.M.; Garcia, C.; Mappes, T.; Mousseau, T.A.; Møller, A.P.; Pajares, A.J.M.; Piwczyński, M.; Tukalenko, E. Ionizing Radiation from Chernobyl Affects Development of Wild Carrot Plants. Sci. Rep. 2016, 6, 39282. [Google Scholar] [CrossRef] [PubMed] [Green Version]
- Moles, A.T.; Westoby, M. Seedling Survival and Seed Size: A Synthesis of the Literature. J. Ecol. 2004, 92, 372–383. [Google Scholar] [CrossRef]
- Antonova, E.V.; Karimullina, E.M.; Pozolotina, V.N. Intraspecific Variation in Melandrium album along a Radioactive Contamination Gradient at the Eastern Ural Radioactive Trace. Russ. J. Ecol. 2013, 44, 18–27. [Google Scholar] [CrossRef]
- Antonova, E.V.; Pozolotina, V.N.; Karimullina, E.M. Variation in the Seed Progeny of Smooth Brome Grass, Bromus inermis Leyss., under Conditions of Chronic Irradiation in the Zone of the Eastern Ural Radioactive Trace. Russ. J. Ecol. 2014, 45, 508–516. [Google Scholar] [CrossRef]
- Vasseur, F.; Violle, C.; Enquist, B.J.; Vile, D. Genetic Variability and Plasticity of Plant Allometry. Funct. Ecol. 2023, 37, 1095–1105. [Google Scholar] [CrossRef]
- Nagel, M.; Arc, E.; Rajjou, L.; Cueff, G.; Bailly, M.; Clément, G.; Sanchez-Vicente, I.; Bailly, C.; Seal, C.E.; Roach, T. Impacts of Drought and Elevated Temperature on the Seeds of Malting Barley. Front. Plant Sci. 2022, 13, 1049323. [Google Scholar] [CrossRef]
- Pandey, G.K.; Sharma, M.; Pandey, G.K. Elucidation of Abiotic Stress Signaling in Plants; Springer: Berlin/Heidelberg, Germany, 2015; ISBN 1493922114. [Google Scholar]
- Pareek, A.; Sopory, S.K.; Bohnert, H.J. Abiotic Stress Adaptation in Plants; Springer: Berlin/Heidelberg, Germany, 2009; ISBN 9048131111. [Google Scholar]
- Gill, S.S.; Tuteja, N. Reactive Oxygen Species and Antioxidant Machinery in Abiotic Stress Tolerance in Crop Plants. Plant Physiol. Biochem. 2010, 48, 909–930. [Google Scholar] [CrossRef]
- Lata, C.; Prasad, M. Role of DREBs in Regulation of Abiotic Stress Responses in Plants. J. Exp. Bot. 2011, 62, 4731–4748. [Google Scholar] [CrossRef] [PubMed] [Green Version]
- Ahuja, I.; de Vos, R.C.H.; Bones, A.M.; Hall, R.D. Plant Molecular Stress Responses Face Climate Change. Trends Plant Sci. 2010, 15, 664–674. [Google Scholar] [CrossRef] [PubMed]
- Reddy, A.R.; Chaitanya, K.V.; Vivekanandan, M. Drought-Induced Responses of Photosynthesis and Antioxidant Metabolism in Higher Plants. J. Plant Physiol. 2004, 161, 1189–1202. [Google Scholar] [CrossRef] [PubMed]
- Gudkov, S.V.; Grinberg, M.A.; Sukhov, V.; Vodeneev, V. Effect of Ionizing Radiation on Physiological and Molecular Processes in Plants. J. Environ. Radioact. 2019, 202, 8–24. [Google Scholar] [CrossRef] [PubMed]
- Moussa, H. Low Dose of Gamma Irradiation Enhanced Drought Tolerance in Soybean. Acta Agron. Hung. 2011, 59, 1–12. [Google Scholar] [CrossRef] [Green Version]
- Ul’yanenko, L.N.; Kruglov, P.V.; Filipas, A.P.; Aleksakhin, R.M. Effect of Ionizing Radiation and Climatic Factors on Wheat Productivity. Agric. Biol. 2001, 5, 69–74. [Google Scholar]
- Trubina, M.R. Effect of Temperature and Fluorides on Growth and Development of Crepis tectorum L. Seedlings from Populations of Polluted and Nonpolluted Habitats. Contemp. Probl. Ecol. 2014, 7, 104–113. [Google Scholar] [CrossRef]
- Karpov, D.N.; Karpov, S.D.; Atnasheva, L.Z. Plantains Role in the Composition of the Southern Urals Grassy Cover. Samara J. Sci. 2017, 6, 33–36. [Google Scholar] [CrossRef]
- GBIF Secretariat. Plantago major L. GBIF Backbone Taxonomy. Checklist Dataset. Available online: https://doi.org/10.15468/39omei (accessed on 21 March 2023).
- Warwick, S.I.; Briggs, D. The Genecology of Lawn Weeds. V. The Adaptive Significance of Different Growth Habit in Lawn and Roadside Populations of Plantago major L. New Phytol. 1980, 85, 289–300. [Google Scholar] [CrossRef]
- Preobrazhenskaya, E.I. Radioresistance of Plant Seeds; Atomizdat: Moscow, Russia, 1971. (In Russian) [Google Scholar]
- Pozolotina, V.N.; Molchanova, I.V.; Karavaeva, E.N.; Mikhailovskaya, L.N.; Antonova, E.V. The Current State of Terrestrial Ecosystems in the Eastern Ural Radioactive Trace: Contamination Levels and Biological Effects; Goshchitskii: Ekaterinburg, Russia, 2008; ISBN 978-98829-011-7. (In Russian) [Google Scholar]
- Nikipelov, B.; Mikerin, Y.; Romanov, G.; Spirin, D.; Kholina, Y.; Buldakov, L. The Radiation Accident in the Southern Urals in 1957 and the Cleanup Measures Implemented. In Proceedings of the International Symposium, Vienna, Austria, 6–10 November 1989; pp. 373–403. [Google Scholar]
- Aarkrog, A.; Dahlgaard, H.; Nielsen, S.P.; Trapeznikov, A.V.; Molchanova, I.V.; Pozolotina, V.N.; Karavaeva, E.N.; Yushkov, P.I.; Polikarpov, G.G. Radioactive Inventories from the Kyshtym and Karachay Accidents: Estimates Based on Soil Samples Collected in the South Urals (1990–1995). Sci. Total Environ. 1997, 201, 137–154. [Google Scholar] [CrossRef]
- Molchanova, I.; Mikhailovskaya, L.; Antonov, K.; Pozolotina, V.; Antonova, E. Current Assessment of Integrated Content of Long-Lived Radionuclides in Soils of the Head Part of the East Ural Radioactive Trace. J. Environ. Radioact. 2014, 138, 238–248. [Google Scholar] [CrossRef] [PubMed]
- Pozolotina, V.N.; Molchanova, I.V.; Mikhaylovskaya, L.N.; Antonova, E.V.; Karavaeva, E.N. The Current State of Terrestrial Ecosystems in the Eastern Ural Radioactive Trace. In Radiation Exposure: Sources, Impacts and Reduction Strategies; Guillin Gerada, J., Ed.; Nova Science Publishers, Inc.: New York, NY, USA, 2012; pp. 113–140. ISBN 9781621008699. [Google Scholar]
- Antonova, E.V.; Pozolotina, V.N.; Karimullina, E.M. Time-Dependent Changes of the Physiological Status of Bromus inermis Leyss. Seeds from Chronic Low-Level Radiation Exposure Areas. Biol. Rhythm Res. 2015, 46, 587–600. [Google Scholar] [CrossRef]
- Vorobeichik, E.L.; Kozlov, M.V. Impact of Point Polluters on Terrestrial Ecosystems: Methodology of Research, Experimental Design, and Typical Errors. Russ. J. Ecol. 2012, 43, 89–96. [Google Scholar] [CrossRef]
- Brown, J.E.; Alfonso, B.; Avila, R.; Beresford, N.A.; Copplestone, D.; Hosseini, A. A New Version of the ERICA Tool to Facilitate Impact Assessments of Radioactivity on Wild Plants and Animals. J. Environ. Radioact. 2016, 153, 141–148. [Google Scholar] [CrossRef] [PubMed] [Green Version]
- Oliver, J.E. The Encyclopedia of World ClimatologyI; Encyclopedia of Earth Sciences Series; Springer: Dordrecht, Germany, 2005; ISBN 1402032641. [Google Scholar]
- StatSoft Inc. STATISTICA (Data Analysis Software System). New Features and Enhancements Edn; Version 10; StatSoft, Inc.: Tulsa, OK, USA, 2011. [Google Scholar]
- R Core Team. R: A Language and Environment for Statistical Computing; Version 4.0.4.; R Foundation for Statistical Computing: Vienna, Austria, 2017; Available online: https://www.r-project.org/ (accessed on 21 March 2023).


| Year | Survival Rate | Root Length | ||
|---|---|---|---|---|
| Background | EURT | Background | EURT | |
| 2005 | Bg-2≈ | Imp-1↗; Imp-2≈; Imp-2≈ | Bg-2≈ | Imp-1↘; Imp-2↘; Imp-3≈ |
| 2010 | Bg-2≈; Bg-3≈ | Imp-2-1≈; Imp-2-2≈; Imp-3≈ | Bg-2≈; Bg-3≈ | Imp-2-1≈; Imp-2-2≈; Imp-3≈ |
| 2011 * | Bg-2↘; Bg-3≈ | Imp-1↘; Imp-2↘ | Bg-2↘; Bg-3≈ | Imp-1↘; Imp-2↘ |
| 2013 | Bg-2≈; Bg-4≈ | Imp-4≈ | Bg-2↘; Bg-4↘ | Imp-4↘ |
| 2014 | Bg-2≈; Bg-3≈; Bg-4≈ Bg-5-1≈; Bg-5-2≈ | Imp-2↘; Imp-3-1↘; Imp-3-2≈; Imp-3-3≈; Imp-4≈ | Bg-2≈; Bg-3↘; Bg-4↘; Bg-5-1↘; Bg-5-2↘ | Imp-2↘; Imp-3-1↘; Imp-3-2↘; Imp-3-3↘; Imp-4↘ |
| 2015 | Bg-3↘; Bg-5≈; Bg-6↘; Bg-7↘ | Imp-2↘; Imp-3↘; Imp-4≈ | Bg-3↘; Bg-5↘; Bg-6≈; Bg-7↘ | Imp-2↘; Imp-3↘; Imp-4↘ |
| 2016 | Bg-2↘; Bg-3↘; Bg-5↘; Bg-6≈; Bg-7≈ | Imp-2≈; Imp-3≈; Imp-4≈ | Bg-2↘; Bg-3↘; Bg-5↘; Bg-6≈; Bg-7↘ | Imp-2≈; Imp-3↘; Imp-4↘ |
| 2017 | Bg-3↘; Bg-5↘; Bg-7↘; Bg-8↘ | Imp-2↘; Imp-3↘; Imp-4↘ | Bg-3↘; Bg-5↘; Bg-7↘; Bg-8↘ | Imp-2↘; Imp-3↘; Imp-4↘ |
| 2018* | Bg-7↘; Bg-8↘ | Imp-2≈; Imp-3-1↘; Imp-3-2↘; Imp-4↘; | Bg-7↘; Bg-8↘ | Imp-2↘; Imp-3-1↘; Imp-3-2↘; Imp-4↘ |
| 2020 | Bg-3↘; Bg-9↘; Bg-10↘; Bg-11↘ | Imp-2↘; Imp-3-1↘; Imp-3-2↘; Imp-4↘ | Bg-3↘; Bg-9↘; Bg-10↘; Bg-11↘ | Imp-2↘; Imp-3-1↘; Imp-3-2↘; Imp-4↘ |
| 2021 | Bg-9↘; Bg-10↘; Bg-11↘ | Imp-2↘; Imp-3↘; Imp-4↘ | Bg-9↘; Bg-10↘; Bg-11↘ | Imp-2↘; Imp-3↘; Imp-4↘ |
| Weather Factor | R | p-Value | b0 ± SE | b1 ± SE | n |
| ΣP8 | 0.45 | 0.0050 | 0.2233 ± 0.0072 | 0.0004 ± 0.0001 | 38 |
| ΣP10 | 0.42 | 0.0088 | 0.2239 ± 0.0075 | 0.0003 ± 0.0001 | 38 |
| ΣP-Tef10 | 0.81 | 0.0044 | 0.2214 ± 0.0071 | 0.0038 ± 0.0010 | 11 |
| HTC8 | 0.48 | 0.0029 | 0.2242 ± 0.0066 | 0.0171 ± 0.0053 | 38 |
| Viability Parameter | Weather Factor | R | p-Value | b0 ± SE | b1 ± SE | n |
|---|---|---|---|---|---|---|
| Background populations | ||||||
| Root length, mm | ΣP3 | −0.44 | 0.0056 | 61.81 ± 5.47 | −0.49 ± 0.17 | 38 |
| ΣP6 | −0.52 | 0.0009 | 66.78 ± 5.85 | −0.25 ± 0.07 | 38 | |
| ΣP11 | −0.55 | 0.0003 | 64.16 ± 4.78 | −0.46 ± 0.11 | 38 | |
| ΣP12 | −0.61 | <0.0001 | 67.93 ± 4.98 | −0.63 ± 0.14 | 38 | |
| ΣTef9 | −0.59 | 0.0001 | 75.28 ± 6.77 | −0.14 ± 0.03 | 38 | |
| ΣP-Tef6 | −0.53 | 0.0006 | 64.15 ± 5.03 | −0.23 ± 0.06 | 38 | |
| ΣP-Tef9 | −0.45 | 0.0047 | 60.07 ± 4.85 | −0.93 ± 0.31 | 38 | |
| HTC4 | 0.81 | 0.0015 | 26.43 ± 5.66 | 28.52 ± 6.57 | 12 | |
| HTC6 | −0.47 | 0.0029 | 63.20 ± 5.51 | −10.13 ± 3.18 | 38 | |
| ΣP3 | −0.44 | 0.0056 | 61.81 ± 5.47 | −0.49 ± 0.17 | 38 | |
| ΣP6 | −0.52 | 0.0009 | 66.78 ± 5.85 | −0.25 ± 0.07 | 38 | |
| Impact populations | ||||||
| Survival rate, % | ΣP8 | 0.42 | 0.0083 | 16.59 ± 6.19 | 0.30 ± 0.11 | 38 |
| ΣTef4 | −0.50 | 0.0025 | 43.24 ± 4.65 | −0.35 ± 0.11 | 34 | |
| ΣP-Tef8 | 0.47 | 0.0027 | 15.49 ± 5.81 | 0.34 ± 0.11 | 38 | |
| Root length, mm | ΣP8 | 0.51 | 0.0011 | 27.31 ± 5.02 | 0.31 ± 0.09 | 38 |
| ΣP12 | −0.45 | 0.0042 | 61.89 ± 6.67 | −0.59 ± 0.19 | 38 | |
| ΣTef9 | −0.51 | 0.0011 | 75.03 ± 9.34 | −0.20 ± 0.06 | 38 | |
| ΣP-Tef7 | 0.44 | 0.0050 | 23.87 ± 6.88 | 0.23 ± 0.08 | 38 | |
| ΣP-Tef8 | 0.52 | 0.0009 | 27.81 ± 4.83 | 0.32 ± 0.09 | 38 | |
| HTC7 | 0.43 | 0.0069 | 23.32 ± 7.32 | 12.07 ± 4.21 | 38 | |
| HTC8 | 0.56 | 0.0002 | 27.54 ± 4.50 | 14.71 ± 3.65 | 38 | |
| Viability Parameter | Weather Factor | R | p-Value | b0 ± SE | b1 ± SE | n |
|---|---|---|---|---|---|---|
| Impact populations, 100 Gy | ||||||
| Survival rate, % | ΣP-Tef4 | −0.79 | 0.0014 | 40.44 ± 7.28 | −9.91 ± 2.35 | 13 |
| Root length, mm | ΣP4 | −0.62 | 0.0001 | 11.96 ± 1.75 | −0.20 ± 0.04 | 33 |
| ΣP7 | −0.52 | 0.0019 | 13.60 ± 2.70 | −0.09 ± 0.03 | 33 | |
| ΣP-Tef6–8 | −0.48 | 0.0044 | 14.45 ± 3.22 | −0.05 ± 0.01 | 33 | |
| HTC6–8 | −0.44 | 0.0097 | 12.62 ± 2.93 | −5.61 ± 2.03 | 33 | |
| Background populations, 200 Gy | ||||||
| Survival rate, % | HTC4 | −0.84 | 0.0093 | 22.84 ± 5.60 | −24.52 ± 6.50 | 8 |
| HTC9 | −0.49 | 0.0092 | 18.10 ± 5.21 | −18.80 ± 6.66 | 27 | |
| Impact populations, 200 Gy | ||||||
| Root length, mm | ΣP6 | −0.68 | 0.0001 | 11.72 ± 1.91 | −0.12 ± 0.03 | 23 |
| ΣP7 | −0.66 | 0.0003 | 12.91 ± 2.28 | −0.10 ± 0.02 | 23 | |
| ΣP8 | −0.50 | 0.0095 | 7.69 ± 1.63 | −0.08 ± 0.03 | 23 | |
| ΣP-Tef6 | −0.57 | 0.0022 | 9.45 ± 1.84 | −0.10 ± 0.03 | 23 | |
| ΣP-Tef8 | −0.53 | 0.0057 | 7.73 ± 1.55 | −0.09 ± 0.03 | 23 | |
| HTC6 | −0.67 | 0.0002 | 11.09 ± 1.81 | −5.29 ± 1.20 | 23 | |
| HTC7 | −0.51 | 0.0082 | 9.75 ± 2025 | −3.73 ± 1.30 | 23 | |
| HTC8 | −0.54 | 0.0042 | 7.62 ± 1.47 | −3.77 ± 1.19 | 23 | |
| ΣTef6–8 | 0.81 | <0.0001 | −37.03 ± 6.12 | 0.03 ± 0.004 | 23 | |
| ΣP-Tef6–8 | −0.74 | 0.0042 | 15.98 ±2.36 | −0.06 ± 0.01 | 23 | |
| HTC6–8 | −0.76 | <0.0001 | 14.73 ± 2.05 | −8.04 ± 1.42 | 23 | |
| Site | Site Name | GPS Coordinates | ADR, μGy h−1 * | Multiplicity Factor of Background Level Excess |
|---|---|---|---|---|
| Background values | Bg | - | 0.091−0.129 | 1 |
| Northern shore of Lake Uruskul | Imp-1 | 55°49′ N, 60°55′ E | 14.51−16.72 ** | 145−167 |
| Southwest shore of Lake Uruskul | Imp-2 | 55°49′ N, 60°55′ E | 16.94−24.75 | 169−248 |
| South shore of Lake Berdenish | Imp-3 | 55°46′ N, 60°52′ E | 64.01−93.63 | 640−936 |
| Roadway at southern boundary of EURT | Imp-4 | 55°44′ N, 60°50′ E | 137.16−165.90 | 1371−1659 |
Disclaimer/Publisher’s Note: The statements, opinions and data contained in all publications are solely those of the individual author(s) and contributor(s) and not of MDPI and/or the editor(s). MDPI and/or the editor(s) disclaim responsibility for any injury to people or property resulting from any ideas, methods, instructions or products referred to in the content. |
© 2023 by the authors. Licensee MDPI, Basel, Switzerland. This article is an open access article distributed under the terms and conditions of the Creative Commons Attribution (CC BY) license (https://creativecommons.org/licenses/by/4.0/).
Share and Cite
Shimalina, N.S.; Antonova, E.V.; Pozolotina, V.N. Multiannual Assessment of Quality of Plantago major L. Seed Progeny from Kyshtym Radiation Accident Area: Weather-Dependent Effects. Plants 2023, 12, 2528. https://doi.org/10.3390/plants12132528
Shimalina NS, Antonova EV, Pozolotina VN. Multiannual Assessment of Quality of Plantago major L. Seed Progeny from Kyshtym Radiation Accident Area: Weather-Dependent Effects. Plants. 2023; 12(13):2528. https://doi.org/10.3390/plants12132528
Chicago/Turabian StyleShimalina, Nadezhda S., Elena V. Antonova, and Vera N. Pozolotina. 2023. "Multiannual Assessment of Quality of Plantago major L. Seed Progeny from Kyshtym Radiation Accident Area: Weather-Dependent Effects" Plants 12, no. 13: 2528. https://doi.org/10.3390/plants12132528