Article

Molecular Genetic Diversity and Combining Ability for Some Physiological and Agronomic Traits in Rice under Well-Watered and Water-Deficit Conditions

1
Rice Research Department, Field Crops Research Institute, Agricultural Research Center, Giza 12619, Egypt
2
Department of Plant Production and Protection, College of Agriculture and Veterinary Medicine, Qassim University, Burydah 51452, Saudi Arabia
3
Department of Genetics, College of Agriculture, Kafrelsheikh University, Kafr El-Sheikh 33516, Egypt
4
Agronomy Department, Faculty of Agriculture, Zagazig University, Zagazig 44519, Egypt
*
Authors to whom correspondence should be addressed.
Plants 2022, 11(5), 702; https://doi.org/10.3390/plants11050702
Submission received: 27 January 2022 / Revised: 28 February 2022 / Accepted: 2 March 2022 / Published: 5 March 2022

Abstract

:
Water deficit is a pivotal abiotic stress that detrimentally constrains rice growth and production. Thereupon, the development of high-yielding and drought-tolerant rice genotypes is imperative in order to sustain rice production and ensure global food security. The present study aimed to evaluate diverse exotic and local parental rice genotypes and their corresponding cross combinations under water-deficit versus well-watered conditions, determining general and specific combining ability effects, heterosis, and the gene action controlling important traits through half-diallel analysis. In addition, the research aimed to assess parental genetic distance (GD) employing simple sequence repeat (SSR) markers, and to determine its association with hybrid performance, heterosis, and specific combining ability (SCA) effects. Six diverse rice genotypes (exotic and local) and their 15 F1 hybrids were assessed for two years under water-deficit and well-watered conditions. The results revealed that water-deficit stress substantially declined days to heading, plant height, chlorophyll content, relative water content, grain yield, and yield attributes. Contrarily, leaf rolling and the sterility percentage were considerably increased compared to well-watered conditions. Genotypes differed significantly for all the studied characteristics under water-deficit and well-watered conditions. Both additive and non-additive gene actions were involved in governing the inheritance of all the studied traits; however, additive gene action was predominant for most traits. The parental genotypes P1 and P2 were identified as excellent combiners for earliness and the breeding of short stature genotypes. Moreover, P3, P4, and P6 were identified as excellent combiners to increase grain yield and its attributes under water-deficit conditions. The hybrid combinations; P1 × P4, P2 × P5, P3 × P4, and P4 × P6 were found to be good specific combiners for grain yield and its contributed traits under water-deficit conditions. The parental genetic distance (GD) ranged from 0.38 to 0.89, with an average of 0.70. It showed lower association with hybrid performance, heterosis, and combining ability effects for all the studied traits. Nevertheless, SCA revealed a significant association with hybrid performance and heterosis, which suggests that SCA is a good predictor for hybrid performance and heterosis under water-deficit conditions. Strong positive relationships were identified between grain yield and each of relative water content, chlorophyll content, number of panicles/plant, number of filled grains/panicle, and 1000-grain weight. This suggests that these traits could be exploited as important indirect selection criteria for improving rice grain yield under water-deficit conditions.

1. Introduction

Rice (Oryza sativa L.) is a vital cereal food crop for most parts of the world [1,2]. It has valuable nutritional benefits, being high in carbohydrates, low in fat, and rich in minerals, calories, protein, and vitamins [3]. Its acreage is approximately 162 million hectares, producing about 756 million tones [4]. Moreover, this production should be increased to cope with continuing population growth and the threat of environmental pressures [5]. Drought stress is a harsh environmental factor with devastating impacts on global rice production [6,7]. Nearly half the cultivated area of rice worldwide is predicted to suffer from water shortages, causing a substantial reduction in rice yield [8]. Rice requires standing water throughout its growing season for acceptable production. Rice is considered vulnerable to water shortage during its vegetative and reproductive stages, impacting grain yield. Water deficit accelerates flowering and elevates spikelet sterility, which results in fewer grains per panicle. Consequently, it is vulnerable to reduced yields due to water scarcity [9]. Thus, developing drought-tolerant genotypes is imperative in order to maintain global food security [10,11]. Continuous efforts are underway to breed high-yielding and drought-tolerant rice genotypes, particularly in the face of current climate change.
An effective program for breeding high-yielding and drought-tolerant genotypes must evaluate available materials in order to categorize the appropriate sources of drought tolerance [12]. Therefore, assessing the combining ability and nature of the gene action controlling agronomic traits could assist in identifying suitable parents for crossing, as well as promising recombinants, in order to improve drought tolerance [13,14]. Diallel mating is an efficient method of biometric analysis for the study of general (GCA) and specific (SCA) combining ability effects, enabling the identification of the gene action implicated in several traits in rice [15]. Additionally, it assists in understanding the heterotic effects of the offspring at a preliminary stage of breeding programs [16]. The selection of parental genotypes with good GCA effects and offspring with high SCA effects for eligible traits can be thereby enhanced. Several studies have exploited GCA and SCA to recognize good parents and identify the best crosses for improving stress tolerance in rice [3,17,18,19,20,21].
Assessing genetic diversity is an integral aspect of the development of new genotypes with a desired combination of traits [22,23,24]. Moreover, it accelerates the detection of promising genotypes without the need to evaluate all possible cross combinations in breeding programs [25,26]. Morphological and biochemical markers are environmentally influenced, and are labor-intensive and costly to study [27]. Conversely, DNA-based markers are more reliable, stable, and repeatable. Accordingly, DNA-based markers have been widely applied to investigate genetic divergence among genotypes [28,29]. Microsatellites or simple sequence repeats (SSR) are valuable markers due to their co-dominant transmission, multi-allelic nature, relative abundance, genome coverage, informativeness, and low DNA requirement [30]. Numerous published reports have revealed a significant relationship between GD-based molecular markers with F1 hybrid performance and heterosis [31,32,33], although other studies have detected no significant correlation [22,26,34,35]. We hypothesized that crossing diverse exotic and local rice genotypes with different levels of tolerance to water deficit would provide promising high-yielding and tolerant F1 hybrids. Therefore, the current study aimed to accomplish the following: (i) to explore the performance of six diverse rice genotypes and their 15 F1 crosses for some physiological and agronomic traits under well-watered and water-deficit conditions; (ii) to assess the combining ability, heterosis, and gene action type that regulates the inheritance of the studied traits; (iii) to investigate parental genetic distance and its association with hybrid performance, heterosis, and SCA; and (iv) to study the associations among evaluated traits under well-watered and water-deficit conditions.

2. Materials and Methods

2.1. Parental Genotypes and Hybridization

Six diverse rice (Oryza sativa L.) genotypes were selected according to their distinct origin and tolerance to water deficit. The selected parents included tolerant exotic genotypes and adopted local cultivars that are sensitive to drought stress. Seeds were obtained from genetic stock of the Rice Research and Training Center (RRTC). The pedigree of utilized parents is displayed in Table 1. A half-diallel mating design (6 × 6) excluding reciprocals was employed to produce 15 F1 hybrids during the summer season of 2019. The hot-water emasculation method was utilized according to Jodon [36], as modified by Butany [37].

2.2. Experimental Site and Agronomic Practices

The parental genotypes and generated F1 hybrid combination crosses were assessed during two growing seasons in 2020 and 2021 at the Experimental Farm of Rice Research Department, Sakha Agricultural Research Station, Kafr El-Sheikh, Egypt (31°09′ N, 30°9′ E). The experimental site is hot, with no precipitation events during rice growing seasons, which is representative of the summer season in Egypt. The meteorological data are shown in Figure S1. The physical and chemical soil properties of the experimental site during both seasons are described in Table S1. The parental genotypes and obtained F1 hybrid combinations were assessed under two irrigation regimes; well-watered and water-deficit conditions in separated experiments. A Randomized Complete Block Design (RCBD) with three replications was used in each experiment. The well-watered condition (W) was performed using continuous flooding every 4 days with an adequate depth of submersion that ensured all surface areas were covered by water in each irrigation incident. The water-deficit treatment (S) was performed using irrigation every 12 days without standing water. The stress condition was applied after 15 days from the transplantation date until maturity. The applied irrigation quantities for each treatment were measured using a flow meter, and were 13,100 and 8360 m3/ha under well-watered and water-deficit conditions, respectively. The seeds of each genotype (parents and their corresponding F1 crosses) were sown in the nursery on 7 and 5 of May in the 2020 and 2021 seasons, respectively, then transplanted to the field after 30 days. The seedlings of each genotype (the parents and F1s) were individually transplanted in three rows per replicate. Each row was 4.0 m long with a spacing of 20 × 20 cm among rows and hills. Nitrogen fertilizer at a rate of 165 kg N ha−1 was applied in three splits in the form of urea (46.0% N). Phosphorous was applied at a rate of 37 kg P2O5 ha−1 as super-phosphate (15% P2O5), and potassium at a rate of 50 kg K2O kg/ha as potassium sulfate (48% K2O). Zinc fertilizer was applied at a rate of 24 kg/ha ZnSO4. Other standard agricultural practices such as weed control and disease protection were applied.

2.3. Measured Traits

2.3.1. Morphological and Physiological Traits

The value of days to heading (DTH) was measured as the number of days from transplanting to the date when 50% of panicles were fully exerted in each plot. The plant height (PH; cm) was recorded as the distance from the soil surface to the tip of the main panicle at maturity. Chlorophyll content (CHLC; SPAD unit) was recorded utilizing a SPAD meter (Model: SPAD-502, Hangzhou Mindfull Technology Co., Ltd., Hangzhou, China) from the topmost completely expanded leaves on the main panicle during the flowering period. Leaf rolling (LR) was recorded using visual assessment following the method outlined by De Datta et al. [38]. Relative water content (RWC) was measured as proposed by Barrs and Weatherley [39] using the following equation: RWC = ((FW − DW)/(TW − DW)) × 100, where FW is fresh leaf weight, DW is leaf dry weight, and TW is turgid leaf weight.

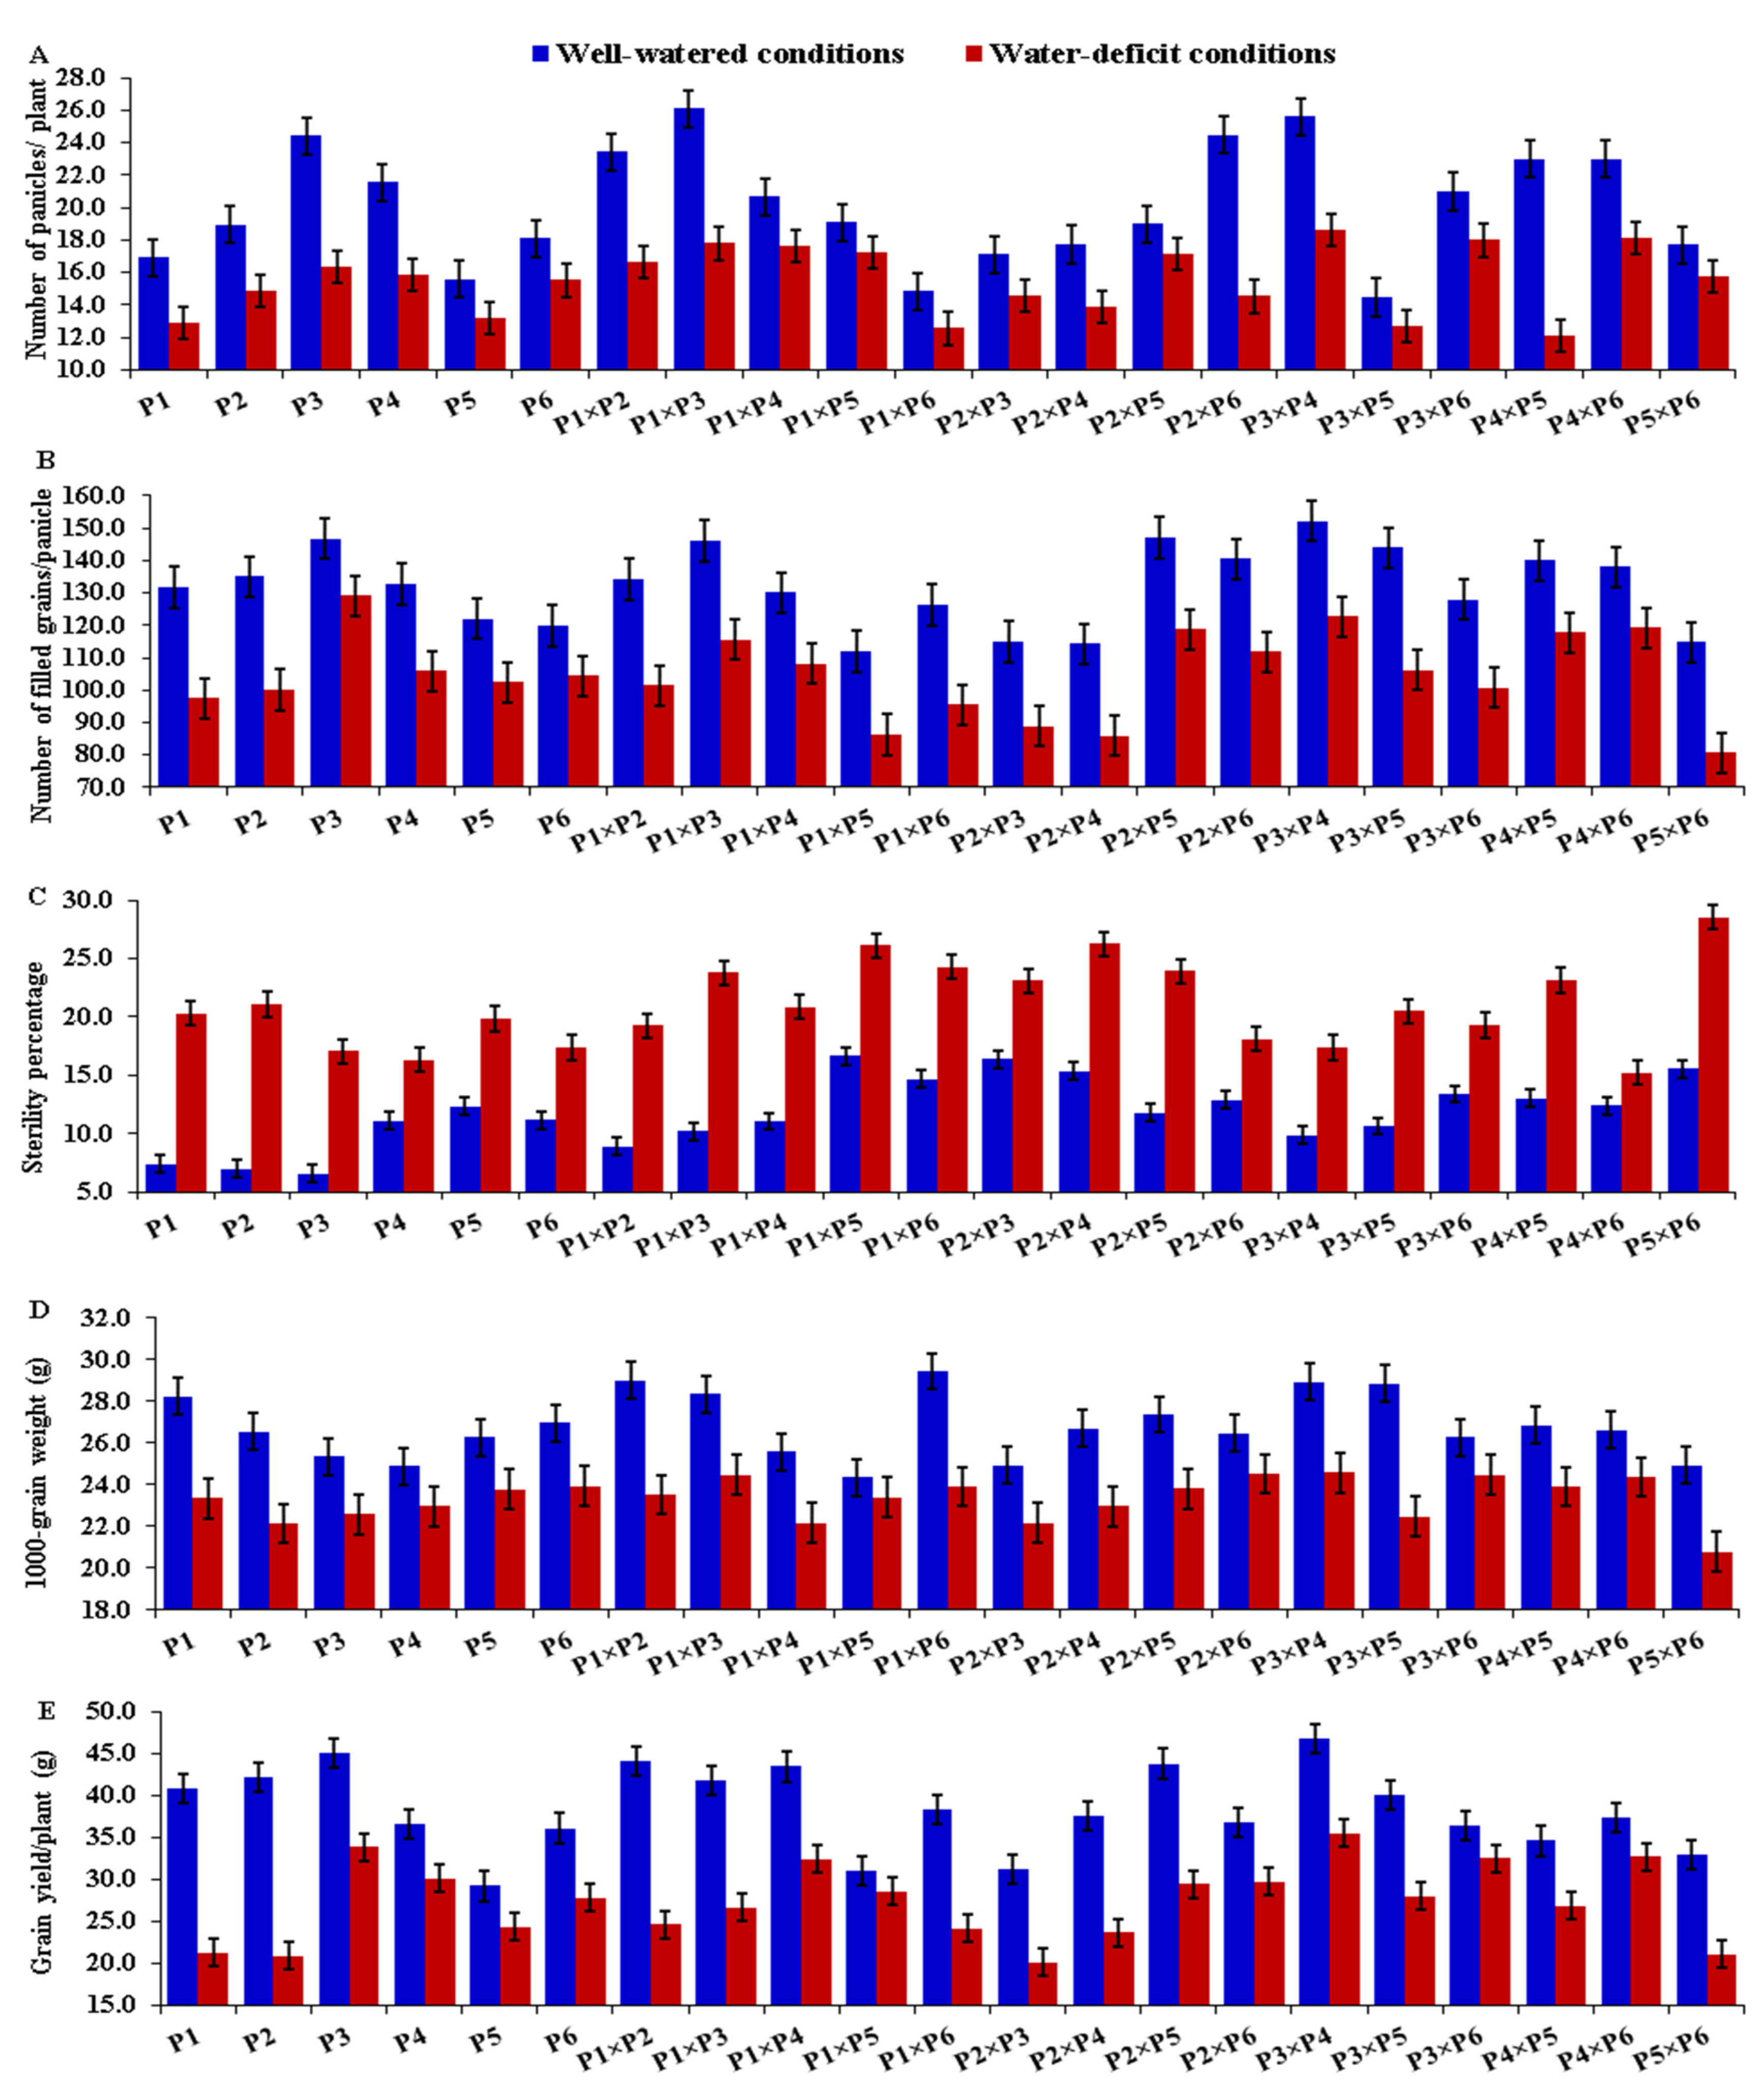
2.3.2. Grain Yield and Its Related Traits

At harvest, the number of panicles per plant (NP) was measured by counting the number of panicles/plant of 10 randomly selected plants in each plot. The number of filled grains per panicle (NFG) was recorded by separating and counting the filled grains of 10 main panicles selected randomly from each plot. The 1000-grain weight (TGW; g) was calculated based on the weight of 1000 grains sampled from each plot. The sterility percentage (SP, %) was recorded by dividing the number of unfilled grains by the total grains from 10 panicles/plot. Grain yield/plant (GYPP; g) was recorded as the weight of the individual plant grain yield and adjusted to 14% grain moisture content.

2.4. Molecular Analysis

Genomic DNA was extracted utilizing the CTAB method [40] from a healthful portion of leaves obtained from 20-day-old seedlings. Twenty-nine SSR markers related to drought tolerance traits/QTLs were applied [41,42,43,44]. Only 16 polymorphic markers were detected and accordingly were employed for SSR analysis. The sequence information of primers used is presented in Table S2, and chromosomal locations and repeat motifs are provided on the Gramene website (http://www.gramene.org, accessed on 26 January 2022). PCR analysis was performed utilizing a 10 μL reaction volume including 1 Taq DNA polymerase unit, 0.2 mM dNTPs, 2 mM MgCl2, 0.5 μM reverse and forward primers, and 1 μL of 20 ng/μL genomic DNA template. The PCR reaction was initially started by denaturation at 94 °C for 2 min followed by 94 °C for 30 s, annealing at 55–64 °C (based on primer Tm) for 30 s, extension at 72 °C for 30 s for thirty-five cycles, and the program was completed with a final extension step at 72 °C for 3 min. Amplification products were separated using a gel electrophoresis unit incorporating 2% agarose gel, stained with ethidium bromide and visualized under a UV-Gel documentation system. Allele number, major allele frequency, gene diversity, and the polymorphic information content (PIC) were identified for all markers utilizing Power-Marker version 3.25. Genetic distances were estimated using the PAST program. The dendrogram tree was constructed with the unweighted pair group method utilizing arithmetic averages (UPGMA) within the computational package MVSP version 3.1.

2.5. Statistical Analysis

The analysis of variance (ANOVA) was performed for all measured traits using R statistical software version 4.1.1 The combined analysis was applied whenever the homogeneity test was non-significant using Bartlett’s test. Combining ability analysis was applied as outlined by Griffing’s method 2, model 1 [16]. Heterosis was computed as follows: mid-parent (MP) heterosis = (F1 − MP)/MP × 100 and better-parent (BP) heterosis = (F1 − BP)/BP × 100.
Four tolerance indices were estimated to determine potentially drought-tolerant genotypes as follows: Mean productivity (MP) = Y s +   Y p 2 , [45]
Geometric mean productivity (GMP) = Y s × Y p , [46]
Stress tolerance index (STI) STI = Y s × Y p ( Y - p ) 2 , [46]
Yield index (YI) = Y s Y - s , [47] where Yp is yield of each genotype under well-watered conditions, Ys is yield of each genotype under water-deficit conditions, and Ȳp and Ȳs are the means of all genotypes under well-watered and stress conditions, respectively. The hierarchical cluster analysis was applied based on tolerance indices to differentiate the evaluated genotypes based on their drought tolerance following the method of Ward Jr [48]. Principal component analysis (PCA) was performed to evaluate associations among the studied traits.

3. Results

3.1. Analysis of Variance

The analysis of variance results indicated significant impacts of irrigation (I), genotype (G), and their interactions (G × I) on all of the studied traits (Table 2). Dividing the genotypic effect into GCA and SCA components revealed that the GCA and SCA mean squares were highly significant for all assessed characteristics. The interaction effects of GCA × I and SCA × I were significant for all evaluated traits. The ratio of GCA/SCA was greater than the unity for all considered traits, except chlorophyll content (CHLC), number of filled grains/panicle (NFG), sterility percentage (SP), and 1000-grain weight (TGW). Furthermore, the extent of GCA × I interaction was superior to SCA × I for all characteristics, except PH, CHLC, NP, and TGW.

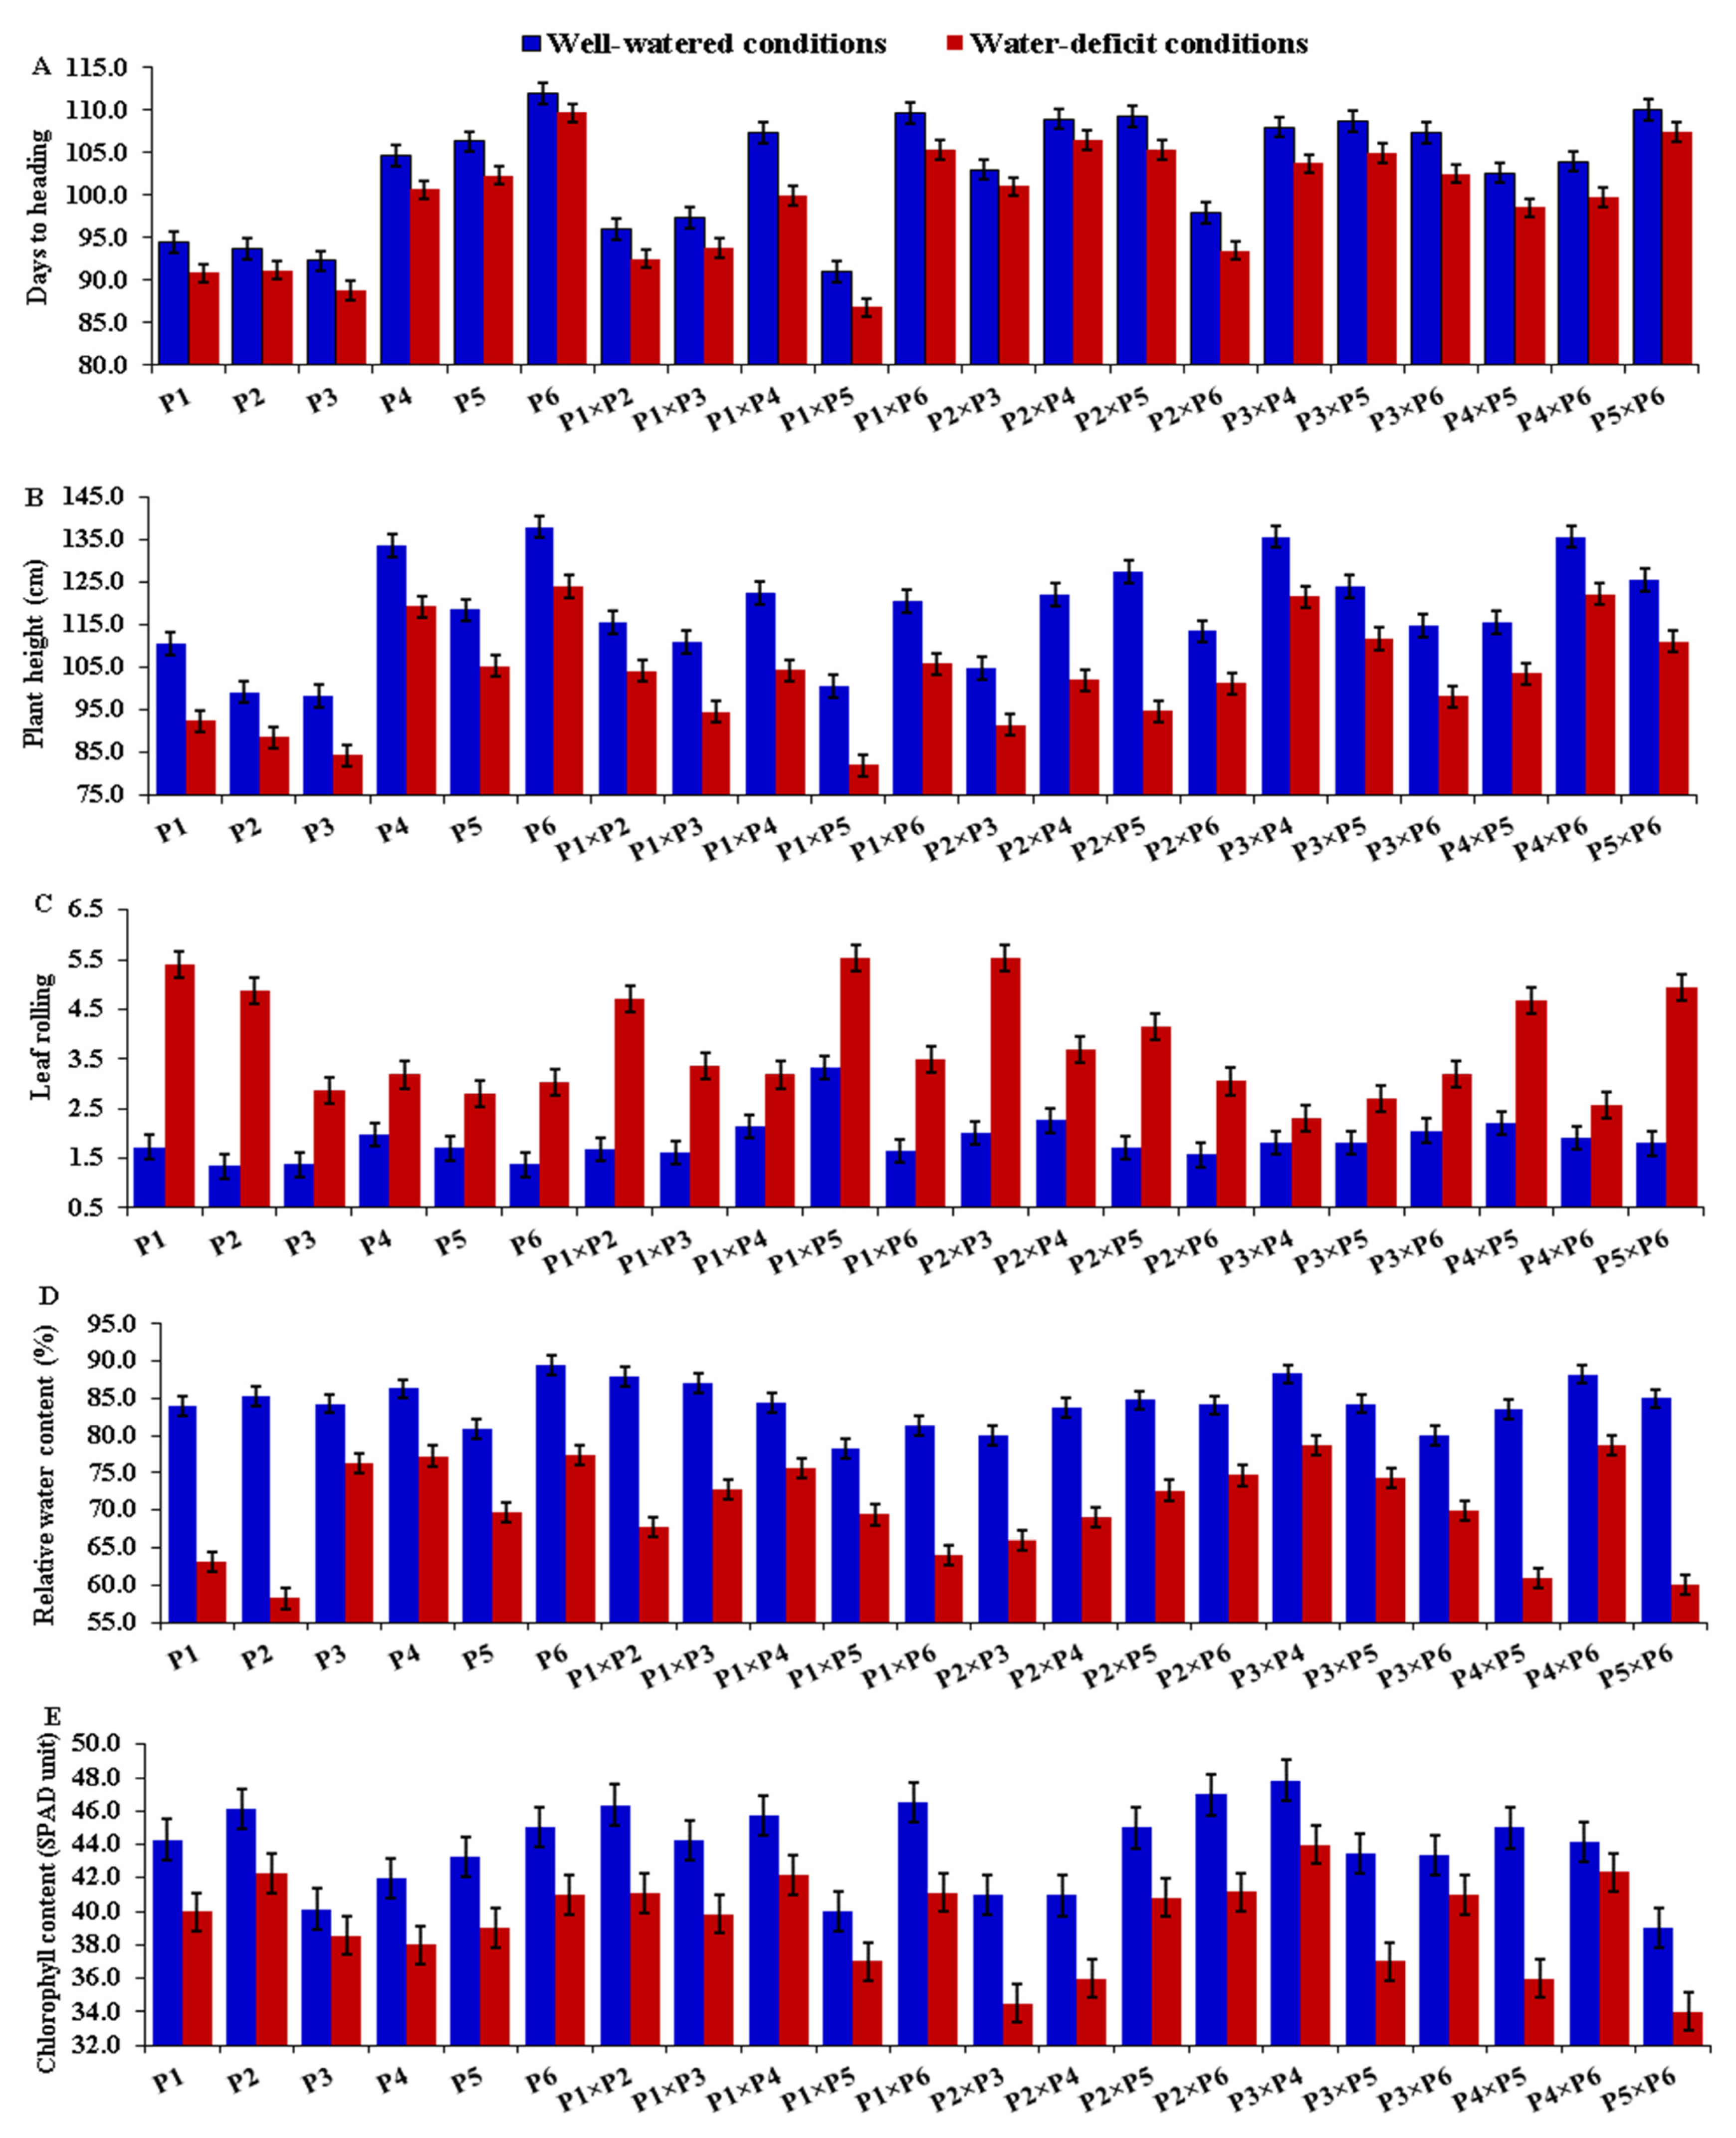
3.2. Mean Performance of Parents and F1 Hybrids

The assessed rice parental genotypes and their F1 hybrids manifested a wide variation for all measured traits under both well-watered and stress conditions. Water-deficit stress caused early heading in all tested genotypes compared with normal irrigation. The mean values of days to heading (DTH) reduced from 103.1 to 99.3 days due to water deficiency (Figure 1A). The parents P3, P1, and P2 and the hybrids P1 × P2, P1 × P3, and P2 × P6 displayed the earliest heading, whereas the latest heading was exhibited by the parent P6 and the hybrids P1 × P6, P2 × P4, P3 × P5, and P5 × P6 under both normal and water-deficit conditions (Figure 2A). Plant height (PH) declined on average from 118.4 to 103.0 cm, as the amount of irrigation decreased (Figure 1B). The parents P3 and P2 and hybrids P1 × P5, P1 × P3, and P2 × P3 produced the shortest plants, whereas the tallest ones were from the parents P6, P4 and the hybrids P3 × P4, and P4 × P6 under both irrigation regimes (Figure 2B). Water-deficit treatment also caused a considerable increase in leaf rolling (LR), which rose on average from 1.87 under well-watered conditions to 4.59 under water-deficit conditions (Figure 1C). The parental genotypes P2, P3, and P6 and the hybrids P1 × P3, P1 × P6, and P2 × P6 showed the lowest values under normal conditions, while the parents P3, P5 and P6 and the hybrid combinations P3 × P5, P3 × P4, and P4 × P6 had the lowest values under stress conditions (Figure 2C). Relative water content (RWC) also was negatively affected by water limitation; it decreased from 84.34% under regular irrigation to 72.04% under water-deficit conditions (Figure 1D). The highest values were exhibited by the parents P4 and P6 and the hybrids P1 × P3, P3 × P4, and P4 × P6 under both treatments (Figure 2D). Likewise, water deficiency decreased chlorophyll content (CHLC) from 43.83 to 39.37 (Figure 1E). The highest values for chlorophyll content were recorded for the parents P2 and P6 and the hybrids P1 × P2, P1 × P4, P1 × P6, and P3 × P4 under both conditions (Figure 2E). Under water-deficit conditions, the number of panicles per plant (NP) also declined from 20.13 to 15.52 (Figure 1F). The parental genotypes P3 and P4 had the highest mean values under both conditions (Figure 3A). The cross combinations P1 × P2, P1 × P3, P2 × P6, P3 × P4, P4 × P5, and P4 × P6 produced the highest number of panicles per plant under well-watered conditions, whilst P3 × P4, P4 × P6, and P3 × P6 produced the highest number under stress conditions. In the same manner, the number of filled grains per panicle (NFG) significantly decreased as irrigation decreased, falling from 131.95 to 104.77 (Figure 1G). The uppermost values were exhibited by the parents P2 and P3 and the hybrid combinations P1 × P3, P2 × P5, P3 × P4, and P3 × P5 under well-watered conditions (Figure 3B). Under stress conditions, the highest NFG values were displayed by the parents P3 and P4 and the hybrids P1 × P3, P2 × P5, P3 × P4, P4 × P5, and P4 × P6. On the other hand, water-deficit treatment caused a significant increase in the sterility percentage (SP) from 11.83% to 21.04% (Figure 1H). Under well-watered conditions, the genotypes P1, P2, P3, P1 × P2, P1 × P3, P3 × P4, and P3 × P5 demonstrated the lowest SP, while P3, P4, P6, P2 × P6, P3 × P4, and P4 × P6 recorded the lowest SP under water-deficit conditions (Figure 3C). Water-deficit treatment reduced the 1000-grain weight (TGW) from 26.81 to 23.35 g (Figure 1I). The heaviest TGW was recorded for the parental genotypes P1, P2, and P6 and the hybrids P1 × P2, P1 × P3, P1 × P6, P3 × P4, and P3 × P5 under well-watered conditions. The parents P5 and P6 and the hybrids, P1 × P3, P2 × P6, P3 × P4, P3 × P6, and P4 × P6, on the other hand, had the highest TGW values under water-deficit conditions (Figure 3D). Finally, grain yield per plant (GYPP) reduced significantly, from 38.39 to 27.33 g under well-watered and stress conditions, respectively (Figure 1J). The parents P1, P2, and P3 and the hybrids P1 × P2, P1 × P4, P2 × P5, and P3 × P4 exhibited the highest grain yield under well-watered conditions, while the parents P3, P4, and P6 and the hybrids P1 × P4, P3 × P4, P3 × P6, and P4 × P6 produced the highest grain yield under stress conditions (Figure 3E).

3.3. Genotypic Classification According to Drought Tolerance Indices

Drought tolerance indices were estimated for the assessed rice parents and their corresponding hybrids. These indices were employed to categorize the evaluated genotypes based on their drought-stress tolerance. The assessed genotypes were categorized into three groups with distinct genotypes (Figure 4). The genotypes in group A included six genotypes, specifically P3, P4, P1 × P4, P3 × P4, P3 × P6, and P4 × P6, which possessed superior values for tolerance indices; hence, they are considered drought-tolerant genotypes. Group B, on the other hand, consists of eight genotypes with intermediate values for the tolerance indices; consequently, they are categorized as moderately drought-tolerant genotypes. However, the seven genotypes in groups C displayed the lowest values of tolerance indices; hence, they are deemed drought-sensitive genotypes.

3.4. General Combining Ability (GCA) Effects

The parents with significant and positive GCA effects are vital for all studied traits, except DTH, PH, LR and SP where negative values are desirable. The GCA effects for the assessed traits varied greatly among the evaluated parents (Table 3). The parental genotypes P1, P2, and P3 exhibited the highest significant and negative GCA effects for DTH and PH under both well-watered and stress conditions. Similarly, the highest significant and negative GCA effects for LR were recorded by P3, P4, and P6 under water-deficit conditions. Otherwise, significant and positive GCA effects for RWC were observed for P3 under drought stress conditions, and for P4 and P6 under both conditions. In addition, positive and significant GCA effects for CHLC were exhibited by P1, P2, and P6 under both conditions. The parents P3 and P4 recorded the highest significant and positive GCA effects for NP and NFG. The best combiners for SP were demonstrated by P1 and P2, under well-watered conditions; P4 and P6, under water-stress conditions; and P3 under both conditions. Meanwhile, the largest positive GCA effect for TGW was observed for P1 under well-watered conditions and P6 under water-deficit conditions. The highest positive and significant GCA for grain yield was obtained by P1 and P2 under well-watered conditions, P6 under water-stress conditions, and P3 and P4 under both conditions, demonstrating that they are appropriate candidates for GY improvement.

3.5. Specific Combining Ability (SCA) Effects

The hybrids exhibited considerable variation regarding the SCA effects for all the studied traits (Table 4). Negative and significant SCA estimates for DTH were exhibited by the hybrids P1 × P5, P2 × P6, P4 × P5, and P4 × P6 under both conditions (Table 4). The crosses P1 × P5, P2 × P6, P3 × P6, and P4 × P5 displayed significant and negative SCA values for PH across both conditions. The highest negative and significant SCA effects for LR were observed by the crosses P1 × P3, P1 × P4, P1 × P6, P2 × P5, P2 × P6, P3 × P4, P3 × P5, and P4 × P6 under water-deficit conditions. Conversely, the uppermost positive and significant SCA estimates for RWC were recorded by P1 × P2, P1 × P3, P2 × P5, P3 × P4, P3 × P5, and P4 × P6 under both conditions. Regarding CHLC, the SCA effects were positive and significant for the crosses P1 × P6 and P4 × P5 under normal conditions, for P4 × P6 under stress conditions, and for P1 × P2, P1 × P4, P2 × P5, and P3 × P4 under both conditions. Similarly, P1 × P2, P1 × P3, P1 × P5, P2 × P5, P3 × P4, and P4 × P6 expressed the largest significant and positive SCA values for NP. High positive and significant SCA estimates for NFG were exhibited by P1 × P2, P1 × P3, P2 × P5, P2 × P6, P4 × P5, and P4 × P6 under both conditions. The hybrids P1 × P2, P3 × P4, P3 × P5, and P4 × P6 were identified as good specific combiners for SP. Regarding TKW, the highest positive SCA values were observed for the hybrids P1 × P2, P1 × P6, and P3 × P5 under well-watered conditions, for P2 × P6 and P4 × P6 under stress conditions, and for P1 × P3, P2 × P5, P3 × P4, and P4 × P5 under both conditions. Additionally, the highest positive SCA effects for GYPP were observed for P3 × P5 under well-watered conditions, P1 × P5, P2 × P6, P3 × P6, and P4 × P6 under water-deficit conditions, and P1 × P2, P1 × P4, P2 × P5, and P3 × P4 under both conditions.

3.6. Heterosis Relative to Mid-Parent (MP) and Better-Parent (BP)

The heterosis percentages relative to MP or BP under well-watered and water-deficit conditions are presented in Table 5. Most crosses demonstrated substantial heterosis relative to MP or BP under both conditions. The largest negative MP heterosis for DTH towards earliness was observed for P1 × P5, P2 × P6, P4 × P5, and P4 × P6 under both conditions, whilst the highest negative BP heterosis was exhibited by P1 × P5 and P4 × P5. The cross combinations P1 × P5, P1 × P6, P2 × P6, P3 × P6, P4 × P5, and P5 × P6 manifested significant negative MP heterosis for PH towards shortness. Meanwhile, only the hybrid P1 × P5 had significant negative BP heterosis for this trait under both conditions. Under drought stress conditions, the hybrids P1 × P3, P1 × P4, P1 × P6, and P2 × P6 displayed the highest negative and significant MP heterosis for LR, whereases the hybrid P3 × P4 showed the highest heterosis over BP. Meanwhile, the highest positive and significant MP heterotic effects for RWC were recorded for P1 × P2, P1 × P3, P2 × P5, P3 × P4, and P3 × P5 under both treatments, whereas the maximum significant and positive BP heterosis was recorded for P1 × P3 under well-watered conditions, for P2 × P5 under water-stress conditions, and for P1 × P2 and P3 × P4 under both conditions.
The uppermost positive MP and BP heterotic effects for CHLC were exhibited by the hybrids P1 × P4 and P3 × P4 under both conditions. Additionally, positive and significant heterosis over the BP was observed for the hybrid P1 × P6 under well-watered conditions and for P4 × P6 under water-stress conditions. With respect to NP, the hybrids P1 × P2, P1 × P3, P1 × P5, P3 × P4, and P4 × P6 displayed the largest significant and positive heterotic effects relative to MP and BP under both conditions. The crosses with the best positive MP values for NFG were P1 × P3, P3 × P4, and P3 × P5 under well-watered conditions, P1 × P4 under water-deficit conditions, and P2 × P5, P2 × P6, P4 × P5, and P4 × P6 under both conditions. In addition, positive and significant heterosis relative to BP was exhibited by the crosses P2 × P6 and P4 × P6 under stress conditions and P2 × P5 and P4 × P5 under both conditions. The three hybrids P1 × P2, P2 × P6 and P4 × P6 possessed significantly negative MP heterosis for the SP, while the highest negative and significant BP heterosis was exhibited by the hybrid P4 × P6 under stress conditions. Concerning TKW, significant and positive MP heterotic effects were observed for the hybrids P1 × P2, P1 × P6, P2 × P4, P3 × P5, and P4 × P5 under well-watered conditions and for P1 × P3, P2 × P5, and P3 × P4 under both conditions. Furthermore, significant and positive BP heterotic effects were exhibited by the hybrid P1 × P6 under well-watered conditions, by P1 × P3 under stress conditions, and by P3 × P4 under both conditions. The hybrid combinations P1 × P2, P1 × P4, and P3 × P4 displayed the uppermost positive and significant MP and BP heterotic effects under both conditions for GYPP. Meanwhile, the hybrids P2 × P5, P2 × P6, and P4 × P6 exhibited significantly positive BP heterosis under water-deficit conditions.

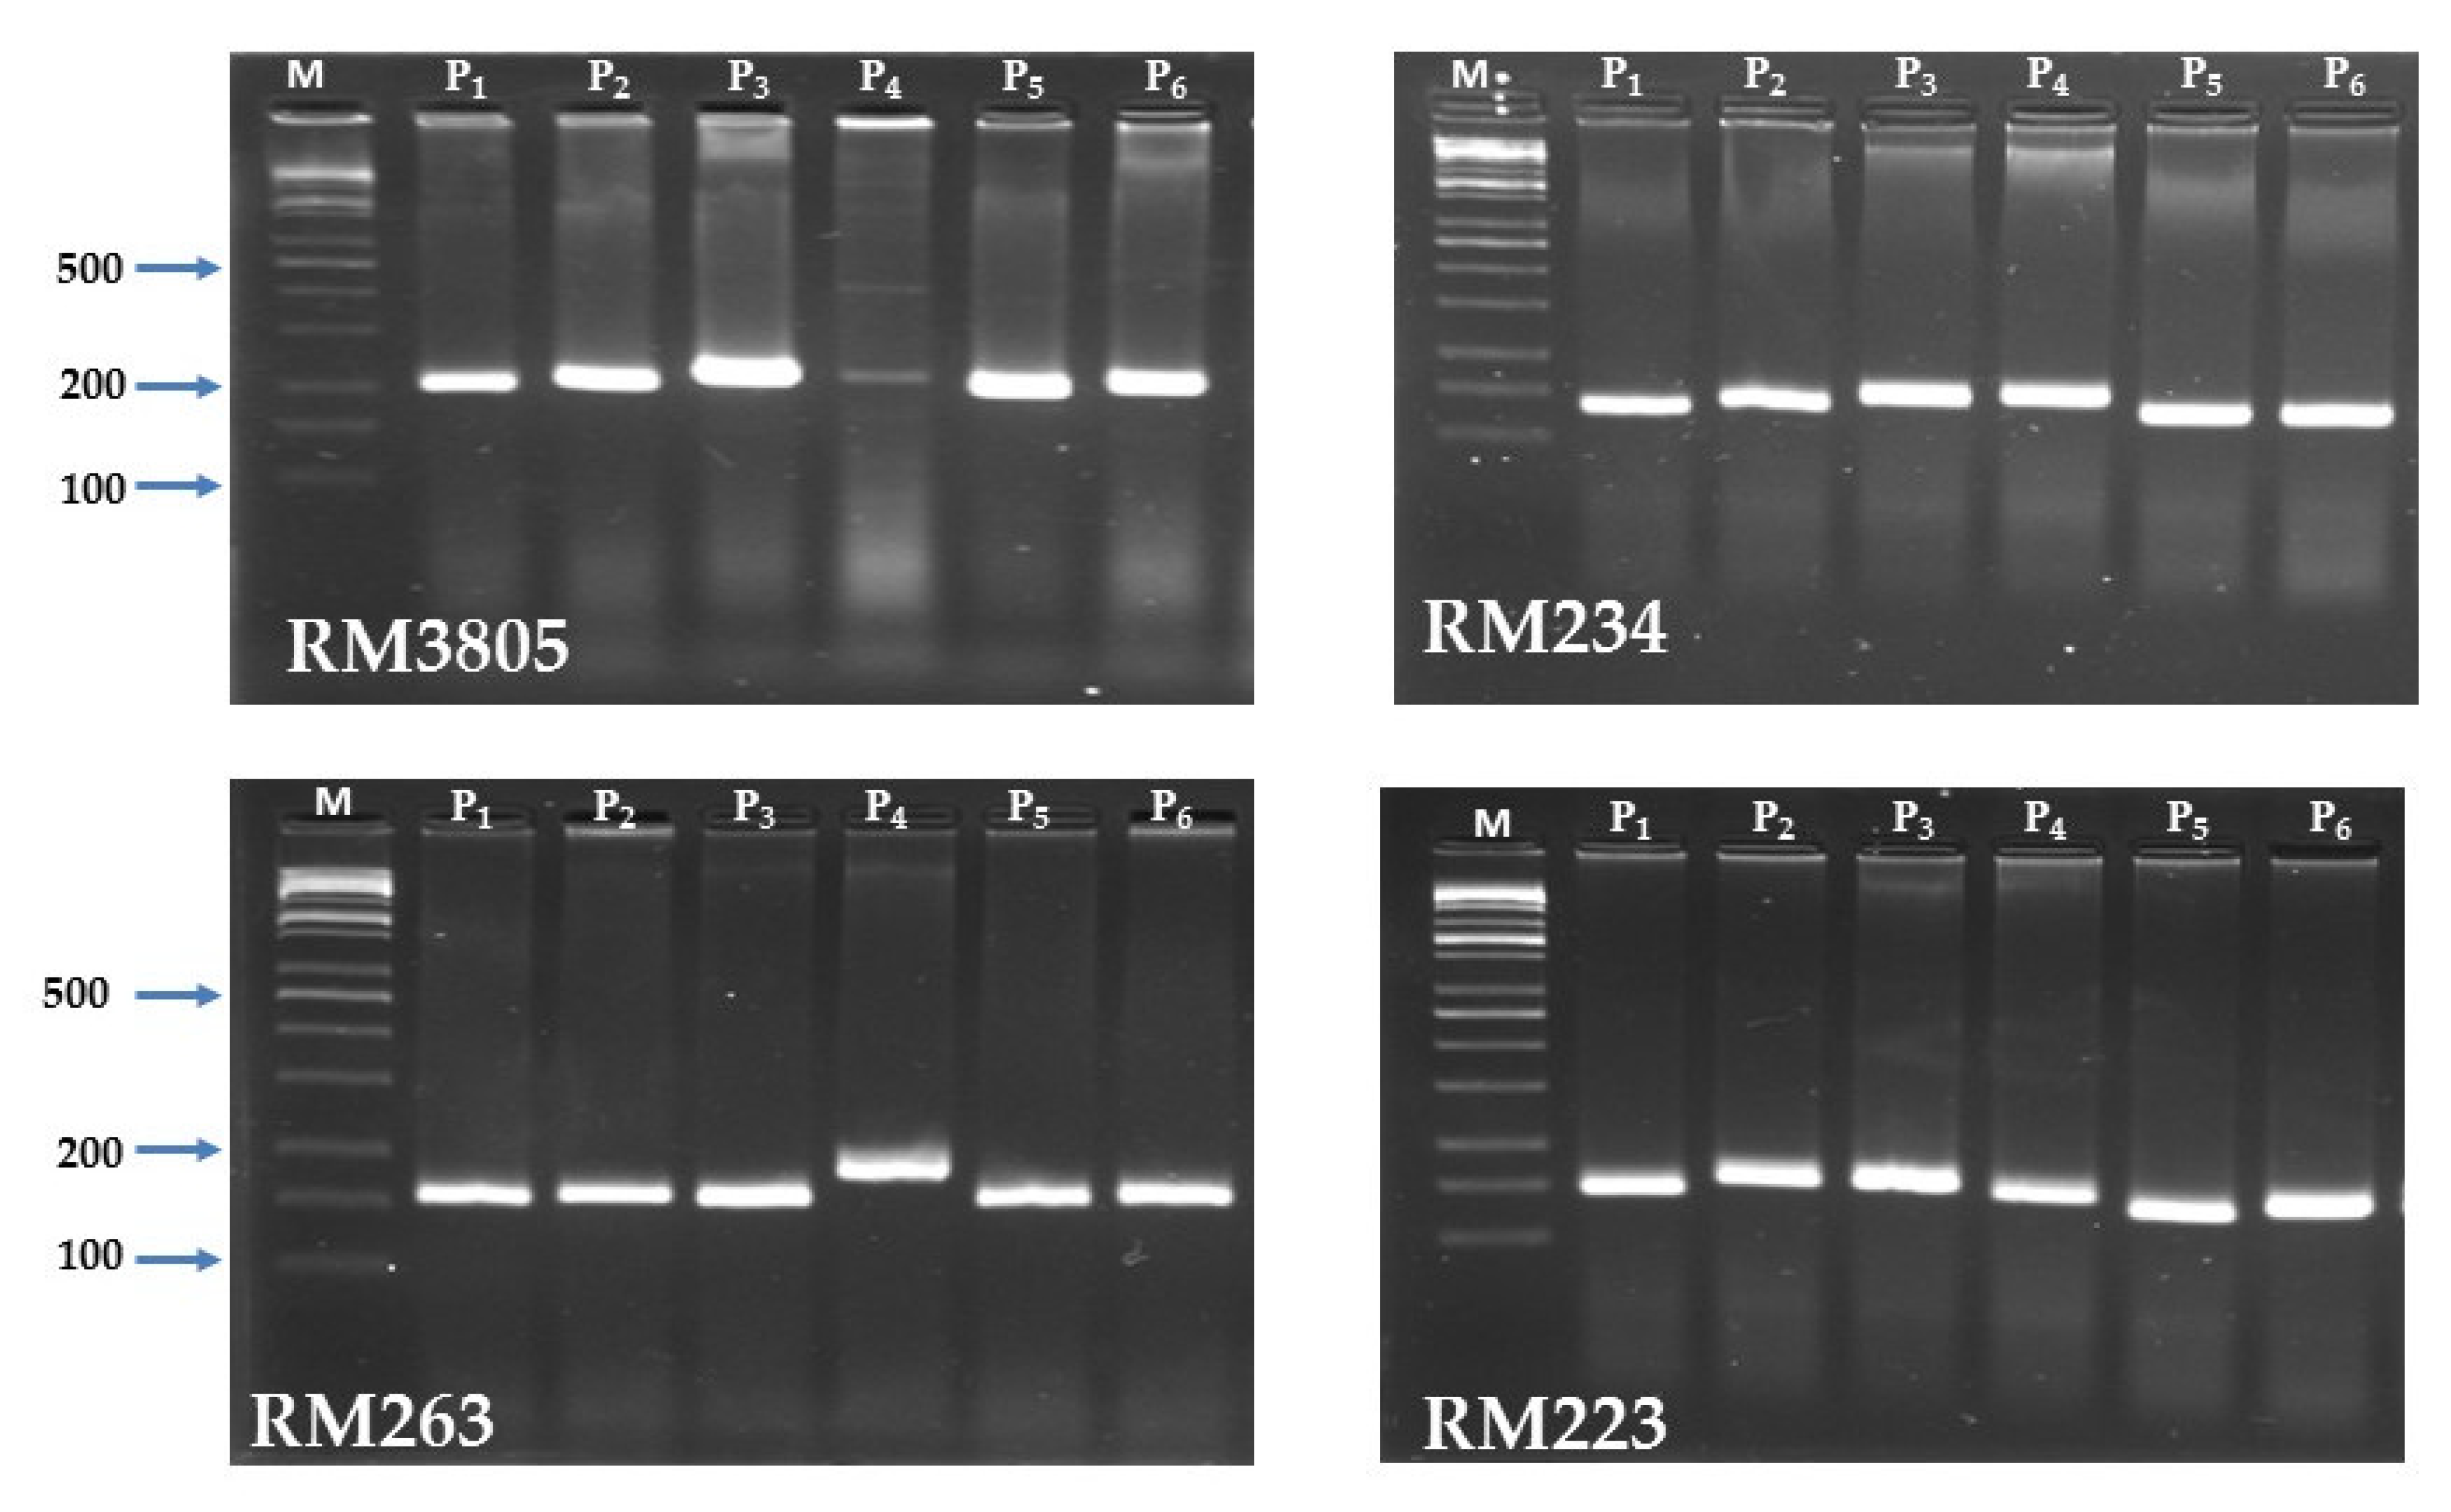
3.7. Microsatellites Based Polymorphism

Out of the twenty-nine SSR primers assessed, sixteen polymorphic markers were found throughout the rice genome. The polymorphic SSR markers provided a total of fifty-three alleles, which were utilized to analyze the genetic diversity among the investigated parental genotypes. The allele numbers per locus varied from two (RM315 and RM543) to five (RM20A), with an average of 3.31 alleles/locus (Table 6). The effective number of alleles per locus varied from 1.80 to 3.79 alleles with an average of 2.77 alleles. The maximum effective number of alleles per locus (3.79) was identified for RM20A and RM279. The major allele frequency had an average of 0.49 with a range from 0.33 to 0.67. The gene diversity or heterozygosity (HE) varied from 0.44 (RM543) to 0.74 (RM20A and RM279) with an average of 0.62. Moreover, the average polymorphic information content (PIC) was 0.55 with a range of 0.35 (RM543) to 0.69 (RM20A and RM279). The highly polymorphic SSR markers are displayed in Figure 5.

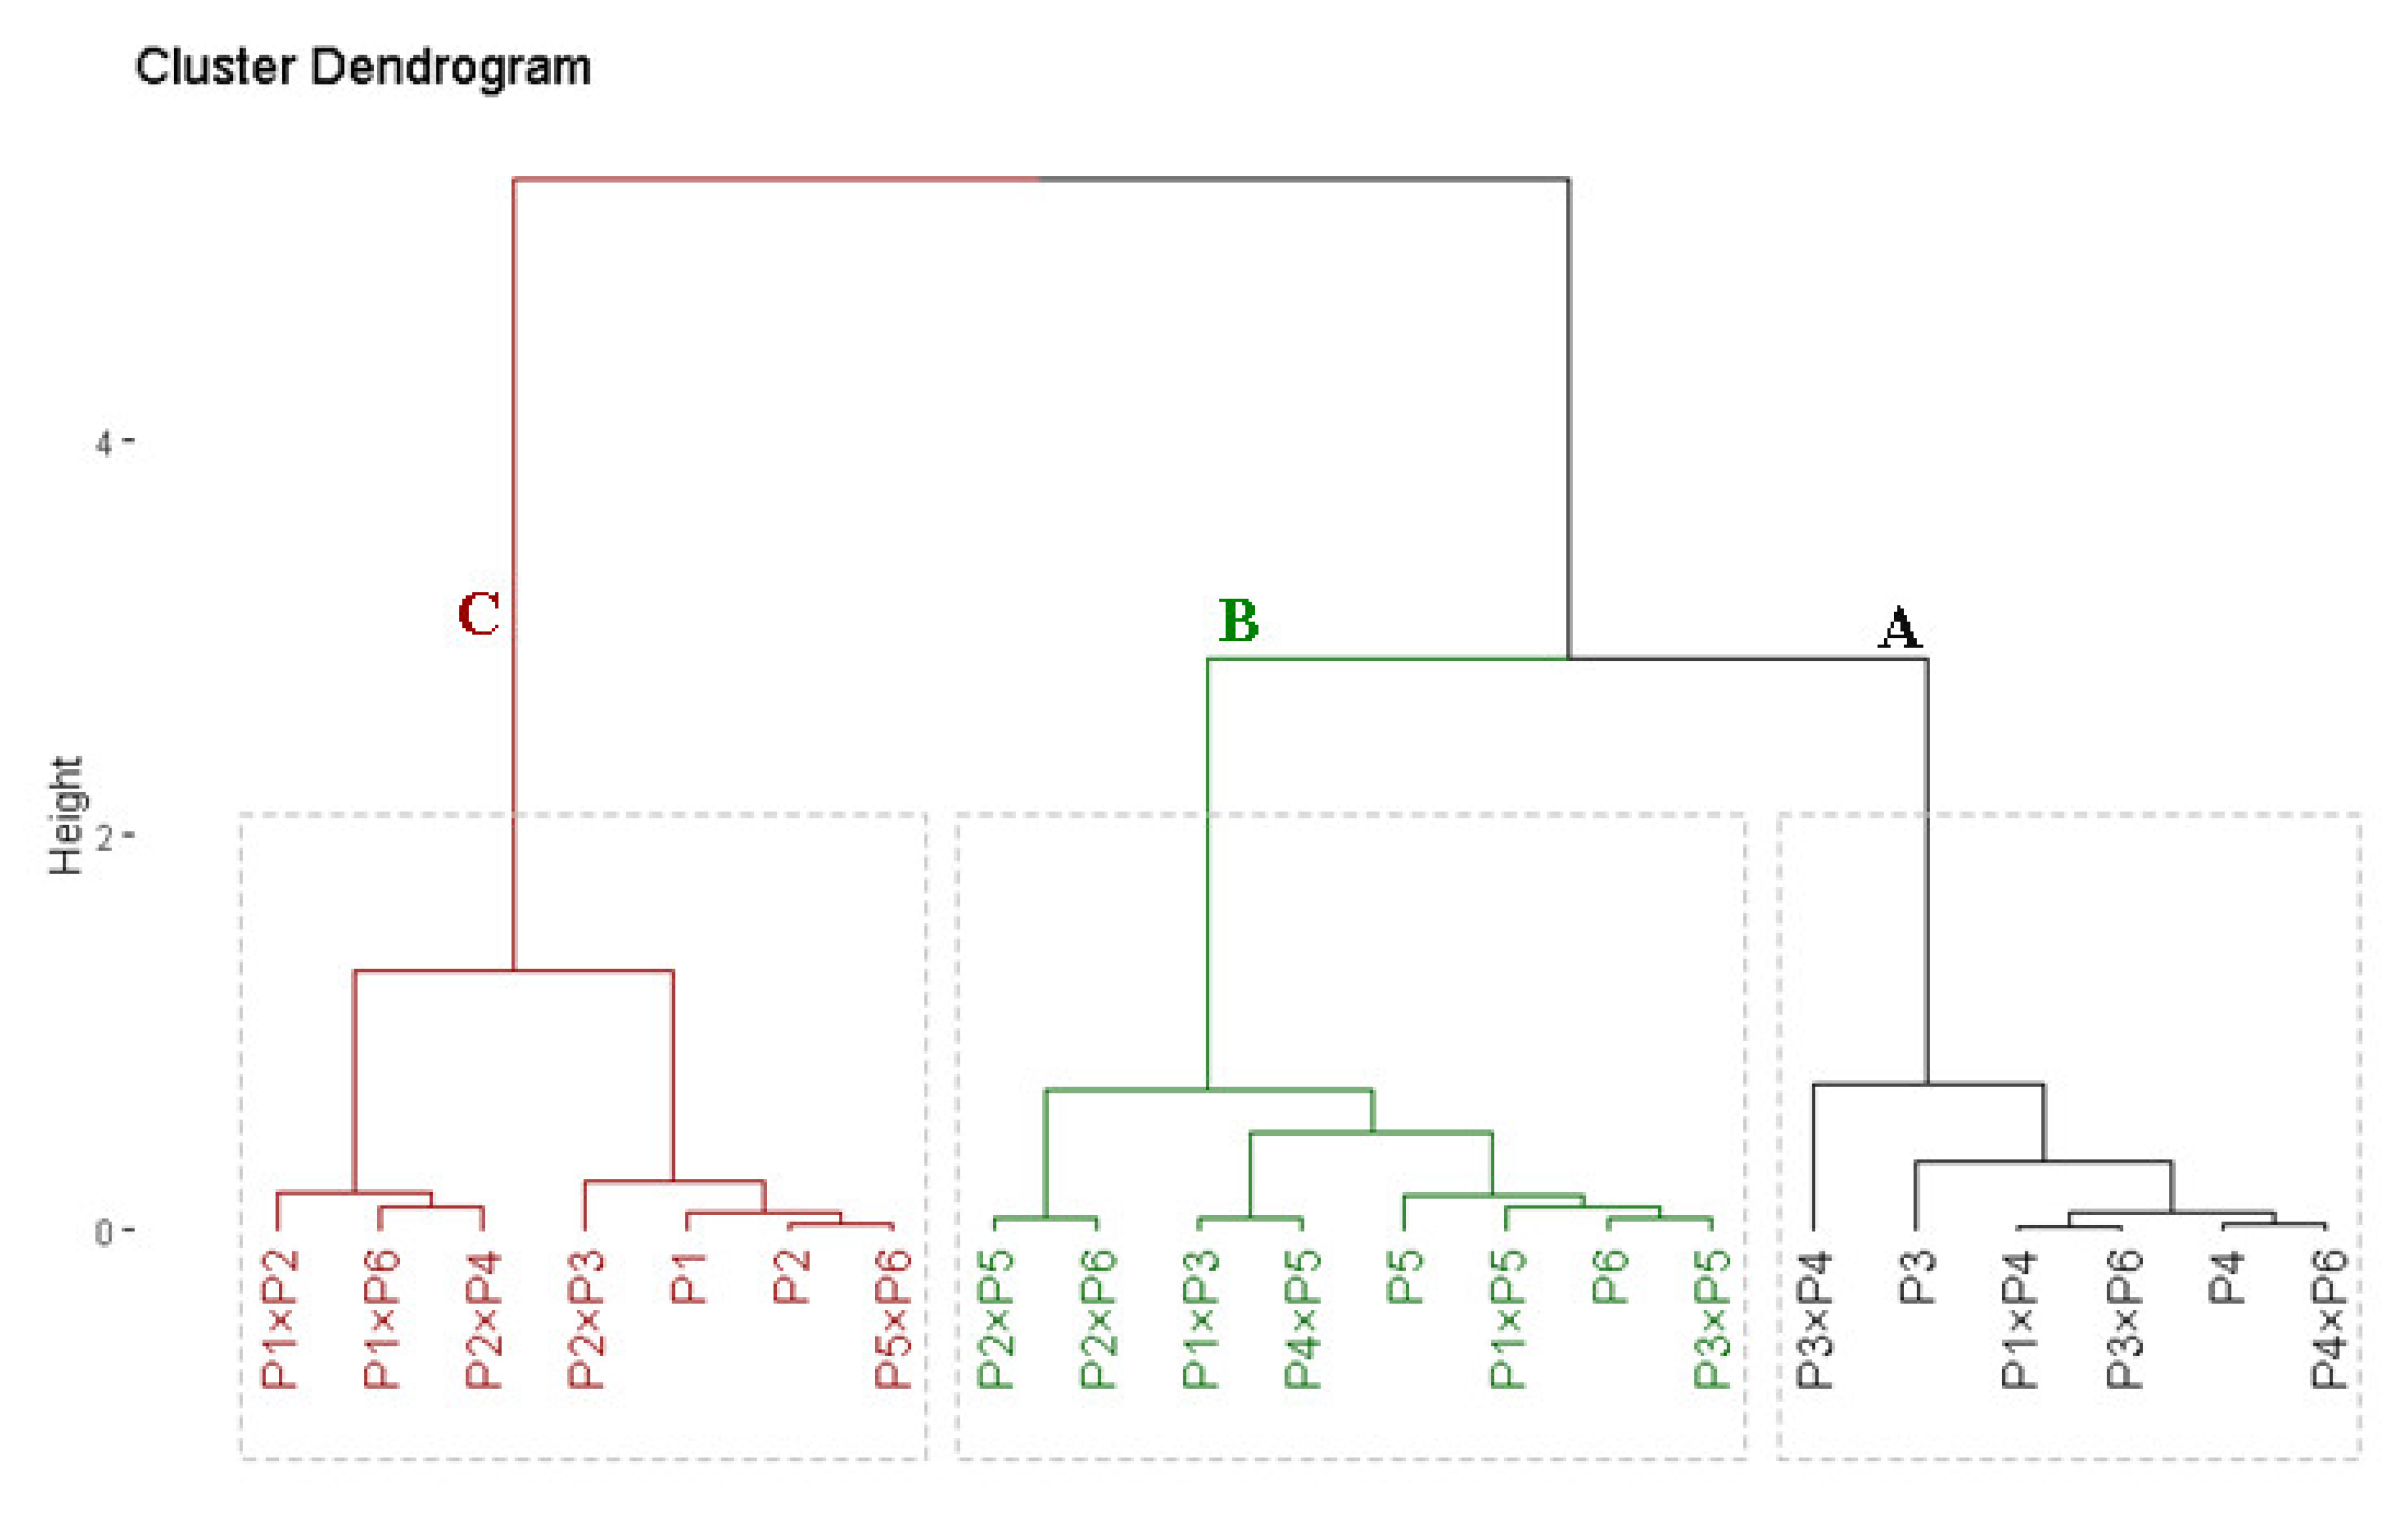
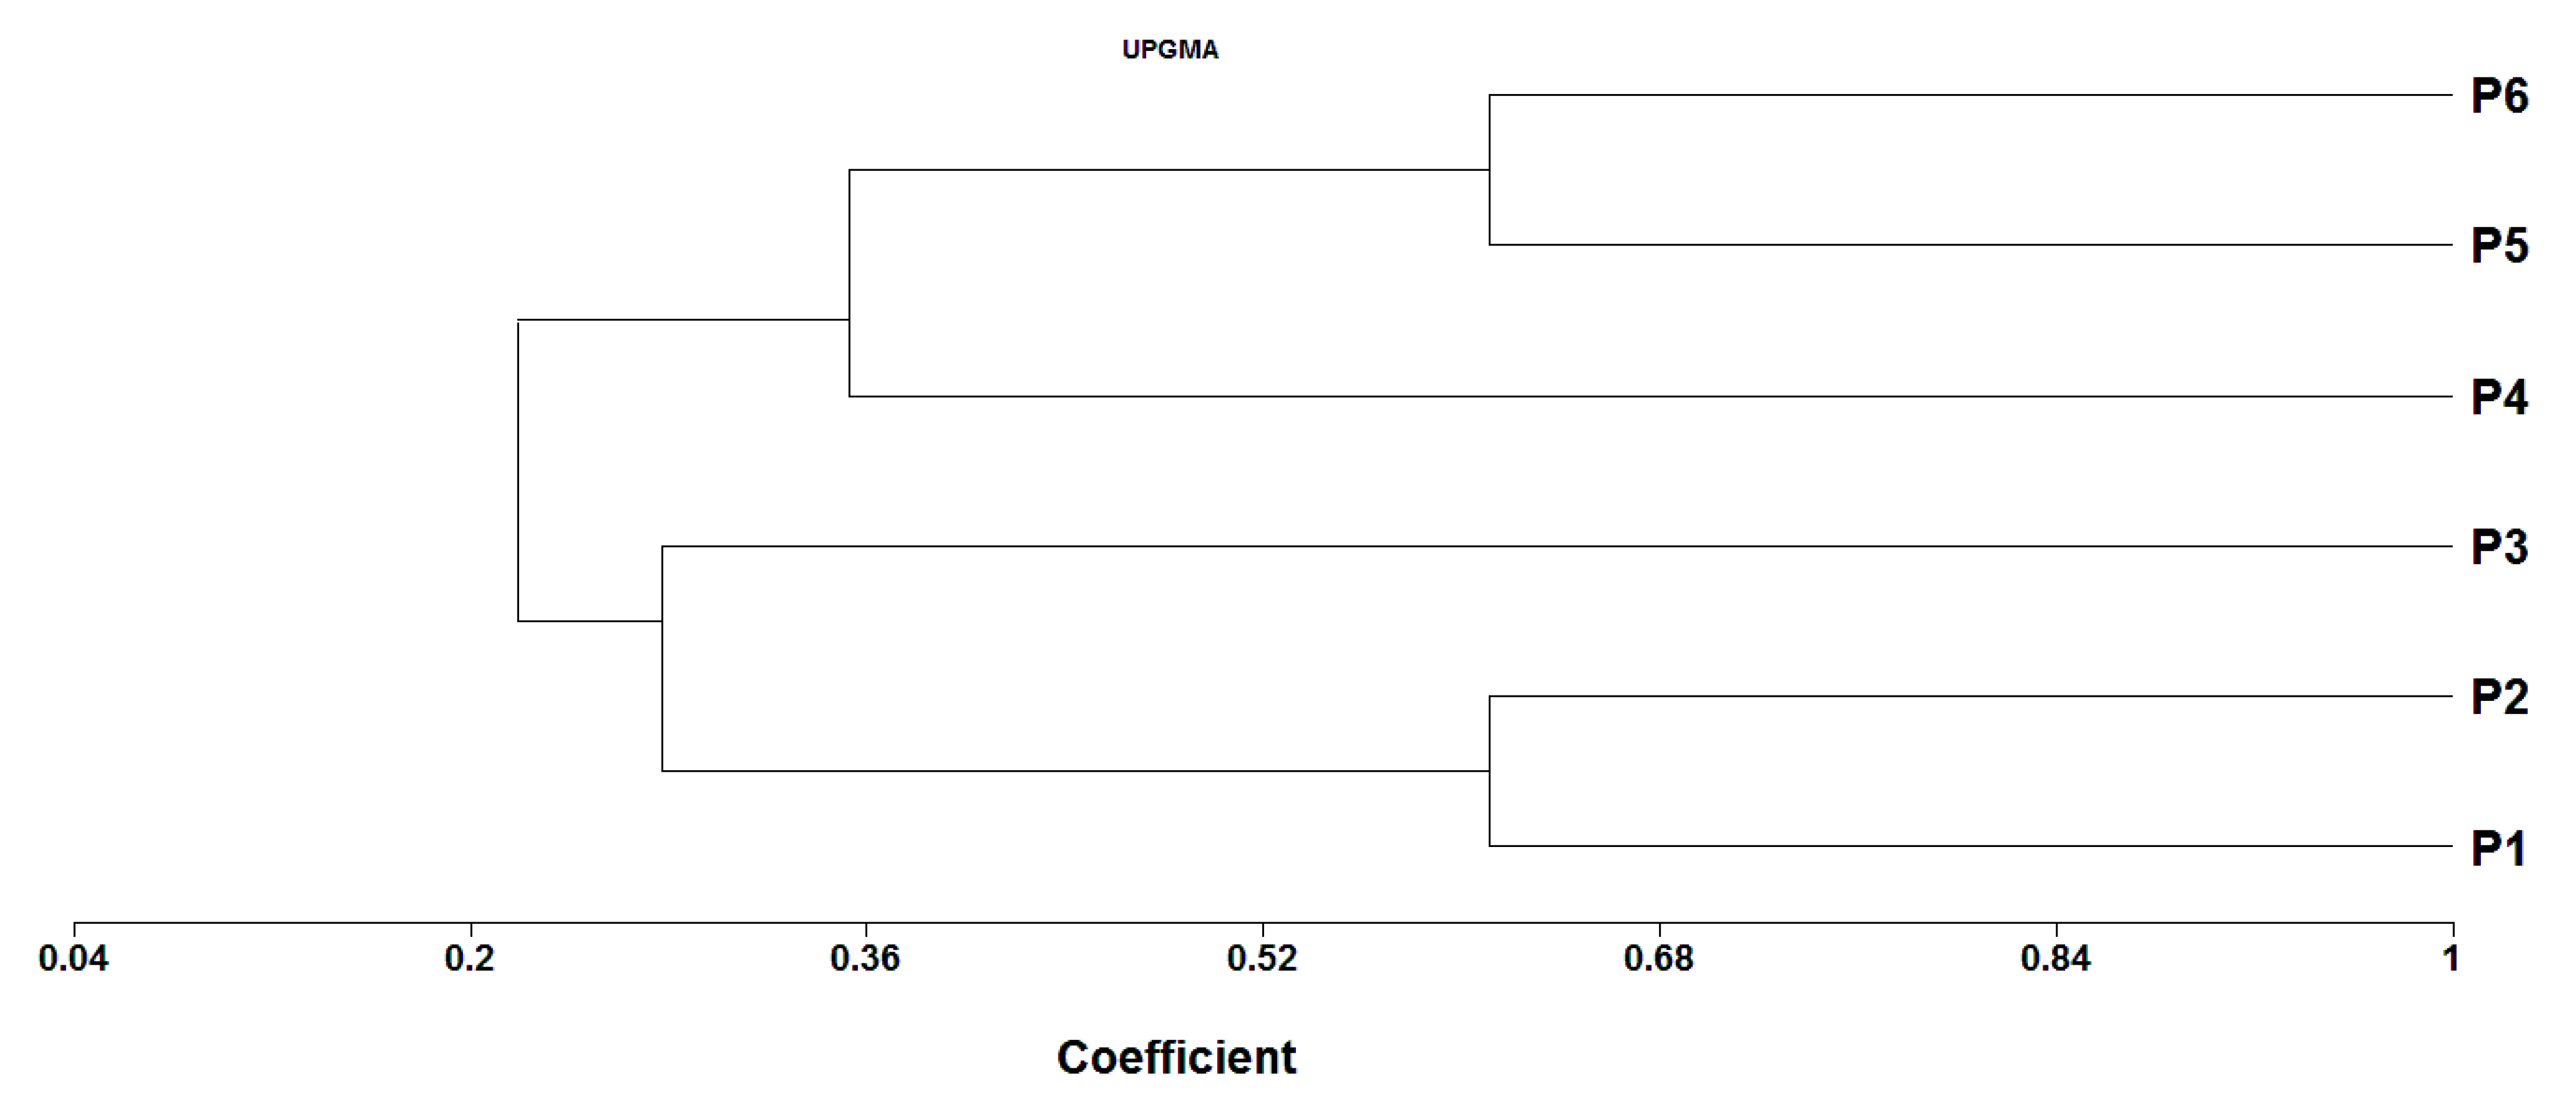
3.8. Genetic Distance (GD) and Cluster Analysis

Genetic distance based on SSR markers varied from 0.38 to 0.89 with an average of 0.70 (Table 7). The smallest genetic distance (0.38) was detected between the two parents P1 and P2, whereas the uppermost genetic distance was observed between P1 and P5 (0.89), followed by P1 and P4 (0.88). The dendrogram constructed based on GD divided the parental genotypes into two major clusters with internal sub-clusters within both groups (Figure 6). Cluster I comprised the three exotic genotypes, which were further separated into two sub-clusters. The first sub-cluster included P5 and P6, while the second sub-cluster had only P4. Cluster II contained the three Egyptian rice cultivars, which could be further separated into two subgroups; the parental genotypes P1 and P2 constituted the first subgroup, while P3 formed the second one.

3.9. Correlation between Parental GD, Hybrid Performance, SCA, and Heterosis

The associations between SSR marker-based GD and F1 hybrid performance were not significant for any of the evaluated traits under either the well-watered or water-deficit conditions (Table 8). Similarly, GD displayed a non-significant association with SCA effects, MP heterosis, and BP heterosis. Conversely, the SCA effects of the assessed crosses exhibited a strong correlation with each of the F1 hybrids’ performance, MP heterosis, and BP heterosis for all the evaluated traits. Moreover, a highly significant association was detected between F1 performance, MP heterosis, and BP heterosis for all the measured traits under both conditions.

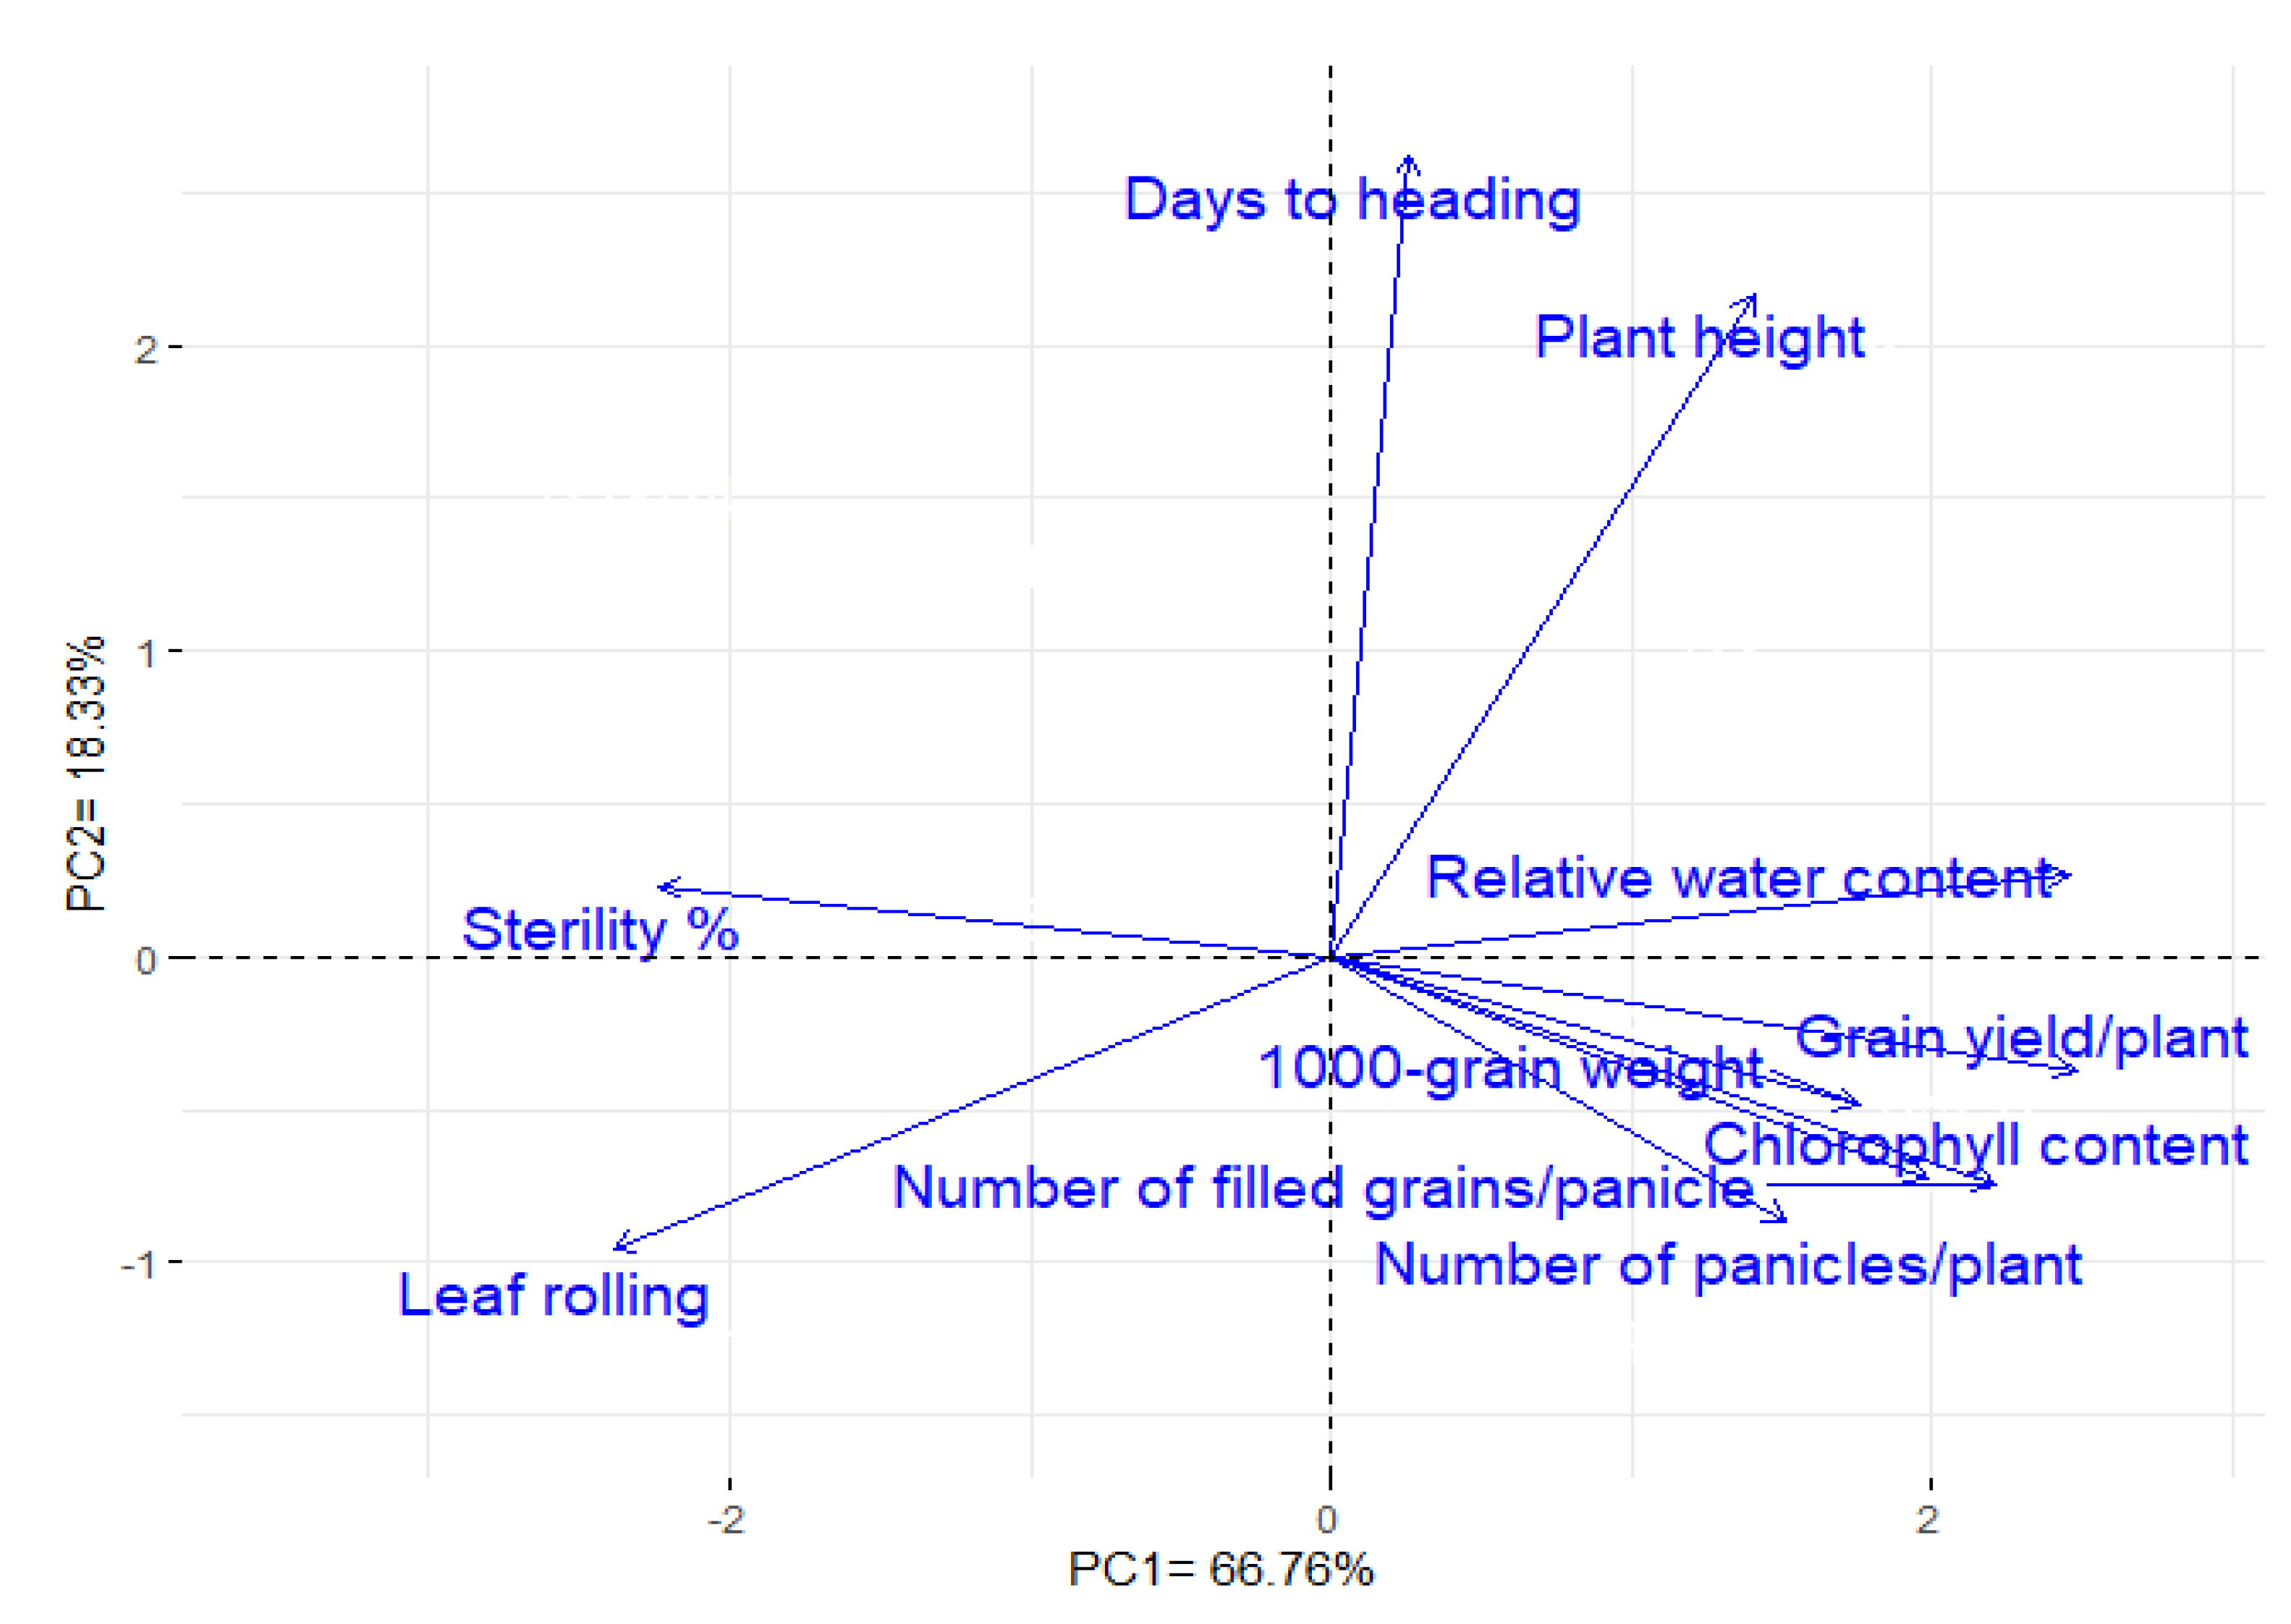
3.10. Interrelationship among the Studied Traits

Principal component analysis was performed to assess the relationship among evaluated traits under water-deficit conditions. The first two PCAs described most of the variability, accounting for 85.09% (66.76% and 18.33% by PCA1 and PCA2, respectively). Accordingly, the two PCAs were employed to perform the PC-biplot (Figure 7). A strong positive relationship was detected between grain yield and each of relative water content, chlorophyll content, number of panicles per plant, number of filled grains per panicle, and 1000-grain weight. Conversely, a negative association was determined between yield traits and both sterility percentage and leaf rolling. Similar results are depicted by the correlation heatmap, as shown in Figure S2.

4. Discussion

Developing high-yielding and drought-tolerant rice genotypes has come to be more imperative to sustain rice production in the face of ongoing population growth and the threats of climate change. The significant genotypic difference detected for all measured traits indicated the presence of adequate genetic variability among the evaluated genotypes. Accordingly, the genetic variations that were discovered could be exploited in establishing a successful rice program for breeding high-yielding and drought-tolerant genotypes. In keeping with these findings, high genetic variations have also been observed for different agronomic traits in rice under well-watered and water-deficit conditions by Venuprasad et al. [49], Monkham et al. [50], Khan et al. [2], and Anusha et al. [17]. The significant difference between tested irrigation regimes resulted in dissimilar impacts on the evaluated genotypes. Moreover, the significant G × I interaction obtained for most of the measured traits revealed differential performances of the genotypes under well-watered and water shortage conditions [51]. Drought is a pivotal environmental stress that detrimentally constraints rice growth and production [52,53]. The obtained results revealed that water deficit caused considerable reductions in all the evaluated characteristics compared to the well-watered condition, except for leaf rolling and the sterility percentage, which significantly increased. These findings are in consonance with prior published reports that confirmed the influence of water limitation on different traits of rice [6,9,11,54]. The obtained results revealed that water-deficit stress induced a reduction in the number of days to heading. Earliness can be considered an escape approach and a resilient adaptation under water-stress conditions [55,56,57]. Moreover, water-deficit stress treatment caused a major decrease in plant height, which may be a result of reduced cell turgor and a constraining of cell division and cell expansion [58,59]. Relative water content (RWC) is a physiological trait that has great importance for evaluating rice genotypes for drought tolerance [60,61]. A drought stress-induced reduction in RWC may be the result of a decline in water uptake from soil to the root system and reduced internal water flow from the root to the leaves [62]. Correspondingly, the decline in chlorophyll content might be due to the destructive impact of the water deficit on photosynthetic enzyme activity and reactive oxygen species accumulation, which affect the chloroplast, resulting in a reduction of carbon assimilation and decreased chlorophyll content, as well as inhibition of the photosynthetic process [63,64]. Yield contributing traits are the eventual products of physiological developments. The notable declines in yield traits under water-deficit stress may be a consequence of a deficiency of absorbed water, along with the inhibition of cell elongation and cell division, delayed cellular growth, and a reduced photosynthetic rate [65,66,67]. Furthermore, water deficit limits assimilate mobilization from leaves and stems to grains, which results in smaller or shriveled grains [68]. Moreover, the reduction in grain number/panicle could be a result of increased pollen inviability [69], spikelet sterility [70], or abortion of immature embryos [49,71].
An efficient breeding program relies on the careful choice of parents. The GCA effects are of crucial importance in selecting potential parents that could be exploited in developing improved populations [16], as parental genotypes with the desired GCA transfer additive genes to their offspring, making them useful for breeding programs [45]. The obtained results revealed that GCA values varied between the well-watered and watered deficit conditions, confirming environmental impacts on GCA effects. The parental genotypes P1, P2, and P3 were recognized as good combiners for earliness and shortened plant height under both conditions. This indicates that these parents could be useful in developing early and dwarf genotypes, which are preferred to escape from terminal drought stress [18]. The parents P1 and P6 were recognized as good combiners for increasing chlorophyll content. Meanwhile, improvements in RWC could be achieved by using the parents P3 and P4, which had steadily positive and significant GCA estimates under stress conditions. The local parental genotype P3 and the two exotic genotypes P4 and P6 could be favorable combiners for grain yield and some of its contributed traits. Consequently, these parents could transfer their promising alleles to progenies and enhance grain yield under water-stress conditions. Previous studies have also emphasized the significance of using exotic and local parents with positive and high GCA effects for boosting grain yield and related agronomic traits under normal and water-deficit conditions [3,17,21,72].
SCA elucidates the deviation of hybrids’ performance from that of the parents utilized, and allows for estimation of non-additive gene effects. Hybrids with significant SCA effects are great choices for the selection of transgressive segregates. SCA effects revealed that all of the developed hybrids displayed significant SCA in a preferable direction for at least one trait. On the basis of these results, the hybrid combinations P1 × P4, P2 × P5, P3 × P4, and P4 × P6 can be considered excellent specific combiners for developing high-yielding hybrids under water-deficit conditions. These hybrids were generated from parents with good × good or good × poor general combiners. These results reveal the role of accumulative impacts of additive × additive interactions of positive alleles [73]. Similarly, El-Mowafi, et al. [3] determined that the existence of at least one good general combiner is crucial for ensuring good specific cross combinations. Evidently, none of the evaluated cross combinations recorded significant SCA estimates for all assessed traits. Nevertheless, the hybrid P3 × P4 was a good specific combiner for CHLC, RWC, NP, NFG, SP, and GYPP under both conditions. Moreover, P4 × P6 combined well for DTH, RWC, NP, NFG, SP, and GYPP under both conditions. Remarkably, the crosses possessed significant and positive SCA effects and better parent heterotic impacts for grain yield and contributing traits. Consequently, desirable segregants could be projected from these cross combinations. Thus, these crosses could be efficiently employed in rice programs to improve these traits under well-watered and drought stress conditions.
The significant GCA and SCA effects for grain yield and other evaluated traits indicate that both additive and non-additive gene actions play integral roles in regulating the inheritance of all the assessed traits. However, the variance due to GCA demonstrated a higher magnitude than SCA for most of the studied traits. This implies a greater role for additive gene effects in regulating the inheritance of these traits, and consequently, the recurrent selection method could be efficacious for improving these traits. The obtained results coincide with those of Suvi et al. [18], Zewdu [74], Gramaje et al. [22], and El-Mowafi et al. [3]. They disclosed that the additive gene effects contribute considerably to the inheritance of grain yield and several related traits in rice. On the contrary, other reports have found that non-additive gene action has a major role in the inheritance of agronomic traits in rice [17,19,75]. The significant GCA × I and SCA × I interactions for grain yield and most of the other studied traits indicate the differential performance of the parental genotypes and hybrids under distinct conditions. This demonstrates the necessity of identifying adapted parents and hybrids in each condition individually [76]. The preponderance of GCA × I interaction over SCA × I for most of the studied traits signifies that the additive genetic effects were more affected by the environment than the non-additive ones.
Applying tolerance indices provides valuable information to support the classification of the genotypes based on their tolerance to abiotic stresses. In the present study, cluster analysis was utilized to differentiate drought-tolerant and drought-sensitive genotypes based on tolerance indices. The analysis grouped the assessed genotypes into three clusters (A–C), varying from tolerant to sensitive genotypes. The genotypes P3, P4, P1 × P4, P3 × P4, P3 × P6, and P4 × P6 were determined to be drought-tolerant (Figure 4). Consequently, these genotypes could be employed in rice breeding programs to improve grain yield under drought stress conditions. Numerous prior studies have employed tolerance indices and cluster analysis to categorize rice genotypes under water-deficit conditions [65,77].
The SSR markers utilized in the current study reflected the degree of genetic diversity among the assessed parental genotypes. The results indicate that the number of alleles per locus varied from 2 to 5 with an average of 3.31 alleles per locus, a finding that is comparable to Khan et al. [2], Pradhan et al. [78], and Singh et al. [79], which determined values of 3, 3.15 and 3.11 allele/locus, respectively. However, Rahman et al. [80], Das et al. [81], and Tabkhkar et al. [65] identified 4.18, 4.91, and 6.21 alleles/locus, respectively. The variation in allele numbers might be ascribed to the genetic architecture of the genotypes and to the SSR utilized. The most frequent allele possessed an average of 0.49 signifying that 49.0% of the evaluated genotypes had a common allele at any of the examined loci. The PIC measures allelic diversity at a locus; it was relatively high (0.55), which demonstrates good preferential power of the applied markers [19]. The mean PIC value detected in the present study was close to those reported by Zhang et al. [82], Salem and Sallam [83], and Verma and Srivastava [19], who detected an average of 0.54, 57, and 0.51, respectively. Furthermore, the markers RM279 and RM20A displayed higher distinguishing power to differentiate genotypes owing to their high PIC values (0.69). These markers could be utilized for upcoming genetic and mapping analyses in rice [2]. The average genetic diversity that existed among parental genotypes was relatively high (0.70), signifying the existence of considerable genetic diversity based on SSR analysis. The lowest genetic distance was observed between the two Egyptian rice cultivars P1 and P2, which are japonica-type and drought-susceptible genotypes. On the other hand, the greatest genetic distance was observed between the local parental cultivar P1, which is drought-susceptible and japonica-type, and the exotic genotype P5, which is an indica type and drought tolerant. Similarly, Chakravarthi and Naravaneni [84] discovered minimal similarity between japonica-type and indica-type lines. On the other hand, Kanawapee et al. [85] determined a moderately high level of similarity between related lines. The microsatellite markers facilitated the grouping of the parental genotypes into two main clusters. Genotypes that share common ancestors were grouped into the same cluster, displaying the efficacy of SSR markers in investigating genetic diversity in rice, as elucidated in previous reports [31,86,87]. The results of the field evaluation indicated that crossing parents from different clusters could result in superior hybrids. Notably, the hybrid P3 × P4 gave higher grain yield under well-watered and drought stress conditions. It was derived from crossing between group 1 (exotic genotypes) and group 2 (local genotypes). This proves there is the potential to attain more efficient hybrids by crossing diverse genotypes from distinct groups. Thus, parental selection using DNA markers could help in developing superior rice hybrids and population improvements [87], a finding with valuable implications for hybrid rice programs. The non-significant correlation recorded between SSR-based GD, hybrid performance, heterosis (mid or better parent) and SCA effects for all the studied traits could be a result of using a relatively small number of markers. Analogous findings were reported by Xiao et al. [26], Hua et al. [35], Gramaje et al. [22], and Zhang et al. [88]. However, Xangsayasane et al. [31] and Singh et al. [33] reported a significant association between GD, heterosis and hybrid performance. Our results also demonstrate that SCA effects were considerably related with hybrid performance and heterotic effects for all of the studied traits under water-stress and well-watered conditions. This indicates that SCA is a key factor in determining heterosis and the performance of the hybrids under water-deficit conditions. These results concur with the findings of Gramaje et al. [22], who reported that SCA estimates could be employed as a good predictor for hybrids’ performance and heterosis.
Information on the interrelationships between grain yield and other characteristics could reinforce the efficacy of breeding programs by allowing the exploitation of suitable traits as selection criteria under stress conditions [89,90,91]. The PC-biplot provides a suitable approach to assess such associations between studied traits [92,93]. Strong positive relationships were identified between grain yield and each of relative water content, chlorophyll content, number of panicles/plant, number of filled grains/panicle, and 1000-grain weight. This indicates their importance as valuable characteristics for indirect selection, particularly in segregated early generations, under drought stress [7,8,94]. In addition, grain yield was adversely associated with sterility percentage and leaf rolling [11,94,95].

5. Conclusions

Noticeable genetic variability was detected among the tested parents and their F1 hybrids for all the studied traits under well-watered and water-deficit conditions. The parental genotypes P3, P4, and P6 were identified as excellent general combiners for developing high-yielding and drought-tolerant rice genotypes. Moreover, the crosses P1 × P4, P2 × P4, P3 × P4, and P4 × P6 were the most favorable combinations for improving grain yield, particularly under water-deficit conditions. These are the best hybrid combinations with the highest better-parent and mid-parent heterosis for grain yield and other agronomic traits. Additive and non-additive gene effects are implicated in regulating the inheritance of all traits, with a prevalence of the additive gene action for most traits. Different plant traits comprising chlorophyll content, relative water content, number of panicles/plant, number of filled grains/panicle, and 1000-grain weight were recognized as indirect selection criteria for breeding drought-tolerant genotypes due to their positive association with grain yield. SSR based-genetic distance failed to predict SCA effects, heterosis, and hybrid performance. However, SCA could be employed in order to predict the heterosis and performance of hybrids under water-stress conditions.

Supplementary Materials

The following are available online at https://www.mdpi.com/article/10.3390/plants11050702/s1, Figure S1: Meteorological data of the experimental site in the two summer seasons of 2020 and 2021; Figure S2: Correlation heatmap of the evaluated traits under water deficit conditions, Table S1: Physical and chemical soil characteristics of the experimental sites during 2020 and 2021 growing seasons; Table S2: List of SSR primers and their sequences used in this study; Table S3: Separate analysis of variance of all the studied traits under each environment; Table S4: General combining ability effects (GCA) of the evaluated parents for all studied traits under each environment; Table S5. Specific combining ability effects (SCA) for the 15 F1 hybrids for studied traits under each environment.

Author Contributions

Conceptualization, R.M.S., M.I.G. and E.M.; methodology, R.M.S., M.I.G., M.R. and E.M.; software, R.M.S., M.I.G., M.R. and E.M.; validation, R.M.S. and E.M.; formal analysis, R.M.S., M.I.G., M.R. and E.M.; investigation, M.I.G., M.R. and E.M.; resources, R.M.S., A.S.A. and M.I.G.; data curation, R.M.S., A.S.A. and E.M.; writing—original draft preparation, R.M.S. and E.M.; writing—review and editing, R.M.S., M.I.G., M.R., A.S.A. and E.M.; visualization, R.M.S. and E.M.; funding acquisition, R.M.S., M.R. and A.S.A. All authors have read and agreed to the published version of the manuscript.

Funding

This research received no external funding.

Data Availability Statement

The data presented in this study are available upon request from the corresponding author.

Acknowledgments

The authors are grateful to all members of the Rice Research and Training Center (RRTC), Field Crops Research Institute, Agricultural Research Center (ARC), Egypt for the support provided during the completion of this research. The researchers would like to thank the Deanship of Scientific Research, Qassim University for funding the publication of this project.

Conflicts of Interest

The authors declare no conflict of interest.

References

  1. Khush, G.S. What it will take to feed 5.0 billion rice consumers in 2030. Plant Mol. Biol. 2005, 59, 1–6. [Google Scholar] [CrossRef] [PubMed]
  2. Khan, F.; Naaz, S.; Singh, N.; Shukla, P.K.; Tripathi, R.; Yadav, H.K.; Shirke, P.A. Molecular, physiological and agronomic assessment of genetic diversity in rice varieties in relation to drought treatment. Curr. Plant Biol. 2022, 29, 100232. [Google Scholar] [CrossRef]
  3. El-Mowafi, H.F.; AlKahtani, M.D.; Abdallah, R.M.; Reda, A.M.; Attia, K.A.; El-Hity, M.A.; El-Dabaawy, H.E.; Husnain, L.A.; Al-Ateeq, T.K.; EL-Esawi, M.A. Combining ability and gene action for yield characteristics in novel aromatic cytoplasmic male sterile hybrid rice under water-stress conditions. Agriculture 2021, 11, 226. [Google Scholar] [CrossRef]
  4. Faostat. Food and Agriculture Organization of the United Nations. Statistical Database. 2022. Available online: http://www.fao.org/faostat/en/#data (accessed on 15 January 2022).
  5. Fageria, N. Yield physiology of rice. J. Plant Nutr. 2007, 30, 843–879. [Google Scholar] [CrossRef]
  6. Hafez, E.M.; Gowayed, S.M.; Nehela, Y.; Sakran, R.M.; Rady, A.; Awadalla, A.; Omara, A.E.-D.; Alowaiesh, B.F. Incorporated biochar-based soil amendment and exogenous glycine betaine foliar application ameliorate rice (Oryza sativa L.) tolerance and resilience to osmotic stress. Plants 2021, 10, 1930. [Google Scholar] [CrossRef]
  7. Gaballah, M.M.; Ghoneim, A.M.; Ghazy, M.I.; Mohammed, H.M.; Sakran, R.M.; Rehman, H.U.; Shamsudin, N.A.A. Root traits responses to irrigation intervals in rice (Oryza sativa). Int. J. Agric. Biol. 2021, 26, 22–30. [Google Scholar] [CrossRef]
  8. Yang, X.; Wang, B.; Chen, L.; Li, P.; Cao, C. The different influences of drought stress at the flowering stage on rice physiological traits, grain yield, and quality. Sci. Rep. 2019, 9, 3742. [Google Scholar] [CrossRef] [Green Version]
  9. Manickavelu, A.; Nadarajan, N.; Ganesh, S.; Gnanamalar, R.; Babu, R.C. Drought tolerance in rice: Morphological and molecular genetic consideration. Plant Growth Regul. 2006, 50, 121–138. [Google Scholar] [CrossRef]
  10. Mehana, M.; Abdelrahman, M.; Emadeldin, Y.; Rohila, J.S.; Karthikeyan, R. Impact of genetic improvements of rice on its water use and effects of climate variability in Egypt. Agriculture 2021, 11, 865. [Google Scholar] [CrossRef]
  11. Ghazy, M.I.; Salem, K.F.; Sallam, A. Utilization of genetic diversity and marker-trait to improve drought tolerance in rice (Oryza sativa L.). Mol. Biol. Rep. 2021, 48, 157–170. [Google Scholar] [CrossRef]
  12. Gracia, M.; Mansour, E.; Casas, A.; Lasa, J.; Medina, B.; Cano, J.L.M.; Moralejo, M.; López, A.; Fuster, P.L.; Escribano, J. Progress in the Spanish national barley breeding program. Span. J. Agric. Res. 2012, 10, 741–751. [Google Scholar] [CrossRef] [Green Version]
  13. Salem, T.; Rabie, H.; Mowafy, S.; Eissa, A.; Mansour, E. Combining ability and genetic components of egyptian cotton for earliness, yield, and fiber quality traits. SABRAO J. Breed. Genet. 2020, 52, 369–389. [Google Scholar]
  14. Kamara, M.M.; Ghazy, N.A.; Mansour, E.; Elsharkawy, M.M.; Kheir, A.; Ibrahim, K.M. Molecular genetic diversity and line× tester analysis for resistance to late wilt disease and grain yield in maize. Agronomy 2021, 11, 898. [Google Scholar] [CrossRef]
  15. Kamara, M.M.; Ibrahim, K.M.; Mansour, E.; Kheir, A.; Germoush, M.O.; El-Moneim, A.; Motawei, M.I.; Alhusays, A.Y.; Farid, M.A.; Rehan, M. Combining ability and gene action controlling grain yield and its related traits in bread wheat under heat stress and normal conditions. Agronomy 2021, 11, 1450. [Google Scholar] [CrossRef]
  16. Griffing, B. Concept of general and specific combining ability in relation to diallel crossing systems. Aust. J. Biol. Sci. 1956, 9, 463–493. [Google Scholar] [CrossRef]
  17. Anusha, G.; Rao, D.S.; Jaldhani, V.; Beulah, P.; Neeraja, C.; Gireesh, C.; Anantha, M.; Suneetha, K.; Santhosha, R.; Prasad, A.H. Grain Fe and Zn content, heterosis, combining ability and its association with grain yield in irrigated and aerobic rice. Sci. Rep. 2021, 11, 10579. [Google Scholar] [CrossRef] [PubMed]
  18. Suvi, W.T.; Shimelis, H.; Laing, M.; Mathew, I.; Shayanowako, A.I. Determining the combining ability and gene action for rice yellow mottle virus disease resistance and agronomic traits in rice (Oryza sativa L.). Agronomy 2021, 11, 12. [Google Scholar] [CrossRef]
  19. Verma, O.; Srivastava, H. Genetic component and combining ability analyses in relation to heterosis for yield and associated traits using three diverse rice-growing ecosystems. Field Crops Res. 2004, 88, 91–102. [Google Scholar] [CrossRef]
  20. Mackill, D.; Coffman, W.; Rutger, J. Pollen shedding and combining ability for high temperature tolerance in rice. Crop Sci. 1982, 22, 730–733. [Google Scholar] [CrossRef]
  21. Sakran, R.; El Shamey, E.; Anis, G. Diallel analysis of different rice genotypes under water deficiency conditions and assessing genetic diversity using ssr markers. J. Plant Prod. Sci. 2020, 11, 1319–1332. [Google Scholar] [CrossRef]
  22. Gramaje, L.V.; Caguiat, J.D.; Enriquez, J.O.S.; dela Cruz, Q.D.; Millas, R.A.; Carampatana, J.E.; Tabanao, D.A.A. Heterosis and combining ability analysis in CMS hybrid rice. Euphytica 2020, 216, 14. [Google Scholar] [CrossRef]
  23. Abaza, G.M.S.M.; Awaad, H.A.; Attia, Z.M.; Abdel-lateif, K.S.; Gomaa, M.A.; Abaza, S.M.S.M.; Mansour, E. Inducing potential mutants in bread wheat using different doses of certain physical and chemical mutagens. Plant Breed. Biotechnol. 2020, 8, 252–264. [Google Scholar] [CrossRef]
  24. Gharib, M.; Qabil, N.; Salem, A.; Ali, M.; Awaad, H.; Mansour, E. Characterization of wheat landraces and commercial cultivars based on morpho-phenological and agronomic traits. Cereal Res. Commun. 2021, 49, 149–159. [Google Scholar] [CrossRef]
  25. Palanga, K.K.; Traore, K.; Bimpong, K.; Jamshed, M.; Mkulama, M.A. Genetic diversity studies on selected rice varieties grown in Africa based on aroma, cooking and eating quality. Afr. J. Biotechnol. 2016, 15, 1136–1146. [Google Scholar]
  26. Xiao, J.; Li, J.; Yuan, L.; McCouch, S.; Tanksley, S. Genetic diversity and its relationship to hybrid performance and heterosis in rice as revealed by PCR-based markers. Theor. Appl. Genet. 1996, 92, 637–643. [Google Scholar] [CrossRef] [PubMed]
  27. Thomson, M.J.; Septiningsih, E.M.; Suwardjo, F.; Santoso, T.J.; Silitonga, T.S.; McCouch, S.R. Genetic diversity analysis of traditional and improved Indonesian rice (Oryza sativa L.) germplasm using microsatellite markers. Theor. Appl. Genet. 2007, 114, 559–568. [Google Scholar] [CrossRef] [PubMed]
  28. Singh, A.; Sengar, R. DNA fingerprinting based decoding of indica rice (Oryza sativa L.) via molecular marker (SSR, ISSR, & RAPD) in aerobic condition. Adv. Crop Sci. Technol. 2015, 3, 167. [Google Scholar]
  29. Igartua, E.; Mansour, E.; Cantalapiedra, C.P.; Contreras-Moreira, B.; Gracia, M.P.; Fuster, P.; Escribano, J.; Molina-Cano, J.L.; Moralejo, M.; Thomas, W.T. Selection footprints in barley breeding lines detected by combining genotyping-by-sequencing with reference genome information. Mol. Breed. 2015, 35, 11. [Google Scholar] [CrossRef] [Green Version]
  30. Powell, W.; Morgante, M.; Andre, C.; Hanafey, M.; Vogel, J.; Tingey, S.; Rafalski, A. The comparison of RFLP, RAPD, AFLP and SSR (microsatellite) markers for germplasm analysis. Mol. Breed. 1996, 2, 225–238. [Google Scholar] [CrossRef]
  31. Xangsayasane, P.; Xie, F.; Hernandez, J.E.; Boirromeo, T.H. Hybrid rice heterosis and genetic diversity of IRRI and Lao rice. Field Crops Res. 2010, 117, 18–23. [Google Scholar] [CrossRef]
  32. Jaikishan, I.; Rajendrakumar, P.; Ramesha, M.; Viraktamath, B.; Balachandran, S.; Neeraja, C.; Sujatha, K.; Srinivasa Rao, K.; Natarajkumar, P.; Hari, Y. Prediction of heterosis for grain yield in rice using ‘key’informative EST-SSR markers. Plant Breed. 2010, 129, 108–111. [Google Scholar] [CrossRef]
  33. Singh, V.K.; Upadhyay, P.; Sinha, P.; Mall, A.K.; Ellur, R.K.; Singh, A.; Jaiswal, S.K.; Biradar, S.; Ramakrishna, S.; Sundaram, R. Prediction of hybrid performance based on the genetic distance of parental lines in two-line rice (Oryza sativa L.) hybrids. J. Crop Sci. Biotechnol. 2011, 14, 1. [Google Scholar] [CrossRef]
  34. Yingheng, W.; Qiuhua, C.A.I.; Hongguang, X.; Fangxi, W.; Ling, L.; Wei, H.; Jianfu, Z. Determination of heterotic groups and heterosis analysis of yield performance in indica rice. Rice Sci. 2018, 25, 261–269. [Google Scholar] [CrossRef]
  35. Hua, J.; Xing, Y.; Xu, C.; Sun, X.; Yu, S.; Zhang, Q. Genetic dissection of an elite rice hybrid revealed that heterozygotes are not always advantageous for performance. Genetics 2002, 162, 1885–1895. [Google Scholar] [CrossRef] [PubMed]
  36. Jodon, N. Experiments on artificial hybridization of rice. Agron. J. 1938, 30, 294–305. [Google Scholar] [CrossRef]
  37. Butany, W. Mass emasculation in rice. Intern. Rice Com. Newsl. 1961, 9, 9–13. [Google Scholar]
  38. De Datta, S.; Malabuyoc, J.; Aragon, E. A field screening technique for evaluating rice germplasm for drought tolerance during the vegetative stage. Field Crops Res. 1988, 19, 123–134. [Google Scholar] [CrossRef]
  39. Barrs, H.; Weatherley, P. A re-examination of the relative turgidity technique for estimating water deficits in leaves. Aust. J. Biol. Sci. 1962, 15, 413–428. [Google Scholar] [CrossRef] [Green Version]
  40. Doyle, J. DNA protocols for plants Molecular techniques in taxonomy. NATO ASI Ser. 1991, 57, 283–293. [Google Scholar]
  41. Vikram, P.; Swamy, B.; Dixit, S.; Ahmed, H.U.; Teresa Sta Cruz, M.; Singh, A.K.; Kumar, A. qDTY 1.1, a major QTL for rice grain yield under reproductive-stage drought stress with a consistent effect in multiple elite genetic backgrounds. BMC Genet. 2011, 12, 89. [Google Scholar] [CrossRef] [Green Version]
  42. Qu, Y.; Mu, P.; Zhang, H.; Chen, C.Y.; Gao, Y.; Tian, Y.; Wen, F.; Li, Z. Mapping QTLs of root morphological traits at different growth stages in rice. Genetica 2008, 133, 187–200. [Google Scholar] [CrossRef] [PubMed]
  43. Venuprasad, R.; Bool, M.; Quiatchon, L.; Sta Cruz, M.; Amante, M.; Atlin, G. A large-effect QTL for rice grain yield under upland drought stress on chromosome. Mol. Breed. 2012, 30, 535–547. [Google Scholar] [CrossRef]
  44. Ramadan, E.; Elmoghazy, A.; El-Mowafi, H. Molecular markers based genetic diversity analysis for drought tolerance in rice (Oryza Sativa, L.) Using SSR Markers. Int. J. Sci. Res. Agric. Sci. 2015, 2, 1. [Google Scholar]
  45. Rosielle, A.; Hamblin, J. Theoretical aspects of selection for yield in stress and non-stress environment. Crop Sci. 1981, 21, 943–946. [Google Scholar] [CrossRef]
  46. Fernandez, G.C. Effective selection criteria for assessing plant stress tolerance. In Proceedings of the International Symposium on Adaptation of Vegetables and Other Food Crops in Temperature and Water Stress, Shanhua, Taiwan, 13–16 August 1992; pp. 257–270. [Google Scholar]
  47. Gavuzzi, P.; Rizza, F.; Palumbo, M.; Campanile, R.; Ricciardi, G.; Borghi, B. Evaluation of field and laboratory predictors of drought and heat tolerance in winter cereals. Can. J. Plant Sci. 1997, 77, 523–531. [Google Scholar] [CrossRef]
  48. Ward, J.H., Jr. Hierarchical grouping to optimize an objective function. J. Am. Stat. Assoc. 1963, 58, 236–244. [Google Scholar] [CrossRef]
  49. Venuprasad, R.; Lafitte, H.R.; Atlin, G.N. Response to direct selection for grain yield under drought stress in rice. Crop Sci. 2007, 47, 285–293. [Google Scholar] [CrossRef]
  50. Monkham, T.; Jongdee, B.; Pantuwan, G.; Sanitchon, J.; Mitchell, J.; Fukai, S. Genotypic variation in grain yield and flowering pattern in terminal and intermittent drought screening methods in rainfed lowland rice. Field Crops Res. 2015, 175, 26–36. [Google Scholar] [CrossRef]
  51. Mansour, E.; Mahgoub, H.A.; Mahgoub, S.A.; El-Sobky, E.-S.E.; Abdul-Hamid, M.I.; Kamara, M.M.; AbuQamar, S.F.; El-Tarabily, K.A.; Desoky, E.-S.M. Enhancement of drought tolerance in diverse Vicia faba cultivars by inoculation with plant growth-promoting rhizobacteria under newly reclaimed soil conditions. Sci. Rep. 2021, 11, 24142. [Google Scholar] [CrossRef]
  52. El-Sanatawy, A.M.; El-Kholy, A.S.; Ali, M.; Awad, M.F.; Mansour, E. Maize seedling establishment, grain yield and crop water productivity response to seed priming and irrigation management in a mediterranean arid environment. Agronomy 2021, 11, 756. [Google Scholar] [CrossRef]
  53. Desoky, E.-S.M.; Mansour, E.; El-Sobky, E.-S.E.; Abdul-Hamid, M.I.; Taha, T.F.; Elakkad, H.A.; Arnaout, S.M.; Eid, R.S.; El-Tarabily, K.A.; Yasin, M.A. Physio-biochemical and agronomic responses of faba beans to exogenously applied nano-silicon under drought stress conditions. Front. Plant Sci. 2021, 12, 637783. [Google Scholar] [CrossRef] [PubMed]
  54. Gaballah, M.M.; Metwally, A.M.; Skalicky, M.; Hassan, M.M.; Brestic, M.; El Sabagh, A.; Fayed, A.M. Genetic diversity of selected rice genotypes under water stress conditions. Plants 2021, 10, 27. [Google Scholar] [CrossRef]
  55. Sellammal, R.; Robin, S.; Raveendran, M. Association and heritability studies for drought resistance under varied moisture stress regimes in backcross inbred population of rice. Rice Sci. 2014, 21, 150–161. [Google Scholar] [CrossRef]
  56. Mansour, E.; Desoky, E.-S.M.; Ali, M.M.; Abdul-Hamid, M.I.; Ullah, H.; Attia, A.; Datta, A. Identifying drought-tolerant genotypes of faba bean and their agro-physiological responses to different water regimes in an arid Mediterranean environment. Agric. Water Manag. 2021, 247, 106754. [Google Scholar] [CrossRef]
  57. Ali, M.M.; Mansour, E.; Awaad, H.A. Drought tolerance in some field crops: State of the art review. In Mitigating Environmental Stresses for Agricultural Sustainability in Egypt; Springer: Berlin/Heidelberg, Germany, 2021; pp. 17–62. [Google Scholar]
  58. Kamarudin, Z.S.; Yusop, M.R.; Tengku Muda Mohamed, M.; Ismail, M.R.; Harun, A.R. Growth performance and antioxidant enzyme activities of advanced mutant rice genotypes under drought stress condition. Agronomy 2018, 8, 279. [Google Scholar] [CrossRef] [Green Version]
  59. Desoky, E.-S.M.; Mansour, E.; Ali, M.M.A.; Yasin, M.A.T.; Abdul-Hamid, M.I.E.; Rady, M.M.; Ali, E.F. Exogenously used 24-epibrassinolide promotes drought tolerance in maize hybrids by improving plant and water productivity in an arid environment. Plants 2021, 10, 354. [Google Scholar] [CrossRef]
  60. Shivakrishna, P.; Reddy, K.A.; Rao, D.M. Effect of PEG-6000 imposed drought stress on RNA content, relative water content (RWC), and chlorophyll content in peanut leaves and roots. Saudi J. Biol. Sci. 2018, 25, 285–289. [Google Scholar]
  61. Nahar, S.; Sahoo, L.; Tanti, B. Screening of drought tolerant rice through morpho-physiological and biochemical approaches. Biocatal. Agric. Biotechnol. 2018, 15, 150–159. [Google Scholar] [CrossRef]
  62. Desoky, E.-S.M.; Elrys, A.S.; Mansour, E.; Eid, R.S.; Selem, E.; Rady, M.M.; Ali, E.F.; Mersal, G.A.; Semida, W.M. Application of biostimulants promotes growth and productivity by fortifying the antioxidant machinery and suppressing oxidative stress in faba bean under various abiotic stresses. Sci. Hortic. 2021, 288, 110340. [Google Scholar] [CrossRef]
  63. Naroui Rad, M.R.; Kadir, M.A.; Yusop, M.R. Genetic behaviour for plant capacity to produce chlorophyll in wheat (Triticum aestivum) under drought stress. Aust. J. Crop Sci. 2012, 6, 415–420. [Google Scholar]
  64. Desoky, E.-S.M.; Merwad, A.-R.; Abo El-Maati, M.F.; Mansour, E.; Arnaout, S.M.; Awad, M.F.; Ramadan, M.F.; Ibrahim, S.A. Physiological and biochemical mechanisms of exogenously applied selenium for alleviating destructive impacts induced by salinity stress in bread wheat. Agronomy 2021, 11, 926. [Google Scholar] [CrossRef]
  65. Tabkhkar, N.; Rabiei, B.; Lahiji, H.S.; Chaleshtori, M.H. Genetic variation and association analysis of the SSR markers linked to the major drought-yield QTLs of rice. Biochem. Genet. 2018, 56, 356–374. [Google Scholar] [CrossRef]
  66. Kumar, S.; Dwivedi, S.K.; Basu, S.; Kumar, G.; Mishra, J.; Koley, T.K.; Rao, K.; Choudhary, A.; Mondal, S.; Kumar, S. Anatomical, agro-morphological and physiological changes in rice under cumulative and stage specific drought conditions prevailed in eastern region of India. Field Crops Res. 2020, 245, 107658. [Google Scholar] [CrossRef]
  67. Desoky, E.-S.M.; Mansour, E.; Yasin, M.A.; El Sobky, E.-S.E.; Rady, M.M. Improvement of drought tolerance in five different cultivars of Vicia faba with foliar application of ascorbic acid or silicon. Span. J. Agric. Res. 2020, 18, 16. [Google Scholar] [CrossRef]
  68. Elshayb, O.M.; Nada, A.M.; Ibrahim, H.M.; Amin, H.E.; Atta, A.M. Application of silica nanoparticles for improving growth, yield, and enzymatic antioxidant for the hybrid rice EHR1 growing under water regime Conditions. Materials 2021, 14, 1150. [Google Scholar] [CrossRef]
  69. Liu, J.; Liao, D.; Oane, R.; Estenor, L.; Yang, X.; Li, Z.; Bennett, J. Genetic variation in the sensitivity of anther dehiscence to drought stress in rice. Field Crops Res. 2006, 97, 87–100. [Google Scholar] [CrossRef]
  70. Mukamuhirwa, A.; Persson Hovmalm, H.; Bolinsson, H.; Ortiz, R.; Nyamangyoku, O.; Johansson, E. Concurrent drought and temperature stress in rice a possible result of the predicted climate change: Effects on yield attributes, eating characteristics, and health promoting compounds. Int. J. Environ. Res. 2019, 16, 1043. [Google Scholar] [CrossRef] [Green Version]
  71. O’Toole, J.; Moya, T. Water deficits and yield in upland rice. Field Crops Res. 1981, 4, 247–259. [Google Scholar] [CrossRef]
  72. Muthuramu, S.; Jebaraj, S.; Ushakumari, R.; Gnanasekaran, M. Estimation of combining ability and heterosis for drought tolerance in different locations in rice (Oryza sativa L.). Electron. J. Plant Breed. 2010, 1, 1279–1285. [Google Scholar]
  73. Fasahat, P.; Rajabi, A.; Rad, J.M.; Derera, J. Principles and utilization of combining ability in plant breeding. Biom. Biostat. Int. J. 2016, 4, 1–24. [Google Scholar] [CrossRef]
  74. Zewdu, Z. Combining ability analysis of yield and yield components in selected rice (Oryza sativa L.) genotypes. Cogent Food agric. 2020, 6, 1811594. [Google Scholar] [CrossRef]
  75. Bassuony, N.N.; Zsembeli, J. Inheritance of some flag leaf and yield characteristics by half-diallel analysis in rice crops (Oryza Sativa, L.). Cereal Res. Commun. 2021, 49, 503–510. [Google Scholar] [CrossRef]
  76. Sharifi, P.; Dehghani, H.; Moumeni, A.; Moghaddam, M. Genetic main effect and genotype× environment interaction for cooking quality traits in a diallel set of Indica rice (Oryza sativa L.) varieties. Crop Pasture Sci. 2010, 61, 475–482. [Google Scholar] [CrossRef]
  77. Mau, Y.S.; Ndiwa, A.S.; Oematan, S.S.; Markus, J.E. Drought tolerance indices for selection of drought tolerant, high yielding upland rice genotypes. Aust. J. Crop Sci. 2019, 13, 170–178. [Google Scholar] [CrossRef]
  78. Pradhan, S.K.; Barik, S.R.; Sahoo, A.; Mohapatra, S.; Nayak, D.K.; Mahender, A.; Meher, J.; Anandan, A.; Pandit, E. Population structure, genetic diversity and molecular marker-trait association analysis for high temperature stress tolerance in rice. PLoS ONE 2016, 11, e0160027. [Google Scholar] [CrossRef] [Green Version]
  79. Singh, N.; Choudhury, D.R.; Tiwari, G.; Singh, A.K.; Kumar, S.; Srinivasan, K.; Tyagi, R.; Sharma, A.; Singh, N.; Singh, R. Genetic diversity trend in Indian rice varieties: An analysis using SSR markers. BMC Genet. 2016, 17, 127. [Google Scholar] [CrossRef] [Green Version]
  80. Rahman, M.M.; Rasaul, M.; Hossain, M.; Iftekharuddaula, K.; Hasegawa, H. Molecular characterization and genetic diversity analysis of rice (Oryza sativa L.) using SSR markers. J. Crop Improv. 2012, 26, 244–257. [Google Scholar] [CrossRef]
  81. Das, B.; Sengupta, S.; Parida, S.K.; Roy, B.; Ghosh, M.; Prasad, M.; Ghose, T.K. Genetic diversity and population structure of rice landraces from Eastern and North Eastern States of India. BMC Genet. 2013, 14, 71. [Google Scholar] [CrossRef] [Green Version]
  82. Zhang, P.; Li, J.; Li, X.; Liu, X.; Zhao, X.; Lu, Y. Population structure and genetic diversity in a rice core collection (Oryza sativa L.) investigated with SSR markers. PLoS ONE 2011, 6, e27565. [Google Scholar] [CrossRef] [Green Version]
  83. Salem, K.F.; Sallam, A. Analysis of population structure and genetic diversity of Egyptian and exotic rice (Oryza sativa L.) genotypes. Comptes Rendus Biol. 2016, 339, 1–9. [Google Scholar] [CrossRef]
  84. Chakravarthi, B.K.; Naravaneni, R. SSR marker based DNA fingerprinting and diversity study in rice (Oryza sativa. L). Afr. J. Biotechnol. 2006, 5, 684–688. [Google Scholar]
  85. Kanawapee, N.; Sanitchon, J.; Srihaban, P.; Theerakulpisut, P. Genetic diversity analysis of rice cultivars (Oryza sativa L.) differing in salinity tolerance based on RAPD and SSR markers. Electron. J. Biotechnol. 2011, 14, 2. [Google Scholar]
  86. Mukherjee, M.; Padhy, B.; Srinivasan, B.; Mahadani, P.; Baksh, S.Y.; Donde, R.; Singh, O.N.; Behera, L.; Swain, P.; Dash, S.K. Revealing genetic relationship and prospecting of novel donors among upland rice genotypes using qDTY-linked SSR markers. Rice Sci. 2018, 25, 308–319. [Google Scholar] [CrossRef]
  87. Sreewongchai, T.; Sripichitt, P.; Matthayatthaworn, W. Parental genetic distance and combining ability analyses in relation to heterosis in various rice origins. J. Crop Sci. Biotechnol. 2021, 24, 327–336. [Google Scholar] [CrossRef]
  88. Zhang, Q.; Zhou, Z.; Yang, G.; Xu, C.; Liu, K.; Maroof, M.S. Molecular marker heterozygosity and hybrid performance in indica and japonica rice. Theor. Appl. Genet. 1996, 93, 1218–1224. [Google Scholar] [CrossRef]
  89. Habibullah, M.; Sarkar, S.; Islam, M.M.; Ahmed, K.U.; Rahman, M.; Awad, M.F.; ElSayed, A.I.; Mansour, E.; Hossain, M. Assessing the response of diverse sesame genotypes to waterlogging durations at different plant growth stages. Plants 2021, 10, 2294. [Google Scholar] [CrossRef]
  90. Mansour, E.; Moustafa, E.S.; Abdul-Hamid, M.I.; Ash-shormillesy, S.M.; Merwad, A.-R.M.; Wafa, H.A.; Igartua, E. Field responses of barley genotypes across a salinity gradient in an arid Mediterranean environment. Agric. Water Manag. 2021, 258, 107206. [Google Scholar] [CrossRef]
  91. Swailam, M.; Mowafy, S.; El-Naggar, N.; Mansour, E. Agronomic responses of diverse bread wheat genotypes to phosphorus levels and nitrogen forms in a semiarid environment. SABRAO J. Breed. Genet. 2021, 53, 592–608. [Google Scholar] [CrossRef]
  92. El-Sanatawy, A.M.; Ash-Shormillesy, S.M.; Qabil, N.; Awad, M.F.; Mansour, E. Seed halo-priming improves seedling vigor, grain yield, and water use efficiency of maize under varying irrigation regimes. Water 2021, 13, 2115. [Google Scholar] [CrossRef]
  93. Moustafa, E.S.; El-Sobky, E.-S.E.; Farag, H.I.; Yasin, M.A.; Attia, A.; Rady, M.O.; Awad, M.F.; Mansour, E. Sowing date and genotype influence on yield and quality of dual-purpose barley in a salt-affected arid region. Agronomy 2021, 11, 717. [Google Scholar] [CrossRef]
  94. Abd Allah, A.; Ammar, M.; Badawi, A. Screening rice genotypes for drought resistance in Egypt. J. Plant Breed. Crop Sci. 2010, 2, 205–215. [Google Scholar]
  95. Kumar, S.; Dwivedi, S.; Singh, S.; Jha, S.; Lekshmy, S.; Elanchezhian, R.; Singh, O.; Bhatt, B. Identification of drought tolerant rice genotypes by analysing drought tolerance indices and morpho-physiological traits. ABRAO J. Breed. Genet. 2014, 46, 217–230. [Google Scholar]
Figure 1. Boxplots for days to heading (A), plant height (B), leaf rolling (C), relative water content (D), chlorophyll content (E), number of panicles/plant (F), number of filled grains per panicle (G), sterility % (H), 1000-grain weight (I), and grain yield per plant (J) under well-watered and water-deficit conditions.
Plants 11 00702 g001
Figure 2. Mean performance of the six rice parents and their 15 F1 crosses for days to heading (A), plant height (B), leaf rolling (C), relative water content (D), and chlorophyll content (E) under well-watered and water-deficit conditions. The bars on the columns correspond to LSD (p ≤ 0.05).
Plants 11 00702 g002
Figure 3. Mean performance of the six rice parents and their 15 F1 crosses for number of panicles per plant (A), number of filled grains per panicle (B), sterility % (C), 1000-grain weight (D), and grain yield per plant (E) under well-watered and water-deficit conditions. The bars on the columns represent LSD (p ≤ 0.05).
Plants 11 00702 g003
Figure 4. Dendrogram of the phenotypic distances among six rice genotypes and their 15 corresponding crosses based on four drought tolerance indices. The genotypes were categorized into three groups: A is drought-tolerant; B is moderately drought-tolerant; and C is drought-sensitive.
Plants 11 00702 g004
Figure 5. PCR amplified fragments for the SSR markers RM263, RM223, RM234, and RM3805 with the six parental rice genotypes. M is a 100 bp DNA ladder.
Plants 11 00702 g005
Figure 6. Dendrogram generated from UPGMA cluster analysis of the six parental rice genotypes based on SSR markers.
Plants 11 00702 g006
Figure 7. Biplot of principal component analysis exploring the association among the studied traits under water-deficit conditions.
Plants 11 00702 g007
Table 1. Name, parentage and origin of the six rice genotypes utilized in the current study.
CodeNameParentageOriginDrought Tolerance
P1Sakha-102GZ4096/Giza177EgyptSensitive
P2Sakha-105GZ5581-46-3/GZ 4316-7-1-1EgyptSensitive
P3Giza-179GZ6296/GZ1368EgyptTolerant
P4DullarUnknownIndiaTolerant
P5IRAT-112(IRAT 13/dourado precoce)Ivory CoastTolerant
P6MoroberekanIR 8-24-6-(M307 H5)Guinea (West Africa)Tolerant
Table 2. Combined analysis of variance for all studied traits across tested environments.
Source of VarianceDFDTHPHLRRWCCHLCNPNFGSPTGWGYPP
Years (Y)159.21 *670.29 *56.02 **938.71 **545.18 **67.51 **482.91 *55.81 **15.37 *76.42 **
Replication/Y46.2360.960.44.069.51.1241.180.891.222.97
Irrigation (I)1898.47 **15047.07 **231.23 **12377.84 **1250.43 **1340.22 **46572.20 **5346.77 **753.61 **7674.90 **
Y × I1145.51 **857.33 **41.31 **89.51 **43.29*7.99 *681.84 *11.60 *6.45 *31.21 **
Error a46.1829.510.333.675.320.9235.170.730.842.36
Genotype (G)20527.42 **1693.12 **4.81 **194.00 **74.93 **77.73 **1801.61 **101.16 **14.24 **190.07 **
G × Y206.29 **15.49 **1.88 **10.26 **3.52 **8.12 **169.64 **5.77 **2.67 **25.64 **
G × I203.89 **66.62 **2.93 **102.63 **8.47 **24.06 **112.19 **28.74 **5.87 **82.93 **
G × Y × I206.00 **26.80 **1.09 **8.12 **5.32 **3.57 **77.00 **4.08 **1.26 *19.53 **
Pooled Error1601.014.940.181.291.050.8729.480.620.632.18
GCA5892.34 **4309.89 **6.97 **284.41 **57.28 **87.79 **1695.02 **77.75 **5.66 **267.52 **
SCA15405.78 **820.86 **4.09 **163.86 **80.81 **74.38 **1837.15 **108.96 **17.10 **164.25 **
GCA × Y56.57 **10.672.48 **20.84 **3.54 **8.08 **149.50 **7.17 **2.49 **13.68 **
SCA × Y156.20 **17.09 **1.68 **6.73 **3.51 **8.13 **176.35 **5.30 **2.72 **29.63 **
GCA × I54.44 **20.53 **5.94 **128.00 **4.75 **17.43 **120.99 **53.53 **3.67 **188.29 **
SCA × I153.71 **81.99 **1.93 **94.17 **9.71 **26.27 **109.26 **20.48 **6.60 **47.81 **
GCA × Y × I54.23 **24.65 **1.60 **3.45 *3.59 **1.1510.523.61 **0.8413.17 **
SCA × Y × I156.60 **27.51 **0.92 **9.68 **5.89 **4.37 **99.16 **4.24 **1.40 **21.65 **
GCA/SCA 2.25.251.71.740.711.180.920.710.331.63
GCAxY/SCAxY 1.060.621.473.11.010.990.851.350.920.46
GCAxI/SCAxI 1.190.253.071.360.490.661.112.610.563.94
* and ** indicate p-value < 0.05 and 0.01, respectively. DF is degree of freedom; DTH is days to heading; PH is plant height; CHLC is chlorophyll content (SPAD reading); LR is leaf rolling; RWC is relative water content; NP is number of panicles per plant; SP is sterility percentage; TGW is 1000-grain weight (g); and GYPP is grain yield per plant (g).
Table 3. General combining ability estimates (GCA) of the six parents for all the studied traits under well-watered and water-deficit conditions.
ParentDays to HeadingPlant HeightLeaf RollingRelative Water ContentChlorophyll Content
Well-
Watered
Water-
Deficit
Well-
Watered
Water-
Deficit
Well-
Watered
Water-
Deficit
Well-
Watered
Water-
Deficit
Well-
Watered
Water-
Deficit
P1−3.90 **−4.36 **−4.73 **−5.66 **0.11 *0.58 **−0.44 **−2.04 **0.58 **0.69 **
P2−2.37 **−1.73 **−5.90 **−6.28 **−0.14 **0.56 **0.10−3.23 **0.72 **0.31 *
P3−1.58 **−1.42 **−5.33 **−4.34 **−0.12 *−0.45 **−0.282.79 **−0.84 **−0.27 *
P42.34 **1.84 **8.71 **8.96 **0.16 **−0.45 **1.31 **3.17 **0.110.11
P51.59 **1.57 **0.13−0.90 **0.16 **0.15 **−1.59 **−1.93 **−0.98 **−1.60 **
P63.92 **4.09 **7.13 **8.22 **−0.16 **−0.39 **0.90 **1.24 **0.41 **0.75 **
LSD (gi) 0.050.280.250.590.580.110.120.290.310.280.26
LSD (gi) 0.010.370.330.780.760.140.150.380.410.370.35
ParentNumber of
Panicles/Plant
Number of
Filled Grains/Panicle
Sterility Percentage1000-Grain
Weight
Grain Yield/Plant
Well-
Watered
Water-
Deficit
Well-
Watered
Water-
Deficit
Well-
Watered
Water-
Deficit
Well-
Watered
Water-
Deficit
Well-
Watered
Water-
Deficit
P1−0.37 **−0.13−1.45 *−3.91 **−0.82 **0.95 **0.69 **0.091.44 **−1.54 **
P2−0.16−0.26 *−0.31−3.25 **−0.44 **0.70 **−0.01−0.26 *1.12 **−2.76 **
P31.53 **0.71 **6.90 **7.44 **−1.14 **−1.13 **0.05−0.012.22 **2.38 **
P41.53 **0.43 **2.09 **4.07 **0.14−1.47 **−0.40 **0.060.53 **2.49 **
P5−2.06 **−0.92 **−2.73 **−2.33 **1.20 **1.82 **−0.34 **−0.18−3.50 **−1.08 **
P6−0.47 **0.17−4.50 **−2.03 **1.05 **−0.88 **0.010.31 **−1.82 **0.52 **
LSD (gi) 0.050.260.231.431.410.170.240.200.220.400.37
LSD (gi) 0.010.350.301.901.880.220.320.270.290.530.50
* and ** indicate p < 0.05 and 0.01, respectively.
Table 4. Specific combining ability effects (SCA) of 15 F1 cross combinations for all evaluated traits under well-watered and water-deficit conditions.
CrossDays to HeadingPlant HeightLeaf RollingRelative Water ContentChlorophyll Content
Well-
Watered
Water-
Deficit
Well-
Watered
Water-
Deficit
Well-
Watered
Water-
Deficit
Well-
Watered
Water-
Deficit
Well-
Watered
Water-
Deficit
P1 × P2−0.83 *−0.667.70 **13.07 **−0.15−0.213.95 **2.62 **1.24 **0.72 *
P1 × P3−0.260.272.53 **1.56−0.23−0.55 **3.40 **1.79 **0.660.05
P1 × P45.82 **3.19 **0.11−1.93 *0.01−0.73 **−0.82 *4.11 **1.23 **1.99 **
P1 × P5−9.77 **−9.69 **−13.31 **−14.40 **1.21 **1.03 **−4.00 **3.05 **−3.42 **−1.47 **
P1 × P66.54 **6.28 **−0.300.32−0.15−0.47 **−3.50 **−5.52 **1.69 **0.31
P2 × P33.87 **4.92 **−2.35 **−0.840.41 **1.64 **−4.16 **−3.88 **−2.71 **−4.91 **
P2 × P45.93 **7.08 **0.93−3.64 **0.38*−0.18−1.99 **−1.27 **−3.72 **−3.80 **
P2 × P57.03 **6.18 **14.86 **−1.07−0.16−0.33 *1.92 **7.50 **1.44 **2.74 **
P2 × P6−6.65 **−8.17 **−6.14 **−3.73 **0.01−0.89 **−1.23 **6.34 **2.03 **0.71
P3 × P44.15 **4.03 **13.86 **14.05 **−0.09−0.58 **2.92 **2.49 **4.72 **4.79 **
P3 × P55.58 **5.49 **10.70 **13.94 **−0.09−0.78 **1.81 **3.19 **1.43 **−0.50
P3 × P61.91 **0.57−5.53 **−8.65 **0.48 **0.26−4.96 **−4.34 **−0.061.15 **
P4 × P5−4.36 **−4.18 **−11.75 **−7.52 **0.041.22 **−0.47−10.56 **2.04 **−1.89 **
P4 × P6−5.37 **−5.47 **1.452.12 **0.05−0.35 *1.70 **4.03 **−0.182.10 **
P5 × P61.42 **2.45 **−0.170.72−0.051.42 **1.35 **−9.63 **−4.26 **−4.52 **
LSD Sij 0.050.760.681.621.580.290.320.800.840.760.72
LSD Sij 0.011.010.912.152.100.380.421.061.121.000.95
CrossNumber of Panicles/PlantNumber of Filled Grains/PanicleSterility Percentage1000-Grain WeightGrain Yield/Plant
Well-
Watered
Water-
Deficit
Well-
Watered
Water-
Deficit
Well-
Watered
Water-
Deficit
Well-
Watered
Water-
Deficit
Well-
Watered
Water-
Deficit
P1 × P23.83 **1.50 **3.97 *3.98 *−1.68 **−3.42 **1.52 **0.373.13 **1.59 **
P1 × P34.80 **1.68 **8.60 **7.18 **0.332.94 **0.81 **1.05 **−0.21−1.56 **
P1 × P4−0.611.82 **−2.513.20−0.100.32−1.52 **−1.34 **3.09 **4.14 **
P1 × P51.40 **2.78 **−15.77 **−12.22 **4.45 **2.30 **−2.82 **0.15−5.36 **3.90 **
P1 × P6−4.47 **−3.01 **0.30−3.192.60 **3.17 **1.94 **0.150.29−2.19 **
P2 × P3−4.40 **−1.38 **−23.55 **−19.96 **6.11 **2.51 **−1.90 **−0.90 **−10.52 **−6.84 **
P2 × P4−3.77 **−1.80 **−19.40 **−19.76 **3.83 **6.01 **0.29−0.17−2.47 **−3.44 **
P2 × P51.09 **2.81 **18.08 **19.70 **−0.79 **0.360.92 **0.92 **7.79 **5.96 **
P2 × P64.99 **−0.90 **13.35 **12.26 **0.47 *−2.74 **−0.341.12 **−0.884.59 **
P3 × P42.43 **1.96 **11.31 **6.52 **−0.94 **−1.07 **2.48 **1.19 **5.71 **3.30 **
P3 × P5−5.13 **−2.66 **7.88 **−3.57−1.23 **−1.25 **2.34 **−0.68*2.90 **−0.60
P3 × P6−0.201.59 **−6.35 **−9.38 **1.66 **0.26−0.60*0.83 **−2.32 **2.23 **
P4 × P53.40 **−2.89 **8.69 **11.29 **−0.151.75 **0.79 **0.69 *−0.82−1.87 **
P4 × P61.80 **2.03 **8.51 **12.52 **−0.62 **−3.48 **0.220.65 *0.282.36 **
P5 × P60.090.96 **−9.89 **−19.79 **1.48 **6.54 **−1.53 **−2.70 **−0.12−5.74 **
LSD Sij 0.050.720.633.943.880.460.660.550.591.101.03
LSD Sij 0.010.950.835.225.150.600.870.730.791.461.36
* and ** indicate p-value < 0.05 and 0.01, respectively.
Table 5. Heterosis relative to Mid-Parent (MP) and Better-Parent (BP) of the 15 F1 hybrids for all evaluated traits under well-watered (W) and water-deficit (S) conditions.
CrossDays to HeadingPlant HeightLeaf RollingRelative Water Content (%)Chlorophyll Content
M.PB.PM.PB.PM.PB.PM.PB.PM.PB.P
WSWSWSWSWSWSWSWSWSWS
P1 × P21.99 **1.67 **2.47 **1.83 **10.14 **15.12 **16.51 **17.61 **9.47−8.5325.44−3.623.93 **11.47 **3.12 **7.05 **2.55 *−0.040.52−2.76 *
P1 × P34.21 **4.39 **5.47 **5.60 **6.23 **7.07 **12.95 **12.20 **3.66−18.76 **16.9916.783.46 **4.47 **3.26 **−4.47 **4.77 **1.50−0.14−0.30
P1 × P47.77 **4.39 **13.55 **10.01 **0.36−1.4210.78 **13.00 **15.34−26.02 **23.75−0.26−0.867.58 **−2.21 **−2.20 *6.04 **8.17 **3.30 *5.52 **
P1 × P5−9.39 **−10.12 **−3.74 **−4.46 **−12.26 **−17.03 **−9.12 **−11.19 **94.74 **31.61 **96.46 **98.44 **−4.96 **4.43 **−6.71 **−0.42−8.61 **−6.28 **−9.69 **−7.41 **
P1 × P66.17 **5.03 **15.98 **15.88 **−3.05 **−2.15 *8.97 **14.63 **6.62−16.82 **20.5816.09−6.24 **−8.95 **−9.13 **−17.26 **4.11 **1.583.25*0.29
P2 × P310.77 **12.31 **11.60 **13.79 **6.28 **5.93 **6.79 **8.61 **47.97 **42.59 **50.00 **92.01 **−5.64 **−1.84 *−6.20 **−13.47 **−4.93 **−14.62 **−11.10 **−18.38 **
P2 × P49.89 **11.03 **16.35 **16.81 **5.01 **−1.8423.24 **15.25 **36.35 **−8.1969.08 **16.23 *−2.37 **1.86 *−2.94 **−10.70 **−7.08 **−10.30 **−11.24 **−14.83 **
P2 × P59.34 **8.87 **16.72 **15.54 **17.18 **−2.28 *28.64 **7.02 **13.635.3328.9348.92 **2.04 **13.64 **−0.614.28 **0.700.49−2.43−3.39 *
P2 × P6−4.72 **−6.89 **4.61 **2.56 **−4.27 **−4.78 **14.52 **14.31 **16.08−22.70 **17.461.16−3.74 **10.16 **−5.99 **−3.47 **3.07 **−1.191.86−2.67
P3 × P49.65 **9.51 **17.01 **16.81 **17.09 **19.50 **38.19 **44.37 **7.81−4.3431.55−20.14 *3.53 **2.60 **2.33 **1.93 *16.46 **14.97 **13.87 **14.15 **
P3 × P59.43 **9.80 **17.74 **18.15 **14.38 **17.80 **26.23 **32.54 **17.70−8.2231.55−3.112.07 **1.90 *0.00−2.49 **4.20 **−4.57 **0.45−5.13 **
P3 × P65.07 **3.32 **16.29 **15.45 **−2.89 **−5.70 **16.82 **16.55 **50.03 **8.5750.30 **11.11−7.91 **−8.87 **−10.58 **−9.51 **1.783.08 *−3.76 **0.00
P4 × P5−2.70 **−2.91 **−1.94 **−2.11 **−8.35 **−7.86 **−2.53 *−1.7420.4551.72 **30.45 *68.42 **0.02−16.98 **−3.13 **−21.06 **5.57 **−6.49 **4.04 **−7.69 **
P4 × P6−4.03 **−5.13 **−0.67−0.88−0.060.481.622.45 *13.94−3.7939.34 *−14.320.421.87 *−1.371.81 *1.497.18 **−1.943.26 *
P5 × P60.781.35 **3.48 **4.98 **−2.15*−3.20 **5.91 **5.38 **17.6764.50 **31.7977.63 **−0.19−18.15 **−4.99 **−22.44 **−11.65 **−15.00 **−13.41 **−17.07 **
CrossNumber of Panicles/PlantNumber of Filled Grains/PanicleSterility Percentage1000-Grain WeightGrain Yield/Plant
M.PB.PM.PB.PM.PB.PM.PB.PM.PB.P
WSWSWSWSWSWSWSWSWSWS
P1 × P230.69 **19.76 **23.77 **11.74 **0.55 2.80 −0.70 1.43 23.76 **−6.82 **27.28 **−4.99 5.92 **3.51 2.760.896.34 **16.71 **4.69 *15.53 **
P1 × P326.19 **21.67 **6.81 **8.78 **4.83 *1.87 −0.54 −10.65 **46.05 **27.40 **54.96 **39.39 **5.88 **6.60 **0.454.86 *−2.54 −3.45 −7.14 **−21.31 **
P1 × P47.45 **22.91 **−4.13 11.47 **−1.67 6.27 *−2.06 1.99 19.57 **13.85 **49.62 **27.59 **−3.64 *−4.28 *−9.35 **−5.04 *12.33 **26.18 **6.49 **7.83 **
P1 × P517.48 **32.37 **12.84 **30.91 **−11.73 **−13.64 **−15.00 **−15.72 **68.86 **30.20 **125.61 **31.69 **−10.67 **−0.69 −13.77 **−1.64−11.51 **25.27 **−24.08 **17.47 **
P1 × P6−15.29 **−11.65 **−18.03 **−19.15 **0.34 −5.30 −4.14 −8.48 **58.36 **28.89 **98.53 **39.59 **6.70 **1.11 4.33 **−0.16−0.40 −1.66 −6.12 **−13.07 **
P2 × P3−21.13 **−6.57 *−30.00 **−10.77 **−18.41 **−22.41 **−21.66 **−31.14 **141.16 **21.17 **148.58 **35.41 **−3.85 *−0.88 −6.03 **−1.82−28.36 **−26.40 **−30.70 **−40.49 **
P2 × P4−12.43 **−9.54 **−17.78 **−12.26 **−14.65 **−16.74 **−15.37 **−19.04 **69.90 **40.46 **119.87 **60.85 **3.81 *1.84 0.550.04−4.48 *−7.24 *−10.78 **−21.40 **
P2 × P510.07 **22.21 **0.35 15.21 **14.35 **17.39 **8.80 **16.10 **22.15 **16.94 **69.02 **20.63 **3.65 *3.70 *3.120.1322.82 **30.22 **4.01 20.95 **
P2 × P632.33 **−4.42 29.40 **−6.40 10.15 **9.21 **3.99 6.94 *42.60 **−5.83 *84.90 **4.16 −1.09 6.40 **−1.872.43−5.87 **22.07 **−12.57 **6.96 *
P3 × P411.38 **15.73 **4.87 *13.89 **8.90 **4.39 3.72 −4.99 *11.92 **3.94 50.30 **6.27 15.27 **7.96 **14.23 **7.05 **14.80 **11.10 **3.97 *4.91 *
P3 × P5−27.69 **−14.29 **−40.78 **−22.61 **7.14 **−8.22 **−1.91 −17.75 **12.65 **10.94 **62.00 **19.91 **11.84 **−3.09 9.85 **−5.56 **7.74 **−3.62 −11.20 **−17.13 **
P3 × P6−1.25 12.86 **−14.05 **10.00 **−4.04 −13.75 **−12.81 **−22.01 **51.35 **11.88 **103.67 **12.94 **0.43 5.26 **−2.612.26−10.14 **5.42 *−19.06 **−4.05
P4 × P523.78 **−16.30 **6.61 *−23.33 **9.88 **13.04 **5.39 *11.11 **11.09 **27.95 **17.36 **41.62 **5.02 **2.32 2.250.555.22 *−1.23 −5.35 *−10.61 **
P4 × P615.96 **15.75 **6.61 *14.62 **9.21 **13.36 **3.93 12.55 **11.59 **−9.80 **11.77 **−6.88 *2.72 3.95 *−1.261.832.88 13.10 **2.25 8.76 **
P5 × P6 5.04 9.58 **−2.24 1.30 −5.10 *−22.08 **−5.88 *−22.86 **32.51 **53.20 **39.75 **63.92 **−6.30 **−12.94 **−7.52 **−13.21 **0.88 −19.21 **−8.77 **−24.16 **
* and ** indicate p-value < 0.05 and 0.01, respectively.
Table 6. Genetic details of the sixteen polymorphic SSR markers used in this study.
Marker NameChromosome NumberNumber of AllelesEffective Number of AllelesMajor Allele FrequencyGene DiversityPIC
RM315121.950.580.490.37
RM543121.800.670.440.35
RM263232.320.580.570.50
RM279243.790.330.740.69
RM55332.00.670.500.45
RM518443.600.330.720.67
RM159543.00.500.670.62
RM3805632.570.500.610.54
RM70732.570.500.610.54
RM234732.570.500.610.54
RM72843.600.330.720.67
RM223843.600.330.720.67
RM160932.570.500.610.54
RM2221032.570.500.610.54
RM3321132.00.670.500.45
RM20A125.3.790.330.740.69
Mean3.312.770.490.620.55
Table 7. Genetic distance among the assessed parental genotypes based on SSR markers.
ParentP1P2P3P4P5P6
P1-
P20.38-
P30.780.67-
P40.880.820.77-
P50.890.720.780.59-
P60.780.610.780.710.39-
Table 8. Correlation coefficients among parental genetic distance (GD), F1 hybrid performance, mid-parent heterosis (MP), better-parent (BP) heterosis, and SCA for all the studied traits under well-watered (W) and water-deficit (S) conditions.
CorrelationIrrig.Days to HeadingPlant HeightLeaf RollingRelative Water ContentChlorophyll ContentNumber of Panicles/PlantNumber of Filled Grains/PanicleSterility Percentage1000-Grain WeightGrain Yield/Plant
r (GD, F1)W0.08−0.050.43−0.350.02−0.160.010.10−0.040.08
S−0.01−0.23−0.360.490.240.160.11−0.030.250.45
r (GD, SCA)W0.19−0.060.38−0.390.07−0.33−0.120.26−0.07−0.06
S0.12−0.29−0.330.340.270.07−0.020.080.230.31
r (GD, MP)W0.22−0.030.34−0.290.19−0.33−0.130.140.03−0.03
S0.15−0.18−0.420.250.350.13−0.010.040.240.26
r (GD, BP)W0.400.090.38−0.150.13−0.35−0.220.44−0.05−0.14
S0.340.07−0.140.200.340.15−0.110.050.290.09
r (F1, SCA)W0.80 **0.65 **0.91 **0.92 **0.95 **0.90 **0.93 **0.88 **0.96 **0.84 **
S0.81 **0.66 **0.83 **0.84 **0.95 **0.95 **0.92 **0.91 **0.98 **0.82 **
r (F1, MP)V0.68 **0.53 *0.88 **0.86 **0.89 **0.84 **0.91 **0.68 **0.91 **0.77 **
S0.69 **0.52 *0.72 **0.690.96 **0.91 **0.89 **0.94 **0.94 **0.70 **
r (F1, BP)W0.73 **0.53 *0.89 **0.83 **0.92 **0.77 **0.84 **0.66 **0.87 **0.80 **
S0.75 **0.55 *0.90 **0.78 **0.93 **0.92 **0.75 **0.91 **0.920.66 **
r (SCA, MP)W0.95 **0.95 **0.99 **0.97 **0.96 **0.98 **0.99 **0.92 **0.98 **0.97 **
S0.96 **0.97 **0.95 **0.95 **0.95 **0.97 **0.98 **0.98 **0.97 **0.97 **
r (SCA, BP)W0.89 **0.83 **0.94 **0.91 **0.97 **0.92 **0.96 **0.86 **0.96 **0.88 **
S0.88 **0.77 **0.88 **0.91 **0.95 **0.97 **0.92 **0.97 **0.93 **0.93 **
* and ** indicate p-value < 0.05 and 0.01, respectively.
Publisher’s Note: MDPI stays neutral with regard to jurisdictional claims in published maps and institutional affiliations.

