
QTL Identification for Stem Fiber, Strength and Rot Resistance in a DH Population from an Alien Introgression of Brassica napus


Abstract
:1. Introduction
2. Results
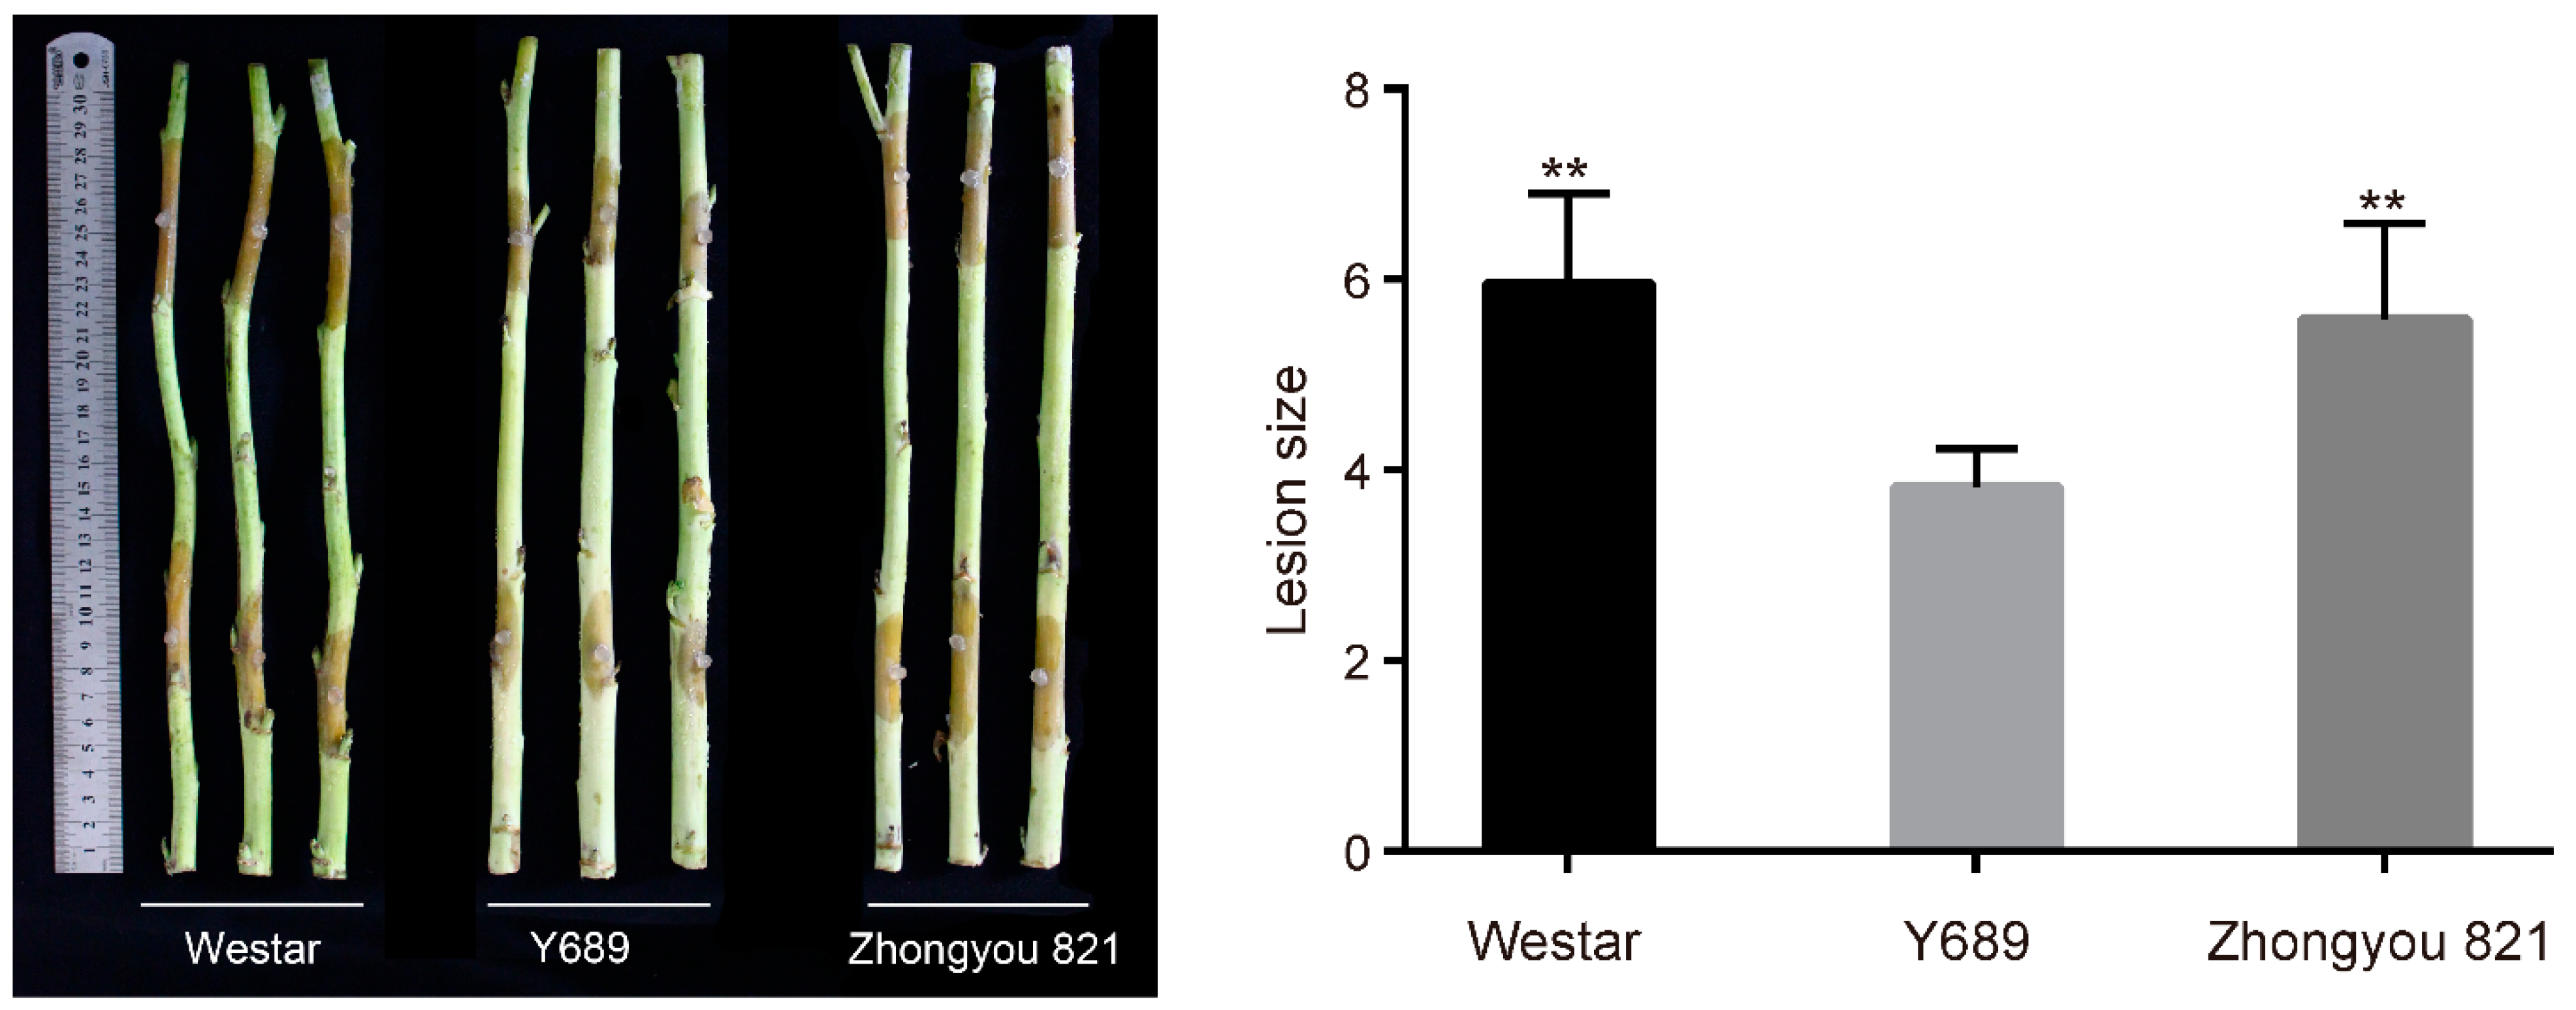
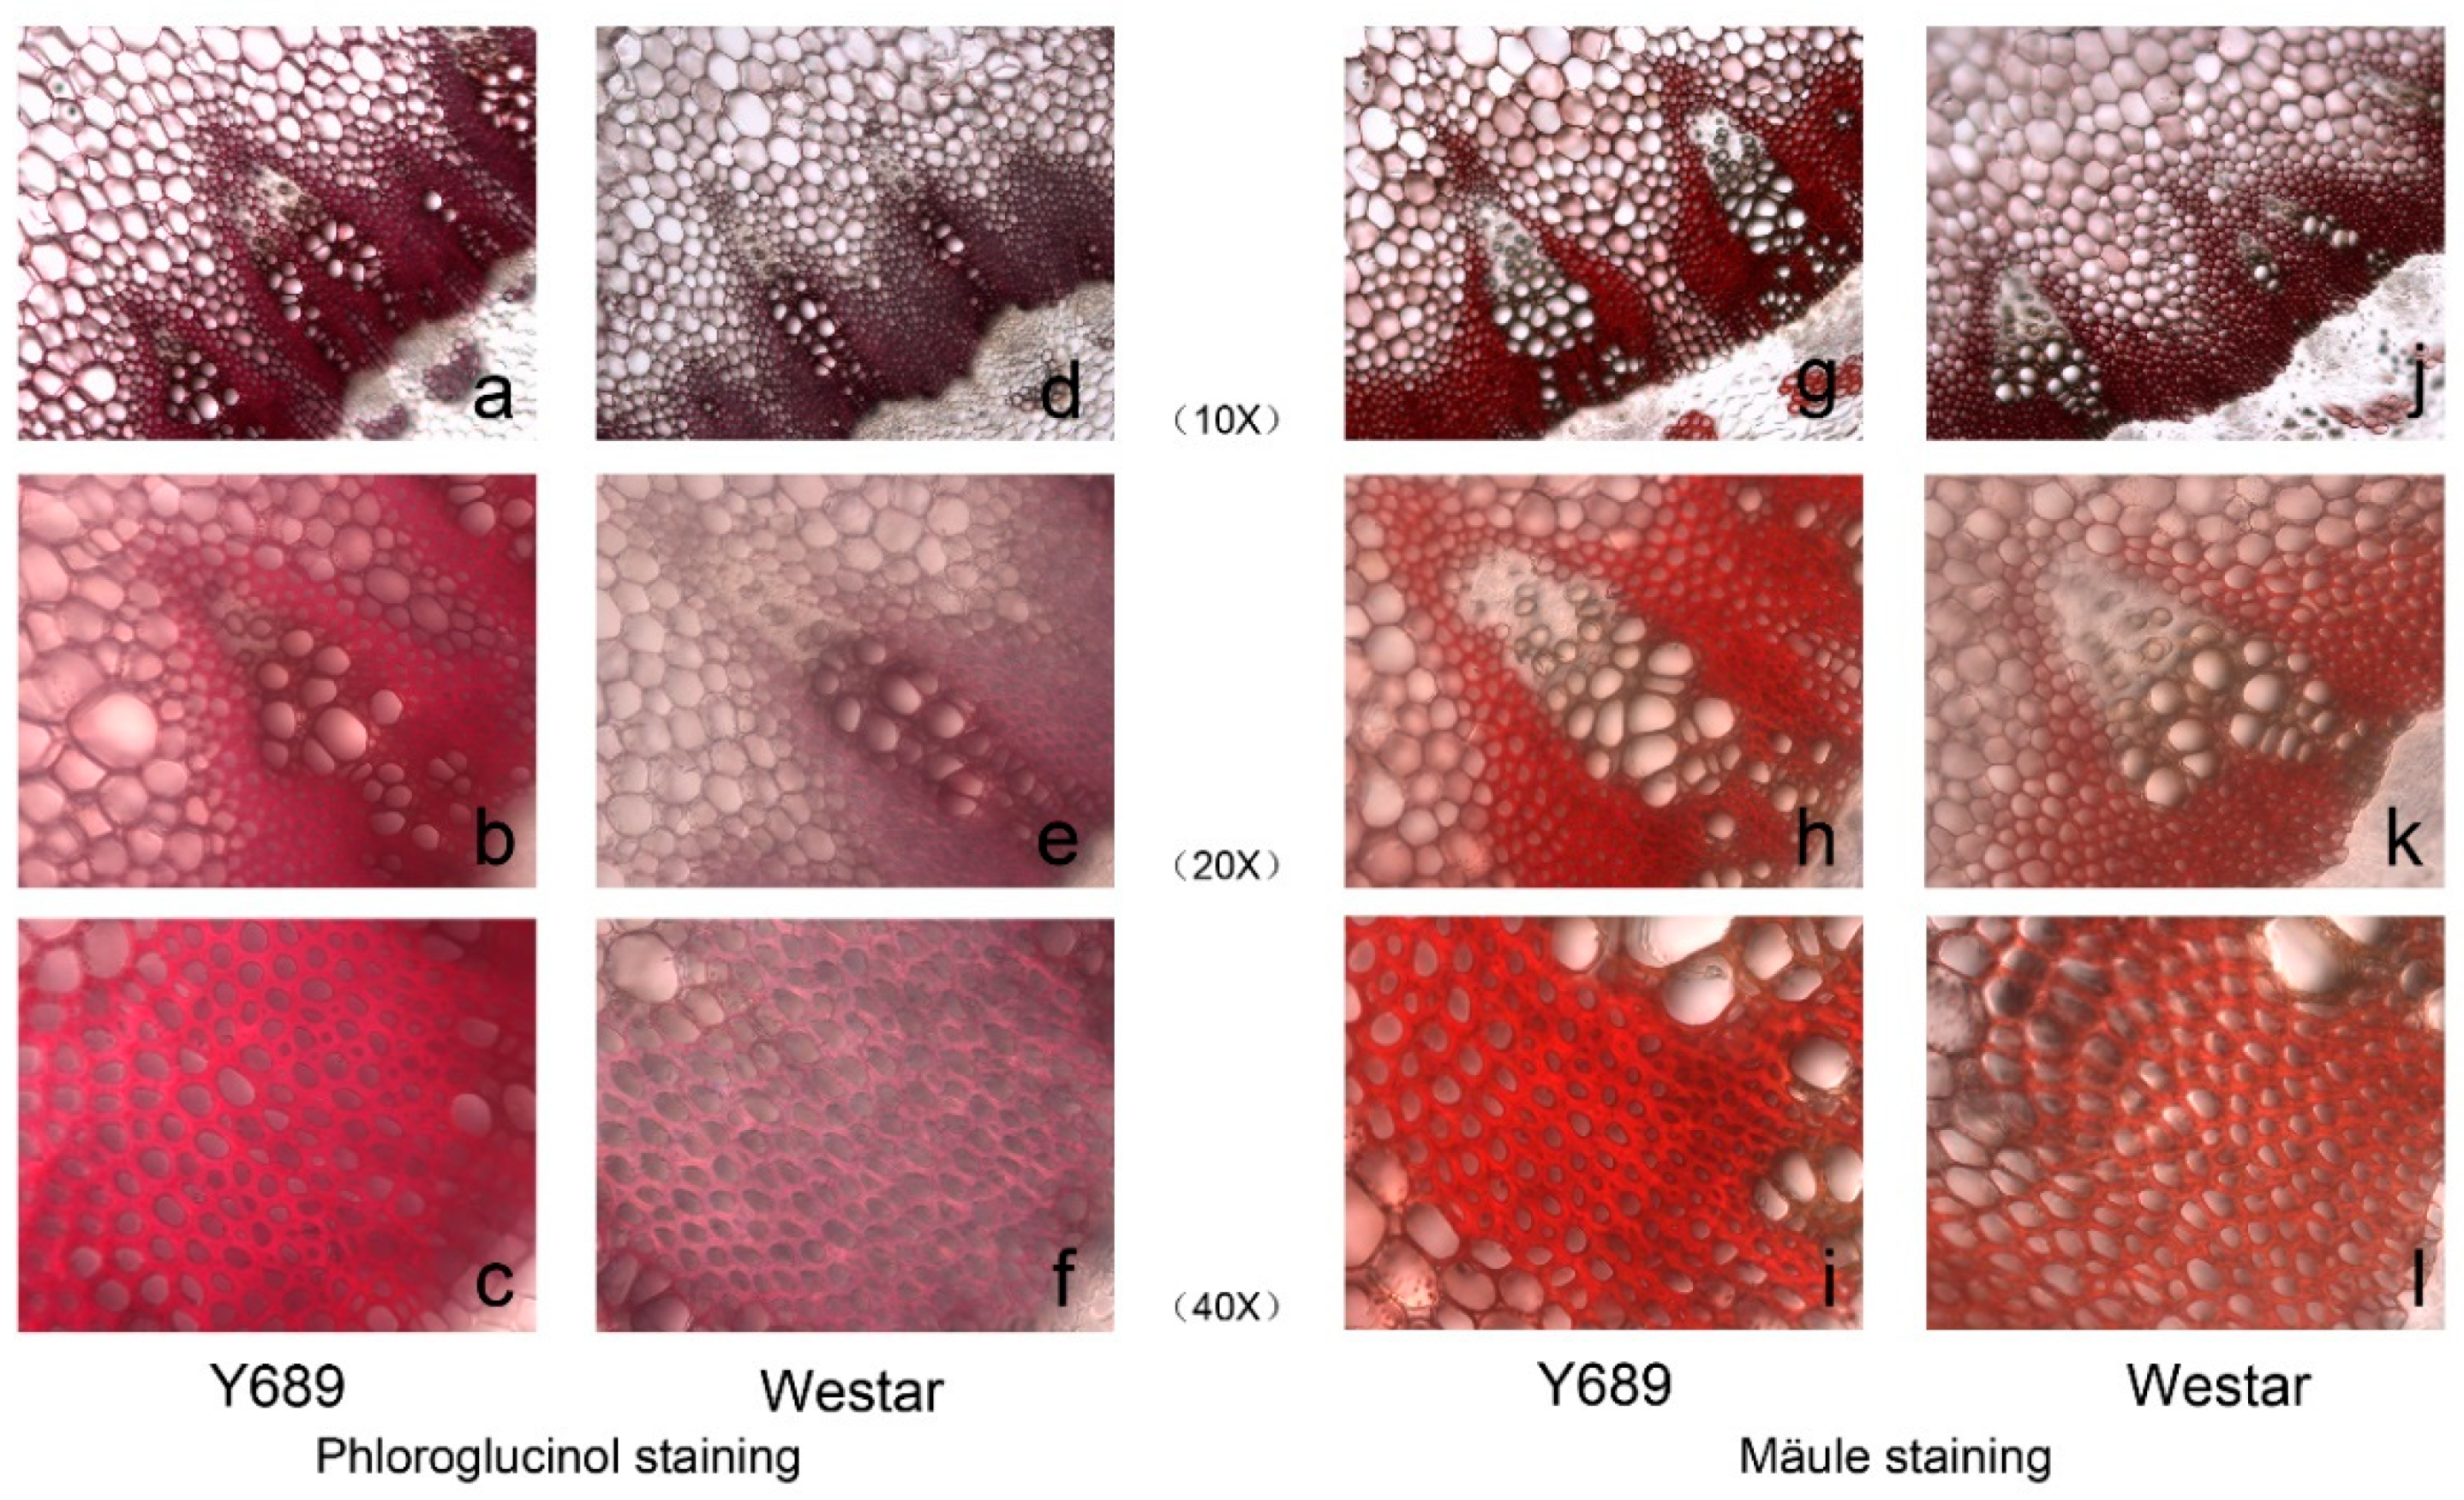
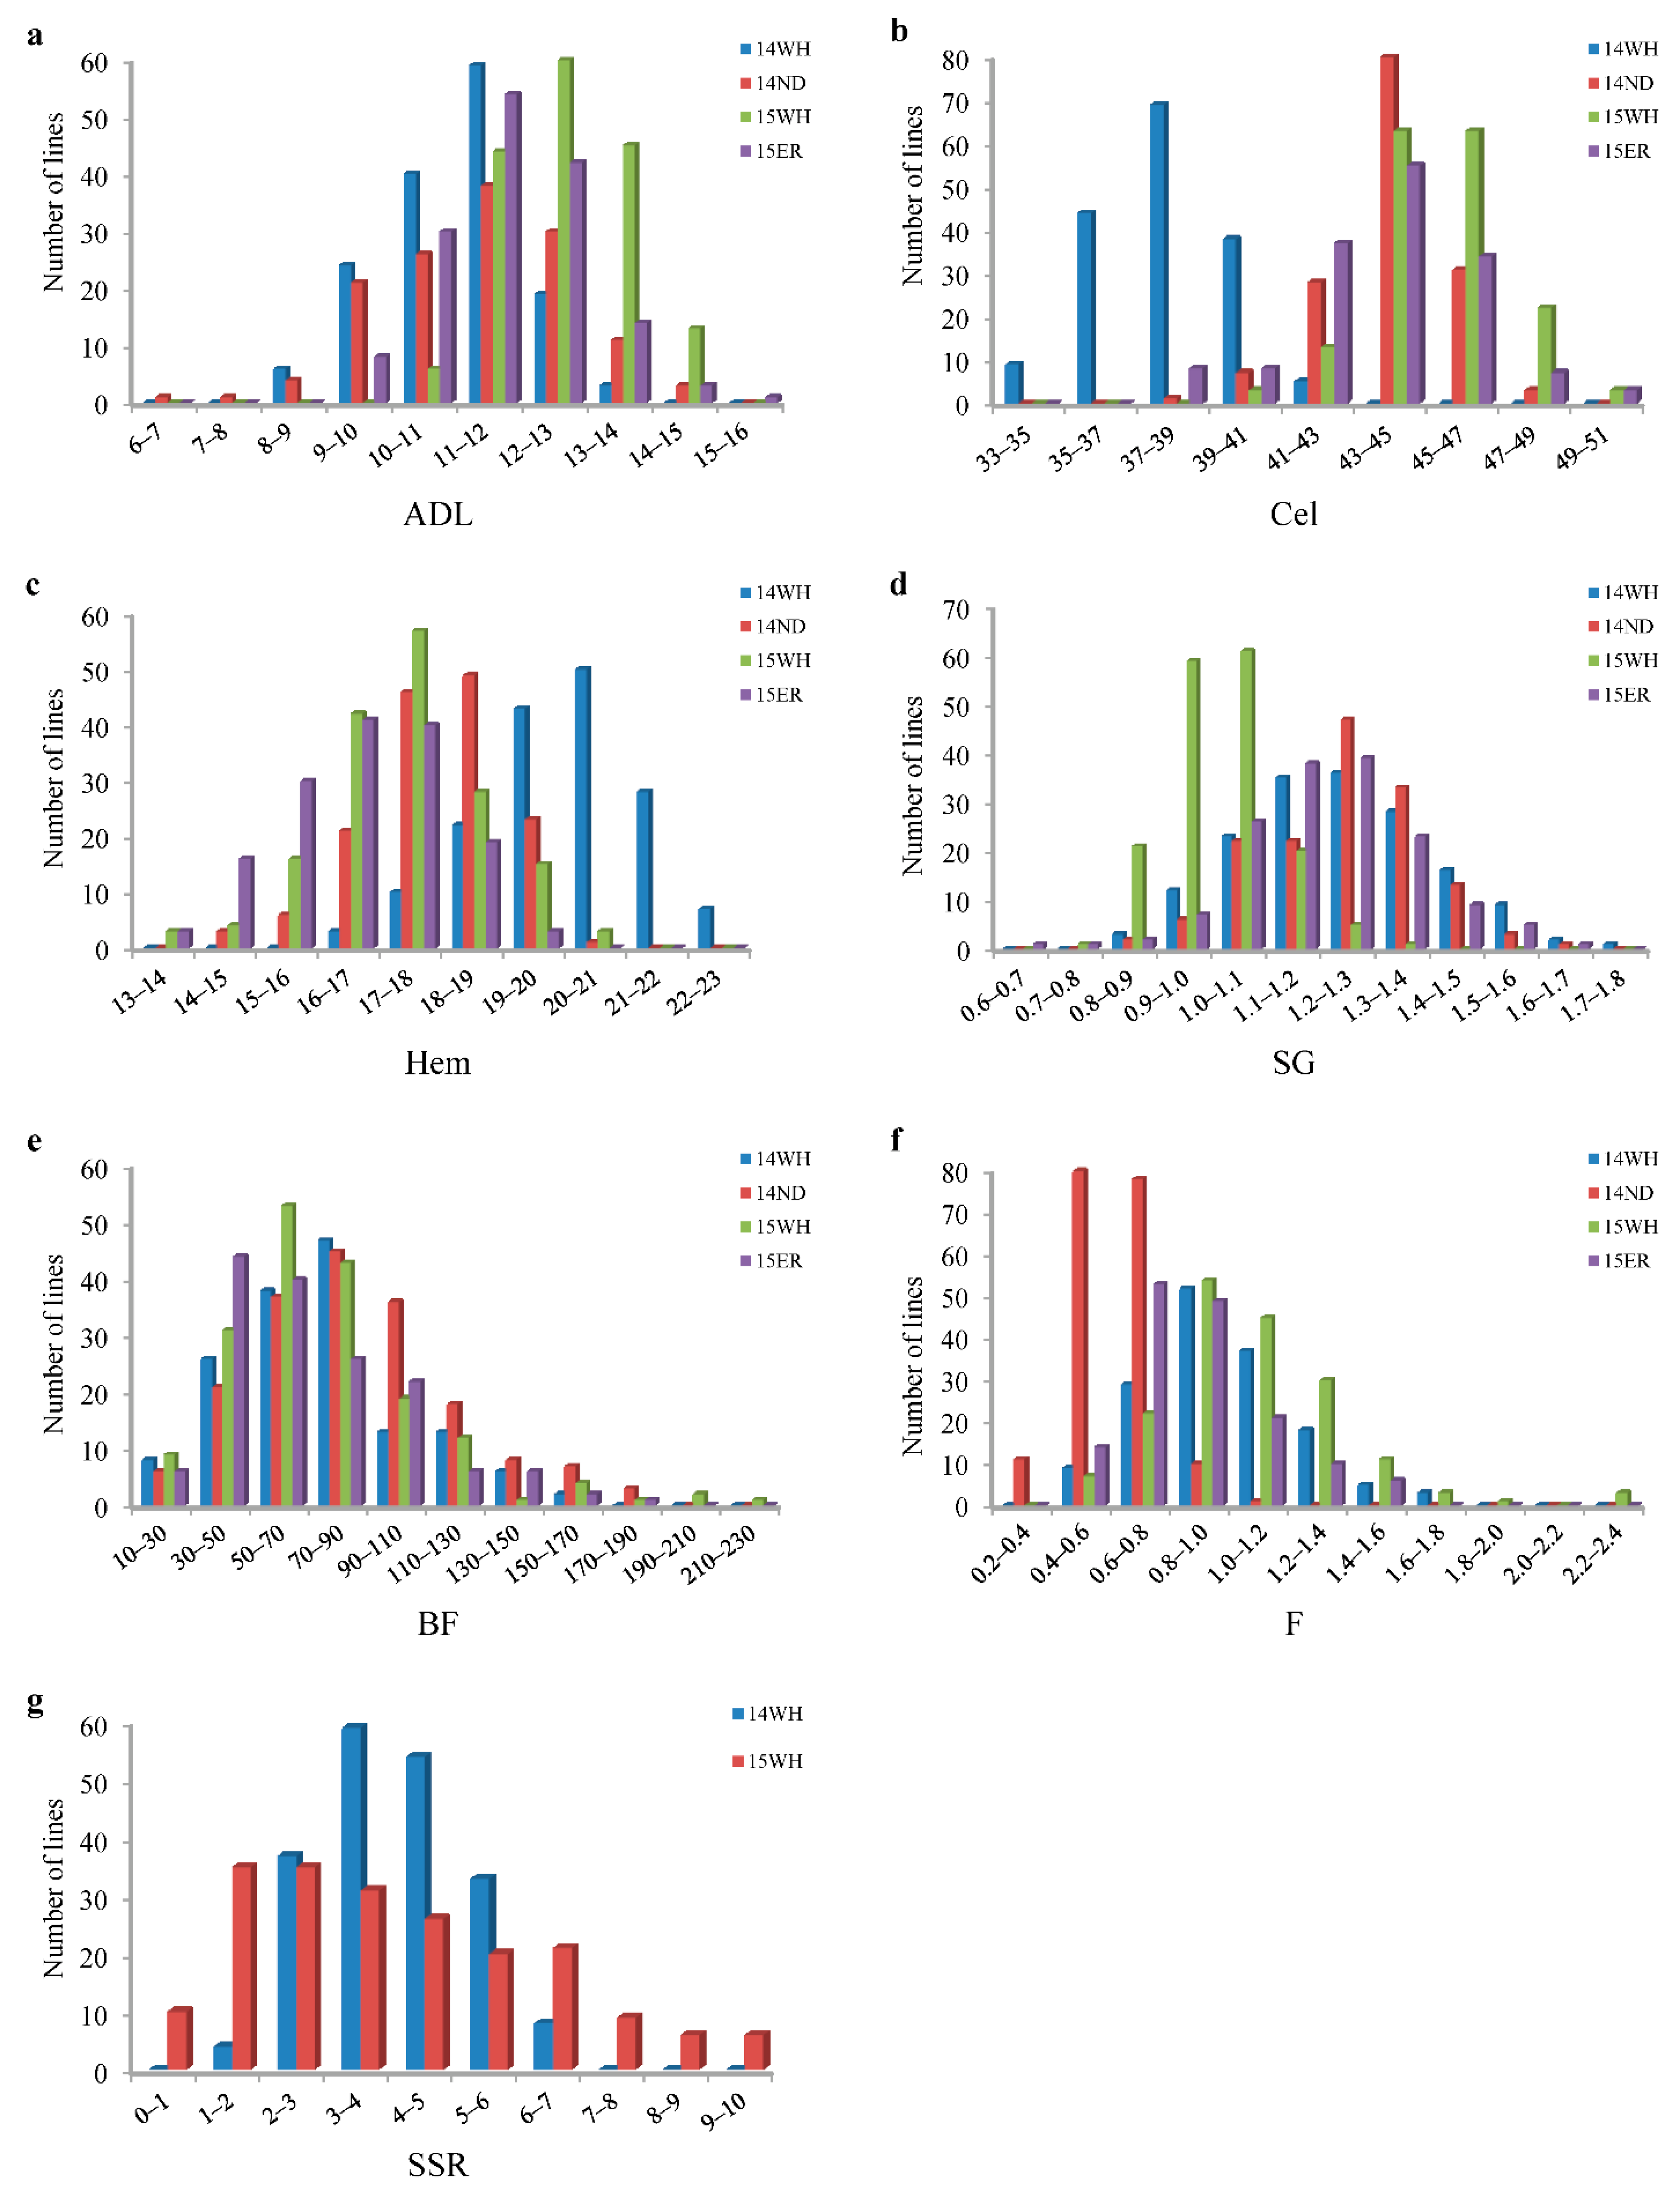
2.1. Phenotypic Performances of the Parents and DH Lines
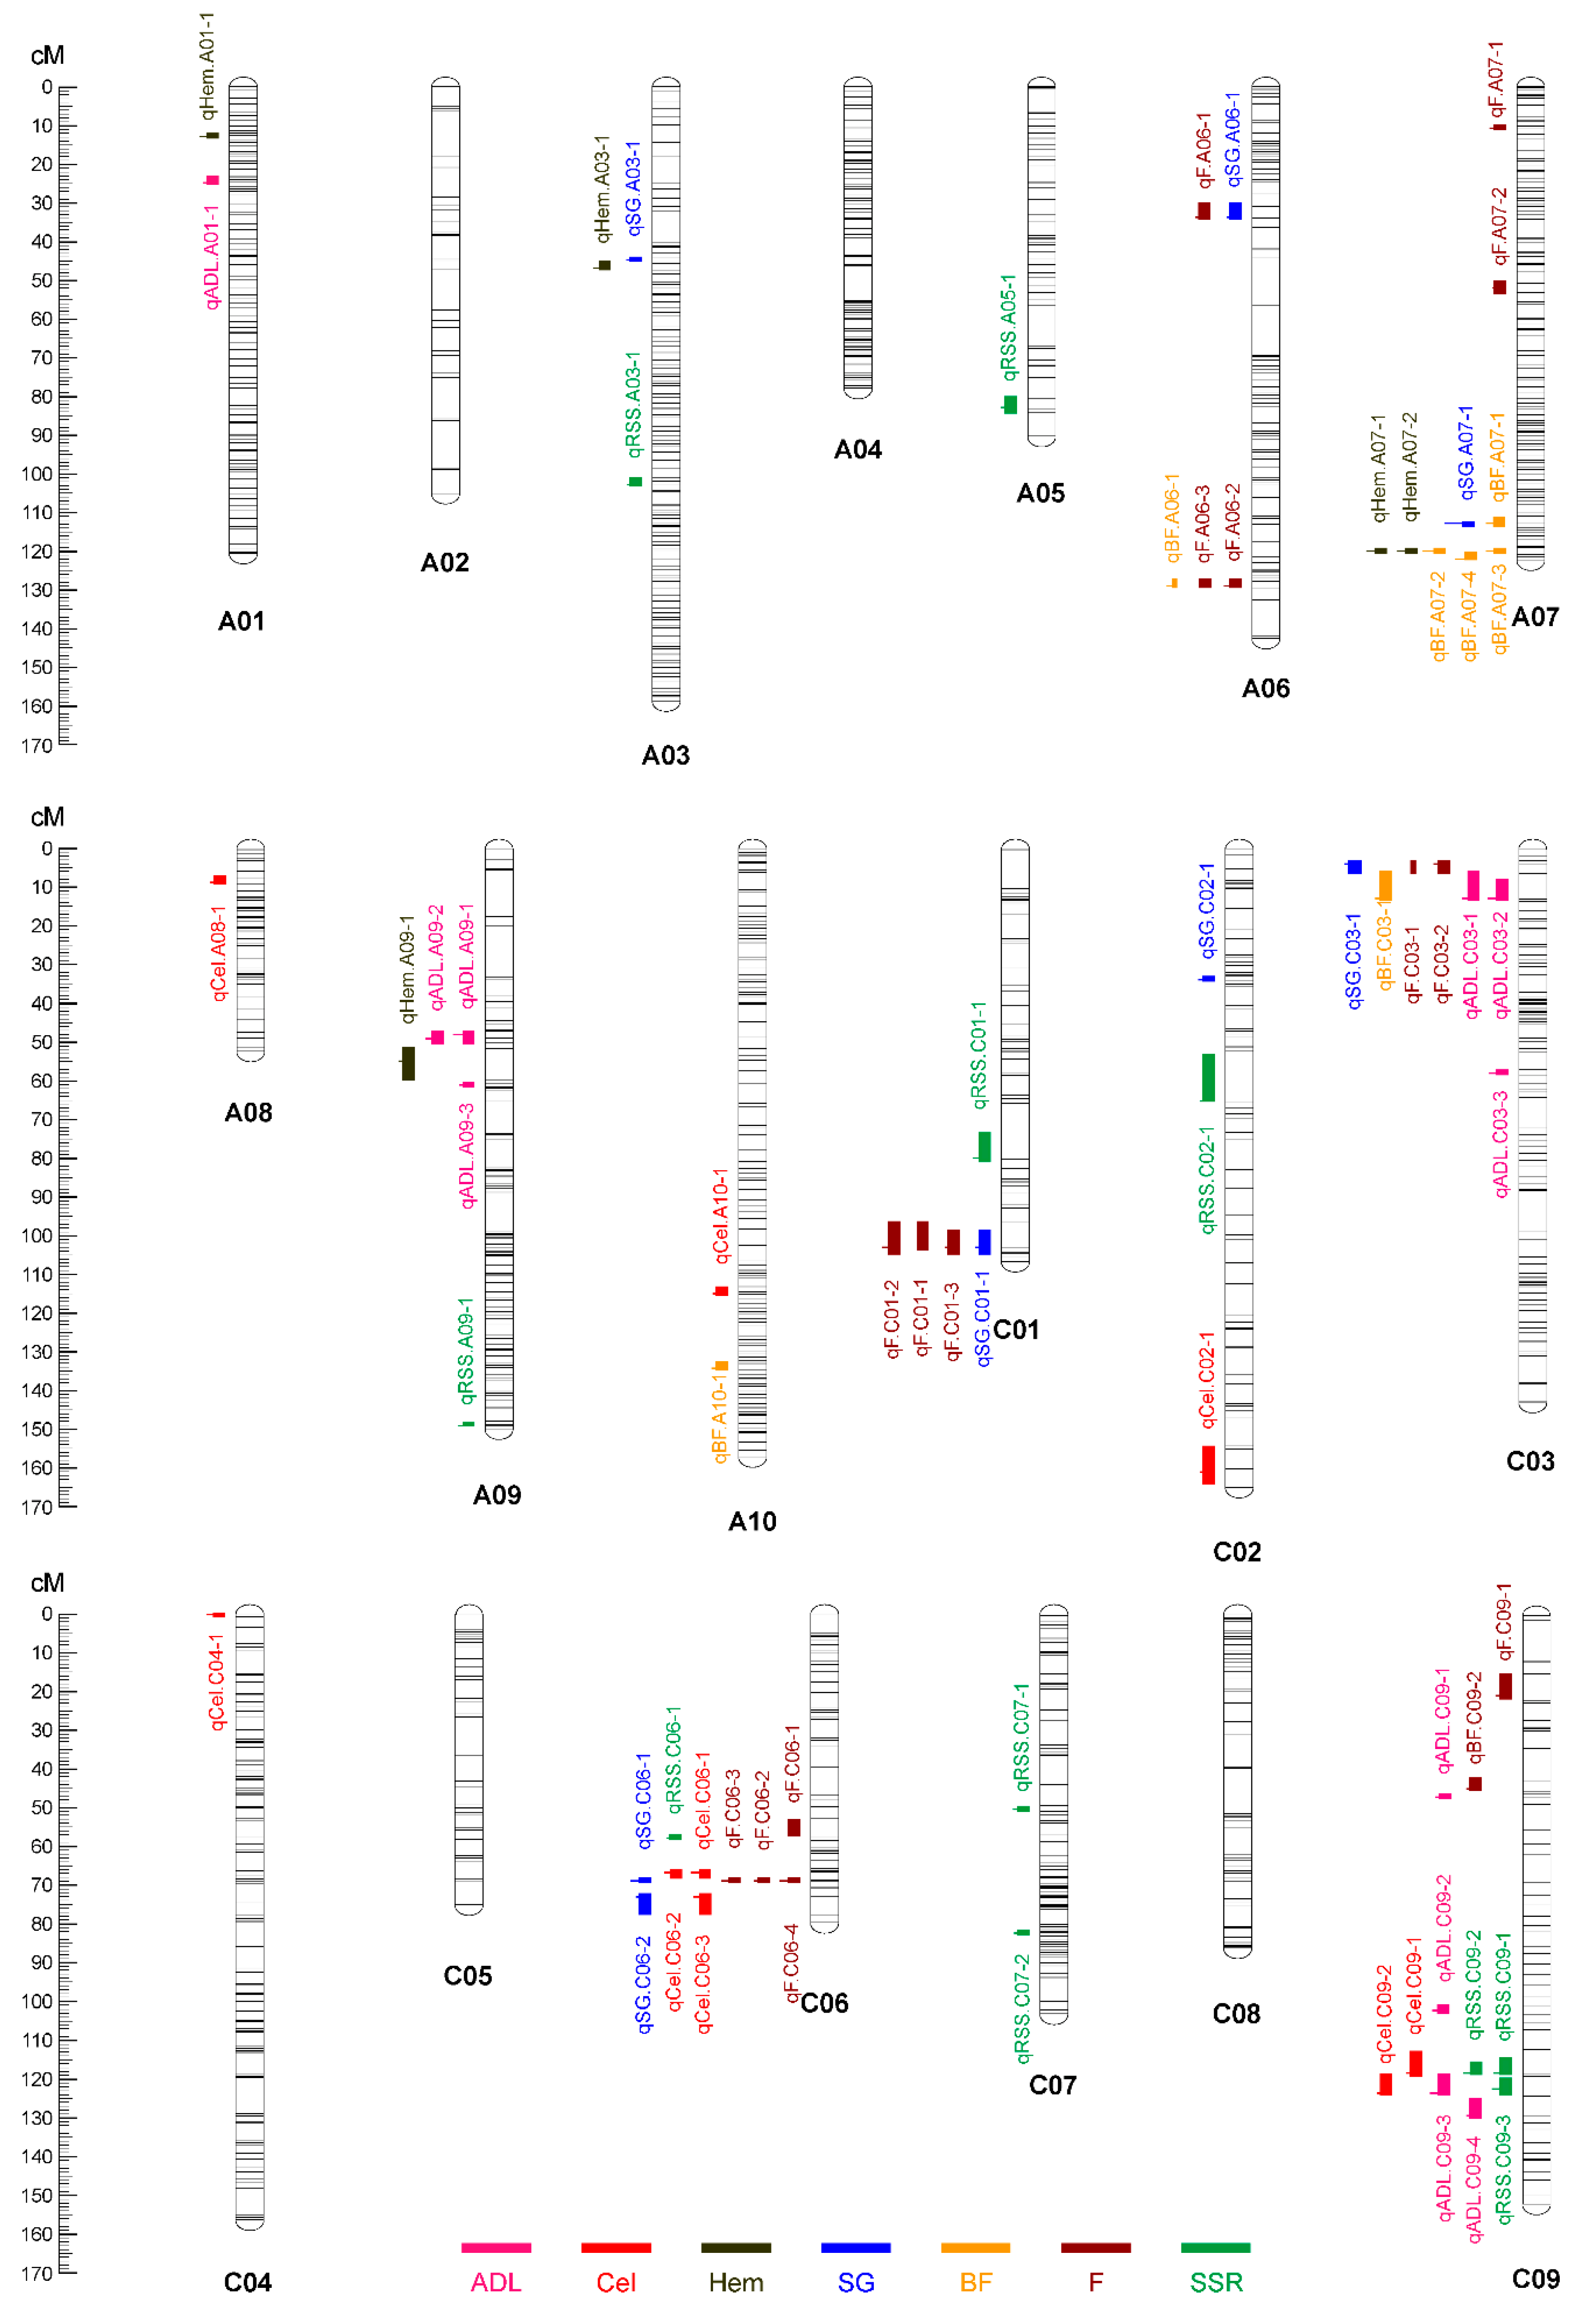
2.2. Additive QTL Mapping and Meta-Analysis
2.3. QTL by Environment Interaction Mapping
2.4. Candidate Genes Mining
3. Discussion
4. Materials and Methods
4.1. Plant Material and Growth Conditions
4.2. Histochemical Staining
4.3. Phenotypic Evaluations and Statistical Analysis
4.4. QTL Mapping
4.5. Candidate Gene Mining
5. Conclusions
Supplementary Materials
Author Contributions
Funding
Institutional Review Board Statement
Informed Consent Statement
Data Availability Statement
Conflicts of Interest
References
- Wu, W.; Ma, B. A new method for assessing plant lodging and the impact of management options on lodging in canola crop production. Sci. Rep. 2016, 6, 31890. [Google Scholar] [CrossRef] [PubMed] [Green Version]
- Wei, L.; Jian, H.; Lu, K.; Yin, N.; Wang, J.; Duan, X.; Li, W.; Liu, L.; Xu, X.; Wang, R.; et al. Genetic and transcriptomic analyses of lignin- and lodging-related traits in Brassica napus. Theor. Appl. Genet. 2017, 130, 1961–1973. [Google Scholar] [CrossRef] [PubMed]
- Pei, Y.; Li, Y.; Zhang, Y.; Yu, C.; Fu, T.; Zou, J.; Tu, Y.; Peng, L.; Chen, P. G-lignin and hemicellulosic monosaccharides distinctively affect biomass digestibility in rapeseed. Bioresour. Technol. 2016, 203, 325–333. [Google Scholar] [CrossRef] [PubMed]
- Liu, D.; Wu, J.; Lin, L.; Li, P.; Li, S.; Wang, Y.; Li, J.; Sun, Q.; Liang, J.; Wang, Y. Overexpression of cinnamoyl-coA reductase 2 in Brassica napus increases resistance to Sclerotinia sclerotiorum by affecting lignin biosynthesis. Front. Plant Sci. 2021, 12, 732733. [Google Scholar] [CrossRef] [PubMed]
- Cao, Y.; Yan, X.; Ran, S.; Ralph, J.; Smith, R.A.; Chen, X.; Qu, C.; Li, J.; Liu, L. Knockout of the lignin pathway gene BnF5H decreases the S/G lignin compositional ratio and improves S. sclerotiorum resistance in B. napus. Plant Cell Environ. 2021, 45, 248–261. [Google Scholar] [CrossRef]
- Miao, L.; Chao, H.; Chen, L.; Wang, H.; Zhao, W.; Li, B.; Zhang, L.; Li, H.; Wang, B.; Li, M. Stable and novel QTL identification and new insights into the genetic networks affecting seed fiber traits in Brassica napus. Theor. Appl. Genet. 2019, 132, 1761–1775. [Google Scholar] [CrossRef]
- Herrero, J.; Fernández-Pérez, F.; Yebra, T.; Novo-Uzal, E.; Pomar, F.; Pedreño, M.Á.; Cuello, J.; Guéra, A.; Esteban-Carrasco, A.; Zapata, J.M. Bioinformatic and functional characterization of the basic peroxidase 72 from Arabidopsis thaliana involved in lignin biosynthesis. Planta 2013, 237, 1599–1612. [Google Scholar] [CrossRef]
- Zhang, K.; Bhuiya, M.-W.; Pazo, J.R.; Miao, Y.; Kim, H.; Ralph, J.; Liu, C.-J. An Engineered monolignol 4-O-methyltransferase depresses lignin biosynthesis and confers novel metabolic capability in Arabidopsis. Plant Cell 2012, 24, 3135–3152. [Google Scholar] [CrossRef] [Green Version]
- Zhao, Q.; Nakashima, J.; Chen, F.; Yin, Y.; Fu, C.; Yun, J.; Shao, H.; Wang, X.; Wang, Z.-Y.; Dixon, R.A. LACCASE is necessary and nonredundant with PEROXIDASE for lignin polymerization during vascular development in Arabidopsis. Plant Cell 2013, 25, 3976–3987. [Google Scholar] [CrossRef] [Green Version]
- Alejandro, S.; Lee, Y.; Tohge, T.; Sudre, D.; Osorio, S.; Park, J.; Bovet, L.; Lee, Y.; Geldner, N.; Fernie, A.R.; et al. AtABCG29 is a monolignol transporter involved in lignin biosynthesis. Curr. Biol. 2012, 22, 1207–1212. [Google Scholar] [CrossRef] [Green Version]
- Liu, H.; Guo, Z.; Gu, F.; Ke, S.; Sun, D.; Dong, S.; Liu, W.; Huang, M.; Xiao, W.; Yang, G.; et al. 4-Coumarate-CoA ligase-like gene OsAAE3 negatively mediates the rice blast resistance, floret development and lignin biosynthesis. Front. Plant Sci. 2017, 7, 2041. [Google Scholar] [CrossRef] [PubMed] [Green Version]
- Wagner, A.; Tobimatsu, Y.; Phillips, L.; Flint, H.; Geddes, B.; Lu, F.; Ralph, J. Syringyl lignin production in conifers: Proof of concept in a Pine tracheary element system. Proc. Natl. Acad. Sci. USA 2015, 112, 6218–6223. [Google Scholar] [CrossRef] [PubMed] [Green Version]
- Yang, Q.; He, Y.; Kabahuma, M.; Chaya, T.; Kelly, A.; Borrego, E.; Bian, Y.; El Kasmi, F.; Yang, L.; Teixeira, P.; et al. A gene encoding maize caffeoyl-CoA O-methyltransferase confers quantitative resistance to multiple pathogens. Nat. Genet. 2017, 49, 1364–1372. [Google Scholar] [CrossRef] [PubMed]
- Eloy, N.B.; Voorend, W.; Lan, W.; Saleme, M.D.L.S.; Cesarino, I.; Vanholme, R.; Smith, R.A.; Goeminne, G.; Pallidis, A.; Morreel, K.; et al. Silencing CHALCONE SYNTHASE in Maize impedes the incorporation of tricin into lignin and increases lignin content. Plant Physiol. 2017, 173, 998–1016. [Google Scholar] [CrossRef] [PubMed] [Green Version]
- Guo, H.; Wang, Y.; Wang, L.; Hu, P.; Wang, Y.; Jia, Y.; Zhang, C.; Zhang, Y.; Zhang, Y.; Wang, C.; et al. Expression of the MYB transcription factor gene BplMYB46 affects abiotic stress tolerance and secondary cell wall deposition in Betula platyphylla. Plant Biotechnol. J. 2017, 15, 107–121. [Google Scholar] [CrossRef]
- Li, H.; Yang, Y.; Wang, Z.; Guo, X.; Liu, F.; Jiang, J.; Liu, G. BpMADS12 gene role in lignin biosynthesis of Betula platyphylla Suk by transcriptome analysis. J. For. Res. 2016, 27, 1111–1120. [Google Scholar] [CrossRef]
- Acker, R.V.; Déjardin, A.; Desmet, S.; Hoengenaert, L.; Vanholme, R.; Morreel, K.; Laurans, F.; Kim, H.; Santoro, N.; Foster, C.; et al. Different routes for conifer- and sinapaldehyde and higher saccharification upon deficiency in the dehydrogenase CAD1. Plant Physiol. 2017, 175, 1018–1039. [Google Scholar] [CrossRef]
- Liu, L.; Qu, C.; Wittkop, B.; Yi, B.; Xiao, Y.; He, Y.; Snowdon, R.J.; Li, J. A high-density SNP map for accurate mapping of seed fibre QTL in Brassica napus L. PLoS ONE 2013, 8, e83052. [Google Scholar] [CrossRef]
- Behnke, N.; Suprianto, E.; Möllers, C. A major QTL on chromosome C05 significantly reduces acid detergent lignin (ADL) content and increases seed oil and protein content in oilseed rape (Brassica napus L.). Theor. Appl. Genet. 2018, 131, 2477–2492. [Google Scholar] [CrossRef]
- Liu, L.; Stein, A.; Wittkop, B.; Sarvari, P.; Li, J.; Yan, X.; Dreyer, F.; Frauen, M.; Friedt, W.; Snowdon, R.J. A knockout mutation in the lignin biosynthesis gene CCR1 explains a major QTL for acid detergent lignin content in Brassica napus seeds. Theor. Appl. Genet. 2012, 124, 1573–1586. [Google Scholar] [CrossRef]
- Li, H.; Cheng, X.; Zhang, L.; Hu, J.; Zhang, F.; Chen, B.; Xu, K.; Gao, G.; Li, H.; Li, L.; et al. An integration of genome-wide association study and gene co-expression network analysis identifies candidate genes of stem lodging-related traits in brassica napus. Front. Plant Sci. 2018, 9, 796. [Google Scholar] [CrossRef] [PubMed]
- Hai, L.; Guo, H.; Xiao, S.; Jiang, G.; Zhang, X.; Yan, C.; Xin, Z.; Jia, J. Quantitative trait loci (QTL) of stem strength and related traits in a doubled-haploid population of wheat (Triticum aestivum L.). Euphytica 2005, 141, 1–9. [Google Scholar] [CrossRef]
- Wang, J.; Zhu, J.; Huang, R.; Yang, Y.S. Investigation of cell wall composition related to stem lodging resistance in wheat (Triticum aestivum L.) by FTIR spectroscopy. Plant Signal. Behav. 2012, 7, 856–863. [Google Scholar] [CrossRef] [Green Version]
- Ma, Q.H. The expression of caffeic acid 3-O-methyltransferase in two wheat genotypes differing in lodging resistance. J. Exp. Bot. 2009, 60, 2763–2771. [Google Scholar] [CrossRef] [PubMed] [Green Version]
- Miller, C.N.; Harper, A.L.; Trick, M.; Werner, P.; Waldron, K.; Bancroft, I. Elucidation of the genetic basis of variation for stem strength characteristics in bread wheat by Associative Transcriptomics. BMC Genom. 2016, 17, 500. [Google Scholar] [CrossRef] [PubMed] [Green Version]
- Begović, L.; Abičić, I.; Lalić, A.; Lepeduš, H.; Cesar, V.; Leljak-Levanić, D. Lignin synthesis and accumulation in barley cultivars differing in their resistance to lodging. Plant Physiol. Biochem. 2018, 133, 142–148. [Google Scholar] [CrossRef]
- Long, W.; Dan, D.; Yuan, Z.; Chen, Y.; Jin, J.; Yang, W.; Zhang, Z.; Li, N.; Li, S. Deciphering the genetic basis of lodging resistance in wild rice oryza longistaminata. Front. Plant Sci. 2020, 11, 628. [Google Scholar] [CrossRef]
- Liu, X.; Hu, X.; Li, K.; Liu, Z.; Wu, Y.; Wang, H.; Huang, C. Genetic mapping and genomic selection for maize stalk strength. BMC Plant Biol. 2020, 20, 196. [Google Scholar] [CrossRef]
- Hu, H.; Liu, W.; Fu, Z.; Homann, L.; Technow, F.; Wang, H.; Song, C.; Li, S.; Melchinger, A.E.; Chen, S. QTL mapping of stalk bending strength in a recombinant inbred line maize population. Theor. Appl. Genet. 2013, 126, 2257–2266. [Google Scholar] [CrossRef]
- Peiffer, J.A.; Flint-Garcia, S.A.; De Leon, N.; McMullen, M.D.; Kaeppler, S.M.; Buckler, E.S. The genetic architecture of maize stalk strength. PLoS ONE 2013, 8, e67066. [Google Scholar] [CrossRef] [Green Version]
- Liu, W.; Zou, J.; Zhang, J.; Yang, F.; Wan, Y.; Yang, W. Evaluation of soybean (Glycine max) stem vining in maize-soybean relay strip intercropping system. Plant Prod. Sci. 2015, 18, 69–75. [Google Scholar] [CrossRef] [Green Version]
- Chen, H.; Shan, Z.; Sha, A.; Wu, B.; Yang, Z.; Chen, S.; Zhou, R.; Zhou, X. Quantitative trait loci analysis of stem strength and related traits in soybean. Euphytica 2011, 179, 485–497. [Google Scholar] [CrossRef]
- Wu, J.; Cai, G.; Tu, J.; Li, L.; Liu, S.; Luo, X.; Zhou, L.; Fan, C.; Zhou, Y. Identification of QTLs for resistance to Sclerotinia stem rot and BnaC.IGMT5.a as a candidate gene of the major resistant QTL SRC6 in Brassica napus. PLoS ONE 2013, 8, e67740. [Google Scholar] [CrossRef] [PubMed] [Green Version]
- Höch, K.; Koopmann, B.; Tiedemann, A.V. Lignin composition and timing of cell wall lignification are involved in Brassica napus resistance to stem rot caused by Sclerotinia sclerotiorum. Phytopathology 2021, 111, 1438–1448. [Google Scholar] [CrossRef]
- Chalhoub, B.; Denoeud, F.; Liu, S.; Parkin, I.A.P.; Tang, H.; Wang, X.; Chiquet, J.; Belcram, H.; Tong, C.; Samans, B.; et al. Early allopolyploid evolution in the post-Neolithic Brassica napus oilseed genome. Science 2014, 345, 950–953. [Google Scholar] [CrossRef] [Green Version]
- Kendall, S.L.; Holmes, H.; White, C.A.; Clarke, S.M.; Berry, P.M. Quantifying lodging-induced yield losses in oilseed rape. Field Crop. Res. 2017, 211, 106–113. [Google Scholar] [CrossRef]
- Shen, Y.; Xiang, Y.; Xu, E.; Ge, X.; Li, Z. Major co-localized QTL for plant height, branch initiation height, stem diameter, and flowering time in an alien introgression derived Brassica napus DH population. Front. Plant Sci. 2018, 9, 390. [Google Scholar] [CrossRef] [Green Version]
- Jin, S.; Chen, H. Near-infrared analysis of the chemical composition of rice straw. Ind. Crop. Prod. 2007, 26, 207–211. [Google Scholar] [CrossRef]
- Hayes, D.J.M. Development of near infrared spectroscopy models for the quantitative prediction of the lignocellulosic components of wet Miscanthus samples. Bioresour. Technol. 2012, 119, 393–405. [Google Scholar] [CrossRef]
- Shen, Y.; Yang, Y.; Xu, E.; Ge, X.; Xiang, Y.; Li, Z. Novel and major QTL for branch angle detected by using DH population from an exotic introgression in rapeseed (Brassica napus L.). Theor. Appl. Genet. 2018, 131, 67–78. [Google Scholar] [CrossRef]
- Li, J.; Zhao, Z.; Hayward, A.; Cheng, H.; Fu, D. Integration analysis of quantitative trait loci for resistance to Sclerotinia sclerotiorum in Brassica napus. Euphytica 2015, 205, 483–489. [Google Scholar] [CrossRef]
- Wu, J.; Zhao, Q.; Liu, S.; Shahid, M.; Lan, L.; Cai, G.; Zhang, C.; Fan, C.; Wang, Y.; Zhou, Y. Genome-wide association study identifies new loci for resistance to sclerotinia stem rot in Brassica napus. Front. Plant Sci. 2016, 7, 1418. [Google Scholar] [CrossRef] [PubMed] [Green Version]
- Wei, L.; Jian, H.; Lu, K.; Filardo, F.; Yin, N.; Liu, L.; Qu, C.; Li, W.; Du, H.; Li, J. Genome-wide association analysis and differential expression analysis of resistance to Sclerotinia stem rot in Brassica napus. Plant Biotechnol. J. 2016, 14, 1368–1380. [Google Scholar] [CrossRef] [PubMed] [Green Version]
- Zhang, F.; Huang, J.; Tang, M.; Cheng, X.; Liu, Y.; Tong, C.; Yu, J.; Sadia, T.; Dong, C.; Liu, L.; et al. Syntenic quantitative trait loci and genomic divergence for Sclerotinia resistance and flowering time in Brassica napus. J. Integr. Plant Biol. 2019, 61, 75–88. [Google Scholar] [CrossRef] [PubMed] [Green Version]
- Hossain, Z.; Amyot, L.; McGarvey, B.; Gruber, M.; Jung, J.; Hannoufa, A. The translation elongation factor eEF-1Bβ1 is involved in cell wall biosynthesis and plant development in Arabidopsis thaliana. PLoS ONE 2012, 7, e30425. [Google Scholar] [CrossRef] [PubMed] [Green Version]
- Ohtani, M.; Ramachandran, V.; Tokumoto, T.; Takebayashi, A.; Ihara, A.; Matsumoto, T.; Hiroyama, R.; Nishikubo, N.; Demura, T. Identification of novel factors that increase enzymatic saccharification efficiency in Arabidopsis wood cells. Plant Biotechnol. 2017, 34, 203–206. [Google Scholar] [CrossRef] [Green Version]
- Chen, H.-F.; Wang, H.; Li, Z.-Y. Production and genetic analysis of partial hybrids in intertribal crosses between Brassica species (B. rapa, B. napus) and Capsella bursa-pastoris. Plant Cell Rep. 2007, 26, 1791–1800. [Google Scholar] [CrossRef]
- Okuzaki, A.; Ogawa, T.; Koizuka, C.; Kaneko, K.; Inaba, M.; Imamura, J.; Koizuka, N. CRISPR/Cas9-mediated genome editing of the fatty acid desaturase 2 gene in Brassica napus. Plant Physiol. Biochem. 2018, 131, 63–69. [Google Scholar] [CrossRef]
- Zhao, J.; Buchwaldt, L.; Rimmer, S.R.; Sharpe, A.; McGregor, L.; Bekkaoui, D.; Hegedus, D. Patterns of differential gene expression in Brassica napus cultivars infected with Sclerotinia sclerotiorum. Mol. Plant Pathol. 2009, 10, 635–649. [Google Scholar] [CrossRef]
- Zhang, K.; Qian, Q.; Huang, Z.; Wang, Y.; Li, M.; Hong, L.; Zeng, D.; Gu, M.; Chu, C.; Cheng, Z. GOLD HULL AND INTERNODE2 encodes a primarily multifunctional cinnamyl-alcohol dehydrogenase in rice. Plant Physiol. 2006, 140, 972–983. [Google Scholar] [CrossRef] [Green Version]
- Chapple, C.C.S.; Vogt, T.; Ellis, B.E.; Somerville, C.R. An arabidopsis mutant defective in the general phenylpropanoid pathway. Plant Cell 1992, 4, 1413–1424. [Google Scholar] [PubMed]
- Mei, J.; Qian, L.; Disi, J.O.; Yang, X.; Li, Q.; Li, J.; Frauen, M.; Cai, D.; Qian, W. Identification of resistant sources against Sclerotinia sclerotiorum in Brassica species with emphasis on B. oleracea. Euphytica 2011, 177, 393–399. [Google Scholar] [CrossRef]
- Mei, J.; Ding, Y.; Lu, K.; Wei, D.; Liu, Y.; Disi, J.O.; Li, J.; Liu, L.; Liu, S.; McKay, J.; et al. Identification of genomic regions involved in resistance against Sclerotinia sclerotiorum from wild Brassica oleracea. Theor. Appl. Genet. 2013, 126, 549–556. [Google Scholar] [CrossRef] [PubMed]
- Meng, L.; Li, H.; Zhang, L.; Wang, J. QTL IciMapping: Integrated software for genetic linkage map construction and quantitative trait locus mapping in biparental populations. Crop J. 2015, 3, 269–283. [Google Scholar] [CrossRef] [Green Version]
- Wang, J. Inclusive composite interval mapping of quantitative trait genes. Acta Agron. Sin. 2009, 35, 239–245. [Google Scholar] [CrossRef] [Green Version]
- Shi, J.; Li, R.; Qiu, D.; Jiang, C.; Long, Y.; Morgan, C.; Bancroft, I.; Zhao, J.; Meng, J. Unraveling the complex trait of crop yield with quantitative trait loci mapping in Brassica napus. Genetics 2009, 182, 851–861. [Google Scholar] [CrossRef] [Green Version]
- Sosnowski, O.; Charcosset, A.; Joets, J. BioMercator V3: An upgrade of genetic map compilation and quantitative trait loci meta-analysis algorithms. Bioinformatics 2012, 28, 2082–2083. [Google Scholar] [CrossRef] [Green Version]


| Trait | Environment | Parent Y689 | Parent Westar a | DH Lines Range | Mean ± SD | Skewness | Kurtosis | Heritability |
|---|---|---|---|---|---|---|---|---|
| ADL | 14WH | 11.68 ± 1.21 | 10.91 ± 1.53 * | 8.31–13.83 | 10.98 ± 1.07 | −0.18 | −0.25 | 0.66 |
| 14ND | 12.61 ± 1.23 | 11.67 ± 2.53 | 6.66–14.43 | 11.28 ± 1.42 | −0.29 | 0.17 | ||
| 15WH | 13.23 ± 1.46 | 12.55 ± 1.52 ** | 10.25–14.88 | 12.62 ± 0.90 | 0.09 | −0.21 | ||
| 15ER | 12.69 ± 1.32 | 11.71 ± 1.35 *** | 9.10–15.34 | 11.75 ± 1.08 | 0.28 | 0.23 | ||
| Cel | 14WH | 38.49 ± 1.85 | 36.88 ± 1.23 ** | 33.37–42.63 | 37.88 ± 1.71 | −0.16 | −0.18 | 0.79 |
| 14ND | 46.51 ± 1.64 | 41.87 ± 1.45 | 38.98–48.61 | 43.95 ± 1.65 | −0.28 | 0.39 | ||
| 15WH | 46.09 ± 1.92 | 44.02 ± 1.63 * | 39.86–49.68 | 45.20 ± 1.77 | −0.10 | 0.29 | ||
| 15ER | 45.38 ± 2.03 | 42.81 ± 2.05 | 37.55–50.26 | 43.68 ± 2.34 | −0.14 | 0.27 | ||
| Hem | 14WH | 18.58 ± 1.23 | 17.07 ± 1.36 ** | 16.42–23.04 | 20.00 ± 1.29 | −0.21 | −0.17 | 0.81 |
| 14ND | 20.38 ± 1.32 | 19.93 ± 1.23 * | 14.10–20.06 | 17.85 ± 1.11 | −0.50 | 0.34 | ||
| 15WH | 19.32 ± 1.54 | 14.71 ± 1.87 *** | 13.42–20.69 | 17.31 ± 1.33 | −0.14 | 0.40 | ||
| 15ER | 16.57 ± 1.36 | 15.43 ± 1.65 | 13.42–19.95 | 16.62 ± 1.30 | −0.06 | −0.42 | ||
| SG | 14WH | 1.28 ± 0.12 | 1.18 ± 0.26 * | 0.84–1.75 | 1.23 ± 0.18 | 0.24 | −0.16 | 0.56 |
| 14ND | 1.39 ± 0.11 | 1.21 ± 0.15 | 0.85–1.63 | 1.24 ± 0.14 | −0.17 | −0.13 | ||
| 15WH | 1.15 ± 0.13 | 1.05 ± 0.16 * | 0.73–1.32 | 1.01 ± 0.10 | 0.25 | 0.08 | ||
| 15ER | 1.34 ± 0.14 | 1.11 ± 0.24 | 0.69–1.69 | 1.20 ± 0.16 | 0.06 | 0.66 | ||
| BF | 14WH | 110.31 ± 21.50 | 59.68 ± 25.30 *** | 10.87–166.95 | 73.04 ± 30.11 | 0.63 | 0.23 | 0.68 |
| 14ND | 141.43 ± 22.30 | 65.65 ± 32.01 *** | 23.15–180.30 | 84.11 ± 33.22 | 0.58 | 0.12 | ||
| 15WH | 156.48 ± 29.65 | 82.79 ± 24.56 *** | 14.14–227.43 | 74.21 ± 34.97 | 1.40 | 3.24 | ||
| 15ER | 144.56 ± 31.24 | 87.95 ± 23.15 *** | 10.12–174.03 | 69.07 ± 30.71 | 0.96 | 0.72 | ||
| F | 14WH | 1.33 ± 0.24 | 0.66 ± 0.32 *** | 0.43–1.70 | 0.97 ± 0.25 | 0.45 | 0.15 | 0.56 |
| 14ND | 0.84 ± 0.13 | 0.59 ± 0.06 *** | 0.31–1.10 | 0.60 ± 0.13 | 0.30 | 0.33 | ||
| 15WH | 1.97 ± 0.56 | 1.06 ± 0.21 *** | 0.44–2.36 | 1.06 ± 0.31 | 1.20 | 3.22 | ||
| 15ER | 1.38 ± 0.47 | 1.15 ± 0.54 *** | 0.46–1.56 | 0.87 ± 0.23 | 0.79 | 0.34 | ||
| SSR | 14WH | 2.54 ± 1.23 | 5.86 ± 1.36 *** | 1.18–6.80 | 4.03 ± 1.14 | 0.19 | −0.55 | 0.62 |
| 15WH | 1.87 ± 2.35 | 8.56 ± 1.54 *** | 1.00–9.94 | 4.02 ± 2.25 | 0.64 | −0.45 |
| Trait | Consensus QTL | Identified QTL | ||||||||||
|---|---|---|---|---|---|---|---|---|---|---|---|---|
| QTL a | Chr. b | Peak | CI c | PI (kb) d | QTL | LOD e | Peak | CI | Add. | R2 (%) f | Env. g | |
| ADL | cqADL.A01-1 | A01 | 25 | 23.5–25.5 | 3928–4027 | qADL.A01-1 | 4.02 | 25 | 23.5–25.5 | 0.12 | 6.87 | BLUE |
| cqADL.A09-1 | A09 | 48.49 | 47.43–49.56 | 5038–6244 | qADL.A09-1 | 6.01 | 48 | 47.5–50.5 | 0.34 | 14.27 | 15WH | |
| qADL.A09-2 | 3.65 | 49 | 47.5–50.5 | 0.30 | 9.40 | 14WH | ||||||
| cqADL.A09-2 | A09 | 61 | 60.5–61.5 | 9254–10,122 | qADL.A09-3 | 3.31 | 61 | 60.5–61.5 | 0.09 | 5.58 | BLUE | |
| cqADL.C03-1 | C03 | 12.99 | 10.96–15.03 | 1378–2930 | qADL.C03-1 | 4.16 | 13 | 6.5–13.5 | −0.27 | 9.15 | 15WH | |
| qADL.C03-2 | 5.11 | 13 | 8.5–13.5 | −0.38 | 12.77 | 15ER | ||||||
| cqADL.C03-2 | C03 | 58 | 57.5–58.5 | 21,514–21,931 | qADL.C03-3 | 6.04 | 58 | 57.5–58.5 | −0.12 | 10.57 | BLUE | |
| cqADL.C09-1 | C09 | 47 | 46.5–47.5 | 32,543–34,424 | qADL.C09-1 | 3.64 | 47 | 46.5–47.5 | 0.31 | 9.26 | 14WH | |
| cqADL.C09-2 | C09 | 102 | 100.5–102.5 | 43,321–43,705 | qADL.C09-2 | 5.78 | 102 | 100.5–102.5 | 0.12 | 10.48 | BLUE | |
| cqADL.C09-3 | C09 | 123 | 118.5–123.5 | 45,206–45,833 | qADL.C09-3 | 5.21 | 123 | 118.5–123.5 | 0.58 | 16.57 | 14ND | |
| cqADL.C09-4 | C09 | 129 | 124.5–129.5 | 45,832–46,749 | qADL.C09-4 | 3.15 | 129 | 124.5–129.5 | 0.30 | 7.69 | 15ER | |
| Cel | cqCel.A08-1 | A08 | 9 | 7.5–9.5 | 12,328–13,217 | qCel.A08-1 | 5.08 | 9 | 7.5–9.5 | −0.26 | 7.63 | BLUE |
| cqCel.A10-1 | A10 | 115 | 113.5–115.5 | 14,613–14,735 | qCel.A10-1 | 3.35 | 115 | 113.5–115.5 | −0.21 | 4.85 | BLUE | |
| cqCel.C02-1 | C02 | 161 | 154.5–164 | 43,090–45,788 | qCel.C02-1 | 3.38 | 161 | 154.5–164 | −0.21 | 5.13 | BLUE | |
| cqCel.C04-1 | C04 | 0 | 0–0.5 | 0–369 | qCel.C04-1 | 3.22 | 0 | 0–0.5 | −0.69 | 10.01 | 15ER | |
| cqCel.C06-1 | C06 | 67 | 66.29–67.7 | 19,870–20,407 | qCel.C06-1 | 4.69 | 67 | 66.5–68.5 | −0.66 | 12.09 | 15WH | |
| qCel.C06-2 | 5.95 | 67 | 66.5–68.5 | −0.31 | 8.91 | BLUE | ||||||
| cqCel.C06-2 | C06 | 73 | 72.5–77.5 | 28,297–33,676 | qCel.C06-3 | 3.68 | 73 | 72.5–77.5 | −0.52 | 9.28 | 14WH | |
| cqCel.C09-1 | C09 | 118 | 112.5–118.5 | 44,583–45,206 | qCel.C09-1 | 3.35 | 118 | 112.5–118.5 | 0.46 | 8.39 | 14WH | |
| cqCel.C09-2 | C09 | 123 | 118.5–123.5 | 45,206–45,833 | qCel.C09-2 | 4.82 | 123 | 118.5–123.5 | 0.26 | 7.21 | BLUE | |
| Hem | cqHem.A01-1 | A01 | 13 | 12.5–13.5 | 2254–2401 | qHem.A01-1 | 6.73 | 13 | 12.5–13.5 | −0.28 | 10.62 | BLUE |
| cqHem.A03-1 | A03 | 47 | 45.5–47.5 | 5031–5777 | qHem.A03-1 | 3.67 | 47 | 45.5–47.5 | 0.38 | 8.80 | 14WH | |
| cqHem.A07-1 | A07 | 120 | 119.64–120.35 | 18,917–19,528 | qHem.A07-1 | 5.26 | 120 | 119.5–120.5 | −0.50 | 12.96 | 14WH | |
| qHem.A07-2 | 7.84 | 120 | 119.5–120.5 | −0.24 | 12.82 | BLUE | ||||||
| cqHem.A09-1 | A09 | 55 | 51.5–59.5 | 6244–9008 | qHem.A09-1 | 3.73 | 55 | 51.5–59.5 | −0.15 | 6.13 | BLUE | |
| SG | cqSG.A03-1 | A03 | 45 | 44.5–45.5 | 4872–5163 | qSG.A03-1 | 3.77 | 45 | 44.5–45.5 | −0.04 | 5.65 | 14ND |
| cqSG.A06-1 | A06 | 34 | 30.5–34.5 | 3231–3733 | qSG.A06-1 | 3.54 | 34 | 30.5–34.5 | 0.02 | 4.40 | BLUE | |
| cqSG.A07-1 | A07 | 113 | 112.5–113.5 | 15,704–15,964 | qSG.A07-1 | 15.06 | 113 | 112.5–113.5 | 0.10 | 27.18 | 14ND | |
| cqSG.C01-1 | C01 | 103 | 98.5–104.5 | 34,527–36,893 | qSG.C01-1 | 3.73 | 103 | 98.5–104.5 | 0.02 | 4.64 | BLUE | |
| cqSG.C02-1 | C02 | 34 | 33.5–34.5 | 3320–7926 | qSG.C02-1 | 3.24 | 34 | 33.5–34.5 | −0.05 | 7.98 | 14WH | |
| cqSG.C03-1 | C03 | 4 | 3.5–6.5 | 988–1378 | qSG.C03-1 | 5.84 | 4 | 3.5–6.5 | −0.03 | 7.51 | BLUE | |
| cqSG.C06-1 | C06 | 69 | 68.5–69.5 | 20,407–22,987 | qSG.C06-1 | 9.71 | 69 | 68.5–69.5 | 0.04 | 12.93 | BLUE | |
| cqSG.C06-2 | C06 | 73 | 72.5–77.5 | 28,297–33,676 | qSG.C06-2 | 3.58 | 73 | 72.5–77.5 | −0.04 | 5.33 | 14ND | |
| BF | cqBF.A06-1 | A06 | 129 | 127.5–129.5 | 23,209–23,617 | qBF.A06-1 | 3.59 | 129 | 127.5–129.5 | 9.33 | 8.24 | 15WH |
| cqBF.A07-1 | A07 | 113 | 111.5–113.5 | 15,774–15,964 | qBF.A07-1 | 5.13 | 113 | 111.5–113.5 | 12.22 | 11.97 | 15WH | |
| cqBF.A07-2 | A07 | 120 | 119.64–120.35 | 18,917–19,528 | qBF.A07-2 | 6.51 | 120 | 119.5–120.5 | 13.84 | 16.65 | 14WH | |
| qBF.A07-3 | 5.16 | 120 | 119.5–120.5 | 12.96 | 13.13 | 15ER | ||||||
| cqBF.A07-3 | A07 | 122 | 120.5–122 | 19,528–19,664 | qBF.A07-4 | 6.79 | 122 | 120.5–122 | 5.99 | 14.34 | BLUE | |
| cqBF.A10-1 | A10 | 134 | 132.5–134.5 | 15,279–15,420 | qBF.A10-1 | 3.27 | 134 | 132.5–134.5 | 3.76 | 6.25 | BLUE | |
| cqBF.C03-1 | C03 | 13 | 6.5–13.5 | 1378–2930 | qBF.C03-1 | 3.66 | 13 | 6.5–13.5 | −3.95 | 6.89 | BLUE | |
| F | cqF.A06-1 | A06 | 34 | 30.5–34.5 | 3231–3733 | qF.A06-1 | 3.54 | 34 | 30.5–34.5 | 0.02 | 4.40 | BLUE |
| cqF.A06-2 | A06 | 129 | 128.29–129.7 | 23,209–23,617 | qF.A06-2 | 3.43 | 129 | 127.5–129.5 | 0.07 | 8.05 | 14WH | |
| qF.A06-3 | 4.45 | 129 | 127.5–129.5 | 0.08 | 1.92 | 15WH | ||||||
| cqF.A07-1 | A07 | 11 | 10.5–11.5 | 1806–1818 | qF.A07-1 | 4.64 | 11 | 10.5–11.5 | −0.04 | 7.56 | 14ND | |
| cqF.A07-2 | A07 | 52 | 50.5–53.5 | 8499–6330 | qF.A07-2 | 5.32 | 52 | 50.5–53.5 | −0.09 | 2.34 | 15WH | |
| cqF.C01-1 | C01 | 102.7 | 100.7–104.65 | 32,292–35,693 | qF.C01-1 | 5.71 | 102 | 96.5–103.5 | 0.09 | 2.52 | 15WH | |
| qF.C01-2 | 3.98 | 103 | 96.5–104.5 | 0.07 | 9.39 | 14WH | ||||||
| qF.C01-3 | 3.73 | 103 | 98.5–104.5 | 0.02 | 4.64 | BLUE | ||||||
| cqF.C03-1 | C03 | 4 | 2.93–5.06 | 988–1378 | qF.C03-1 | 4.45 | 4 | 3.5–6.5 | −0.08 | 1.92 | 15WH | |
| qF.C03-2 | 5.84 | 4 | 3.5–6.5 | −0.03 | 7.51 | BLUE | ||||||
| cqF.C06-1 | C06 | 57 | 53.5–57.5 | 15,950–17,544 | qF.C06-1 | 4.83 | 57 | 53.5–57.5 | 0.09 | 2.13 | 15WH | |
| cqF.C06-2 | C06 | 69 | 68.71–69.28 | 20,407–22,987 | qF.C06-2 | 3.26 | 69 | 68.5–69.5 | 0.07 | 7.61 | 14WH | |
| qF.C06-3 | 4.19 | 69 | 68.5–69.5 | 0.08 | 10.76 | 15ER | ||||||
| qF.C06-4 | 9.71 | 69 | 68.5–69.5 | 0.04 | 12.93 | BLUE | ||||||
| cqF.C09-1 | C09 | 21 | 15.5–21.5 | 8185–11,082 | qF.C09-1 | 3.68 | 21 | 15.5–21.5 | −0.07 | 9.51 | 15ER | |
| cqF.C09-2 | C09 | 45 | 42.5–45.5 | 30,708–31,732 | qF.C09-2 | 4.06 | 45 | 42.5–45.5 | −0.04 | 6.67 | 14ND | |
| SSR | cqSSR.A03-1 | A03 | 103 | 101.5–103.5 | 17,026–17,802 | qSSR.A03-1 | 3.33 | 103 | 101.5–103.5 | −0.15 | 5.43 | BLUE |
| cqSSR.A05-1 | A05 | 83 | 80.5–84.5 | 20,644–20,666 | qSSR.A05-1 | 4.56 | 83 | 80.5–84.5 | 0.28 | 7.04 | 14WH | |
| cqSSR.A09-1 | A09 | 149 | 148.5–149 | 32,939–33,464 | qSSR.A09-1 | 4.37 | 149 | 148.5–149 | 0.17 | 7.18 | BLUE | |
| cqSSR.C01-1 | C01 | 80 | 73.5–80.5 | 13,067–28,388 | qSSR.C01-1 | 5.65 | 80 | 73.5–80.5 | −0.31 | 8.77 | 14WH | |
| cqSSR.C02-1 | C02 | 65 | 53.5–65.5 | 1896–5009 | qSSR.C02-1 | 3.64 | 65 | 53.5–65.5 | −0.17 | 5.97 | BLUE | |
| cqSSR.C06-1 | C06 | 58 | 57.5–58.5 | 17,544–17,599 | qSSR.C06-1 | 3.24 | 58 | 57.5–58.5 | −0.26 | 4.91 | 14WH | |
| cqSSR.C07-1 | C07 | 50 | 49.5–50.5 | 33,958–34,672 | qSSR.C07-1 | 3.84 | 50 | 49.5–50.5 | 0.16 | 6.39 | BLUE | |
| cqSSR.C07-2 | C07 | 82 | 81.5–82.5 | 40,805–40,986 | qSSR.C07-2 | 3.72 | 82 | 81.5–82.5 | 0.25 | 5.63 | 14WH | |
| cqSSR.C09-1 | C09 | 118 | 116.79–119.19 | 44,590–45,206 | qSSR.C09-1 | 7.40 | 118 | 114.5–118.5 | 0.23 | 12.64 | BLUE | |
| qSSR.C09-2 | 5.05 | 118 | 115.5–118.5 | 0.65 | 14.26 | 15WH | ||||||
| cqSSR.C09-2 | C09 | 122 | 119.5–123.5 | 45,206–45,833 | qSSR.C09-3 | 9.93 | 122 | 119.5–123.5 | 0.44 | 17.11 | 14WH | |
| Unique QTL | Consensus QTL | ||||||
|---|---|---|---|---|---|---|---|
| Chr. a | Peak | CI b | Trait | Peak | CI | ||
| uqA06-1 | A06 | 34 | 32.58–35.41 | cqSG.A06-1 | SG | 34 | 30.5–34.5 |
| cqF.A06-1 | F | 34 | 30.5–34.5 | ||||
| uqA06-2 | A06 | 129 | 128.42–129.57 | cqBF.A06-1 | BF | 129 | 127.5–129.5 |
| cqF.A06-2 | F | 129 | 128.29–129.7 | ||||
| uqA07-1 | A07 | 113 | 112.55–113.44 | cqBF.A07-1 | BF | 113 | 111.5–113.5 |
| cqSG.A07-1 | SG | 113 | 112.5–113.5 | ||||
| uqA07-2 | A07 | 120 | 119.74–120.25 | cqHem.A07-1 | Hem | 120 | 119.64–120.35 |
| cqBF.A07-2 | BF | 120 | 119.64–120.35 | ||||
| uqC01-1 | C01 | 102.77 | 101.12–104.42 | cqSG.C01-1 | SG | 103 | 98.5–104.5 |
| cqF.C01-1 | F | 102.68 | 100.7–104.65 | ||||
| uqC03-1 | C03 | 4 | 3.13–4.86 | cqF.C03-1 | F | 4 | 2.93–5.06 |
| cqSG.C03-1 | SG | 4 | 3.5–6.5 | ||||
| uqC03-2 | C03 | 12.99 | 11.23–14.75 | cqBF.C03-1 | BF | 13 | 6.5–13.5 |
| cqADL.C03-1 | ADL | 12.99 | 10.96–15.03 | ||||
| uqC06-1 | C06 | 69 | 68.75–69.24 | cqSG.C06-1 | SG | 69 | 68.5–69.5 |
| cqF.C06-2 | F | 69 | 68.71–69.28 | ||||
| uqC06-2 | C06 | 73 | 71.23–74.76 | cqCel.C06-2 | Cel | 73 | 72.5–77.5 |
| cqSG.C06-2 | SG | 73 | 72.5–77.5 | ||||
| uqC09-1 | C09 | 118 | 116.88–119.11 | cqCel.C09-1 | Cel | 118 | 112.5–118.5 |
| cqSSR.C09-1 | SSR | 118 | 116.79–119.19 | ||||
| uqC09-2 | C09 | 122.56 | 121.23–123.88 | cqADL.C09-3 | ADL | 123 | 118.5–123.5 |
| cqCel.C09-2 | Cel | 123 | 118.5–123.5 | ||||
| cqSSR.C09-2 | SSR | 122 | 119.5–123.5 | ||||
| Trait | Combined QTL a | Chr. b | Pos. c | CI d | LOD e | LOD | LOD | PVE h | PVE | PVE | Add k | Consensus QTL l |
|---|---|---|---|---|---|---|---|---|---|---|---|---|
| (A) f | (AbyE) g | (A) i | (AbyE) j | |||||||||
| ADL | IqADL.A09-1 | A09 | 51 | 50.5–51.5 | 8.19 | 3.86 | 4.32 | 6.26 | 3.62 | 2.64 | 0.13 | |
| IqADL.C03-1 | C03 | 13 | 9.5–13.5 | 8.53 | 5.08 | 3.44 | 7.05 | 4.85 | 2.20 | −0.15 | cqADL.C03-1 | |
| IqADL.C03-2 | C03 | 58 | 57.5–58.5 | 5.11 | 3.99 | 1.12 | 4.57 | 3.77 | 0.80 | −0.13 | cqADL.C03-2 | |
| IqADL.C09-1 | C09 | 123 | 118.5–123.5 | 6.16 | 2.35 | 3.81 | 8.56 | 2.25 | 6.32 | 0.10 | cqADL.C09-3 | |
| Cel | IqCel.C02-1 | C02 | 162 | 156.5–164 | 6.65 | 5.13 | 1.52 | 2.49 | 1.51 | 0.98 | −0.24 | cqCel.C02-1 |
| IqCel.C06-1 | C06 | 67 | 66.5–68.5 | 5.63 | 3.18 | 2.44 | 1.87 | 1.00 | 0.87 | −0.22 | cqCel.C06-1 | |
| IqCel.C07-1 | C07 | 81 | 80.5–81.5 | 57.23 | 26.20 | 31.03 | 24.29 | 8.49 | 15.79 | 0.58 | ||
| IqCel.C07-2 | C07 | 83 | 82.5–83.5 | 48.65 | 8.31 | 40.35 | 18.45 | 2.58 | 15.87 | −0.32 | ||
| IqCel.C09-1 | C09 | 118 | 116.5–118.5 | 8.53 | 7.72 | 0.81 | 2.66 | 2.37 | 0.29 | 0.31 | cqCel.C09-1 | |
| Hem | IqHem.A01-1 | A01 | 15 | 14.5–15.5 | 6.63 | 6.01 | 0.62 | 3.42 | 3.36 | 0.06 | −0.26 | |
| IqHem.A03-1 | A03 | 47 | 45.5–47.5 | 5.77 | 4.41 | 1.36 | 3.15 | 2.47 | 0.68 | 0.16 | cqHem.A03-1 | |
| IqHem.A07-1 | A07 | 120 | 119.5–120.5 | 10.11 | 9.28 | 0.84 | 5.76 | 5.26 | 0.50 | −0.25 | cqHem.A07-1 | |
| SG | IqSG.A07-1 | A07 | 116 | 115.5–117.5 | 13.87 | 2.23 | 11.63 | 22.34 | 4.16 | 18.18 | 0.01 | |
| BF | IqBF.A07-1 | A07 | 120 | 119.5–120.5 | 9.72 | 4.59 | 5.13 | 10.09 | 5.43 | 4.65 | 4.34 | cqBF.A07-2 |
| IqBF.C03-1 | C03 | 13 | 6.5–13.5 | 5.22 | 4.86 | 0.37 | 7.04 | 6.08 | 0.96 | −4.31 | cqBF.C03-1 | |
| F | IqF.C06-1 | C06 | 69 | 68.5–69.5 | 40.70 | 18.15 | 22.55 | 23.75 | 9.61 | 14.15 | 0.07 | cqF.C06-2 |
| IqF.C06-2 | C06 | 72 | 71.5–72.5 | 26.87 | 2.32 | 24.55 | 13.36 | 1.18 | 12.18 | −0.02 | ||
| IqF.C09-1 | C09 | 21 | 16.5–21.5 | 6.62 | 4.94 | 1.68 | 2.80 | 2.45 | 0.35 | −0.03 | cqF.C09-1 | |
| SSR | IqSSR.A05-1 | A05 | 83 | 80.5–84.5 | 4.96 | 0.59 | 4.38 | 5.72 | 2.04 | 3.68 | 0.12 | cqSSR.A05-1 |
| IqSSR.C01-1 | C01 | 80 | 74.5–80.5 | 5.48 | 2.13 | 3.35 | 7.40 | 6.70 | 0.70 | −0.21 | cqSSR.C01-1 | |
| IqSSR.C06-1 | C06 | 63 | 61.5–65.5 | 4.02 | 1.33 | 2.69 | 5.08 | 4.31 | 0.78 | −0.19 | ||
| IqSSR.C09-1 | C09 | 122 | 119.5–123.5 | 10.30 | 2.08 | 8.22 | 11.94 | 6.40 | 5.54 | 0.21 | cqSSR.C09-2 |
Publisher’s Note: MDPI stays neutral with regard to jurisdictional claims in published maps and institutional affiliations. |
© 2022 by the authors. Licensee MDPI, Basel, Switzerland. This article is an open access article distributed under the terms and conditions of the Creative Commons Attribution (CC BY) license (https://creativecommons.org/licenses/by/4.0/).
Share and Cite
Shao, Y.; Shen, Y.; He, F.; Li, Z. QTL Identification for Stem Fiber, Strength and Rot Resistance in a DH Population from an Alien Introgression of Brassica napus. Plants 2022, 11, 373. https://doi.org/10.3390/plants11030373
Shao Y, Shen Y, He F, Li Z. QTL Identification for Stem Fiber, Strength and Rot Resistance in a DH Population from an Alien Introgression of Brassica napus. Plants. 2022; 11(3):373. https://doi.org/10.3390/plants11030373
Chicago/Turabian StyleShao, Yujiao, Yusen Shen, Feifei He, and Zaiyun Li. 2022. "QTL Identification for Stem Fiber, Strength and Rot Resistance in a DH Population from an Alien Introgression of Brassica napus" Plants 11, no. 3: 373. https://doi.org/10.3390/plants11030373