Article

Genome-Wide Identification and Expression Profiling of Aconitase Gene Family Members Reveals Their Roles in Plant Development and Adaptation to Diverse Stress in Triticum aestivum L.

1
Department of Genetics and Plant Breeding, Faculty of Agriculture, Sri Sri University, Cuttack 754006, India
2
Krishi Vigyan Kendra, Bikaner II, Swami Keshwanand Rajasthan Agricultural University, Bikaner 334603, India
3
ICAR-Central Institute for Arid Horticulture, Bikaner 334006, India
4
KIIT-Technology Business Incubator (KIIT-TBI), Kalinga Institute of Industrial Technology 13 (KIIT), Deemed to be University, Bhubaneswar 751024, India
5
Department of Life Science, Dongguk University, Dong-gu 10326, Republic of Korea
*
Authors to whom correspondence should be addressed.
Plants 2022, 11(24), 3475; https://doi.org/10.3390/plants11243475
Submission received: 17 November 2022 / Revised: 28 November 2022 / Accepted: 30 November 2022 / Published: 12 December 2022
(This article belongs to the Special Issue Cereal Crop Breeding)

Abstract

:
Global warming is a serious threat to food security and severely affects plant growth, developmental processes, and, eventually, crop productivity. Respiratory metabolism plays a critical role in the adaptation of diverse stress in plants. Aconitase (ACO) is the main enzyme, which catalyzes the revocable isomerization of citrate to isocitrate in the Krebs cycle. The function of ACO gene family members has been extensively studied in model plants, for instance Arabidopsis. However, their role in plant developmental processes and various stress conditions largely remained unknown in other plant species. Thus, we identified 15 ACO genes in wheat to elucidate their function in plant developmental processes and different stress environments. The phylogenetic tree revealed that TaACO genes were classified into six groups. Further, gene structure analysis of TaACOs has shown a distinctive evolutionary path. Synteny analysis showed the 84 orthologous gene pairs in Brachypodium distachyon, Aegilops tauschii, Triticum dicoccoides, Oryza sativa, and Arabidopsis thaliana. Furthermore, Ka/Ks ratio revealed that most TaACO genes experienced strong purifying selection during evolution. Numerous cis-acting regulatory elements were detected in the TaACO promoters, which play a crucial role in plant development processes, phytohormone signaling, and are related to defense and stress. To understand the function of TaACO genes, the expression profiling of TaACO genes were investigated in different tissues, developmental stages, and stress conditions. The transcript per million values of TaACOs genes were retrieved from the Wheat Expression Browser Database. We noticed the differential expression of the TaACO genes in different tissues and various stress conditions. Moreover, gene ontology analysis has shown enrichment in the tricarboxylic acid metabolic process (GO:0072350), citrate metabolic process (GO:0006101), isocitrate metabolic process GO:0006102, carbohydrate metabolic (GO:0005975), and glyoxylate metabolic process (GO:0046487). Therefore, this study provided valuable insight into the ACO gene family in wheat and contributed to the further functional characterization of TaACO during different plant development processes and various stress conditions.

1. Introduction

The Krebs cycle, or citric acid cycle, is also known as the Tricarboxylic acid (TCA) cycle [1]. The TCA cycle produces ATP in almost all living organisms, which is a vital source of energy [2]. The TCA cycle is the principal component of carbon metabolism that supplies the electrons for oxidative phosphorylation, and also acts as an intermediate for amino acid biosynthesis. Further, the TCA cycle connects glycolysis to fatty acid metabolism through the glyoxylate cycle [3]. The reversible isomerization of citrate to isocitrate is the second step of the TCA cycle, which is catalyzed by aconitase gene family members for instance, via cis-aconitate [4]. Aconitase (ACO) is also recognized as aconitate hydratase (EC 4.2.1.3), which contains an iron–sulfur protein (4Fe–4S) with a molecular weight of ~90 kDa [5,6,7]. Generally, Aconitase has two isoforms, including the mitochondrial isoform and cytosolic aconitase. The mammalian aconitases are extensively studied, which expand our understanding and knowledge about the functions and underlying mechanisms of this gene family member [8,9]. ACO1 (cytosolic aconitase) contains the AcnA_IRP domain, binds to RNA stem-loop structure, and hinders the translation of the ferritin transcript in humans [10], while ACO2 contains the AcnA_mitochondrial domain and functions in the TCA cycle.
Remarkably, all the identified aconitase genes in higher plants shared higher sequence similarity with the cytosolic aconitase, whereas animal aconitase genes have shown sequence similarity with mitochondrial isoforms [11,12,13]. Arabidopsis genome encodes the three aconitase genes and possesses the AcnA_IRP domain as human, however, no iron-responsive element-binding protein 1 (IRP1) activity was observed in the Arabidopsis [13]. All three AtACO were found in the proteome of mitochondria [14,15]. However, the ACO 1 gene localized in mitochondria and cytosol in wild species of tomato [16]. Plant aconitases have been implicated in carbon, sucrose, lipid metabolism, and the glyoxylate cycle [17,18,19]. Plant aconitases have also participated in a wide range of developmental processes, such as programmed cell death, oxidative stress, and hypersensitive response [11,12,13,20]. ACOs gene family members were only reported in some model plants including Arabidopsis, maize, soybean, sorghum, poplar, and physcomitrella [1,12,21]. However, the role of ACO gene family members largely remain unexplored in other plant species. The ACO gene family has been extensively studied in Arabidopsis [4,12]. AtACO3 regulates the stress response via phosphorylation at Ser91 that is prompted by mitochondrial dysfunction. Further, proteomic data showed phosphorylation and abundance of AtACO3 increased under stress, which required signaling via ANAC017. AtACO3 enhanced the tolerance against ultraviolet-B- and antimycin-A-stimulated mitochondrial dysfunction in Arabidopsis. These results suggest that AtACO3 is a target, and mediated signaling of mitochondrial dysfunction, which is crucial for accomplishing plants stress tolerance [22]. AtACO3 also functions in the first 3 days during germination in Arabidopsis. The expression and activities of ZmAco1 and ZMAco4 were increased in scutellum during germination in maize. The activity of mitochondrial and cytosolic forms of aconitase was highest on the fourth day of germination. However, the expression and activity of the cytosolic form suddenly declined, whereas the mitochondrial form reduced more slowly. Further, the activity of the mitochondrial form ACO was strongly inhibited by H2O2 compared to the cytosolic form. Thus, these results indicate that the mitochondrial form acts in the TCA cycle, while the cytosolic form operates in the glyoxylate [23]. Moreover, the expression of cytosolic and mitochondrial forms of aconitase is regulated by phytochrome in maize leaves [24]. Aconitase also acts as a biosensor for oxidants in plants. Oxidative stress in Arabidopsis cells, resulting in the degradation of a special type of mitochondrial protein, such as aconitase, led to the effect on respiratory functions [25]
With the recent advances in DNA sequencing technology, there has been a rapid increase sequenced in plant genomes in the past decade. However, the genes identified in plant genomes is now a great challenge for plant biologists, especially their structural and functional characterization [7,26,27,28]. The long-awaited wheat (Triticum aestivum L.) genome was recently completed and the ~124,201 gene loci were annotated [29,30]. Wheat is a globally major cereal crop and provides half of the food eaten by the world’s population [29,31,32]. India is the second-largest wheat-producing country [33]. Wheat is an important source of protein, carbohydrates, vitamins, and minerals [26,27,33]. Further, the global demand for wheat has been rising and we will need to increase wheat production to feed the ever-growing world population [34]. However, wheat production is severely affected by diverse stresses [35,36,37]. Thus, publicly available genome sequence data provide the opportunity to carry out a genome-wide analysis of the ACO gene family in wheat. Here, we identified and analyzed the ACO gene family of wheat using different computational tools. The analysis of the TaACO gene family includes phylogenetic analysis, chromosomal distribution, gene structure, synteny relationship, and protein–protein interaction. Further, the expression profiling of TaACO genes were investigated in different tissues, developmental stages, and stress conditions. The expression profile of TaACO genes revealed the differential expression pattern of the TaACO genes in different tissues and various stress conditions. Therefore, our results provide valuable information about the ACO gene family in wheat and contribute to the further characterization of ACOs during plant development and response to diverse biotic and abiotic stress.

2. Results

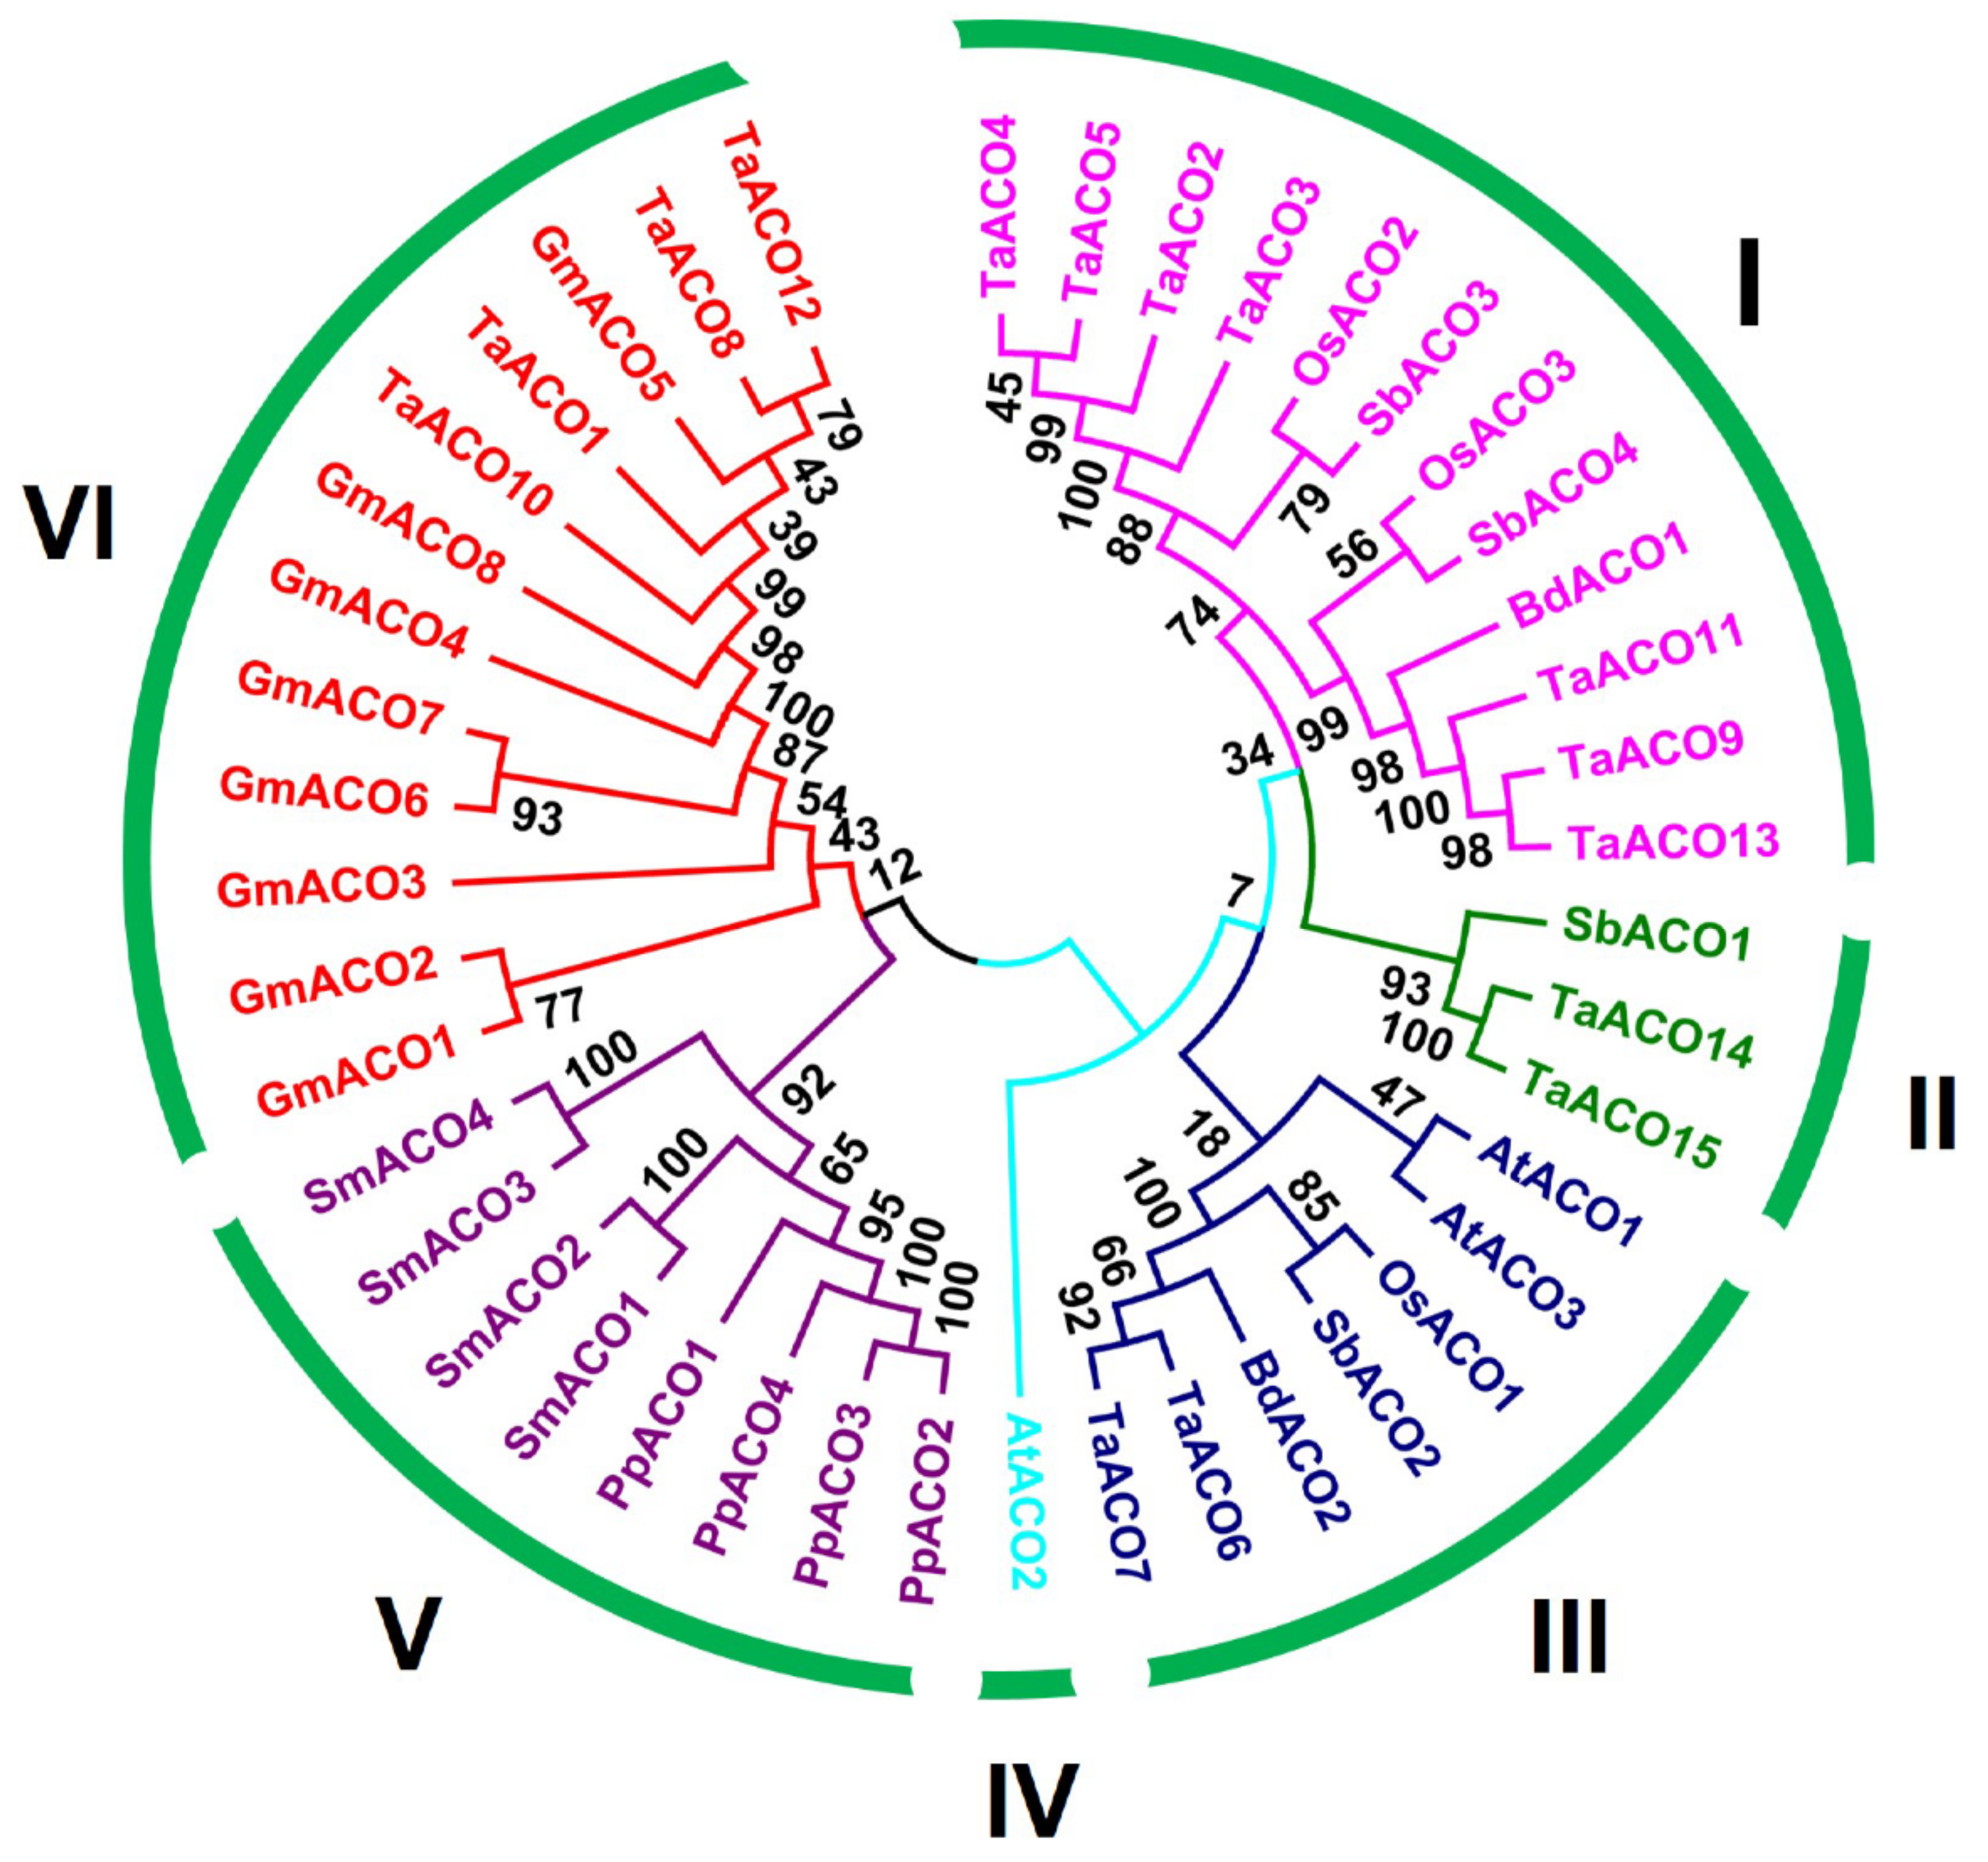
2.1. Genome-Wide Characterization and Evolutionary Analysis of TaACO Genes

In the present investigation, 15 ACO genes were identified in the wheat genome by using different computational tools (Table 1; Table S1).
Compared to other plants, this number is relatively higher than, for instance, A.thaliana, O.sativa, G.max, B. distachyon and S. bicolor (Table S2).
This may be due to the fact that wheat is hexaploid with a bulky genome size. TaACO gene family members contain protein lengths ranging from 477–1007 amino acids with molecular weights 51.92–109.32 kilodalton for TaACO10 and TaACO2. The isoelectric point was 5.67 and 6.6 for TaACO14 and TaACO7. We also correlated the molecular weight of TaACOs with their isoelectric point values to understand the dispersal of various TaACOs (Figure S1). These results indicate that all TaACOs had a similar isoelectric points and molecular weights. The GRAVY values ranged from −0.073 to −0.227, suggesting that TaACO proteins are hydrophilic. Further, we also predicted the subcellular location of TaACO proteins; most of the TaACOs localized at chloroplast thylakoid membrane, while two TaACOs were situated in the mitochondrion, cytoplasm, and one TaACO protein was found at extracellular space (Table 1).
Furthermore, to investigate the evolutionary dynamics between TaACO and other crop ACOs, the phylogenetic tree was generated with Arabidopsis thaliana (AtACOs), Oryza sativa (OsACOs), Glycine max (GmACOs), Sorghum bicolor (SbACOs), Brachypodium distachyon (BdACOs), Physcomitrella patens (PpACOs), and Selaginella moellendorffii (SmACOs) proteins (Table S3). The phylogenetic tree has shown that TaACO proteins were separated into six groups (Figure 1).
Group I comprises seven members whereas, Group II, III, IV, V, and VI contain two, two, zero, zero, and four members, respectively (Figure S2).

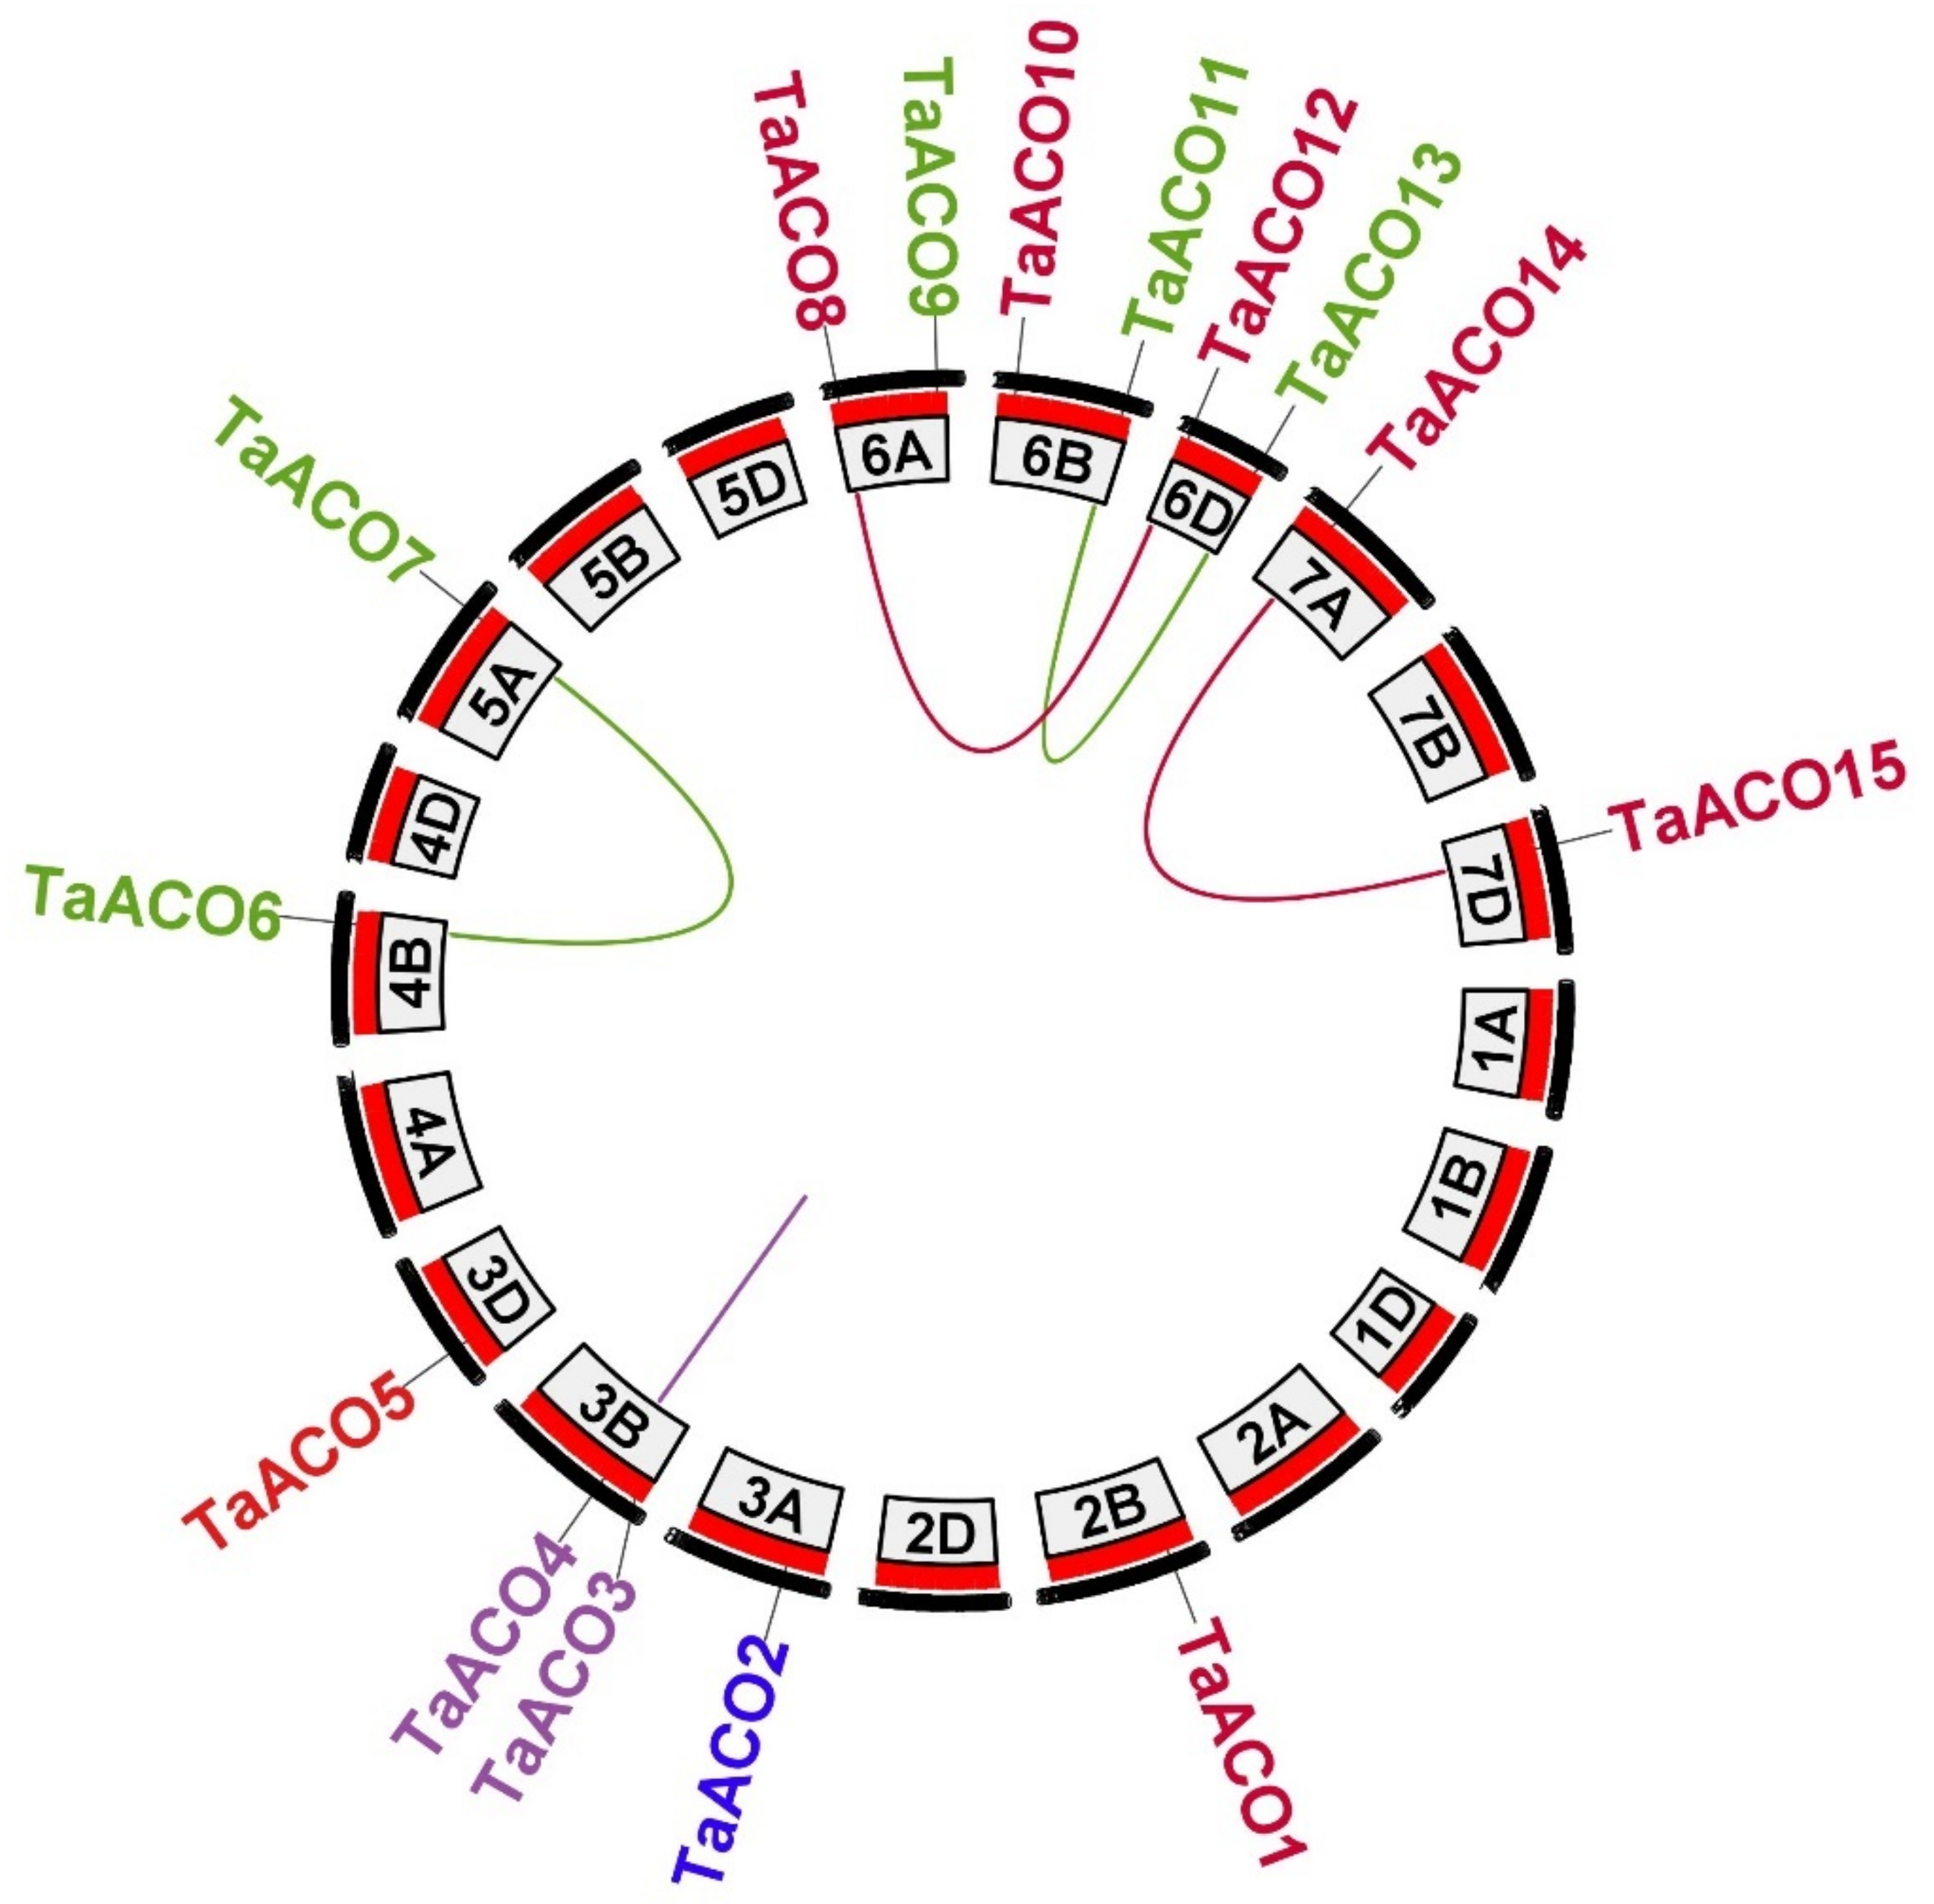
2.2. Chromosomal Location, Gene Duplication and Synteny Relationship of TaACO Genes

The identified TaACO genes were mapped on the wheat chromosome using the Phengram webserver. The TaACO genes were located on 11 chromosomes of wheat (Figure 2 and Table 1). The B sub-genomes contain the maximum TaACO genes (6), followed by A sub-genomes (5) and D sub-genomes (4), respectively (Figure S3A). Further, a single gene was found on the chromosomes 2B, 3A, 3D, 4B, 5A, 7A, and 7D, while two TaACO genes were mapped on the chromosomes 3B, 6A, 6B, and 6D (Figure S3B).
Conversely, none of TaACO genes were mapped on the chromosome 1 (A, B & D), 2 (A &D), 4 (A & D), 5 (B & D), or 7 (B). Thus, these results indicated that the TaACO gene family members were unequally distributed on the wheat chromosomes. Further, we also scanned for the gene duplication in the ACO gene family in wheat. The phylogenetic tree of TaACOs has shown some gene duplications (Figure S3 and S4). We observed that ten TaACO genes were involved in duplication events (Figure 3 and Figure S4 and Table S4), which indicates that the increase of the ACO gene family in wheat was mainly caused via segmental and whole-genome duplication.
To determine the selection force of duplicated TaACO genes, we calculated the Ka/Ks values for the five pairs of TaACO genes (Figure S4; Table S4). The Ka/Ks value was <1 for the five TaACO genes, pointing out that TaACO genes undergo a solid purifying selection with minor alterations, and subsequent duplication. Therefore, these results suggest the preserved evolution of TaACO genes. We also examined the synteny analysis of TaACO genes with model plants and other wheat relatives, for instance, O. sativa A. thaliana, Ae. tauschii, B. distachyon, and T. dicoccoides; the MCScanX was used to identify the orthologous pair genes between these plant genomes (Figure 4 and Table S5).
We found 13, 15, 17, 10, and 29 orthologous genes between TaACOs with other ACOs in O. sativa A. thaliana, Ae. tauschii, B. distachyon, and T. dicoccoides, respectively. The results show that 4, 22, 11, and 20 TaACO genes were collinear with ACO genes in O. sativa A. thaliana, Ae. tauschii, and B. distachyon, respectively. Except for the TaACO1 gene, all had two orthologous pairs of TaACO genes, which may play critical functions in the evolution of TaACOs. Thus, these outcomes indicate that TaACO genes may result from other crop ortholog genes.

2.3. Gene Structure and Conserved Motif and Protein Tertiary Structure Analysis of TaACO Genes

We also examined the structural features of the TaACO genes (Figure 5). Gene structure analysis showed that TaACO genes significantly differed in gene structure (Figure 5 and Figure S5).
TaACO genes comprise 12–19 introns, for instance, TaACO1, TaACO2, TaACO3, and TaACO4 had the minimum twelve introns, while a maximum of nineteen introns were identified in the TaACO9, TaACO10, TaACO11, TaACO12, TaACO14, and TaACO15. To understand the functions of TaACO genes, we analyzed the conserved motif of TaACO protein by the Multiple Em for Motif Elicitation (MEME) website. Finally, we identified the ten conserved motifs in TaACO proteins (Figure 6 and Figure S6). The TaACO gene family was discovered by the existence of aconitase domain (pfam PF 00330) and all fifteen TaACO proteins contain at least one aconitase motif (Table S6) which participates in isomerization of citrate to isocitrate in the TCA cycle. Additionally, the alignment of amino acid sequence also revealed that TaACO proteins shared a conserved aconitase domain (Figures S7 and S8A). Further, to understand the biological function of TaACO genes in wheat, the three-dimensional (3D) structure of TaACO proteins were predicted by phyre2 online web tools (Figure S8B). TaACO proteins consist of four globular domains with a linker fragment.

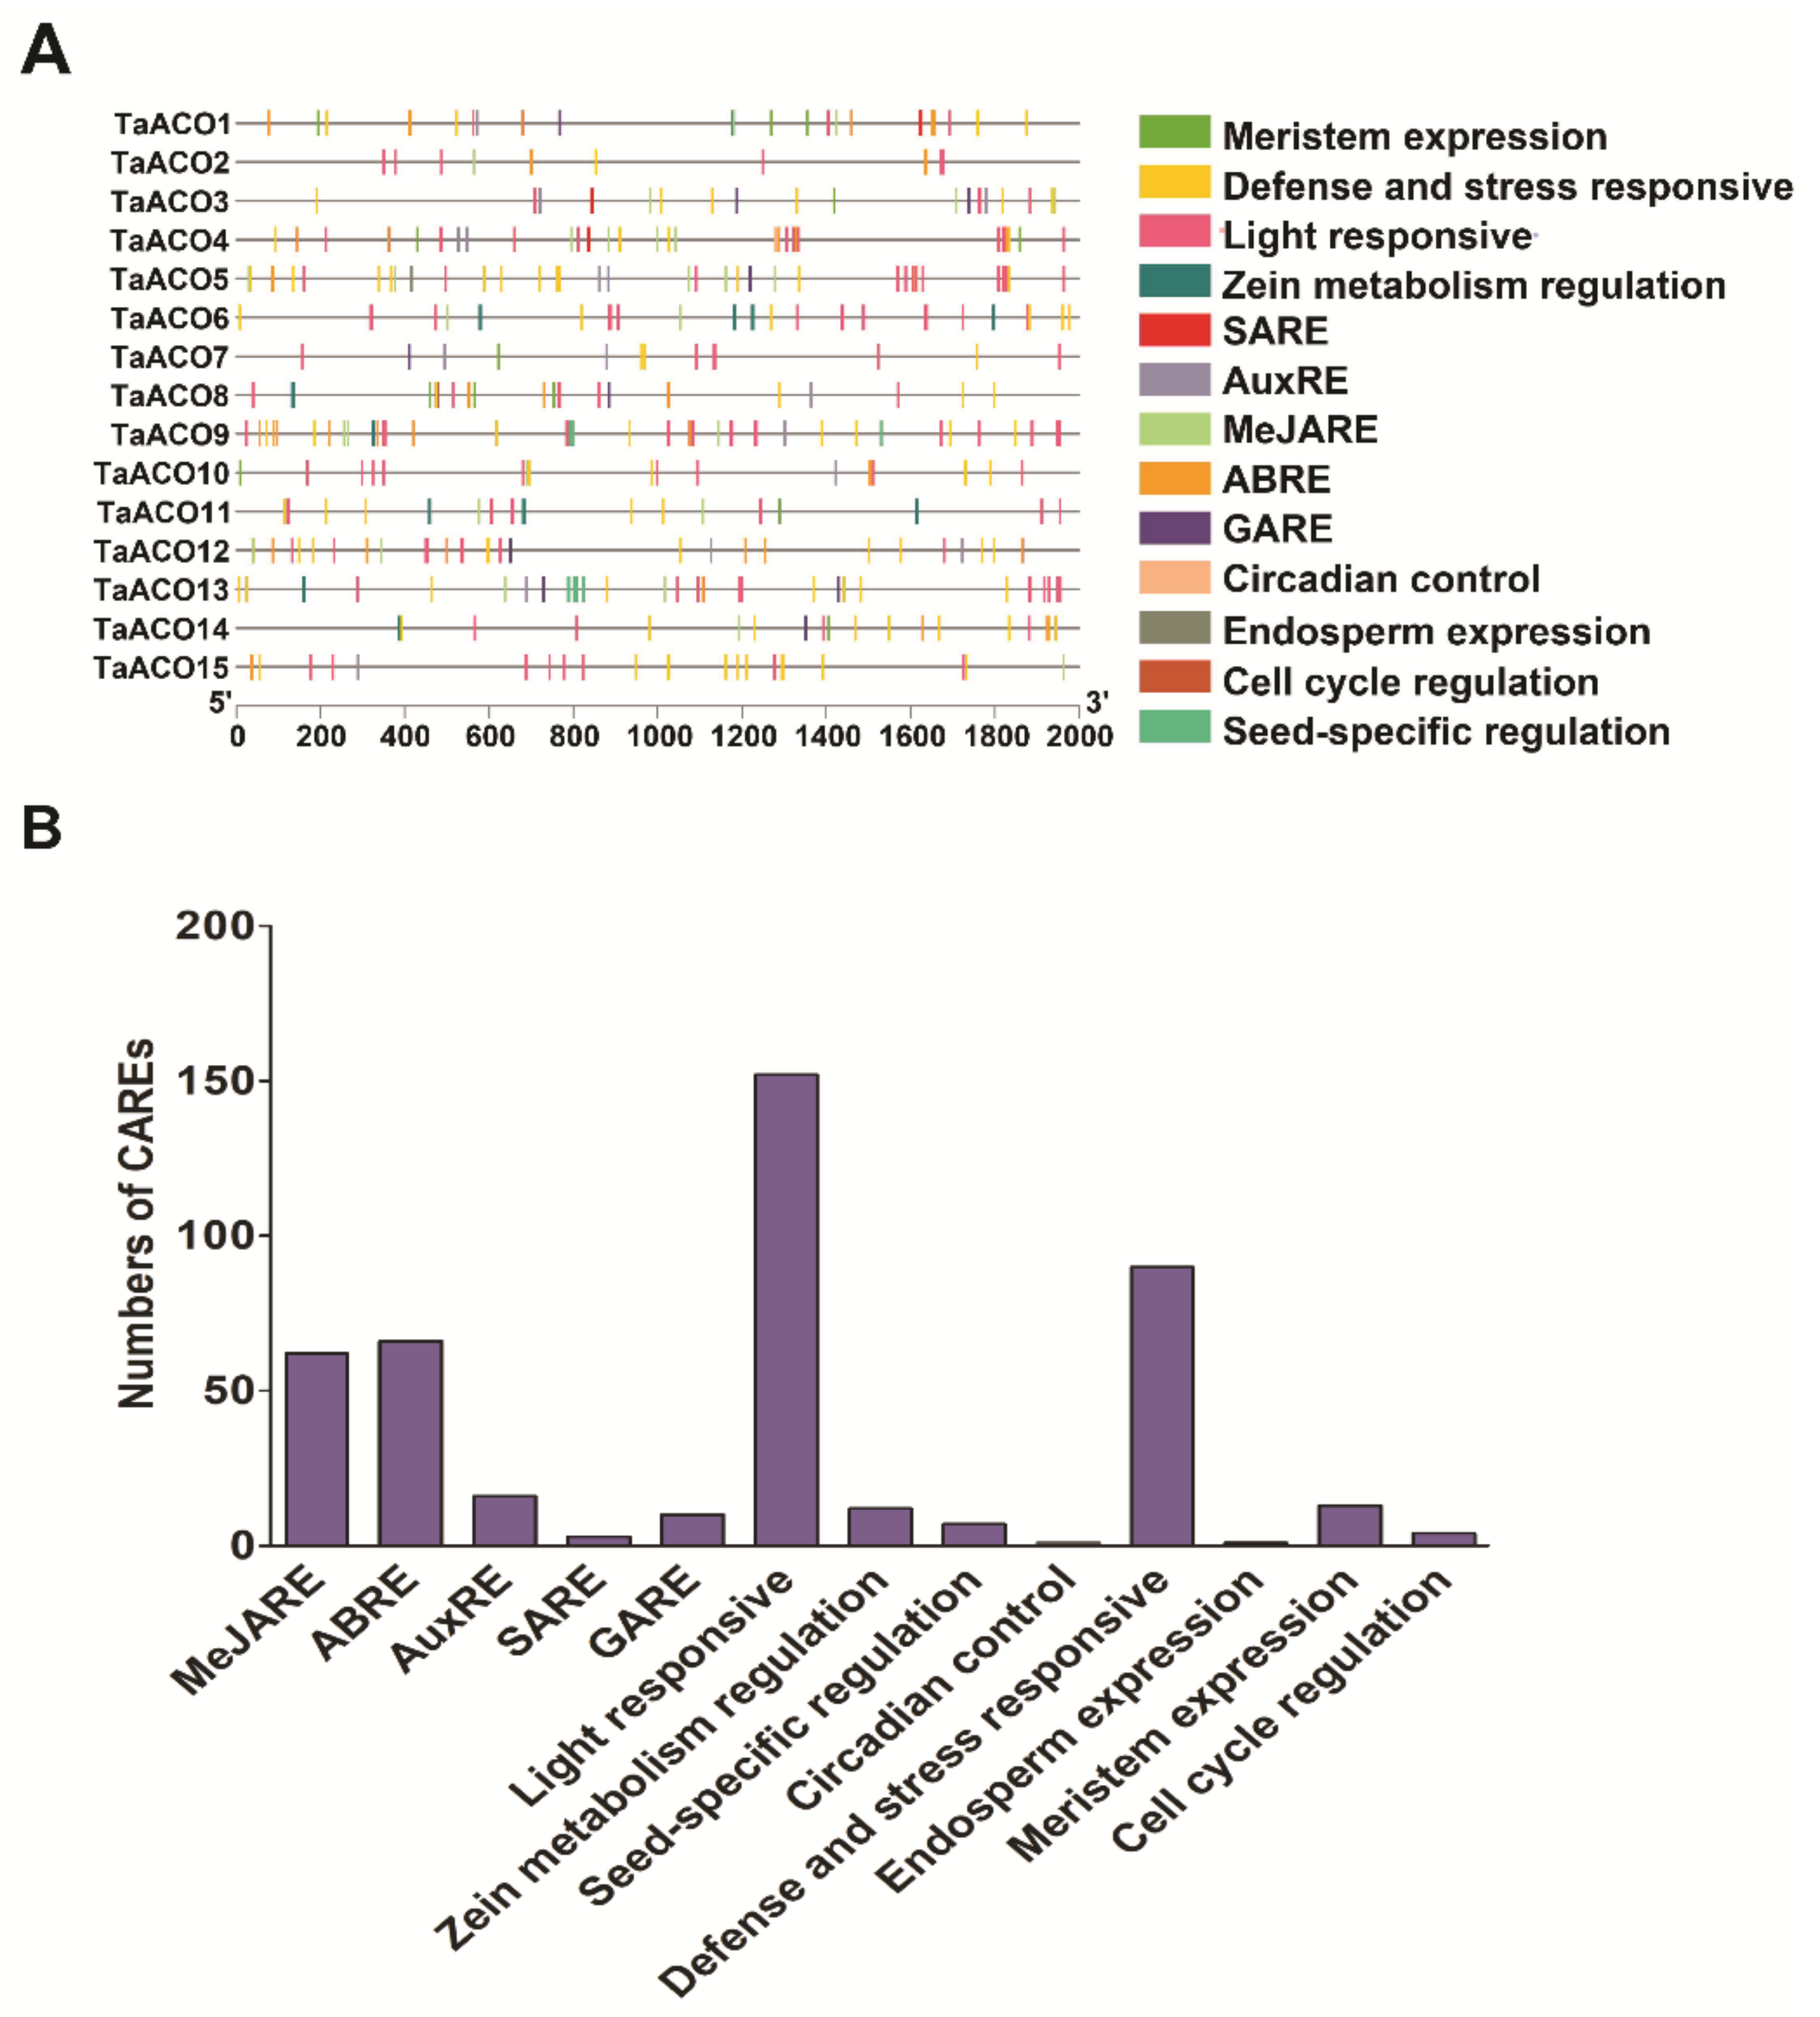
2.4. Prediction of Cis-Acting Regulatory Elements (CAREs) in TaACO Genes

To examine the precise functions of TaACO genes, 2000 base pair upstream sequences of TaACO genes were evaluated via PlantCARE online web server. This analysis has shown that TaACO promoters comprise different cis-elements related to plant hormones, developmental processes, defense and stress response (Figure 7A and Table S7).
TaACO genes contain the five phytohormone responsive elements, such as the gibberellin responsive element (GARE), the auxin-responsive element (AuxRE), the abscisic acid response element (ABRE), the salicylic acid response element (SARE), and the MeJA response element (MeJARE). The CAREs fit into light responsive, stress responsive, ABRE, and MeJARE, which were the ubiquitous presence in the promoter region of TaACO gene family members (Figure 7B). Hence, these findings indicate that TaACOs play an essential role in plant development and response to diverse stresses. Further, TaACOs also comprise CARE related to meristem expression, zein metabolism, circadian control, endosperm expression, cell cycle regulation, and seed-specific regulation. The CAREs reported in the TaACO gene family demonstrated that TaACOs might be involved in various biological processes. Thus, these results provide crucial information to understand the intricate regulatory network of the TaACO gene family in response to plant hormones, multifactorial stress, and different developmental processes.

2.5. Gene Ontology Analysis of TaACO Genes

Gene ontology (GO) enrichment analysis help in elucidating the function of any genes by comparing amino acid sequence with the known function of other plant species genes. All TaACO gens were magnificently interpreted and assigned GO terms by AgriGO, and further confirmed by EggNOG database (Figure S9; Tables S8 and S9) that reverted the similar outcomes as AgriGO. TaACO genes have shown enrichment in the tricarboxylic acid metabolic process (GO:0072350), citrate metabolic process (GO:0006101), isocitrate metabolic process GO:0006102, carbohydrate metabolic (GO:0005975), nucleoside phosphate metabolic process GO:0006753, glyoxylate metabolic process (GO:0046487), cellular respiration (GO:0045333), response to metal ion (GO:0010038), response to oxidative stress (GO:0006979), response to osmotic stress (GO:0006970) in the biological process category (Figure S9A), while in the cellular class, TaACO has displayed enrichment in the cytoplasm (GO:0005737), intracellular organelle (GO:0043229), membrane-bounded organelle (GO:0043227), intracellular membrane-bounded organelle (GO:0043231) (Figure S9B). In addition, the prediction of subcellular localization also returns similar results (Table 1). In the molecular function class, catalytic activity (GO:0003824) and binding (GO:0005488) were the predominant groups that participated in the TCA cycle (Figure S9C). Thus, these findings indicate that TaACO genes play an important function in plant developmental processes.

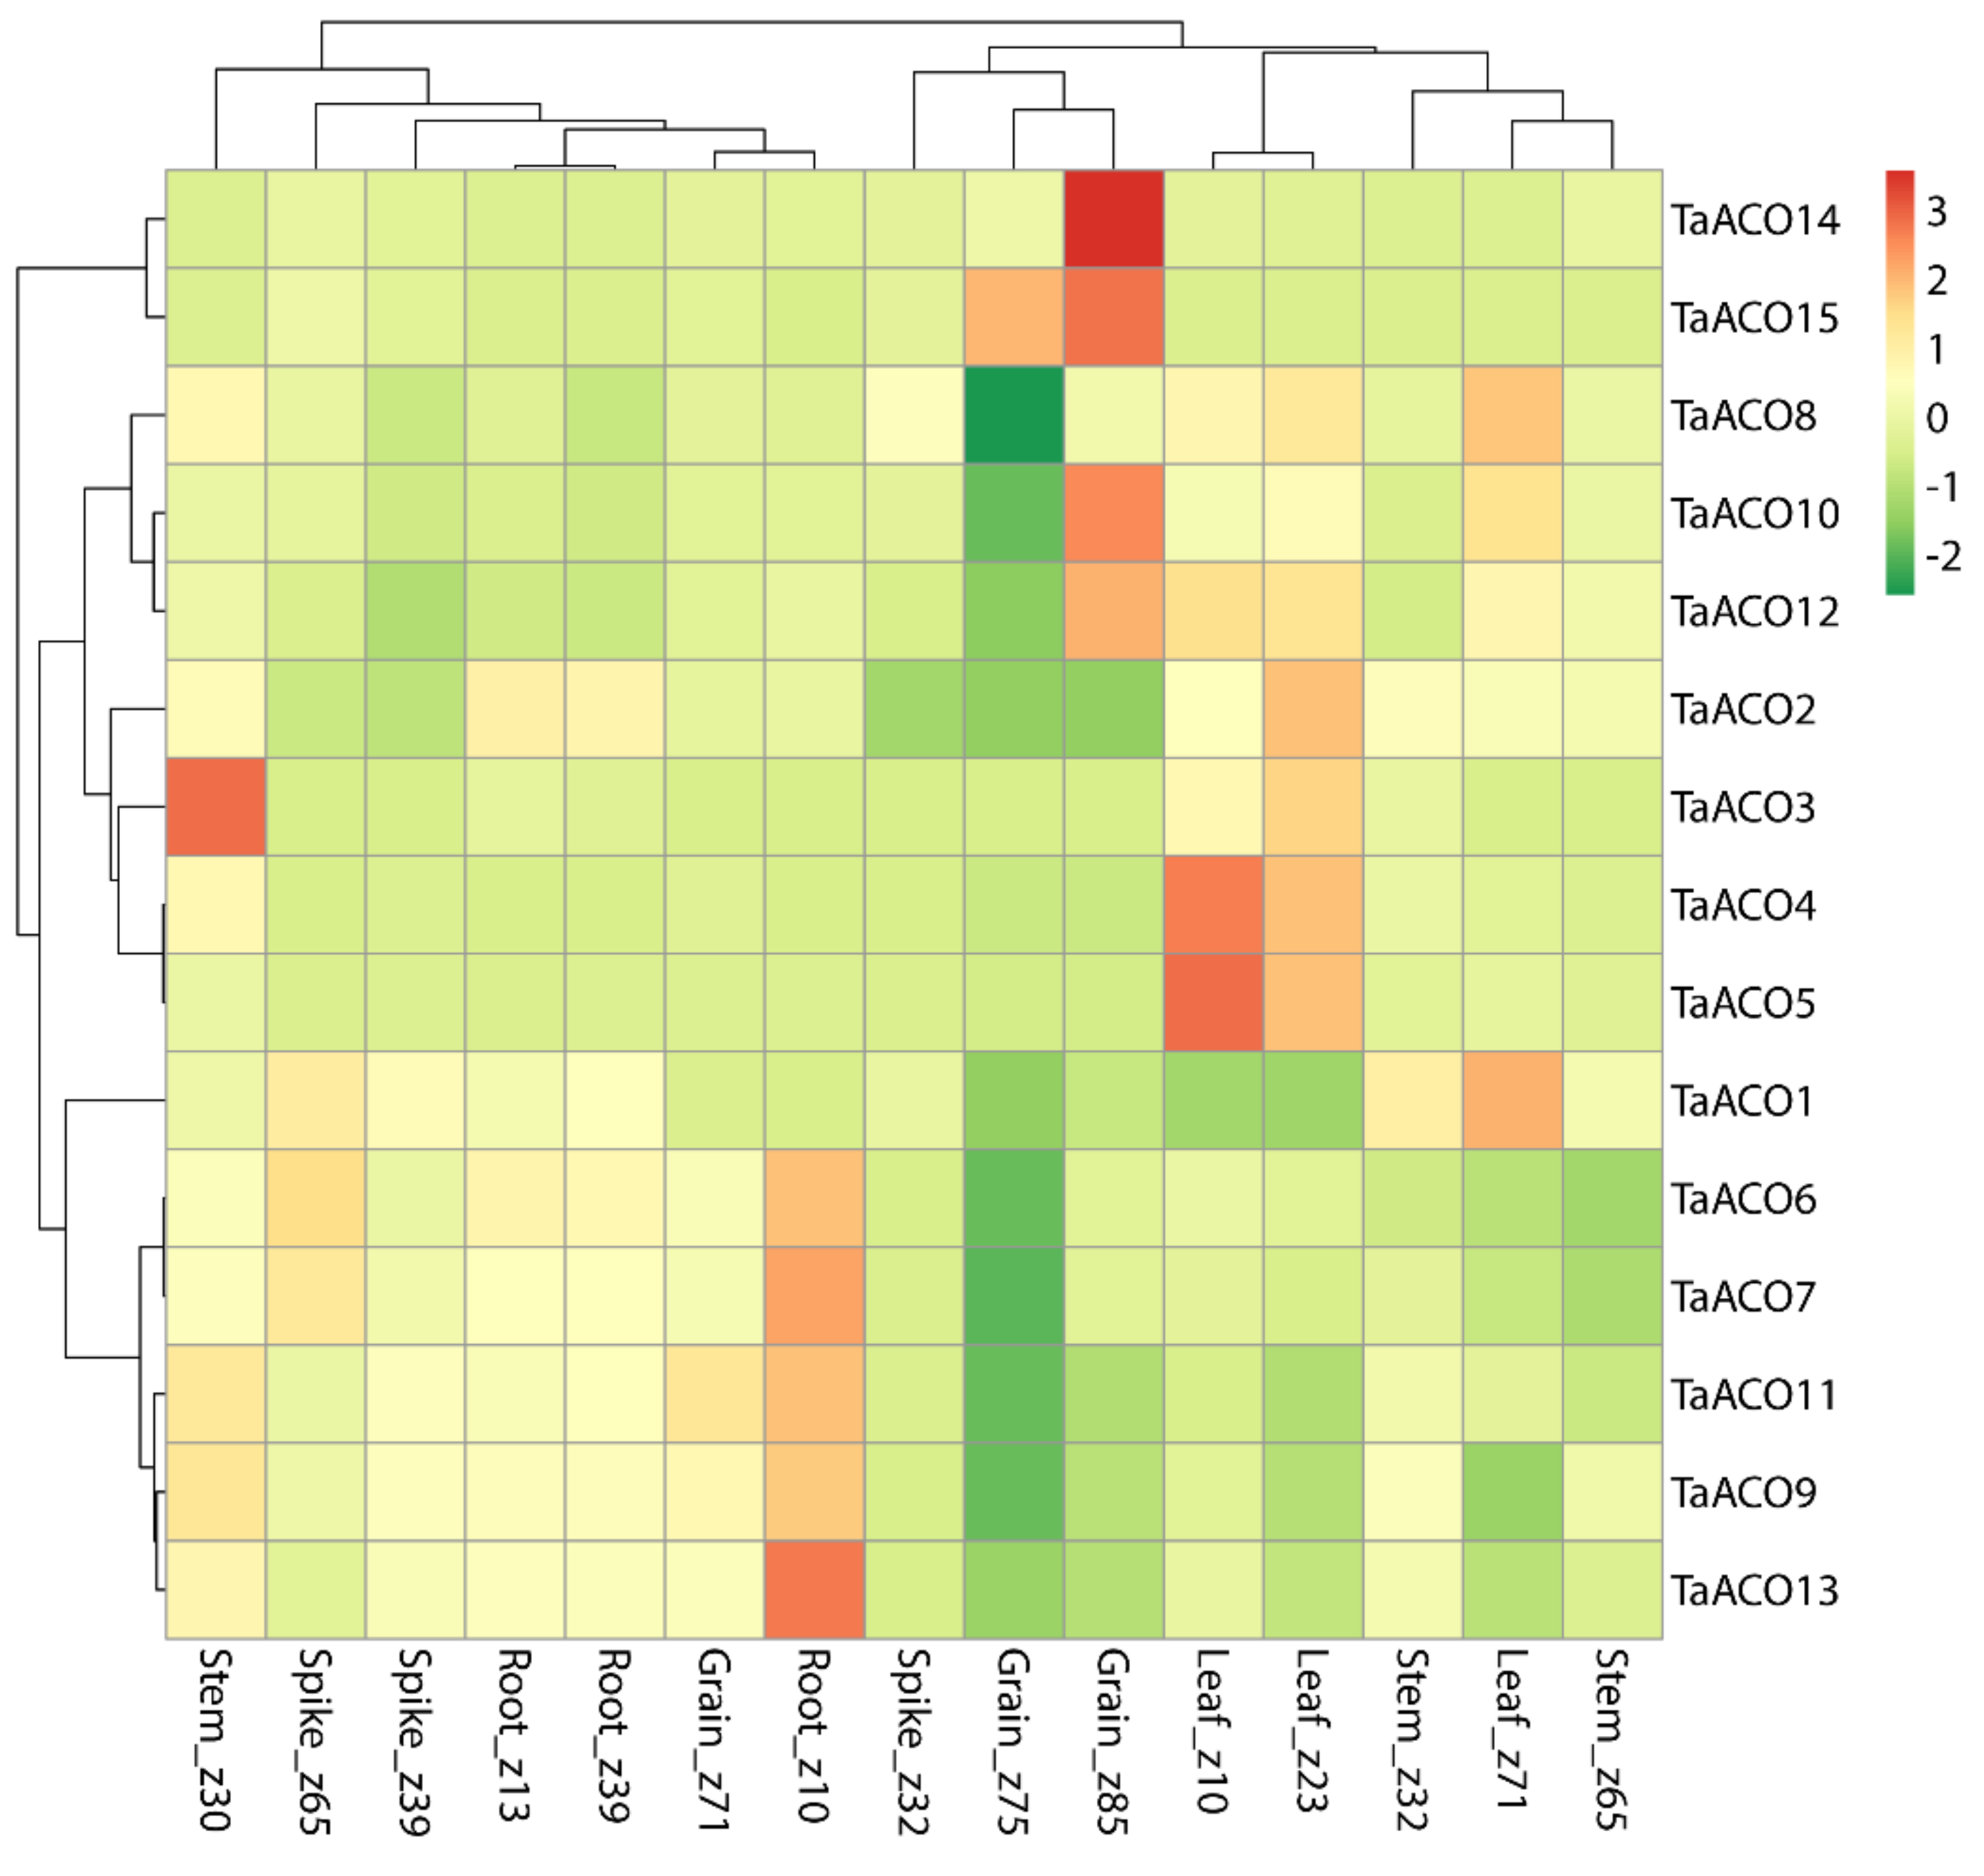
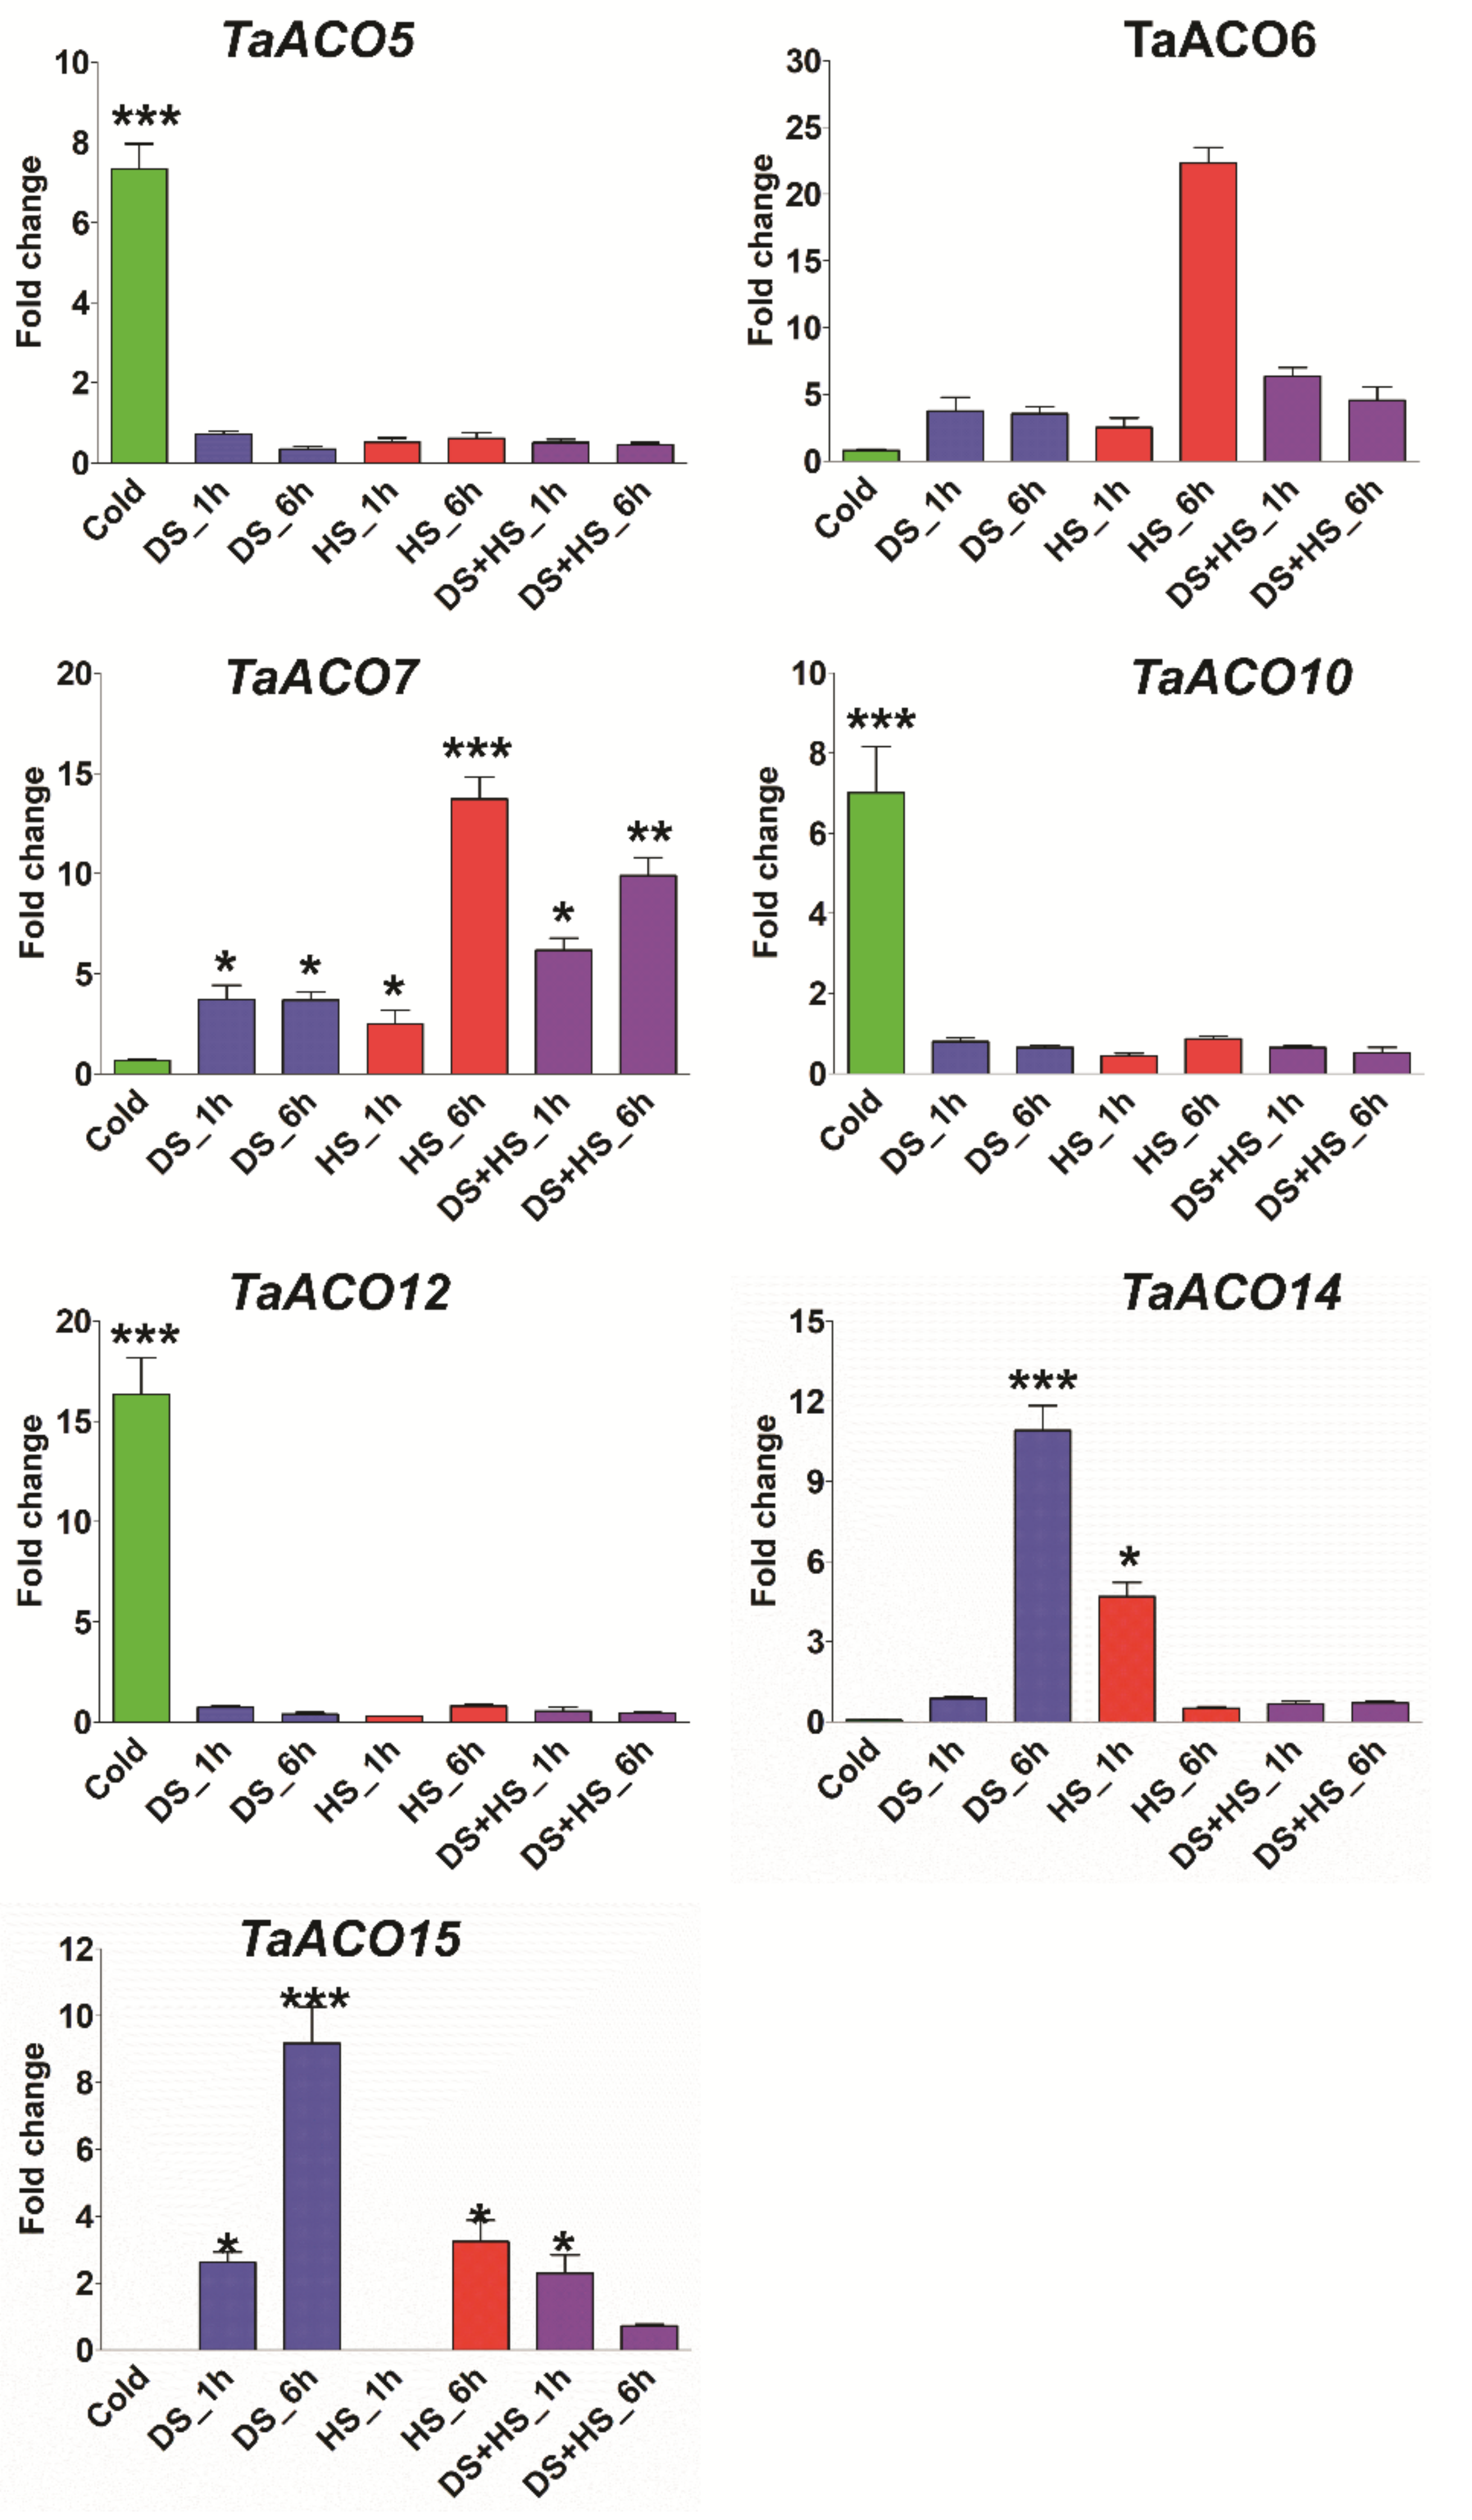
2.6. Expression Profiling of TaACO Genes in Different Tissues, Developmental Stages, and Stress Conditions

To understand the role of TaACO genes, the expression profiling of TaACO genes were investigated in different tissues, developmental stages, and stress environments. The TPM values of TaACOs genes were downloaded from the Wheat Expression Browser. These TPM numbers were used to create heatmaps and carry out a principal component analysis (Figure 8, Figures S10A,B and S11).
To understand the expression patterns of TaACOs, five tissues were taken from three different developmental stages. TaACOs genes exhibited differential expression in the various tissues and different developmental stages (Figure 8); for instance, the expression levels of TaACO4, TaACO5, and TaACO12 in leaf_z10, the expression levels of TaACO2, TaACO3, TaACO4, TaACO5, TaACO8, and TaACO12 in leaf_z23, and TaACO1, TaACO8 and TaACO10 were significantly elevated in leaf_z71.
The expression of TaACO15 in grain_z75 was raised. The expression of TaACO10, TaACO12, TaACO14, and TaACO15 were elevated in grain_z85. In addition, the expression of TaACO6, TaACO7, TaACO9, TaACO11, and TaACO13 was significantly raised in root_z10, and TaACO3 was upregulated in spike_z30. These findings demonstrated that the TaACO gene family might be implicated in various plant developmental processes.
Expression profiling of TaACO was also examined in various stress conditions including cold, drought, heat, septoria tritici blotch, powdery mildew, and stripe rust (Figure S11). The expression level of TaACO1 was significantly elevated in PM24h, while expression of TaACO9, TaACO13, and TaACO15 was significantly induced in PM48h, and expression of TaACO2, TaACO4, and TaACO8 was slightly upregulated in PM72h. TaACO2, TaACO4, TaACO5, and TaACO8 have shown elevated levels in SR72h, whereas the expression of TaACO11 was highly raised in Zt14d. Further, the differential expression pattern was also noticed for TaACO genes in abiotic stress. The expression level of TaACO5, TaACO10, and TaACO12 was significantly elevated in cold. Similarly, the expression level of TaACO6 and TaACO7 were highly induced in heat stress after 6 h. TaACO14 and TaACO15 have displayed higher expression in drought stress after 6 h. TaACO6 and TaACO7 also showed elevated expression levels in combined drought and heat stress after 6 h (Figure S11). Furthermore, the expression kinetics of TaACO genes were confirmed by quantitative reverse transcription PCR (qRT-PCR). qRT-PCR analysis revealed that an almost similar expression pattern was observed under abiotic stress conditions (Figure 9). Collectively, these results have shown that TaACO genes may participate in different developmental processes and respond to biotic and abiotic stresses in wheat.

2.7. Protein–Protein Interaction Network Analysis of TaACO Genes

To study the protein–protein interactions (PPIs) between TaACOs and other proteins, a protein network was generated by the STRING webserver (Figure 10 and Table S10).
According to the predicted results, we reported that TaACO interacted with 98 different wheat proteins. TaACO5 could interact with 13 other wheat proteins, for instance, Traes_1BS_770A3582E.1, Traes_2AL_B4C264AB8.1, Traes_2BL_6552196A1.1, TaACO12, Traes_2DL_AE61DD300.2, Traes_3B_0B9FADF42.1, TaACO7, TaACO6, Traes_3DS_0E5F1E5A4.2, Traes_5AL_1F730D0C4.3, Traes_5DL_E6D11E867.1, Traes_5BL_E3904C0B8.1, and Traes_5BL_1D75C197C.1. TaACO6 and TaACO7 could interact with 15 other wheat proteins, such as Traes_1BS_770A3582E.1, Traes_2AL_B4C264AB8.1, Traes_2BL_6552196A1.1, TaACO12, Traes_2DL_AE61DD300.2, Traes_3B_0B9FADF42.1, TaACO5, Traes_3DS_0E5F1E5A4.2, Traes_5AL_1F730D0C4.3, TaACO15, TaACO14, TaACO13, Traes_5BL_1D75C197C.1, Traes_5BL_E3904C0B8.1, and Traes_5DL_E6D11E867.1, while TaACO12 can interact with Traes_1BS_770A3582E.1, Traes_2AL_B4C264AB8.1, Traes_2BL_6552196A1.1, TaACO7, TaACO13, TaACO14, TaACO5, TaACO6, TaACO15, Traes_5DL_E6D11E867.1, Traes_5AL_1F730D0C4.3, Traes_5BL_1D75C197C.1, Traes_5BL_E3904C0B8.1, Traes_3B_0B9FADF42.1, Traes_2DL_AE61DD300.2, and Traes_3DS_0E5F1E5A4.2, which are 3-isopropylmalate (IPM) dehydrogenase and citrate synthase. IPM dehydrogenase enzyme catalyzes the oxidation and decarboxylation of IPM to ketoleucine in the presence of NAD+. Further, transamination of ketoleucine yields leucine in the leucine biosynthetic pathway [38,39]. Citrate synthase (CS) catalyzes the condensation of oxaloacetate (OAA) and acetyl coenzyme A to produce citrate in the TCA cycle [40,41]. These results provide valuable information to understand the biological functions of TaACO genes.

3. Discussion

The aconitase gene family in plants plays an important role in the glyoxylate and TCA cycles. ACO gene family has also been identified and characterized in other crops including three genes in A. thaliana, eight in G. max, two in B. distachyon, six in Z. mays, four in S. bicolor, and four in C. clementina [1,21]. However, for the first time, we identified the ACO gene family in wheat. Several researchers have shown that ACO genes are also present in primitive plants and expanded during evolution [1]. In this work, we performed an in silico analysis and identified the 15 ACO genes in wheat (Table 1). The phylogenetic analysis A. thaliana, G. max, T. aestivum, B. distachyon, S. bicolor, Z. mays, P. patens, and S. moellendorffii revealed that ACO genes were divided into six classes (Figure 1). The phylogenetic tree has shown that groups I and II were specific to monocot, whereas group IV had dicot-specific ACOs, and group V contained primitive-landed-specific ACOs (Figure 1 and Figure S2). The origin of this kind of genes suggests specific functions in the monocots that play a critical role in morphological development [7,26,28,42]. However, ACO genes were dispersed into the well-known clade Arabidopsis, soybean, sorghum, maize, and wheat, suggesting that the ACOs gene may originate from a common ancestor. The TaACO gene family is expanded in the wheat and contained more ACO genes compared to the earlier described ACOs in A. thaliana, G. max, Z. mays, O. sativa, B. distachyon, S. bicolor, P. trichocarpa, and C. clementina [1,21]. Tandem, segmental, and whole-genome duplications are the major forces involved in the gene duplication processes and expanding the gene family in various plant species [43,44]. Further, we also scanned for the gene duplication analysis of ACO gene family members in wheat. The phylogenetic tree of TaACOs has shown some gene duplications (Figure S4). We found ten TaACO genes involved in the duplication process (Figure 3 and Table S4). The duplicated gene pairs are TaACO8:TaACO12, TaACO14:TaACO15, TaACO6:TaACO7, and TaACO11:TaACO13, that indicate that the expansion of the ACO gene family in wheat was mainly caused via segmental duplication and whole genome duplication. Similarly, duplication event was reported in angiosperms, which play an important role in the expansion of the ACO genes. Segmental duplication was observed in Z. mays, G. max, and P. trichocarpa. Segmental gene duplication might be the main driving force of ACO gene family expansion in the Z. mays, G. max, and P. trichocarpa [1]. Similar results were observed in citrus [21]. Additionally, the Ka/Ks value was <1 for the five TaACO genes pointing out that TaACO genes undergo a strong purifying selection with minor alterations after duplication. Therefore, these results suggest the conserved evolution of TaACO genes. Furthermore, chromosomal mapping of TaACOs showed that a single gene was found on the chromosomes 2B, 3A, 3D, 4B, 5A, 7A, and 7D, while two TaACO genes were mapped on the chromosomes 3B, 6A, 6B, and 6D (Figure S3A). Conversely, none of the TaACO genes were mapped on the chromosomes 1A, 1B, 1D, 2A, 2D, 4A, 4D, 5B, 5D, and 7B. Hence, these results showed that the 15 TaACOs were unequally dispersed on the wheat chromosomes (Figure 2 and Figure S3B). Likewise, results were reported in PIN-FORMED (PIN), brassinazole-resistant (BZR), and PERKs gene family in wheat [26,27,28]. Thus, the unequal distribution of TaACO genes on the 11 chromosomes of wheat suggests that genes disappear and add through segmental duplication or whole genome events, and there might be errors during genome sequencing and assembly. Moreover, we found 13, 15, 17, 10, and 29 orthologous genes between TaACOs with other ACOs in O. sativa A. thaliana, Ae. tauschii, B. distachyon, and T. dicoccoides, respectively. The results show that 4, 22, 11, and 20 TaACO genes were collinear with ACO genes in O. sativa A. thaliana, Ae. tauschii, and B. distachyon, respectively. Except for theTaACO1 gene, all had two orthologous pairs of TaACO genes, which may play key functions in the evolution of TaACOs. During the evolution, there have been changes in the upstream and/or exon regions of duplicated genes, which has caused a change in their expression pattern and function [45,46]. Therefore, these findings indicate that TaACO genes may result from other plant orthologous genes.
Gene structure analysis provided key clues to understanding gene function and evolution. Gene structure analysis revealed that TaACO genes greatly differed in gene structure. TaACO genes comprise 12-19 introns, for instance, TaACO1, TaACO2, TaACO3, TaACO4 had the minimum of twelve introns, while a maximum of nineteen introns were identified in the TaACO9, TaACO10, TaACO11, TaACO12, TaACO14, and TaACO15 (Figure 5 and Figure S5). The size of the intron is one of the important factors that influence the gene size, for example, a notable variance in gene size was observed between the largest gene TaACO4 (9 kb) and the smallest gene TaACO6 (2 kb) owing to the total intron length (9 kb vs. 2 kb). Several researchers have demonstrated the importance of introns in the evolution of various genes in plants [47,48]. Many gene families contain lower, absent, and higher numbers of introns [49,50]. The number of exon and intron differences may be suitable for the documentation of evolutionary mechanisms [50]. In this work, all 15 TaACO genes had higher numbers and bigger introns during evolution in wheat. In this study, genes have shown the variable intron-exon structures presenting diverse functions. The different gene structures of TaACO could result in diverse functions due to selection pressure during wheat genome evolution. Furthermore, examination of motifs revealed that all TaACO proteins comprise the 10 diverse motifs (Figure 6 and Figure S6). We noticed that seven motifs were found in all the TaACO proteins (Motif 2, 3, 4, 5, 6, 9, and 10). Hence, we speculated that the same group of genes in the phylogenetic tree might share similar functions, even in the different plant species. Moreover, multiple protein sequence alignment of TaACO with other ACO proteins exhibited that TaACO shared a conserved aconitase domain (Figures S7 and S8A). WOX and YABBY gene family was evolutionarily conserved in G. hirsutum [51]. Moreover, 3D structure analysis has shown that TaACO proteins comprise the four globular domains with a linker fragment (Figure S8B). Consequently, this result will help in understanding and explaining the molecular basis of the isomerization of citrate to isocitrate in the TCA cycle.
CAREs present in the promoter section play a key role in the function and regulation of genes [52]. TaACO promoter regions comprise the different CARE elements related to phytohormones, related to growth and stress response (Figure 7A and Table S7). Additionally, ten CAREs were detected in each of the TaACO promoter regions (Table S7). A total of eight CAREs were predicted which are related to light response such as G-box (CARE participates in light response), Sp1 (light responsive element), GT1-motif (light responsive element), MRE (MYB binding site involved in light responsiveness), Box 4 (part of a conserved DNA module involved in light responsiveness), Box II (part of a light responsive element), chs-Unit 1 m1 (part of a light responsive element), and chs-CMA1a (part of a light responsive element) [53,54]. Further, we also found four CAREs related to growth, for instance, O2-site (zein metabolism regulation), GCN4-motif (endosperm expression), and CAT-box (meristem expression) [55,56]. Additionally, we detected phytohormone CARE related, for example, MeJA-responsive element (CGTCA-motif), abscisic acid-responsive element (ABRE), salicylic acid responsiveness (TCA-element), and gibberellin-responsive element (TATC-box-motif). The light responsive, defense and stress responsive, ABRE, and MeJARE elements were prevalent in TaACOs promoters (Figure 7B and Table S7). Furthermore, we also found that CAREs participated in the response to multifactorial stress, including low-temperature responsiveness (LTR) and defense and stress responsiveness (ARE and GC-motif). These results suggest that TaACO genes might be regulated by diverse developmental processes, phytohormone and different biotic and abiotic stress conditions. Many studies have demonstrated that light plays an essential role in plant development processes [57]. Light also modulates the expression level of aconitase genes [58]. The microarray analysis in Arabidopsis has shown light suppression of the mitochondrial aconitase [59]. This could lead to the decreased respiration of mitochondria and enhanced photosynthesis efficiency. Hence, these results suggest that TaACOs play an essential role in plant development and response to diverse stress. Further, TaACOs also comprise CARE related to meristem expression, zein metabolism, circadian control, endosperm expression, seed-specific, and cell cycle regulation. The CAREs reported in the TaACO gene family demonstrated that TaACOs may be involved in a variety of biological processes. Thus, these results provide crucial information to understand the intricate regulatory network of the TaACO gene family in response to plant hormones, multifactorial stress, and different developmental processes.
TaACOs genes exhibited differential expression in the various tissues (Figure 8), for instance, the expression level of TaACO4, TaACO5, and TaACO12 in leaf_z10, TaACO2, TaACO3, TaACO4, TaACO5, TaACO8, and TaACO12 in leaf_z23, and TaACO1, TaACO8 and TaACO10 were significantly elevated in leaf_z71. The temporal and spatial expression pattern of TaACO genes indicates that TaACO genes might have a function in different tissues and various developmental stages in wheat. In addition, our gene ontology results revealed a wide range of roles of TaACO genes in the biological processes (Figure S9A–C). These results demonstrated that TaACO genes play an important role in different tissues and developmental stages. Similarly, the expression level of PtACO3 was elevated in the root tissues of poplar [1]. The expression of cytosolic and mitochondrial forms of aconitase were regulated by phytochrome in maize leaves [24]. The expression of AtACO2 and AtACO3 were highly raised in the cauline leaf tissues in Arabidopsis [1]. Likewise, two SmACO genes were differentially expressed in leaf, stem, and root tissues. ZmACO4 showed a higher expression compared to the other five ACO genes in maize [1]. Aconitase genes have been detected in mitochondria and cytosol. The functions of each isoform are diverse [60,61,62]. Eprintsev et al. [23] also reported the differential activity and expression of Aco1 and Aco4 in scutellum during the germination of maize seeds. Further, Aconitase knockdown and knockdown mutant of Drosophila showed a lethal effect in Drosophila, suggesting that Aconitase is important for viability [63]. We assumed that all key enzymes of the TCA cycle might be controlled by light via aconitase [64]. However, no direct experimental evidence of light governing the aconitase function has been found. Carrari and colleague [16] reported that the aconitase activity decreased in the ACO mutant of tomato; however, the photosynthesis rate was significantly increased in tomato. CcAco3 was constitutively expressed—although at low levels—along all phases of fruit pulp ripening in citrus [21]. Thus, these findings demonstrated that the TaACO gene family may be implicated in various plant developmental processes.
Many age-linked and mitochondrial disorders are related to raised expression levels of reactive oxygen species following decreased activity of ACO [65]. The differential expression pattern was also noticed for TaACO genes in abiotic stress (Figure S11). The expression level of TaACO5, TaACO10, and TaACO12 was significantly elevated in cold. Similarly, the expression level of TaACO6 and TaACO7 were highly induced in heat stress after 6 h. TaACO14 and TaACO15 displayed higher expression in drought stress after 6 h. TaACO6 and TaACO7 also showed elevated expression levels in combined drought and heat stress after 6 h (Figure S11). The elevated expression level of TaACO genes under cold, heat, and drought stress indicates that TaACO genes might be involved in stress tolerance in wheat by coordinating regulation among the TaACOs. Several studies demonstrated that ACO genes have been implicated in response to oxidative stress in plants [11,12,66]. ABA and MeJA play a crucial role in oxidative homeostasis in plants. The CARE analyses in this work also revealed that all TaACO genes contained CAREs response to different phytohormones, defense and stress responsiveness. In addition, Wang et al. [1] showed that numerous ACO genes, for instance, BdACO2, GmACO3, and OsACO1 had an elevated expression level in root tissues of B. distachyon, G. max, and O. sativa during stress conditions. The elevated expression of citrate triggers the expression of the oxidase, thereby inhibiting ROS formation in mitochondria [66]. Furthermore, the qRT-PCR analysis revealed that an almost similar expression pattern was observed under abiotic stress conditions (Figure 9). Moreover, our PPI results also revealed that TaACO interacted with 98 different wheat proteins. TaACO5 could interact with 13 other wheat proteins, while TaACO6 and TaACO7 could interact with 15 other wheat proteins. Hence, the TaACO protein also interacts with other proteins and modulates the metabolism and signaling pathways in wheat. These results suggested that plant ACO genes might be participated in oxidative stress by responding to different metabolisms and phytohormones. Therefore, these results have shown that TaACO genes may participate in different developmental processes and respond to abiotic stresses in wheat. Collectively, these findings demonstrated that TaACOs might regulate a wide range of cellular processes, phytohormones signaling and response to various stress; of course, this is important and must be proved by experimental data in the near future. Therefore, these results provided foundational information to elucidate the precise function of TaACO genes in plant developmental processes, responses to different plant hormones, and diverse stresses.

4. Materials and Methods

4.1. Identification of ACO Genes in Wheat

To identify the ACO gene in wheat, ACO protein sequences of A.thaliana, O.sativa, G.max, B. distachyon, S. bicolor, P. patens, and S. moellendorffii were downloaded from the Phytozome (https://phytozome-next.jgi.doe.gov/ accessed on 15 October 2022). The twenty-eight ACO protein sequences used as query against the T. aestivum proteome with an e-value of 10−5 and bit-score>100 kept cut-off to find TaACO genes and, finally, the BLASTp result was tabulated. Further verified for the existence of aconitase domain using other databases: InterPro [67], HMMscan [68], National Center for Biotechnology Information CDD [69] and Simple Modular 132 Architecture Research Tool (SMART, http://smart.emblheidelberg.de/ accessed on 15 October 2022). Eventually, the protein sequences with aconitase domain were selected and named according to their positions on the chromosomes.

4.2. Biophysical Characteristics, Subcellular Localization Genomic Localization, Gene Duplication and Synteny Analysis

The biophysical features of TaACO proteins, including isoelectric point, lengths, and molecular weight, were evaluated by the ExPASy server [70] and isoelectric point calculator [71]. Subcellular localization was predicted using CELLO (http://cello.life.nctu.edu.tw/ accessed on 18 October 2022), WoLEPSORT (http://www.genscript.com/wolf-psort.html accessed on 18 October 2022), and BUSCA online tools (http://busca.biocomp.unibo.it/ accessed on 18 October 2022). For the distribution on wheat chromosomes, the genomic positions of TaACO genes were obtained from Ensembl plants (http://plants.ensembl.org/biomart/martview accessed on 18 October 2022). PhenoGram (http://visualization.ritchielab.org/phenograms/plot accessed on 18 October 2022) was used to represent the ACO genes on the wheat chromosomes. McScan tools were used to find out gene duplication and synteny analysis [72]. The Ka/Ks value was calculated using the TBtools [73].

4.3. Gene Structure, Protein Motif, and 3D Structure

The coding sequences, corresponding genomic sequences, and protein sequences of TaACO genes were retrieved from Ensembl plants (https://plants.ensembl.org/index.html accessed on 15 October 2022). Further, exon/intron structures were constructed using the Gene Structure Display Server 2.0 (http://gsds.gao-lab.org/ accessed on 17 October 2022). The protein motifs in the TaACO were elucidated using Multiple Em for Motif Elicitation ver.5.3.3. (http://meme-suite.org/tools/meme accessed on 18 October 2022) with default settings. The three-dimensional structure (3D) of TaACOs were produced using the Phyre2 web server (http://www.sbg.bio.ic.ac.uk/phyre2/html/page.cgi?id=index accessed on 18 October 2022).

4.4. Gene Ontology, Promoter Cis-Acting Regulatory Elements (CAREs), and Protein Interaction Network Analysis

TaACO protein sequences were evaluated for GO terms enrichment using the agriGO (http://bioinfo.cau.edu.cn/agriGO/ accessed on 20 October 2022) and EggNOG (http://eggnogdb.embl.de/#/app/emapper accessed on 20 October 2022). To identify CAREs, 2000 bp upstream sequences of ACO genes were downloaded from Ensemble Plants and analyzed using the PlantCARE online web server (http://bioinformatics.psb.ugent.be/webtools/plantcare/html/ accessed on 20 October 2022). Further, the most frequently occurring CAREs were presented using the TBtools [73]. The TaACO protein interaction network was examined using the STRING online webserver (https://string-db.org/cgi accessed on 20 October 2022).

4.5. Expression Analysis of TaACO Genes

Gene expression data of TaACO genes in different wheat tissues (leaf, stem, root, spike, and grain) and different stress conditions (cold, drought, heat, combined drought, and heat) were obtained from WheatExp database (http://www.wheat-expression.com/ accessed on 22 October 2022). The expression pattern was presented as a heatmap based on transcript per million (TPM), which was mapped by ClustVis [74] and principal component analysis (PCA) plots generated by TBtools [73].

4.6. Plant Growth, Stress Conditions, and Quantitative Reverse Transcription PCR Analysis

Wheat seeds were seeded in plastic pots and grown in a greenhouse, and then 10-day-old seedlings were acclimatized for 2 days in growth chamber environments. The wheat seedlings were exposed to drought and heat stress (37 °C) for 1 h and 6 h, while cold stress was for 3 days (4 °C). For the combined drought and heat stress, first, the wheat seedling was exposed to drought stress and then subjected to heat stress for 1 h and 6 h at 37 °C in an incubator. Controls were kept at 25 °C. The drought-, heat-, and cold-stressed wheat seedlings were collected for RNA isolation and stored at −80 °C. Total RNA was extracted from the control, drought-, heat-, and cold-stressed wheat seedlings as described by [75,76]. cDNA was synthesized using the iScriptTM cDNA synthesis kit (Bio-Rad, Hercules, CA, USA). Wheat actin (AB181991) was used as the control to standardize the gene expression data and the qRT-PCR was executed with Applied Biosystems 7500 Fast Real-Time PCR. Each qRT-PCR reaction was performed with three technical replicates and repeated three times. The fold change value was calculated based on mean 2-ΔΔCT and finally fold change value was used to plot the graph [77,78]. All primers used in this study were tabulated in Table S11.

5. Conclusions

Wheat is major cereal crop and widely consumed staple food worldwide. However, global warming is becoming a severe threat to food security due to the constant climate changes, largely affecting plant growth and development, eventually the yield. This has raised a significant challenge for plant biologists to increase yield and improve wheat’s quality and various stress tolerance. In this work, we identified 15 ACO genes in wheat genome. Phylogenetic tree revealed that TaACO genes classified into six groups. Further, gene structure analysis of TaACOs has shown a distinctive evolutionary path. Furthermore, Ka/Ks ratio revealed that most TaACO genes experienced strong purifying selection during evolution. Numerous cis-acting regulatory elements were detected in the TaACO promoters, which might play a crucial role in plant development processes, phytohormone signaling, and are related to defense and stress. Moreover, expression profile revealed that TaACO genes were differentially expressed in different tissues, developmental stages, and abiotic stress conditions. Therefore, our results provide valuable information about the ACO gene family in wheat and contribute to the further characterization of ACOs during plant development and response to diverse biotic and abiotic stress.

Supplementary Materials

The following are available online at https://www.mdpi.com/article/10.3390/plants11243475/s1. Figure S1: The molecular mass (kDa) and isoelectric point of plots of TaACO genes. Figure S2: Dispersal of TaACOs in a different group of the phylogenetic tree. Figure S3: Chromosomal locations of identified ACO genes and on the three sub-genomes of (A) Dispersal of ACO genes in the A, B and D sub-genomes. (B) Dispersal of ACO genes on wheat chromosomes. Figure S4: Evolutionary analysis of TaACO genes. A phylogenetic tree was produced using MEGA7 with the NJ method and 1000 bootstrap replications. A black asterisk denotes the duplicated gene pairs. Figure S5: The different number of exons and introns found in the TaACOs gene family. Figure S6: Sequence logo of TaACO motif and height of each mountain indicate the conservation at this position, whereas the height of the different letters represents the frequency of the corresponding amino acids. Figure S7: Alignment of the TaACO proteins and preserved aconitase domain is indicated with red color line. Amino acid residues conserved in all proteins were shaded blue and similar amino acids were gray shaded. Dashes denote gaps that led to exploiting the alignment of the homologous region. Figure S8: Alignment and three-dimensional structure of the TaACO protein sequences. (A) The aconitase domain is underlined with red color. Colored and shaded amino acids are chemically similar residues. Dashes indicate gaps introduced to maximize the alignment of the homologous region. (B) Predicted 3D structures TaACO proteins. Figure S9: The predicted GO term of TaACO gene family using AgriGO (A) Biological Process. (B) Cellular component. (C) Molecular function. Figure S10: PCA plots displaying grouping of different (A) Different tissues and developmental stages. (B) Diverse stress conditions based on the TaACO expression profiles. HS: Heat stress; DS: Drought stress; DS+HS: Combined drought and heat stress; PM: Powdery mildew; SR: Stripe rust; Zt: Zymoseptoria tritici; d: days; h: hour. Figure S11: Heatmaps signifying the expression profile of TaACO genes in biotic and abiotic stress conditions. TPM values were directly used to produce the heatmaps. HS: Heat stress; DS: Drought stress; DS+HS: Combined drought and heat stress; PM: Powdery mildew; SR: Stripe rust; Zt: Zymoseptoria tritici; d: days; h: hour. Table S1: TaACO genomic, conserved domain sequence, protein and promoter sequence. Table S2: The number of ACO genes found in the other crop species. Table S3: ACO proteins from Arabidopsis, rice, soybean, wheat, brachypodium, sorghum, selaginella, and physcomitrella used to produce phylogenetic tree. Table S4: Estimated nonsynonymous substitutions (Ka) and synonymous substitutions Ks ratio of duplicate gene pairs in TaACO gene family. Table S5: Orthologous relationships of TaACO genes with other ACO genes in B. distachyon, Ae. tauschii, T. dicoccoides, O. sativa, and A. thaliana. Table S6: Identified the aconitase domains in the TaACO proteins predicted using pfam with default parameters. Table S7: Identified the cis-regulatory elements in the TaACO promoter region. Table S8: Predicted significant Go term in the TaACO gene family by AgriGo analysis. Table S9: TaACO gene annotation using EggNOG database. Table S10: The PPI network between TaACO and other proteins in wheat. Table S11: qRT-PCR primers used for the TaACO genes in this study.

Author Contributions

M.S.K. and M.K. designed and wrote the manuscript; M.S.K. and M.K. supervised the study; B.S.K., C.R., A.S., P.D., J.S.G., N.M. and S.-M.C. provided valuable feedback to this study. All authors have read and agreed to the published version of the manuscript.

Funding

This work was supported by the Dongguk University Research Fund of 2021-2022.

Institutional Review Board Statement

Not applicable.

Informed Consent Statement

Not applicable.

Data Availability Statement

Data are available in the manuscript and in the Supplementary Materials.

Acknowledgments

M.K. would like to Acknowledge the Department of Life Science, Dongguk University, for providing infrastructure to carry out experiments.

Conflicts of Interest

The authors declare no conflict of interest.

References

  1. Wang, Y.-M.; Yang, Q.; Liu, Y.-J.; Yang, H.-L. Molecular evolution and expression divergence of the aconitase (ACO) gene family in land plants. Front. Plant Sci. 2016, 7, 1879. [Google Scholar] [CrossRef] [PubMed] [Green Version]
  2. Schnarrenberger, C.; Martin, W. Evolution of the enzymes of the citric acid cycle and the glyoxylate cycle of higher plants: A case study of endosymbiotic gene transfer. Eur. J. Biochem. 2002, 269, 868–883. [Google Scholar] [CrossRef] [PubMed] [Green Version]
  3. Nunes-Nesi, A.; Araújo, W.L.; Obata, T.; Fernie, A.R. Regulation of the mitochondrial tricarboxylic acid cycle. Curr. Opin. Plant Biol. 2013, 16, 335–343. [Google Scholar] [CrossRef] [PubMed]
  4. Peyret, P.; Perez, P.; Alric, M. Structure, Genomic Organization, and Expression of the Arabidopsis thaliana Aconitase Gene: Plant aconitase show significant homology with mammalian iron-responsive element-binding protein (∗). J. Biol. Chem. 1995, 270, 8131–8137. [Google Scholar] [CrossRef] [PubMed] [Green Version]
  5. Beinert, H.; Kennedy, M.C.; Stout, C.D. Aconitase as iron− sulfur protein, enzyme, and iron-regulatory protein. Chem. Rev. 1996, 96, 2335–2374. [Google Scholar] [CrossRef]
  6. Kesawat, M.S.; Das, B.K.; Kumar, M.; Bhaganagare, G.R. An overview on Fe–S protein biogenesis from prokaryotes to eukaryotes. Biol. Nitrogen Fixat. 2015, 57–74. [Google Scholar] [CrossRef]
  7. Kesawat, M.S.; Das, B.K.; Bhaganagare, G.R. Genome-wide identification, evolutionary and expression analyses of putative Fe–S biogenesis genes in rice (Oryza sativa). Genome 2012, 55, 571–583. [Google Scholar] [CrossRef]
  8. Matasova, L.; Popova, T. Aconitate hydratase of mammals under oxidative stress. Biochemistry 2008, 73, 957–964. [Google Scholar] [CrossRef]
  9. Lushchak, O.V.; Piroddi, M.; Galli, F.; Lushchak, V.I. Aconitase post-translational modification as a key in linkage between Krebs cycle, iron homeostasis, redox signaling, and metabolism of reactive oxygen species. Redox Rep. 2014, 19, 8–15. [Google Scholar] [CrossRef] [Green Version]
  10. Hentze, M.W.; Kühn, L.C. Molecular control of vertebrate iron metabolism: mRNA-based regulatory circuits operated by iron, nitric oxide, and oxidative stress. Proc. Natl. Acad. Sci. USA 1996, 93, 8175–8182. [Google Scholar] [CrossRef]
  11. Navarre, D.A.; Wendehenne, D.; Durner, J.; Noad, R.; Klessig, D.F. Nitric oxide modulates the activity of tobacco aconitase. Plant Physiol. 2000, 122, 573–582. [Google Scholar] [CrossRef] [Green Version]
  12. Arnaud, N.; Ravet, K.; Borlotti, A.; Touraine, B.; Boucherez, J.; Fizames, C.; Briat, J.-F.; Cellier, F.; Gaymard, F. The iron-responsive element (IRE)/iron-regulatory protein 1 (IRP1)–cytosolic aconitase iron-regulatory switch does not operate in plants. Biochem. J. 2007, 405, 523–531. [Google Scholar] [CrossRef] [Green Version]
  13. Moeder, W.; Del Pozo, O.; Navarre, D.A.; Martin, G.B.; Klessig, D.F. Aconitase plays a role in regulating resistance to oxidative stress and cell death in Arabidopsis and Nicotiana benthamiana. Plant Mol. Biol. 2007, 63, 273–287. [Google Scholar] [CrossRef]
  14. Kruft, V.; Eubel, H.; Jänsch, L.; Werhahn, W.; Braun, H.-P. Proteomic approach to identify novel mitochondrial proteins in Arabidopsis. Plant Physiol. 2001, 127, 1694–1710. [Google Scholar] [CrossRef]
  15. Heazlewood, J.L.; Tonti-Filippini, J.S.; Gout, A.M.; Day, D.A.; Whelan, J.; Millar, A.H. Experimental analysis of the Arabidopsis mitochondrial proteome highlights signaling and regulatory components, provides assessment of targeting prediction programs, and indicates plant-specific mitochondrial proteins. Plant Cell 2004, 16, 241–256. [Google Scholar] [CrossRef] [Green Version]
  16. Carrari, F.; Nunes-Nesi, A.; Gibon, Y.; Lytovchenko, A.; Loureiro, M.E.; Fernie, A.R. Reduced expression of aconitase results in an enhanced rate of photosynthesis and marked shifts in carbon partitioning in illuminated leaves of wild species tomato. Plant Physiol. 2003, 133, 1322–1335. [Google Scholar] [CrossRef] [Green Version]
  17. Hayashi, M.; De Bellis, L.; Alpi, A.; Nishimura, M. Cytosolic aconitase participates in the glyoxylate cycle in etiolated pumpkin cotyledons. Plant Cell Physiol. 1995, 36, 669–680. [Google Scholar]
  18. Eastmond, P.J.; Graham, I.A. Re-examining the role of the glyoxylate cycle in oilseeds. Trends Plant Sci. 2001, 6, 72–78. [Google Scholar] [CrossRef]
  19. Borek, S.; Nuc, K. Sucrose controls storage lipid breakdown on gene expression level in germinating yellow lupine (Lupinus luteus L.) seeds. J. Plant Physiol. 2011, 168, 1795–1803. [Google Scholar] [CrossRef]
  20. Verniquet, F.; Gaillard, J.; Neuburger, M.; Douce, R. Rapid inactivation of plant aconitase by hydrogen peroxide. Biochem. J. 1991, 276, 643–648. [Google Scholar] [CrossRef] [Green Version]
  21. Terol, J.; Soler, G.; Talon, M.; Cercos, M. The aconitate hydratase family from Citrus. BMC Plant Biol. 2010, 10, 222. [Google Scholar] [CrossRef]
  22. Pascual, J.; Rahikainen, M.; Angeleri, M.; Alegre, S.; Gossens, R.; Shapiguzov, A.; Heinonen, A.; Trotta, A.; Durian, G.; Winter, Z. ACONITASE 3 is part of theANAC017 transcription factor-dependent mitochondrial dysfunction response. Plant Physiol. 2021, 186, 1859–1877. [Google Scholar] [CrossRef] [PubMed]
  23. Eprintsev, A.T.; Fedorin, D.N.; Nikitina, M.V.; Igamberdiev, A.U. Expression and properties of the mitochondrial and cytosolic forms of aconitase in maize scutellum. J. Plant Physiol. 2015, 181, 14–19. [Google Scholar] [CrossRef] [PubMed]
  24. Eprintsev, A.T.; Fedorin, D.N.; Cherkasskikh, M.V.; Igamberdiev, A.U. Regulation of expression of the mitochondrial and cytosolic forms of aconitase in maize leaves via phytochrome. Plant Physiol. Biochem. 2020, 146, 157–162. [Google Scholar] [CrossRef] [PubMed]
  25. Sweetlove, L.; Heazlewood, J.; Herald, V.; Holtzapffel, R.; Day, D.; Leaver, C.; Millar, A. The impact of oxidative stress on Arabidopsis mitochondria. Plant J. 2002, 32, 891–904. [Google Scholar] [CrossRef]
  26. Kesawat, M.S.; Kherawat, B.S.; Singh, A.; Dey, P.; Kabi, M.; Debnath, D.; Saha, D.; Khandual, A.; Rout, S.; Ali, A. Genome-wide identification and characterization of the brassinazole-resistant (BZR) gene family and its expression in the various developmental stage and stress conditions in wheat (Triticum aestivum L.). Int. J. Mol. Sci. 2021, 22, 8743. [Google Scholar] [CrossRef]
  27. Kumar, M.; Kherawat, B.S.; Dey, P.; Saha, D.; Singh, A.; Bhatia, S.K.; Ghodake, G.S.; Kadam, A.A.; Kim, H.-U.; Chung, S.-M. Genome-wide identification and characterization of PIN-FORMED (PIN) gene family reveals role in developmental and various stress conditions in Triticum aestivum L. Int. J. Mol. Sci. 2021, 22, 7396. [Google Scholar] [CrossRef]
  28. Kesawat, M.S.; Kherawat, B.S.; Singh, A.; Dey, P.; Routray, S.; Mohapatra, C.; Saha, D.; Ram, C.; Siddique, K.H.; Kumar, A. Genome-Wide Analysis and Characterization of the Proline-Rich Extensin-like Receptor Kinases (PERKs) Gene Family Reveals Their Role in Different Developmental Stages and Stress Conditions in Wheat (Triticum aestivum L.). Plants 2022, 11, 496. [Google Scholar] [CrossRef]
  29. Consortium, I.W.G.S.; Appels, R.; Eversole, K.; Stein, N.; Feuillet, C.; Keller, B.; Rogers, J.; Pozniak, C.J.; Choulet, F.; Distelfeld, A. Shifting the limits in wheat research and breeding using a fully annotated reference genome. Science 2018, 361, eaar7191. [Google Scholar]
  30. Shiferaw, B.; Smale, M.; Braun, H.-J.; Duveiller, E.; Reynolds, M.; Muricho, G. Crops that feed the world 10. Past successes and future challenges to the role played by wheat in global Food Security. Food Secur. 2013, 5, 291–317. [Google Scholar] [CrossRef] [Green Version]
  31. Macauley, H.; Ramadjita, T. Cereal Crops: Rice, Maize, Millet, Sorghum, Wheat; Abdou Diouf International Conference Centre: Sebi Ponty, Senegal, 2015. [Google Scholar]
  32. Joshi, A.; Mishra, B.; Chatrath, R.; Ortiz Ferrara, G.; Singh, R.P. Wheat improvement in India: Present status, emerging challenges and future prospects. Euphytica 2007, 157, 431–446. [Google Scholar] [CrossRef]
  33. Kumar, P.; Yadava, R.; Gollen, B.; Kumar, S.; Verma, R.K.; Yadav, S. Nutritional contents and medicinal properties of wheat: A review. Life Sci. Med. Res. 2011, 22, 1–10. [Google Scholar]
  34. Sharma, I.; Tyagi, B.; Singh, G.; Venkatesh, K.; Gupta, O. Enhancing wheat production-A global perspective. Indian J. Agricul. Sci. 2015, 85, 3–13. [Google Scholar]
  35. Laghari, K.A.; Sial, M.A.; Arain, M.A. Effect of high temperature stress on grain yield and yield components of wheat (Triticum aestivum L.). J. Sci. Technol. Devel. 2012, 31, 83–90. [Google Scholar]
  36. Afzal, F.; Chaudhari, S.K.; Gul, A.; Farooq, A.; Ali, H.; Nisar, S.; Sarfraz, B.; Shehzadi, K.J.; Mujeeb-Kazi, A. Bread wheat (Triticum aestivum L.) under biotic and abiotic stresses: An overview. Crop Prod. Glob. Environ. Issues 2015, 293–317. [Google Scholar] [CrossRef]
  37. Limbalkar, O.M.; Meena, K.; Singh, M.; Sunilkumar, V. Genetic improvement of wheat for biotic and abiotic stress tolerance. Int J Curr Microbiol App Sci 2018, 7, 1962–1971. [Google Scholar] [CrossRef]
  38. He, Y.; Mawhinney, T.P.; Preuss, M.L.; Schroeder, A.C.; Chen, B.; Abraham, L.; Jez, J.M.; Chen, S. A redox-active isopropylmalate dehydrogenase functions in the biosynthesis of glucosinolates and leucine in Arabidopsis. Plant J. 2009, 60, 679–690. [Google Scholar] [CrossRef]
  39. He, Y.; Chen, L.; Zhou, Y.; Mawhinney, T.P.; Chen, B.; Kang, B.H.; Hauser, B.A.; Chen, S. Functional characterization of Arabidopsis thaliana isopropylmalate dehydrogenases reveals their important roles in gametophyte development. New Phytol. 2011, 189, 160–175. [Google Scholar] [CrossRef]
  40. Wiegand, G.; Remington, S.J. Citrate synthase: Structure, control, and mechanism. Annu. Rev. Biophys. Biophys. Chem. 1986, 15, 97–117. [Google Scholar] [CrossRef]
  41. La Cognata, U.; Landschütze, V.; Willmitzer, L.; Müller-Röber, B. Structure and expression of mitochondrial citrate synthases from higher plants. Plant Cell Physiol. 1996, 37, 1022–1029. [Google Scholar] [CrossRef] [Green Version]
  42. Lespinet, O.; Wolf, Y.I.; Koonin, E.V.; Aravind, L. The role of lineage-specific gene family expansion in the evolution of eukaryotes. Genome Res. 2002, 12, 1048–1059. [Google Scholar] [CrossRef] [PubMed] [Green Version]
  43. Lawton-Rauh, A. Evolutionary dynamics of duplicated genes in plants. Mol. Phylogenet. Evol. 2003, 29, 396–409. [Google Scholar] [CrossRef] [PubMed]
  44. Moore, R.C.; Purugganan, M.D. The early stages of duplicate gene evolution. Proc. Natl. Acad. Sci. USA 2003, 100, 15682–15687. [Google Scholar] [CrossRef] [PubMed] [Green Version]
  45. Faraji, S.; Heidari, P.; Amouei, H.; Filiz, E. Abdullah, and Poczai, P. Investigation and computational analysis of the sulfotransferase (Sot) gene family in potato (solanum tuberosum): Insights into sulfur adjustment for proper development and stimuli responses. Plants 2021, 10, 2597. [Google Scholar] [CrossRef] [PubMed]
  46. Heidari, P.; Faraji, S.; Poczai, P. Magnesium transporter gene family: Genome-wide identification and characterization in Theobroma cacao, Corchorus capsularis, and Gossypium hirsutum of family malvaceae. Agronomy 2021, 11, 1651. [Google Scholar] [CrossRef]
  47. William Roy, S.; Gilbert, W. The evolution of spliceosomal introns: Patterns, puzzles and progress. Nat. Rev. Genet. 2006, 7, 211–221. [Google Scholar] [CrossRef]
  48. Roy, S.W.; Penny, D. Patterns of intron loss and gain in plants: Intron loss–dominated evolution and genome-wide comparison of O. sativa and A. thaliana. Mol. Biol. Evol. 2007, 24, 171–181. [Google Scholar] [CrossRef] [Green Version]
  49. Liu, H.; Lyu, H.M.; Zhu, K.; Van de Peer, Y.; Cheng, Z.M. The emergence and evolution of intron-poor and intronless genes in intron-rich plant gene families. Plant J. 2021, 105, 1072–1082. [Google Scholar] [CrossRef]
  50. Lecharny, A.; Boudet, N.; Gy, I.; Aubourg, S.; Kreis, M. Introns in, introns out in plant gene families: A genomic approach of the dynamics of gene structure. J. Struct. Funct. Genom. 2003, 3, 111–116. [Google Scholar] [CrossRef]
  51. Yang, Z.; Gong, Q.; Wang, L.; Jin, Y.; Xi, J.; Li, Z.; Qin, W.; Yang, Z.; Lu, L.; Chen, Q. Genome-wide study of YABBY genes in upland cotton and their expression patterns under different stresses. Front. Genet. 2018, 9, 33. [Google Scholar] [CrossRef] [Green Version]
  52. Hernandez-Garcia, C.M.; Finer, J.J. Identification and validation of promoters and cis-acting regulatory elements. Plant Sci. 2014, 217, 109–119. [Google Scholar] [CrossRef] [Green Version]
  53. Roy, A.L.; Sen, R.; Roeder, R.G. Enhancer–promoter communication and transcriptional regulation of Igh. Trends Immunol. 2011, 32, 532–539. [Google Scholar] [CrossRef] [Green Version]
  54. Roy, A.L.; Singer, D.S. Core promoters in transcription: Old problem, new insights. Trends Biochem. Sci. 2015, 40, 165–171. [Google Scholar] [CrossRef] [Green Version]
  55. Zhang, Y.; Wong, C.-H.; Birnbaum, R.Y.; Li, G.; Favaro, R.; Ngan, C.Y.; Lim, J.; Tai, E.; Poh, H.M.; Wong, E. Chromatin connectivity maps reveal dynamic promoter–enhancer long-range associations. Nature 2013, 504, 306–310. [Google Scholar] [CrossRef] [Green Version]
  56. Cheng, Y.; Tang, Q.; Li, Y.; Zhang, Y.; Zhao, C.; Yan, J.; You, H. Folding/unfolding kinetics of G-quadruplexes upstream of the P1 promoter of the human BCL-2 oncogene. J. Biol. Chem. 2019, 294, 5890–5895. [Google Scholar] [CrossRef]
  57. Fankhauser, C.; Chory, J. Light control of plant development. Annu. Rev. Cell Dev. Biol. 1997, 13, 203–229. [Google Scholar] [CrossRef] [Green Version]
  58. Rasmusson, A.G.; Escobar, M.A. Light and diurnal regulation of plant respiratory gene expression. Physiol. Plant. 2007, 129, 57–67. [Google Scholar] [CrossRef]
  59. Tepperman, J.M.; Hudson, M.E.; Khanna, R.; Zhu, T.; Chang, S.H.; Wang, X.; Quail, P.H. Expression profiling of phyB mutant demonstrates substantial contribution of other phytochromes to red-light-regulated gene expression during seedling de-etiolation. Plant J. 2004, 38, 725–739. [Google Scholar] [CrossRef]
  60. Kim, S.-Y.; Marekov, L.; Bubber, P.; Browne, S.E.; Stavrovskaya, I.; Lee, J.; Steinert, P.M.; Blass, J.P.; Beal, M.F.; Gibson, G.E. Mitochondrial aconitase is a transglutaminase 2 substrate: Transglutamination is a probable mechanism contributing to high-molecular-weight aggregates of aconitase and loss of aconitase activity in Huntington disease brain. Neurochem. Res. 2005, 30, 1245–1255. [Google Scholar] [CrossRef]
  61. Regev-Rudzki, N.; Karniely, S.; Ben-Haim, N.N.; Pines, O. Yeast aconitase in two locations and two metabolic pathways: Seeing small amounts is believing. Mol. Biol. Cell 2005, 16, 4163–4171. [Google Scholar] [CrossRef] [Green Version]
  62. Chen, X.J.; Wang, X.; Butow, R.A. Yeast aconitase binds and provides metabolically coupled protection to mitochondrial DNA. Proc. Natl. Acad. Sci. USA 2007, 104, 13738–13743. [Google Scholar] [CrossRef] [PubMed] [Green Version]
  63. Cheng, Z.; Tsuda, M.; Kishita, Y.; Sato, Y.; Aigaki, T. Impaired energy metabolism in a Drosophila model of mitochondrial aconitase deficiency. Biochem. Biophys. Res. Commun. 2013, 433, 145–150. [Google Scholar] [CrossRef] [PubMed]
  64. Fernie, A.R.; Carrari, F.; Sweetlove, L.J. Respiratory metabolism: Glycolysis, the TCA cycle and mitochondrial electron transport. Curr. Opin. Plant Biol. 2004, 7, 254–261. [Google Scholar] [CrossRef] [PubMed]
  65. Bota, D.A.; Van Remmen, H.; Davies, K.J. Modulation of Lon protease activity and aconitase turnover during aging and oxidative stress. FEBS Lett. 2002, 532, 103–106. [Google Scholar] [CrossRef] [PubMed] [Green Version]
  66. Vanlerberghe, G.C.; Mclntosh, L. Signals regulating the expression of the nuclear gene encoding alternative oxidase of plant mitochondria. Plant Physiol. 1996, 111, 589–595. [Google Scholar] [CrossRef] [PubMed]
  67. Hunter, S.; Apweiler, R.; Attwood, T.K.; Bairoch, A.; Bateman, A.; Binns, D.; Bork, P.; Das, U.; Daugherty, L.; Duquenne, L. InterPro: The integrative protein signature database. Nucleic Acids Res. 2009, 37 (Suppl. S1), D211–D215. [Google Scholar] [CrossRef] [Green Version]
  68. Bilmes, J.A. What HMMs can do. IEICE Trans. Inf. Syst. 2006, 89, 869–891. [Google Scholar] [CrossRef]
  69. Marchler-Bauer, A.; Derbyshire, M.K.; Gonzales, N.R.; Lu, S.; Chitsaz, F.; Geer, L.Y.; Geer, R.C.; He, J.; Gwadz, M.; Hurwitz, D.I. CDD: NCBI’s conserved domain database. Nucleic Acids Res. 2015, 43, D222–D226. [Google Scholar] [CrossRef] [Green Version]
  70. Gasteiger, E.; Gattiker, A.; Hoogland, C.; Ivanyi, I.; Appel, R.D.; Bairoch, A. ExPASy: The proteomics server for in-depth protein knowledge and analysis. Nucleic Acids Res. 2003, 31, 3784–3788. [Google Scholar] [CrossRef] [Green Version]
  71. Kozlowski, L.P. IPC–isoelectric point calculator. Biol. Direct 2016, 11, 1–16. [Google Scholar] [CrossRef] [Green Version]
  72. Wang, Y.; Tang, H.; DeBarry, J.D.; Tan, X.; Li, J.; Wang, X.; Lee, T.-h.; Jin, H.; Marler, B.; Guo, H. MCScanX: A toolkit for detection and evolutionary analysis of gene synteny and collinearity. Nucleic Acids Res. 2012, 40, e49. [Google Scholar] [CrossRef] [PubMed] [Green Version]
  73. Chen, C.; Chen, H.; Zhang, Y.; Thomas, H.R.; Frank, M.H.; He, Y.; Xia, R. TBtools: An integrative toolkit developed for interactive analyses of big biological data. Mol. Plant 2020, 13, 1194–1202. [Google Scholar] [CrossRef] [PubMed]
  74. Metsalu, T.; Vilo, J. ClustVis: A web tool for visualizing clustering of multivariate data using Principal Component Analysis and heatmap. Nucleic Acids Res. 2015, 43, W566–W570. [Google Scholar] [CrossRef] [PubMed]
  75. Kim, D.K.; Kesawat, M.S.; Hong, C.B. One gene member of the ADP-ribosylation factor family is heat-inducible and enhances seed germination in Nicotiana tabacum. Genes Genom. 2017, 39, 1353–1365. [Google Scholar] [CrossRef]
  76. Kesawat, M.S.; Kim, D.K.; Zeba, N.; Suh, M.C.; Xia, X.; Hong, C.B. Ectopic RING zinc finger gene from hot pepper induces totally different genes in lettuce and tobacco. Mol. Breed. 2018, 38, 1–24. [Google Scholar] [CrossRef]
  77. Livak, K.J.; Schmittgen, T.D. Analysis of relative gene expression data using real-time quantitative PCR and the 2− ΔΔCT method. Methods 2001, 25, 402–408. [Google Scholar] [CrossRef]
  78. Narancio, R.; John, U.; Mason, J.; Spangenberg, G. Selection of optimal reference genes for quantitative RT-PCR transcript abundance analysis in white clover (Trifolium repens L.). Funct. Plant Biol. 2018, 45, 737–744. [Google Scholar] [CrossRef]
Figure 1. Phylogenetic analysis of ACO proteins among the rice (3) wheat (15), Arabidopsis (3), soybean (8), Brachypodium (2), Sorghum (4), Physcomitrella (4), and Selaginella (4) using the MEGAX by the neighbor-joining (NJ) method and the bootstrap was 1000 repeats.
Plants 11 03475 g001
Figure 2. Chromosomal locations of identified ACO genes on the three sub-genomes of wheat. Schematic chromosomal location of ACO genes on the different chromosomes, whereas gene name is mentioned on the right side. The different colored sphere indicates the position of the ACO genes on the wheat chromosomes. The chromosome numbers are shown above the chromosomes.
Plants 11 03475 g002
Figure 3. Chromosomal location and duplicated ACO genes in T. aestivum. Duplicated ACO genes are linked with distinct color lines and the figure was produced via TB tools.
Plants 11 03475 g003
Figure 4. Syntenic connections of TaACO genes between A. tauschii, B. distachyon, O. sativa, and A. thaliana. The gray lines in the background denote the collinear blocks within T. aestivum and other plant species genomes, whereas the red lines indicate the syntenic ACO gene pairs.
Plants 11 03475 g004
Figure 5. Gene structure organization of the TaACO genes. Blue boxes indicate the untranslated regions, yellow boxes denote the exons, and dark black lines signify the introns. The lengths of black lines and boxes are based on gene length.
Plants 11 03475 g005
Figure 6. The motifs of TaACO genes are predicted by MEME. Distinct colored boxes denoting the various preserved motifs having differing sizes and sequences.
Plants 11 03475 g006
Figure 7. Cis-acting regulatory elements (CAREs) predicted in the TaACO promoters using the PlantCARE website. (A) The different colors represent the various CARE-related to phytohormone, defense and stress, growth, and development. (B) Most frequently predicted CAREs in the TaACO promoter regions.
Plants 11 03475 g007
Figure 8. Heatmap demonstrating expression pattern of the TaACOs in different tissues and developmental stages. Columns indicate genes and rows denote different tissues and developmental stages. TPM numbers were directly used to produce the heatmaps.
Plants 11 03475 g008
Figure 9. qRT-PCR analysis of randomly selected TaACO genes in different stress conditions to validate RNA seq data. The wheat actin gene was used as the internal control. The Asterisk denotes significant variances compared to the control, top of the bars signifies outcomes of the Tukey HSD test at the <0.05 (* p < 0.05) ** p lies in between the values of 0.05 and 0.001, and <0.001 level (*** p < 0.001). *** meaning expression is significantly induced compared with others. Error bars display standard deviation (SD). Data are mean ± SD (n = 3).
Plants 11 03475 g009
Figure 10. Protein–protein interaction (PPI) analysis of TaACOs proteins. PPI network generated via STRINGV9.1. Each knob denotes a protein, each edge represents an interaction.
Plants 11 03475 g010
Table 1. Nomenclature and characteristics of the aconitase (ACOs) genes in wheat was detected using different computational tools.
Proposed Gene NameGene IDGenomic LocationOrientationCDS Length (bp)Protein Length (aa)Protein NameMolecular Weight (KDa)Isoelectric Point (pI)GRAVYPredicted Subcellular Localization
TaACO1TraesCS2B02G1819002B:156914707-156922970Reverse1506501Hypothetical protein CFC21_02235354.796.09−0.202mitochondrion
TaACO2TraesCS3A02G1840003A:214122773-214123221Reverse30241007Putative aconitate hydratase, cytoplasmic isoform109.326.50−0.132chloroplast thylakoid membrane
TaACO3TraesCS3B02G2138003B:253633139-253633475Reverse1971656Putative aconitate hydratase, cytoplasmic71.295.92−0.155cytoplasm
TaACO4TraesCS3B02G2139003B:253666186-253666845Reverse30151004Putative aconitate hydratase, cytoplasmic isoform 108.956.59−0.153chloroplast thylakoid membrane
TaACO5TraesCS3D02G1882003D:174907841-174908490Reverse30151004Putative aconitate hydratase, cytoplasmic isoform108.896.38−0.123mitochondrion
TaACO6TraesCS4B02G3351004B:626011015-626011628Reverse2400799Putative aconitate hydratase, cytoplasmic86.75.98−0.073extracellular space
TaACO7TraesCS5A02G5050005A:670410810-670411419Reverse2988995Putative aconitate hydratase, cytoplasmic106.936.60−0.128chloroplast thylakoid membrane
TaACO8TraesCS6A02G0806006A:49189960-49195152Forward15335103-isopropylmalate dehydratase large subunit, chloroplastic-like55.166.43−0.218chloroplast thylakoid membrane
TaACO9TraesCS6A02G4000006A:609449354-609450370Forward2931976Putative aconitate hydratase, cytoplasmic106.26.41−0.184chloroplast thylakoid lumen
TaACO10TraesCS6B02G1081006B:88711659-88715726Forward1434477Hypothetical protein CFC21_10194851.925.97−0.221chloroplast thylakoid membrane
TaACO11TraesCS6B02G4402006B:705380681-705381704Forward2934977Putative aconitate hydratase, cytoplasmic106.316.37−0.209chloroplast
TaACO12TraesCS6D02G0743006D:37921196-37926065Forward15335103-isopropylmalate dehydratase large subunit, chloroplastic-like55.136.43−0.227chloroplast thylakoid membrane
TaACO13TraesCS6D02G3842006D:462627391-462628393Forward2928975Putative aconitate hydratase, cytoplasmic106.156.35−0.174chloroplast thylakoid lumen
TaACO14TraesCS7A02G2191007A:186527123-186528324Reverse2715904Aconitate hydratase, cytoplasmic-like99.85.67−0.145cytoplasm
TaACO15TraesCS7D02G2230007D:184190377-184191564Forward2067688Aconitate hydratase, cytoplasmic isoform75.716.19−0.156cytoplasm
MW: molecular weight; KDa: Kilo Dalton; aa: amino acids; bp: base pair; ID: identity; pI: isoelectric point.
Publisher’s Note: MDPI stays neutral with regard to jurisdictional claims in published maps and institutional affiliations.

