
The Other Mechanisms by Which the Rht Genes Improve the Harvest Index of Wheat


Abstract
:1. Introduction
2. Material and Methods
2.1. Plant Height Measurement
2.2. The A/Ci Responses Curve Measurement and Amax Determination
2.3. Specific Leaf Area (cm² g−¹) Measurement
2.4. Carbon Discrimination (Δ13C) Measurement
2.5. The Yield Components and Harvest Index Measurements
2.6. The 1⁵N Labeling and Sampling
2.7. The 15N-Enrichment Calculations
2.8. Statistical Analysis
3. Results
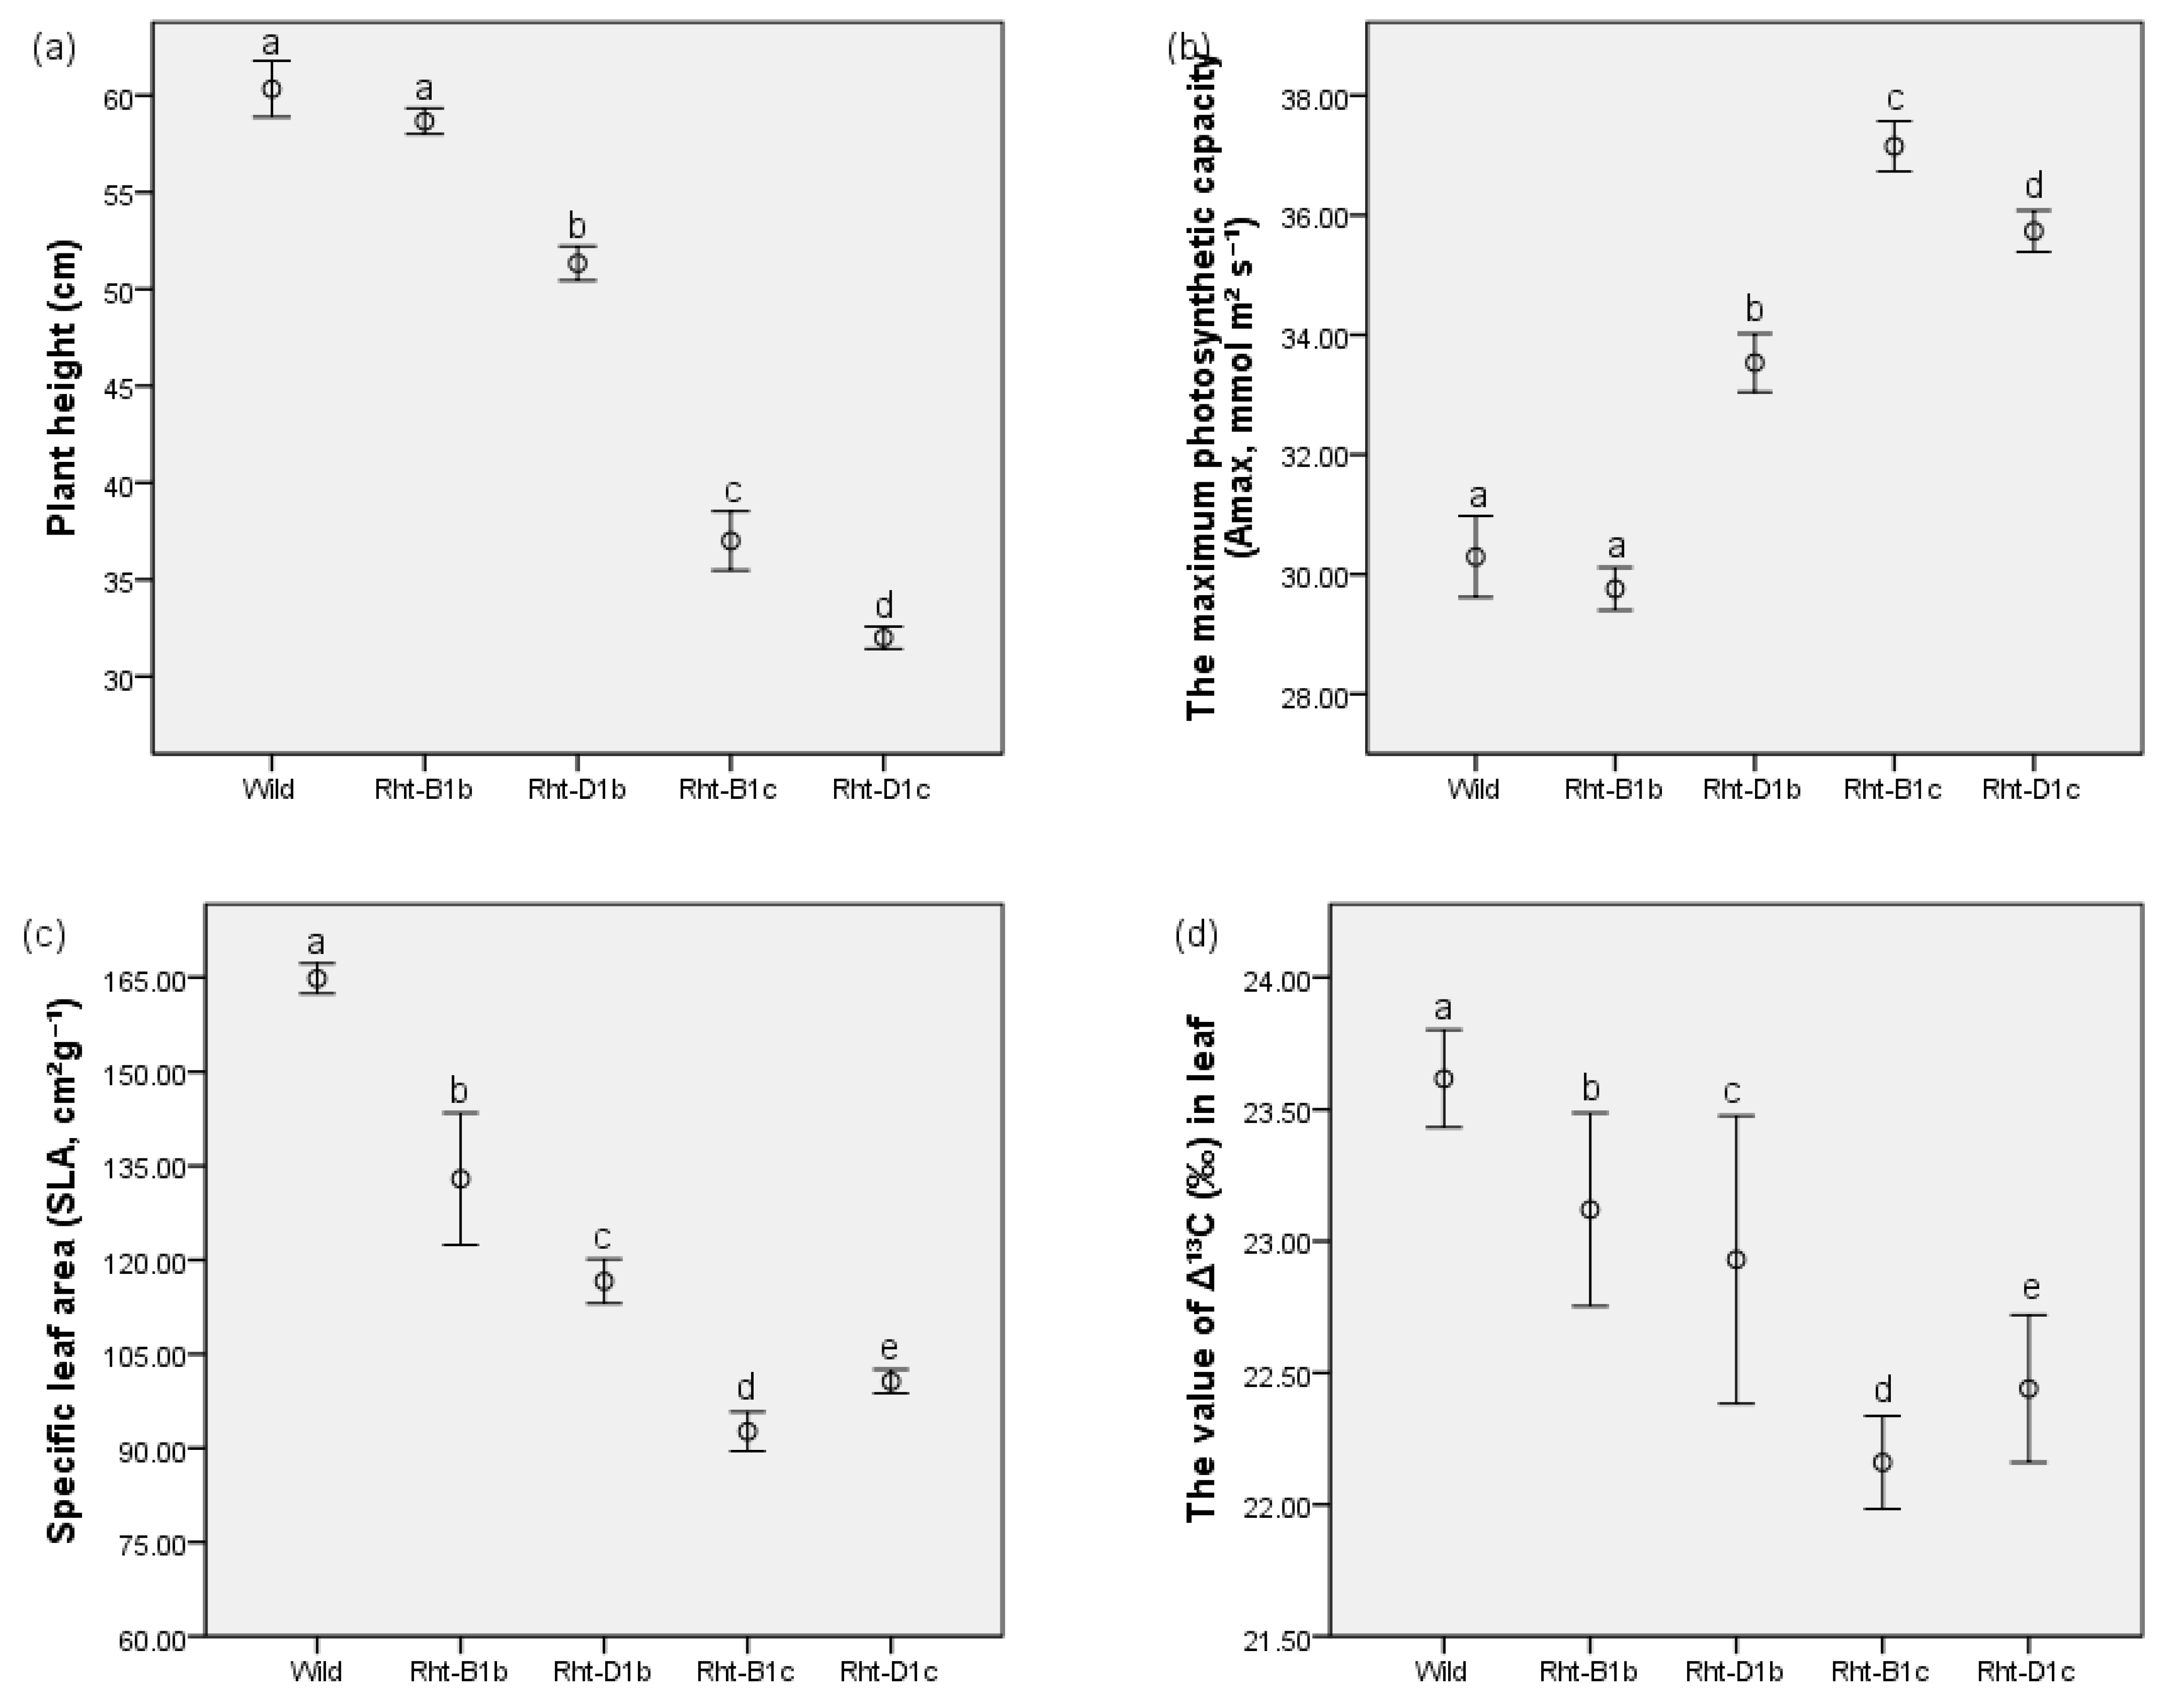
3.1. Plant Height
3.2. The Effects of Straw-Shortening on Photosynthesis
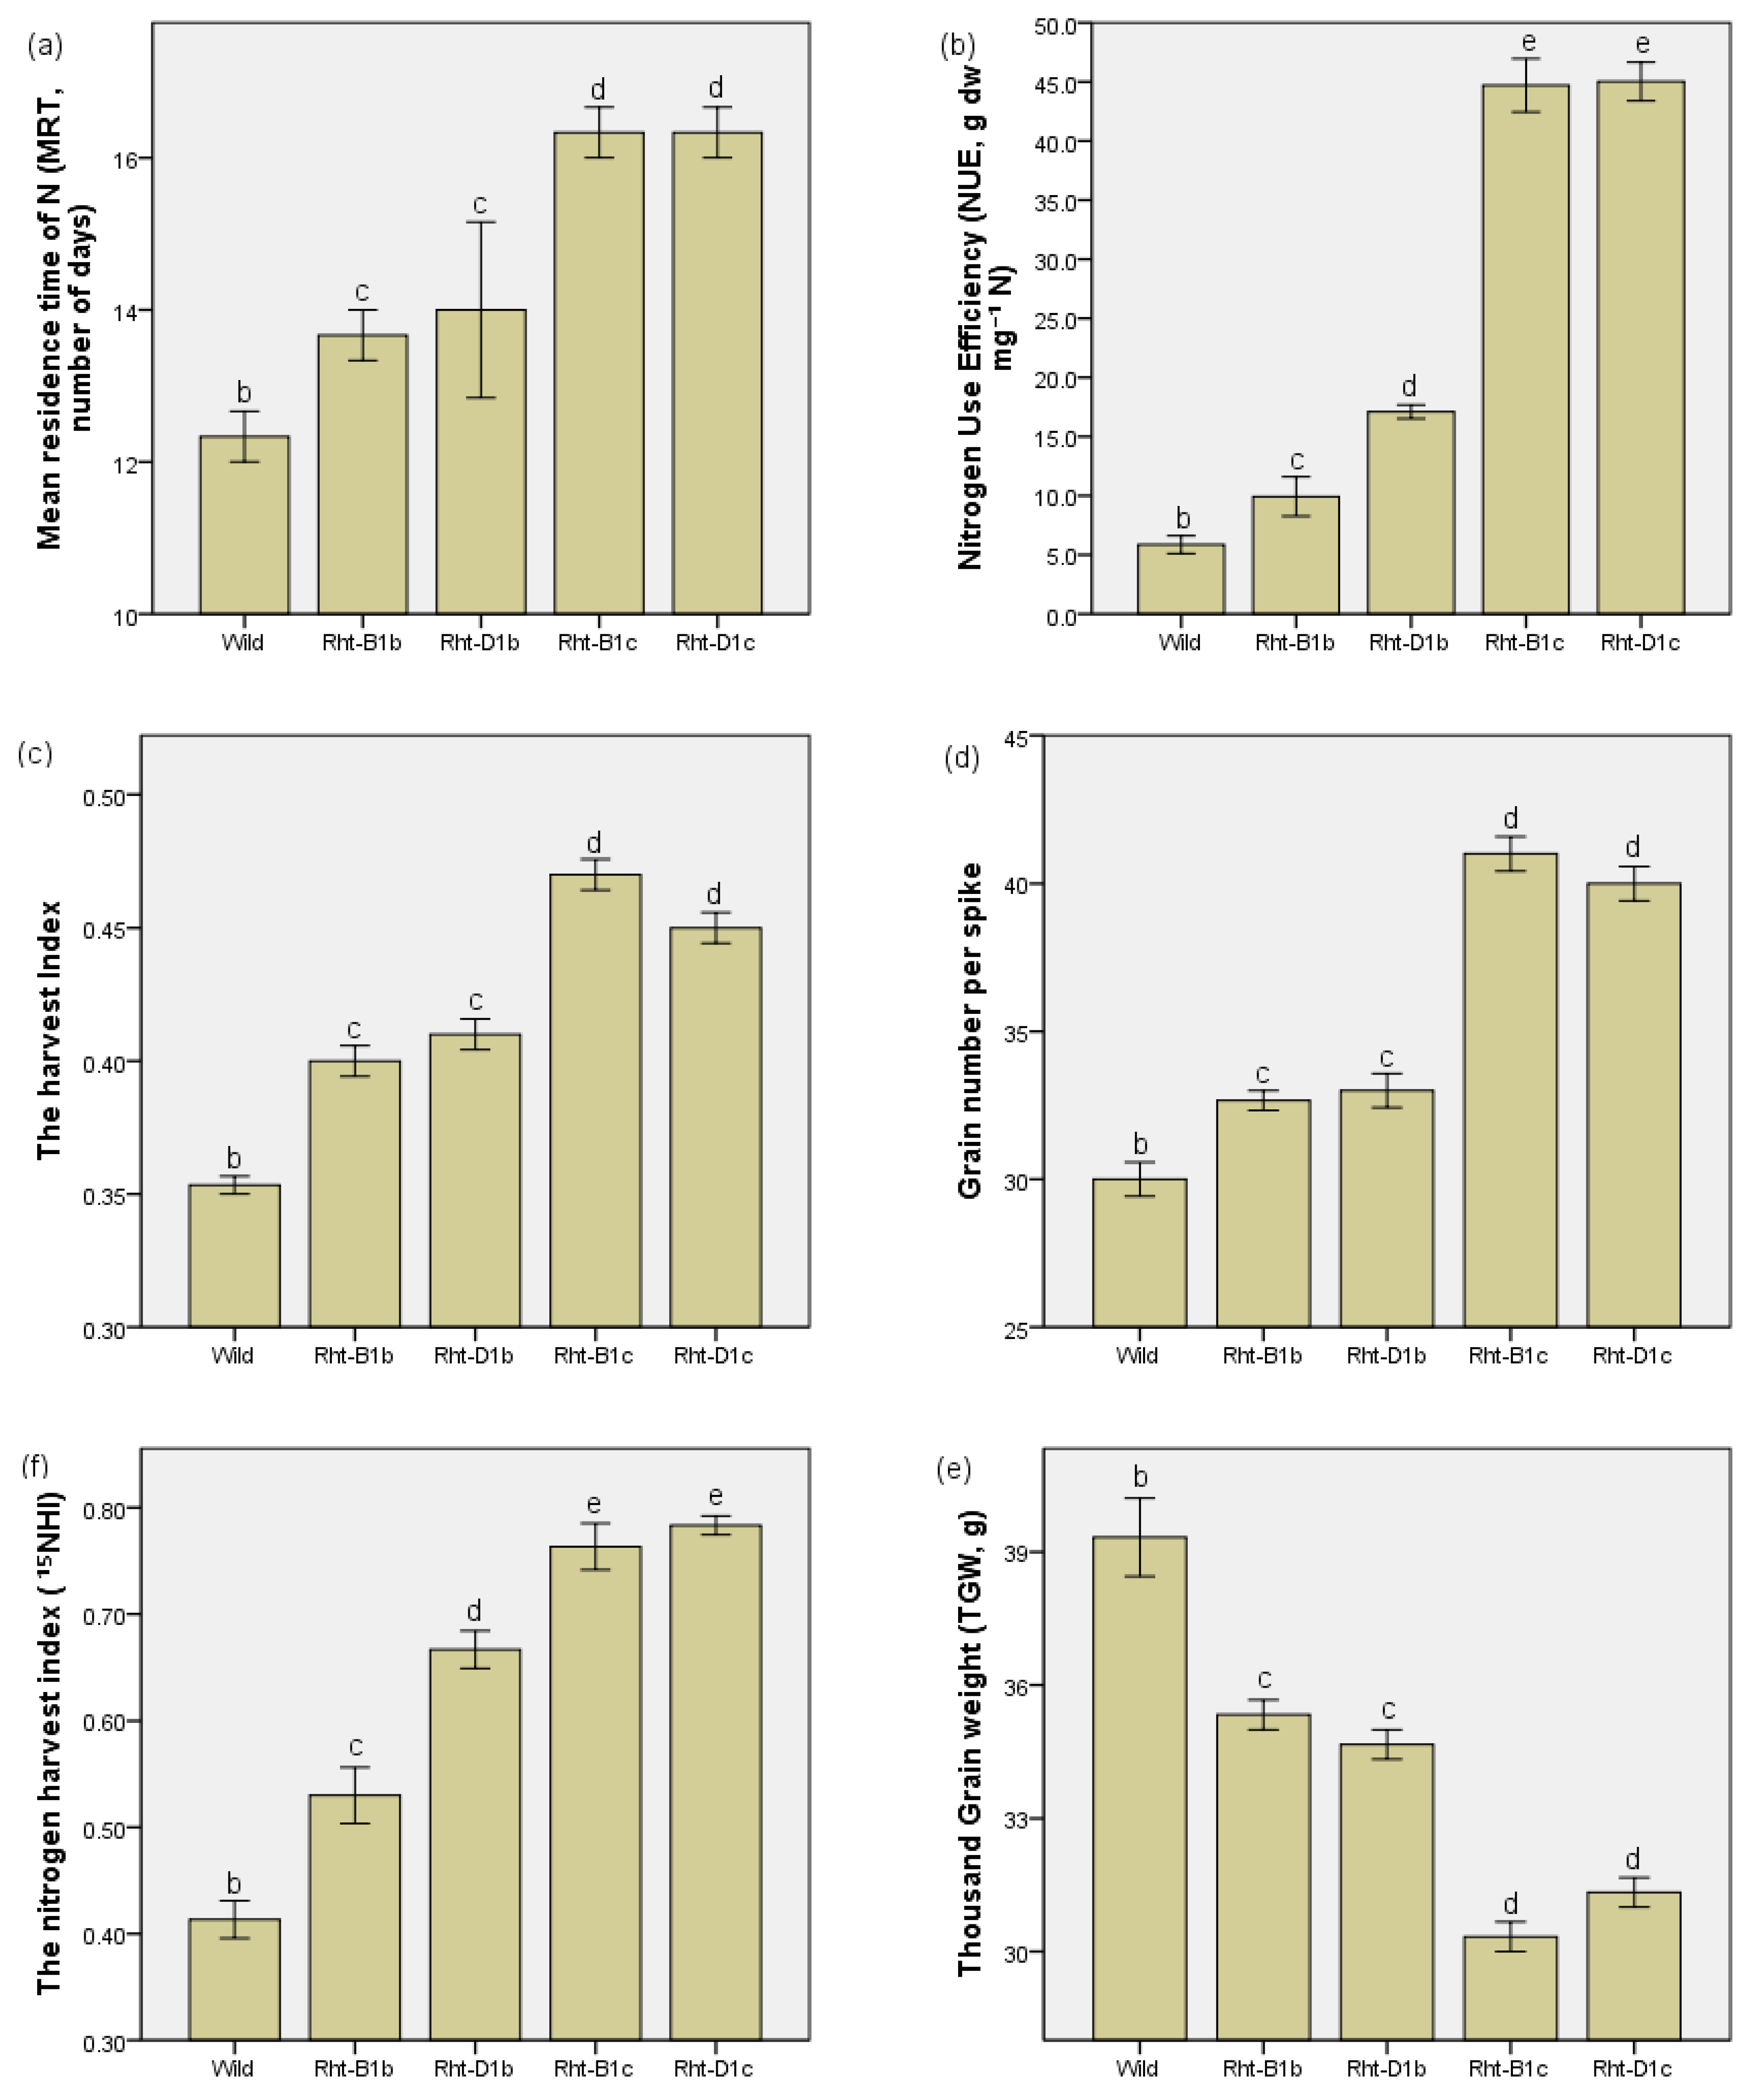
3.3. The Effects of Straw Shortening on the MRT of N, Harvest Index, and Grain Number on Spike
4. Discussion
Author Contributions
Funding
Institutional Review Board Statement
Informed Consent Statement
Data Availability Statement
Conflicts of Interest
References
- Youssefian, S.; Kirby, E.J.M.; Gale, M.D. Pleiotropic effects of the GA insensitive Rht dwarfing genes in wheat. II. Effects on leaf, stem, ear, and floret growth. Field Crops Res. 1992, 28, 191–210. [Google Scholar] [CrossRef]
- Youssefian, S.; Kirby, E.J.M.; Gale, M.D. Pleiotropic effects of the GA insensitive Rht dwarfing genes in wheat. I. Effects on the development of the ear, stem and leaves. Field Crops Res. 1992, 28, 179–190. [Google Scholar] [CrossRef]
- Reynolds, M.; Bonnet, D.; Chapman, C.S.; Furbank, T.R.; Mane, Y.; Mather, E.D.; Parry, M. Raising yield potential of wheat. I. Overview of consortium approach and breeding strategies. J. Exp. Bot. 2011, 62, 439–452. [Google Scholar] [CrossRef] [PubMed] [Green Version]
- Fischer, R.A. Wheat physiology: A review of recent developments. Crop Pasture Sci. 2011, 62, 95–114. [Google Scholar] [CrossRef] [Green Version]
- Li, S.; Tian, Y.; Wu, K.; Ye, W.; Yu, J.; Zhang, J.; Liu, Q.; Hu, M.; Li, H.; Tong, Y.; et al. Modulating plant growth–metabolism coordination for sustainable agriculture. Nature 2018, 560, 595–600. [Google Scholar] [CrossRef]
- Calderini, D.F.; Dreccer, M.F.; Slafer, G.A. Genetic improvement in wheat yield and associated traits. A reexamination of previous results and the latest trends. Plant Breed. 1995, 114, 108–112. [Google Scholar] [CrossRef]
- Pingali, P.L. Green revolution: Impacts, limits, and the path ahead. Proc. Natl. Acad. Sci. USA. 2012, 109, 12302–12308. [Google Scholar] [CrossRef] [PubMed] [Green Version]
- Wu, K.; Wang, S.; Song, W.; Zhang, J.; Wang, Y.; Liu, Q.; Yu, J.; Ye, Y.; Li, S.; Chen, J.; et al. Enhanced sustainable green revolution yield via nitrogen-responsive chromatin modulation in rice. Science 2020, 367, 641. [Google Scholar] [CrossRef]
- Miralles, D.J.; Slafer, A. Individual grain weight responses to genetic reduction in culm length in wheat as affected by source-sink manipulations. Field Crops Res. 1995, 43, 55–66. [Google Scholar] [CrossRef]
- Berry, P.M.; Kendall, S.; Rutterford, Z.; Orford, S.; Griffiths, S. Historical analysis of the effects of breeding on the height of winter wheat (Triticum aestivum L.) and consequences for lodging. Euphytica 2014, 203, 375–383. [Google Scholar] [CrossRef]
- Foulkes, M.J.; Snape, J.W.; Shearman, V.J.; Reynolds, M.; Gaju, O.; Sylvester-Bradley, R. Genetic progress in yield potential in wheat: Recent advances and future prospects. J. Agric. Sci. 2007, 145, 17–29. [Google Scholar] [CrossRef]
- Shearman, V.J.; Sylvester-Bradley, R.; Scott, R.K.; Foulkes, M.J. Physiological processes associated with wheat yield progress in the UK. Crop Sci. 2005, 45, 175–185. [Google Scholar] [CrossRef]
- Flintham, J.E.; Borner, A.; Worland, A.J.; Gale, M.D. Optimizing wheat grain 6 yield: Effects of Rht dwarfing genes. J. Agric. Sci. 1997, 128, 11–25. [Google Scholar] [CrossRef]
- Bonnett, D.G.; Ellis, M.; Rebetzke, G.J.; Condon, A.G.; Spielmeyer, W.; Richards, R.A. Dwarfing genes in Australian wheat–Present and future. In Proceedings of the 10th Australian Wheat Breeders Assembly, (Mildura, 16–21 September, 2001); CSIRO: Canberra, Australia, 2001; pp. 154–157. [Google Scholar]
- Keyes, G.J.; Paolillo, D.J.; Sorrells, M.E. The effects of dwarfing genes Rht1 and Rht2 on cellular dimensions and rate of leaf elongation in wheat. Ann. Bot. 1989, 64, 683–690. [Google Scholar] [CrossRef]
- Rebetzke, G.J.; Bonnett, D.G.; Ellis, M.H. Combining gibberellic acid sensitive and insensitive dwarfing genes in breeding of higher yielding, semi-dwarf wheat. Field Crops Res. 2012, 127, 17–25. [Google Scholar] [CrossRef]
- Ellis, M.H.; Rebetzke, G.J.; Chandler, P.; Bonnett, D.G.; Spielmeyer, W.; Richards, R.A. The effect of different height reducing genes on the early growth of wheat. Funct. Plant Biol. 2004, 31, 583–589. [Google Scholar] [CrossRef] [PubMed]
- Wilhelm, E.P.; Boulton, M.I.; Al-Kaff, N.; Balfourier, F.; Bordes, J.; Greenland, A.J.; Powell, W.; Mackay, I.J. Rht1 and Ppd-D1 association with height, GA sensitivity, and days to heading in worldwide bread wheat collection. Theor. Appl. Genet. 2013, 126, 2233–2243. [Google Scholar] [CrossRef] [PubMed]
- Gale, M.D.; Youssefian, S. Dwarfing genes in wheat. Prog. Plant Breed. 1985, 1, 1–35. [Google Scholar]
- Allen, R.E. Agronomic comparisons between Rht1 and Rht2 semi-dwarf genes in winter wheat. Crop Sci. 1989, 29, 1103–1108. [Google Scholar] [CrossRef]
- Richards, R.A. The effect of dwarfing genes in spring wheat in dry environments. II. Growth, water use and water use efficiency. Aust. J. Agric. Res. 1992, 43, 529–539. [Google Scholar] [CrossRef]
- Peng, J.; Richards, D.E.; Hartley, N.M.; Murphy, G.P.; Devos, K.M.; Flintham, J.E.; Beales, J.; Fish, L.J.; Worland, A.J.; Pelica, F.; et al. “Green revolution” genes encode mutant gibberellins response modulators. Nature 1999, 400, 256–261. [Google Scholar] [CrossRef] [PubMed]
- Rebetzke, G.J.; Botwright, T.L.; Moore, C.S.; Richards, R.A.; Condon, A.G. Genotypic variation in specific leaf area for genetic improvement of early vigour in wheat. Field Crops Res. 2004, 88, 179–189. [Google Scholar] [CrossRef]
- Borner, A.; Plaschke, J.; Korzun, V.; Worland, A.J. The relationships between the dwarfing genes of wheat and rye. Euphytica 1996, 89, 69–75. [Google Scholar] [CrossRef]
- Worland, A.J. The influence of flowering time genes on environmental adaptability in European wheat. Euphytica 1996, 89, 49–57. [Google Scholar] [CrossRef]
- Reid, J.B.; Weller, J.R.; Sherrif, L.J. A more severe mutant allele at the ls locus. Genet. J. 1996, 28, 15–17. [Google Scholar]
- Gale, M.D.; Gregory, R.S. A rapid method for early generation selection of dwarf genotypes in wheat. Euphytica 1977, 26, 733–738. [Google Scholar] [CrossRef]
- Li, Y.; Xiao, J.; Wu, J.; Duan, J.; Liu, Y.; Ye, X.; Zhang, X.; Guo, X.; Gu, Y.; Zhang, L.; et al. A tandem segmental duplication (TSD) in green revolution gene Rht-D1b region underlies plant height variation. New Phytol. 2012, 196, 282–291. [Google Scholar] [CrossRef]
- Li, A.; Yang, W.; Guo, X.; Liu, D.; Sun, J.; Zhang, A. Isolation of a gibberellins insensitive dwarfing gene, Rht-B1e, and development of an allele-specific PCR marker. Mol. Breed. 2012, 30, 1443–1451. [Google Scholar] [CrossRef]
- Borner, A.; Mettin, D. The genetic control of gibberellic acid insensitivity of the wheat variety Ai-Bian. In Proceedings 7th International Wheat Genetic Symposium; Miller, T.E., Koebner, R.M.D., Eds.; Institute of Plant Science Research, Cambridge Laboratory: Cambridge, UK, 1988; pp. 489–492. [Google Scholar]
- Pearce, S.; Saville, R.; Vaughan, S.P.; Chandler, P.M.; Wilhelm, E.P.; Sparks, C.A.; Al-kaff, N.; Korolev, A.; Boulton, M.I.; Phillips, A.L.; et al. Molecular characterization of Rht1 dwarfing genes in hexaploid wheat. Plant Physiol. 2011, 157, 1820–1831. [Google Scholar] [CrossRef] [Green Version]
- Izumi, N.; Sawada, S.; Sasakuma, T. A dominant gene of dwarfism located on chromosome 4D in Triticum aestivum L. ‘Ai-bain 1’. Wheat Inf. Serv. 1981, 53, 21–24. [Google Scholar]
- Garnier, E.; Laurent, G.; Bellmann, A.; Debain, S.; Bertelier, P.; Ducout, B.; Roumet, C.; Navas, M. Consistency of species ranking based on functional leaf traits. New Phytol. 2001, 152, 69–83. [Google Scholar] [CrossRef] [PubMed]
- Ukozehasi, C.; Griffiths, H. An isotopic proxy for nitrogen redistribution from Alnus acuminata to wheat intercrop. Exp. Agric. 2021, 57, 316–323. [Google Scholar] [CrossRef]
- Farquhar, G.D.; O’ Leary, M.H.; Berry, J.A. On the relationship between carbon isotope discrimination and the intercellular carbon dioxide concentration in leaves. Aust. J. Plant Physiol. 1982, 9, 121–137. [Google Scholar] [CrossRef]
- Reynolds, M.; Foulkes, M.J.; Slafer, G.A.; Berry, P.M.; Parry, M.; Snape, J.W.; Angus, W.J. Raising yield potential in wheat. J. Exp. Bot. 2009, 60, 1899–1918. [Google Scholar] [CrossRef] [PubMed] [Green Version]
- Walker, A.K.; Fiorito, R.J. Effect of cultivation and plant pattern on yield and apparent harvest index of soybean. Crop Sci. 1984, 24, 151–155. [Google Scholar] [CrossRef]
- BassiriRad, H.; Caldwell, M.M. Temporal changes in roots growth and ¹⁵N uptake and water relations of two tussock grass species recovering from water stress. Physiol. Plant. 1992, 86, 525–531. [Google Scholar] [CrossRef]
- Teste, F.P.; Veneklaas, E.J.; Dixon, K.W.; Lambers, H. Is nitrogen transfer among plants enhanced by contrasting nutrient acquisition strategies? Plant, Cell and Environment 2014, 38, 50–60. [Google Scholar] [CrossRef] [Green Version]
- Berendse, F.; Aerts, R. Nitrogen use efficiency: A biological meaningful definition? Functional Ecology 1987, 1, 293–296. [Google Scholar]
- Hirose, T. Nitrogen Use Efficiency revisited. Oecologia 2011, 166, 863–867. [Google Scholar] [CrossRef]
- Andersson, A.; Johansson, E. Nitrogen partitioning in entire plants of different spring wheat cultivars. J. Agron. Crop Sci. 2006, 192, 121–131. [Google Scholar] [CrossRef]
- LeCain, D.R.; Morgan, J.A.; Zerbi, G. Leaf anatomy and gas exchange in nearly isogenic semi-dwarf and tall winter wheat. Crop Sci. 1989, 29, 1246–1251. [Google Scholar] [CrossRef]
- Moregan, J.A.; LeCain, D.R.; Wells, R. Semi-dwarfing genes concentrate photosynthetic machinery and affect leaf gas exchange of wheat. Crop Sci. 1990, 30, 602–608. [Google Scholar] [CrossRef]
- Golluscio, R.A. On the link between nitrogen productivity and residence time: Two opposite nitrogen use strategies? J. Arid. Environ. 2007, 68, 165–169. [Google Scholar] [CrossRef]
- Gegas, V.C.; Nazari, A.; Griffiths, S.; Simmonds, J.; Fish, L.; Orford, S.; Sayer, L.; Doonan, J.H.; Sanape, J.W. A genetic framework for grain size and shape variation in wheat. Plant Cell 2010, 22, 1046–1056. [Google Scholar] [CrossRef]
- Slafer, G.A.; Araus, J.L.; Royo, C.; Garcia Del Moral, L.F. Promising ecophysiological traits for genetic improvement of cereal yields in Mediterranean environments. Ann. Appl. Biol. 2005, 146, 61–70. [Google Scholar] [CrossRef]
- Austin, R.B.; Bingham, J.; Blackwell, R.D.; Evans, L.T.; Ford, M.A.; Morgan, C.L.; Taylor, M. Genetic improvements in winter wheat since 1900 and associated physiological changes. J. Agric. Sci. Camb. 1980, 94, 675–689. [Google Scholar] [CrossRef]


| Line | Parameter | |
|---|---|---|
| Number of Tillers (Mean ± SE, N = 60) | Number of Days to Anthesis (Mean ± SE, N = 60) | |
| Wild type | 33.3 ± 1.9 | 52.0 ± 0.7 |
| Rht-B1b | 24.7 ± 5.5 | 54.0 ± 0.6 |
| Rht-D1b | 19.7 ± 1.8 | 55.7 ± 0.3 |
| Rht-B1c | 21.0 ± 2.0 | 56.3 ± 0.2 |
| Rht-D1c | 27.3 ± 3.2 | 59.3 ± 0.7 |
| Parameter | SLA | Amax | Δ¹³C | # tiller | # grain | TGW | DANT | Ped L. | HI | Biomass | NP | NUE | MRT | NHI | Height |
|---|---|---|---|---|---|---|---|---|---|---|---|---|---|---|---|
| Amax | −0.85 ** | ||||||||||||||
| Δ¹³C | 0.80 ** | −0.71 ** | |||||||||||||
| # tiller | 0.36 | −0.34 | 0.23 | ||||||||||||
| # grain | −0.85 ** | 0.86 ** | −0.63 ** | −0.27 | |||||||||||
| TGW | 0.94 ** | −0.83 ** | 0.73 ** | 0.36 | −0.92 ** | ||||||||||
| DANT | −0.80 ** | 0.70 ** | −0.51 * | −0.29 | 0.79 ** | −0.81 ** | |||||||||
| Ped L. | 0.63 ** | −0.69 ** | 0.45 * | 0.06 | −0.90 ** | 0.79 ** | −0.73 ** | ||||||||
| HI | −0.94 ** | 0.88 ** | −0.69 ** | −0.36 | 0.92 ** | −0.96 ** | 0.82 ** | −0.76 ** | |||||||
| biomass | −0.92 ** | 0.91 ** | −0.67 ** | −0.37 | 0.90 ** | −0.91 ** | 0.89 ** | −0.74 ** | 0.91 ** | ||||||
| NP | −0.88 ** | 0.92 ** | −0.66 ** | −0.24 | 0.95 ** | −0.90 ** | 0.83 ** | −0.85 ** | 0.91 ** | 0.96 ** | |||||
| NUE | −0.86 ** | 0.91 ** | −0.70 ** | −0.21 | 0.97 ** | −0.90 ** | 0.79 ** | −0.88 ** | 0.90 ** | 0.93 ** | 0.98 ** | ||||
| MRT | −0.79 ** | 0.81 ** | −0.63 ** | −0.21 | 0.85 ** | −0.83 ** | 0.74 ** | −0.84 ** | 0.85 ** | 0.82 ** | 0.91 ** | 0.89 ** | |||
| NHI | −0.91 ** | 0.87 ** | −0.62 ** | −0.42 | 0.88 ** | −0.92 ** | 0.88 ** | −0.74 ** | 0.93 ** | 0.98 ** | 0.94 ** | 0.90 ** | 0.84 ** | ||
| Height | 0.84 ** | −0.90 ** | 0.64 ** | 0.17 | −0.94 ** | 0.88 ** | −0.85 ** | 0.87 ** | −0.88 ** | −0.95 ** | −0.98 ** | −0.98 ** | −0.86 ** | −0.90 ** |
Publisher’s Note: MDPI stays neutral with regard to jurisdictional claims in published maps and institutional affiliations. |
© 2022 by the authors. Licensee MDPI, Basel, Switzerland. This article is an open access article distributed under the terms and conditions of the Creative Commons Attribution (CC BY) license (https://creativecommons.org/licenses/by/4.0/).
Share and Cite
Ukozehasi, C.; Ober, E.S.; Griffiths, H. The Other Mechanisms by Which the Rht Genes Improve the Harvest Index of Wheat. Plants 2022, 11, 2837. https://doi.org/10.3390/plants11212837
Ukozehasi C, Ober ES, Griffiths H. The Other Mechanisms by Which the Rht Genes Improve the Harvest Index of Wheat. Plants. 2022; 11(21):2837. https://doi.org/10.3390/plants11212837
Chicago/Turabian StyleUkozehasi, Celestin, Eric S. Ober, and Howard Griffiths. 2022. "The Other Mechanisms by Which the Rht Genes Improve the Harvest Index of Wheat" Plants 11, no. 21: 2837. https://doi.org/10.3390/plants11212837