Article

Genetic Diversity and Population Structure of Normal Maize Germplasm Collected in South Sudan Revealed by SSR Markers

1
Department of Applied Plant Sciences, College of Agriculture and Life Sciences, Kangwon National University, Chuncheon 24341, Korea
2
Interdisciplinary Program in Smart Agriculture, Kangwon National University, Chuncheon 24341, Korea
*
Author to whom correspondence should be addressed.
These authors contributed equally to this work.
Plants 2022, 11(20), 2787; https://doi.org/10.3390/plants11202787
Submission received: 23 September 2022 / Revised: 16 October 2022 / Accepted: 17 October 2022 / Published: 20 October 2022
(This article belongs to the Special Issue Molecular Marker-Assisted Technologies for Crop Breeding)

Abstract

:
Maize is one of the leading global cereals, and in South Sudan maize cultivation occurs in nearly all of the country’s agro-ecological zones. Despite its widespread cultivation, farmers in South Sudan depend on undeveloped varieties, which results in very low yields in the field. In the current study, 27 simple sequence repeat (SSR) markers were used to investigate genetic diversity and population structures among 37 landrace maize accessions collected from farmers’ fields in South Sudan. In total, 200 alleles were revealed with an average of 7.4 alleles per locus and a range from 3.0 to 13.0 alleles per locus. The observed heterozygosity values ranged from 0.06 to 0.91 with an average of 0.35. High polymorphic information content (PIC) values were identified with a mean of 0.69, which indicates the informativeness of the chosen SSR loci. Genetic structure analysis revealed a moderate genetic differentiation among the maize populations with a fixation index of 0.16, while there was very high genetic differentiation within the groups of populations of three regions with a mean fixation index (F) of 0.37. An unweighted pair group method with an arithmetic mean (UPGMA) dendrogram clustered the 37 maize accessions into three groups with 43% genetic similarity. The clustering pattern of the maize accessions was moderately consistent with their collection area. The findings of this study will provide maize breeders with a better understanding of maize diversification as well as a reserve of genetic resources for use in the selection of advantageous and useful resources for the development of maize varieties in South Sudan.

1. Introduction

Maize (Zea mays L.) is a well-known staple food and the most cultivated cereal worldwide [1]. Moreover, it has a huge economic impact as it is used in the production of biofuel, feedstock, and raw material for industry [2]. Although the introduction of maize to South Sudan is not clearly defined, it is widely believed to have been first introduced into Africa through West African countries in the 16th century, especially by Portuguese traders [3,4]. The same source states that Belgian agricultural officials discovered corn that was widely cultivated in the 18th century by the people of the Kingdom of Azande, which is in the southwest of today’s South Sudan [3]. Despite the tropical savanna climate of South Sudan, this crop is cultivated in all agricultural ecological zones, except in the semi-arid climate of the north and east [5]. Differences in climate affect local farmers in each zone, and they maintain their own landrace varieties. As a result, there is a huge amount of phenotypic variability that needs to be characterized for further use in breeding programs [6,7].
In South Sudan, maize is the second most dominant cereal after sorghum and accounts for approximately 20% of the total area of cereals. In 2021, the total yield of maize in South Sudan was 131,000 tons [8], averaging between 0.5 and 0.9 t/ha [9]. South Africa and Ethiopia are the largest maize-producing countries in Africa with average yields of 4.9 t/ha and 4.2 t/ha, respectively [10]. Compared with the yields in these countries, the maize yields per hectare in South Sudan are much lower. Although the low yield rate is associated with several challenges, the crucial challenge is the absolute dependency of South Sudanese small-scale farmers on naturally selected landraces in almost all of the field crops [11,12]. In particular, maize F1 hybrid commercial varieties have never been available to local farmers, while some farmers have access to open-pollinated varieties (OPV) that are being imported from neighboring countries and others that are distributed by humanitarian organizations. The yields of these imported genotypes remain extremely low owing to variations in climate. Landraces are diverse, heterogeneous populations that are commonly sought by farmers because of their adaptation to the local environment of a particular agro-ecological zone and local demand [13]. To develop varieties that are high yielding and tolerant to biotic and abiotic stresses such as drought and diseases, it is essential to understand the genetic diversity and population structure of these native genetic resources. Such an understanding is also helpful for germplasm protection and utilization for crop improvement, especially for providing breeders with the tools to evolve new and improved accessions with desired traits [11,14].
Morphological characterization is a prerequisite for breeding, but it is greatly affected by the environment. Reciprocally, molecular characterization is free from environmental effects and enables highly valuable complementary genetic information to be obtained [15,16]. Molecular markers have been extensively applied for quantitative trait loci (QTL) mapping, association studies, marker-assisted selection (MAS) for breeding and genetic research, and gene cloning [2,17]. Among all molecular markers, simple sequence repeat (SSR) markers have been considered almost the ideal markers for genetic diversity analysis [18], and their success is principally owing to a high level of polymorphism, codominance, repeatability, and reliability [16]. Therefore, SSR markers have also been optimized in maize, thus leading to a superior resolution of alleles in genetically heterozygous populations [19,20,21,22].
To our knowledge, no diversity studies based on molecular markers on South Sudanese maize landraces have been carried out to date, and there has only been very limited research regarding morphological characteristics and maize adaptation. This study is a pioneer in revealing genetic diversity and the population structure of maize landrace germplasm collected in South Sudan. A total of 15 different agricultural locations were explored in our germplasm collection survey to gather maize landrace accessions from traditional maize farms. These accessions represent different environments of maize production areas in South Sudan and were collected with the aim of understanding the genetic diversity of the indigenous accessions. For this purpose, 27 SSR primers have been constructed to study the 37 maize landrace accessions collected from South Sudan. The object of this study is to estimate the genetic diversity and population structure.

2. Results

2.1. Polymorphism of SSR Loci for Maize Landrace Accessions

To analyze the genetic diversity of maize genetic resources in South Sudan with regard to geographical conditions, we used 37 maize landrace accessions that were collected from three regions: northern (six populations), central (four populations), and southern (five populations). These maize accessions were also divided into 15 populations from the three geographic locations of South Sudan (Figure 1, Table 1). For this study, 27 SSR markers were applied to characterize the genetic diversity of the 37 maize landrace accessions collected at the 15 geographic locations across South Sudan (Table 2). For this characterization, we analyzed diverse molecular parameters including the observed number of alleles (Na), effective number of alleles (Ne), Shannon’s information index (I), observed heterozygosity (Ho), expected heterozygosity (He), major allele frequency (MAF), gene diversity (GD), and polymorphic information content (PIC) (Table 2). In total, 200 alleles were detected, segregating in the 37 maize accessions with an average of 7.4 alleles per locus, ranging from 50 to 200 bp. The Na value per locus ranged from 2.0 (for markers umc1130, umc1718, umc2075) to 6.0 (for marker umc2378), with an average of 3.6. GD value ranging from 0.574 for marker umc1380 to 0.887 for marker umc2334, with an average of 0.735, while the MAF value ranged from 0.135 for marker umc2334 to 0.622 for marker umc1380, with an average of 0.390. The Ho value ranged from 0.067 for marker umc1466 to 0.914 for marker umc1108, with an average of 0.351, while the He value ranged from 0.426 for marker umc1380 to 0.773 for marker umc2378, with an average of 0.578. The PIC value ranged from 0.532 for marker umc1024 to 0.876 for marker umc2334, with an average of 0.699. The Shannon information index value varied from 0.618 for marker umc2075 to 1.576 for marker umc2378, with an average of 1.001 (Table 2). These results show that the SSR loci that were used were effective in providing valid estimates of genetic diversity of the maize landrace populations, as represented by the mean genetic diversity indicators (I = 1.001, He = 0.578, PIC = 0.699).

2.2. Genetic Diversity and Genetic Differentiation among Maize Landrace Populations

The genetic diversity indices per population are presented in (Table 3). This study confirmed the Na, Ne, I, Ho, He, and F (Inbreeding coefficient or fixation index) among the 15 landrace maize populations. Na values varied from 1.160 for RE to 2.407 for MN, with an average of 1.877. Ne values varied from 1.160 for RE to 2.066 for YD, with an average of 1.678. Ho values ranged from 0.160 for RE to 0.463 for MN, with an average of 0.335. He values ranged from 0.160 for RE to 0.562 for MN, with an average of 0.413. The Shannon information index values ranged from 0.111 for RE to 0.736 for MN, with an average of 0.480. The fixation index (F) value varied from 0.000 for AW, BE, RE, and YM to 0.438 for AD, with an average of 0.167 (Table 3).
Additionally, in this study, in order to understand the genetic diversity in accordance with the climatic characteristics and geographical areas of South Sudan, we conducted a genetic diversity analysis at the regional level within the groups of populations, namely the southern region population, central region population, and northern region population (Table 4). The Na value varied from 3.000 to 3.293, with an average of 3.123, while the Ne value ranged from 2.293 to 2.364, with an average of 2.322. The Shannon information index value varied from 0.880 to 0.913, with an average of 0.899. The Ho value varied from 0.336 to 0.355, with an average of 0.348. The He value ranged from 0.552 to 0.563, with an average of 0.556. The fixation index showed a range from 0.361 to 0.3.92, with an average of 0.374 (Table 4). The analysis of the molecular variance (AMOVA) for genetic differentiation among and within the 15 populations from the three regions showed that the genetic variation that occurred among regions was only 7% (Table 5). In contrast, the remaining 93% of variability in genetic variation was represented within the regions.

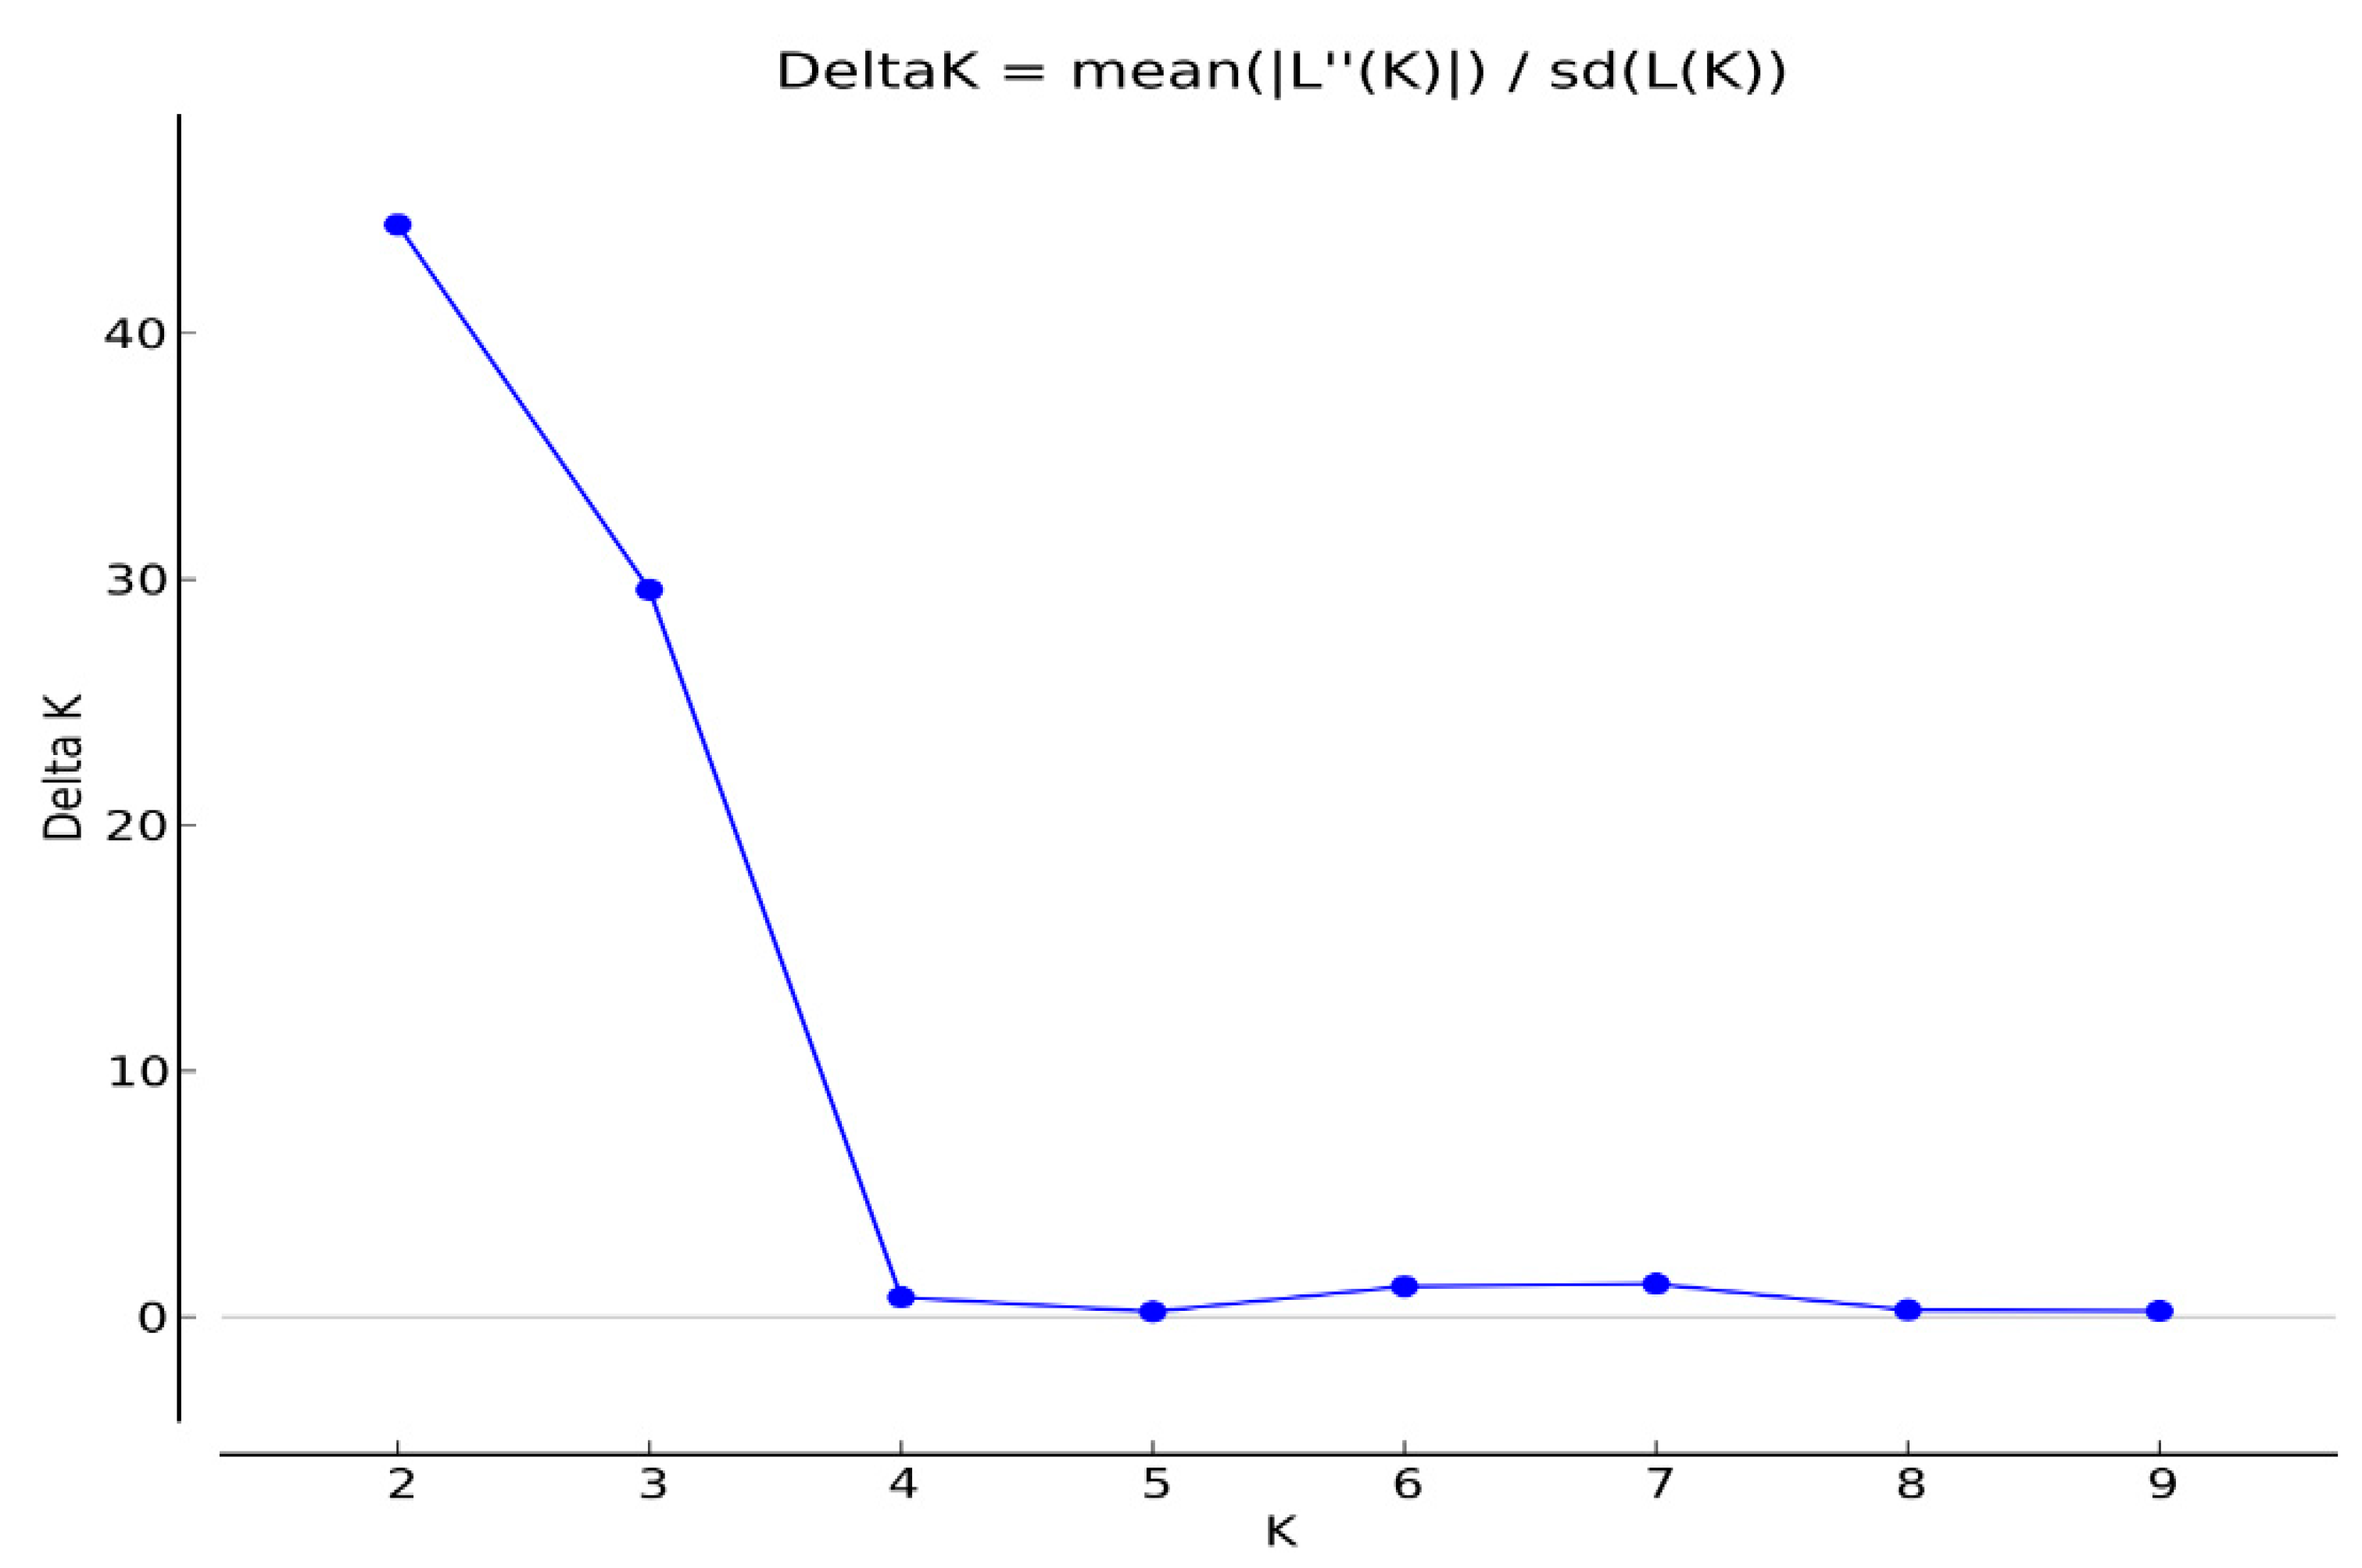
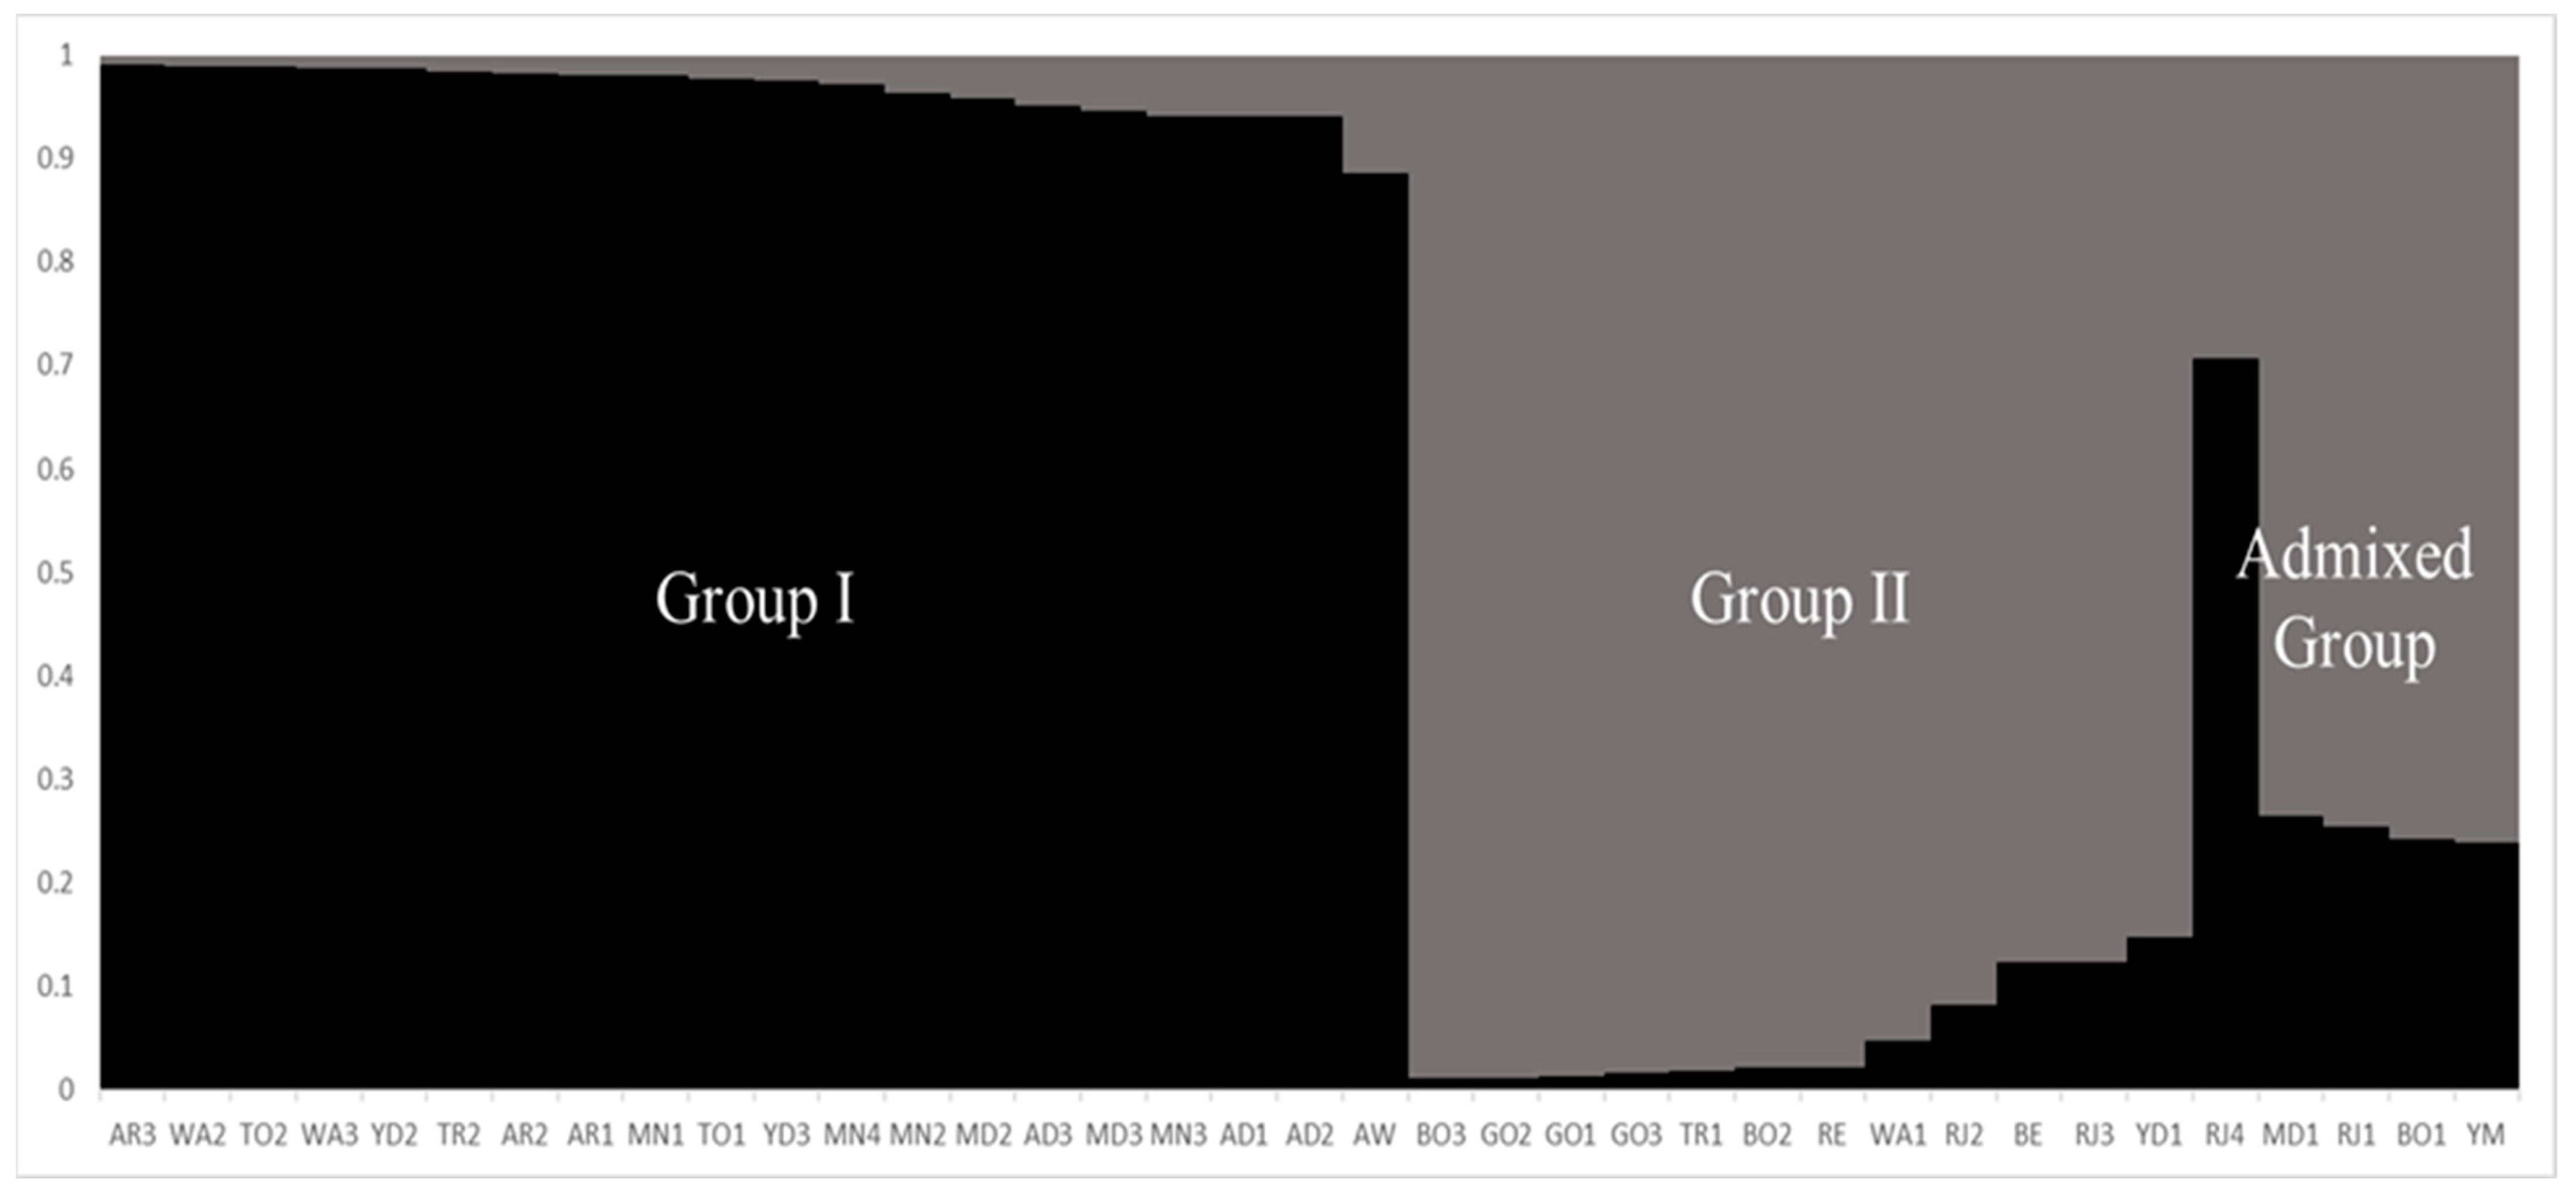
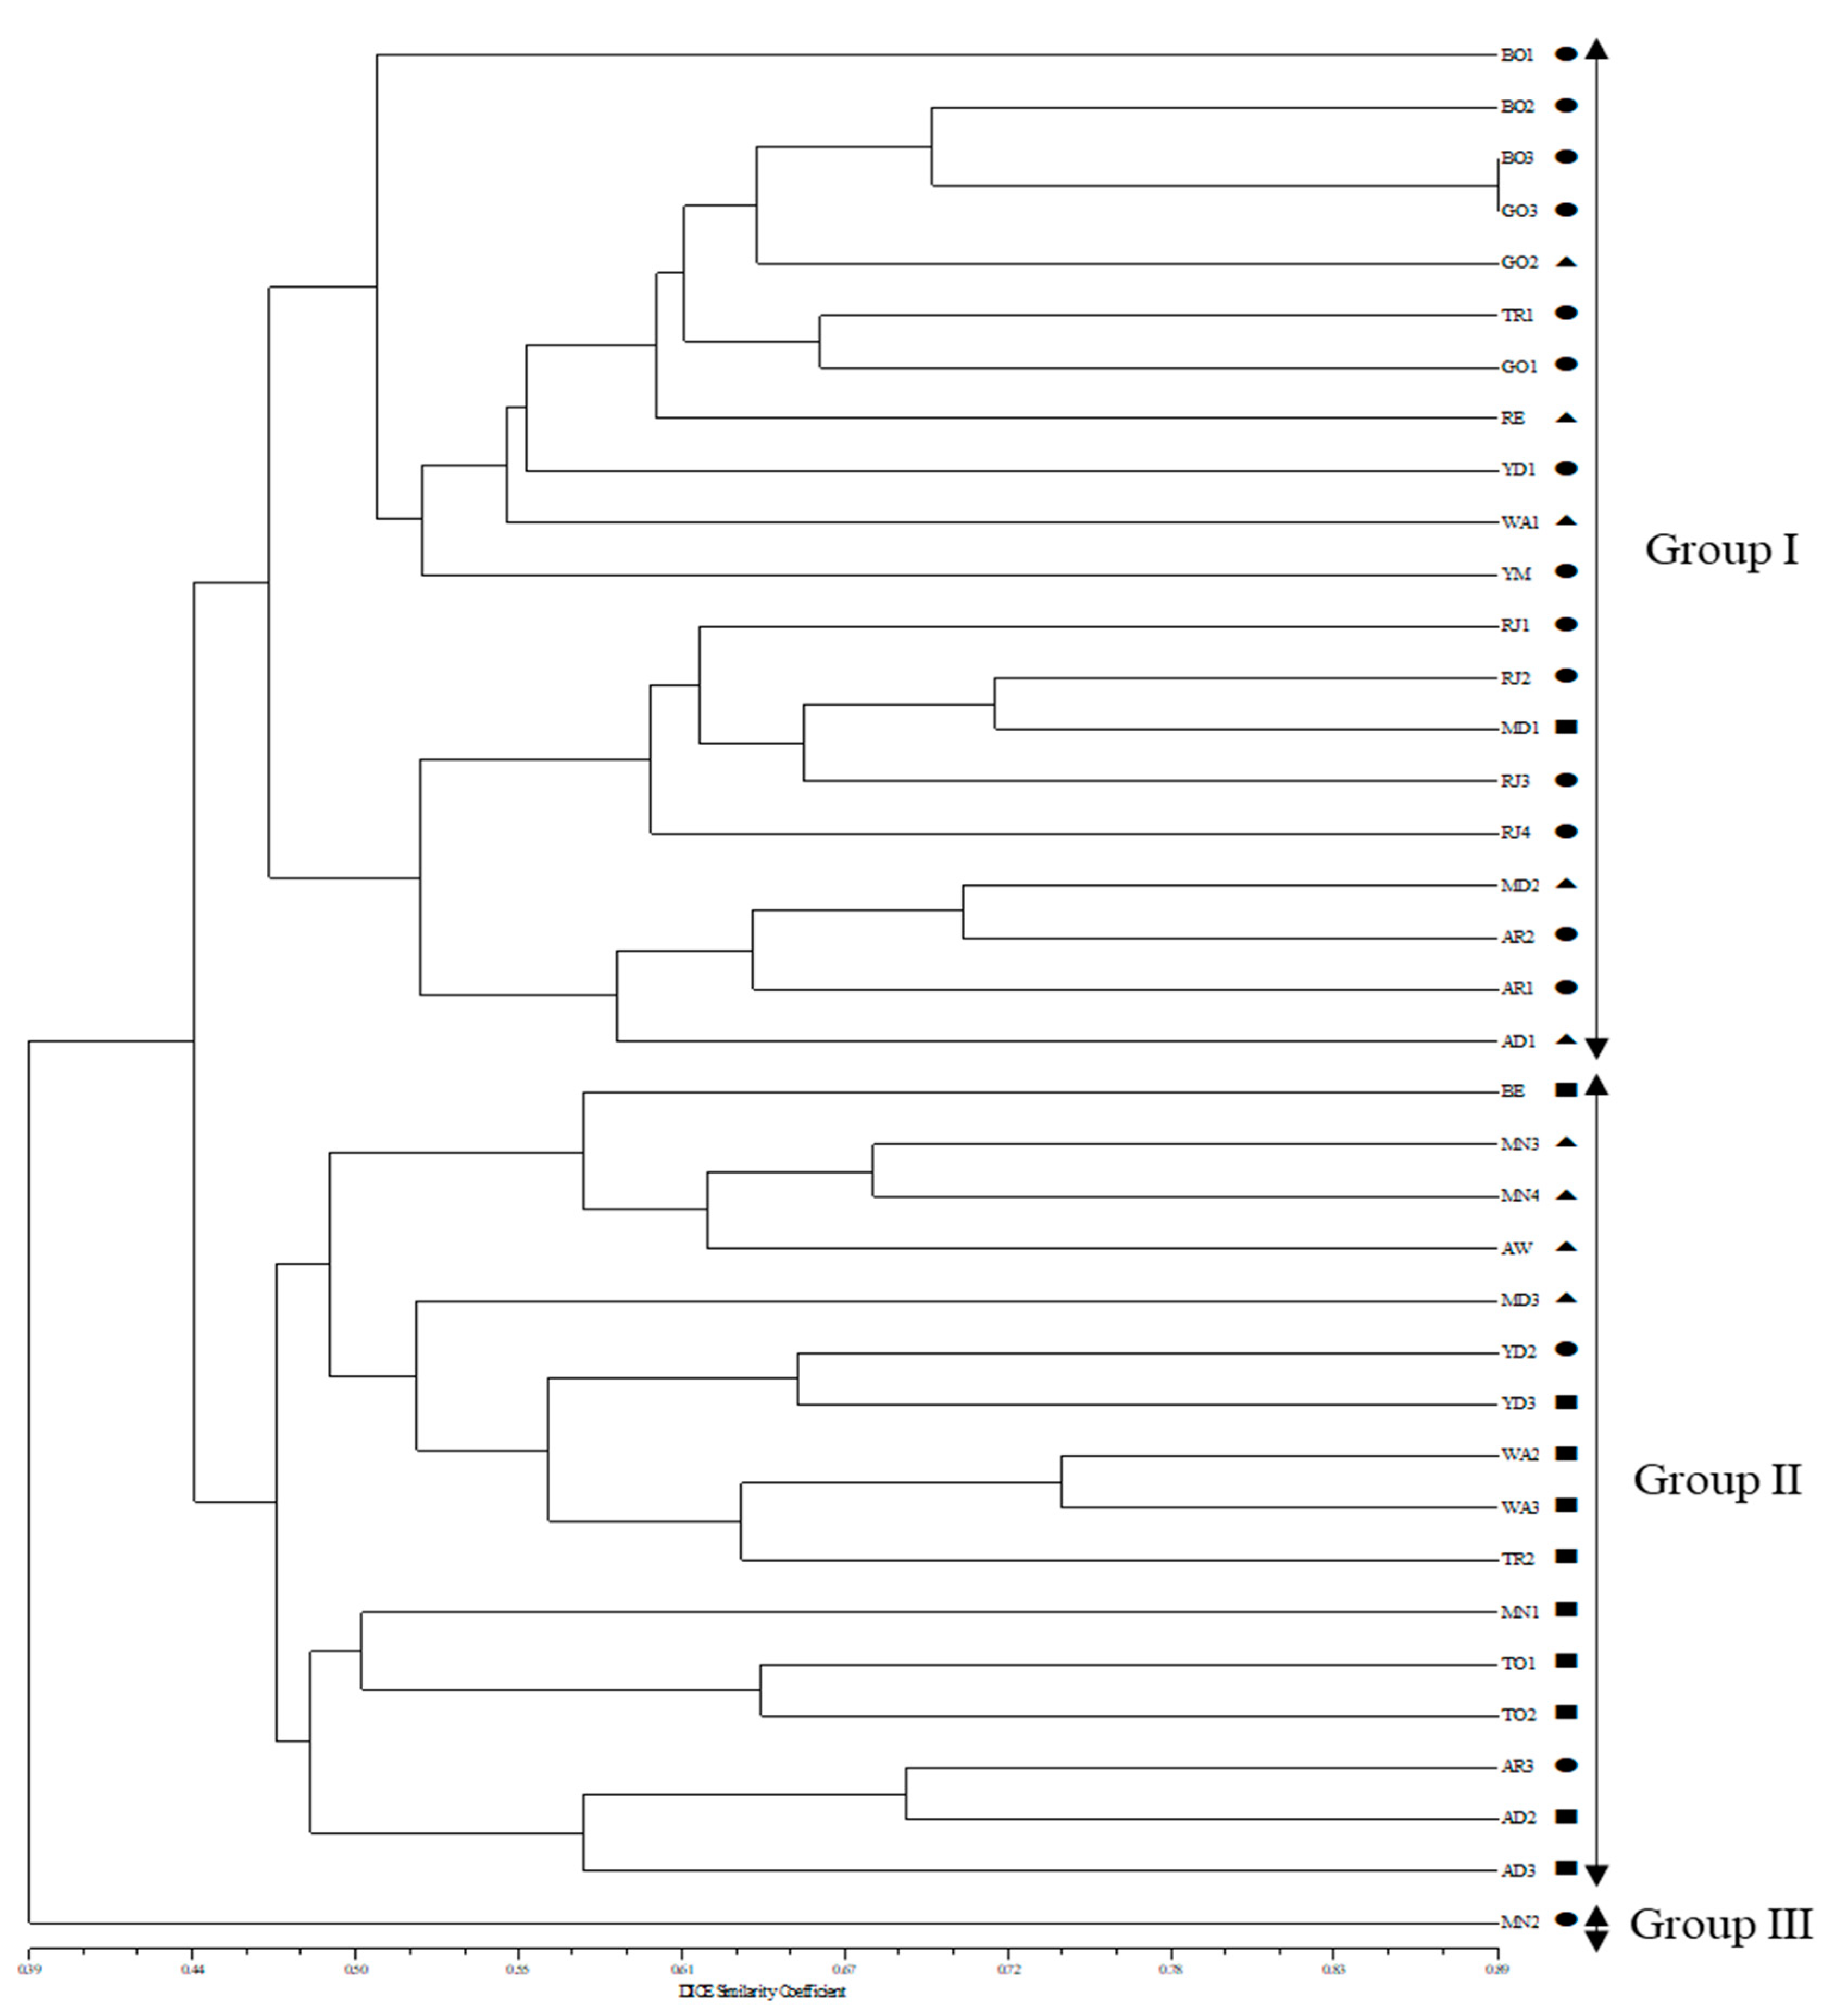
2.3. Cluster Analysis and Population Structure

In the population structure of the 37 accessions of maize landraces from across South Sudan, it was found that the highest value of ΔK was K = 2 (K value describes the number of subpopulations that make up an entire population, and delta K has been suggested to help determine the most probable number of populations) for the 37 accessions of maize landraces (Figure 2). In accordance with this result, all the maize landrace accessions were divided into two main groups and one admixed group (Figure 3). At K = 2 the division was as follows: Group I included 20 maize accessions, namely AR3, WA2, TO2, WA3, YD2, TR2, AR2, AR, MN1, TO1, YD3, MN4, MN2, MD2, AD3, MD3, MN3, AD1, AD2, and AW; Group II contained 12 maize accessions, namely BO3, GO2, GO1, GO3, TR1, BO2, RE, WA1, RJ2, BE, RJ3, and YD1; and the admixed group clustered five accessions, namely RJ4, MD1, RJ1, BO1, and YM (Figure 3).
Furthermore, the dendrogram of the 37 South Sudan maize accessions revealed by an unweighted pair group method with an arithmetic mean (UPGMA) algorithm (Figure 4) showed the 37 maize accessions separated into three groups with a genetic similarity of 46.3%. Group I contained 20 maize accessions, including 12 accessions from the southern region, 3 accessions from the central region, and 4 accessions from the northern region. Group II included 16 maize accessions, including 6 accessions from the southern region, 4 accessions from the central region, and 6 accessions from the northern region. Group III contained only one maize accession, which was from the southern region.

3. Discussion

A comprehensive understanding of the genetic diversity of native genetic resources is crucial for initiating and managing strategies for the conservation of crop genetic resources. Despite the long history of maize cultivation in South Sudan, a lack of developed varieties still forces farmers to turn to indigenous germplasm for traditional farming. To change this prevalent pattern, the formation of knowledge about the level of genetic diversity in landraces is essential because it will allow for the more efficient and effective use of resources in plant improvement [23]. Landraces are a good source of useful alleles because they have been preferred by local farmers for their adaptation to environmental stresses [24]. In order for these genetic resources to be utilized, the characterization of native germplasms is necessary. With this aim, we used 27 SSR markers for genetic diversity and population structure estimation among maize landrace accessions, as described in the Introduction. Compared with other molecular marker systems, SSR, or microsatellite technology, has numerous advantages, viz., simple experimental methods, high reproducibility, polymorphic genetic information contents, the codominant nature of SSR polymorphisms, and abundance and distribution in plant genomes [25,26,27]. These advantages make it a worthy method for estimating genetic diversity and population structure.
In the present study, a total of 200 alleles was revealed using 27 SSR markers with an average of 7.4 alleles per locus, which is similar to or higher than the average number of alleles observed in previous studies using SSR markers [21,28,29]. This high average of alleles per locus can be attributed to high genetic diversity in the investigated genotypes. The PIC value affords a fairer estimation of diversity than the actual number of alleles because it takes into account the relative frequencies of each allele present [23,30]. In our study, the overall average PIC for the SSR loci found was 0.699, which is in agreement with the PIC of 0.69 observed in the Japanese inbred lines of maize accessions [31]. Compared with our findings, Thakur et al. (0.43) [32] and Belalia (0.57) [16] obtained lower values; a higher PIC value was recorded in a Turkish landrace maize population (0.72) using SSR markers [30]. These results indicate that the SSR markers used in this study provided adequate information for estimating the level of genetic diversity in South Sudan’s maize landraces. In particular, some SSR primers, such as umc1108, umc1316, umc1607, umc2275, and umc2378, which showed a high number of alleles and high values of genetic diversity, were considered as useful markers for evaluating the genetic diversity among South Sudan maize accessions. Landraces of maize accessions from Algeria and Northwest Argentina were found to have similar overall genetic diversity values (He = 0.57) as found in this study (He = 0.57) [7,33]. In contrast, Noldin et al. [34] reported a slightly lower genetic diversity (He = 0.48) in Paraguayan maize accessions than the average reported by this and some other reports (He = 0.57). Conversely, few studies have stated higher genetic diversity than the present study [16,22,35,36] with the highest level obtained by Yao et al. [37] (He = 0.7) for maize landraces from the Wuling Mountains region in China. In addition, the apparent difference between the observed and the expected heterozygosity values in this study reflects a deficiency in heterozygosity, which may be the result of low cross-fertility and high self-fertilization rates [38,39]. Another possible reason could be that small-scale farmers usually change the relevant landrace each year by extracting seeds from a small number of ears [28]. However, matching results in heterozygosity deficiency were registered in several previous studies [16,28,34].
The fixation index (F) calculates population differences by virtue of the genetic structure, and a value over 0.15 can be considered significant in differentiating populations [40,41]. In our study, the mean coefficient of genetic differentiation between accessions was identified as F = 0.16 (Table 3). This result is in accordance with the result found in maize landraces from Mexico by Pineda-Hidalgo et al. (2013) [42] as well as that recorded in maize landrace accessions of the Ivory Coast in 2016 [43]. Furthermore, the F index mean within the groups of populations from the three regions of South Sudan (southern region, central region, and northern region) was F = 0.37 (Table 4). This finding is higher than that that was found in Saharan Algerian maize populations (F = 0.22) in 2018 [16] and in accordance with the F mean (F = 0.36) reported in Indian maize landrace populations in 2013 [44]. This result shows a greater genetic differentiation within the groups of populations from the three regions of South Sudan. Moreover, the F value for the northern region populations (0.39) is slightly higher than the F value of the other two regions. This indicates a higher genetic variability. Although in general the F values of all three regions are contiguous, the observed standard of differentiation suggests a moderate gene flow between the populations, which could be attributed to the effect of pollen dispersal and seed mixing/exchange between the neighboring populations [16,44] because it is known that local farmers exchange seeds among themselves in order to raise crop productivity [41,45]. Furthermore, the centers of environmental diversity where maize is being cultivated as a rainfed crop are heterogenous. Usually, the first planting is performed in April in the southern region (equatorial climate, high rainfall, long growing period), while in the central and northern regions planting for the first season starts later in May and June. Consequently, the second growing season, especially in the southern region, begins in September up to late October. This varied condition might have influenced the level of molecular differentiation of local landrace maize accessions. In addition, AMOVA is a satisfactory grouping criterion for evaluating the variation within and among populations. In accordance with the result of the inbreeding coefficient value (F), the AMOVA revealed a greater level of genetic variation within rather than among regions (Table 5), which matches the results recorded in previous studies [32,46,47]. According to Da Silva et al., outcrossing species ordinarily sustain the genetic variation within populations while genetic variation is lower among populations [47].
Furthermore, to have a clear understanding of the information of genetic diversity and population structure of the 37 maize landrace accessions collected from South Sudan, we used the following two statistical methods: a model-based approach with STRUCTURE software and a UPGMA dendrogram with NTSYS-pc V2.1. The results of STRUCTURE revealed that the 37 maize landrace accessions could be split into two main groups and one admixed group based on the ∆K value (Figure 3). At K = 2, Group I consisted of 20 maize accessions representing 54.05% of the total genotypes under study, and most accessions assigned in this group were derived from central region populations, while the southern and northern region populations were represented equally. Group II comprised 12 maize accessions representing 32.43% of the total tested genotypes, and most accessions positioned in this group were derived only from the southern and northern region populations. The admixed group included five accessions from the southern and central region populations only (Figure 3).
Moreover, the UPGMA dendrogram results based on SSR marker data classified the 37 South Sudan maize landrace accessions into three groups with 43% genetic similarity. The major groups I and II occupied almost all the genotypes, while group III had only one accession from a different origin (Figure 4). The clustering was in accordance with the agro-ecological climate of South Sudan, where there are high rainfall and humid tropical savannahs in the southern and central regions of the country and a subtropical climate with semi-arid lands in some parts of the northern region. Group I involved 20 accessions and further separated into three subgroups; 11 accessions in this group derived from populations representing southern parts of South Sudan, while 5 accessions derived from populations representing the central areas and 3 accessions derived from populations from northern areas. Group II consisted of 16 accessions with two minor subgroups; 6 accessions were derived from central region populations, while 6 accessions were from northern region populations and 4 accessions were from southern region populations. Group III revealed one accession, MN2, which is an outlying accession representing a unique genotype derived from the southern part of the country. Most of the accessions were positioned as expected. The placing of accessions from different collection areas in the same group indicates a close genetic association regardless of their diverse origin. The findings suggest that the landrace genotypes of maize may be frequently exchanged among the regions by farmers and that this might have occurred through different routes corresponds clearly with the hypothesis of seed mixing/exchanging and seed trade between small-scale farmers [32].
Even though this paper remains a preliminary study for understanding South Sudan maize germplasm diversity, these findings will be very useful in forming standards for the selection of more genetic materials and allelic germplasm resources with substantial genetic diversity for breeding programs. In this study, genetic diversity analysis was performed using SSR markers on native maize accessions collected in South Sudan, and the results are expected to provide useful and interesting information on the conservation of landrace maize genetic resources and the selection of useful resources for maize breeding programs in South Sudan.

4. Materials and Methods

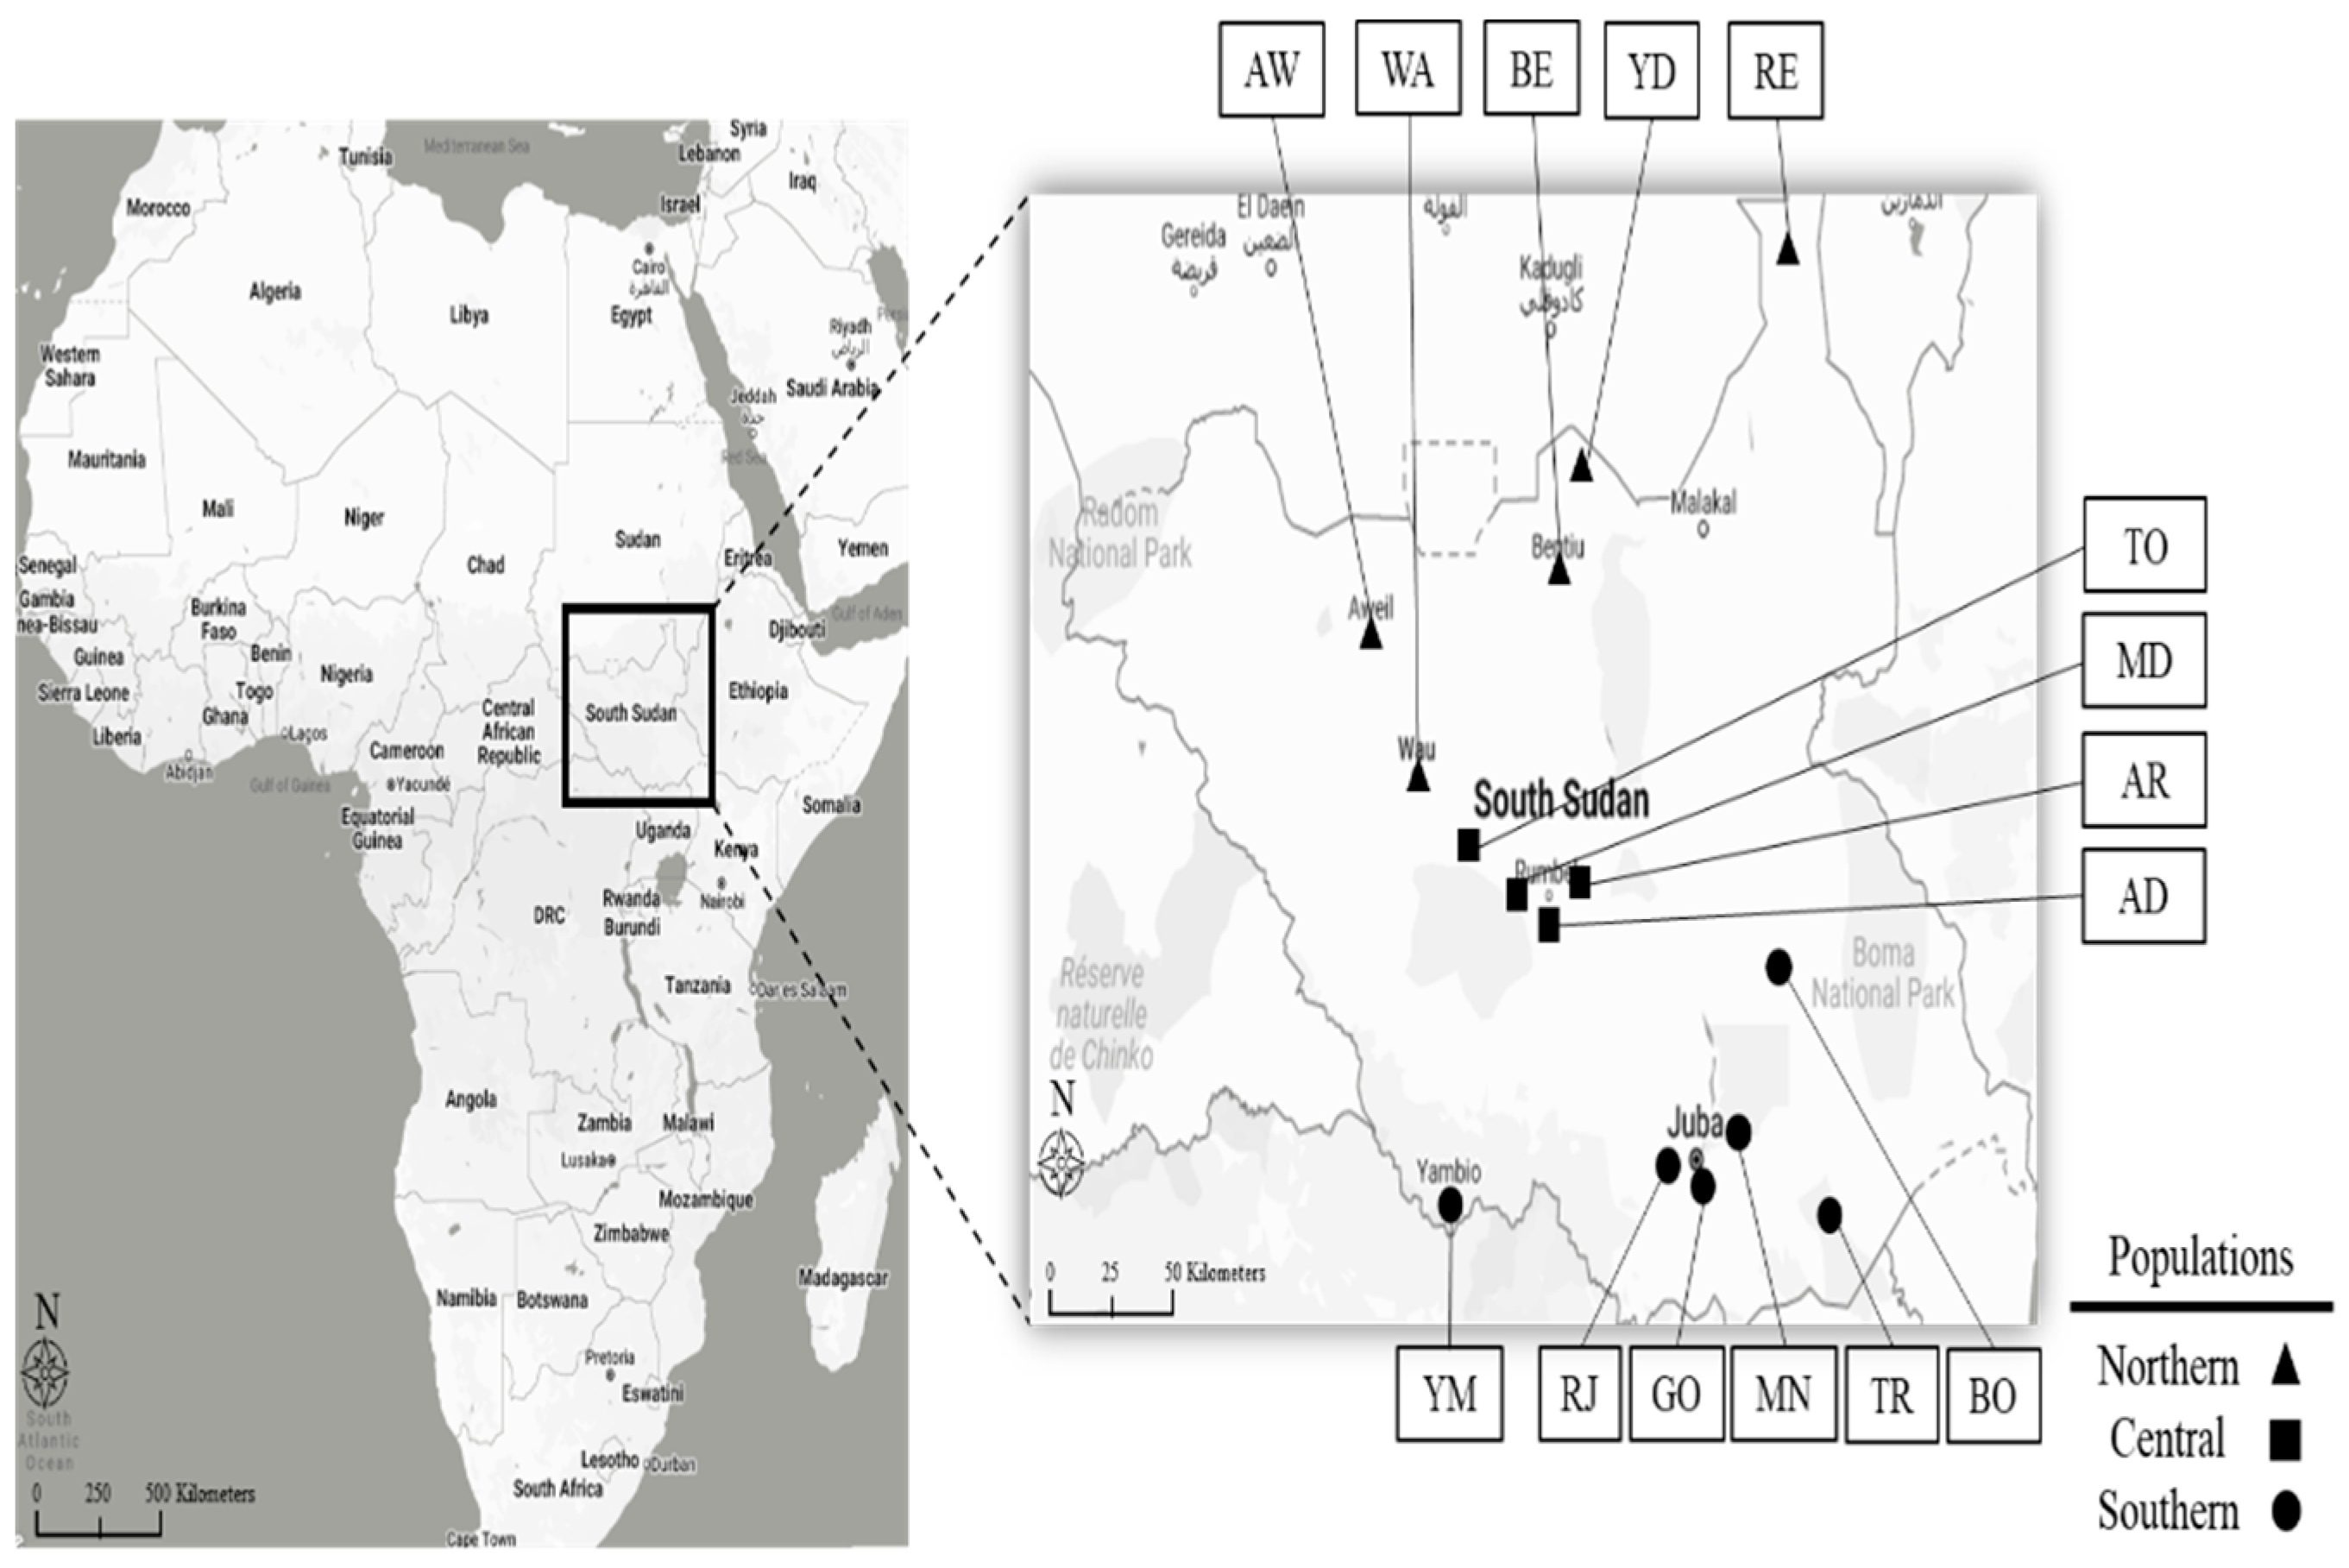
4.1. Plant Materials and DNA Extraction

We studied 37 maize landrace accessions that were collected from populations found in 15 geographic locations of South Sudan. The 37 maize accessions were divided into three populations in relation to geographical conditions, namely northern, central, and southern regions in South Sudan (Figure 1, Table 1). The southern region landrace accessions were collected from the following locations: Bor, Rejaf, Mangalla, Gondokoro, Torit, and Yambio. The central region landrace accessions were collected from Aber, Madhok, Adull, and Tonj, while the northern region landrace accessions were collected from Wau, Aweil, Yida, Renk, and Bentiu. In the southern region, 17 maize accessions were collected from Bor (3 accessions), Rejaf (4 accessions), Mangalla (4 accessions), Gondokor (3 accessions), Torit (2 accessions), and Yambio (1 accessions); in the central region, 11 maize accessions were collected from Aber (3 accessions), Madhok (3 accessions), Adull (3 accessions), and Tonj (2 accessions); and in the northern region 9 maize accessions were collected from Wau (3 accessions), Aweil (1 accession), Yida (3 accessions), Renk (1 accession), and Bentiu (1 accession). The genomic DNA of young leaf tissues was extracted in accordance with the Dellaporta et al. (1983) [48] method with minor modifications.

4.2. SSR Analysis and DNA Electrophoresis

In this study, a total of 100 SSR primer sets (distributed over 10 maize chromosomes) were used in a preliminary experiment using six landrace accessions collected from three populations (southern, central, and northern) of South Sudan. The 27 SSR primer sets, as shown in Table 2, were selected and used for genetic diversity analysis, because they showed different amplification patterns and good polymorphisms among the six landrace accessions. The SSR primer sets used in this study were derived from MaizeGDB (http://www.maizegdb.org/, accessed on 1 September 2021). SSR amplification was performed using EX Taq PCR kit (Takara, Ohtsu, Japan). A total volume of 20 µL of product was composed of 20 ng genomic DNA, 0.2 mM dNTPs, 0.5 µM forward and reverse primers, 1×EX Taq buffer, and 1 unit of EX Taq polymerase for polymerase chain reaction (PCR) of the SSR loci. The PCR protocol was conducted as follows: first step, initial denaturation at 94 °C for 5 min; second step, 1 min of denaturation at 94 °C, 1 min of annealing at 65 °C, and 2 min of extension at 72 °C. The second step was repeated 36 times with the temperature of the annealing stage lowered by decreases of 1 °C at every annealing stage until an eventual annealing temperature of 55 °C was reached. After completing the first two steps, a final third step was carried out of 5 min of extension at 72 °C. DNA electrophoresis analysis was conducted with a mini vertical electrophoresis system (MGV-202-33, CBS Scientific Company, San Diego, CA, USA) for the PCR products. Three µL of the final product was mixed with 3 µL of formamide loading dye (98% formamide, 0.02% xylene C, 0.02% BPH, and 5 mM NaOH). Two µL from each sample was loaded onto a 6% acrylamide-bis acrylamide gel (19:1) in 0.5X Tris-borate-EDTA (TBE) buffer and electrophoresed at 250 V for 30–40 min. The separated fragments were then visualized using ethidium bromide (EtBr).

4.3. Data Analysis

DNA fragments amplified using the SSR primers were scored as present (1) or absent (0). The number of alleles, PIC, MAF, and GD were identified using Powermarker version 3.25 [49]. Popgen32 V1.02 [50] was applied to obtain information on the Na, Ne, Ho, He, and I. GS between each pair of accessions were calculated using the Dice similarity index [51]. A similarity matrix was then used to construct a dendrogram, adopting the UPGMA via the application of SAHN-Clustering from NTSYS-pc V2.1 [52]. The population structure among the 37 maize accessions was investigated by using STRUCTURE 2.2 software [53]. Five independent runs were proceeded with K values ranging from 1 to 10, with 100,000 cycles for both burn-in and run length. The delta K statistic, based on the degree of change in the log probability of data between K values [54], was calculated with STRUCTURE HARVESTER (http://taylor0.biology.ucla.edu/structHarvester/, accessed on 25 February 2022) based on the STRUCTURE results. AMOVA was performed using GenAlEx 6.5 software [55]. Fixation index (F, inbreeding coefficient) was calculated using the following formula [56]
F = 1 H o H e

5. Conclusions

This study is a pioneering approach to the evaluation of genetic diversity and population structure of South Sudan maize. A wide understanding of genetic relatedness is crucial for the improvement of any crop. In order to carry out this study, we used 27 SSR markers to investigate the genetic diversity and population structure of native maize accessions collected from across South Sudan. The amplification of polymorphic loci disclosed the potential of the selected SSR markers for investigating genetic diversity among the collected genotypes. Generally, the indices revealed distinct molecular diversity among the maize landrace populations. In addition, the overall genetic index of inbreeding coefficient (Fst) showed a moderate genetic differentiation among the maize populations and a huge genetic differentiation within the groups of populations from the three regions (southern, central, and northern populations). AMOVA revealed greater genetic variation within the populations rather than among the regions. Moreover, although the results of population structure and UPGMA analysis based on the molecular data of the SSR markers appeared to be mainly in accordance with the geographic location, a number of accessions from different collection areas were positioned in the same group. This result suggests that the mixing of landrace genotypes of South Sudan maize across the regions by local farmers might have occurred in different ways. Even though this paper remains a preliminary study for understanding the diversity of maize in South Sudan, these findings will be very useful in forming standards for genetic materials and for the selection of allelic resources with substantial genetic diversity for breeding programs.

Author Contributions

E.A.M. provided material samples and helped to draft the manuscript. E.A.M., K.J.S., H.P. and Y.J.K. performed the experiment and analyzed the data. E.A.M. and J.K.L. wrote the manuscript and designed the experiments. All authors have read and agreed to the published version of the manuscript.

Funding

This research received no external funding.

Institutional Review Board Statement

Not applicable.

Informed Consent Statement

Not applicable.

Data Availability Statement

Data is contained within the article.

Acknowledgments

This study was supported by the National Research Foundation of Korea (NRF) funded by the Ministry of Education, Science and Technology (NRF-2021R1A6A1A03044242, 2022R1F1A1063300), and Golden Seed Project (No. 213009-05-1-WT821, PJ012650012017), Ministry of Agriculture, Food, and Rural Affairs (MAFRA), Ministry of Oceans and Fisheries (MOF), Korea Forest Service (KFS), Republic of Korea.

Conflicts of Interest

The authors declare that they have no conflict of interest.

References

  1. Shiferaw, B.; Prasanna, B.M.; Hellin, J.; Bänziger, M. Crops That Feed the World 6. Past Successes and Future Challenges to the Role Played by Maize in Global Food Security. Food Secur. 2011, 3, 307–327. [Google Scholar] [CrossRef] [Green Version]
  2. Vathana, Y.; Sa, K.J.; Lim, S.E.; Lee, J.K. Genetic Diversity and Association Analyses of Chinese Maize Inbred Lines Using SSR Markers. Plant Breed. Biotechnol. 2019, 7, 186–199. [Google Scholar] [CrossRef]
  3. Miracle, M.P. The Introduction and Spread of Maize in Africa. J. Afr. Hist. 1965, 6, 39–55. [Google Scholar] [CrossRef]
  4. Shepherd, D.N.; Martin, D.P.; Van Der Walt, E.; Dent, K.; Varsani, A.; Rybicki, E.P. Maize Streak Virus: An Old and Complex “emerging” Pathogen. Mol. Plant Pathol. 2010, 11, 1–12. [Google Scholar] [CrossRef]
  5. African Development Bank. AfDB National Climate Change Profile; African Development Bank: Abidjan, Ivoorkust, 2018; pp. 1–28. [Google Scholar]
  6. Qin, Y.; Shi, G.; Sun, Y. Evaluation of Genetic Diversity in Pampus Argenteus Using SSR Markers. Genet. Mol. Res. 2013, 12, 5833–5841. [Google Scholar] [CrossRef]
  7. Aci, M.M.; Revilla, P.; Morsli, A.; Djemel, A.; Belalia, N.; Kadri, Y.; Khelifi-Saloui, M.; Ordás, B.; Khelifi, L. Genetic Diversity in Algerian Maize (Zea Mays L) Landraces Using SSR Markers. Maydica 2013, 58, 304–310. [Google Scholar]
  8. Security, F.; Republic, T.H.E.; South, O.F. Special Report–2020 FAO/WFP Crop and Food Security Assessment Mission (CFSAM) to the Republic of South Sudan; FAO: Rome, Italy, 2021; ISBN 9789251343470. [Google Scholar]
  9. Awata, L.A.O.; Tokwiny, S.A.; Kitara, I.; Zozimo, R.O.; Bennet, V.S.; Oyiki, C.O. Adaptation of Hybrid Maize to Greenbelt and Ironstone Plateau Agro-Ecologies of South Sudan. Plant Breed. Biotechnol. 2021, 9, 124–138. [Google Scholar] [CrossRef]
  10. PwC. Positioning Nigeria as Africa’s Leader in Maize Production for AfCFTA; PwC: London, UK, 2021. [Google Scholar]
  11. Kim, O.G.; Sa, K.J.; Lee, J.R.; Lee, J.K. Genetic Analysis of Maize Germplasm in the Korean Genebank and Association with Agronomic Traits and Simple Sequence Repeat Markers. Genes Genom. 2017, 39, 843–853. [Google Scholar] [CrossRef]
  12. European Union. South Sudan Rural development Programme South Sudan Crop Production. Farmer Ext. Guid. 2016, 15. Available online: https://europa.eu/capacity4dev/file/30356/download?token=pMPhuRFm (accessed on 1 October 2022).
  13. Prasanna, B.M. Diversity in Global Maize Germplasm: Characterization and Utilization. J. Biosci. 2012, 37, 843–855. [Google Scholar] [CrossRef]
  14. Govindaraj, M.; Vetriventhan, M.; Srinivasan, M. Importance of Genetic Diversity Assessment in Crop Plants and Its Recent Advances: An Overview of Its Analytical Perspectives. Genet. Res. Int. 2015, 2015, 431487. [Google Scholar] [CrossRef] [PubMed] [Green Version]
  15. Gauthier, P.; Gouesnard, B.; Dallard, J.; Redaelli, R.; Rebourg, C.; Charcosset, A.; Boyat, A. RFLP Diversity and Relationships among Traditional European Maize Populations. Theor. Appl. Genet. 2002, 105, 91–99. [Google Scholar] [CrossRef] [PubMed]
  16. Belalia, N.; Lupini, A.; Djemel, A.; Morsli, A.; Mauceri, A.; Lotti, C.; Khelifi-Slaoui, M.; Khelifi, L.; Sunseri, F. Analysis of Genetic Diversity and Population Structure in Saharan Maize (Zea mays L.) Populations Using Phenotypic Traits and SSR Markers. Genet. Resour. Crop Evol. 2019, 66, 243–257. [Google Scholar] [CrossRef]
  17. Kamaluddin; Khan, M.A.; Kiran, U.; Ali, A.; Abdin, M.Z.; Zargar, M.Y.; Ahmad, S.; Sofi, P.A.; Gulzar, S. Molecular Markers and Marker-Assisted Selection in Crop Plants. In Plant Biotechnology: Principles and Applications; Springer: Singapore, 2017; pp. 295–328. [Google Scholar] [CrossRef]
  18. Rohini, M.R.; Sankaran, M.; Rajkumar, S.; Prakash, K.; Gaikwad, A.; Chaudhury, R.; Malik, S.K. Morphological Characterization and Analysis of Genetic Diversity and Population Structure in Citrus × Jambhiri Lush. Using SSR Markers. Genet. Resour. Crop Evol. 2020, 67, 1259–1275. [Google Scholar] [CrossRef]
  19. Dubreuil, P.; Rebourg, C.; Merlino, M.; Charcosset, A. Evaluation of a DNA Pooled-Sampling Strategy for Estimating the RFLP Diversity of Maize Populations. Plant Mol. Biol. Report. 1999, 17, 123–138. [Google Scholar] [CrossRef]
  20. Rebourg, C.; Gouesnard, B.; Charcosset, A. Large Scale Molecular Analysis of Traditional European Maize Populations. Relationships with Morphological Variation. Heredity 2001, 86, 574–587. [Google Scholar] [CrossRef] [PubMed] [Green Version]
  21. Dubreuil, P.; Warburton, M.; Chastanet, M.; Hoisington, D.; Charcosset, A. More on the Introduction of Temperate Maize into Europe: Large-Scale Bulk SSR Genotyping and New Historical Elements. Maydica 2006, 51, 281–291. [Google Scholar]
  22. Sharma, L.; Ramesh, B.M.; Ramesh, B. Phenotypic and microsatellite-based diversity and population genetic structure of maize landraces in India, especially from the North East Himalayan region. Genetica 2010, 138, 619–631. [Google Scholar] [CrossRef]
  23. Laborda, P.R.; Oliveira, K.M.; Garcia, A.A.F.; Paterniani, M.E.A.G.Z.; De Souza, A.P. Tropical Maize Germplasm: What Can We Say about Its Genetic Diversity in the Light of Molecular Markers? Theor. Appl. Genet. 2005, 111, 1288–1299. [Google Scholar] [CrossRef]
  24. Liu, Z.; Guo, R.; Zhao, J.; Cai, Y.; Wang, F.; Cao, M.; Wang, R.; Shi, Y.; Song, Y.; Wang, T.; et al. Genetic Diversity of Two Important Groups of Maize Landraces with Same Name in China Revealed by M13 Tailed-Primer SSRs. Agric. Sci. China 2009, 8, 15–23. [Google Scholar] [CrossRef]
  25. Sa, K.J.; Choi, I.Y.; Park, K.C.; Lee, J.K. Genetic Diversity and Population Structure among Accessions of Perilla Frutescens (L.) Britton in East Asia Using New Developed Microsatellite Markers. Genes Genom. 2018, 40, 1319–1329. [Google Scholar] [CrossRef] [PubMed]
  26. Park, Y.J.; Lee, J.K.; Kim, N.S. Simple Sequence Repeat Polymorphisms (SSRPs) for Evaluation of Molecular Diversity and Germplasm Classification of Minor Crops. Molecules 2009, 14, 4546–4569. [Google Scholar] [CrossRef] [PubMed]
  27. Oh, J.S.; Sa, K.J.; Park, H.; Hyun, D.Y.; Lee, S.; Rhee, J.H.; Lee, J.K. Genetic Variation of Native Perilla Germplasms Collected from South Korea Using Simple Sequence Repeat (Ssr) Markers and Morphological Characteristics. Plants 2021, 10, 1764. [Google Scholar] [CrossRef] [PubMed]
  28. Qi-Lun, Y.; Ping, F.; Ke-Cheng, K.; Guang-Tang, P. Genetic Diversity Based on SSR Markers in Maize (Zea mays L.) Landraces from Wuling Mountain Region in China. J. Genet. 2008, 87, 287–291. [Google Scholar] [CrossRef] [PubMed]
  29. Oppong, A.; Bedoya, C.A.; Ewool, M.B.; Asante, M.D.; Thompson, R.N.; Adu-Dapaah, H.; Lamptey, J.N.L.; Ofori, K.; Offei, S.K.; Warburton, M.L. Bulk Genetic Characterization of Ghanaian Maize Landraces Using Microsatellite Markers. Maydica 2014, 59, 1–8. [Google Scholar]
  30. Cömertpay, G.; Baloch, F.S.; Kilian, B.; Ülger, A.C.; Özkan, H. Diversity Assessment of Turkish Maize Landraces Based on Fluorescent Labelled SSR Markers. Plant Mol. Biol. Rep. 2012, 30, 261–274. [Google Scholar] [CrossRef]
  31. Enoki, H.; Sato, H.; Koinuma, K. SSR Analysis of Genetic Diversity among Maize Inbred Lines Adapted to Cold Regions of Japan. Theor. Appl. Genet. 2002, 104, 1270–1277. [Google Scholar] [CrossRef]
  32. Thakur, N.; Prakash, J.; Thakur, K.; Sharma, J.K.; Kumari, R.; Rana, M.; Lata, S. Genetic Diversity and Structure of Maize Accessions of North Western Himalayas Based on Morphological and Molecular Markers. Proc. Natl. Acad. Sci. India Sect. B-Biol. Sci. 2017, 87, 1385–1398. [Google Scholar] [CrossRef]
  33. Lia, V.V.; Poggio, L.; Confalonieri, V.A. Microsatellite Variation in Maize Landraces from Northwestern Argentina: Genetic Diversity, Population Structure and Racial Affiliations. Theor. Appl. Genet. 2009, 119, 1053–1067. [Google Scholar] [CrossRef] [PubMed]
  34. Noldín, O.; Revilla, P.; Ordás, B. Genetic Diversity of the Floury Race of Maize Avati Morotî from the Guaraní Tribe in Paraguay. Span. J. Agric. Res. 2016, 14, e0707. [Google Scholar] [CrossRef] [Green Version]
  35. Reif, J.C.; Warburton, M.L.; Xia, X.C.; Hoisington, D.A.; Crossa, J.; Taba, S.; Muminović, J.; Bohn, M.; Frisch, M.; Melchinger, A.E. Grouping of Accessions of Mexican Races of Maize Revisited with SSR Markers. Theor. Appl. Genet. 2006, 113, 177–185. [Google Scholar] [CrossRef] [PubMed]
  36. Eschholz, T.W.; Stamp, P.; Peter, R.; Leipner, J.; Hund, A. Genetic Structure and History of Swiss Maize (Zea mays L. Ssp. Mays) Landraces. Genet. Resour. Crop Evol. 2010, 57, 71–84. [Google Scholar] [CrossRef] [Green Version]
  37. Yao, Q.; Fang, P.; Kang, K.; Pan, G. Genetic diversity based on SSR markers in maize (Zea mays L) landraces from Wuling mountain region in China. J. Genet 2007, 87, 287–291. [Google Scholar]
  38. Njuguna, W. Development and Use of Molecular Tools in Fragaria. Ph.D. Thesis, Oregon State University, Corvallis, OR, USA, 2010. [Google Scholar]
  39. Hilmarsson, H.S.; Hytönen, T.; Isobe, S.; Göransson, M.; Toivainen, T.; Hallsson, J.H. Population Genetic Analysis of a Global Collection of Fragaria Vesca Using Microsatellite Markers. PLoS ONE 2017, 12, e0183384. [Google Scholar] [CrossRef]
  40. Chesser, R.K. Gene Diversity and Female Philopatry. Genetics 1991, 127, 437–447. [Google Scholar] [CrossRef] [PubMed]
  41. Luo, Z.; Brock, J.; Dyer, J.M.; Kutchan, T.; Schachtman, D.; Augustin, M.; Ge, Y.; Fahlgren, N.; Abdel-Haleem, H. Genetic Diversity and Population Structure of a Camelina Sativa Spring Panel. Front. Plant Sci. 2019, 10, 184. [Google Scholar] [CrossRef] [PubMed] [Green Version]
  42. Pineda-Hidalgo, K.V.; Méndez-Marroquín, K.P.; Alvarez, E.V.; Chávez-Ontiveros, J.; Sánchez-Peña, P.; Garzón-Tiznado, J.A.; Vega-García, M.O.; López-Valenzuela, J.A. Microsatellite-Based Genetic Diversity among Accessions of Maize Landraces from Sinaloa in México. Hereditas 2013, 150, 53–59. [Google Scholar] [CrossRef]
  43. N’da, H.A.; Akanvou, L.; Pokou, N.D.; Akanza, K.P.; Kouakou, C.K.; Zoro, B.I.A. Genetic Diversity and Population Structure of Maize Landraces from Cte DIvoire. Afr. J. Biotechnol. 2016, 15, 2507–2516. [Google Scholar] [CrossRef] [Green Version]
  44. Wasala, S.K.; Prasanna, B.M. Microsatellite Marker-Based Diversity and Population Genetic Analysis of Selected Lowland and Mid-Altitude Maize Landrace Accessions of India. J. Plant Biochem. Biotechnol. 2013, 22, 392–400. [Google Scholar] [CrossRef]
  45. Louette, D.; Charrier, A.; Berthaud, J. In Situ Conservation of Maize in Mexico: Genetic Diversity and Maize Seed Management in a Traditional Community. Econ. Bot. 1997, 51, 20–38. [Google Scholar] [CrossRef]
  46. Singode, A.; Prasanna, B.M. Analysis of Genetic Diversity in the North Eastern Himalayan Maize Landraces Using Microsatellite Markers. J. Plant Biochem. Biotechnol. 2010, 19, 33–41. [Google Scholar] [CrossRef]
  47. Da Silva, T.A.; Cantagalli, L.B.; Saavedra, J.; Lopes, A.D.; Mangolin, C.A.; da Silva Machado, M.D.F.P.; Scapima, C.A. Population Structure and Genetic Diversity of Brazilian Popcorn Germplasm Inferred by Microsatellite Markers. Electron. J. Biotechnol. 2015, 18, 181–187. [Google Scholar] [CrossRef] [Green Version]
  48. Dellaporta, S.L.; Wood, J.; Hicks, J.B. A plant DNA mini-preparation: Version II. Plant Mol. Biol. Rep. 1983, 1, 19–21. [Google Scholar] [CrossRef]
  49. Liu, K.; Muse, S.V. PowerMarker: An integrated analysis environment for genetic marker analysis. Bioinformatics 2005, 21, 2128–2129. [Google Scholar] [CrossRef] [PubMed]
  50. Yeh, F.C.; Yang, R.C.; Boyle, T. POPGENE 1.32: A Free Program for the Analysis of Genetic Variation Among and Within Populations Using Co-Dominant and Dominant Markers; Uni Alberta: Edmonton, AB, Canada, 2000. [Google Scholar]
  51. Dice, L.R. Measures of the amount of ecologic association between species. Ecology 1945, 26, 297–302. [Google Scholar] [CrossRef]
  52. Rohlf, F. NTSYS-pc: Numerical Taxonomy and Multivariate Analysis System; Version Exter Software: Setauket, NY, USA, 2000. [Google Scholar]
  53. Pritchard, J.K.; Wen, W.; Falush, D. Documentation for Structure Software: Version 2.3. 2003. Available online: http://pritc.h.bsd.uchicago.edu/structure.html (accessed on 1 November 2021).
  54. Evanno, G.; Regnaut, S.; Goudet, J. Detecting the number of clusters of individuals using the software STRUCTURE: A simulation study. Mol. Ecol. 2005, 14, 2611–2620. [Google Scholar] [CrossRef] [PubMed] [Green Version]
  55. Peakall, R.; Smouse, P.E. GenALEx 6.5: Genetic Analysis in Excel. Population Genetic Software for Teaching and Research-an Update. Bioinformatics 2012, 28, 2537–2539. [Google Scholar] [CrossRef] [Green Version]
  56. Pagnotta, M. Comparison among Methods and Statistical Software Packages to Analyze Germplasm Genetic Diversity b Means of Codominant Markersy. J-Multidiscip. Sci. J. 2018, 1, 197–215. [Google Scholar] [CrossRef]
Figure 1. Maps showing geographic location of collection site of maize landrace populations sampled in South Sudan (●: maize population of southern region, ■: maize population of central region, and ▲: maize population of northern region). Refer to Table 1, for the full name of locations’ abbreviations used in the Figure 1.
Plants 11 02787 g001
Figure 2. The magnitude of ∆K as a function of K; the peak value of ∆K was at K = 2, suggesting two genetic groups in the 37 maize landrace accessions.
Plants 11 02787 g002
Figure 3. The population structure pattern for the highest ΔK value, K = 2, of the 37 maize landrace accessions.
Plants 11 02787 g003
Figure 4. UPGMA dendrogram of 37 maize accessions based on 27 SSR markers (●: Southern region maize accessions, ▲: Northern regions maize accessions, ■: Central region maize accessions).
Plants 11 02787 g004
Table 1. Summary of 37 maize landrace accessions collected from various locations in South Sudan.
PopulationReference Name (Abbr)Field-Plot NameField-Plot LocationNo. Genotype SampledBiological StatusGeographical Coordinates
LatitudeLongitude
Southern
populations
BOBorBor, Gonglei State3Landrace6°12′47.8″31°33′56.0″
RJRejafCentral Equatoria State4Landrace4°45′07.9″31°34′18.8″
MNMangallaCentral Equatoria State4Landrace5°10′48.0″31°46′04.8″
GOGondokorCentral Equatoria State3Landrace4°54′00.0″31°40′00.1″
TRToritTorit, Magwi, Eastern Equatoria2Landrace4°24′36.7″32°34′26.4″
YMYambioWestern Equatoria State1Landrace4°34′39.4″28°23′55.7″
Central
populations
ARAberRumbek, Lake State3Landrace6°48′25.9″29°40′44.0″
MDMadhokRumbek, Lake State3Landrace6°42′22.7″29°40′46.6″
ADAdullRumbek, Lake State3Landrace6°37′00.1″29°57′00.0″
TOTonjTonj, Kuajok, warrap State2Landrace8°18′14.4″27°59′36.2″
Northern
populations
WAWauWau, Raja, western bahr ghazhal State3Landrace7°42′33.1″27°59′00.6″
AWAweilNorthern Bahr el Ghazal State1Landrace8°46′01.6″27°23′59.3″
YDYidaRuweng Administrative Area3Landrace10°06′13.0″30°05′25.1″
RERenkRenk, Upper Nile State1Landrace11°44′34.8″32°48′16.1″
BEBentiuBentiu, Unity State1Landrace9°13′53.4″29°48′01.8″
Total37
Table 2. Genetic parameters summary of 27 SSR markers used for analyzing the 37 maize landrace accessions.
SSR Loci NameChr.Allele SizeSample SizeAllele NoNaNeIHoHeMAFGDPIC
bnlg16059100–15074851.7440.8830.3510.4320.5950.6140.590
umc10241102–15070631.8950.7850.0860.4790.5950.5800.532
umc10667110–15072631.8820.7620.3890.4750.4590.6520.590
umc10828150–20066943.5711.3260.4850.7310.2430.8590.844
umc11014110–15038632.4310.9720.1050.6050.4860.6730.627
umc11088100–130701343.6951.3420.9140.7400.3780.8080.792
umc11308100–13074321.8100.6400.3510.4540.4860.6140.536
umc1175760–8066743.0811.2240.2730.6860.3240.7900.762
umc1227560–11056843.0451.2180.2140.6840.2430.8240.800
umc1303390–12072531.8610.7040.4170.4690.4320.6500.583
umc1315490–12074431.9380.8090.5680.4910.4320.6140.534
umc1316895–130721143.0111.2050.3890.6770.3240.8310.815
umc13392110–15052943.1081.2200.1920.6920.2970.8010.774
umc13807130–15070631.7240.7240.1430.4260.6220.5740.543
umc14544130–16068731.9590.8520.4120.4970.4590.7230.693
umc14662150–20060531.7440.7650.0670.4340.5680.6210.582
umc16077100–140701142.1621.0140.3140.5450.3240.8300.813
umc17184150–20070421.9940.6920.2570.5060.3780.6900.628
umc18724100–13074743.0091.2080.4320.6770.2970.8110.786
umc20752140–20068421.7450.6180.2650.4330.5140.6440.591
umc21358150–20052742.1360.8870.2310.5420.3510.7540.717
umc22754130–200741153.4231.4100.8650.7180.2700.8400.822
umc2286270–11056632.0850.8920.2140.5300.4050.7410.704
umc232910150–200661042.4471.0360.1820.6010.2970.8300.810
umc2334750–100741043.6951.3410.5950.7390.1350.8870.876
umc2378390–130621264.1781.5760.5480.7730.2160.8740.861
umc25407140–20064532.2930.9310.2190.5730.4050.7170.671
Max 741364.1781.5760.9140.7730.6220.8870.876
Min 38321.7240.6180.0670.4260.1350.5740.532
Mean 66.17.43.62.5061.0010.3510.5780.3900.7350.699
Total 1784200
Note: Na—Number of different alleles; Ne—Number of effective alleles; I—Shannon’s Information Index; Ho—observed Heterozygosity; He—Expected Heterozygosit; MAF—major allele frequency; GD—genetic diversity; PIC—polymorphic information contents.
Table 3. Genetic diversity parameters of 15 maize landrace populations characterized with 27 SSR markers.
Geographic PopulationSample SizeNaNeIHoHeF
AD52.0391.7780.5830.2630.4680.438
AR52.1481.9250.6010.3950.4570.135
AW21.2401.2400.1660.2400.2400.000
BE21.1921.1920.1330.1920.1920.000
BO52.1481.7900.5930.4440.4740.063
GO51.8521.6100.4760.2590.3830.322
MD62.1851.8930.6200.3640.4730.230
MN72.4072.0580.7360.4630.5620.176
RE21.1601.1600.1110.1600.1600.000
RJ72.0771.7300.5240.2920.3730.219
TO41.8001.6770.4950.4000.4670.143
TR41.8891.7700.5250.2960.4880.392
WA62.1851.8460.6120.3770.4750.208
YD62.4072.0660.7260.4570.5530.174
YM21.4291.4290.2970.4290.4290.000
Max72.4072.0660.7360.4630.5620.438
Min21.1601.1600.1110.1600.1600.000
Mean4.51.8771.6780.4800.3350.4130.167
Total68
Note: Na—Number of different alleles; Ne—Number of effective alleles; I—Shannon’s Information Index; Ho—observed Heterozygosity; He—Expected Heterozygosity; F—Fixation Index.
Table 4. Results of microsatellite analysis for group of maize populations per region.
PopulationNo. PopulationsSample SizeNaNeIHoHeF
Southern populations6303.2962.2930.9130.3530.5530.361
Central populations4203.0742.3640.9030.3550.5630.369
Northern populations5173.0002.3100.8800.3360.5520.392
Mean 22.33.1232.3220.8990.3480.5560.374
Total 67
Note: Na—Number of different alleles; Ne—Number of effective alleles; I—Shannon’s Information Index; Ho—observed Heterozygosity; He—Expected Heterozygosity; F—Fixation Index.
Table 5. Analysis of molecular variance (AMOVA) based on SSR marker in maize landrace populations.
SourcedfSSMSEst. Var.%
Among Regions263.78031.8901.2827%
Within Regions34567.19316.68216.68293%
Total36630.973 17.964100%
Note: df—Degrees of freedom; SS—Sum of squares; MS—Mean of squares; Est. Var. —Estimate of variance; %—Percentage of total variation.
Publisher’s Note: MDPI stays neutral with regard to jurisdictional claims in published maps and institutional affiliations.

