Article

Varying Responses of Vegetation Greenness to the Diurnal Warming across the Global

1
Institute of Loess Plateau, Shanxi University, Taiyuan 030006, China
2
College of Natural Resources and Environment, Northwest A & F University, Xianyang 712100, China
3
Guangdong Ecological Meteorology Center, Guangzhou 510275, China
*
Author to whom correspondence should be addressed.
Plants 2022, 11(19), 2648; https://doi.org/10.3390/plants11192648
Submission received: 13 September 2022 / Revised: 2 October 2022 / Accepted: 5 October 2022 / Published: 8 October 2022

Abstract

:
The distribution of global warming has been varying both diurnally and seasonally. Little is known about the spatiotemporal variations in the relationships between vegetation greenness and day- and night-time warming during the last decades. We investigated the global inter- and intra-annual responses of vegetation greenness to the diurnal asymmetric warming during the period of 1982–2015, using the normalized different vegetation index (NDVI, a robust proxy for vegetation greenness) obtained from the NOAA/AVHRR NDVI GIMMS3g dataset and the monthly average daily maximum (Tmax) and minimum temperature (Tmin) obtained from the gridded Climate Research Unit, University of East Anglia. Several findings were obtained: (1) The strength of the relationship between vegetation greenness and the diurnal temperature varied on inter-annual and seasonal timescales, indicating generally weakening warming effects on the vegetation activity across the global. (2) The decline in vegetation response to Tmax occurred mainly in the mid-latitudes of the world and in the high latitudes of the northern hemisphere, whereas the decline in the vegetation response to Tmin primarily concentrated in low latitudes. The percentage of areas with a significantly negative trend in the partial correlation coefficient between vegetation greenness and diurnal temperature was greater than that of the areas showing the significant positive trend. (3) The trends in the correlation between vegetation greenness and diurnal warming showed a complex spatial pattern: the majority of the study areas had undergone a significant declining strength in the vegetation greenness response to Tmax in all seasons and to Tmin in seasons except autumn. These findings are expected to have important implications for studying the diurnal asymmetry warming and its effect on the terrestrial ecosystem.

1. Introduction

Surface vegetation cover is a core component of terrestrial ecosystems, as it plays an important role in connecting material circulation and energy flow in the atmosphere, hydrosphere, and soil circles [1,2,3,4]. Current satellite observations have revealed long-term greening and browning changes in the vegetation greenness (i.e., the normalized difference vegetation index, NDVI) across the global from the 1980s until the present time [2,5,6,7,8]. Such variations in the vegetation activity are closely related to climate change, particularly the increasing global temperatures over the last several decades [1,8,9,10,11], which can be characterized by the increase in both daytime and night-time temperature [12,13]. The link between global warming and vegetation activity is overwhelming. Recent studies have investigated the responses of satellite-derived vegetation productivity to temperatures during daytime and nighttime between regions and ecosystem [12,14,15,16,17,18,19,20]. However, most of the measurements were static and insufficient to clarify the varying responses of vegetation dynamics to climate warming [21].
The relationship between vegetation activity and temperature variations is not fixed; it constantly changes over time because of the interventions of other environmental and anthropogenic factors, in the face of persistent global warming [22,23]. Therefore, the current focus is on the dynamic responses of vegetation greenness to temperature change over time. For instance, Andreu-Hayles et al. [24] explored the varying boreal forest responses to arctic environmental change near the Firth River, Alaska. Piao et al. [23] found a weakening relationship between inter-annual temperature variability and northern vegetation activity. Fu et al. [25] reported declining global warming effects on the phenology of spring leaf unfolding. Cong et al. [26] examined the varied responses of vegetation activity to climate change on the grasslands of the Tibetan Plateau. He et al. [21] identified obvious shifts in the relationship between vegetation growth and temperature in China’s temperate desert and rainforest areas. Although these findings confirm the dynamic relationship between vegetation greenness and temperature change, the link between diurnal warming and vegetation activity, particularly the variations in their correlation over time, remains unclear.
The main objective of this study was to explore the varying relationships between vegetation greenness and day- and night-time warming on temporal and spatial scale, by simultaneously employing time-series satellite-derived vegetation NDVI data and gridded meteorological data. The understandings drawn from the findings are expected to have important implications for studying the diurnal asymmetry warming and its effect on the terrestrial ecosystem.

2. Results

2.1. Trends of Correlations between Vegetation Greenness and Diurnal Warming

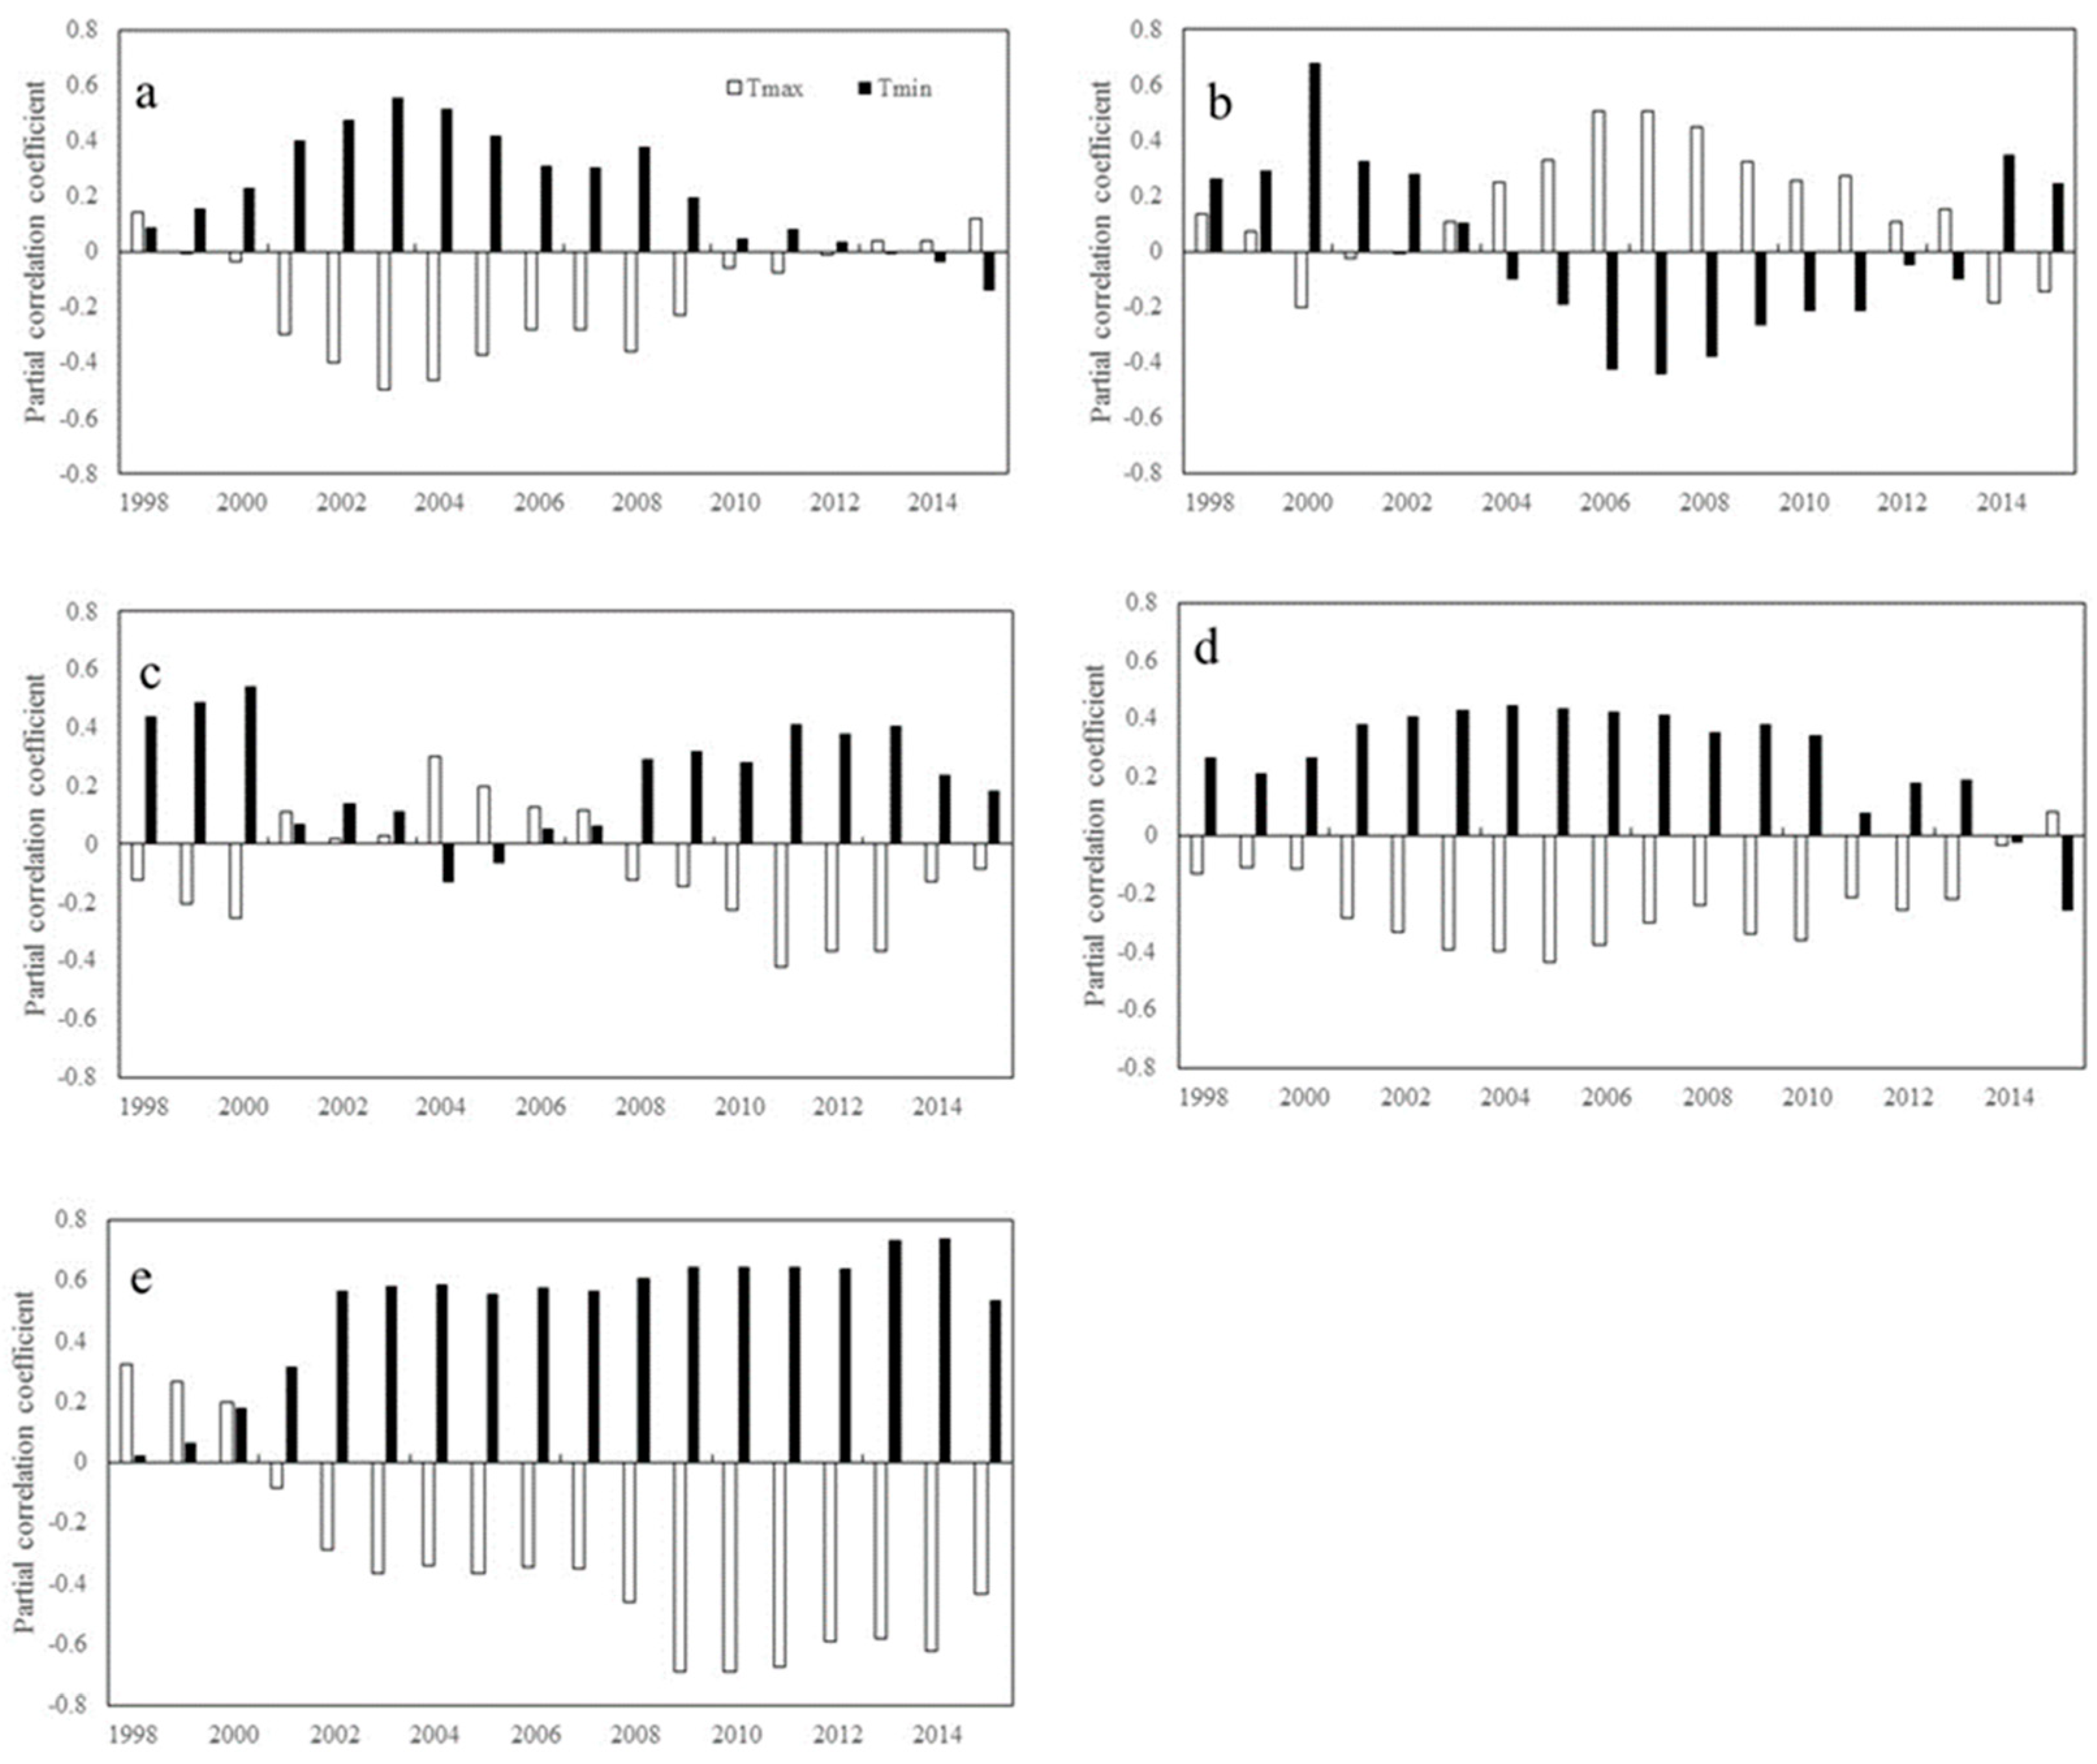
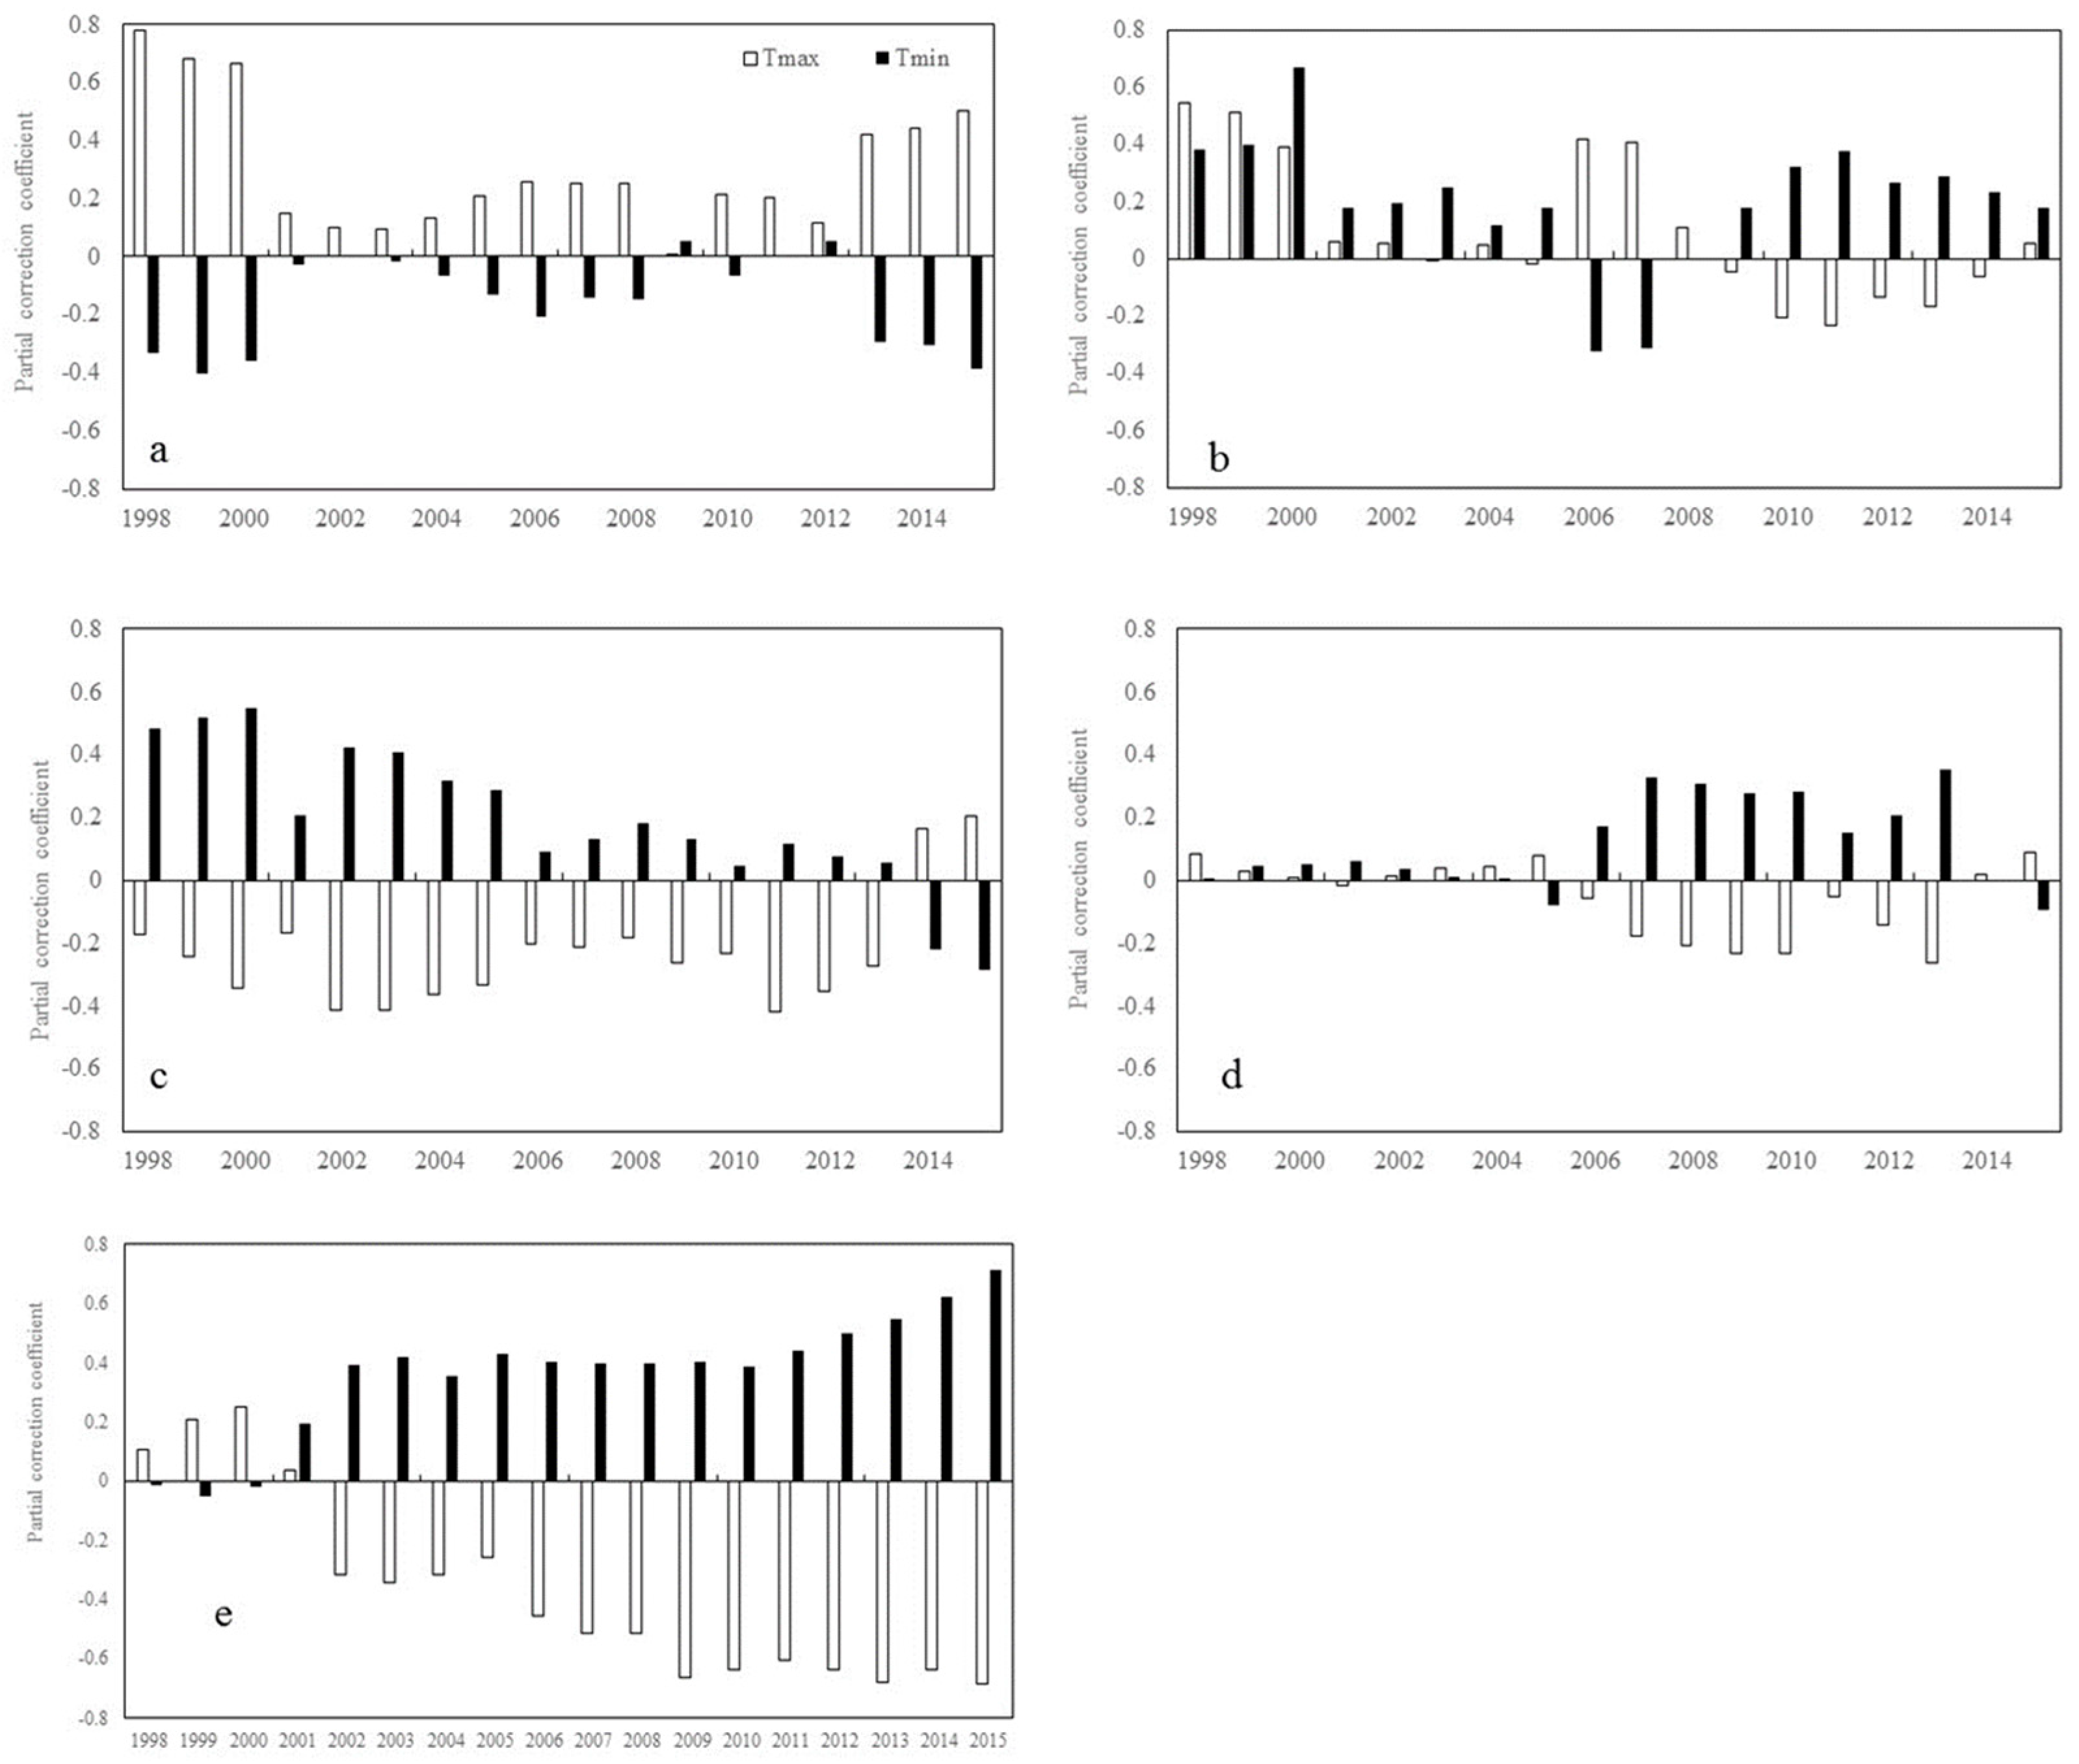
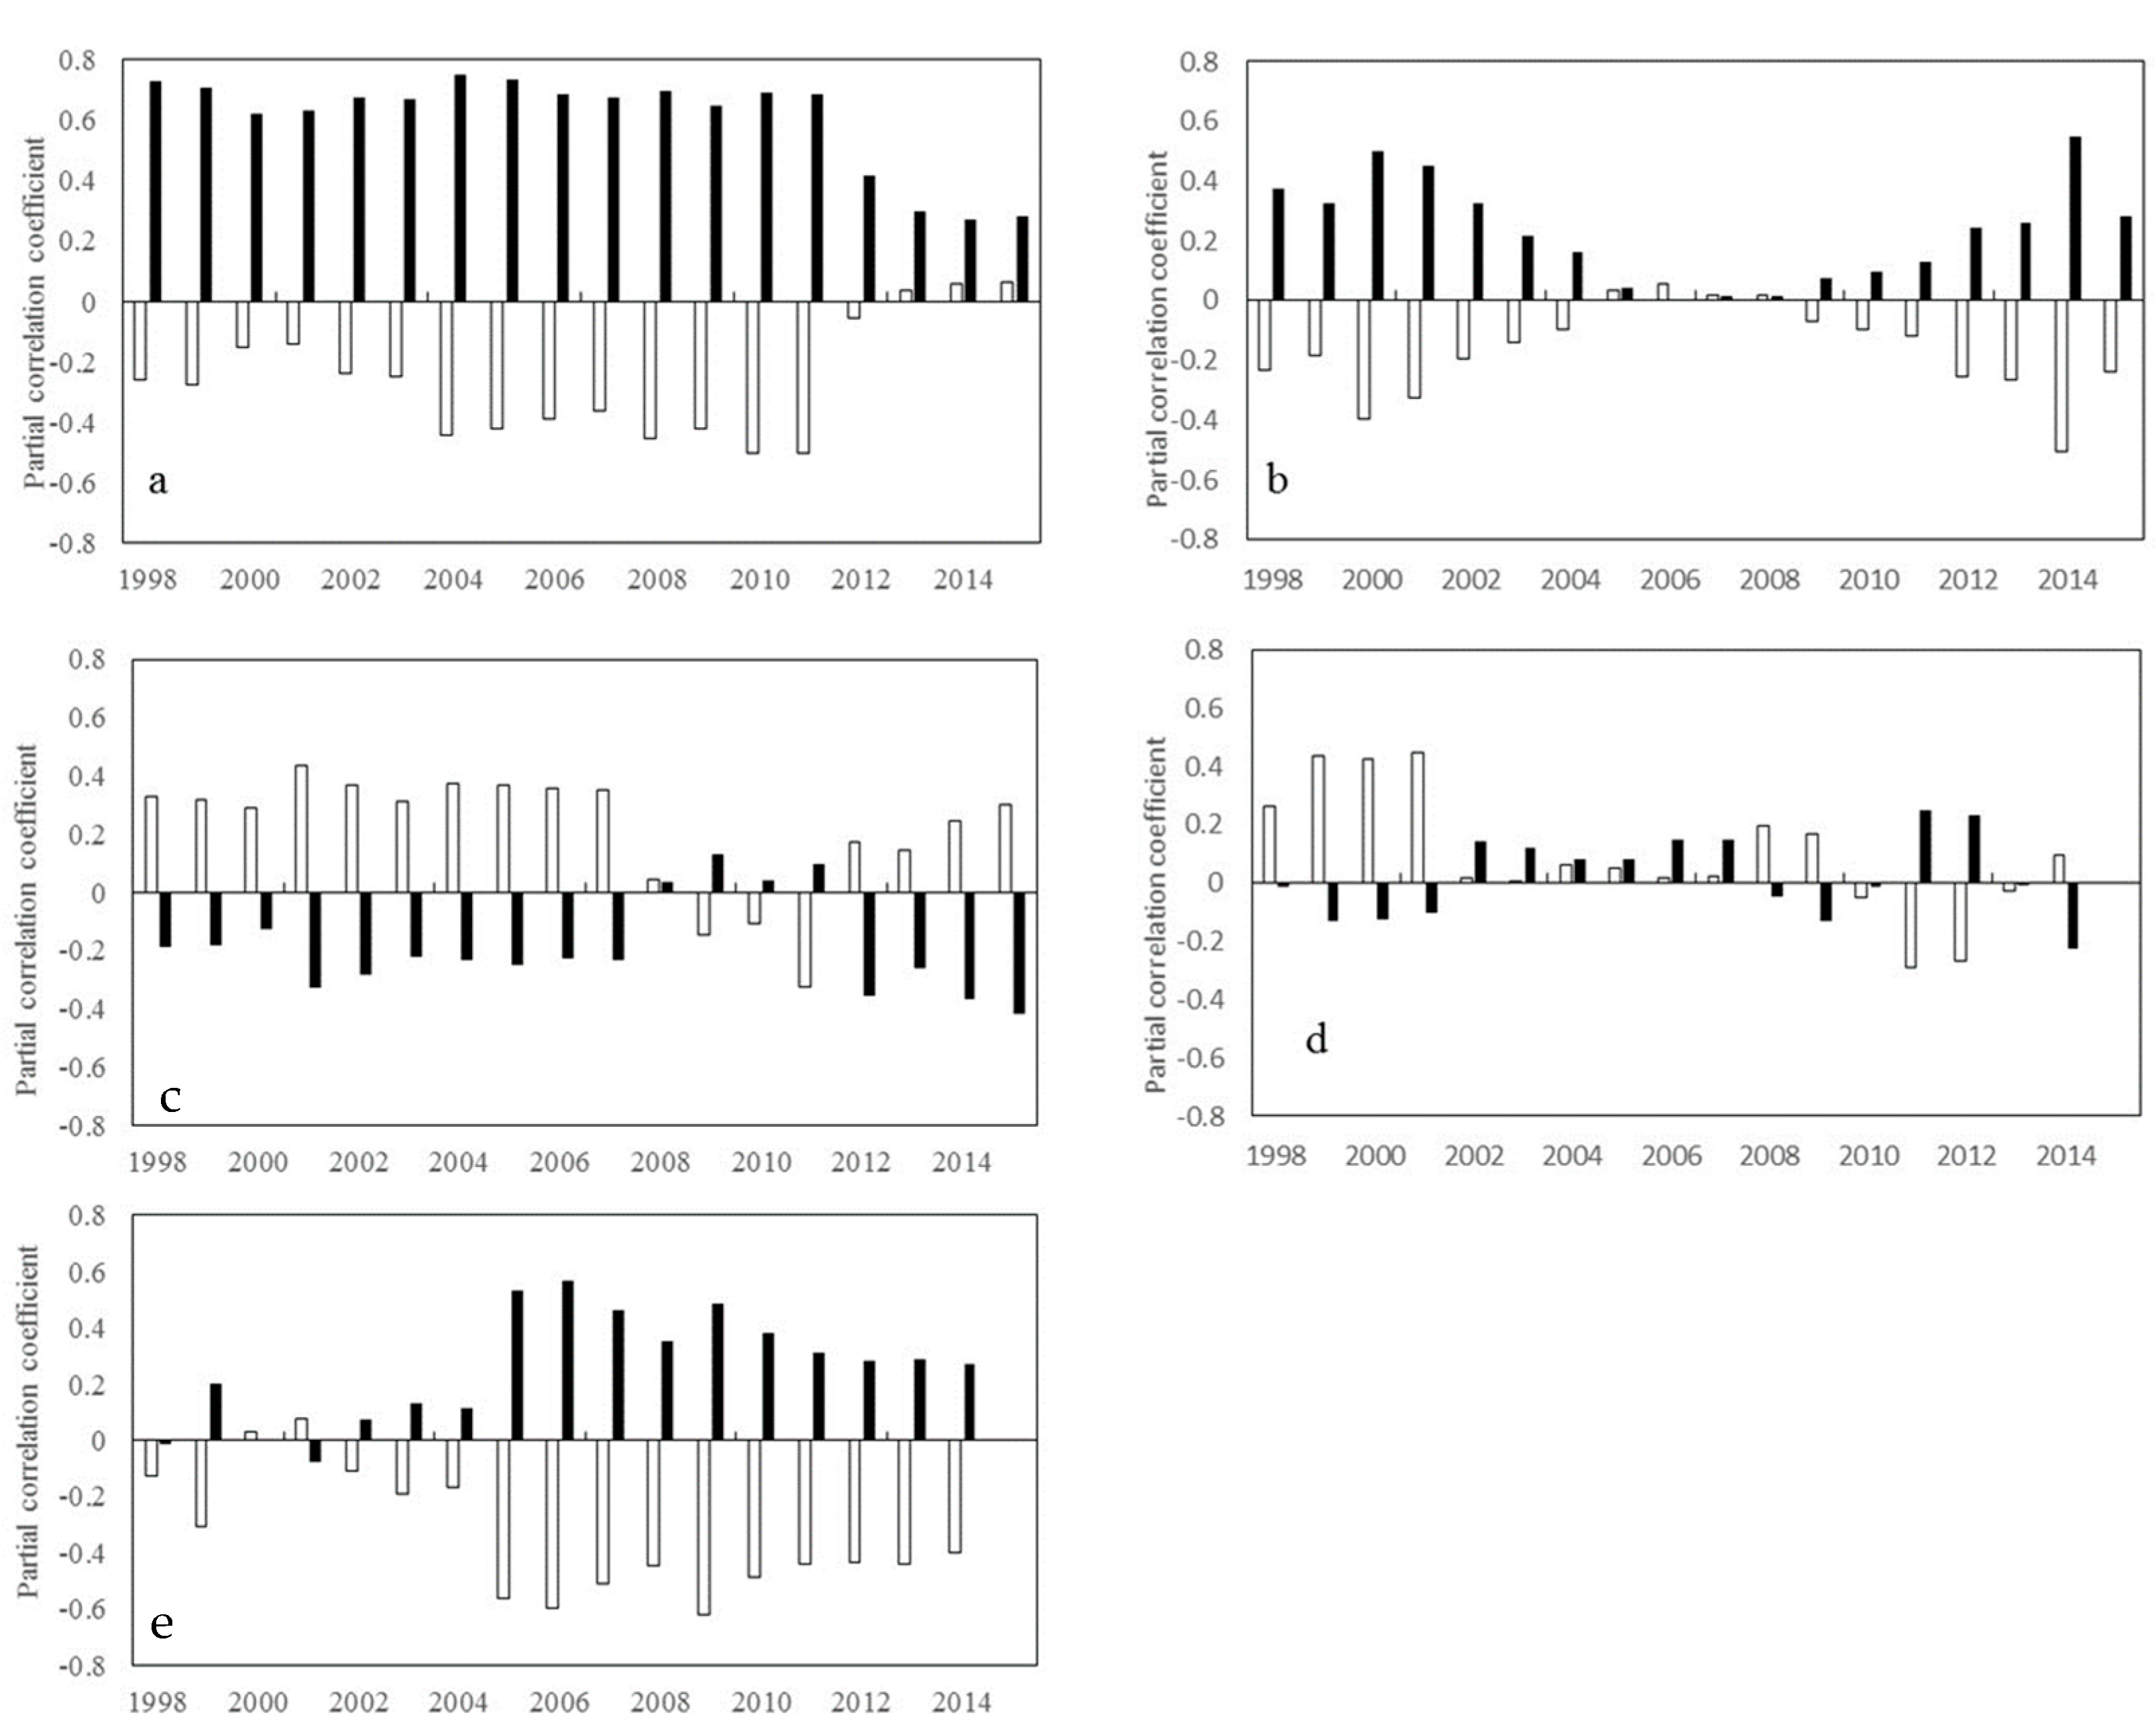
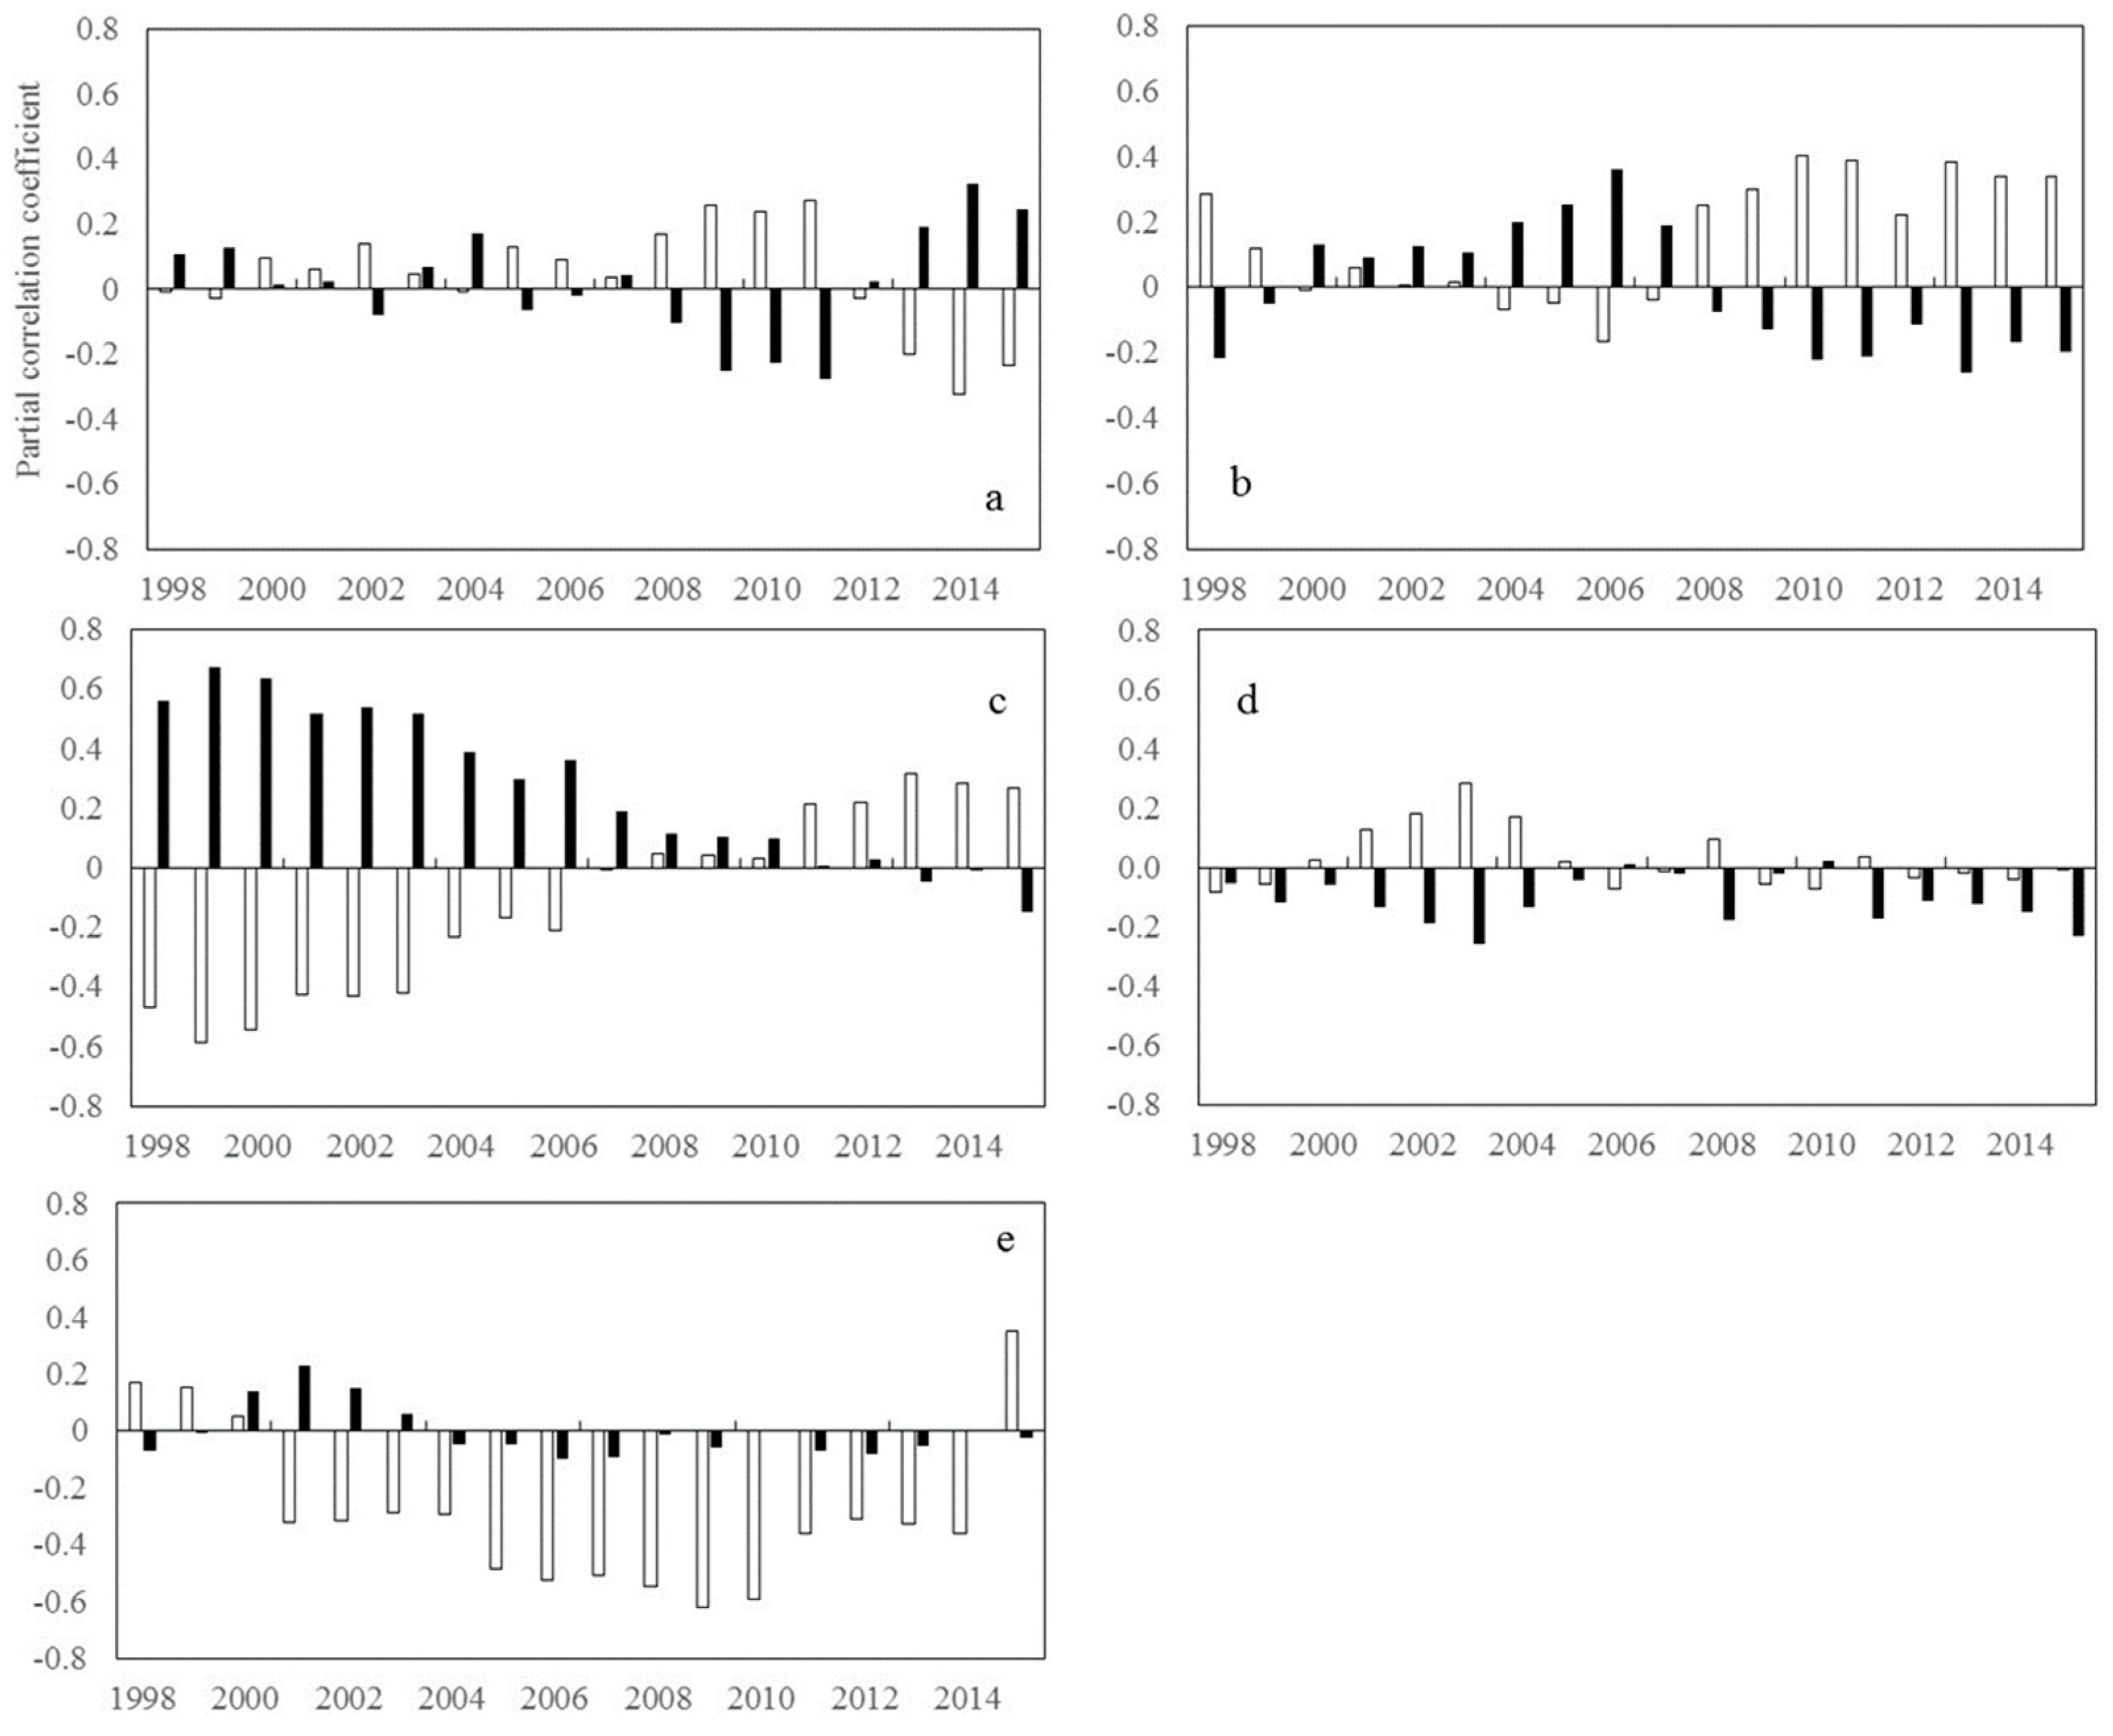
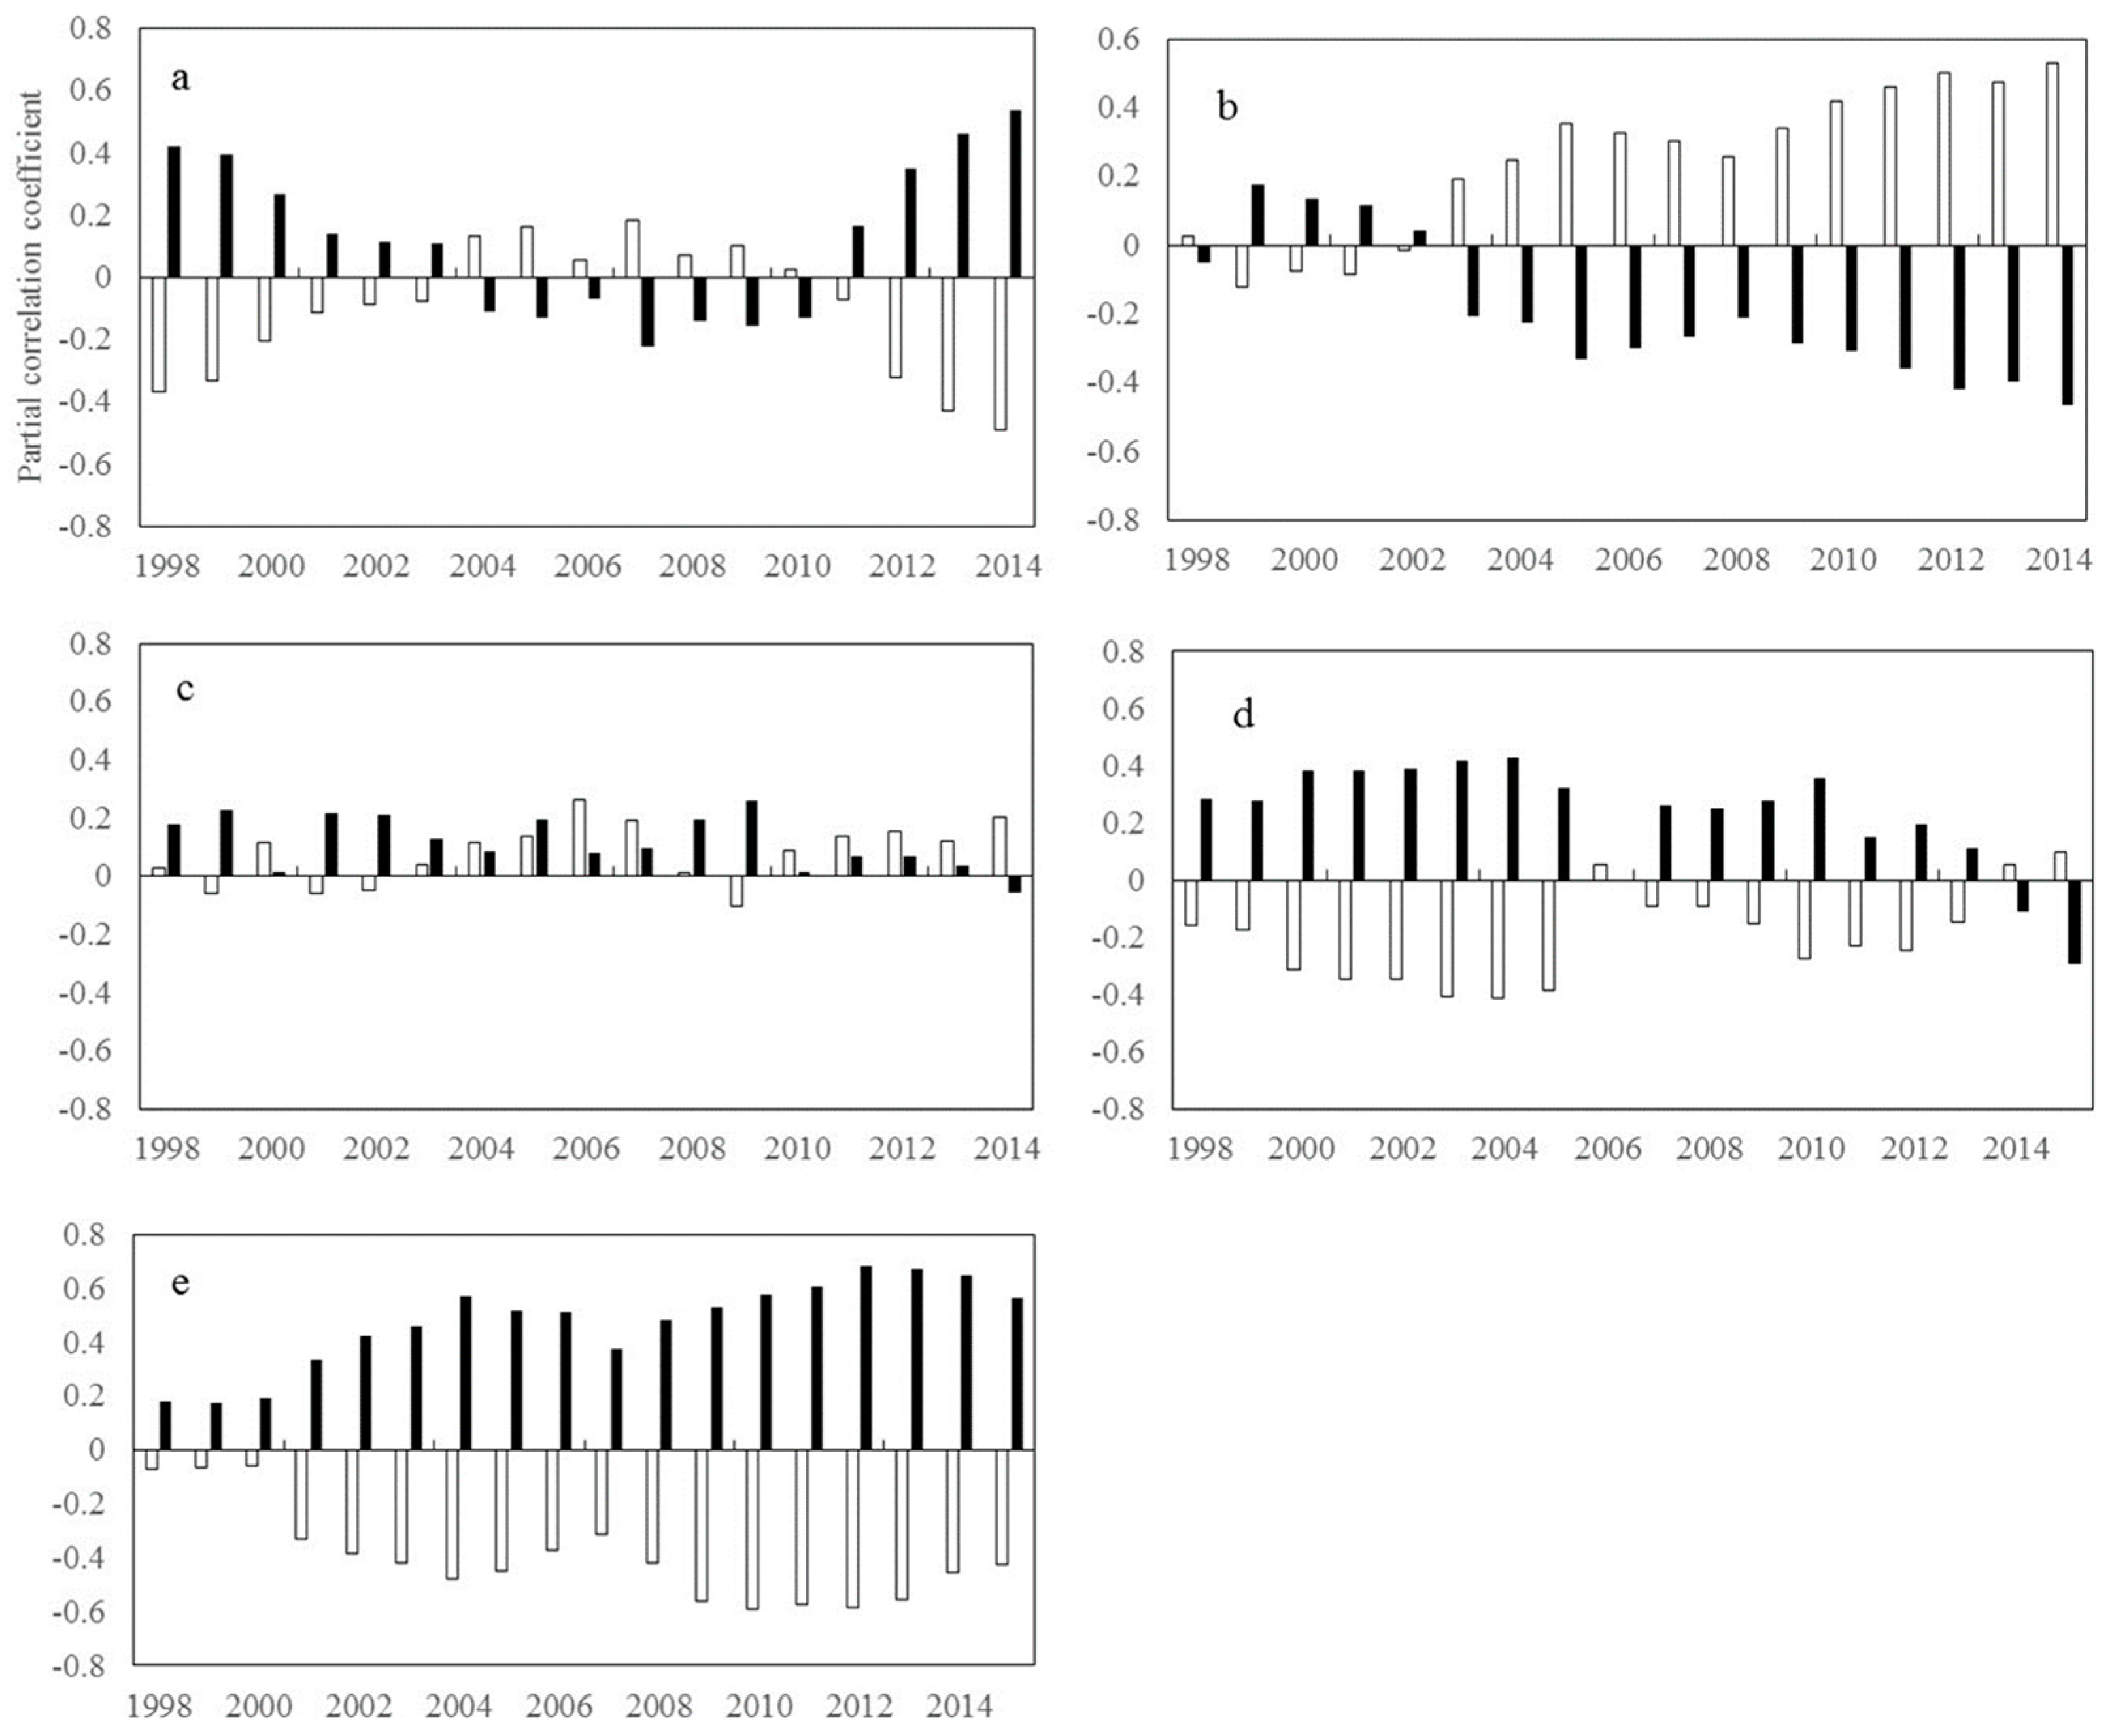
2.1.1. Inter-Annual Changes in RNDVI-Tmax and RNDVI-Tmin

Recent changes in satellite-based vegetation greenness across different areas were closely related to global warming. Figure 1 shows the inter-annual variation in the partial correlation coefficients of the NDVI and diurnal temperature for the period of 1982–2015. In the mid-latitudes of the southern hemisphere, RNDVI-Tmax is approximately 0.323 for the first window of 1982–1998 and decreased to −0.436 for the last window of 1999–2015. In the high latitudes of the northern hemisphere, RNDVI-Tmin shows a significant increasing trend (β = 0.098, p < 0.01) in the first six windows and then a significant decreasing trend (β = −0.056, p < 0.01) in the remaining windows. Similarly, in the low latitudes of the southern hemisphere, RNDVI-Tmin shows a significant increasing trend (β = 0.039, p < 0.01) in the first seven windows, followed by a significant decreasing trend (β = −0.055, p < 0.01) in the remaining windows. In contrast, in the mid-latitudes of the southern hemisphere, RNDVI-Tmin is generally on an upward trend, increasing from 0.022 in the window of 1982–1998 to 0.737 in the window of 1998–2014. These findings indicate a notable shift in the responses of vegetation activity to diurnal temperatures over the last three decades.
Overall, RNDVI-Tmax exhibits only a significant downward trend in the mid-latitudes of the southern hemisphere (β = −0.051, p < 0.05). In contrast, RNDVI-Tmin shows a significant upward trend in the mid-latitudes of the southern hemisphere (β = 0.032, p < 0.05), but a significant downward trend in the low latitudes of the southern hemisphere (β = −0.021, p < 0.05). RNDVI-Tmax does not exhibit a significant trend in the northern hemisphere (p > 0.05), and RNDVI-Tmin exhibits a significant downward trend only in the high latitudes of the northern hemisphere (β = −0.021, p < 0.05).

2.1.2. Inter-Annual Changes in RNDVI-Tmax and RNDVI-Tmin

Variations in the temperature on a seasonal scale may not correspond to similar changes on inter-annual scale. The photosynthesis of vegetation in different growth stages depends on the seasonal cycle of the temperature. Therefore, the sensitivity of vegetation greenness to day- and nighttime warming and variations in seasonality is likely to be highly complex.
During spring, RNDVI-Tmax shows a significant downward trend at the mid-latitudes in both the northern hemisphere (β = −0.031, p < 0.05) and the southern hemisphere (β = −0.055, p < 0.05) (Figure 2). RNDVI-Tmin shows a significant downward trend (β = −0.040, p < 0.05) at the low latitudes in the northern hemisphere while a significant upward trend (β = 0.035, p < 0.05) at the mid-latitudes in the southern hemisphere (Figure 2).
During summer, RNDVI-Tmax shows a significant downward trend not only at the low latitudes in the northern hemisphere (β = −0.020, p < 0.05), but also at the low and mid-latitudes in the southern hemisphere (β = −0.029, p < 0.05) (Figure 3). RNDVI-Tmin shows a significant downward trend (β = −0.022, p < 0.05) at the high latitudes in the northern hemisphere, but a significant upward trend (β = 0.023, p < 0.05) at the mid-latitudes in the southern hemisphere (Figure 3).
During autumn, RNDVI-Tmax shows a significant upward trend at the low-latitudes (β = 0.057, p < 0.01) and the mid-latitudes (β = 0.021, p < 0.01) in the northern hemisphere. (Figure 4) RNDVI-Tmin shows a significant downward trend at the mid-latitudes (β = −0.017, p < 0.05) and the low latitudes (β = −0.048, p < 0.01) in the northern hemisphere (Figure 4). However, in the southern hemisphere, we did not find any statistically significant variations in RNDVI-Tmax and RNDVI-Tmin.
During winter, RNDVI-Tmax shows a significant upward trend at the mid-latitudes in the northern hemisphere (β = 0.041, p < 0.01) and the low latitudes in the southern hemisphere (β = 0.016, p < 0.05), but a significant downward trend (β = −0.025, p < 0.01) at the mid-latitudes in the southern hemisphere (Figure 5). RNDVI-Tmin shows a significant downward trend at the low (β = −0.010, p < 0.05) and the mid-latitudes (β = −0.036, p < 0.01) in the northern hemisphere and at the low latitudes (β = −0.025, p < 0.01) in the southern hemisphere, but a significant upward trend at the mid-latitudes (β = 0.027, p < 0.01) in the southern hemisphere (Figure 5). Although we tried to characterize the sensitivity of vegetation greenness for each season, the possible mechanism leading to the seasonal divergence in the response of vegetation greenness to diurnal warming needs to be studied further.

2.2. Spatial Patterns of the Trends in the Correlations between Vegetation Greenness and Diurnal Temperatures

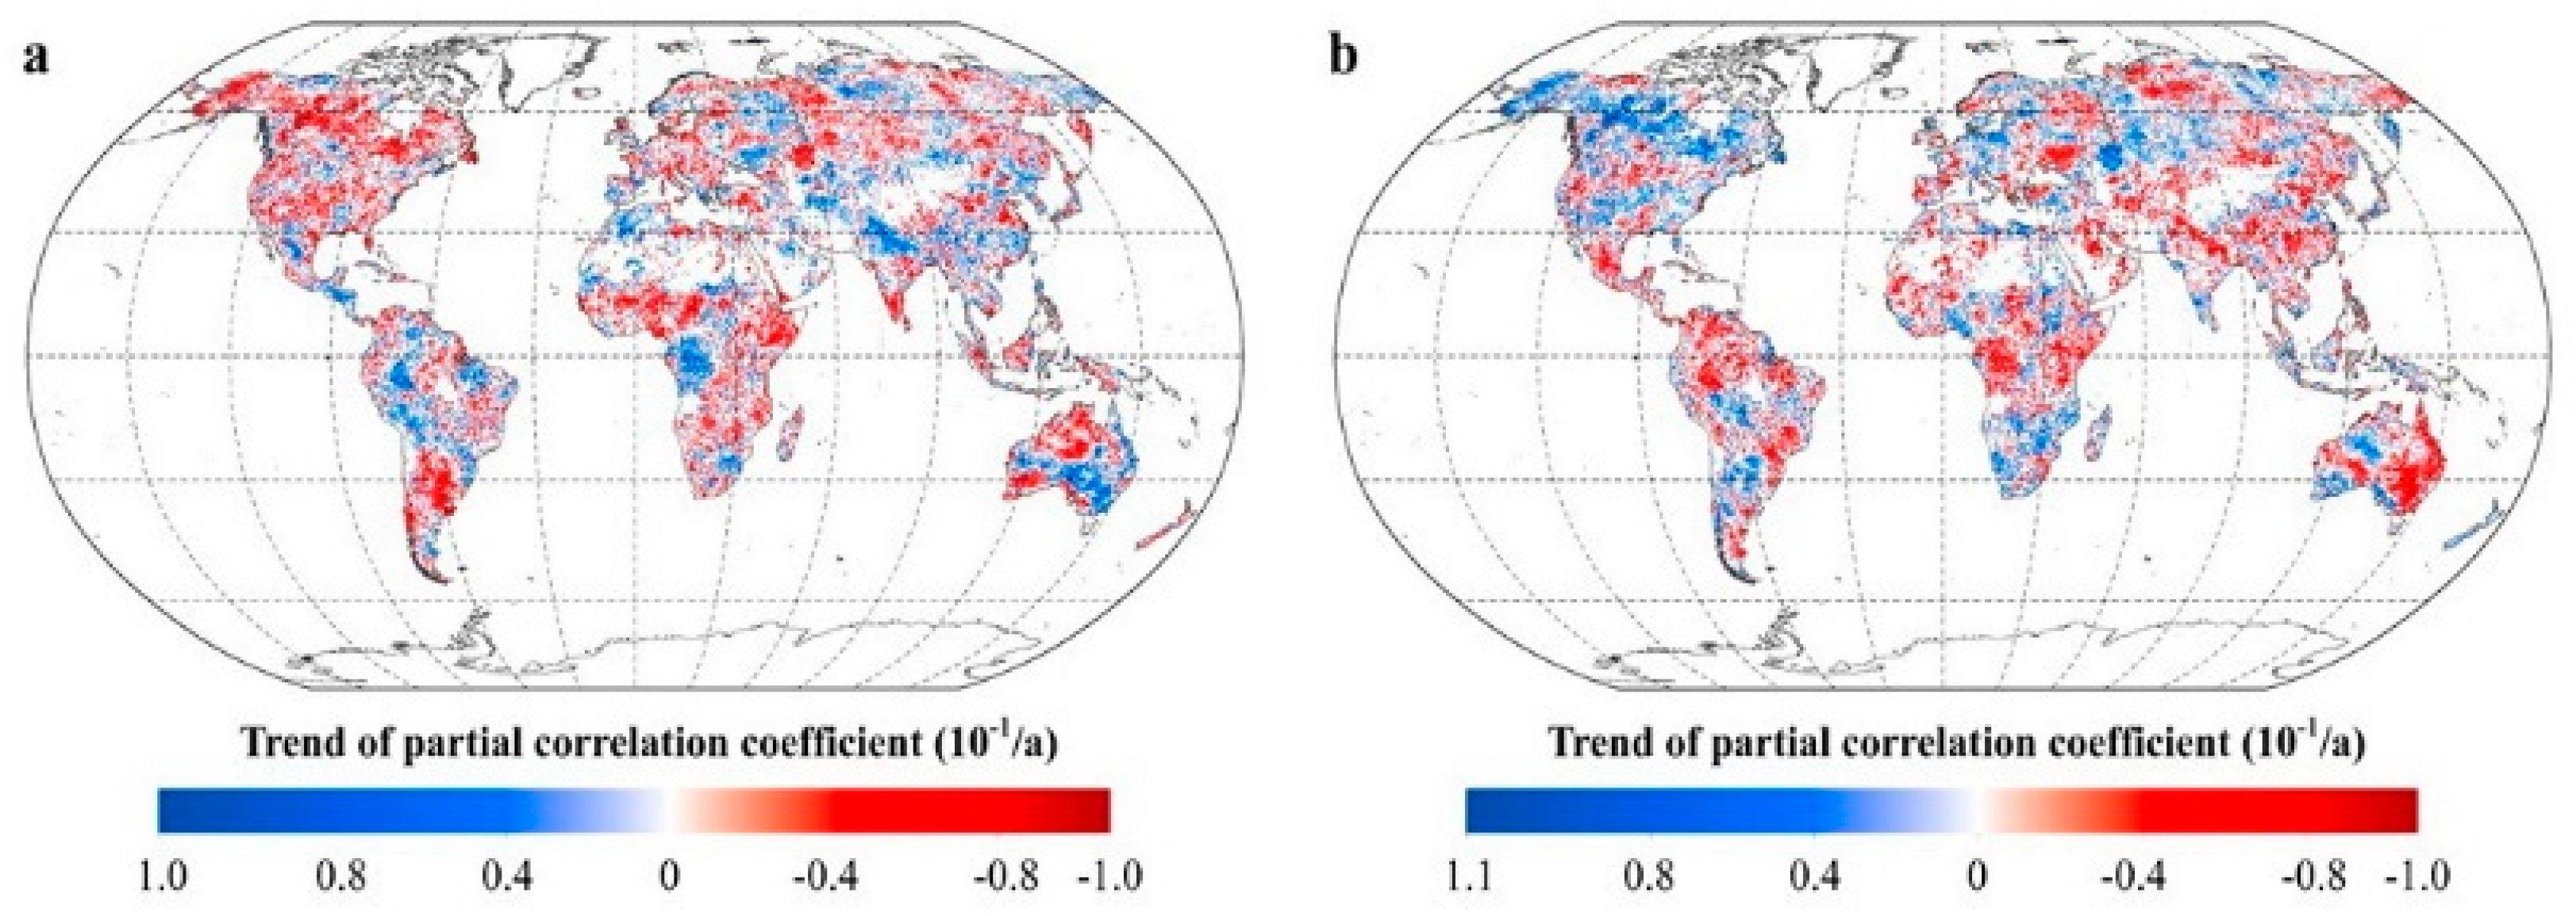
2.2.1. Inter-Annual Patterns of RNDVI-Tmax and RNDVI-Tmin

Figure 6 shows a summary of the spatial variations in the correlations between vegetation activity and diurnal temperatures over 30 years. The areas with a significant increase in RNDVI-Tmax account for 26.01% of the total vegetated areas, mainly located in the southeastern part of Oceania, the Ganges Plain, the western plains of Eastern Europe, and the Amazonian Plain. The areas with a significant decrease in RNDVI-Tmax account for 35.65% of the total vegetated areas, mainly distributed in the northwestern part of Oceania, southern South America, eastern Africa, and the cold temperate zones of the northern hemisphere. About 28.62% of the total vegetated areas show a significant upward trend in RNDVI-Tmin, these areas are mainly located in southern South America, southern Africa, Oceania, and the northwestern boreal regions of North America. Over 32.49% of the total vegetated areas shows a significant downward trend in RNDVI-Tmin, these areas are mainly distributed in eastern Oceania, central Africa, and the tropical regions in the northern hemisphere. In particular, the number of pixels with a significant decrease in RNDVI-Tmax were greater than those with a significant increase in RNDVI-Tmax in each latitude interval.
This difference in the number of pixels between RNDVI-Tmax and RNDVI-Tmin was most pronounced at the mid-latitudes in the southern hemisphere and the mid- and high latitudes in the northern hemisphere. At the mid- and high latitudes in the northern hemisphere and at the mid-latitudes in the southern hemisphere, the proportion of RNDVI-Tmin showing a significant upward trend is slightly higher than that of RNDVI-Tmin showing a significant downward trend. At low latitudes, however, the percentage of areas where RNDVI-Tmin shows a significant downward trend is much higher than that of areas where RNDVI-Tmin shows the opposite trend.
Overall, regions with a declining correlation between vegetation greenness and diurnal temperatures were more than those with an increasing correlation. This implies that worldwide vegetation activity on a larger scale became less sensitive to variations in the day- and night temperature with global warming during the last several decades.

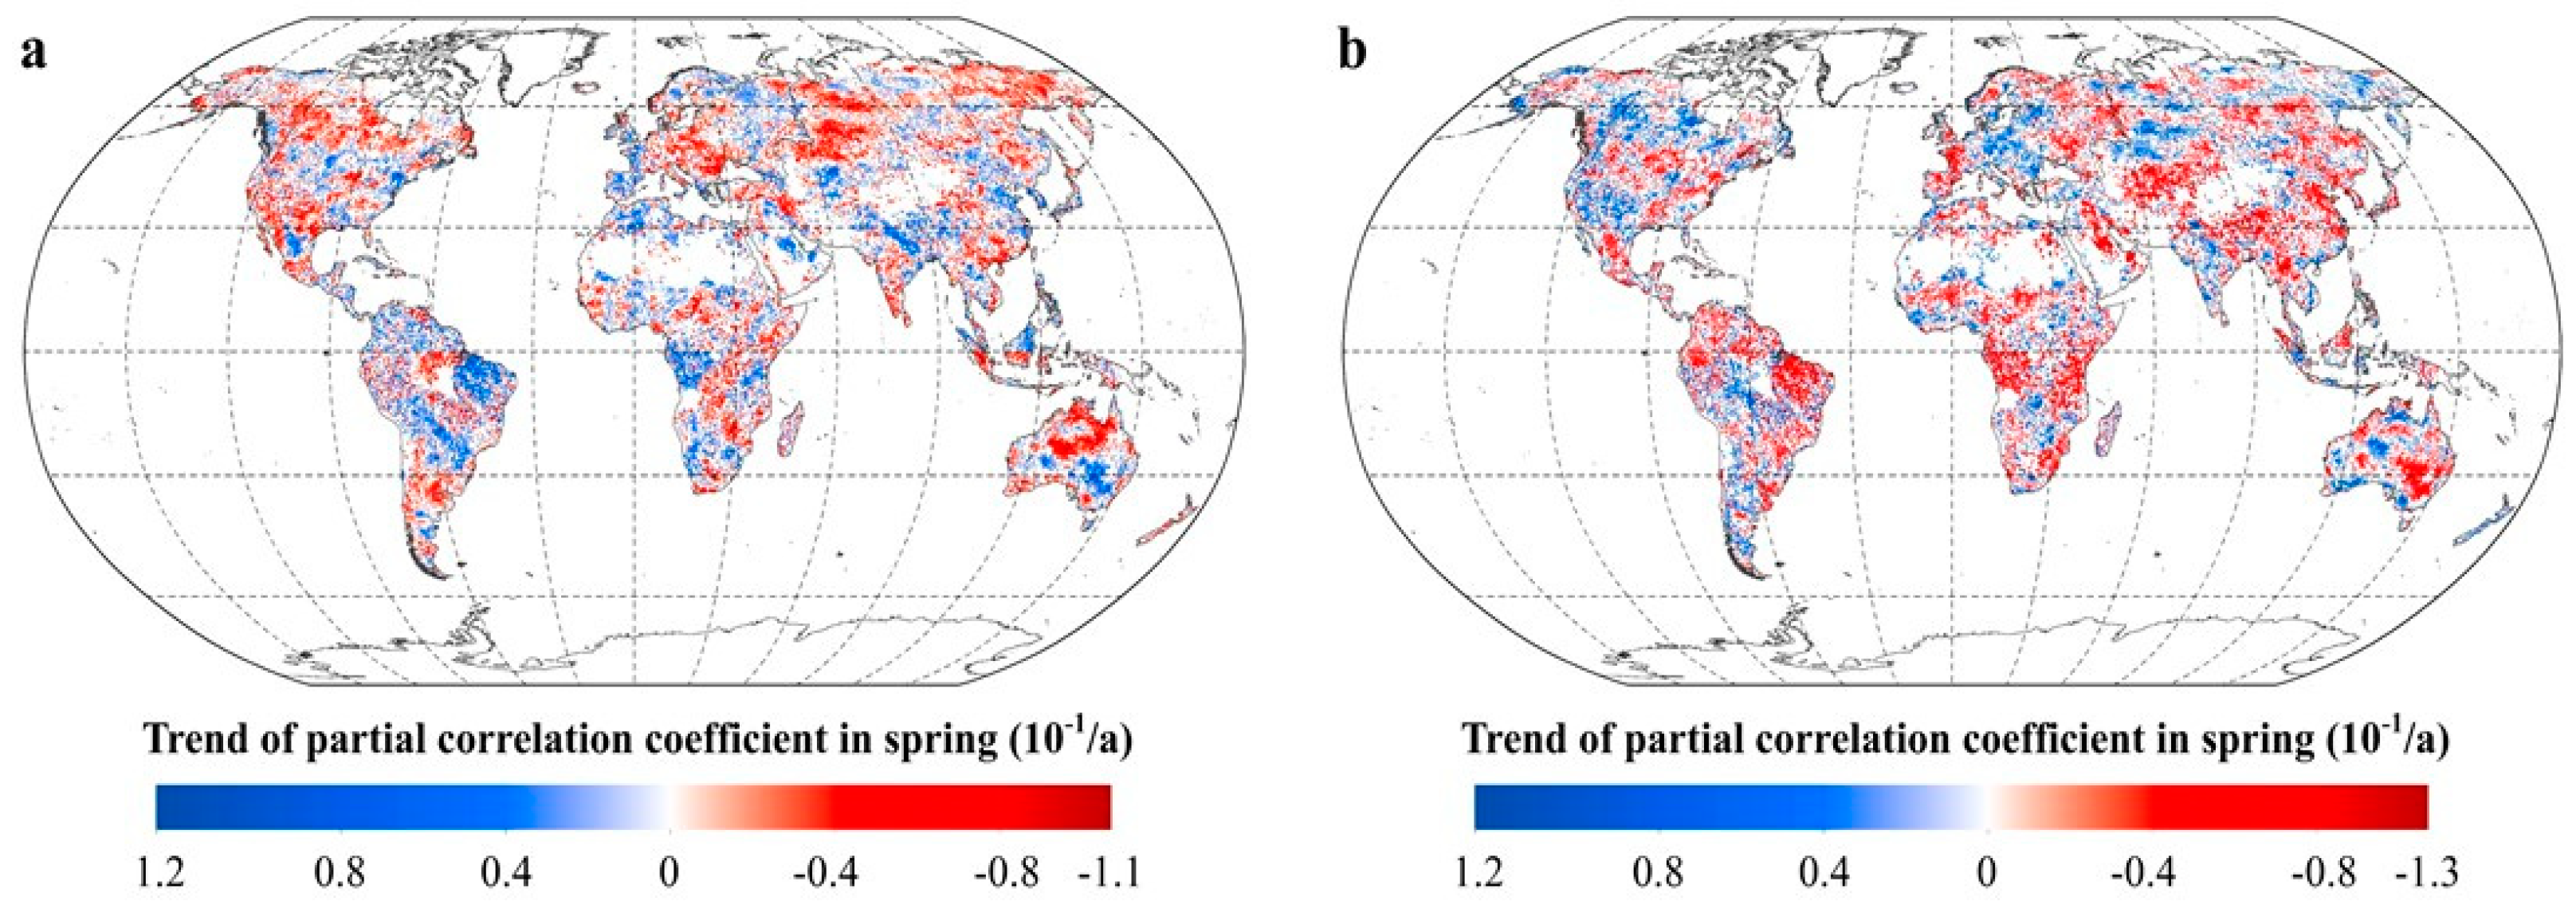
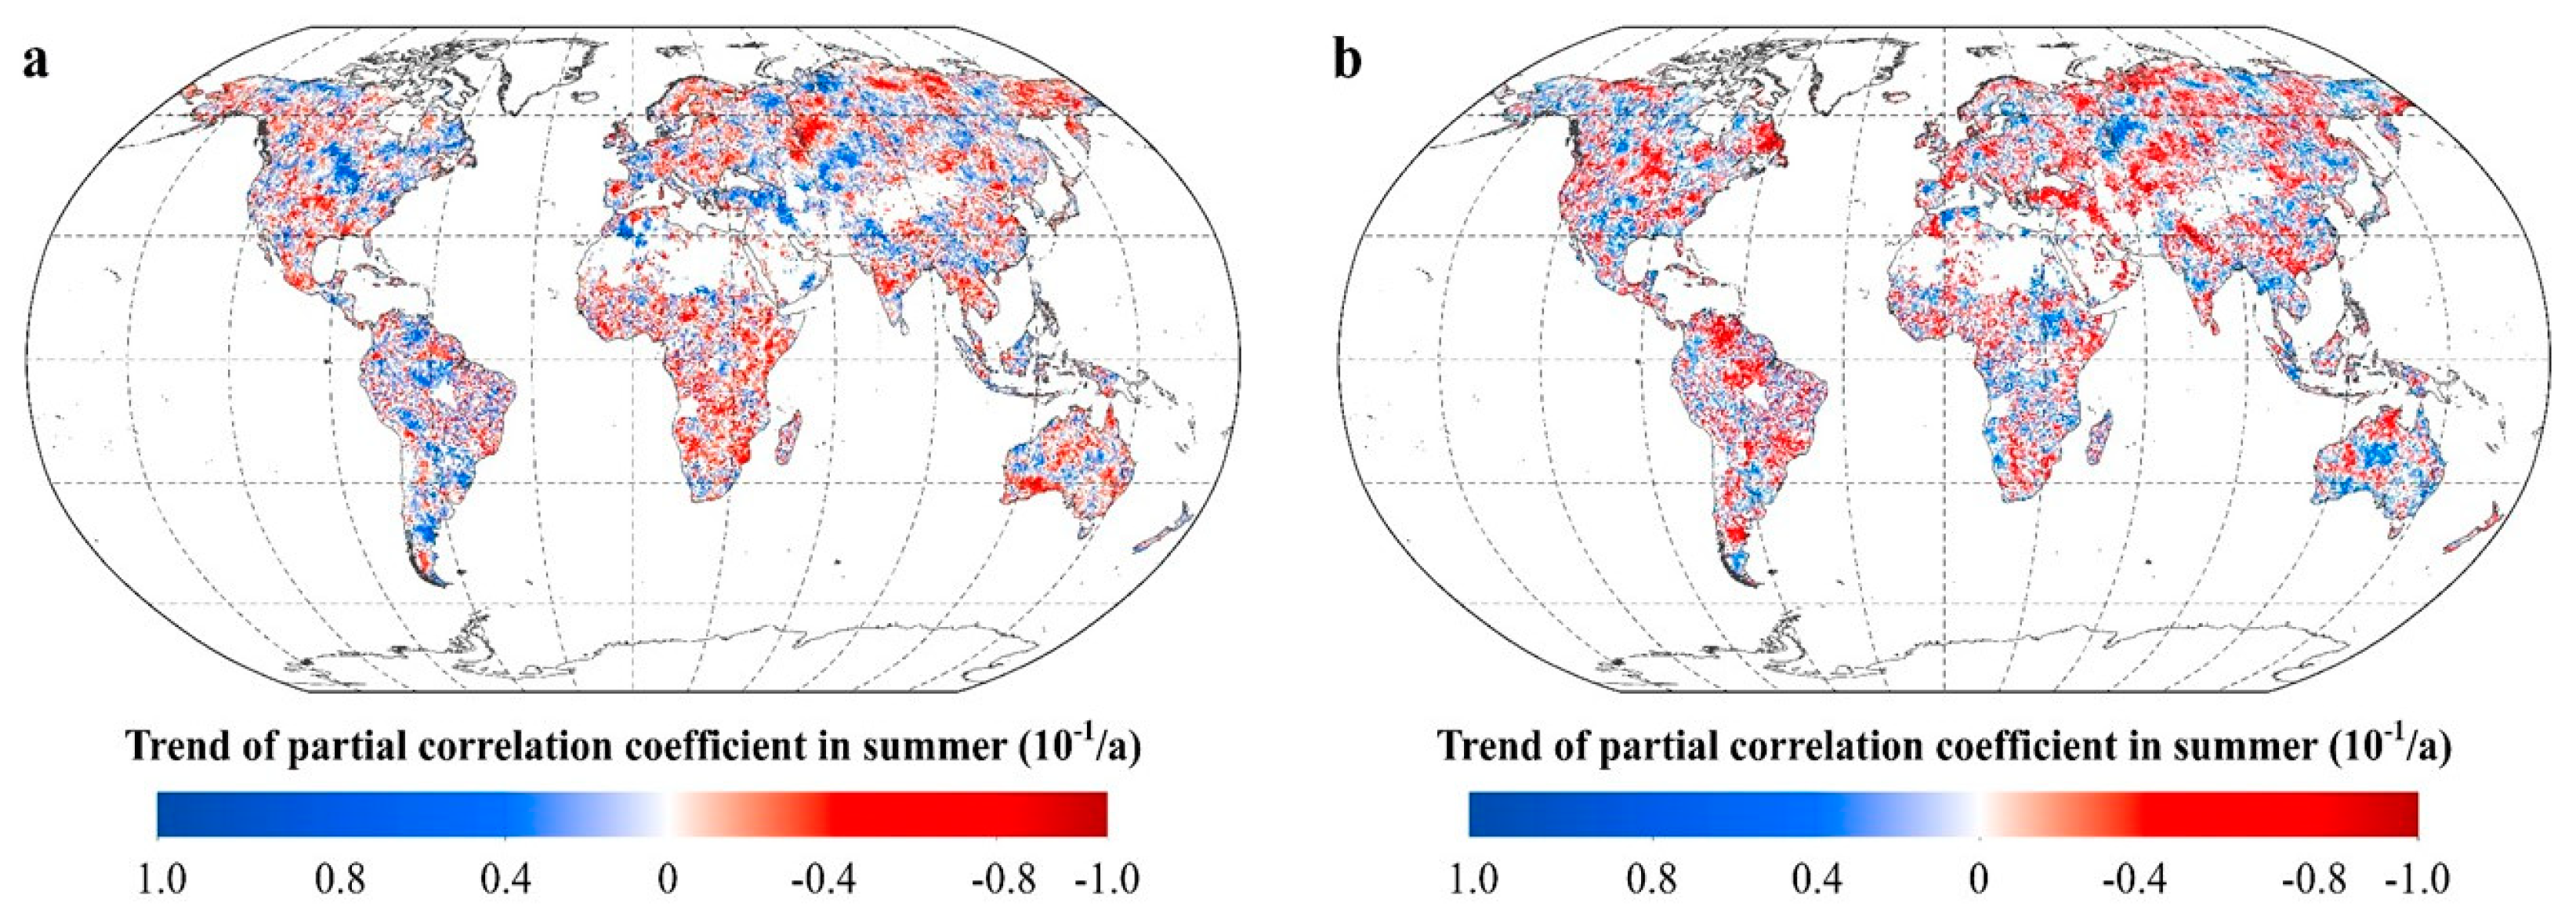
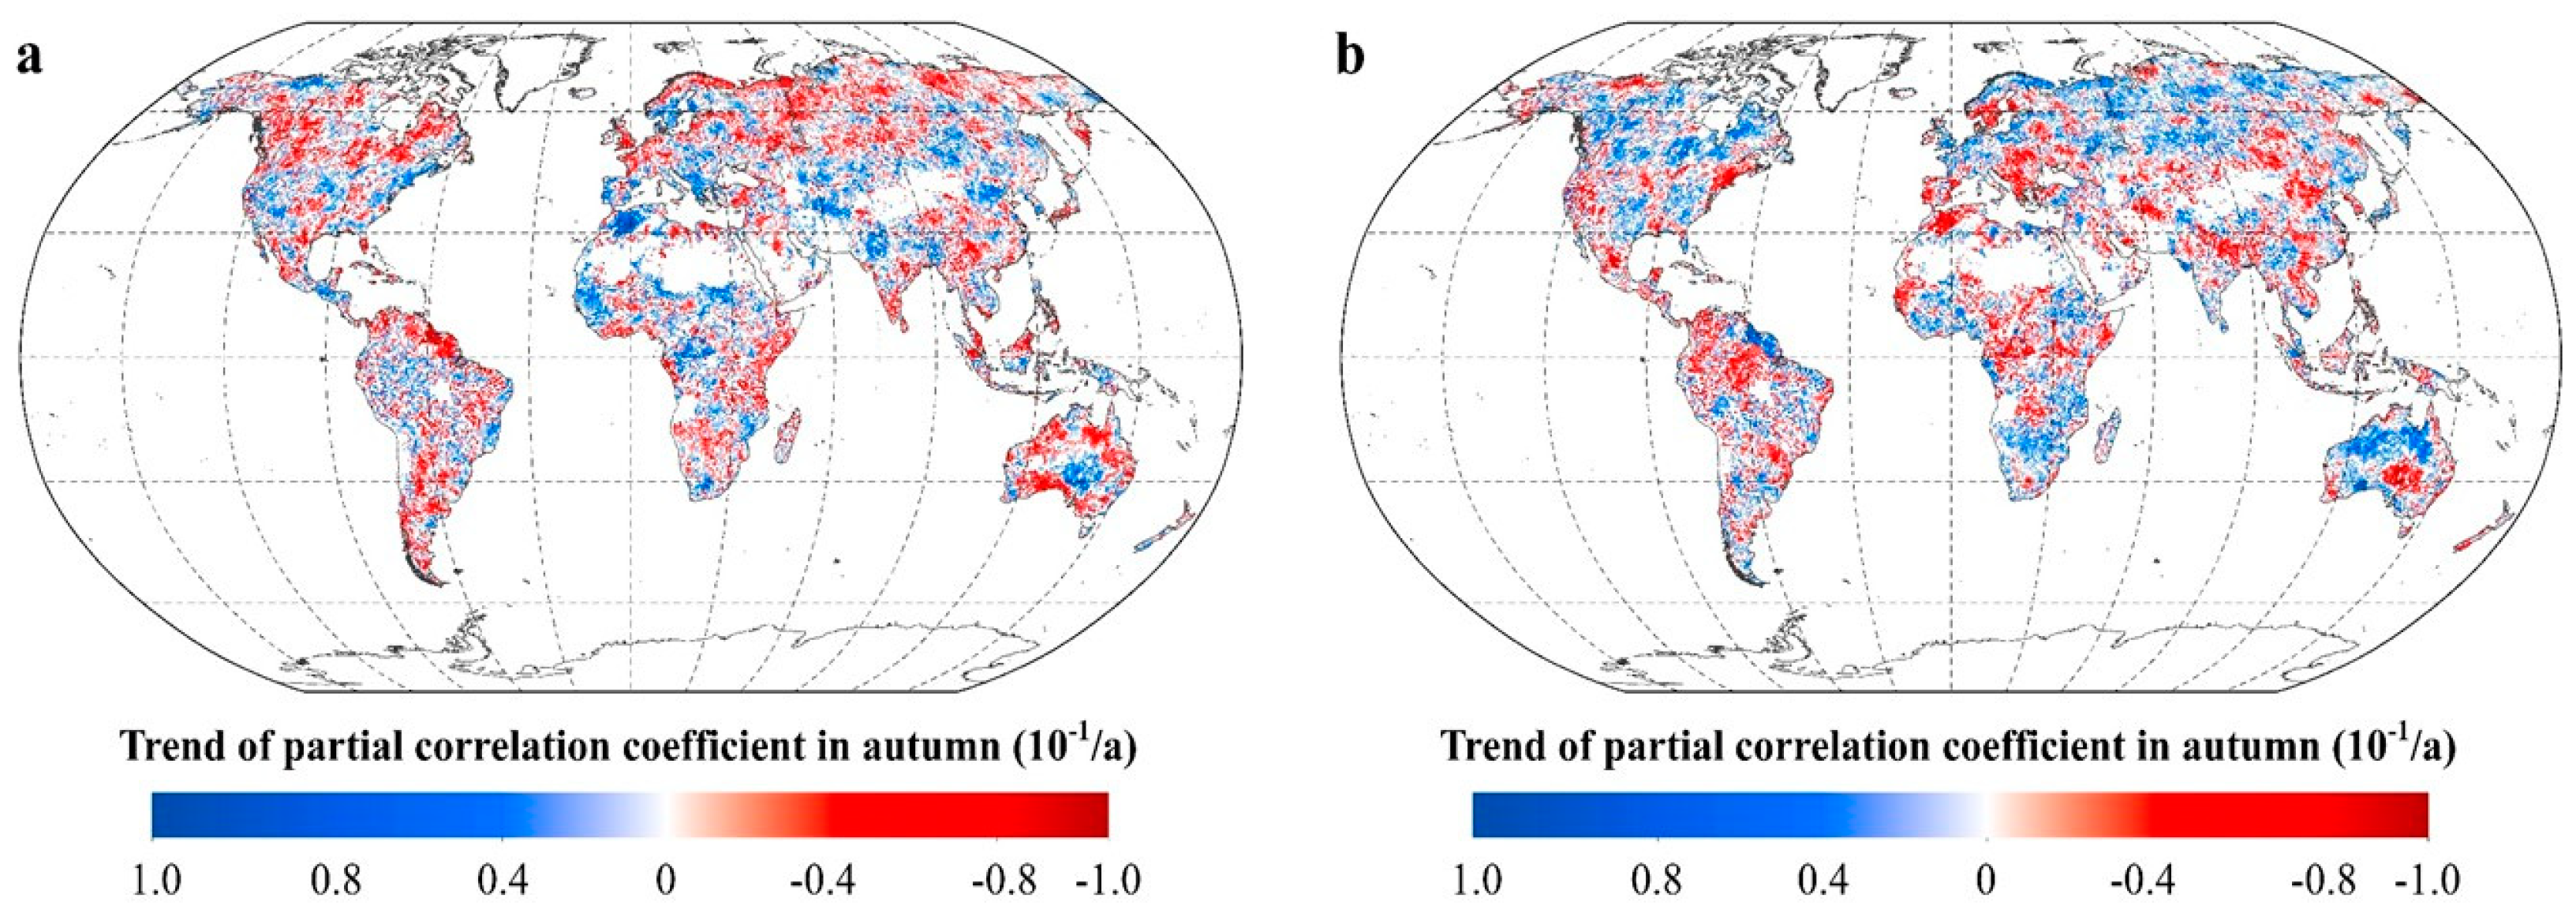
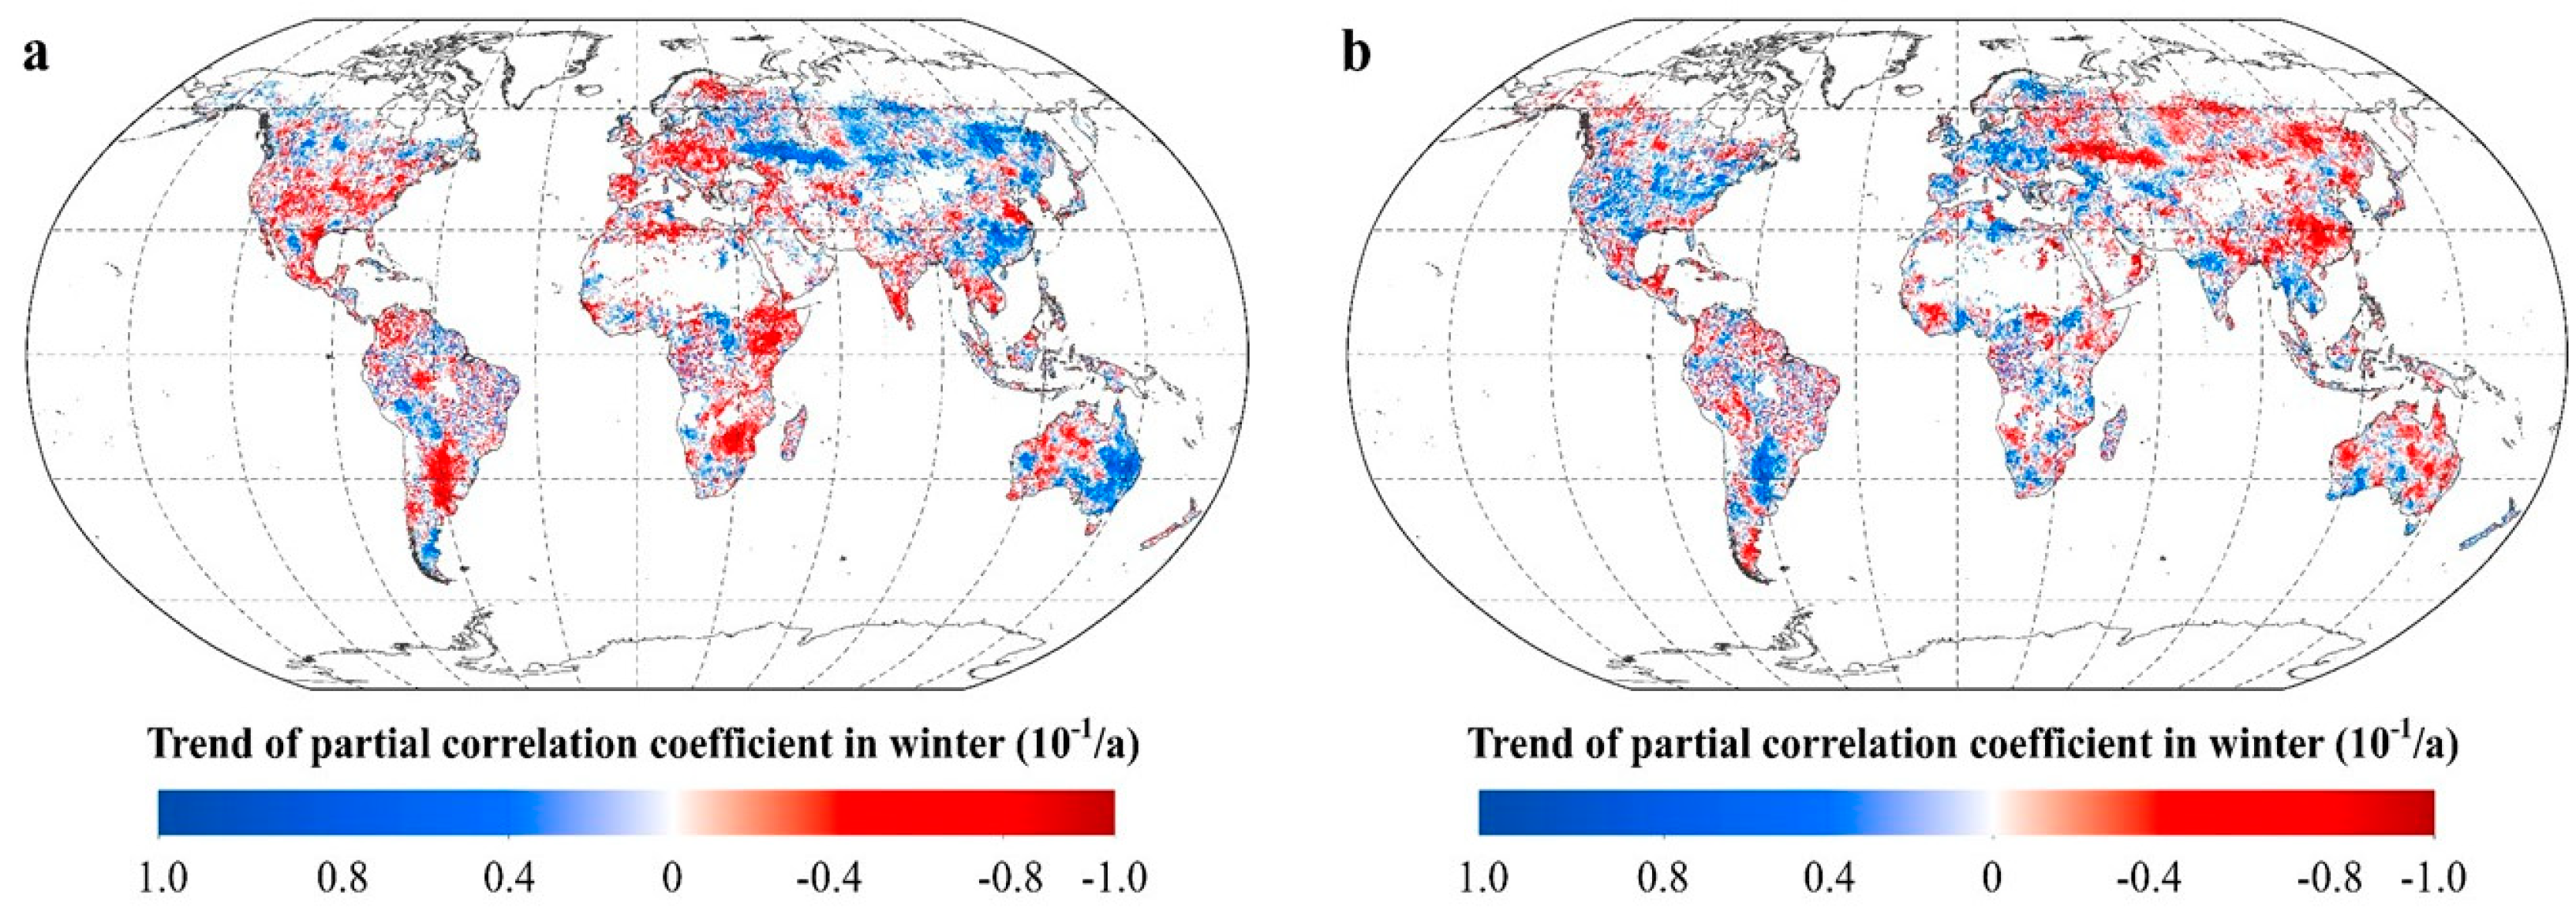
2.2.2. Intra-Annual Patterns of RNDVI-Tmax and RNDVI-Tmin

The seasonal variation in the vegetation greenness response to global warming may increase the complexity of the intra-annual patterns of RNDVI-Tmax and RNDVI-Tmin. For spring, the areas with positive trends in RNDVI-Tmax accounts for 25.66% of the total vegetated areas, mostly in the northeastern part of South America, the eastern plains of Eastern Europe, the Iberian Peninsula, the southeastern parts of Australia, and the Ganges Plain (Figure 7). The areas with negative trends in RNDVI-Tmax accounts for 32.43% of the total vegetated areas, mainly distributed in Western Australia, the Katanga Plateau, and the cold temperate zones in the northern hemisphere. Similarly, about 24.09% of the vegetated areas show positive trends in RNDVI-Tmin, these areas are mainly located in northern North America, southern South America, southern Europe, the Indian Peninsula, and southwestern Australia. Over 32.11% of the vegetated areas show negative trends in RNDVI-Tmin, these areas are mainly distributed in northern South America, central Africa, southeastern Australia, and the temperate regions of the northern hemisphere.
For summer, RNDVI-Tmax shows significant positive trends in 29.80% of the vegetated areas, located mainly in the northern and eastern North America, southern South America, Armenian plateau, Tulan lowland, Kazakh hills, and Ganges plain (Figure 8). RNDVI-Tmax shows significant negative trends in 31.78% of the vegetated areas, located mainly in southern North America, Central European Plains, Scandinavia, Northeast Asia, India Peninsula, and Indochina. Similarly, RNDVI-Tmin shows significant positive trends in 26.68% of the vegetated areas, mainly in the southern Patagonia Plateau of South America, the Yukon Plateau in North America, the south-central United States, the northwestern part of Asia, the Indo-China Peninsula, and Southern Australia. RNDVI-Tmin shows significant negative trends in 34.71% of the vegetated areas, located mainly in northern South America, southern Africa, northwestern Australia, and the cold temperate zones of the northern hemisphere (Figure 8).
For autumn, about 27.43% of the total vegetated areas show significant positive trends in RNDVI-Tmax, these areas are mainly distributed in central Eurasia, central and southern North America, northern Africa, and central Australia (Figure 9). Over 34.07% of the total vegetated areas show significant negative trends in RNDVI-Tmax, these areas are mainly distributed in northern Eurasia, central North America, southern Africa, western Africa, southern South America, and northeastern Australia. In contrast, over 32.67% of the total vegetated areas show significant positive trends in RNDVI-Tmin, these areas are widely distributed in southern Africa, northern Australia, and the cold temperate zones of the northern hemisphere. About 28.76% of the total vegetated areas show significant negative trends in RNDVI-Tmin, these areas are mainly distributed in southern North America, northwestern South America, central Asia, southern Europe, central Africa, and southern Europe (Figure 9).
For winter, the positive trends in RNDVI-Tmax are found in 25.06% of the total vegetated areas, located mainly in central Asia, eastern Australia, Eastern Europe, and southern China (Figure 10). The negative trends in RNDVI-Tmax are found in 25.74% of the total vegetated areas, mainly distributed in Western Europe, central and southern North America, central South America, eastern Africa, Western Australia, Indian Peninsula, and Indochina. Similarly, the positive trends in RNDVI-Tmin are found in 23.32% of the total vegetated areas, located mainly in central North America, Western Europe, southwestern Australia, and the north-central La Plata Plain in South America. The negative trends in RNDVI-Tmin are found in 26.71% of the total vegetated areas, mainly distributed in central Asia, central and eastern Australia, and Eastern Europe (Figure 10).

3. Discussion

The global climate has undergone continuous warming since the 19th century. Such warming has been characterized by a faster change in the global land surface during the nighttime than during the daytime [12,27,28]. However, the current understanding of the sensitivity of vegetation activity to daytime and nighttime temperatures (not to mean temperature) during the last decades is still poor. Therefore, we applied the moving-window-based partial correlation analysis and ordinary least squares linear regression method within a moving 17-year window to the GIMMS NDVI3g dataset and gridded meteorological data covering the global vegetated areas to reveal the variations in the response of vegetation greenness to the day- and nighttime warming during the period of 1982–2015.
We reported a wide reduction in the vegetation NDVI and diurnal temperature sensitivity since the early 1980s across the global. We also showed that the strength of the relationship between vegetation greenness and diurnal temperature varied among seasons and not just at inter-annual intervals. We further confirmed declining warming effects on vegetation activity, in line with some earlier studies conducted from local to global scale [21,22,23,24,25,26].
We tried to reveal the dynamic responses of vegetation greenness to day and night warming and explore the difference in the responses of vegetation to such diurnal warming. However, some uncertainties in this study still constrained our understanding of these responses. For example, the changing response could be related to any one, or a combination, of various factors, such as increasing drought stress [29,30,31], rising CO2 fertilization [22,23], fire disturbances [32,33], global dimming [29], and human-associated activities [21]. These factors were not considered in our analyses because of the lack of sufficient records. Regardless of the cause, our findings on the change in the response of vegetation greenness to diurnal warming have important implications for studies on climate change related to the past as well as the future. Further studies are needed, combining process studies (e.g., ecosystem warming experiments) with multi-scale data, to clarify the mechanisms of the observed decline in the correlation between the diurnal warming and vegetation activity. Our study mainly examined the immediate responses of terrestrial vegetation activity to asymmetric warming. In fact, such asymmetric warming has a non-uniform time-lag impact on terrestrial vegetation growth [34]. Previous studies have also found different responses of vegetation activity to warming across terrestrial ecosystems [12,23]. We did not pay enough attention to this difference in the biome involved. Although the combined effects of hydrothermal regime, ecosystem types, and the time-lag effects increase the uncertainties associated with the weakening relationship between vegetation greenness and current asymmetric warming during day- and night-time, our findings demonstrate the need to consider asymmetric warming and its uneven effect rather than variations in the annual mean temperature when modeling the future behavior of vegetation activity. Hence, significant efforts are required to examine the varying responses of vegetation activity to climate change in such a dynamic climate system in light of the substantial spatial and temporal variations in the diurnal warming and its effects.

4. Materials and Methods

4.1. Datasets

The third-generation NDVI data for the period of 1982–2015 was produced by the Global Inventory Modelling and Mapping Studies group (GIMMS NDVI3g) from the NOAA/AVHRR series satellite imageries, with a spatial resolution of ~0.083º and fortnightly interval. To further minimize the atmospheric noise, the value composites method was used to reconstruct the monthly and yearly NDVI datasets [35]. These NDVI data were aggregated to 0.5º×0.5º to match the resolution of Meteorological data. Pixels with the mean NDVI (annual and monthly) below 0.1 served as non-vegetation areas and were employed as a mask [5,26]. The GIMMS NDVI3g can be used as a proxy for vegetation greenness and has been widely applied to explore the diverse spatiotemporal-scale vegetation activity [5,12,23,26,34].
Climatological data for the same period, including the monthly average daily maximum (Tmax) and minimum temperature (Tmin) and precipitation, with a spatial resolution of ~ 0.5° × 0.5° were obtained from the gridded Climate Research Unit, University of East Anglia (CRU TS 4.01). The CRU TS 4.01 data were produced using angular-distance weighting interpolation. These meteorological materials have been well used in studies on the relationship between global and regional vegetation cover and climate change [7,12,23,34,36].

4.2. Methods

4.2.1. Moving-Window-Based Partial Correlation Analysis

The relationships between vegetation NDVI and temperature were examined using partial correlation analysis (the partial correlation coefficient of NDVI and day- and nighttime temperature were denoted by RNDVI-Tmax and RNDVI-Tmin, respectively), to eliminate the covariate effects of other factors [12,37,38,39]. In this case, for instance, the partial correlation coefficient between NDVI and Tmax was calculated when conditioning the precipitation and Tmin; and that between NDVI and Tmin was calculated when conditioning the precipitation and Tmax. The partial correlations of the NDVI with temperature were calculated in the first 17-year window (1982–1998). The window was then moved forward by 1 year to represent the second 17-year window (1983–1999), and so on until the last 17-year window (1999–2015). Thus, we obtained the partial correlation coefficients within all 17-year windows, which were applied to describe the responses of vegetation greenness to day- and nighttime warming. The NDVI and relevant variables were detrended by a linear detrending method prior to the partial correlation analysis [12,17].

4.2.2. Ordinary Least Squares Linear Regression

To explore the dynamics in the correlation between global vegetation greenness and day- and night temperature, the Ordinary least-squares linear regression analysis method was used to calculate the slope of the partial correlation coefficients of NDVI and Tmax and Tmin within each 17-year window over the entire temporal domain. The partial correlation coefficient and P-value were used to determine the relationship and its significance. The slope of the linear regression represents the changing trend in the correlations between the vegetation greenness and diurnal warming during the period 1982–2015. A positive slope indicates a positive growth response to temperature, while a negative slope indicates a weakening relationship with diurnal warming.
y ( t ) = α + β t + ε
Here, α and β were the fitted intercept and slope, respectively. A two-tailed t-test was used to examine the significance level of the trend. Thus, we described the change in vegetation greenness responses to the diurnal warming from 1982 to 2015.

5. Conclusions

In the most recent period (i.e., 1982–2015), most parts of the world exhibited an overall significant change in the response of vegetation greenness to diurnal warming. On an interannual timescale, the percentage of areas showing a significantly negative trend in the partial correlation coefficient between vegetation greenness and day- and nighttime temperatures was greater than that of areas showing a significant positive trend. For daytime temperatures, this decline in the vegetation response occurred mainly at the mid-latitudes of the world and at the high latitudes of the northern hemisphere. For nighttime temperatures, the decline was primarily concentrated at the low-latitudes across the global. Our study also showed that the strength of the associations between vegetation greenness and diurnal warming varied among seasons. Although the trends in the correlation between vegetation greenness and diurnal warming showed a complex spatial pattern, most of the study areas had undergone a significant declining strength in the vegetation greenness response to daytime temperatures in all seasons and to nighttime temperatures in seasons except autumn. This further implies that the recent reduction in the strength of the response of vegetation greenness to diurnal temperature fluctuations became widespread throughout the world as such as the inter-annual tendency. These findings shew new light on our understanding of the response of vegetation greenness to global warming. We demonstrate the need to carefully consider the asymmetric diurnal warming when unraveling the influence of global warming on terrestrial ecosystem.

Supplementary Materials

The following supporting information can be downloaded at: https://www.mdpi.com/article/10.3390/plants11192648/s1, Table S1: Slopes of the partial correlation coefficients between mean annual NDVI and the duirnal temperature (Tmax and Tmin) for each 17-year moving window across latitudes intervals; Table S2: Slopes of the partial correlation coefficients between mean NDVI and the duirnal temperature (Tmax and Tmin) in spring for each 17-year moving window across latitudes intervals; Table S3: Slopes of the partial correlation coefficients between mean NDVI and the duirnal temperature (Tmax and Tmin) in summer for each 17-year moving window across latitudes intervals; Table S4: Slopes of the partial correlation coefficients between mean NDVI and the duirnal temperature (Tmax and Tmin) in autumn for each 17-year moving window across latitudes intervals; Table S5: Slopes of the partial correlation coefficients between mean NDVI and the duirnal temperature (Tmax and Tmin) in winter for each 17-year moving window across latitudes intervals.

Author Contributions

Methodology, J.Z., and Z.D.; formal analysis, J.Z. and Z.W.; writing—original draft preparation, Z.D. and K.X.; writing—review and editing, Z.D. and Z.W.; funding acquisition, Z.D. and Z.W. All authors have read and agreed to the published version of the manuscript.

Funding

Z.D. and Z.W. were funded by the National Natural Science Foundation of China (grant number: U1810101, 41161066, 41977412, and 418711934), and Shanxi Province Disciplines Group Construction Project of Service to Industrial Innovation: Ecological Remediation of Soil Pollution Disciplines Group (grant number: 20181401).

Institutional Review Board Statement

Not applicable.

Informed Consent Statement

Not applicable.

Data Availability Statement

The data used in the present work have been listed in the Supplementary Materials.

Acknowledgments

The authors thank the editor, the associate editor, and anonymous reviewers for their helpful and constructive comments.

Conflicts of Interest

The authors declare no conflict of interest.

References

  1. Forzieri, G.; Alkama, R.; Miralles, D.G.; Cescatti, A. Satellites reveal contrasting responses of regional climate to the widespread greening of Earth. Science 2017, 356, 1180–1184. [Google Scholar] [CrossRef] [Green Version]
  2. Pan, N.; Feng, X.; Fu, B.; Wang, S.; Ji, F.; Pan, S. Increasing global vegetation browning hidden in overall vegetation greening: Insights from time-varying trends. Remote Sens. Environ. 2018, 214, 59–72. [Google Scholar] [CrossRef]
  3. Kafy, A.A.; Faisal, A.-A.; Al Rakib, A.; Fattah, M.A.; Rahaman, Z.A.; Sattar, G.S. Impact of vegetation cover loss on surface temperature and carbon emission in a fastest-growing city, Cumilla, Bangladesh. Build. Environ. 2022, 208, 108573. [Google Scholar] [CrossRef]
  4. Piao, S.; Wang, X.; Ciais, P.; Zhu, B.; Wang, T.A.O.; Liu, J.I.E. Changes in satellite-derived vegetation growth trend in temperate boreal Eurasia from 1982 to 2006. Glob. Chang. Biol. 2011, 17, 3228–3239. [Google Scholar] [CrossRef]
  5. De Jong, R.; Verbesselt, J.; Zeileis, A.; Schaepman, M. Shifts in Global Vegetation Activity Trends. Remote Sens. 2013, 5, 1117–1133. [Google Scholar] [CrossRef] [Green Version]
  6. Rahaman, Z.A.; Kafy, A.A.; Saha, M.; Rahim, A.A.; Almulhim, A.I.; Rahaman, S.N.; Fattah, M.A.; Rahman, M.T.; Kalaivani, S.; Al Rakib, A. Assessing the impacts of vegetation cover loss on surface temperature, urban heat island and carbon emission in Penang city, Malaysia. Build. Environ. 2022, 222, 109335. [Google Scholar] [CrossRef]
  7. Zhao, L.; Dai, A.; Dong, B. Changes in global vegetation activity and its driving factors during 1982–2013. Agric. Forest. Meteorol. 2018, 249, 198–209. [Google Scholar] [CrossRef]
  8. Zhu, Z.; Piao, S.; Myneni, R.B.; Huang, M.; Zeng, Z.; Canadell, J.G.; Ciais, P.; Sitch, S.; Friedlingstein, P.; Arneth, A.; et al. Greening of the Earth and its drivers. Nat. Clim. Chang. 2016, 6, 791–795. [Google Scholar] [CrossRef]
  9. De Jong, R.; Schaepman, M.E.; Furrer, R.; De Bruin, S.; Verburg, P.H. Spatial relationship between climatologies and changes in global vegetation activity. Glob. Chang. Biol. 2013, 19, 1953–1964. [Google Scholar] [CrossRef]
  10. Fensholt, R.; Horion, S.; Tagesson, T.; Ehammer, A.; Grogan, K.; Tian, F.; Huber, S.; Verbesselt, J.; Prince, S.D.; Tucker, C.J.; et al. Assessing Drivers of Vegetation Changes in Drylands from Time Series of Earth Observation Data, Remote Sensing Time Series; Springer: Cham, Switzerland, 2015; pp. 183–202. [Google Scholar]
  11. Wei, H.; Zhao, X.; Liang, S.; Zhou, T.; Wu, D.; Tang, B. Effects of Warming Hiatuses on Vegetation Growth in the Northern Hemisphere. Remote Sens. 2018, 10, 683. [Google Scholar] [CrossRef]
  12. Peng, S.; Piao, S.; Ciais, P.; Myneni, R.B.; Chen, A.; Chevallier, F.; Dolman, A.J.; Janssens, I.A.; Peñuelas, J.; Zhang, G.; et al. Asymmetric effects of daytime and night-time warming on Northern Hemisphere vegetation. Nature 2013, 501, 88–92. [Google Scholar] [CrossRef] [PubMed]
  13. Xia, J.; Chen, J.; Piao, S.; Ciais, P.; Luo, Y.; Wan, S. Terrestrial carbon cycle affected by non-uniform climate warming. Nat. Geosci. 2014, 7, 173–180. [Google Scholar] [CrossRef]
  14. Cao, R.; Shen, M.; Zhou, J.; Chen, J. Modeling vegetation green-up dates across the Tibetan Plateau by including both seasonal and daily temperature and precipitation. Agric. Forest. Meteorol. 2018, 249, 176–186. [Google Scholar] [CrossRef]
  15. Shen, X.; Liu, B.; Henderson, M.; Wang, L.; Wu, Z.; Jiang, M.; Lu, X.; Wu, H. Asymmetric effects of daytime and nighttime warming on spring phenology in the temperate grasslands of China. Agr. Forest. Meteorol. 2018, 259, 240–249. [Google Scholar] [CrossRef]
  16. Signarbieux, C.; Toledano, E.; Sangines de Carcer, P.; Fu, Y.H.; Schlaepfer, R.; Buttler, A.; Vitasse, Y. Asymmetric effects of cooler and warmer winters on beech phenology last beyond spring. Glob. Chang. Biol. 2017, 23, 4569–4580. [Google Scholar] [CrossRef]
  17. Tan, J.; Piao, S.; Chen, A.; Zeng, Z.; Ciais, P.; Janssens, I.A.; Mao, J.; Myneni, R.B.; Peng, S.; Penuelas, J.; et al. Seasonally different response of photosynthetic activity to daytime and night-time warming in the Northern Hemisphere. Glob. Chang. Biol. 2015, 21, 377–387. [Google Scholar] [CrossRef]
  18. Wu, C.; Wang, X.; Wang, H.; Ciais, P.; Peñuelas, J.; Myneni, R.B.; Desai, A.R.; Gough, C.M.; Gonsamo, A.; Black, A.T.; et al. Contrasting responses of autumn-leaf senescence to daytime and night-time warming. Nat. Clim. Chang. 2018, 8, 1092–1096. [Google Scholar] [CrossRef] [Green Version]
  19. Wu, X.; Liu, H.; Li, X.; Liang, E.; Beck, P.S.; Huang, Y. Seasonal divergence in the interannual responses of Northern Hemisphere vegetation activity to variations in diurnal climate. Sci. Rep. 2016, 6, 19000. [Google Scholar] [CrossRef] [Green Version]
  20. Zhao, J.; Du, Z.; Wu, Z.; Zhang, H.; Guo, N.; Ma, Z.; Liu, X. Seasonal variations of day- and nighttime warming and their effects on vegetation dynamics in China’s temperate zone. Acta Geogr. Sin. 2018, 73, 395–404. [Google Scholar]
  21. He, B.; Chen, A.; Jiang, W.; Chen, Z. The response of vegetation growth to shifts in trend of temperature in China. J. Geogr. Sci. 2017, 27, 801–816. [Google Scholar] [CrossRef] [Green Version]
  22. Briffa, K.R.; Schweingruber, F.H.; Jones, P.D.; Osborn, T.J.; Shiyatov, S.G.; Vaganov, E.A. Reduced sensitivity of recent northern tree-growth to temperature at northern high latitudes. Nature 1998, 391, 678–682. [Google Scholar] [CrossRef]
  23. Piao, S.; Nan, H.; Huntingford, C.; Ciais, P.; Friedlingstein, P.; Sitch, S.; Peng, S.; Ahlstrom, A.; Canadell, J.G.; Cong, N.; et al. Evidence for a weakening relationship between interannual temperature variability and northern vegetation activity. Nat. Commun. 2014, 5, 5018. [Google Scholar] [CrossRef] [PubMed] [Green Version]
  24. Andreu-Hayles, L.; Arrigo, R.D.; Kevin JAnchukaitis Beck, P.S.A. Varying boreal forest response to Arctic environmental change at the Firth River, Alaska. Environ. Res. Lett. 2011, 6, 45503. [Google Scholar] [CrossRef]
  25. Fu, Y.H.; Zhao, H.; Piao, S.; Peaucelle, M.; Peng, S.; Zhou, G.; Ciais, P.; Huang, M.; Menzel, A.; Penuelas, J.; et al. Declining global warming effects on the phenology of spring leaf unfolding. Nature 2015, 526, 104–107. [Google Scholar] [CrossRef] [Green Version]
  26. Cong, N.; Shen, M.; Yang, W.; Yang, Z.; Zhang, G.; Piao, S. Varying responses of vegetation activity to climate changes on the Tibetan Plateau grassland. Int. J. Biometeorol. 2017, 61, 1433–1444. [Google Scholar] [CrossRef]
  27. Dhakhwa, G.B.; Campbell, C.L. Potential Effects of Differential Day-Night Warming in Global Climate Change on Crop Production. Clim. Change 1998, 40, 647–667. [Google Scholar] [CrossRef]
  28. Karl, T.R.; Kukla, G.; Razuvayev, V.N.; Changery, M.J.; Quayle, R.G.; Heim, R.R.; Easterling, D.R.; Fu, C.B. Global warming: Evidence for asymmetric diurnal temperature change. Geophys. Res. Lett. 1991, 18, 2253–2256. [Google Scholar] [CrossRef]
  29. D’Arrigo, R.; Wilson, R.; Liepert, B.; Cherubini, P. On the ‘Divergence problem’ in northern forests a review of the tree-ring evidence and possible causes. Global Planet. Change 2008, 60, 289–305. [Google Scholar] [CrossRef]
  30. Wu, X.; Liu, H.; Li, X.; Piao, S.; Ciais, P.; Guo, W.; Yin, Y.; Poulter, B.; Peng, C.; Viovy, N.; et al. Higher temperature variability reduces temperature sensitivity of vegetation growth in Northern Hemisphere. Geophys. Res. Lett. 2017, 44, 6173–6181. [Google Scholar] [CrossRef]
  31. Yang, Z.; Jiang, L.; Su, F.; Zhang, Q.; Xia, J.; Wan, S. Nighttime warming enhances drought resistance of plant communities in a temperate steppe. Sci. Rep. 2016, 6, 23267. [Google Scholar] [CrossRef]
  32. Beck, P.S.A.; Goetz, S.J. Satellite observations of high northern latitude vegetation productivity changes between 1982 and 2008: Ecological variability and regional differences. Environ. Res. Lett 2011, 6, 45501. [Google Scholar] [CrossRef]
  33. Jolly, W.M.; Cochrane, M.A.; Freeborn, P.H.; Holden, Z.A.; Brown, T.J.; Williamson, G.J.; Bowman, D.M. Climate-induced variations in global wildfire danger from 1979 to 2013. Nat. Commun. 2015, 6, 7537. [Google Scholar] [CrossRef] [PubMed] [Green Version]
  34. Wen, Y.; Liu, X.; Pei, F.; Li, X.; Du, G. Non-uniform time-lag effects of terrestrial vegetation responses to asymmetric warming. Agric. Forest. Meteorol. 2018, 252, 130–143. [Google Scholar] [CrossRef]
  35. Holben, B.N. Characteristics of maximum-value composite images from temporal AVHRR Data. Int. J. Remote Sens. 1986, 7, 1417–1434. [Google Scholar] [CrossRef]
  36. Davy, R.; Esau, I.; Chernokulsky, A.; Outten, S.; Zilitinkevich, S. Diurnal asymmetry to the observed global warming. Int. J. Climatol. 2017, 37, 79–93. [Google Scholar] [CrossRef] [Green Version]
  37. Shen, M.; Piao, S.; Chen, X.; An, S.; Fu, Y.H.; Wang, S.; Cong, N.; Janssens, I.A. Strong impacts of daily minimum temperature on the green-up date and summer greenness of the Tibetan Plateau. Glob. Chang. Biol. 2016, 22, 3057–3066. [Google Scholar] [CrossRef]
  38. Du, Z.; Zhao, J.; Liu, X.; Wu, Z.; Zhang, H. Recent asymmetric warming trends of daytime versus nighttime and their linkages with vegetation greenness in temperate China. Environ. Sci. Pollut. Res. Int. 2019, 26, 35717–35727. [Google Scholar] [CrossRef]
  39. Du, Z.; Zhao, J.; Pan, H.; Wu, Z.; Zhang, H. Responses of vegetation activity to the daytime and nighttime warming in Northwest China. Environ. Monit. Assess. 2019, 191, 721. [Google Scholar] [CrossRef]
Figure 1. Temporal variations in the partial correlation coefficients between mean annual NDVI and the diurnal temperature (Tmax and Tmin) for each 17-year moving window across latitudes intervals. (ae represents latitudes intervals at 60°~90° N, 30°~60° N, 0°~30° N, −30°~0° S, and −60°~0° S, respectively (N and S indicates the Northern and southern hemisphere, respectively). The x axis is the last year of the 17-year moving-window (for example, 1998 stands for a moving-window from 1982 to 1998, …, 2015 stands for a moving-window from 1999 to 2015). The Y axis is the partial correlation coefficients).
Plants 11 02648 g001
Figure 2. Temporal variations in the partial correlation coefficients between mean NDVI and the diurnal temperature (Tmax and Tmin) in spring for each 17-year moving window across latitudes intervals. (ae represents latitudes intervals at 60°~90° N, 30°~60° N, 0°~30° N, −30°~0° S, and −60°~0° S, respectively (N and S indicates the Northern and southern hemisphere, respectively). The x axis is the last year of the 17-year moving-window (for example, 1998 stands for a moving-window from 1982 to 1998,…, 2015 stands for a moving-window from 1999 to 2015). The Y axis is the partial correlation coefficients).
Plants 11 02648 g002
Figure 3. Temporal variations in the partial correlation coefficients between mean NDVI and the diurnal temperature (Tmax and Tmin) in summer for each 17-year moving window across latitudes intervals. (ae represents latitudes intervals at 60°~90° N, 30°~60° N, 0°~30° N, −30°~0° S, and −60°~0° S, respectively (N and S indicates the Northern and southern hemisphere, respectively). The x axis is the last year of the 17-year moving-window (for example, 1998 stands for a moving-window from 1982 to 1998,…, 2015 stands for a moving-window from 1999 to 2015). The Y axis is the partial correlation coefficients).
Plants 11 02648 g003
Figure 4. Temporal variations in the partial correlation coefficients between mean NDVI and the diurnal temperature (Tmax and Tmin) in autumn for each 17-year moving window across latitudes intervals. (ae represents latitudes intervals at 60°~90° N, 30°~60° N, 0°~30° N, −30°~0° S, and −60°~0° S, respectively (N and S indicates the Northern and southern hemisphere, respectively). The x axis is the last year of the 17-year moving-window (for example, 1998 stands for a moving-window from 1982 to 1998,…, 2015 stands for a moving-window from 1999 to 2015). The Y axis is the partial correlation coefficients).
Plants 11 02648 g004
Figure 5. Temporal variations in the partial correlation coefficients between mean NDVI and the diurnal temperature (Tmax and Tmin) in winter for each 17-year moving window across latitudes intervals. (ae represents latitudes intervals at 60°~90° N, 30°~60° N, 0°~30° N, −30°~0° S, and −60°~0° S, respectively (N and S indicates the Northern and southern hemisphere, respectively). The x axis is the last year of the 17-year moving-window (for example, 1998 stands for a moving-window from 1982 to 1998,…, 2015 stands for a moving-window from 1999 to 2015). The Y axis is the partial correlation coefficients).
Plants 11 02648 g005
Figure 6. The response of vegetation greenness to the diurnal temperature. (a. spatial distribution of the temporal trend of the partial coefficients between mean annual NDVI and Tmax. b. spatial distribution of the temporal trend of the partial coefficients between mean annual NDVI and Tmin. Supplementary Table S1).
Plants 11 02648 g006
Figure 7. The response of vegetation greenness to the diurnal temperature in spring. (a. spatial distribution of the temporal trend of the partial coefficients between spring NDVI and Tmax. b. spatial distribution of the temporal trend of the partial coefficients between spring NDVI and Tmin. Supplementary Table S2).
Plants 11 02648 g007
Figure 8. The response of vegetation greenness to the diurnal temperature in summer. (a. spatial distribution of the temporal trend of the partial coefficients between summer NDVI and Tmax. b. spatial distribution of the temporal trend of the partial coefficients between summer NDVI and Tmin. Supplementary Table S3).
Plants 11 02648 g008
Figure 9. The response of vegetation greenness to the diurnal temperature in autumn. (a. spatial distribution of the temporal trend of the partial coefficients between autumn NDVI and Tmax. b. spatial distribution of the temporal trend of the partial coefficients between autumn NDVI and Tmin. Supplementary Table S4).
Plants 11 02648 g009
Figure 10. The response of vegetation greenness to the diurnal temperature in winter. (a. spatial distribution of the temporal trend of the partial coefficients between winter NDVI and Tmax. b. spatial distribution of the temporal trend of the partial coefficients between winter NDVI and Tmin. Supplementary Table S5).
Plants 11 02648 g010
Publisher’s Note: MDPI stays neutral with regard to jurisdictional claims in published maps and institutional affiliations.

