
Silver Nanoparticle Effects on Antioxidant Response in Tobacco Are Modulated by Surface Coating
 , ,
, ,
Abstract
:1. Introduction
2. Results
2.1. AgNP Characterization
2.2. Ag Content
2.2.1. Root
2.2.2. Leaf
2.3. Oxidative Stress Parameters
2.3.1. Root
2.3.2. Leaf
2.4. Nonenzymatic Antioxidants
2.4.1. Root
2.4.2. Leaf
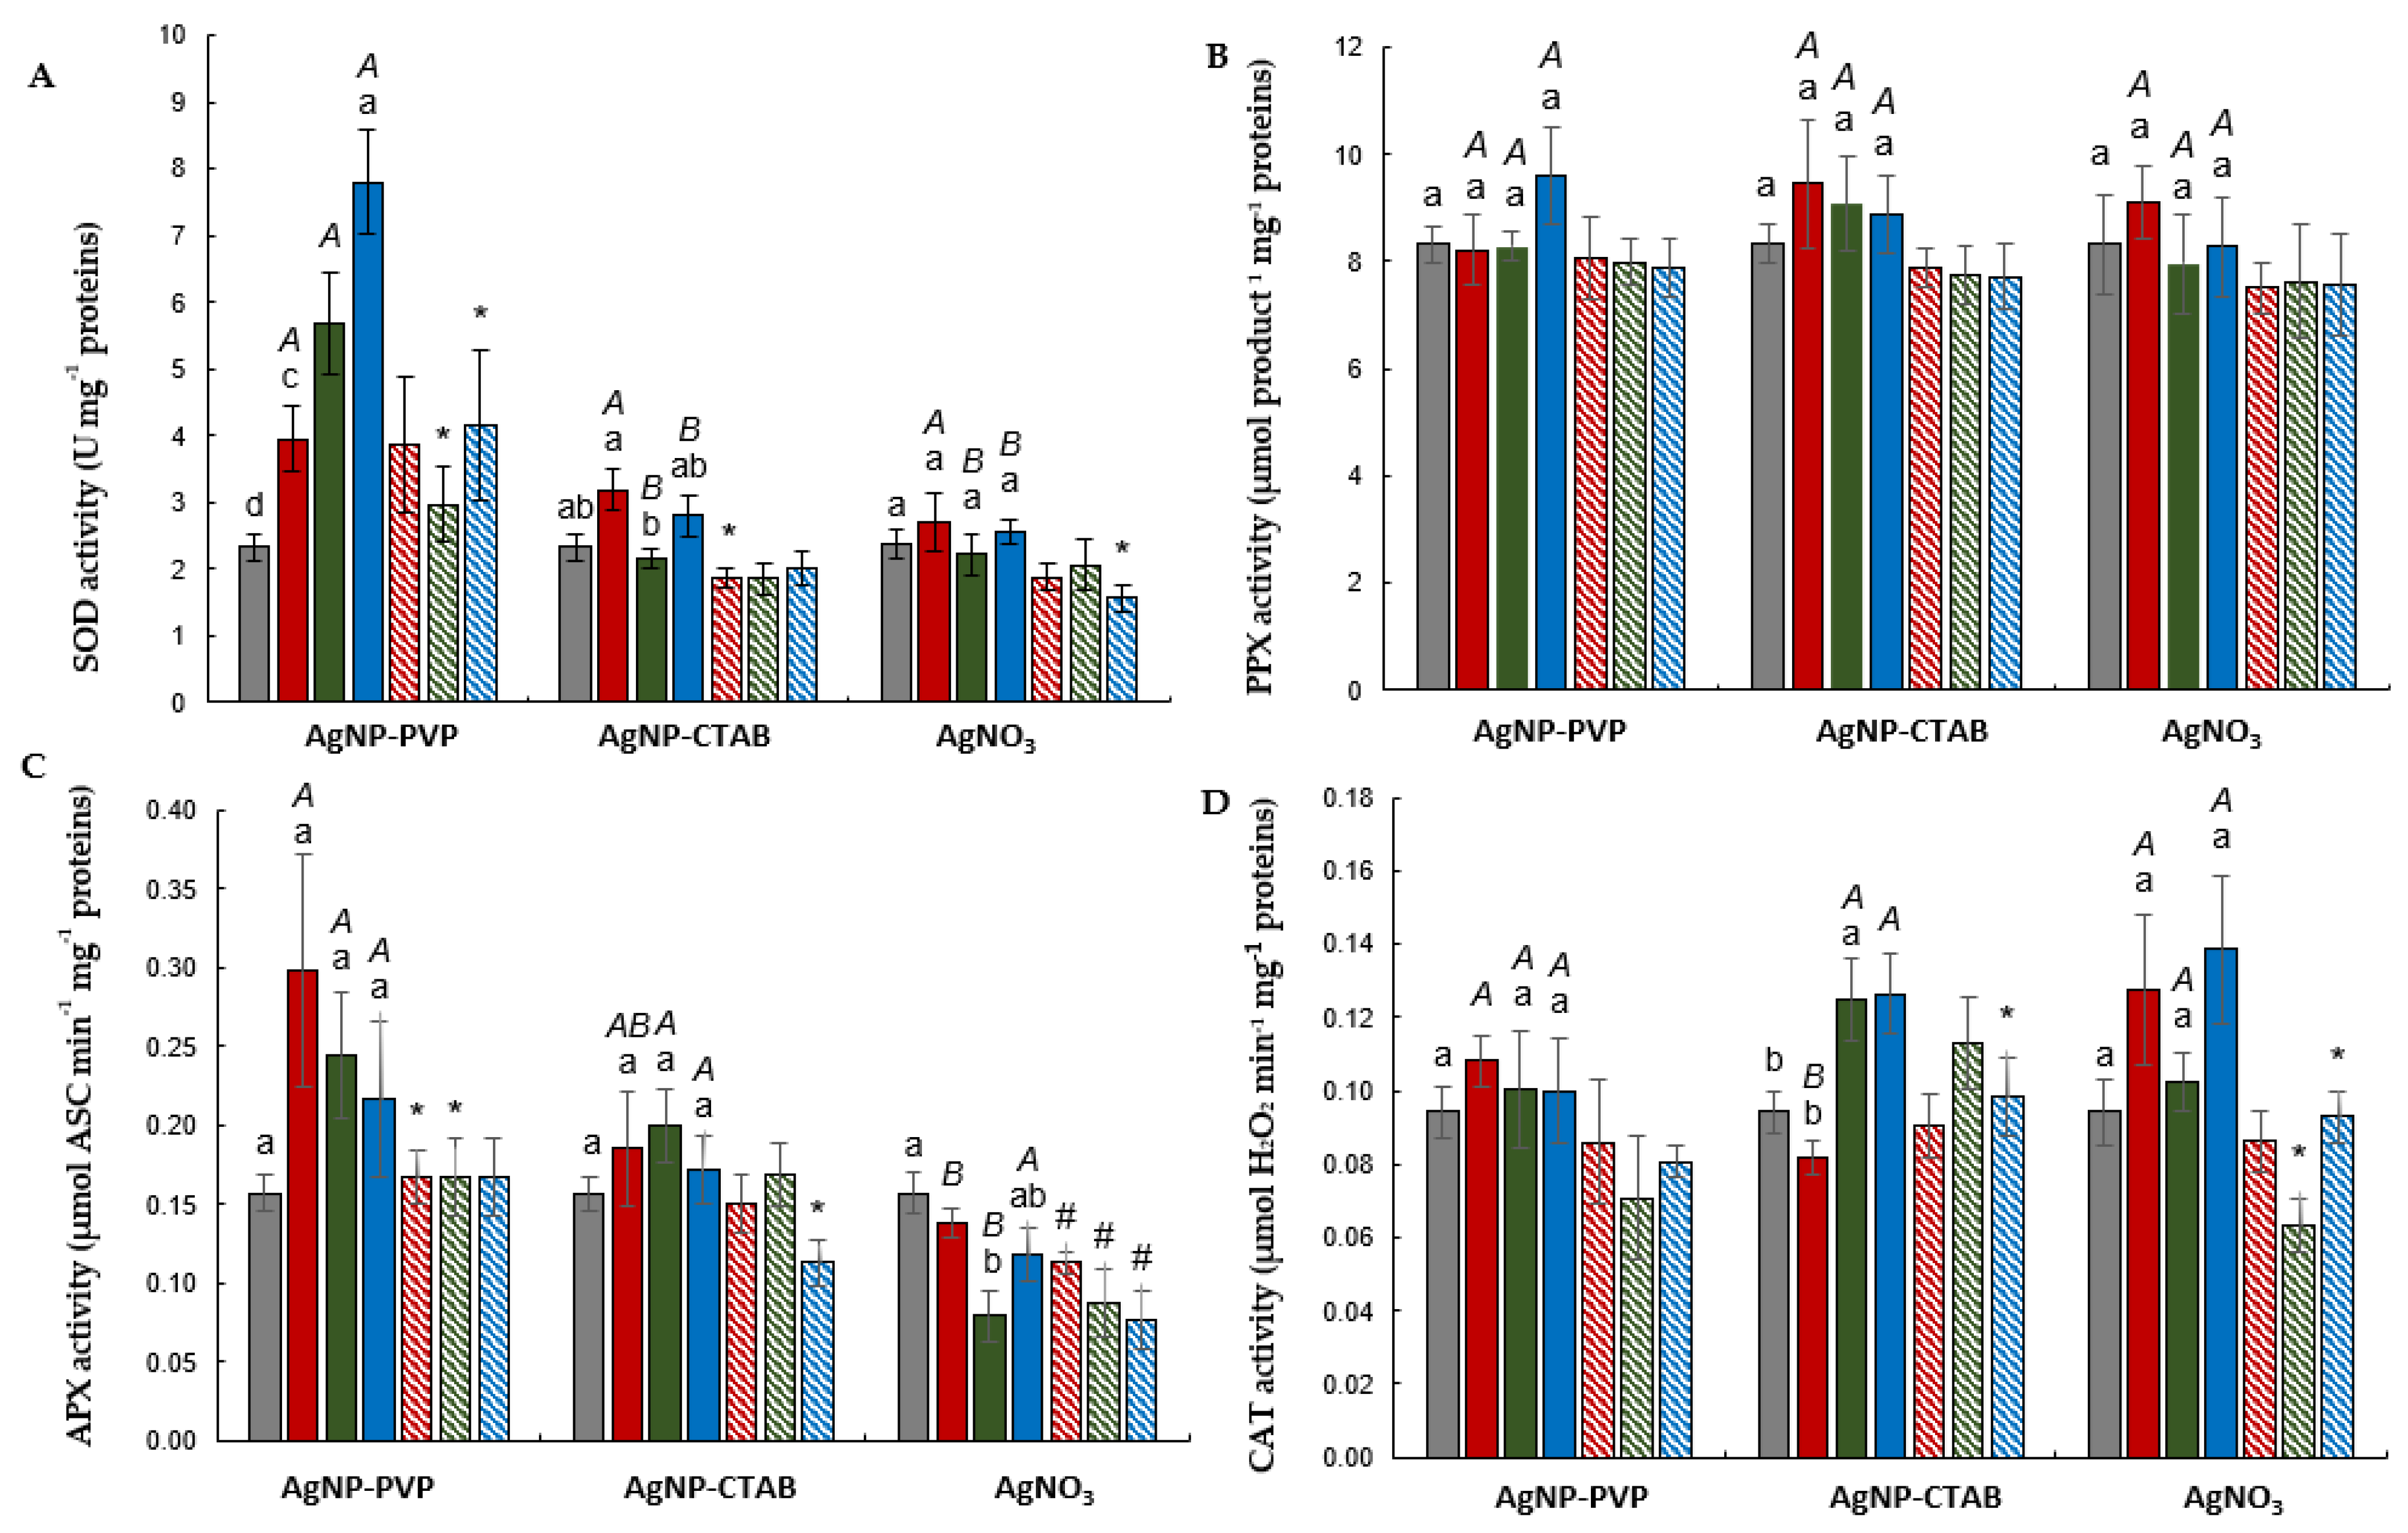
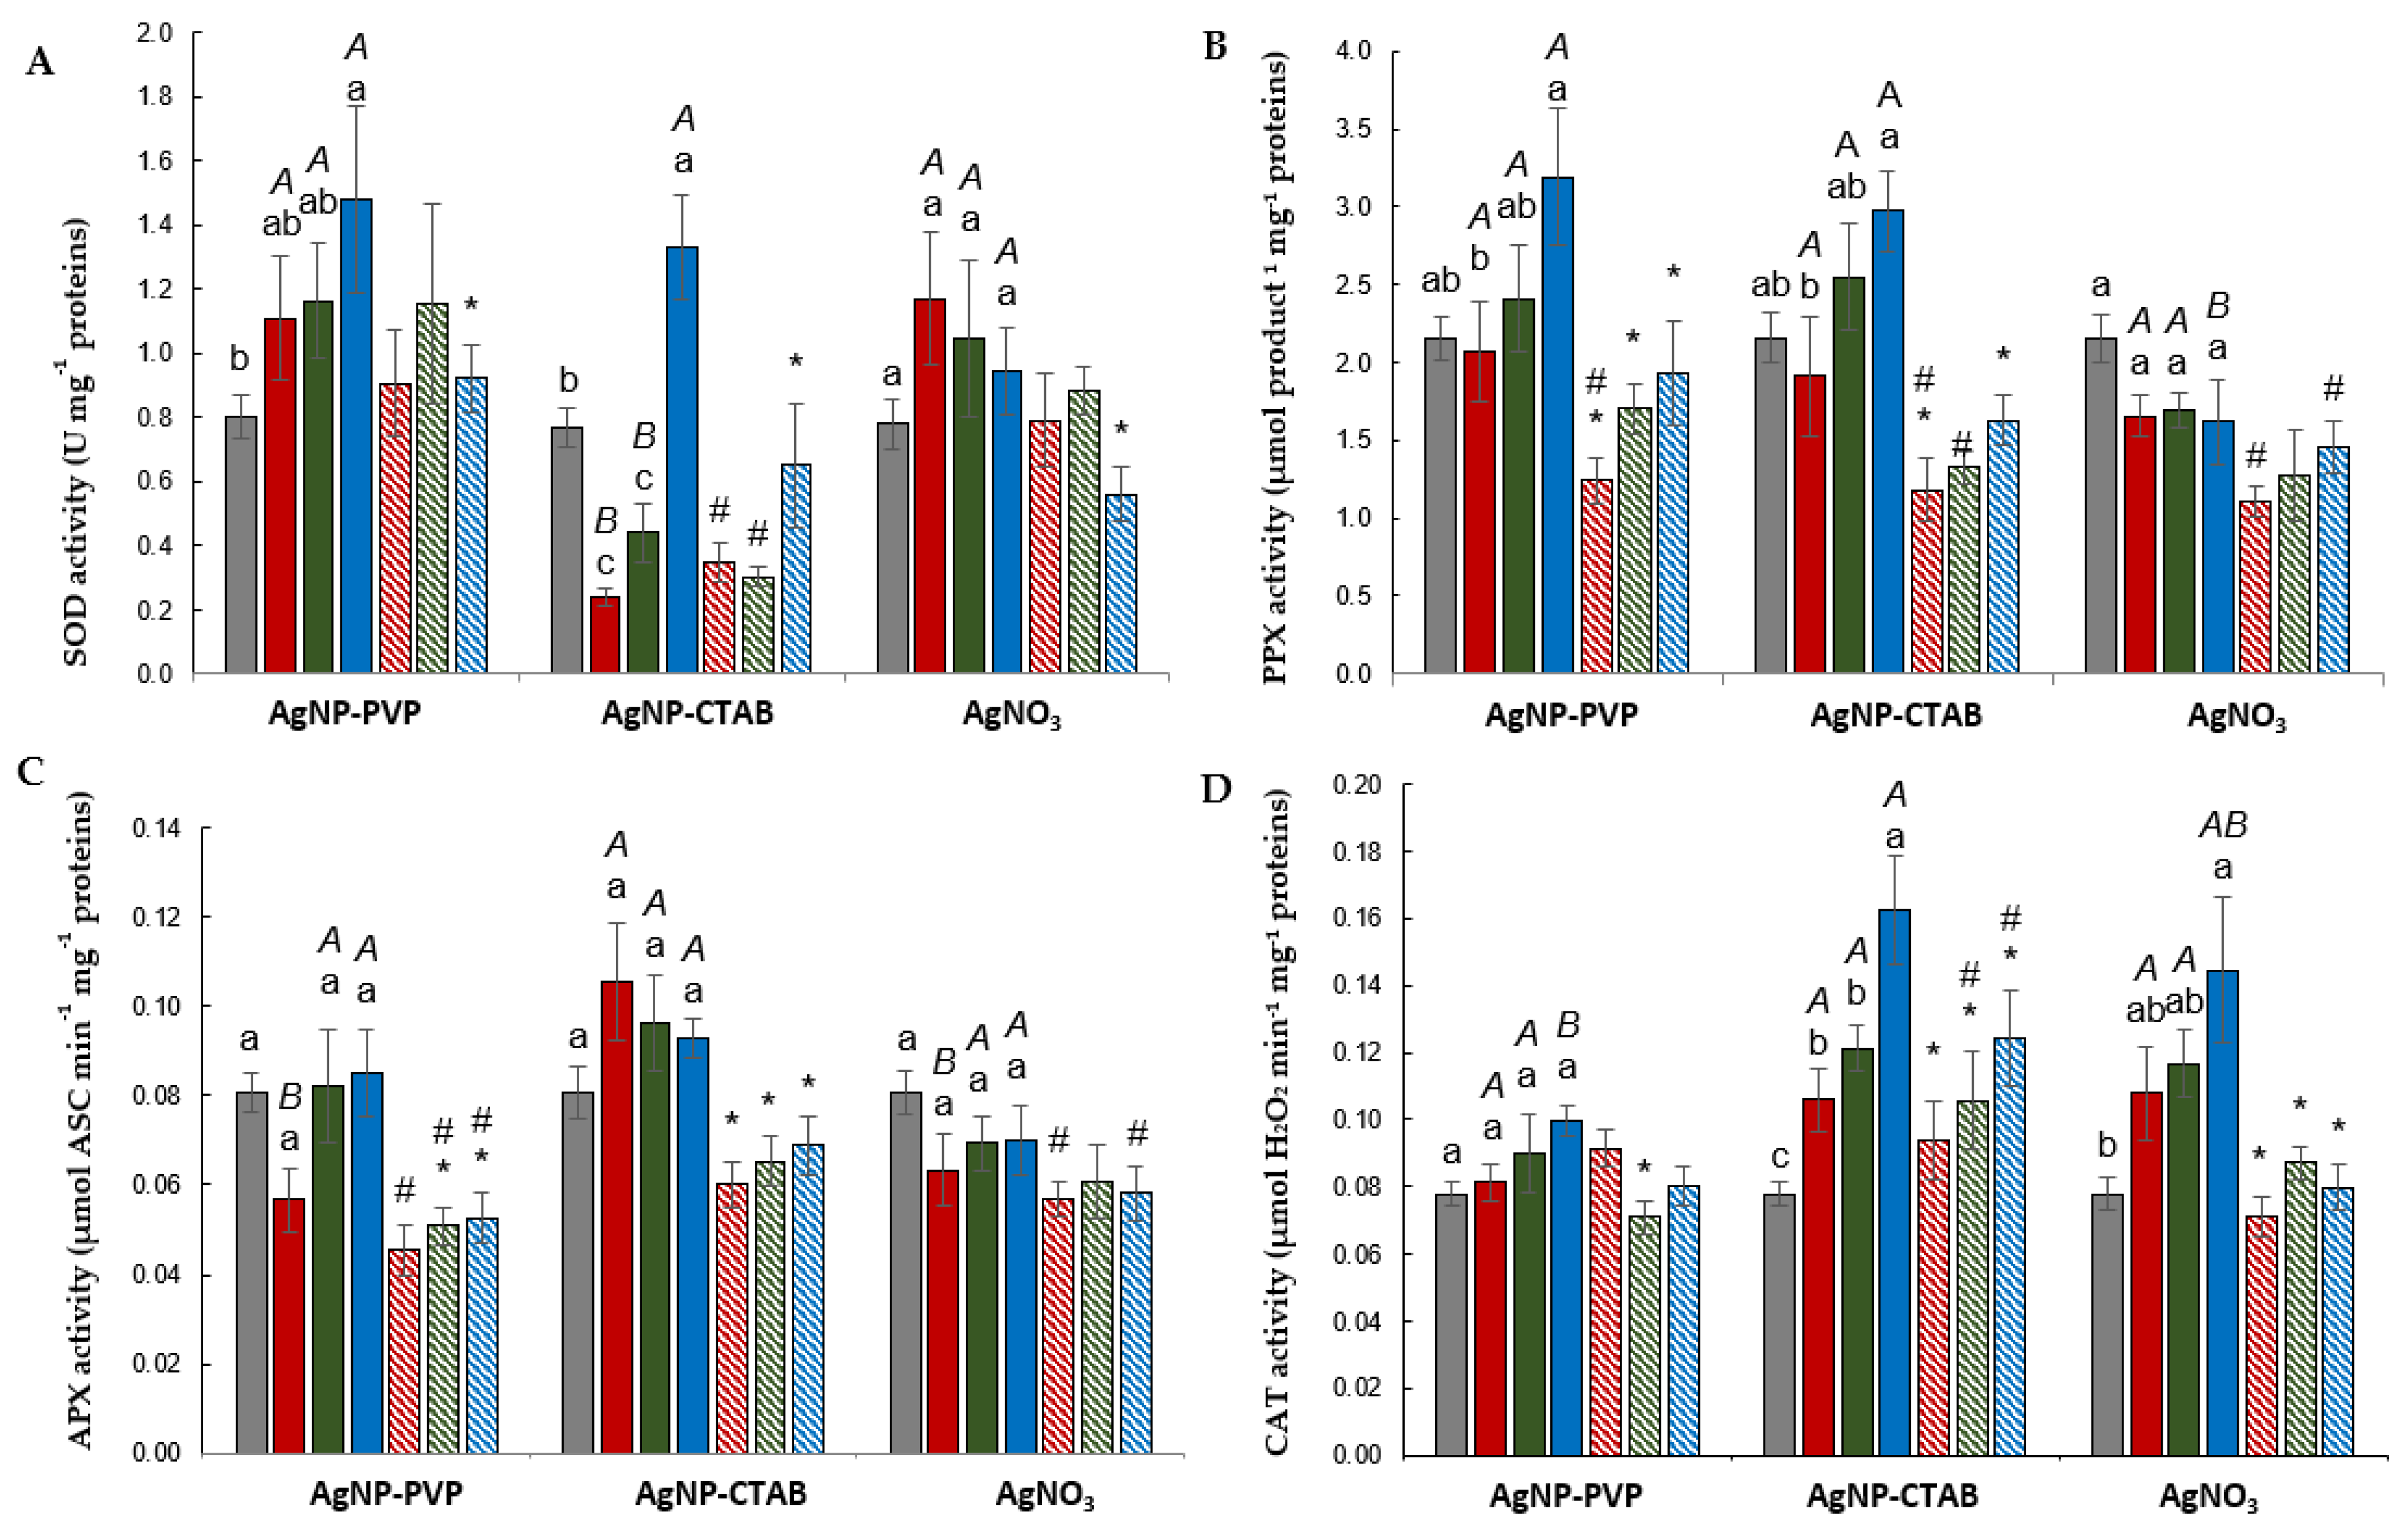
2.5. Antioxidant Enzyme Activity
2.5.1. Root
2.5.2. Leaf
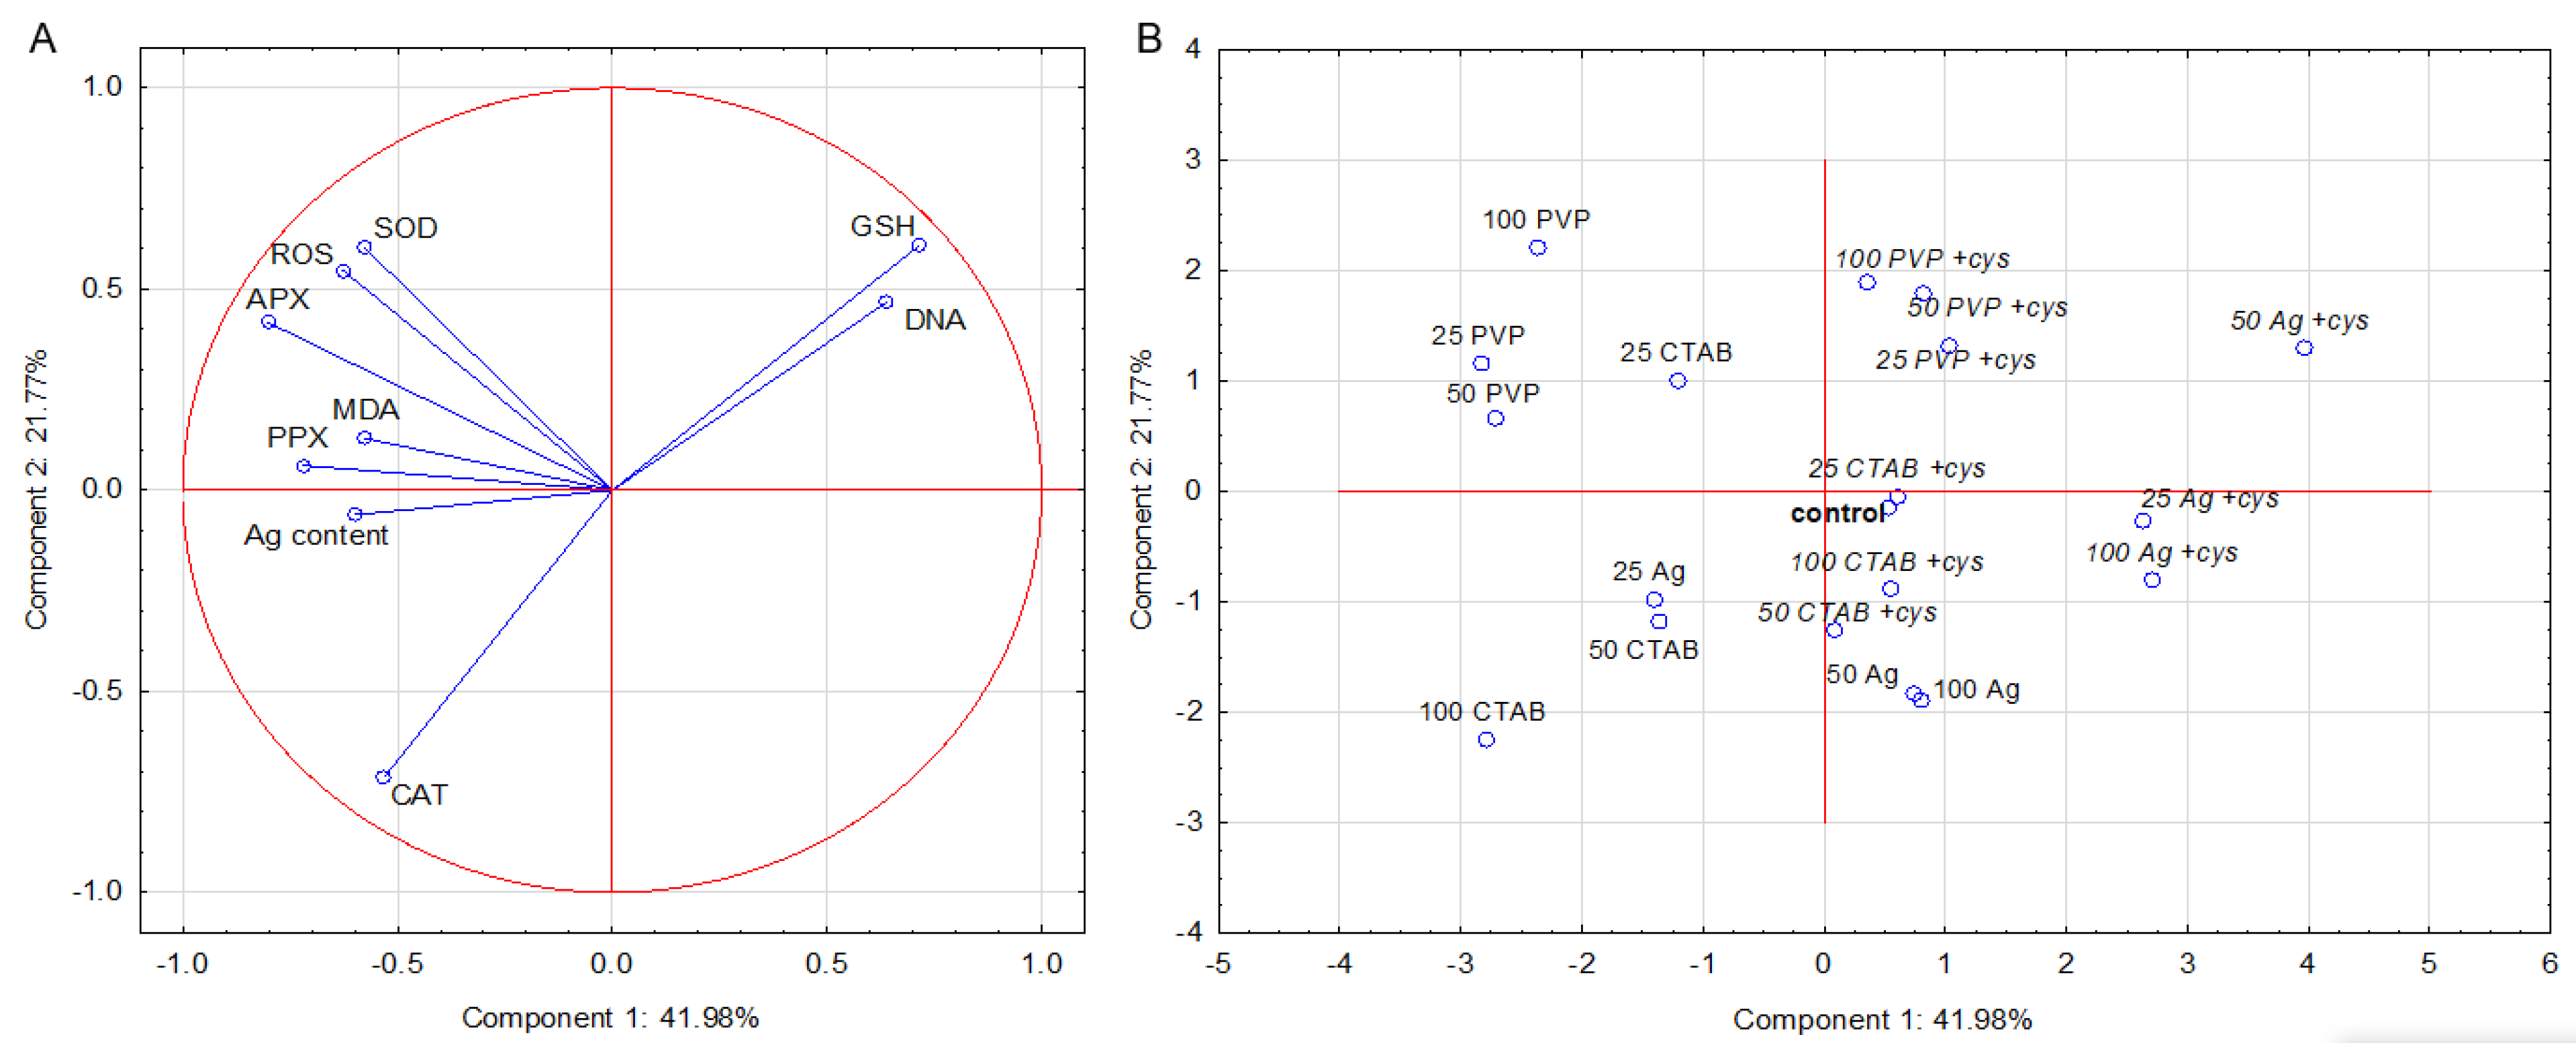
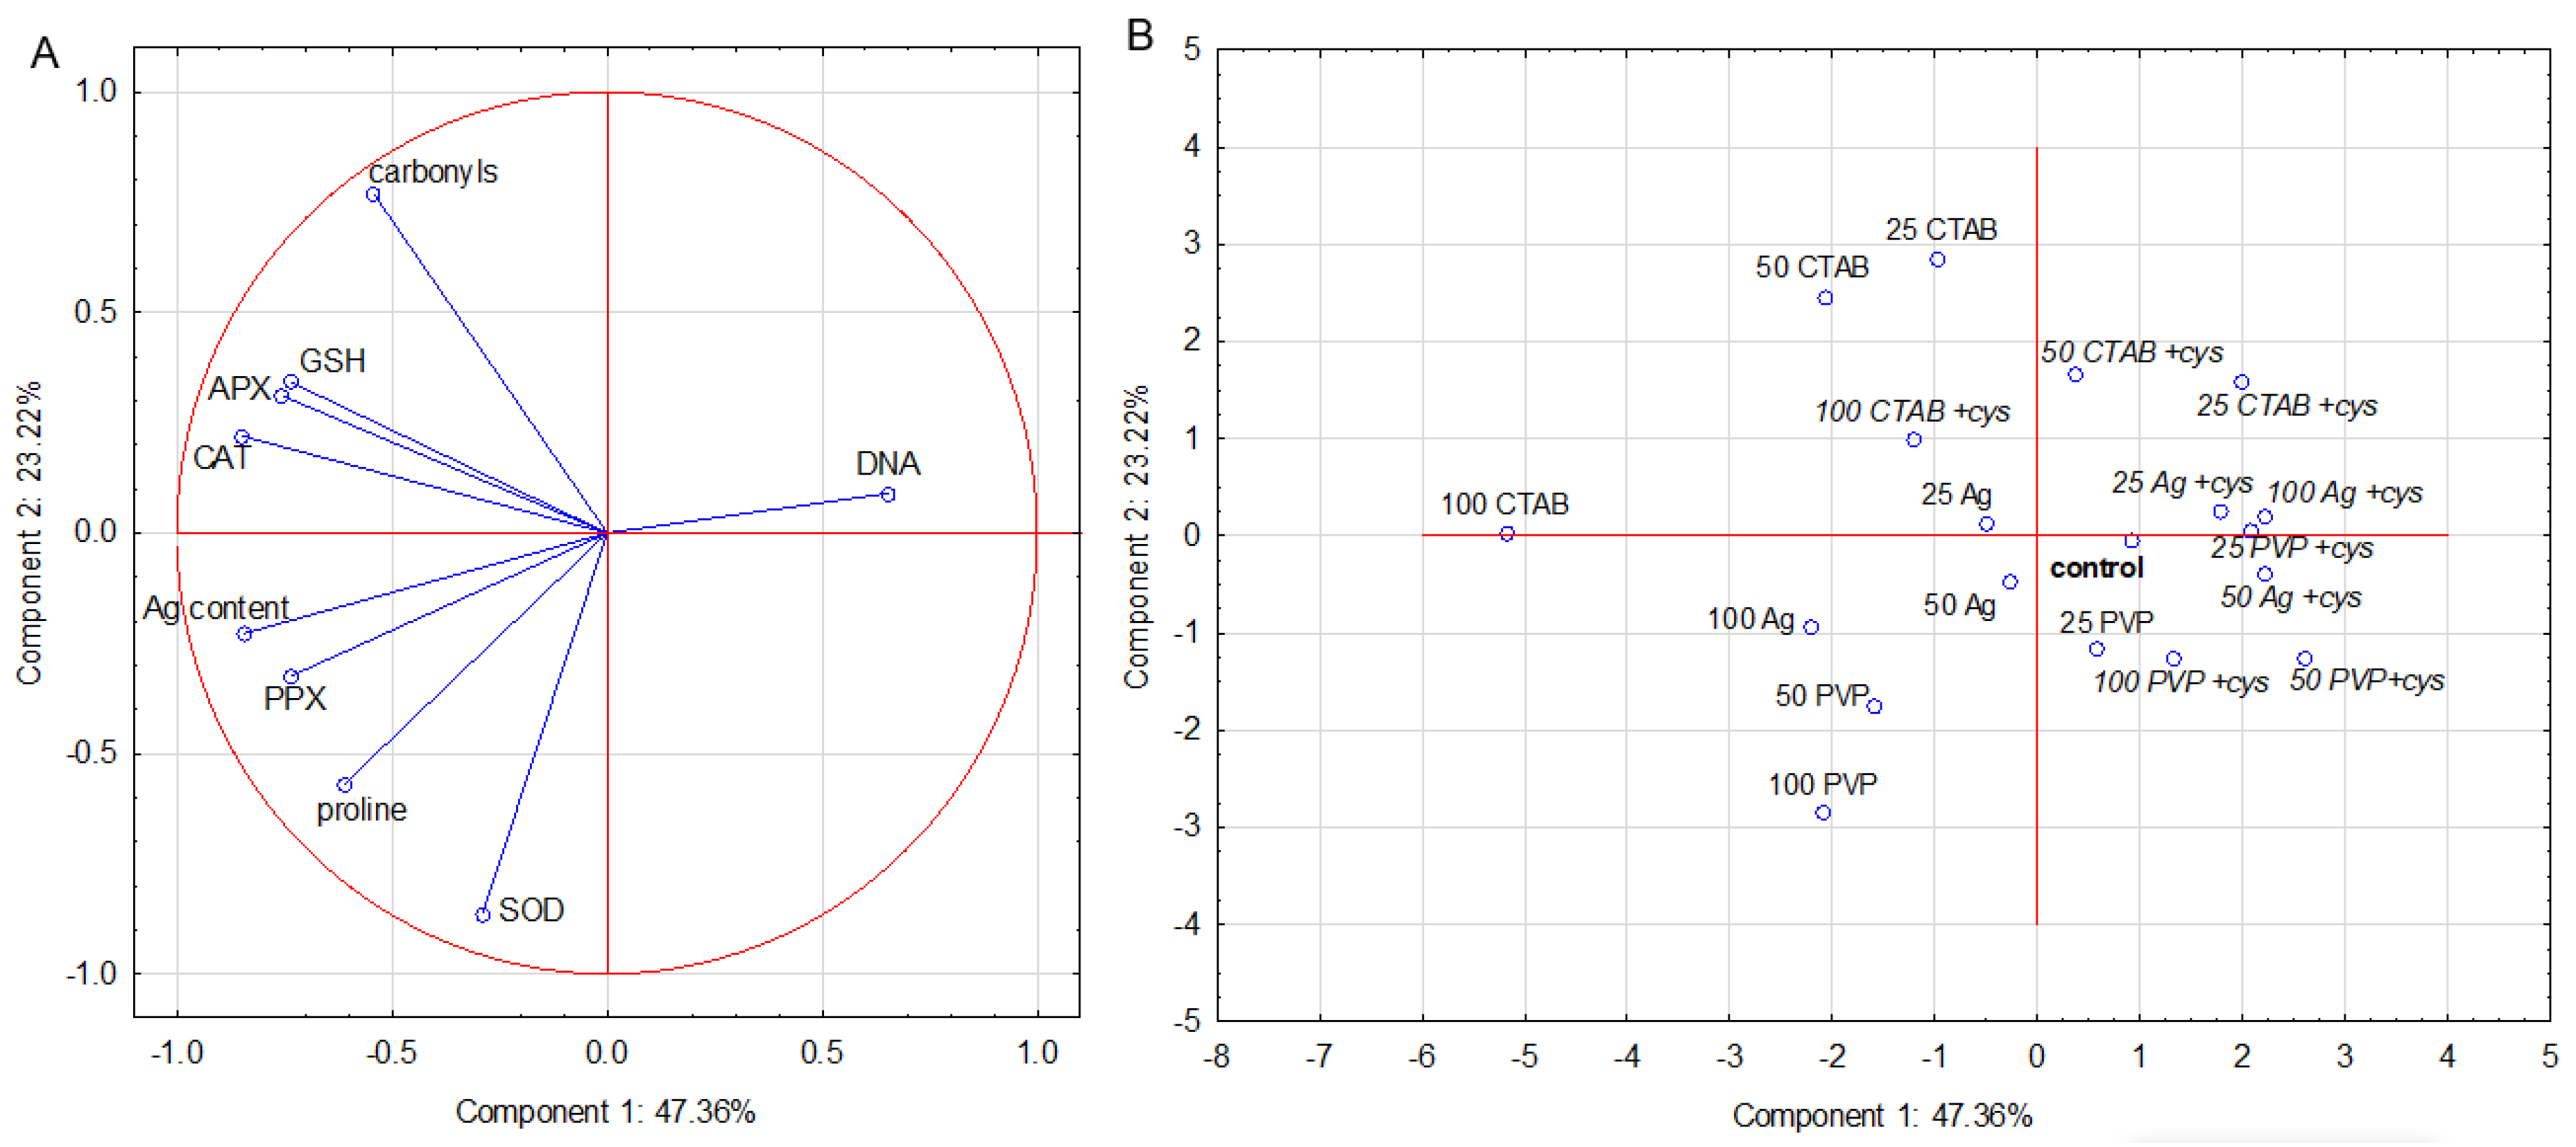
2.6. PCA Analysis
2.6.1. Root
2.6.2. Leaf
2.7. AgNP Localisation in Root Cells
3. Discussion
3.1. Roots
3.2. Leaves
4. Materials and Methods
4.1. AgNP Synthesis and Characterization
4.2. Plant Material and Exposure Experiments
4.3. Ag Content Measurements
4.4. Protein Extraction
4.5. ROS Determination
4.6. Malondialdehyde and Protein Carbonyl Content
4.7. Comet Assay
4.8. Activity Assays of Antioxidant Enzymes
4.9. Proline and Glutathione Contents
4.10. Microscopy Analyses
4.11. Statistical Analysis
5. Conclusions
Supplementary Materials
Author Contributions
Funding
Institutional Review Board Statement
Data Availability Statement
Acknowledgments
Conflicts of Interest
References
- Lee, S.H.; Jun, B.H. Silver nanoparticles: Synthesis and application for nanomedicine. Int. J. Mol. Sci. 2019, 20, 865. [Google Scholar] [CrossRef]
- Biba, R.; Košpić, K.; Komazec, B.; Markulin, D.; Cvjetko, P.; Pavoković, D.; Štefanić, P.P.; Tkalec, M.; Balen, B. Surface coating-modulated phytotoxic responses of silver nanoparticles in plants and freshwater green algae. Nanomaterials 2022, 12, 24. [Google Scholar] [CrossRef] [PubMed]
- Abbas, Q.; Yousaf, B.; Amina; Ali, M.U.; Munir, M.A.M.; El-Naggar, A.; Rinklebe, J.; Naushad, M. Transformation pathways and fate of engineered nanoparticles (ENPs) in distinct interactive environmental compartments: A review. Environ. Int. 2020, 138, 105646. [Google Scholar] [CrossRef]
- Bruna, T.; Maldonado-Bravo, F.; Jara, P.; Caro, N. Silver nanoparticles and their antibacterial applications. Int. J. Mol. Sci. 2021, 22, 7202. [Google Scholar] [CrossRef]
- Anand, R.; Bhagat, M. Silver nanoparticles (AgNPs): As nanopesticides and nanofertilizers. MOJ Biol. Med. 2019, 4, 19–20. [Google Scholar] [CrossRef]
- Ferdous, Z.; Nemmar, A. Health impact of silver nanoparticles: A review of the biodistribution and toxicity following various routes of exposure. Int. J. Mol. Sci. 2020, 21, 2375. [Google Scholar] [CrossRef]
- Suresh, A.K.; Pelletier, D.A.; Wang, W.; Moon, J.W.; Gu, B.; Mortensen, N.P.; Allison, D.P.; Joy, D.C.; Phelps, T.J.; Doktycz, M.J. Silver nanocrystallites: Biofabrication using Shewanella oneidensis, and an evaluation of their comparative toxicity on gram-negative and gram-positive bacteria. Environ. Sci. Technol. 2010, 44, 5210–5215. [Google Scholar] [CrossRef] [PubMed]
- Grün, A.L.; Manz, W.; Kohl, Y.L.; Meier, F.; Straskraba, S.; Jost, C.; Drexel, R.; Emmerling, C. Impact of silver nanoparticles (AgNP) on soil microbial community depending on functionalization, concentration, exposure time, and soil texture. Environ. Sci. Eur. 2019, 31, 15. [Google Scholar] [CrossRef]
- Dedman, C.J.; Newson, G.C.; Davies, G.L.; Christie-Oleza, J.A. Mechanisms of silver nanoparticle toxicity on the marine cyanobacterium Prochlorococcus under environmentally-relevant conditions. Sci. Total Environ. 2020, 747, 141229. [Google Scholar] [CrossRef]
- Burić, P.; Jakšić, Ž.; Štajner, L.; Dutour Sikirić, M.; Jurašin, D.; Cascio, C.; Calzolai, L.; Lyons, D.M. Effect of silver nanoparticles on Mediterranean sea urchin embryonal development is species specific and depends on moment of first exposure. Mar. Environ. Res. 2015, 111, 50–59. [Google Scholar] [CrossRef] [PubMed] [Green Version]
- Cho, Y.M.; Mizuta, Y.; Akagi, J.I.; Toyoda, T.; Sone, M.; Ogawa, K. Size-dependent acute toxicity of silver nanoparticles in mice. J. Toxicol. Pathol. 2018, 31, 73–80. [Google Scholar] [CrossRef] [PubMed]
- Liu, Y.; Sun, L.; Yang, G.; Yang, Z. Nephrotoxicity and genotoxicity of silver nanoparticles in juvenile rats and possible mechanisms of action. Arh. Hig. Rada Toksikol. 2020, 71, 121–129. [Google Scholar] [CrossRef]
- Maziero, J.S.; Thipe, V.C.; Rogero, S.O.; Cavalcante, A.K.; Damasceno, K.C.; Ormenio, M.B.; Martini, G.A.; Batista, J.G.S.; Viveiros, W.; Katti, K.K.; et al. Species-specific in vitro and in vivo evaluation of toxicity of silver nanoparticles stabilized with gum Arabic protein. Int. J. Nanomed. 2020, 15, 7359–7376. [Google Scholar] [CrossRef]
- Cvjetko, P.; Milošić, A.; Domijan, A.M.; Vinković Vrček, I.; Tolić, S.; Peharec Štefanić, P.; Letofsky-Papst, I.; Tkalec, M.; Balen, B. Toxicity of silver ions and differently coated silver nanoparticles in Allium cepa roots. Ecotoxicol. Environ. Saf. 2017, 137, 18–28. [Google Scholar] [CrossRef] [PubMed]
- Cvjetko, P.; Zovko, M.; Štefanić, P.P.; Biba, R.; Tkalec, M.; Domijan, A.M.; Vrček, I.V.; Letofsky-Papst, I.; Šikić, S.; Balen, B. Phytotoxic effects of silver nanoparticles in tobacco plants. Environ. Sci. Pollut. Res. 2018, 25, 5590–5602. [Google Scholar] [CrossRef]
- Yuan, L.; Richardson, C.J.; Ho, M.; Willis, C.W.; Colman, B.P.; Wiesner, M.R. Stress responses of aquatic plants to silver nanoparticles. Environ. Sci. Technol. 2018, 52, 2558–2565. [Google Scholar] [CrossRef] [PubMed]
- Mylona, Z.; Panteris, E.; Kevrekidis, T.; Malea, P. Silver nanoparticle toxicity effect on the seagrass Halophila stipulacea. Ecotoxicol. Environ. Saf. 2020, 189, 109925. [Google Scholar] [CrossRef]
- Foldbjerg, R.; Dang, D.A.; Autrup, H. Cytotoxicity and genotoxicity of silver nanoparticles in the human lung cancer cell line, A549. Arch. Toxicol. 2011, 85, 743–750. [Google Scholar] [CrossRef]
- Roszak, J.; Smok-Pieniążek, A.; Spryszyńska, S.; Kowalczyk, K.; Domeradzka-Gajda, K.; Świercz, R.; Grobelny, J.; Tomaszewska, E.; Ranoszek-Soliwoda, K.; Celichowski, G.; et al. Cytotoxic effects in transformed and non-transformed human breast cell lines after exposure to silver nanoparticles in combination with selected aluminium compounds, parabens or phthalates. J. Hazard. Mater. 2020, 392, 122442. [Google Scholar] [CrossRef]
- Tkalec, M.; Peharec Štefanić, P.; Balen, B. Phytotoxicity of silver nanoparticles and defence mechanisms. Compr. Anal. Chem. 2019, 84, 145–198. [Google Scholar] [CrossRef]
- Dang, F.; Huang, Y.; Wang, Y.; Zhou, D.; Xing, B. Transfer and toxicity of silver nanoparticles in the food chain. Environ. Sci. Nano 2021, 8, 1519–1535. [Google Scholar] [CrossRef]
- Chichiriccò, G.; Poma, A. Penetration and toxicity of nanomaterials in higher plants. Nanomaterials 2015, 5, 851–873. [Google Scholar] [CrossRef]
- Peharec Štefanić, P.; Cvjetko, P.; Biba, R.; Domijan, A.M.; Letofsky-Papst, I.; Tkalec, M.; Šikić, S.; Cindrić, M.; Balen, B. Physiological, ultrastructural and proteomic responses of tobacco seedlings exposed to silver nanoparticles and silver nitrate. Chemosphere 2018, 209, 640–653. [Google Scholar] [CrossRef]
- Biba, R.; Štefanić, P.P.; Cvjetko, P.; Tkalec, M.; Balen, B. Silver Nanoparticles Phytotoxicity Mechanisms. In Silver Nanomaterials for Agri-Food Applications; Elsevier: Amsterdam, The Netherlands, 2021; ISBN 9780128235287. [Google Scholar]
- Peharec Štefanić, P.P.; Košpić, K.; Lyons, D.M.; Jurković, L.; Balen, B.; Tkalec, M. Phytotoxicity of silver nanoparticles on tobacco plants: Evaluation of coating effects on photosynthetic performance and chloroplast ultrastructure. Nanomaterials 2021, 11, 744. [Google Scholar] [CrossRef] [PubMed]
- Biba, R.; Tkalec, M.; Cvjetko, P.; Štefanić, P.P.; Šikić, S.; Pavoković, D.; Balen, B. Silver nanoparticles affect germination and photosynthesis in tobacco seedlings. Acta Bot. Croat. 2021, 80, 241350. [Google Scholar] [CrossRef]
- Dimkpa, C.O.; McLean, J.E.; Martineau, N.; Britt, D.W.; Haverkamp, R.; Anderson, A.J. Silver nanoparticles disrupt wheat (Triticum aestivum L.) growth in a sand matrix. Environ. Sci. Technol. 2013, 47, 1082–1090. [Google Scholar] [CrossRef]
- Mirzajani, F.; Askari, H.; Hamzelou, S.; Farzaneh, M.; Ghassempour, A. Effect of silver nanoparticles on Oryza sativa L. and its rhizosphere bacteria. Ecotoxicol. Environ. Saf. 2013, 88, 48–54. [Google Scholar] [CrossRef] [PubMed]
- Yasur, J.; Rani, P.U. Environmental effects of nanosilver: Impact on castor seed germination, seedling growth, and plant physiology. Environ. Sci. Pollut. Res. 2013, 20, 8636–8648. [Google Scholar] [CrossRef] [PubMed]
- Scherer, M.D.; Sposito, J.C.V.; Falco, W.F.; Grisolia, A.B.; Andrade, L.H.C.; Lima, S.M.; Machado, G.; Nascimento, V.A.; Gonçalves, D.A.; Wender, H.; et al. Cytotoxic and genotoxic effects of silver nanoparticles on meristematic cells of Allium cepa roots: A close analysis of particle size dependence. Sci. Total Environ. 2019, 660, 459–467. [Google Scholar] [CrossRef] [PubMed]
- Yan, A.; Chen, Z. Impacts of silver nanoparticles on plants: A focus on the phytotoxicity and underlying mechanism. Int. J. Mol. Sci. 2019, 20, 1003. [Google Scholar] [CrossRef]
- Choi, O.; Hu, Z. Size dependent and reactive oxygen species related nanosilver toxicity to nitrifying bacteria. Environ. Sci. Technol. 2008, 42, 4583–4588. [Google Scholar] [CrossRef] [PubMed]
- El Badawy, A.M.; Silva, R.G.; Morris, B.; Scheckel, K.G.; Suidan, M.T.; Tolaymat, T.M. Surface charge-dependent toxicity of silver nanoparticles. Environ. Sci. Technol. 2011, 45, 283–287. [Google Scholar] [CrossRef]
- Biba, R.; Matić, D.; Lyons, D.M.; Štefanić, P.P.; Cvjetko, P.; Tkalec, M.; Pavoković, D.; Letofsky-Papst, I.; Balen, B. Coating-dependent effects of silver nanoparticles on tobacco seed germination and early growth. Int. J. Mol. Sci. 2020, 21, 3441. [Google Scholar] [CrossRef]
- Bae, S.; Hwang, Y.S.; Lee, Y.-J.; Lee, S.-K. Effects of water chemistry on aggregation and soil adsorption of silver nanoparticles. Environ. Health Toxicol. 2013, 28, e2013006. [Google Scholar] [CrossRef]
- Behra, R.; Sigg, L.; Clift, M.J.D.; Herzog, F.; Minghetti, M.; Johnston, B.; Petri-Fink, A.; Rothen-Rutishauser, B. Bioavailability of silver nanoparticles and ions: From a chemical and biochemical perspective. J. R. Soc. Interface 2013, 10, 20130396. [Google Scholar] [CrossRef] [PubMed]
- Tolaymat, T.M.; El Badawy, A.M.; Genaidy, A.; Scheckel, K.G.; Luxton, T.P.; Suidan, M. An evidence-based environmental perspective of manufactured silver nanoparticle in syntheses and applications: A systematic review and critical appraisal of peer-reviewed scientific papers. Sci. Total Environ. 2010, 408, 999–1006. [Google Scholar] [CrossRef] [PubMed]
- Levard, C.; Hotze, E.M.; Lowry, G.V.; Brown, G.E. Environmental transformations of silver nanoparticles: Impact on stability and toxicity. Environ. Sci. Technol. 2012, 46, 6900–6914. [Google Scholar] [CrossRef] [PubMed]
- Gondikas, A.P.; Morris, A.; Reinsch, B.C.; Marinakos, S.M.; Lowry, G.V.; Hsu-Kim, H. Cysteine-induced modifications of zero-valent silver nanomaterials: Implications for particle surface chemistry, aggregation, dissolution, and silver speciation. Environ. Sci. Technol. 2012, 46, 7037–7045. [Google Scholar] [CrossRef]
- Pradas del Real, E.A.; Vidal, V.; Carrière, M.; Hiram, A.; Levard, C.; Chaurand, P.; Sarret, G.; Elena, A.; Vidal, V.; Carrière, M.; et al. Silver nanoparticles and wheat roots: A complex interplay. Environ. Sci. Technol. 2017, 51, 5774–5782. [Google Scholar] [CrossRef]
- Barbasz, A.; Kreczmer, B.; Oćwieja, M. Effects of exposure of callus cells of two wheat varieties to silver nanoparticles and silver salt (AgNO3). Acta Physiol. Plant. 2016, 38, 76. [Google Scholar] [CrossRef] [Green Version]
- Nair, P.M.G.; Chung, I.M. Physiological and molecular level effects of silver nanoparticles exposure in rice (Oryza sativa L.) seedlings. Chemosphere 2014, 112, 105–113. [Google Scholar] [CrossRef] [PubMed]
- Nair, P.M.G.; Chung, I.M. Assessment of silver nanoparticle-induced physiological and molecular changes in Arabidopsis thaliana. Environ. Sci. Pollut. Res. 2014, 21, 8858–8869. [Google Scholar] [CrossRef] [PubMed]
- Ghosh, M.; Manivannan, J.; Sinha, S.; Chakraborty, A.; Mallick, S.K.; Bandyopadhyay, M.; Mukherjee, A. In vitro and in vivo genotoxicity of silver nanoparticles. Mutat. Res.—Genet. Toxicol. Environ. Mutagen. 2012, 749, 60–69. [Google Scholar] [CrossRef]
- Jiang, H.S.; Qiu, X.N.; Li, G.B.; Li, W.; Yin, L.Y. Silver nanoparticles induced accumulation of reactive oxygen species and alteration of antioxidant systems in the aquatic plant Spirodela polyrhiza. Environ. Toxicol. Chem. 2014, 33, 1398–1405. [Google Scholar] [CrossRef] [PubMed]
- Hayat, S.; Hayat, Q.; Alyemeni, M.N.; Wani, A.S.; Pichtel, J.; Ahmad, A. Role of proline under changing environments: A review. Plant Signal. Behav. 2012, 7, 1456–1466. [Google Scholar] [CrossRef]
- Mirmoeini, T.; Pishkar, L.; Kahrizi, D.; Barzin, G.; Karimi, N. Phytotoxicity of green synthesized silver nanoparticles on Camelina sativa L. Physiol. Mol. Biol. Plants 2021, 27, 417–427. [Google Scholar] [CrossRef]
- Couto, N.; Wood, J.; Barber, J. The role of glutathione reductase and related enzymes on cellular redox homoeostasis network. Free Radic. Biol. Med. 2016, 95, 27–42. [Google Scholar] [CrossRef]
- Ellman, G.L. Tissue Sulhydryl Groups. Arch. Biochem. Biophys. 1959, 82, 70–77. [Google Scholar] [CrossRef]
- Khromykh, N.O.; Shupranova, L.V.; Lykholat, Y.V.; Bil‛chuk, V.S.; Fedenko, V.S.; Boguslavs‛ka, L.V.; Borysova, O.I. Physiological and biochemical reactions of Hordeum vulgare seedlings to the action of silver nanoparticles. Biosyst. Divers. 2015, 23, 100–104. [Google Scholar] [CrossRef]
- Bagherzadeh Homaee, M.; Ehsanpour, A.A. Silver nanoparticles and silver ions: Oxidative stress responses and toxicity in potato (Solanum tuberosum L) grown in vitro. Hortic. Environ. Biotechnol. 2016, 57, 544–553. [Google Scholar] [CrossRef]
- Song, K.; Zhao, D.; Sun, H.; Gao, J.; Li, S.; Hu, T.; He, X. Green nanopriming: Responses of alfalfa (Medicago sativa L) seedlings to alfalfa extracts capped and light—Induced silver nanoparticles. BMC Plant Biol. 2022, 22, 323. [Google Scholar] [CrossRef]
- Liang, X.; Zhang, L.; Natarajan, S.K.; Becker, D.F. Proline mechanisms of stress survival. Antioxid. Redox. Signal. 2013, 19, 998–1011. [Google Scholar] [CrossRef] [PubMed]
- Shoeib, T.; Siu, K.W.M.; Hopkinson, A.C. Silver ion binding energies of amino acids: Use of theory to assess the validity of experimental silver ion basicities obtained from the kinetic method. J. Phys. Chem. A 2002, 106, 6121–6128. [Google Scholar] [CrossRef]
- Bates, L.S.; Waldren, R.P.; Teare, I.D. Rapid determination of free proline for water stress studies. Plant Soil. 1973, 39, 205–207. [Google Scholar] [CrossRef]
- Lovecká, P.; Macůrková, A.; Záruba, K.; Hubáček, T.; Siegel, J.; Valentová, O. Genomic damage induced in Nicotiana tabacum L. Plants by colloidal solution with silver and gold nanoparticles. Plants 2021, 10, 1260. [Google Scholar] [CrossRef] [PubMed]
- Barbasz, A.; Kreczmer, B.; Oćwieja, M. How the surface properties affect the nanocytotoxicity of silver? Study of the influence of three types of nanosilver on two wheat varieties. Acta Physiol. Plant. 2018, 40, 31. [Google Scholar] [CrossRef]
- Peharec Štefanić, P.; Jarnević, M.; Cvjetko, P.; Biba, R.; Šikić, S.; Tkalec, M.; Cindrić, M.; Letofsky-Papst, I.; Balen, B. Comparative proteomic study of phytotoxic effects of silver nanoparticles and silver ions on tobacco plants. Environ. Sci. Pollut. Res. 2019, 26, 22529–22550. [Google Scholar] [CrossRef]
- Karimi, J.; Mohsenzadeh, S. Physiological effects of silver nanoparticles and silver nitrate toxicity in Triticum aestivum. Iran. J. Sci. Technol. Trans. A Sci. 2017, 41, 111–120. [Google Scholar] [CrossRef]
- Szabados, L.; Savouré, A. Proline: A multifunctional amino acid. Trends Plant Sci. 2010, 15, 89–97. [Google Scholar] [CrossRef]
- Lee, S.; Pagoria, D.; Raigrodski, A.; Geurtsen, W. Effects of combinations of ROS scavengers on oxidative DNA damage caused by visible-light-activated camphorquinone/N,N-Dimethyl-p-toluidine. J. Biomed. Mater. Res. 2007, 83, 391–399. [Google Scholar] [CrossRef]
- Navarro, E.; Wagner, B.; Odzak, N.; Sigg, L.; Behra, R. Effects of differently coated silver nanoparticles on the photosynthesis of Chlamydomonas reinhardtii. Environ. Sci. Technol. 2015, 49, 8041–8047. [Google Scholar] [CrossRef]
- Murashige, T.; Skoog, F. A Revised medium for rapid growth and bio assays with tobacco tissue cultures. Physiol. Plant. 1962, 15, 474–497. [Google Scholar] [CrossRef]
- Bradford, M.M. A rapid and sensitive method for the quantitation of microgram quantities of protein utilizing the principle of protein-dye binding. Anal. Biochem. 1976, 72, 248–254. [Google Scholar] [CrossRef]
- Domijan, A.M.; Abramov, A.Y. Fumonisin B1 inhibits mitochondrial respiration and deregulates calcium homeostasis—Implication to mechanism of cell toxicity. Int. J. Biochem. Cell Biol. 2011, 43, 897–904. [Google Scholar] [CrossRef]
- Heath, R.L.; Packer, L. Photoperoxidation in isolated chloroplasts. Arch. Biochem. Biophys. 1968, 125, 189–198. [Google Scholar] [CrossRef]
- Levine, R.L.; Williams, J.A.; Stadtman, E.P.; Shacter, E. Carbonyl assays for determination of oxidatively modified proteins. Methods Enzymol. 1994, 233, 346–357. [Google Scholar] [CrossRef]
- Gichner, T.; Patková, Z.; Száková, J.; Demnerová, K. Cadmium induces DNA damage in tobacco roots, but no DNA damage, somatic mutations or homologous recombination in tobacco leaves. Mutat. Res.—Genet. Toxicol. Environ. Mutagen. 2004, 559, 49–57. [Google Scholar] [CrossRef] [PubMed]
- Balen, B.; Tkalec, M.; Šikić, S.; Tolić, S.; Cvjetko, P.; Pavlica, M.; Vidaković-Cifrek, Ž. Biochemical responses of Lemna minor experimentally exposed to cadmium and zinc. Ecotoxicology 2011, 20, 815–826. [Google Scholar] [CrossRef] [PubMed]
- Beauchamp, C.; Fridovich, I. Superoxide dismutase: Improved assays and an assay applicable to acrylamide gels. Anal. Biochem. 1971, 44, 276–287. [Google Scholar] [CrossRef]
- Nakano, Y.; Asada, K. Hydrogen peroxide is scavenged by ascorbate-specific peroxidase in spinach chloroplasts. Plant Cell Physiol. 1981, 22, 867–880. [Google Scholar] [CrossRef]
- Aebi, H. Catalase in Vitro. Methods Enzymol. 1984, 105, 121–126. [Google Scholar] [CrossRef] [PubMed]
- Salbitani, G.; Bottone, C.; Carfagna, S. Determination of reduced and total glutathione content in extremophilic microalga Galdieria phlegrea. Bio. Protocol. 2017, 7, e2372. [Google Scholar] [CrossRef] [PubMed] [Green Version]


| Plant Material | Treatments | Concentrations (µM) | Ag Content (μg g−1 DW) | ||
|---|---|---|---|---|---|
| AgNP–PVP | AgNP–CTAB | AgNO3 | |||
| Root | Control | 0 | 0.000 ± 0.000 c | 0.000 ± 0.000 d | 0.000 ± 0.000 d |
| 25 | 3.601 ± 0.145 b,B | 5.348 ± 0.246 c,A | 2.712 ± 0.152 c,C | ||
| AgNP/AgNO3 | 50 | 14.833 ± 0.708 a,A | 8.885 ± 0.320 b,B | 3.833 ± 0.171 b,C | |
| 100 | 16.261 ± 0.283 a,B | 18.976 ± 0.635 a,A | 10.745 ± 0.038 a,C | ||
| 25 + 125 | 1.847 ± 0.082 *, # | 3.943 ± 0.184 *, # | 0.788 ± 0.049 *, # | ||
| AgNP/AgNO3 + cys | 50 + 250 | 7.937 ± 0.342 *, # | 6.386 ± 0.248 *, # | 0.909 ± 0.055 *, # | |
| 100 + 500 | 11.357 ± 0.646 *, # | 12.678 ± 0.143 *, # | 2.351 ± 0.042 *, # | ||
| Leaf | Control | 0 | 0.000 ± 0.000 c | 0.000 ± 0.000 d | 0.000 ± 0.000 d |
| 25 | 0.637 ± 0.101 c,B | 2.107 ± 0.509 c,A | 0.906 ± 0.037 c,AB | ||
| AgNP/AgNO3 | 50 | 5.253 ± 0.228 b,A | 3.399 ± 0.206 b,B | 1.402 ± 0.0504 b,C | |
| 100 | 7.437 ± 0.235 a,B | 8.936 ± 0.295 a,A | 5.298 ± 0.234 a,C | ||
| 25 + 125 | 0.160 ± 0.509 * | 0.902 ± 0.202 | 0.114 ± 0.005 *, # | ||
| AgNP/AgNO3 + cys | 50 + 250 | 1.041 ± 0.206 *, # | 2.038 ± 0.138 *, # | 0.290 ± 0.013 *, # | |
| 100 + 500 | 3.376 ± 0.295 *, # | 6.694 ± 0.658 *, # | 1.155 ± 0.088 *, # | ||
| Conc. (µM) | ROS (% of Control) | MDA (nmol g−1 FW) | Protein Carbonyl (µmol mg−1 proteins) | % Tail DNA | Proline (µmol g−1 FW) | GSH (µmol g−1 FW) | |
|---|---|---|---|---|---|---|---|
| Control | 0 | 100 ± 6.11 b | 126.62 ± 2.95 ab | 0.025 ± 0.003 a | 4.70 ± 0.01 ab | 11.28 ± 1.64 a | 3.89 ± 0.13 a |
| AgNP–PVP | 25 | 180.45 ± 25.59 a,A | 139.78 ± 5.02 a,A | 0.029 ± 0.002 a,A | 3.80 ± 0.33 b,A | 9.04 ± 0.83 a,A | 3.54 ± 0.29 a,A |
| 50 | 142.09 ± 14.86 ab,A | 125.03 ± 3.92 b,A | 0.032 ± 0.003 a,A | 4.10 ± 0.40 ab,A | 8.88 ± 0.79 a,AB | 3.02 ± 0.19 a,A | |
| 100 | 145.50 ± 6.92 ab,A | 106.97 ± 4.73 c,B | 0.029 ± 0.002 a,A | 5.18 ± 0.49 a,A | 8.21 ± 0.95 a,A | 4.04 ± 0.46 a,A | |
| AgNP–PVP + cys | 25 + 125 | 114.61 ± 14.06 * | 118.18 ± 3.71 * | 0.030 ± 0.003 | 5.74 ± 0.43 * | 9.68 ± 1.11 | 4.32 ± 0.36 |
| 50 + 250 | 134.45 ± 12.64 | 123.44 ± 1.81 | 0.029 ± 0.003 | 5.03 ± 0.45 | 10.18 ± 0.86 | 4.93 ± 0.45 *, # | |
| 100 + 500 | 150.30 ± 13.68 # | 114.38 ± 8.47 | 0.030 ± 0.002 | 5.48 ± 0.48 | 11.58 ± 1.68 | 4.53 ± 0.53 | |
| Control | 0 | 100 ± 4.39 a | 126.62 ± 2.76 a | 0.025 ± 0.002 a | 4.70 ± 0.01 a | 11.28 ± 1.79 a | 3.89 ± 0.12 a |
| AgNP–CTAB | 25 | 125.78 ± 14.46 a,A | 139.94 ± 9.27 a,A | 0.023 ± 0.003 a,A | 4.65 ± 0.46 a,A | 7.81 ± 0.90 a,A | 3.94 ± 0.37 a,A |
| 50 | 104.24 ± 6.33 a,AB | 121.41 ± 4.71 a,A | 0.022 ± 0.003 a,B | 4.52 ± 0.43 a,A | 11.39 ± 1.02 a,A | 3.36 ± 0.38 ab,A | |
| 100 | 92.97 ± 8.66 a,B | 133.40 ± 7.21 a,A | 0.023 ± 0.002 a,AB | 2.84 ± 0.34 b,B | 9.15 ± 0.98 a,A | 2.96 ± 0.13 b,B | |
| AgNP–CTAB + cys | 25 + 125 | 127.12 ± 12.23 | 119.18 ± 3.13 * | 0.022 ± 0.002 | 4.51 ± 0.50 | 9.61 ± 0.94 | 3.95 ± 0.49 |
| 50 + 250 | 102.31 ± 4.70 | 116.63 ± 6.86 | 0.019 ± 0.001 # | 4.01 ± 0.38 | 9.16 ± 0.87 | 3.67 ± 0.18 | |
| 100 + 500 | 108.46 ± 14.83 | 115.12 ± 9.37 | 0.022 ± 0.001 | 4.18 ± 0.42 * | 11.18 ± 1.25 | 3.97 ± 0.44 * | |
| Control | 0 | 100 ± 3.91 b | 126.62 ± 2.48 a | 0.025 ± 0.002 a | 4.70 ± 0.0.01 ab | 11.28 ± 1.09 a | 3.89 ± 0.10 a |
| AgNO3 | 25 | 169.16 ± 11.32 a,A | 108.02 ± 3.02 b,B | 0.027 ± 0.003 a,A | 3.57 ± 0.33 b,A | 9.11 ± 1.80 ab,A | 3.47 ± 0.17 ab,A |
| 50 | 86.76 ± 9.80 b,B | 115.89 ± 5.39 b,A | 0.022 ± 0.001 a,B | 3.81 ± 0.39 b,A | 6.64 ± 0.30 b,B | 3.31 ± 0.16 b,A | |
| 100 | 76.95 ± 5.15 b,B | 95.39 ± 2.17 c,B | 0.022 ± 0.001 a,B | 5.80 ± 0.46 a,A | 11.11 ± 0.90 a,A | 3.41 ± 0.10 b,AB | |
| AgNO3 + cys | 25 + 125 | 87.67 ± 1.95 * | 101.58 ± 2.18 # | 0.039 ± 0.001 *, # | 5.35 ± 0.46 * | 6.26 ± 0.63 # | 4.21 ± 0.43 |
| 50 + 250 | 83.84 ± 8.03 | 102.65 ± 4.42 *, # | 0.030 ± 0.002 * | 5.56 ± 0.44 * | 10.41 ± 0.52 * | 5.79 ± 0.32 *, # | |
| 100 + 500 | 69.84 ± 1.17 | 113.19 ± 6.69 *, # | 0.043 ± 0.002 *, # | 5.40 ± 0.43 | 12.07 ± 1.21 | 4.25 ± 0.36 * |
| Conc. (µM) | ROS (% of Control) | MDA (nmol g−1 FW) | Protein Carbonyls (µmol mg−1 proteins) | % Tail DNA | Proline (µmol g−1 FW) | GSH (µmol g−1 FW) | |
|---|---|---|---|---|---|---|---|
| Control | 0 | 100 ± 11.18 ab | 157.51 ± 4.13 a | 0.022 ± 0.002 a | 4.20 ± 0.165 b | 10.40 ± 0.49 b | 3.59 ± 0.23 c |
| AgNP–PVP | 25 | 72.15 ± 12.82 b,A | 180.07 ± 7.20 a,A | 0.023 ± 0.001 a,B | 5.46 ± 0.49 a,A | 16.61 ± 1.75 a,A | 5.30 ± 0.35 ab,B |
| 50 | 100.45 ± 6.70 ab,A | 165.19 ± 11.88 a,A | 0.019 ± 0.001 a,B | 3.87 ± 0.36 b,A | 17.08 ± 1.91 a,A | 6.24 ± 0.55 a,A | |
| 100 | 119.08 ± 14.12 a,A | 161.47 ± 7.46 a,A | 0.019 ± 0.002 a,B | 4.39 ± 0.39 ab,A | 16.83 ± 2.18 a,A | 4.21 ± 0.52 bc,C | |
| AgNP–PVP + cys | 25 + 125 | 108.68 ± 5.77 * | 148.71 ± 6.72 * | 0.024 ± 0.001 | 5.70 ± 0.49 # | 11.32 ± 0.99 * | 4.25 ± 0.39 * |
| 50 + 250 | 78.18 ± 8.88 | 143.68 ± 6.32 | 0.017 ± 0.001 | 6.65 ± 0.54 *, # | 10.72 ± 0.75 * | 3.86 ± 0.27 * | |
| 100 + 500 | 111.38 ± 9.32 | 152.23 ± 7.16 | 0.017 ± 0.002 | 5.03 ± 0.45 | 12.06 ± 0.92 * | 4.03 ± 0.19 | |
| Control | 0 | 100 ± 11.14 a | 157.51 ± 2.55 b | 0.022 ± 0.002 b | 4.20 ± 0.16 a | 10.40 ± 0.55 b | 3.59 ± 0.17 c |
| AgNP–CTAB | 25 | 103.16 ± 17.26 a,A | 170.29 ± 6.47 ab,A | 0.033 ± 0.001 a,A | 5.12 ± 0.48 a,A | 11.32 ± 1.02 b,B | 6.10 ± 0.93 b,AB |
| 50 | 98.81 ± 12.58 a,A | 195.36 ± 6.88 a,A | 0.033 ± 0.001 a,A | 4.71 ± 0.49 a,A | 10.53 ± 0.73 b,B | 7.66 ± 0.86 ab,A | |
| 100 | 111.47 ± 13.49 a,A | 155.19 ± 4.77 b,A | 0.033 ± 0.002 a,A | 4.27 ± 0.58 a,A | 16.85 ± 2.48 a,A | 9.08 ± 0.51 a,A | |
| AgNP–CTAB + cys | 25 + 125 | 109.70 ± 8.47 | 187.36 ± 7.59 *, # | 0.024 ± 0.003 * | 6.19 ± 0.63 # | 9.33 ± 0.67 | 5.38 ± 0.33 # |
| 50 + 250 | 67.13 ± 5.20 | 177.63 ± 7.45 | 0.027 ± 0.003 | 4.09 ± 0.38 | 11.20 ± 0.55 | 5.54 ± 0.42 *, # | |
| 100 + 500 | 95.66 ± 7.27 | 153.76 ± 7.31 | 0.028 ± 0.003 | 4.72 ± 0.38 | 12.53 ± 0.91 * | 6.43 ± 0.56 *, # | |
| Control | 0 | 100 ± 3.96 b | 157.51 ± 5.19 a | 0.022 ± 0.002 a | 4.20 ± 0.16 a | 10.40 ± 0.62 b | 3.59 ± 0.25 c |
| AgNO3 | 25 | 70.61 ± 4.90 c,A | 158.75 ± 5.21 a,A | 0.023 ± 0.001 a,B | 3.15 ± 0.35 a,B | 10.17 ± 0.54 b,B | 7.76 ± 0.65 a,A |
| 50 | 77.20 ± 8.15 c,A | 171.73 ± 8.43 a,A | 0.020 ± 0.002 a,B | 4.07 ± 0.37 a,A | 13.31 ± 1.33 b,AB | 5.88 ± 0.42 b,A | |
| 100 | 123.47 ± 4.46 a,A | 173.78 ± 9.50 a,A | 0.022 ± 0.002 a,B | 3.87 ± 0.42 a,A | 20.24 ± 2.4 a,A | 6.65 ± 0.60 ab,B | |
| AgNO3 + cys | 25 + 125 | 126.92 ± 8.21 *, # | 155.05 ± 5.28 | 0.019 ± 0.002 | 5.07 ± 0.42 * | 10.90 ± 0.87 | 6.80 ± 0.24 # |
| 50 + 250 | 89.65 ± 17.16 | 157.24 ± 4.31 | 0.019 ± 0.002 | 5.51 ± 0.52 *, # | 10.99 ± 0.57 | 3.35 ± 0.36 * | |
| 100 + 500 | 104.99 ± 16.55 | 156.48 ± 8.86 | 0.022 ± 0.001 | 6.56 ± 0.46 *, # | 12.65 ± 1.26 * | 3.84 ± 0.54 * |
Publisher’s Note: MDPI stays neutral with regard to jurisdictional claims in published maps and institutional affiliations. |
© 2022 by the authors. Licensee MDPI, Basel, Switzerland. This article is an open access article distributed under the terms and conditions of the Creative Commons Attribution (CC BY) license (https://creativecommons.org/licenses/by/4.0/).
Share and Cite
Košpić, K.; Biba, R.; Peharec Štefanić, P.; Cvjetko, P.; Tkalec, M.; Balen, B. Silver Nanoparticle Effects on Antioxidant Response in Tobacco Are Modulated by Surface Coating. Plants 2022, 11, 2402. https://doi.org/10.3390/plants11182402
Košpić K, Biba R, Peharec Štefanić P, Cvjetko P, Tkalec M, Balen B. Silver Nanoparticle Effects on Antioxidant Response in Tobacco Are Modulated by Surface Coating. Plants. 2022; 11(18):2402. https://doi.org/10.3390/plants11182402
Chicago/Turabian StyleKošpić, Karla, Renata Biba, Petra Peharec Štefanić, Petra Cvjetko, Mirta Tkalec, and Biljana Balen. 2022. "Silver Nanoparticle Effects on Antioxidant Response in Tobacco Are Modulated by Surface Coating" Plants 11, no. 18: 2402. https://doi.org/10.3390/plants11182402