
Light Intensity—A Key Factor Affecting Flavonoid Content and Expression of Key Enzyme Genes of Flavonoid Synthesis in Tartary Buckwheat

Abstract
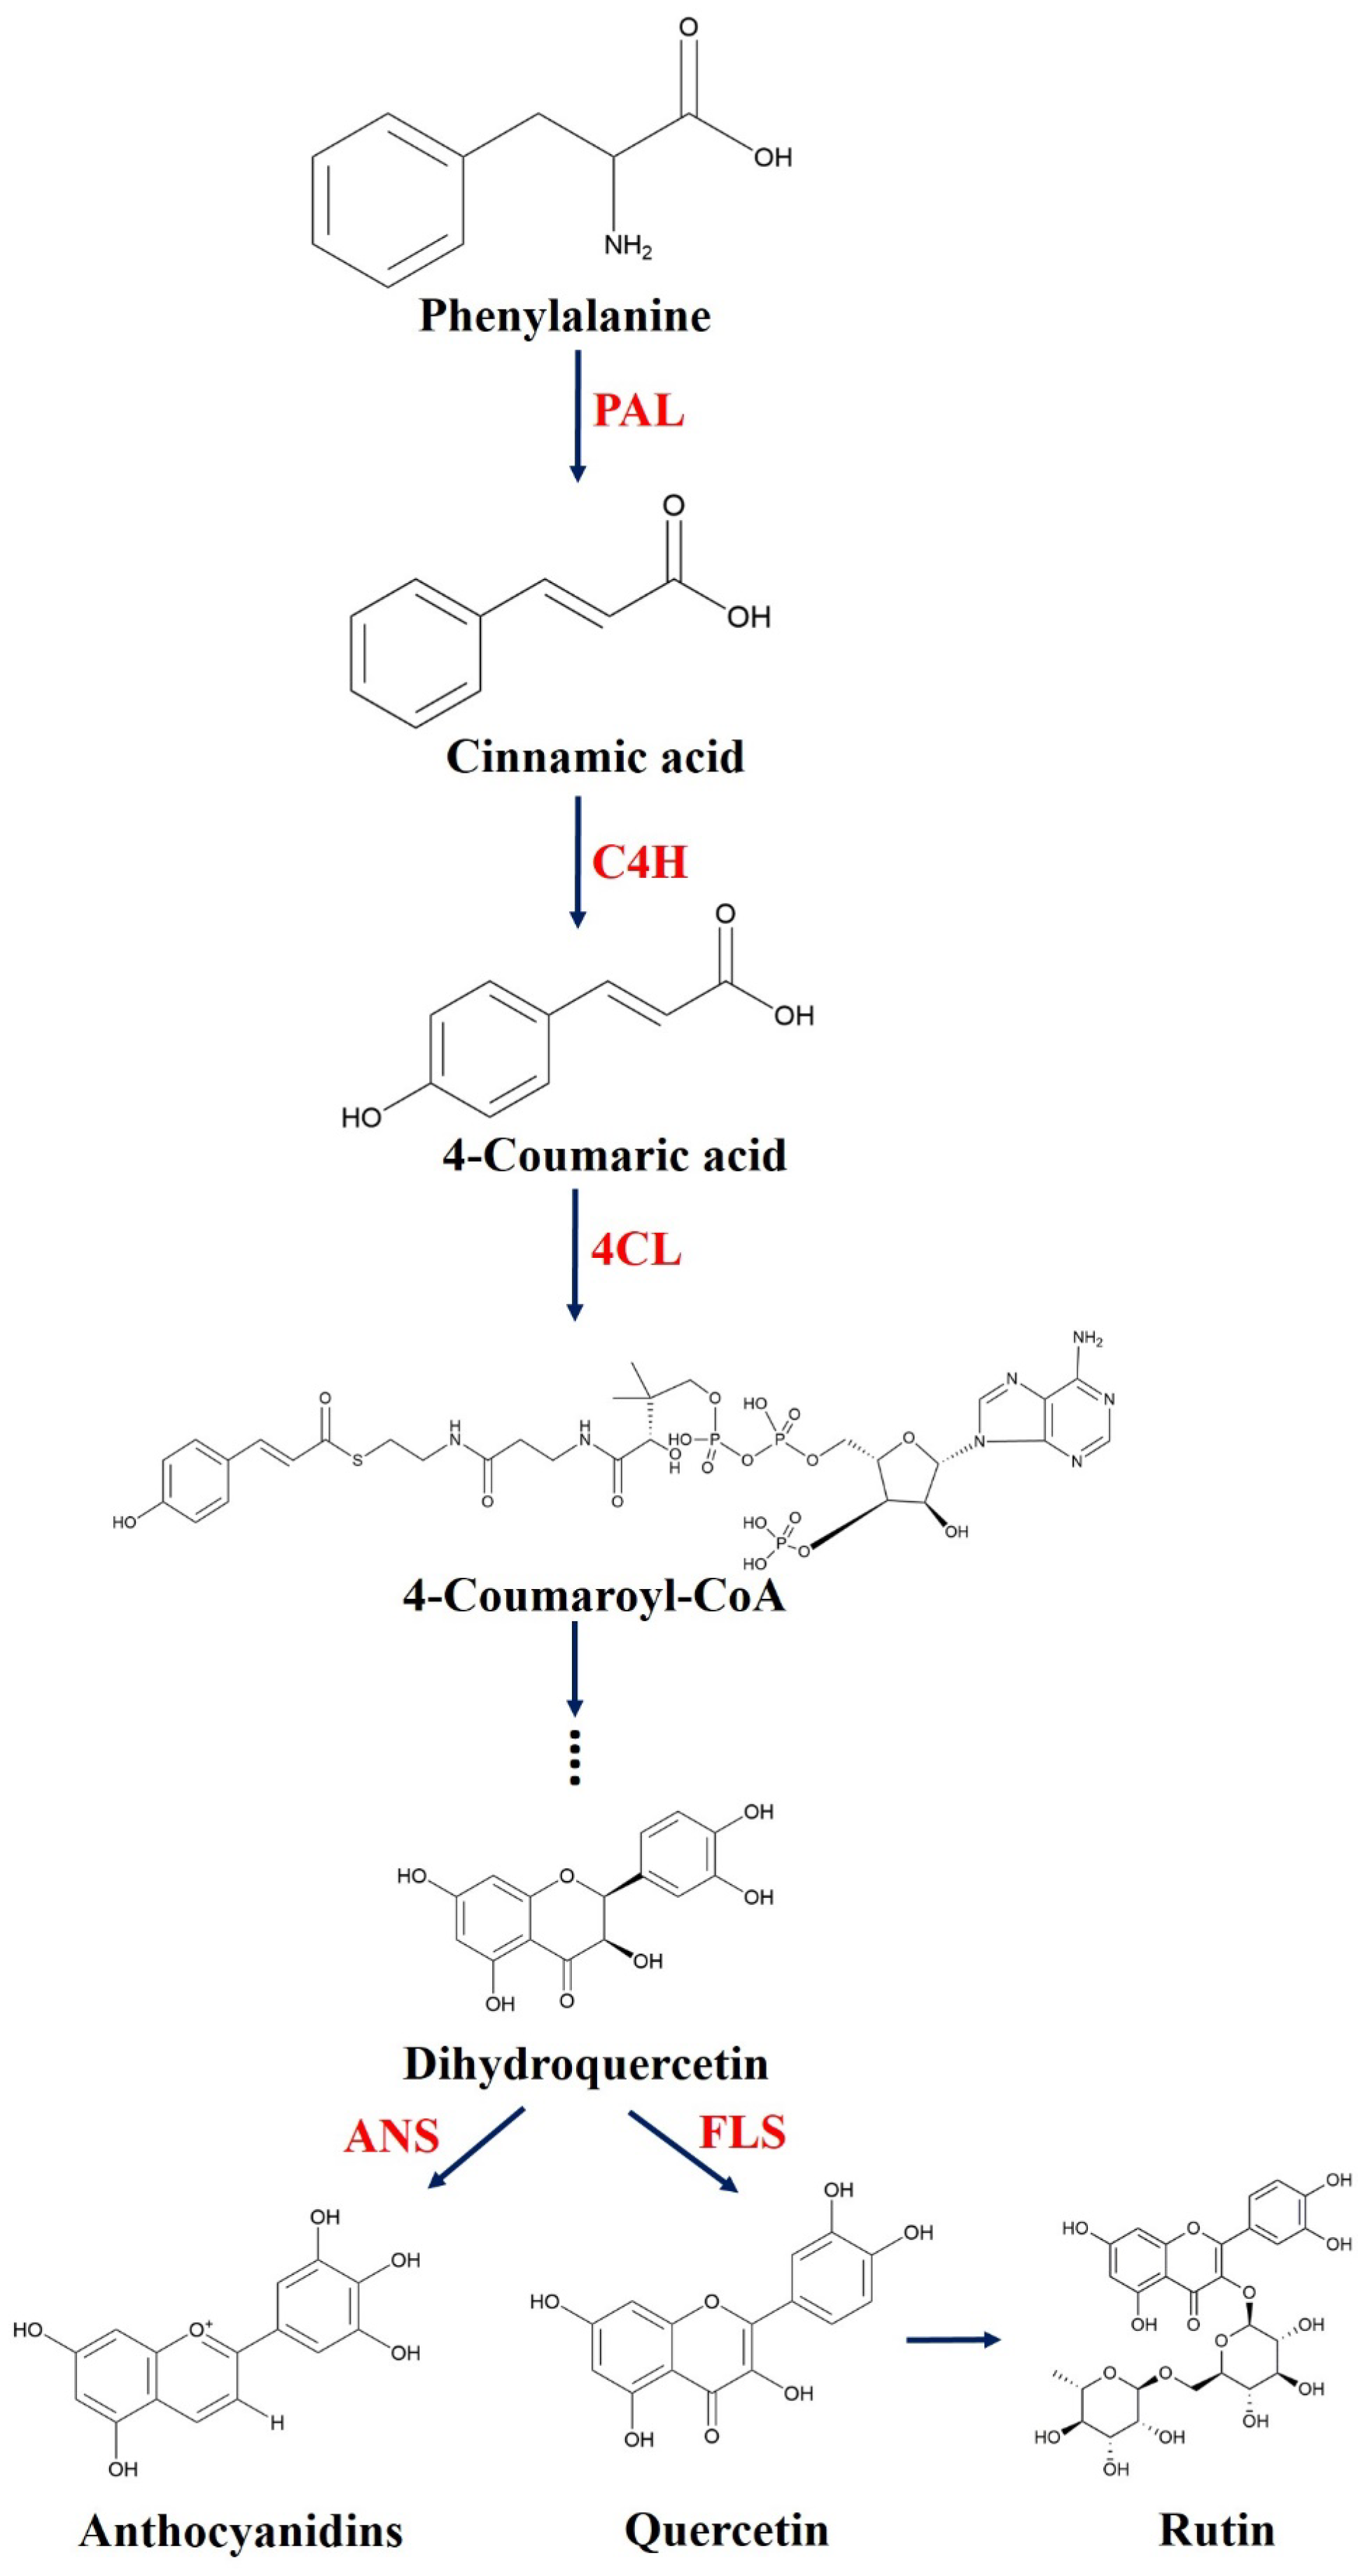
:1. Introduction
2. Results and Discussion
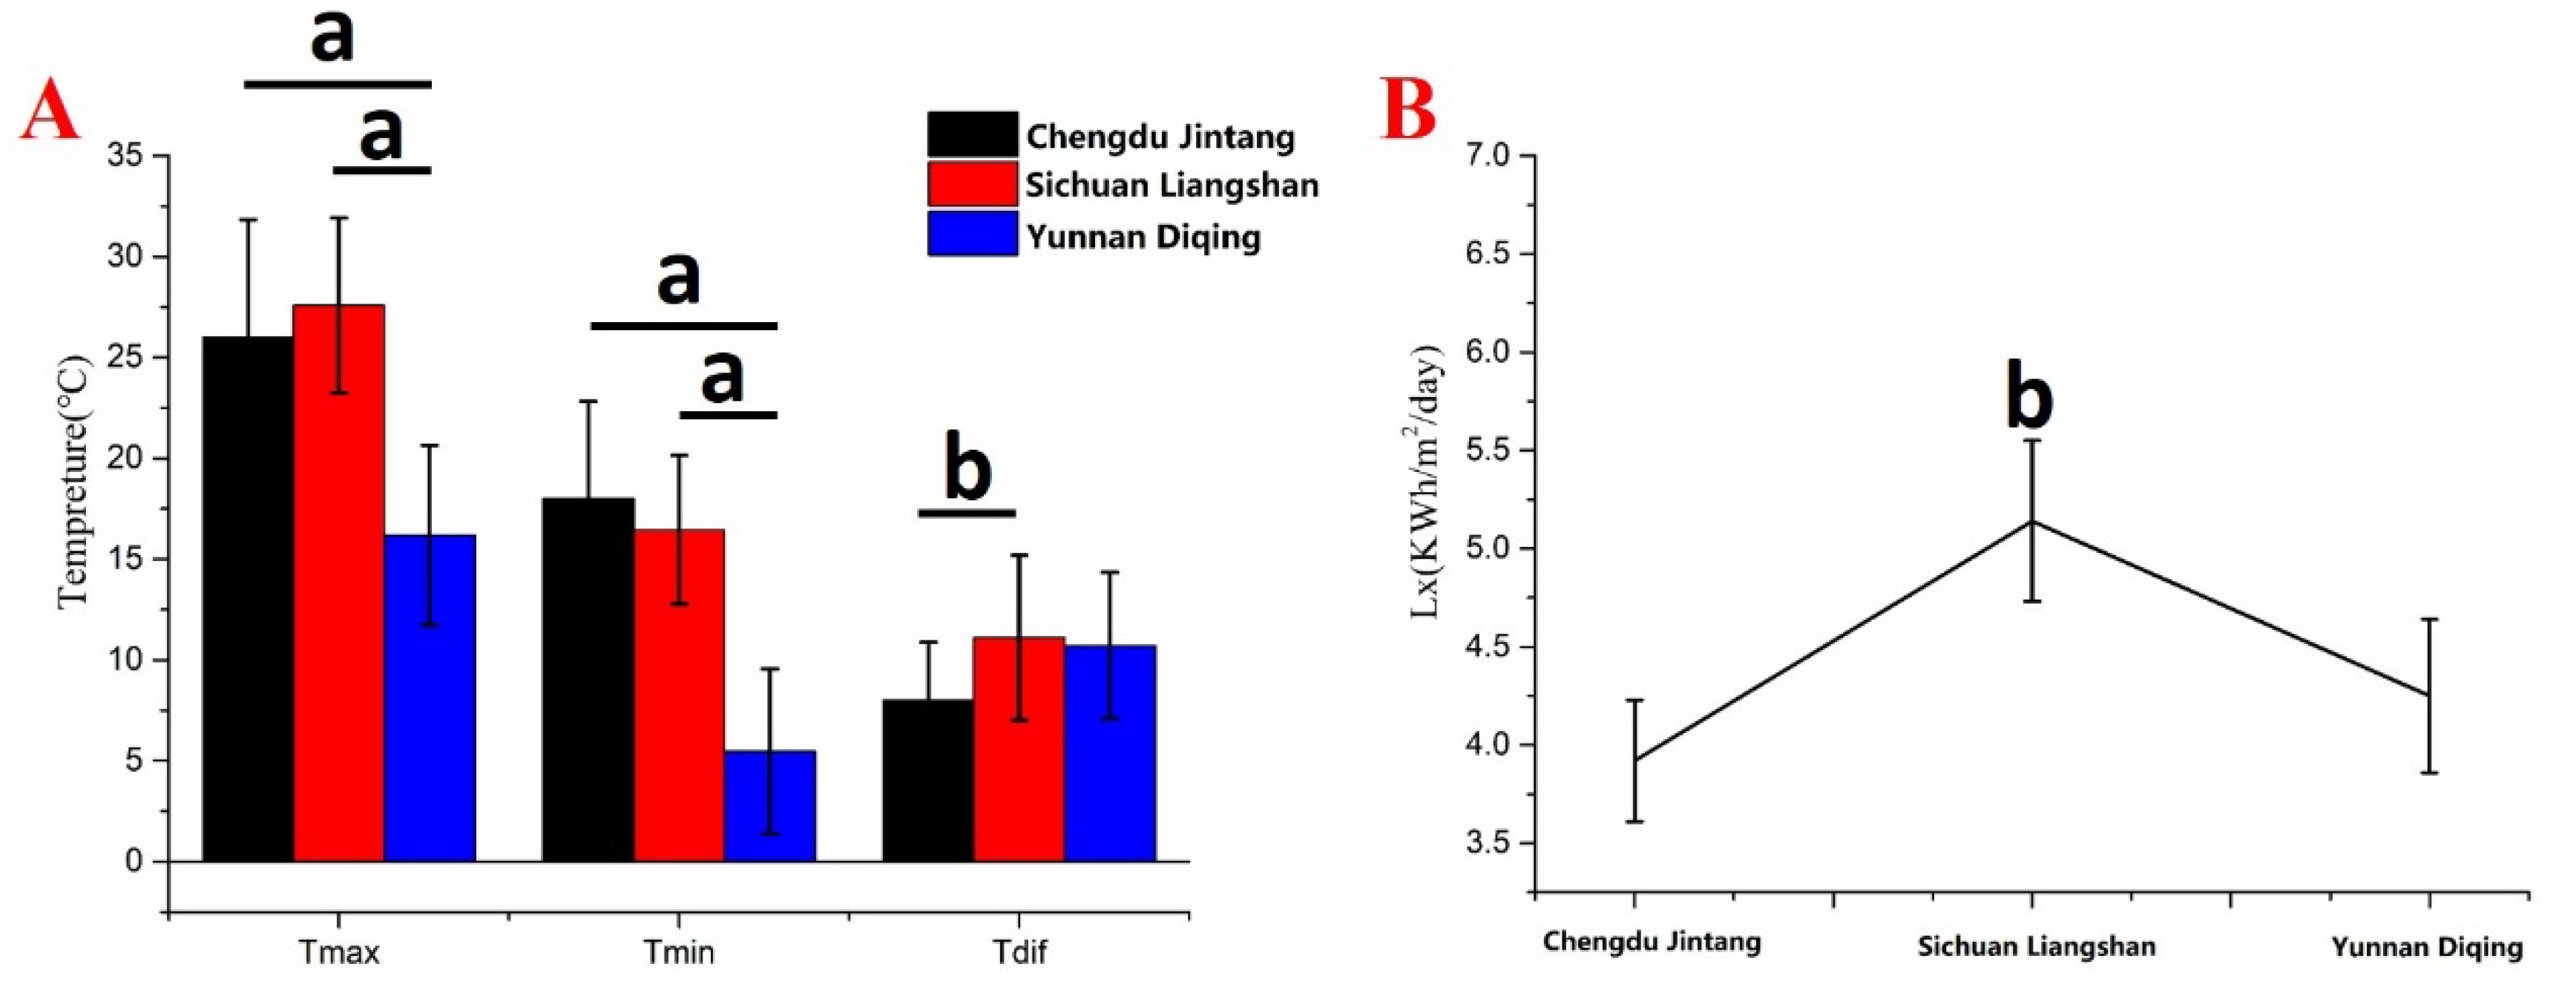
2.1. Analysis of Meteorological Data in Different Producing Areas
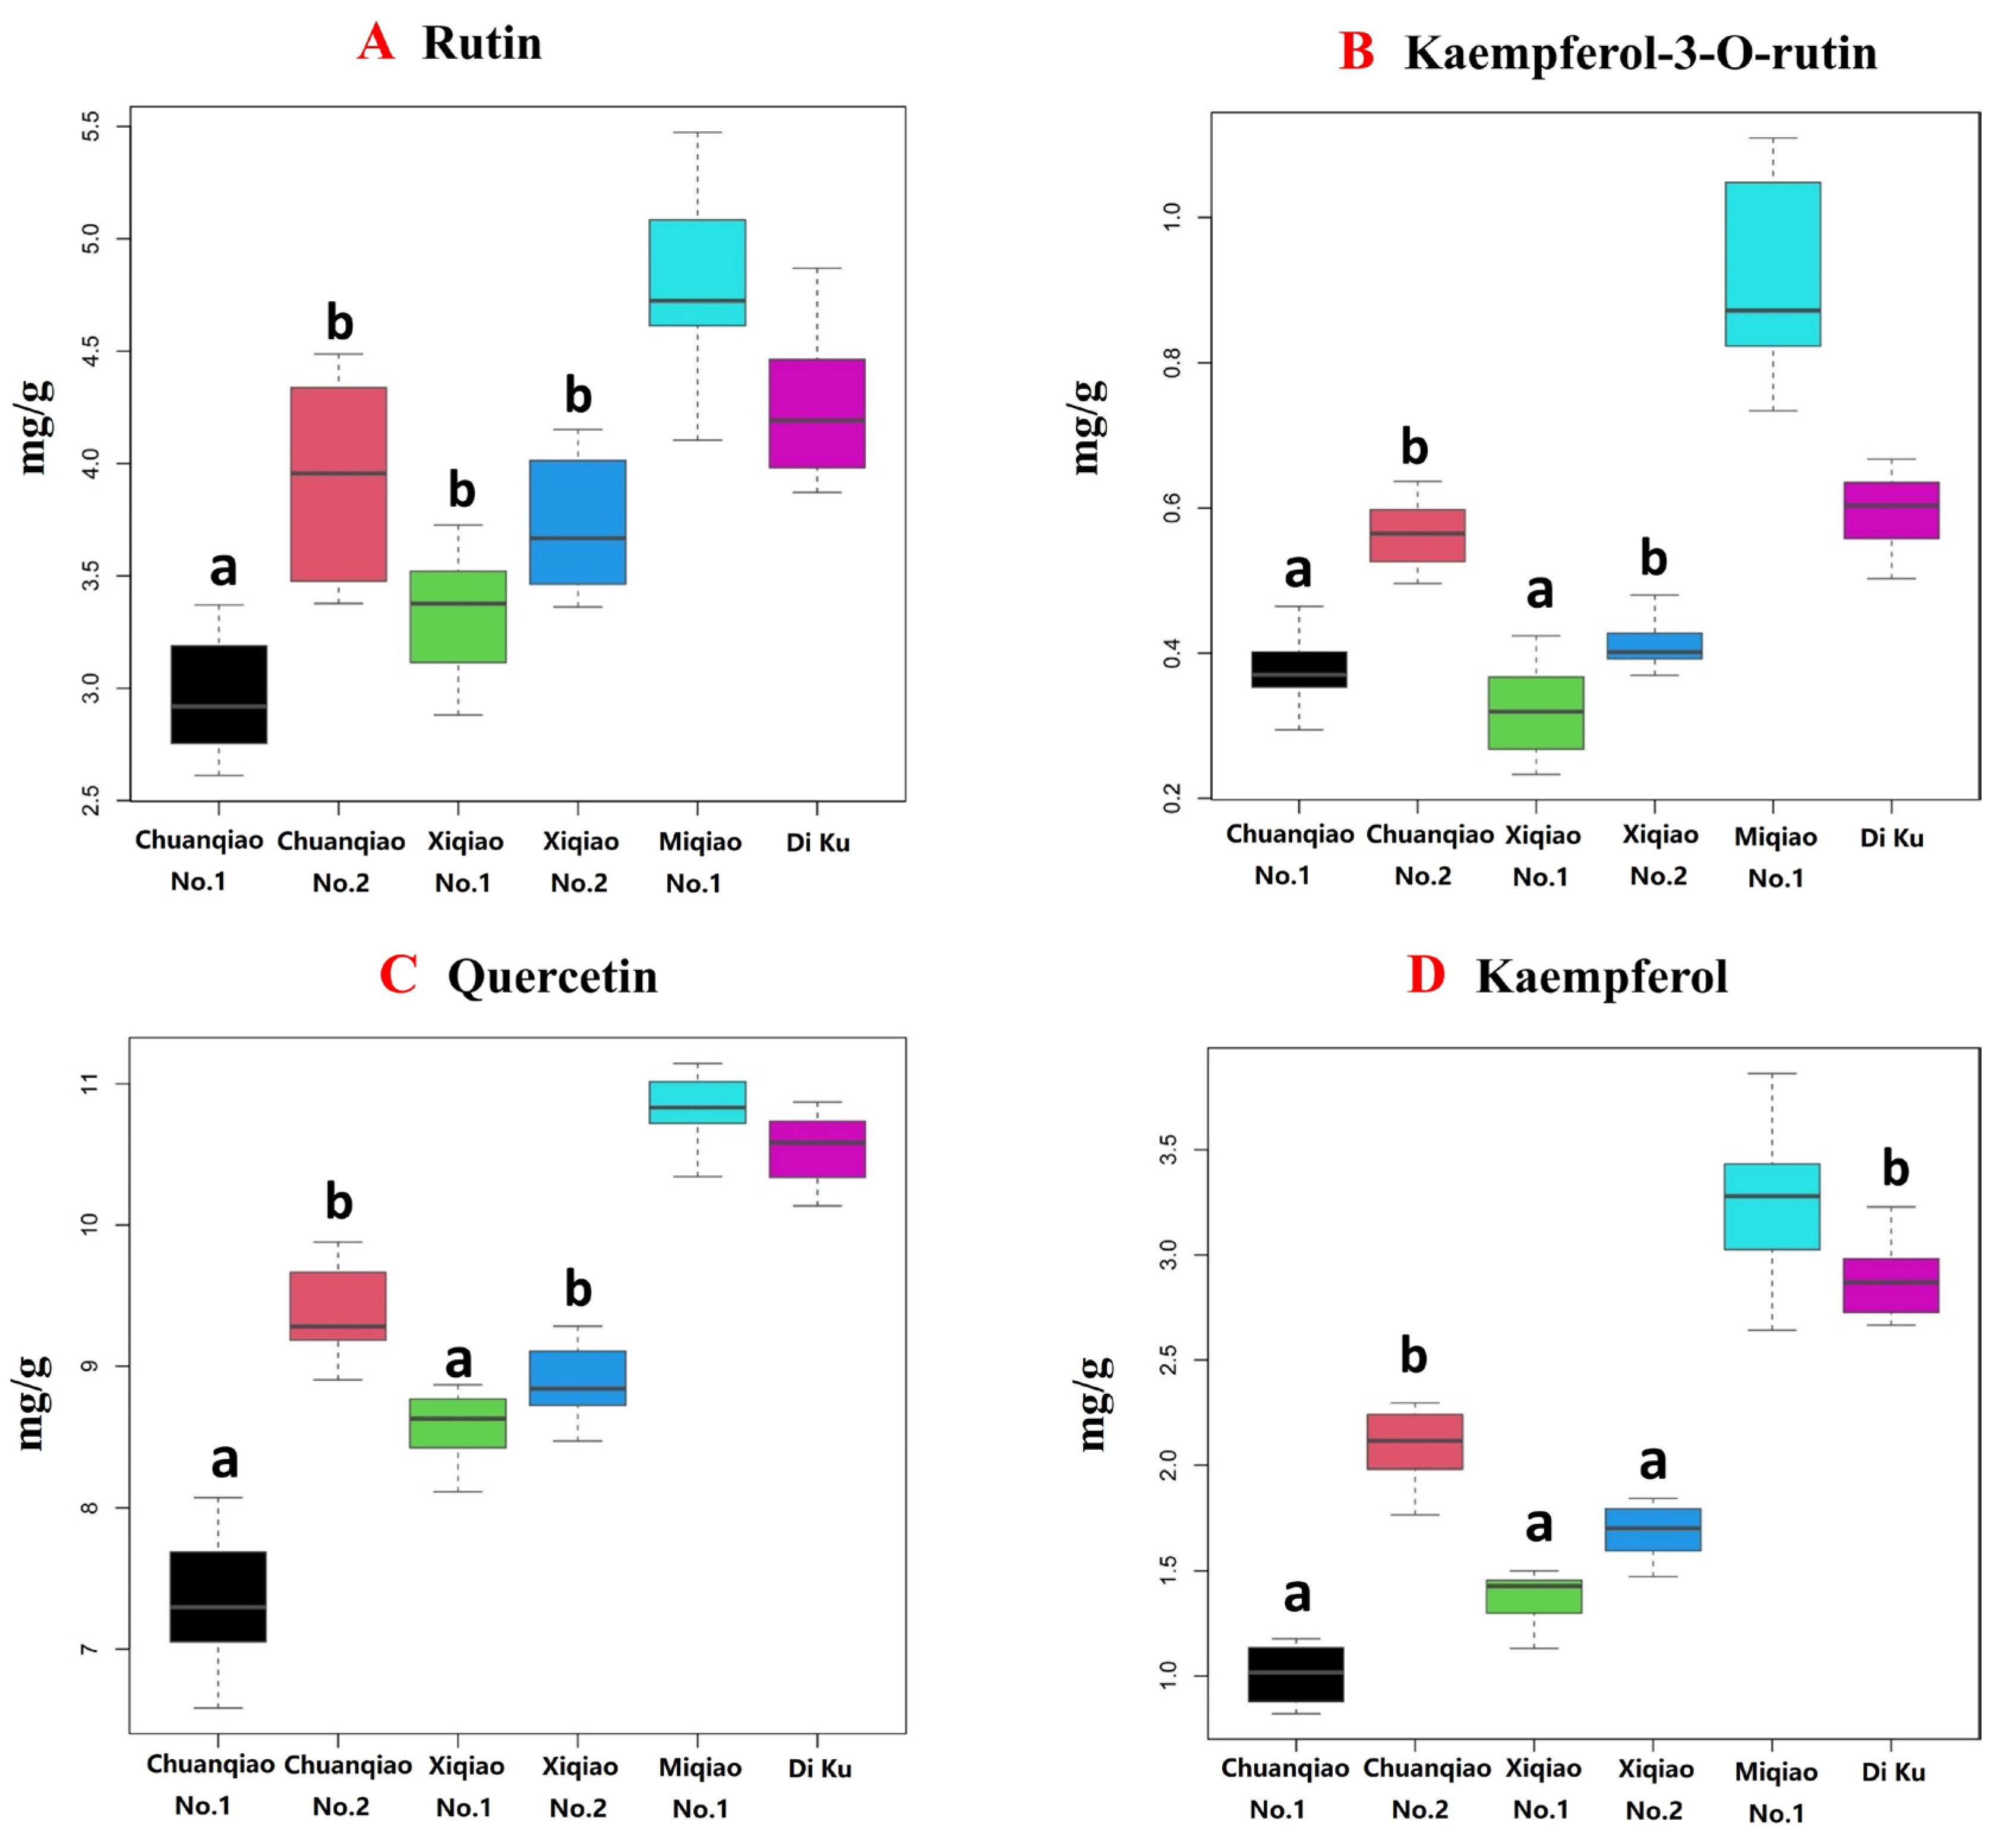
2.2. Analysis of Four Flavonoid Components in Different Varieties of Tartary Buckwheat
2.2.1. Total Ion Flow Diagram and Secondary Mass Spectrometry of Flavonoids in Different Varieties of Tartary Buckwheat
2.2.2. Cluster Analysis of Content Difference in Their Own Metabolites
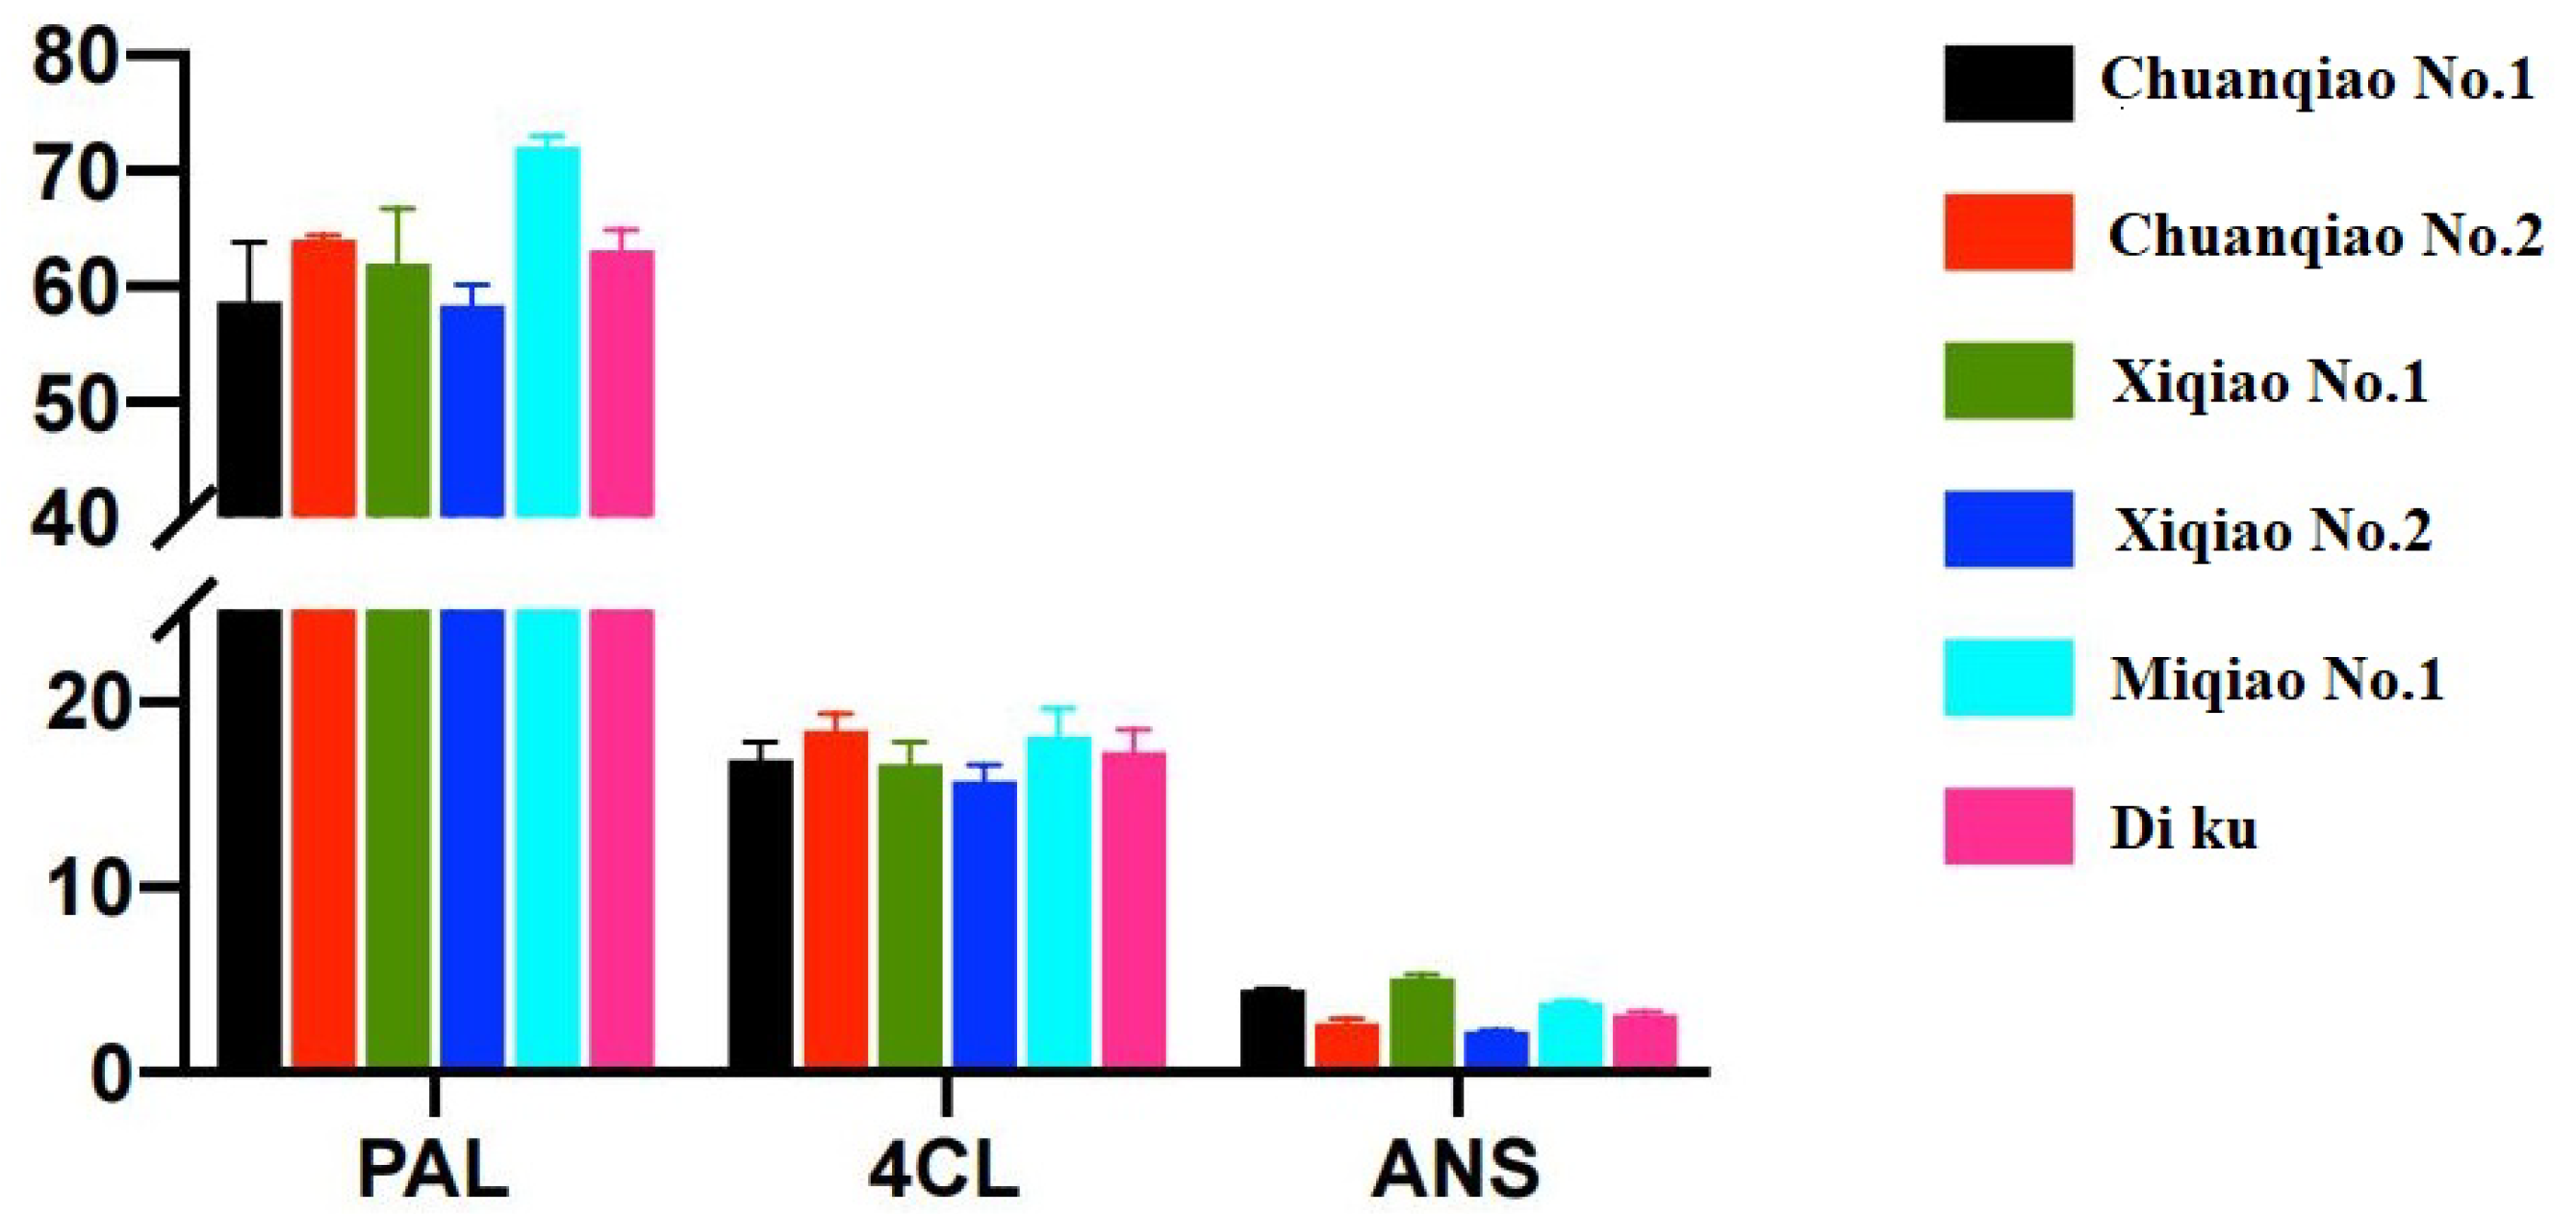
2.3. Expression Analysis of Key Enzyme Genes in Different Varieties of Tartary Buckwheat
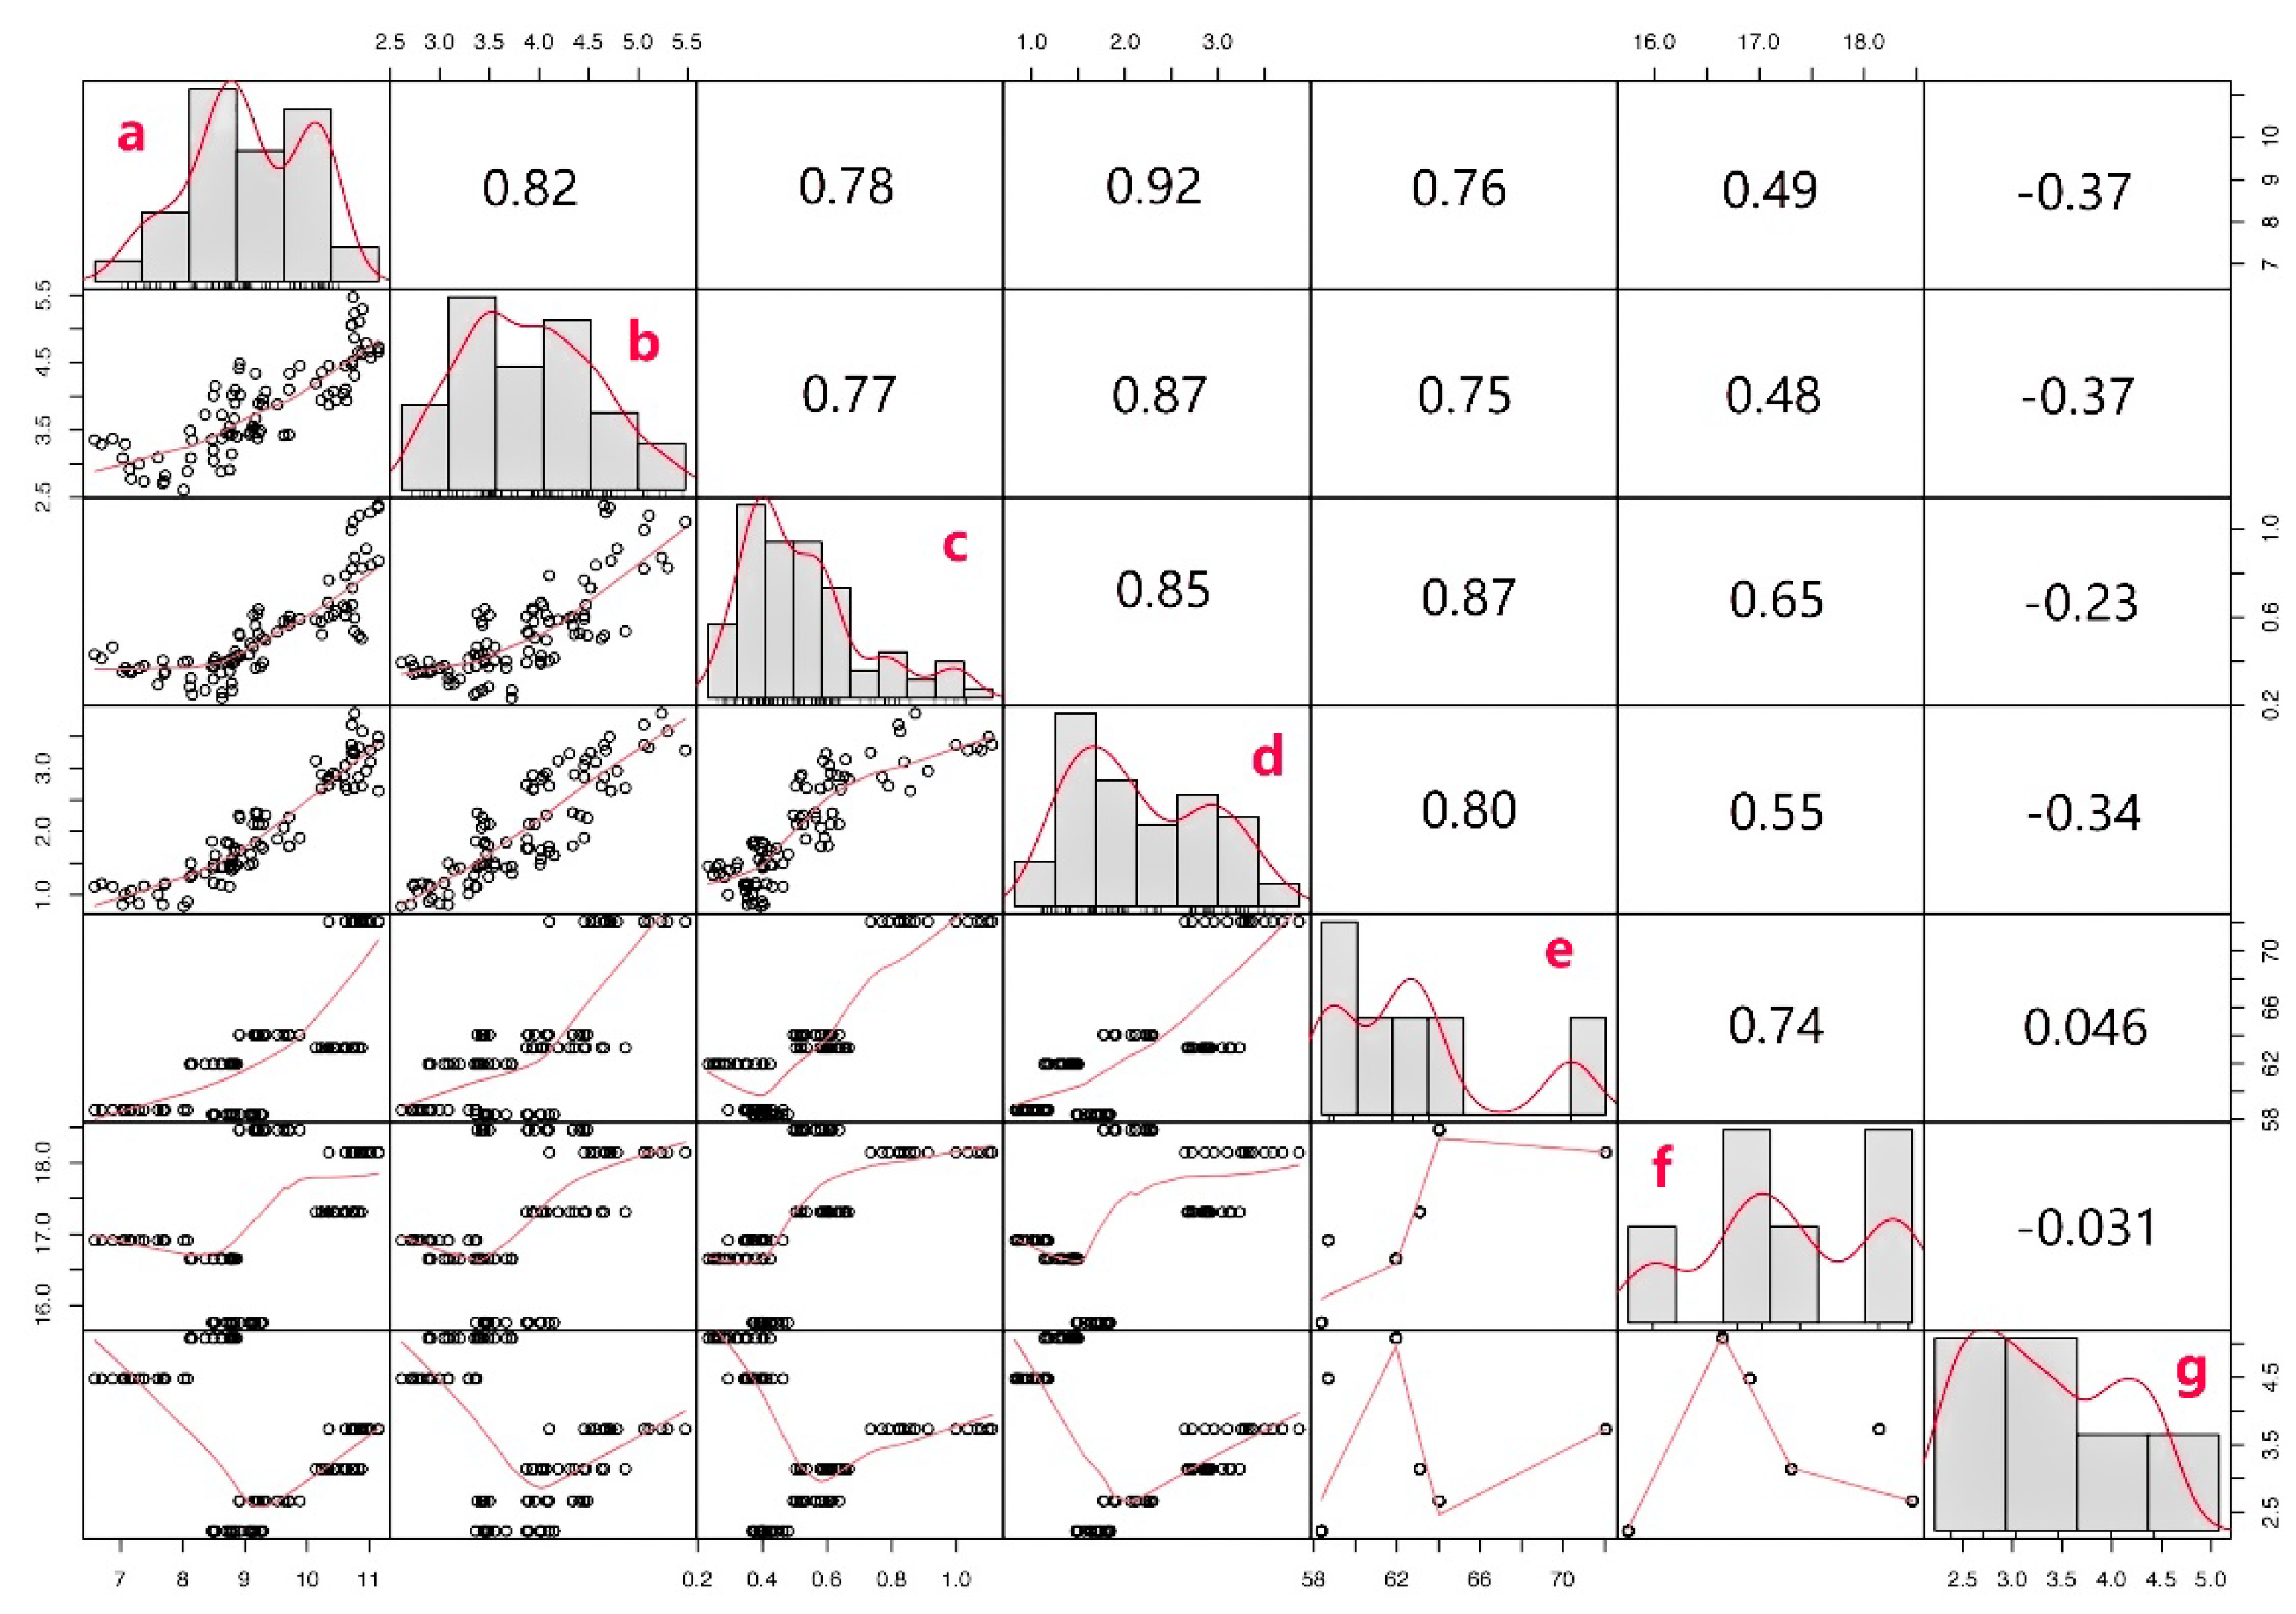
2.4. Correlation Analysis of Enzyme Gene Expression and Content in Tartary Buckwheat
2.5. Effects of Meteorological Factors on the Expression of the Key Enzyme Gene of Flavonoid
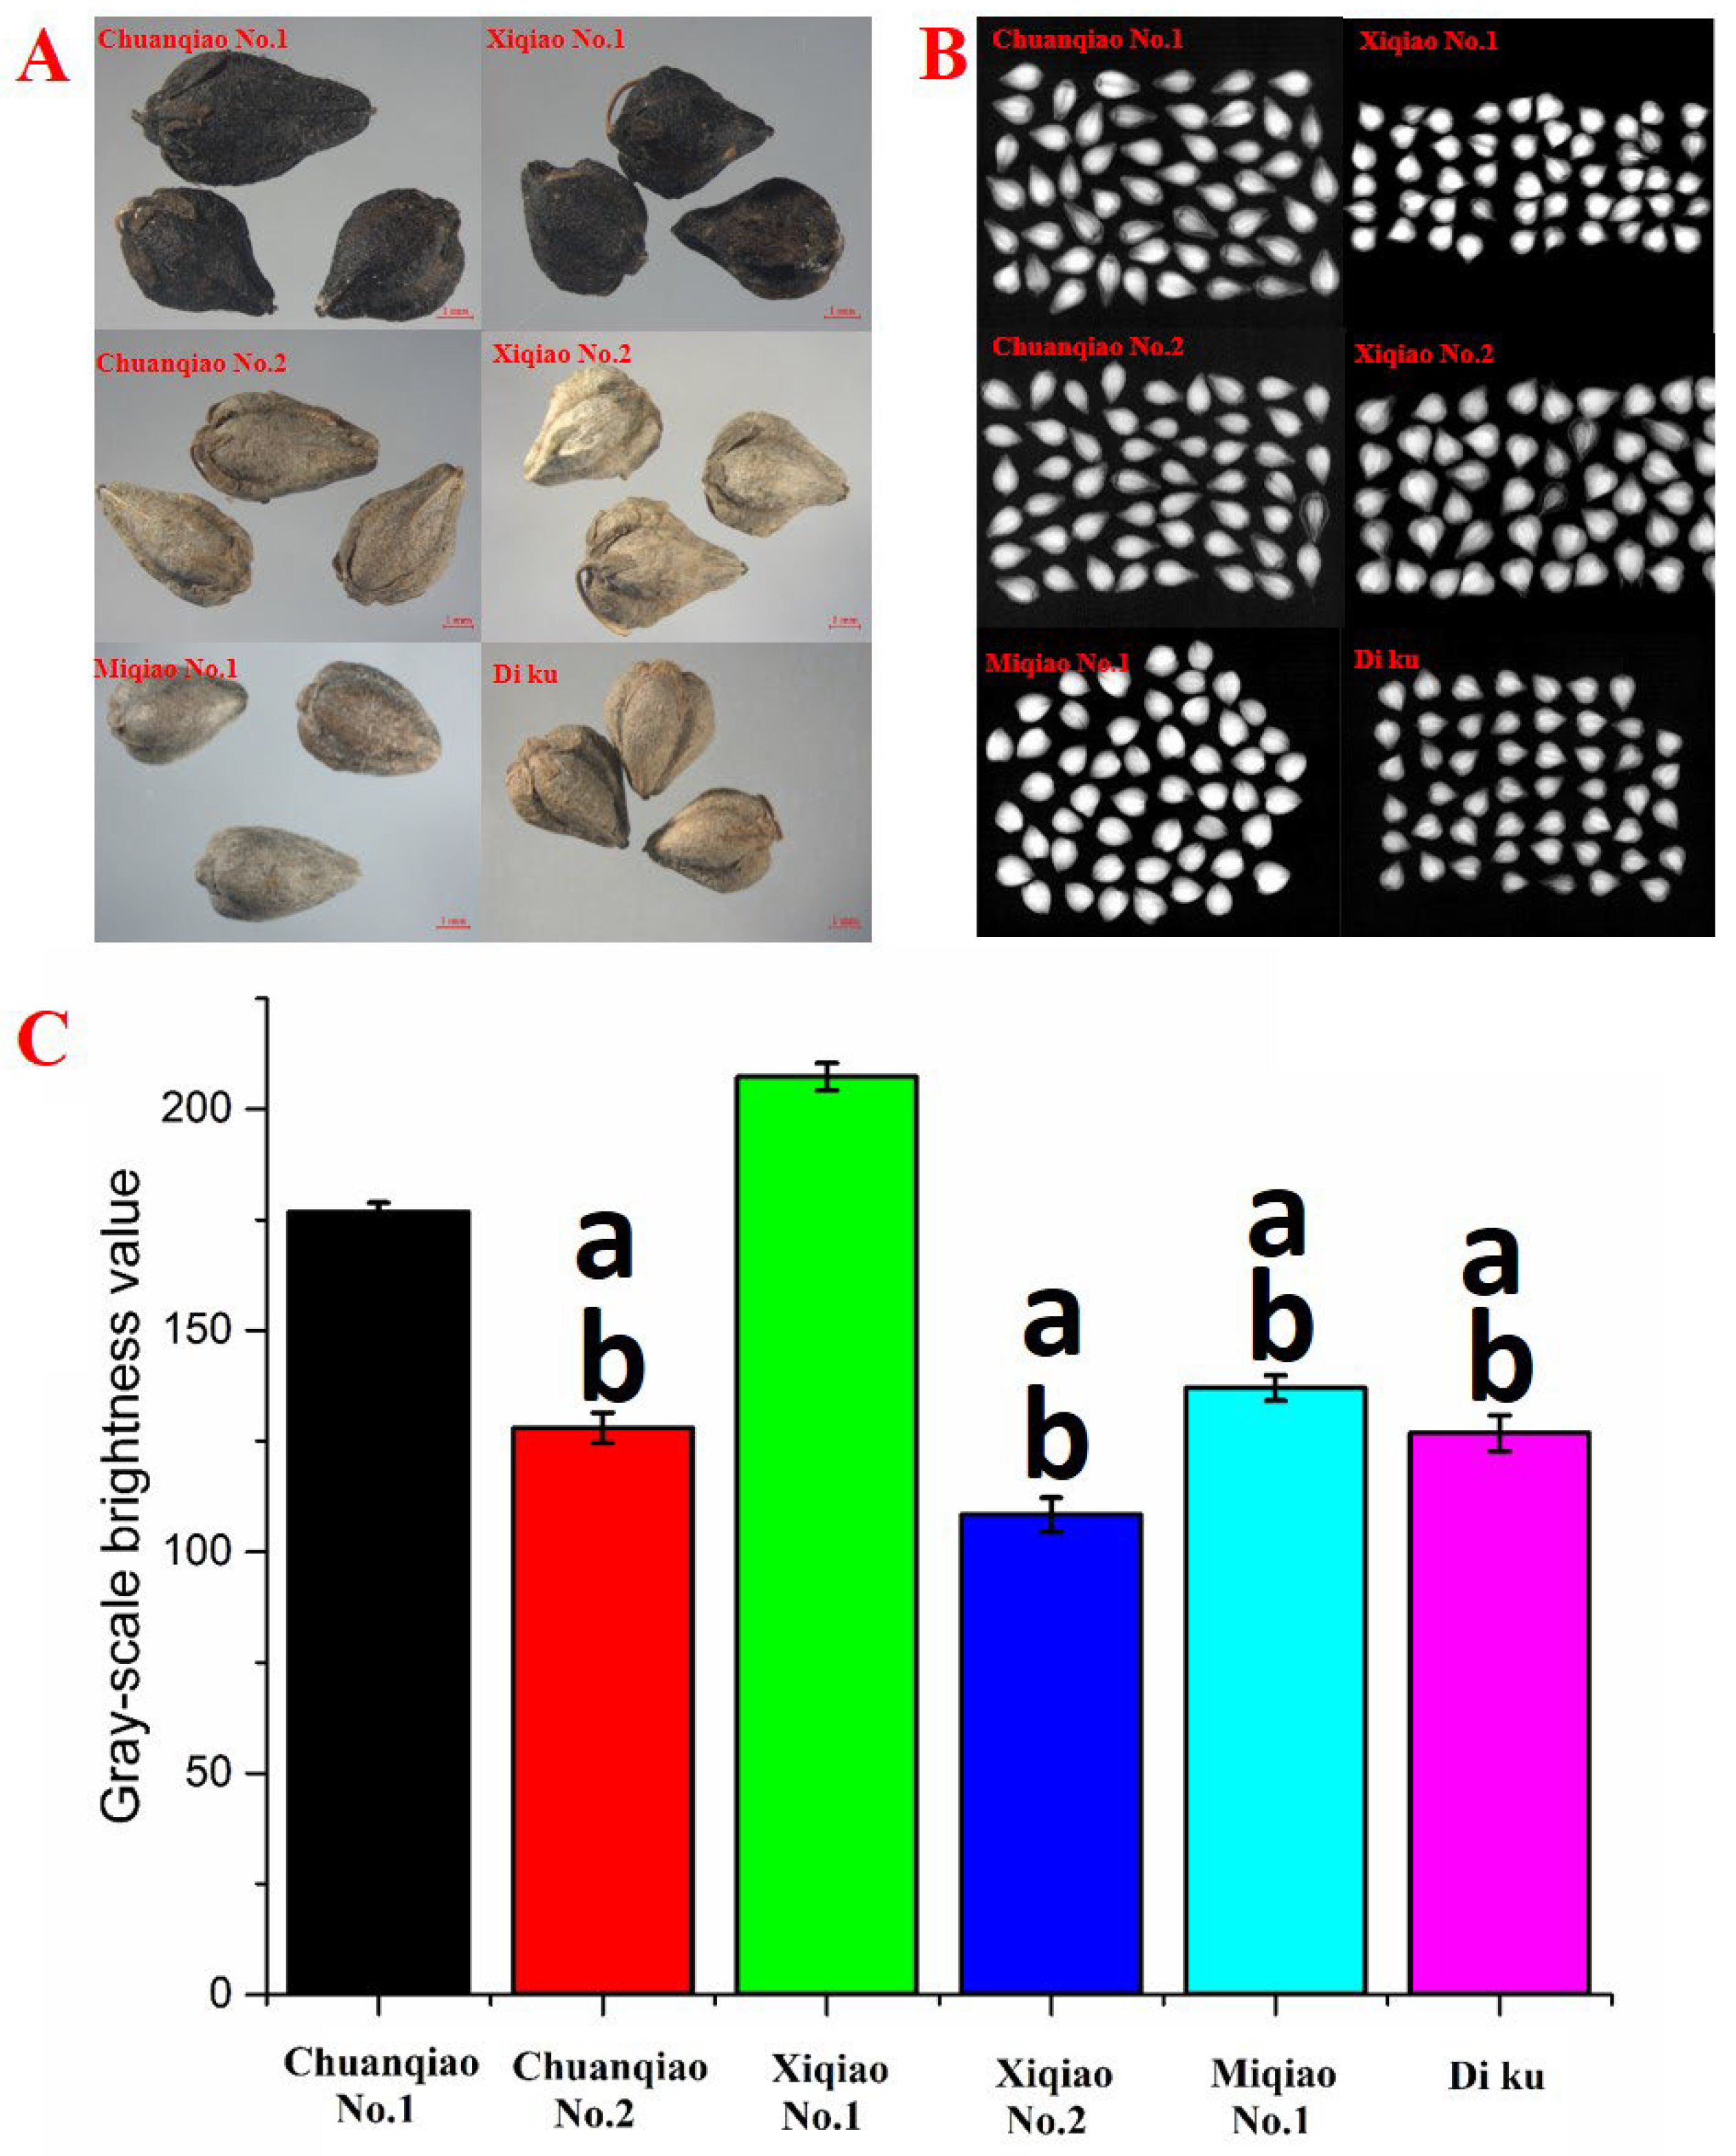
2.6. Effects of Flavonoid Key Enzyme Gene Expression on Seed Coat Color
3. Materials and Methods
3.1. Materials and Reagents
3.2. Meteorological Data Collection
- Tmax: daily maximum temperature (Statistics from 1 March to 30 August 2021 in China Meteorological Network)
- Tmin: daily minimum temperature (Statistics from 1 March to 30 August 2021 in China Meteorological Network)
- Tdif: diurnal temperature difference (the difference between Tmax and Tmin, statistics from 1 March to 30 August 2021)
- Light intensity: the average amount of solar radiation per square meter per day (Statistics from 1 March to 30 August 2021 in China Meteorological Network).
3.3. Extraction Procedure
3.4. Preparation of Mixed Authentic Standards Solution
3.5. Determination of Four Flavonoid Components in Different Varieties of Tartary Buckwheat by UPLC-MS/MS
3.5.1. Chromatographic and Mass Spectrometry Conditions
3.5.2. Method Validation
3.6. RNA Extraction and cDNA Preparation
3.7. Analysis of Tartary Buckwheat Seed Coat Color Difference
3.8. Data Preprocessing and Statistical Analysis
4. Conclusions
Author Contributions
Funding
Institutional Review Board Statement
Informed Consent Statement
Data Availability Statement
Conflicts of Interest
References
- Zielińska, D.; Turemko, M.; Kwiatkowski, J.; Zieliński, H. Evaluation of Flavonoid Contents and Antioxidant Capacity of the Aerial Parts of Common and Tartary Buckwheat Plants. Molecules 2012, 17, 9668–9682. [Google Scholar] [CrossRef] [PubMed]
- Zhang, J.M.; Wang, D.; Wu, Y.H.; Li, W.; Hu, Y.C.; Zhao, G.; Fu, C.M.; Fu, S.; Zou, L. Lipid–Polymer Hybrid Nanoparticles for Oral Delivery of Tartary Buckwheat Flavonoids. J. Agric. Food Chem. 2018, 66, 4923–4932. [Google Scholar] [CrossRef] [PubMed]
- Zhang, K.X.; He, M.; Fan, Y.; Zhao, H.; Gao, B.; Yang, K.L.; Li, F.L.; Tang, Y.; Gao, Q.; Lin, T.; et al. Resequencing of global Tartary buckwheat accessions reveals multiple domestication events and key loci associated with agronomic traits. Genome Biol. 2021, 22, 1–17. [Google Scholar] [CrossRef] [PubMed]
- Zou, L.; Wu, D.; Ren, G.; Hu, Y.; Peng, L.; Zhao, J.; Garcia-Perez, P.; Carpena, M.; Prieto, M.A.; Cao, H.; et al. Bioactive compounds, health benefits, and industrial ap-plications of Tartary buckwheat (Fagopyrum tataricum). Crit. Rev. Food Sci. Nutr. 2021, 19, 1–17. [Google Scholar] [CrossRef] [PubMed]
- Zhu, F. Chemical composition and health effects of Tartary buckwheat. Food Chem. 2016, 203, 231–245. [Google Scholar] [CrossRef]
- Huang, Y.; Liang, D.; Xia, H.; Lin, L.J.; Wang, J.; Lv, X.L. Lignin and Quercetin Synthesis Underlies Berry Russeting in ‘Sunshine Muscat’ Grape. Biomolecules 2020, 10, 690. [Google Scholar] [CrossRef]
- Yao, Y.J.; Sun, L.; Wu, W.J.; Wang, S.; Xiao, X.; Hu, M.L.; Li, C.L.; Zhao, H.X.; Chen, H.; Wu, Q. Genome-Wide Investigation of Major Enzyme-Encoding Genes in the Flavonoid Metabolic Pathway in Tartary Buckwheat (Fagopyrum tataricum). J. Mol. Evol. 2021, 89, 269–286. [Google Scholar] [CrossRef]
- Li, X.H.; Kim, Y.B.; Kim, Y.; Zhao, S.C.; Kim, H.H.; Chung, E.; Lee, J.-H.; Park, S.U. Differential stress-response expression of two flavonol synthase genes and accumulation of flavonols in tartary buckwheat. J. Plant Physiol. 2013, 170, 1630–1636. [Google Scholar] [CrossRef]
- Zhang, L.J.; Li, X.; Ma, B.; Gao, Q.; Du, H.L.; Han, Y.H.; Li, Y.; Cao, Y.H.; Qi, M.; Zhu, Y.X.; et al. The Tartary Buckwheat Genome Provides Insights into Rutin Biosynthesis and Abiotic Stress Tolerance. Mol. Plant 2017, 10, 1224–1237. [Google Scholar] [CrossRef] [Green Version]
- Tian, L.; Pang, Y.; Dixon, R.A. Biosynthesis and genetic engineering of proanthocyanidins and (iso)flavonoids. Phytochem. Rev. 2007, 7, 445–465. [Google Scholar] [CrossRef]
- Guo, Y.; Wang, T.; Fu, F.-F.; El-Kassaby, Y.A.; Wang, G. Temporospatial Flavonoids Metabolism Variation in Ginkgo biloba Leaves. Front. Genet. 2020, 11, 589326. [Google Scholar] [CrossRef] [PubMed]
- Ramadan, A.; Ahmed, E.S.; Abdel-Gayed, M.A.; Kabeil, S.A.; Hafez, E.E. Induction of Structural Genes Expression of Onion Encoding Flavonoids and Anthocyanine Biosynthetic Enzymes as Defense Reaction Against Botrytis aclada Infection. Asian Acad. Res. J. Multidiscip. 2015, 02, 118–132. [Google Scholar]
- Li, X.H.; Park, N.I.; Xu, H.; Woo, S.-H.; Park, C.H.; Park, S.U. Differential Expression of Flavonoid Biosynthesis Genes and Accumulation of Phenolic Compounds in Common Buckwheat (Fagopyrum esculentum). J. Agric. Food Chem. 2010, 58, 12176–12181. [Google Scholar] [CrossRef] [PubMed]
- Jing, R.; Li, H.-Q.; Hu, C.-L.; Jiang, Y.-P.; Qin, L.-P.; Zheng, C.-J. Phytochemical and Pharmacological Profiles of Three Fagopyrum Buckwheats. Int. J. Mol. Sci. 2016, 17, 589. [Google Scholar] [CrossRef] [Green Version]
- Song, Y.J.; Feng, J.C.; Liu, D.M.; Long, C.L. Different Phenylalanine Pathway Responses to Cold Stress Based on Metabolomics and Transcriptomics in Tartary Buckwheat Landraces. J. Agric. Food Chem. 2022, 70, 687–698. [Google Scholar] [CrossRef]
- Zhu, Z.H.; Wen, D.; Zhang, D.; Chao, E.K.; Dong, G.Q.; Du, W.; Sun, W.; Dziedzic, K.; Shi, Y.H.; Xue, J.P. Molecular mechanisms of UVB-induced flavonoid accumulation in Fagopyrum tataricum. Chin. Herb. Med. 2021, 52, 6–12. [Google Scholar]
- Park, B.I.; Kim, J.; Lee, K.; Lim, T.; Hwang, K.T. Flavonoids in common and tartary buckwheat hull extracts and antioxidant activity of the extracts against lipids in mayonnaise. J. Food Sci. Technol. 2019, 56, 2712–2720. [Google Scholar] [CrossRef] [PubMed]
- Zhang, D.; Jiang, C.; Huang, C.; Wen, D.; Lu, J.; Chen, S.; Zhang, T.; Shi, Y.; Xue, J.; Ma, W.; et al. The light-induced transcription factor FtMYB116 promotes accumulation of rutin in Fagopyrum tataricum. Plant Cell Environ. 2019, 42, 1340–1351. [Google Scholar] [CrossRef] [PubMed]
- Choi, M.; Sathasivam, R.; Van Nguyen, B.; Park, N.I.; Woo, S.-H.; Park, S.U. Expression Analysis of Phenylpropanoid Pathway Genes and Metabolomic Analysis of Phenylpropanoid Compounds in Adventitious, Hairy, and Seedling Roots of Tartary Buckwheat. Plants 2021, 11, 90. [Google Scholar] [CrossRef]
- Cheng, L.J.; Liu, J.; Mao, J.Q.; Li, C.; Liu, H.J. Effects of different light on the expression of flavonoids and related metabolic enzymes in buckwheat buds. Food Sci. 2021, 42, 72–79. [Google Scholar]
- Zhang, J.B.; Wang, Y.; Xu, L.; Chen, Z.Y.; Ding, M. Content Determination and Analysis of Flavonoids in Buckwheat from Different Areas. Food Res. Dev. 2018, 39, 143–148. [Google Scholar]
- Yang, W.; Su, Y.; Dong, G.Q.; Qian, G.T.; Shi, Y.H.; Mi, Y.L.; Zhang, Y.M.; Xue, J.P.; Du, W.; Shi, T.X.; et al. Liquid chromatography-mass spectrometry-based metabolomics analysis of flavonoids and anthra-quinones in Fagopyrum tataricum L. Gaertn. (Tartary buckwheat) seeds to trace morphological variations. Food Chem. 2020, 331, 127354. [Google Scholar] [CrossRef] [PubMed]
- Zhang, X.; Long, Y.; Huang, J.; Xia, J.X. OsNAC45 is Involved in ABA Response and Salt Tolerance in Rice. Rice 2020, 13, 79. [Google Scholar] [CrossRef] [PubMed]
- Siles, L.; Eastmond, P.; Kurup, S. Big data from small tissues: Extraction of high-quality RNA for RNA-sequencing from dif-ferent oilseed Brassica seed tissues during seed development. Plant Methods 2020, 16, 80. [Google Scholar] [CrossRef] [PubMed]
- Jensen, J.M.B.; Petersen, M.S.; Stegger, M.; Østergaard, L.; Møller, B.K. Real-Time Relative qPCR without Reference to Control Samples and Estimation of Run-Specific PCR Parameters from Run-Internal Mini-Standard Curves. PLoS ONE 2010, 5, e11723. [Google Scholar] [CrossRef] [Green Version]


| 1 Comps | 2 Comps | 3 Comps | |
|---|---|---|---|
| X | 47.80 | 63.29 | 99.8 |
| Y | 31.83 | 39.71 | 39.8 |
| Regression Equation (1) | CompY = 5.383 + 4.447 compx1 + 4.184 compx2 + 4.179 compx3 | ||
| CompX Equation (2) | Compx1 = 0.22 Tmax − 0.18 Tmin + 0.73 Tdif + 1.51 light intensity + 1.13 Tdif: light intensity | ||
| 1 Comps | 2 Comps | 3 Comps | |
|---|---|---|---|
| X | 35.57 | 60.45 | 100 |
| Y | 46.55 | 49.28 | 49.59 |
| Regression Equation (1) | CompY = 2.781 + 2.033 compx1 + 1.981 compx2 + 1.975 compx3 | ||
| CompX Equation (2) | Compx1 = −0.33 Tmax − 0.74 Tmin + 0.76 Tdif + 1.17 light intensity | ||
| 1 Comps | 2 Comps | 3 Comps | |
|---|---|---|---|
| X | 34.61 | 89.41 | 100.00 |
| Y | 93.71 | 95.00 | 96.06 |
| Regression Equation (1) | CompY = 33.88 + 8.503compx1 + 7.582 compx2 + 6.731 compx3 | ||
| CompX Equation (2) | Compx1 = −4.50 PAL − 3.86 4CL + 31.94 ANS | ||
| Varieties | Batch | Sample Number | Producing Area | Harvest Time |
|---|---|---|---|---|
| Chuanqiao No. 1 | 20,210,501 | S1 | Jintang Wufeng town, Chengdu | August 2021 |
| 20,210,502 | S2 | |||
| 20,210,503 | S3 | |||
| 20,210,504 | S4 | |||
| 20,210,505 | S5 | |||
| Chuanqiao No. 2 | 20,210,601 | S6 | Jintang Wufeng town, Chengdu | August 2021 |
| 20,210,602 | S7 | |||
| 20,210,603 | S8 | |||
| 20,210,604 | S9 | |||
| 20,210,605 | S10 | |||
| Xiqiao No. 1 | 20,200,601 | S11 | Jintang Wufeng town, Chengdu | August 2021 |
| 20,200,602 | S12 | |||
| 20,200,603 | S13 | |||
| 20,200,604 | S14 | |||
| 20,200,605 | S15 | |||
| Xiqiao No. 2 | 20,200,601 | S16 | Jintang Wufeng town, Chengdu | August 2021 |
| 20,200,602 | S17 | |||
| 20,200,603 | S18 | |||
| 20,200,604 | S19 | |||
| 20,200,605 | S20 | |||
| Miqiao No. 1 | 20,210,701 | S21 | Liangshan Zhaojue Agricultural Science Institute, Sichuan | July 2021 |
| 20,210,702 | S22 | |||
| 20,210,703 | S23 | |||
| 20,210,704 | S24 | |||
| 20,210,705 | S25 | |||
| Di ku | 20,200,701 | S26 | Diqing Agricultural Science Institute, Yunnan | August 2021 |
| 20,200,702 | S27 | |||
| 20,200,703 | S28 | |||
| 20,200,704 | S29 | |||
| 20,200,705 | S30 |
| Compound | Ionization Mode | Quantitative Ion Pair (m/z) | Collision Energy (V) |
|---|---|---|---|
| Rutin | Negative | 609/271 | 55.00 |
| Kaempferol-3-O-rutin glycoside | Negative | 593/255 | 52.01 |
| Quercetin | Negative | 301/178 | 16.50 |
| Kaempferol | Negative | 285/239 | 26.31 |
| Compound | Regression Equation | Correlation Coefficient (r) | Linear Range (μg·mL−1) | LOD (ng·mL−1) | LOQ (ng·mL−1) |
|---|---|---|---|---|---|
| Rutin | Y = 66,400X + 541,200 | 0.9945 | 0.018~281.20 | 13.78 | 41.25 |
| Kaempferol-3-O-rutin | Y = 81,000X + 468,700 | 0.9923 | 0.013~202.40 | 5.13 | 13.47 |
| Quercetin | Y = 42,900X + 338,900 | 0.9940 | 0.018~283.20 | 8.28 | 23.89 |
| Kaempferol | Y = 2469.4X + 11,334 | 0.9930 | 0.012~201.60 | 8.98 | 28.40 |
| Gene | Former Primer | Post Primer |
|---|---|---|
| PAL | ACAAGGCGTTACATGGAGGA | CCAAGCTAGGGTTTCTCCCA |
| 4CL | GCAACCATAGACGCTCAAGG | TGCATCGGCTATGGATGGAT |
| ANS | GGAAGTAGGAGGGATAGAGGA | TGGAGAATGAAGGTCAAGGCA |
Publisher’s Note: MDPI stays neutral with regard to jurisdictional claims in published maps and institutional affiliations. |
© 2022 by the authors. Licensee MDPI, Basel, Switzerland. This article is an open access article distributed under the terms and conditions of the Creative Commons Attribution (CC BY) license (https://creativecommons.org/licenses/by/4.0/).
Share and Cite
Wang, D.; Yang, T.; Li, Y.; Deng, F.; Dong, S.; Li, W.; He, Y.; Zhang, J.; Zou, L. Light Intensity—A Key Factor Affecting Flavonoid Content and Expression of Key Enzyme Genes of Flavonoid Synthesis in Tartary Buckwheat. Plants 2022, 11, 2165. https://doi.org/10.3390/plants11162165
Wang D, Yang T, Li Y, Deng F, Dong S, Li W, He Y, Zhang J, Zou L. Light Intensity—A Key Factor Affecting Flavonoid Content and Expression of Key Enzyme Genes of Flavonoid Synthesis in Tartary Buckwheat. Plants. 2022; 11(16):2165. https://doi.org/10.3390/plants11162165
Chicago/Turabian StyleWang, Di, Tao Yang, Yangqian Li, Fang Deng, Shuai Dong, Wei Li, Yueyue He, Jinming Zhang, and Liang Zou. 2022. "Light Intensity—A Key Factor Affecting Flavonoid Content and Expression of Key Enzyme Genes of Flavonoid Synthesis in Tartary Buckwheat" Plants 11, no. 16: 2165. https://doi.org/10.3390/plants11162165