
NMR Metabolomics and Chemometrics of Lettuce, Lactuca sativa L., under Different Foliar Organic Fertilization Treatments

 , , , , ,
Abstract
:1. Introduction
2. Results
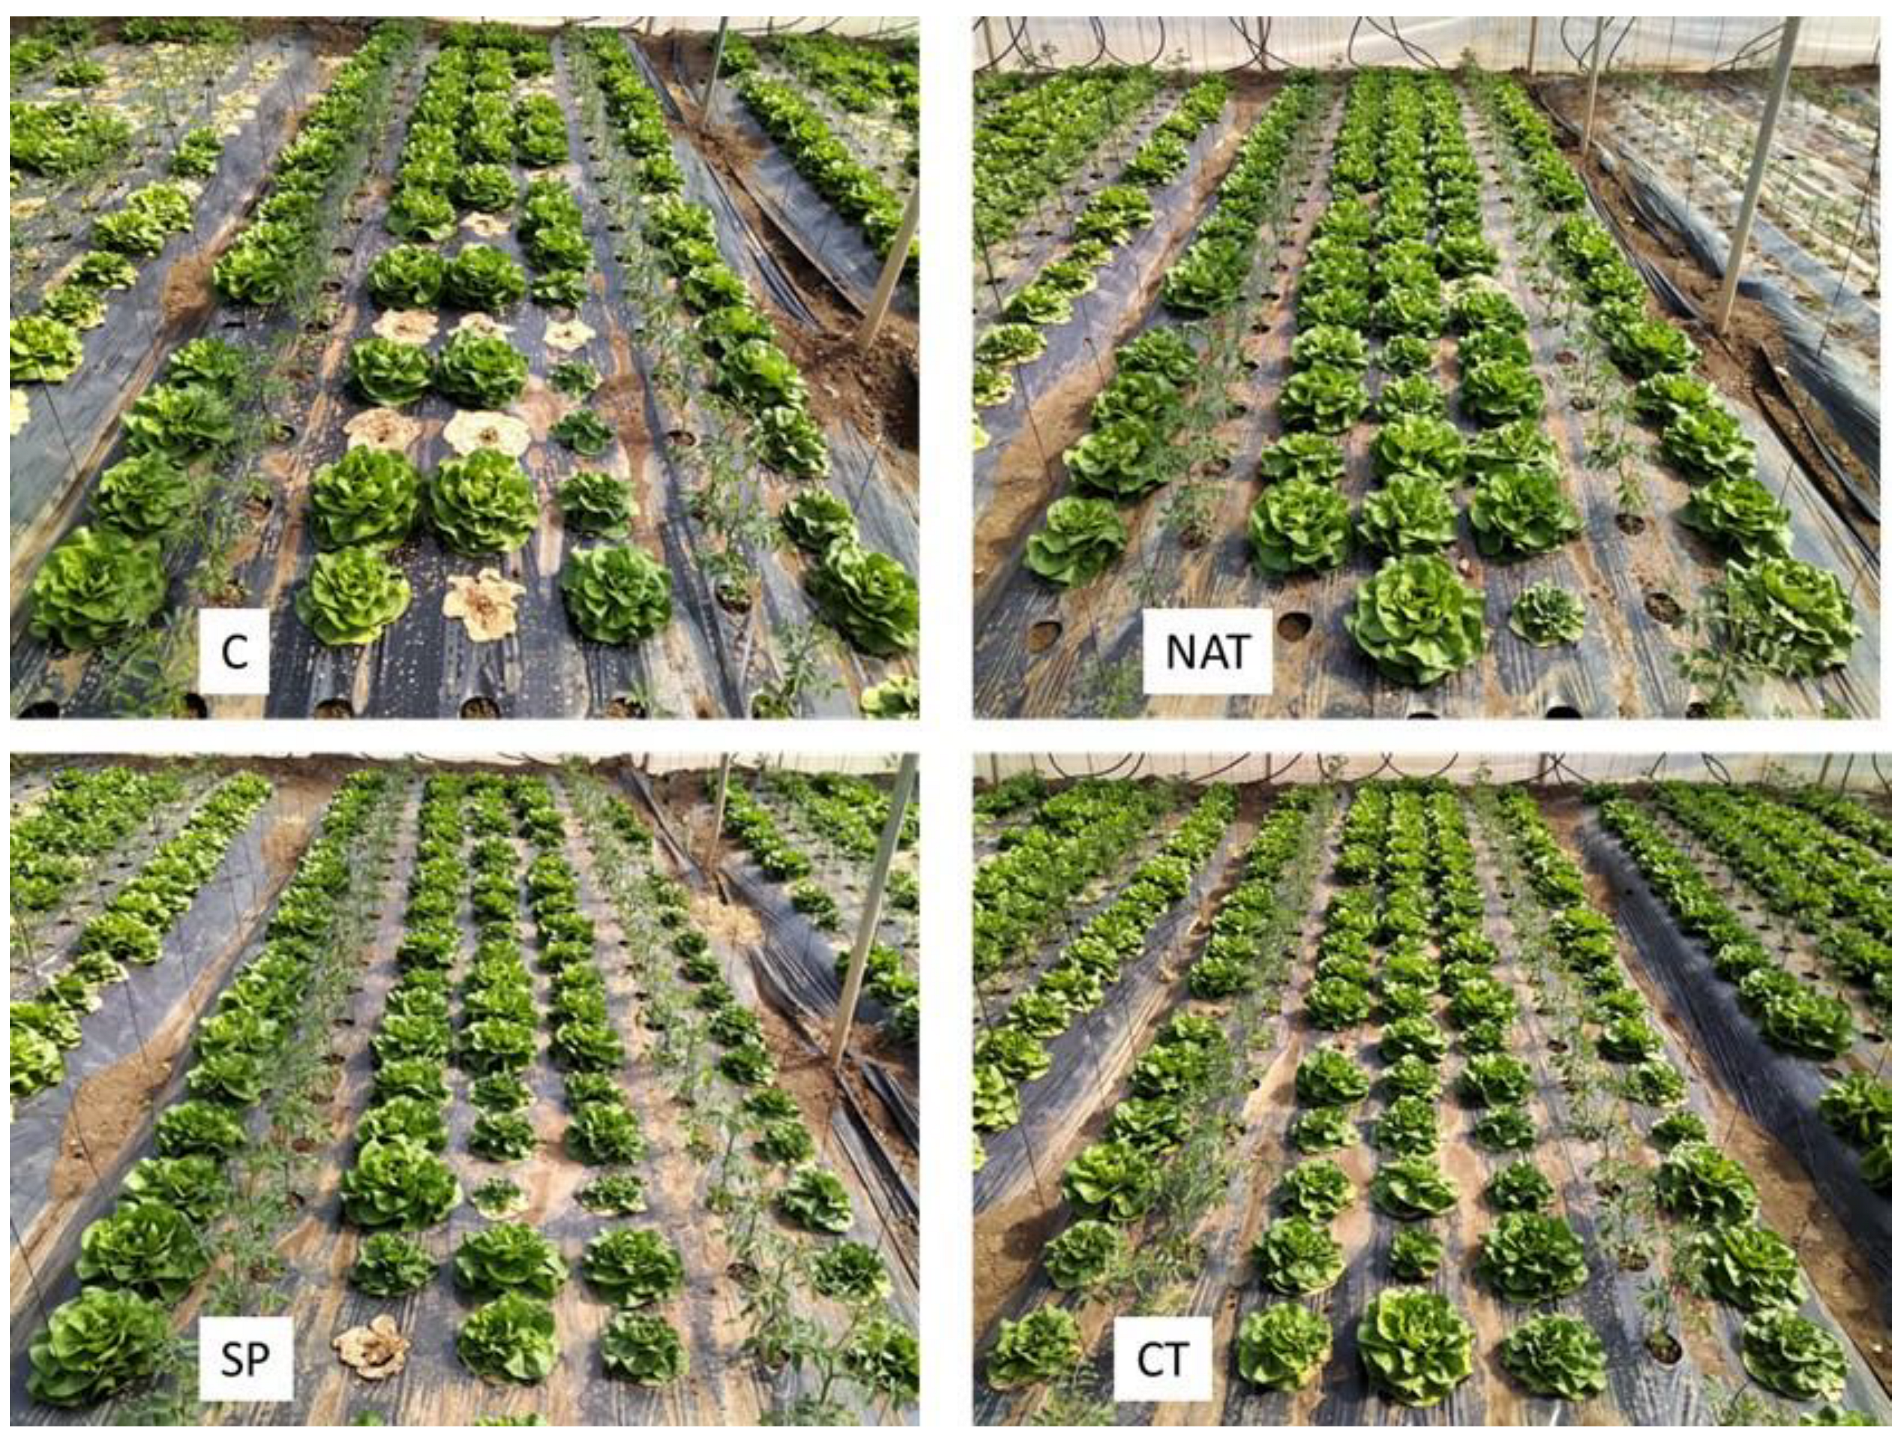
2.1. Plant Analysis
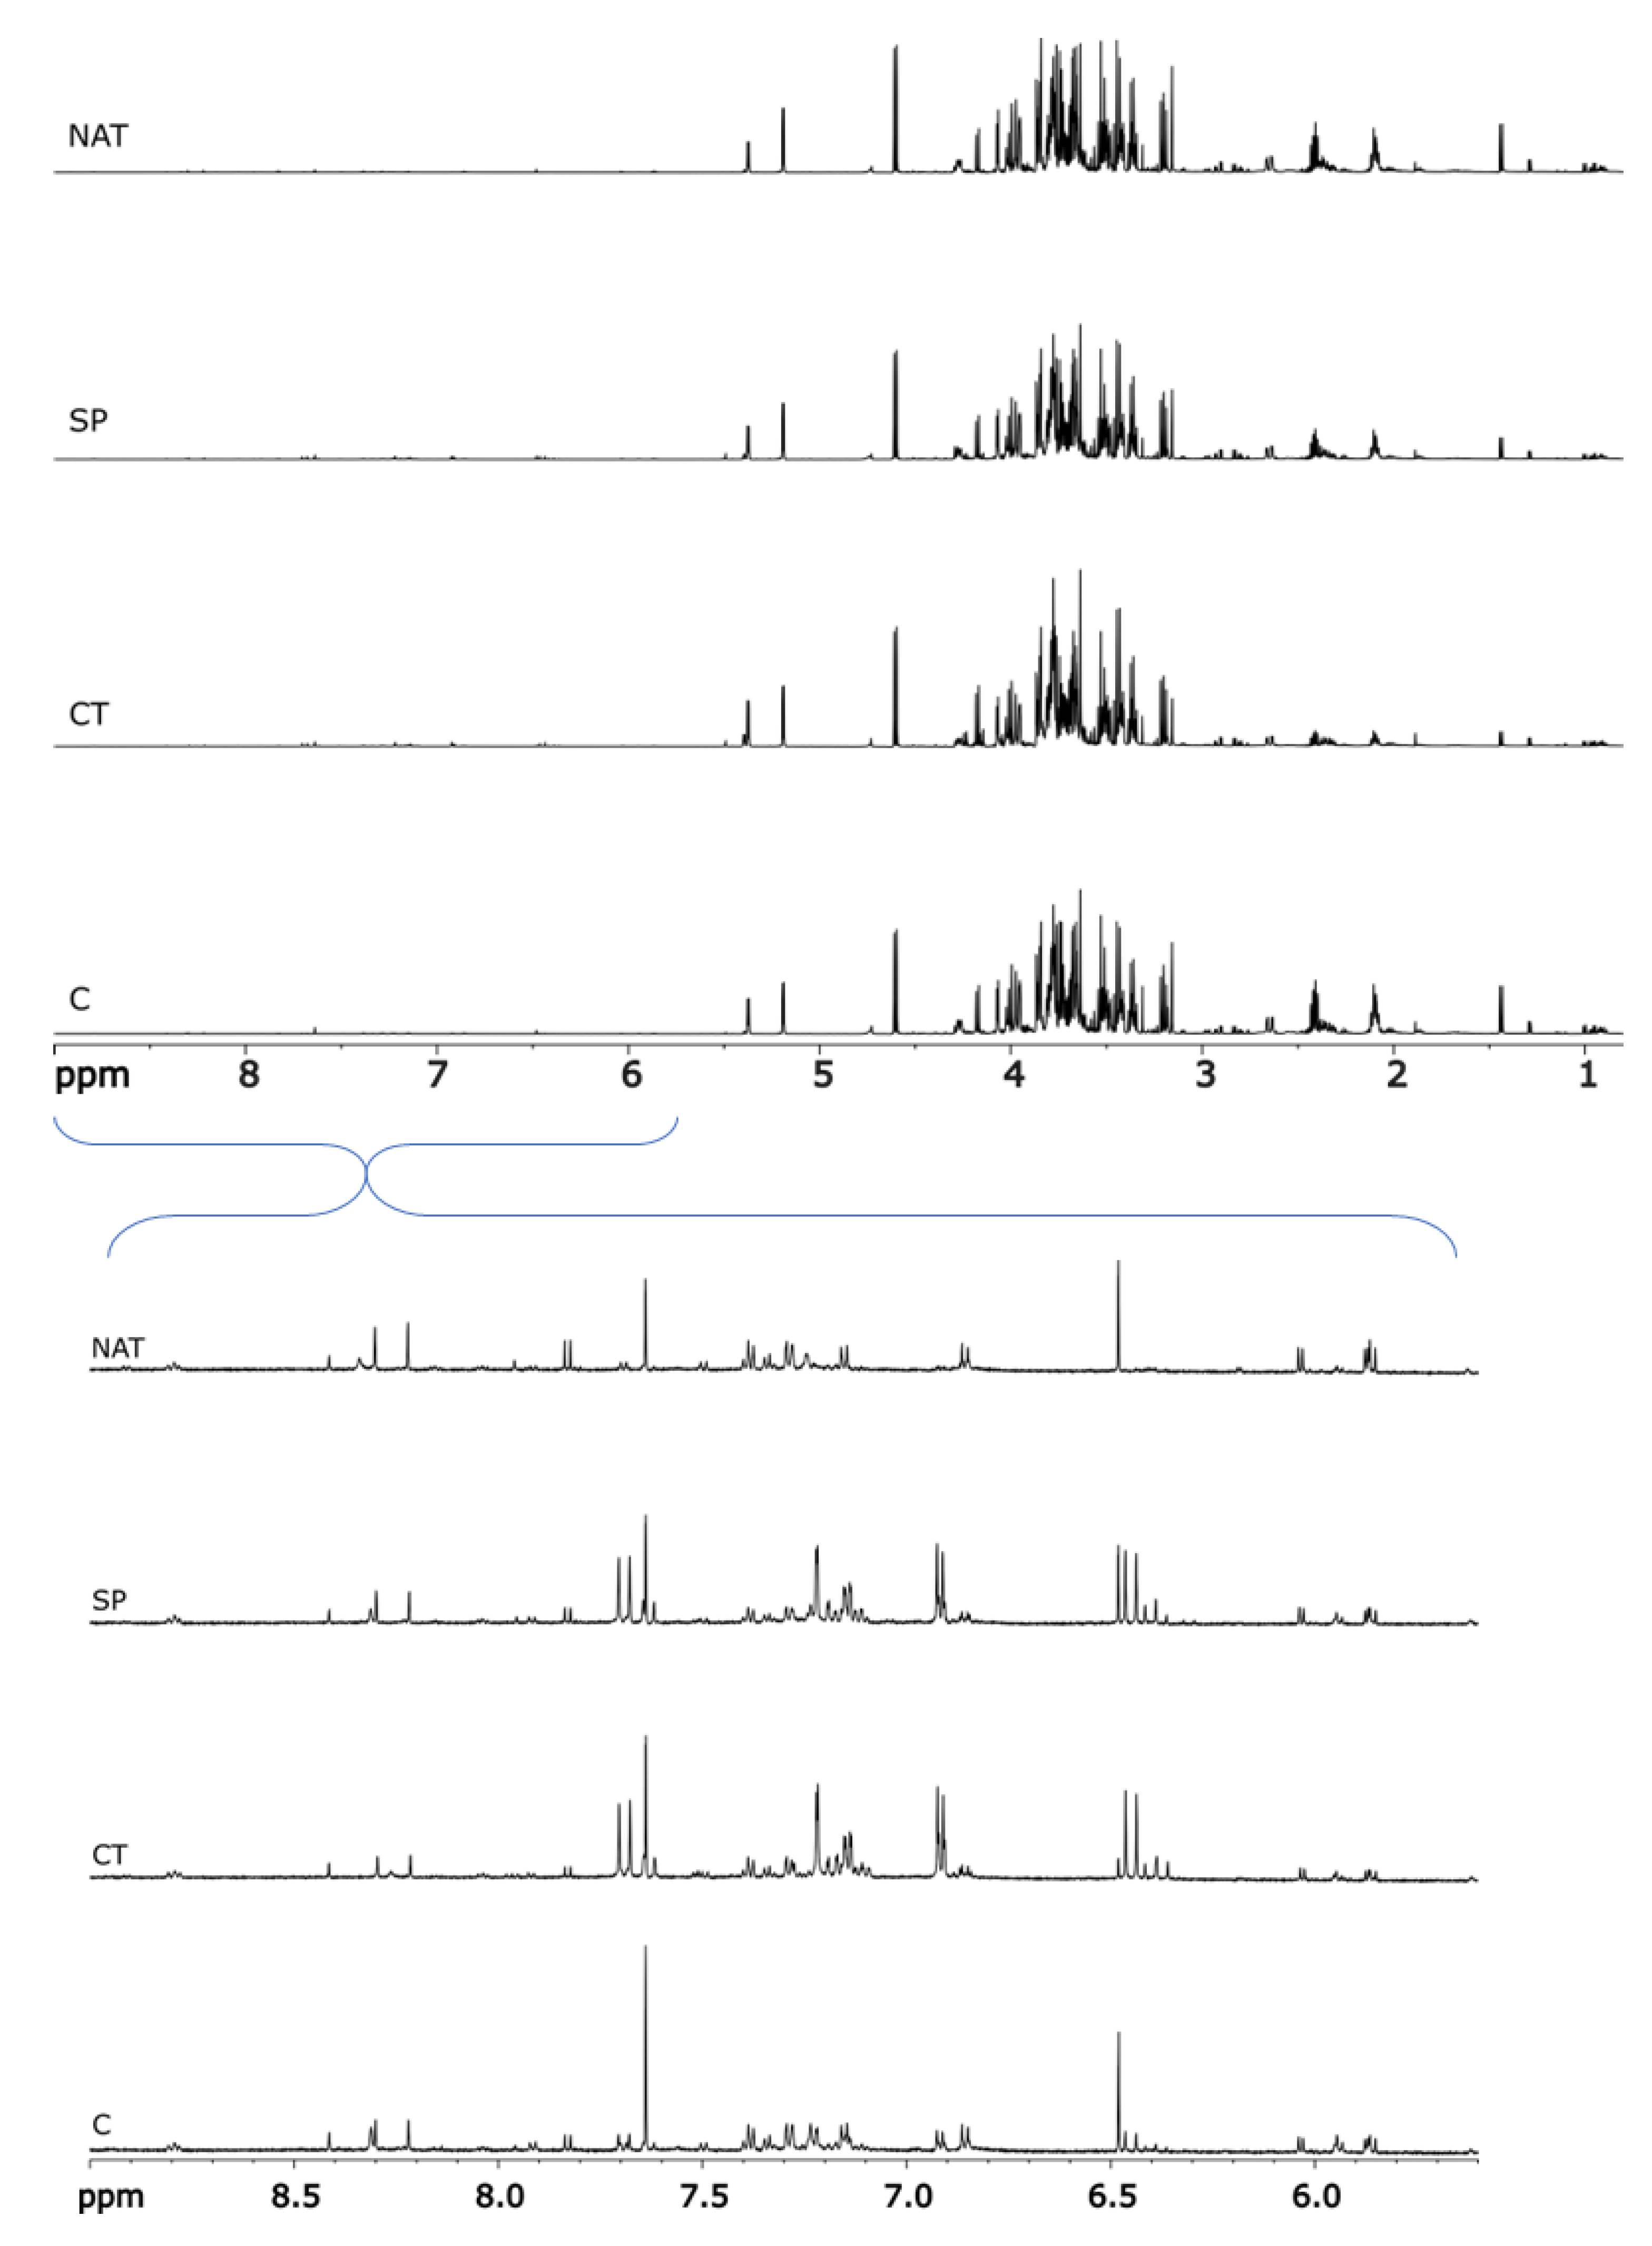
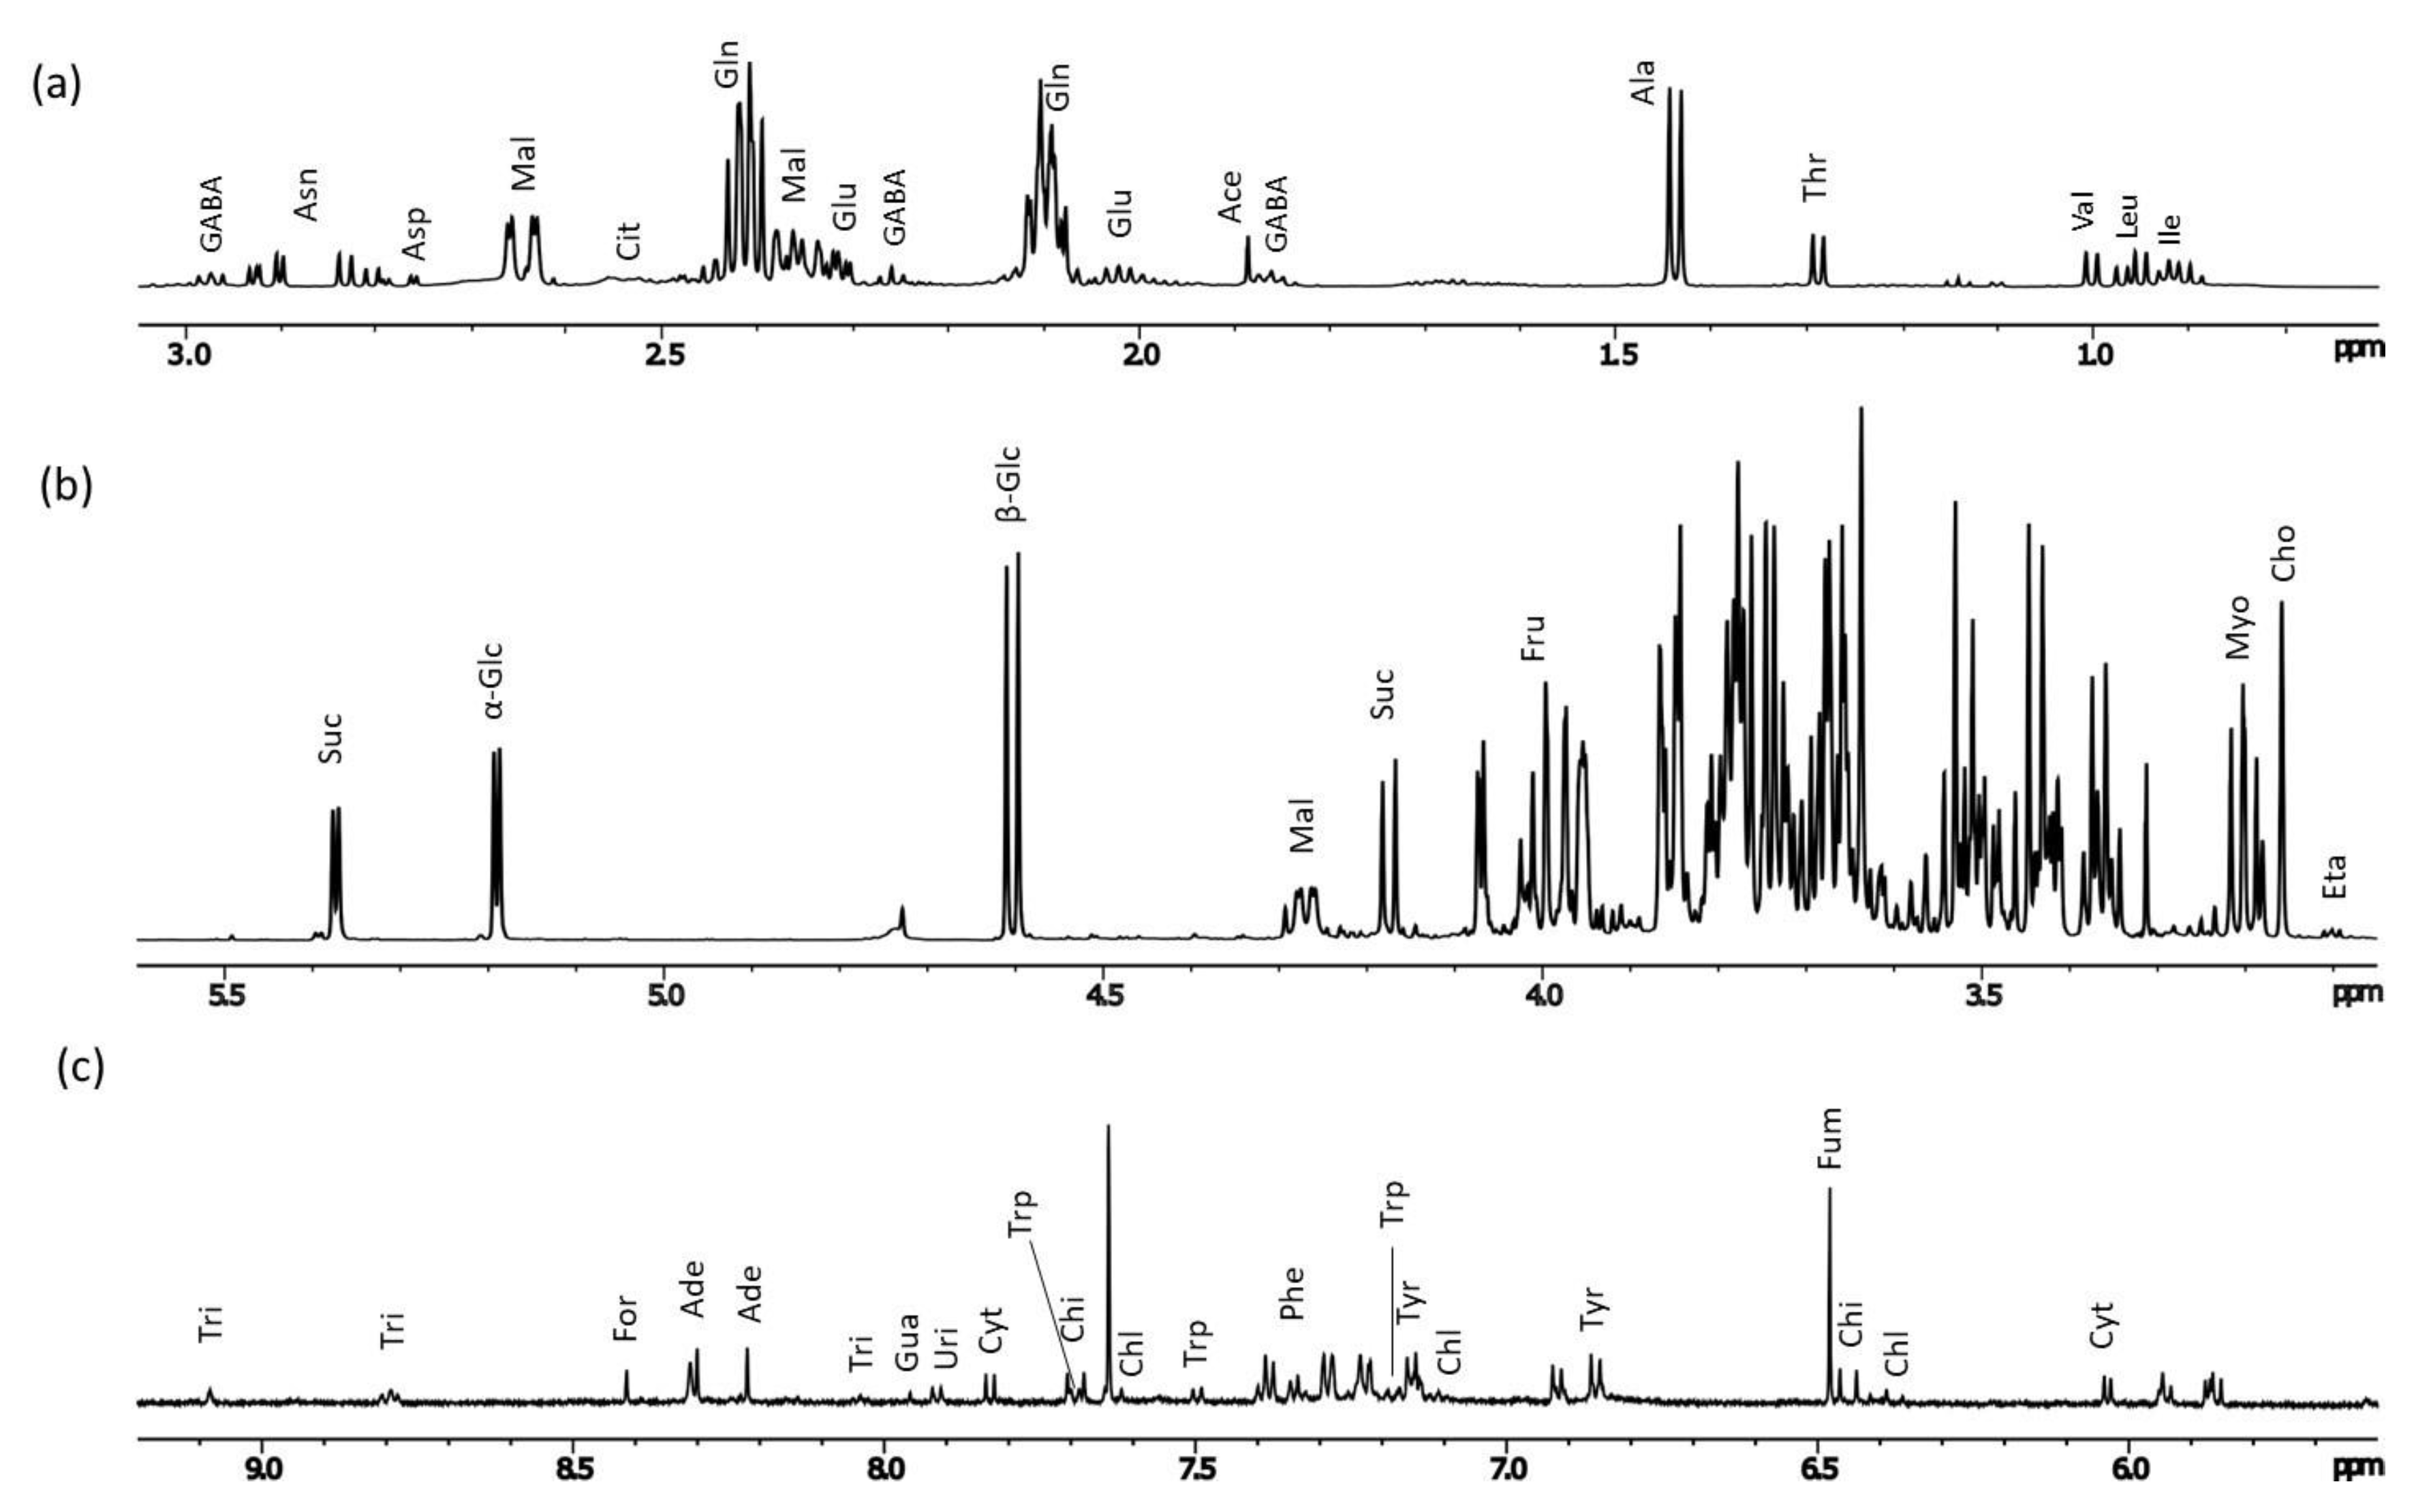
2.2. Metabolomic Analysis
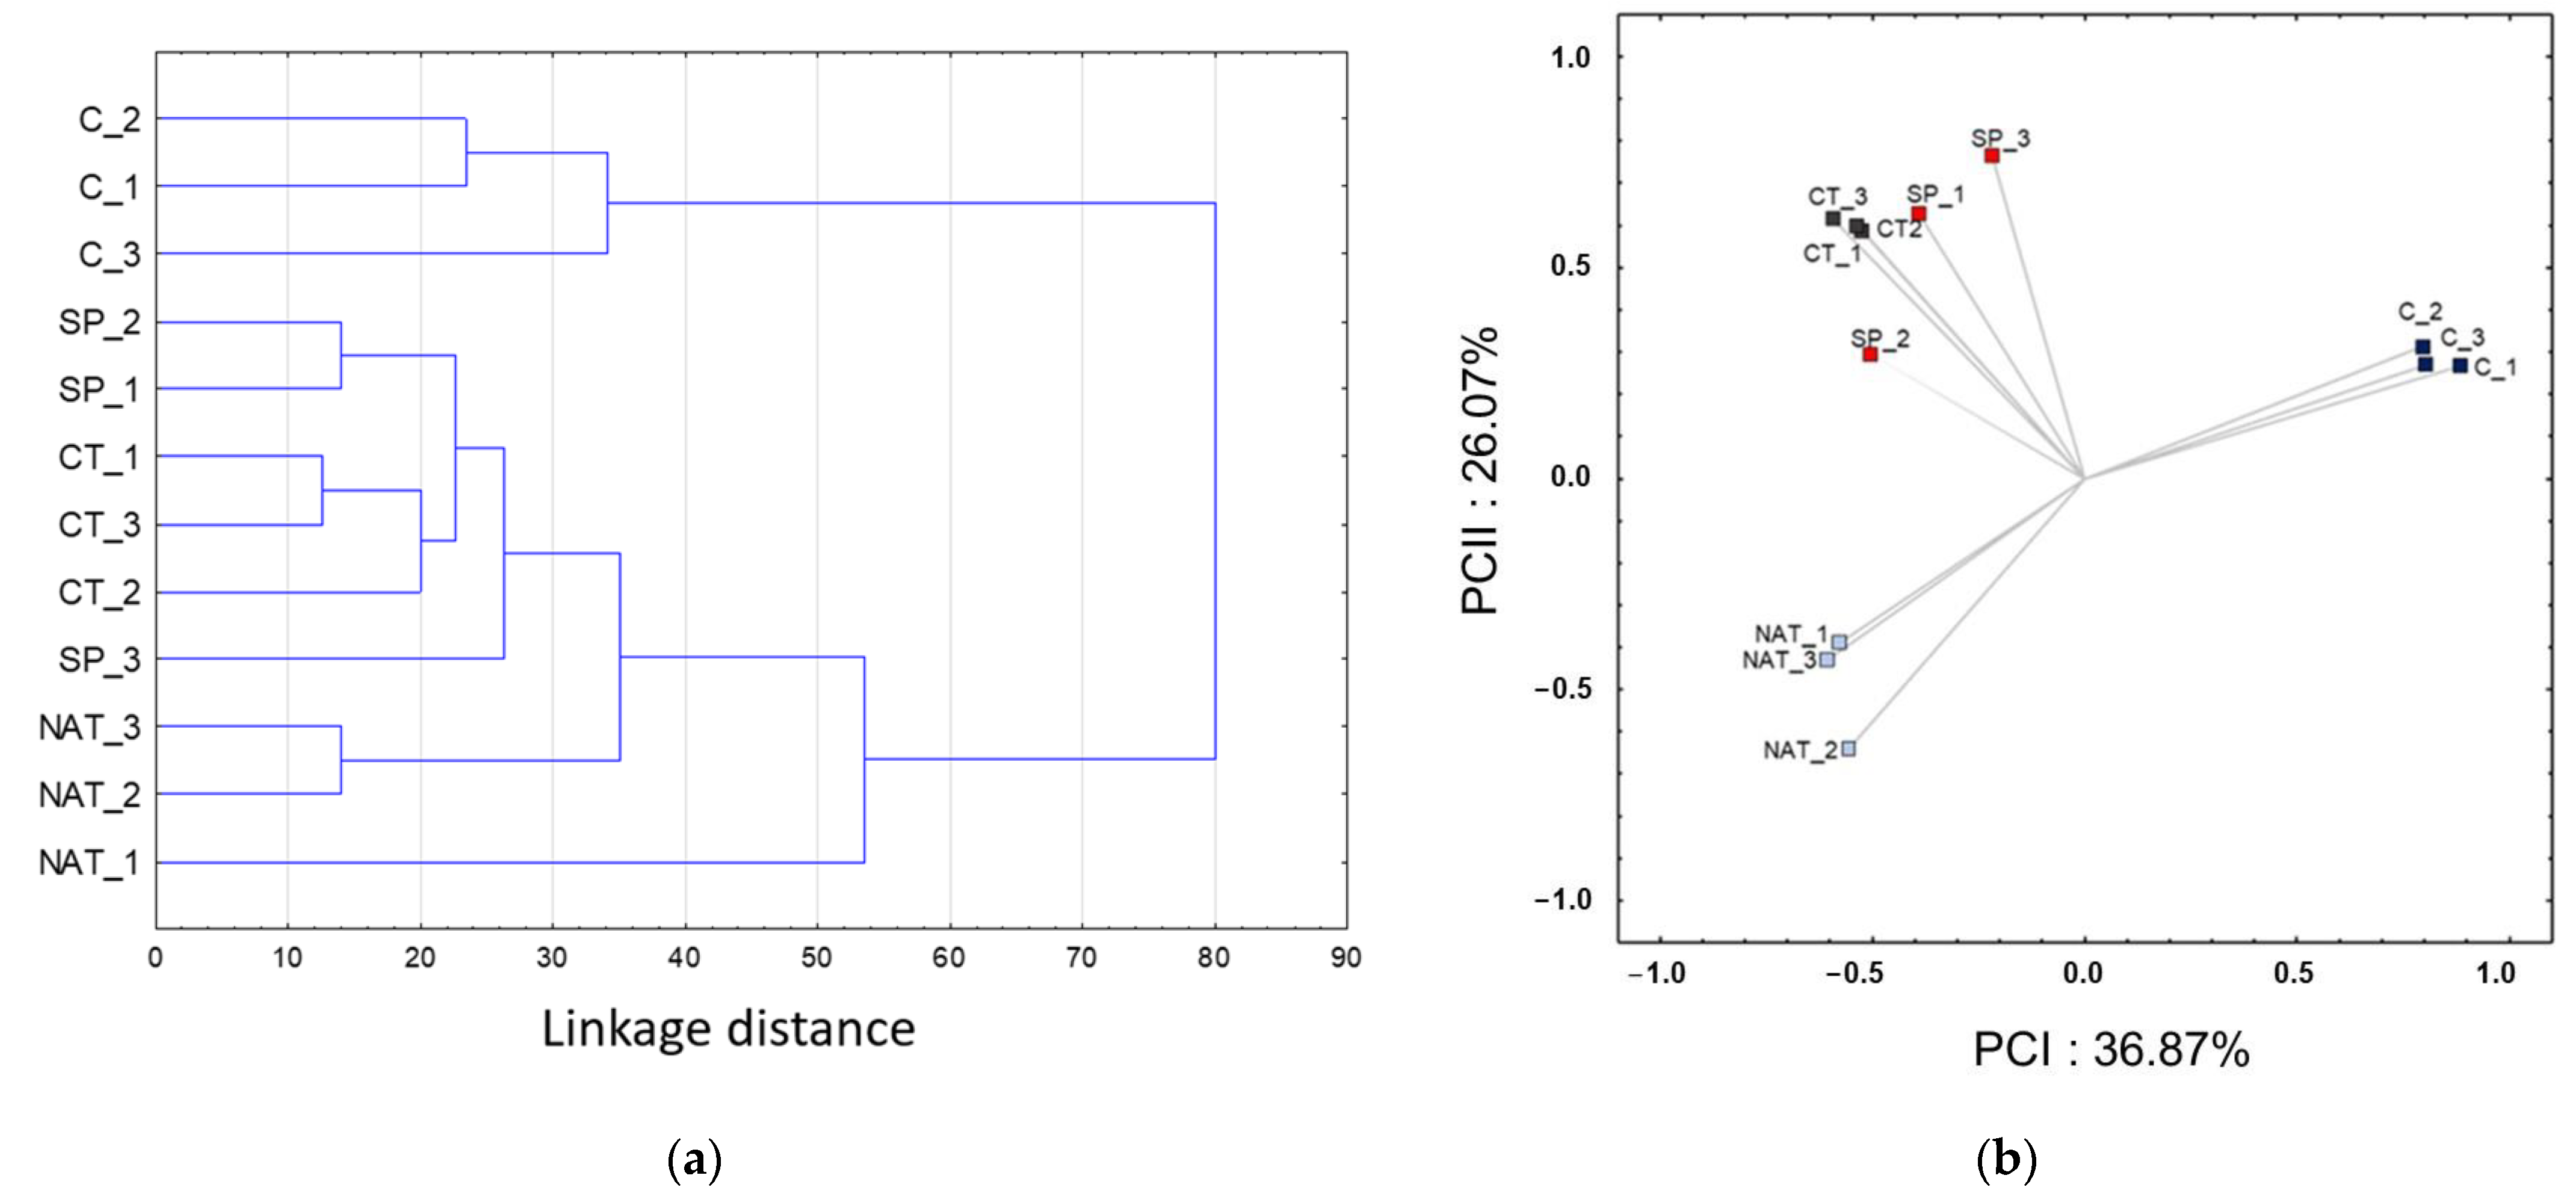
2.3. Chemometric Analysis
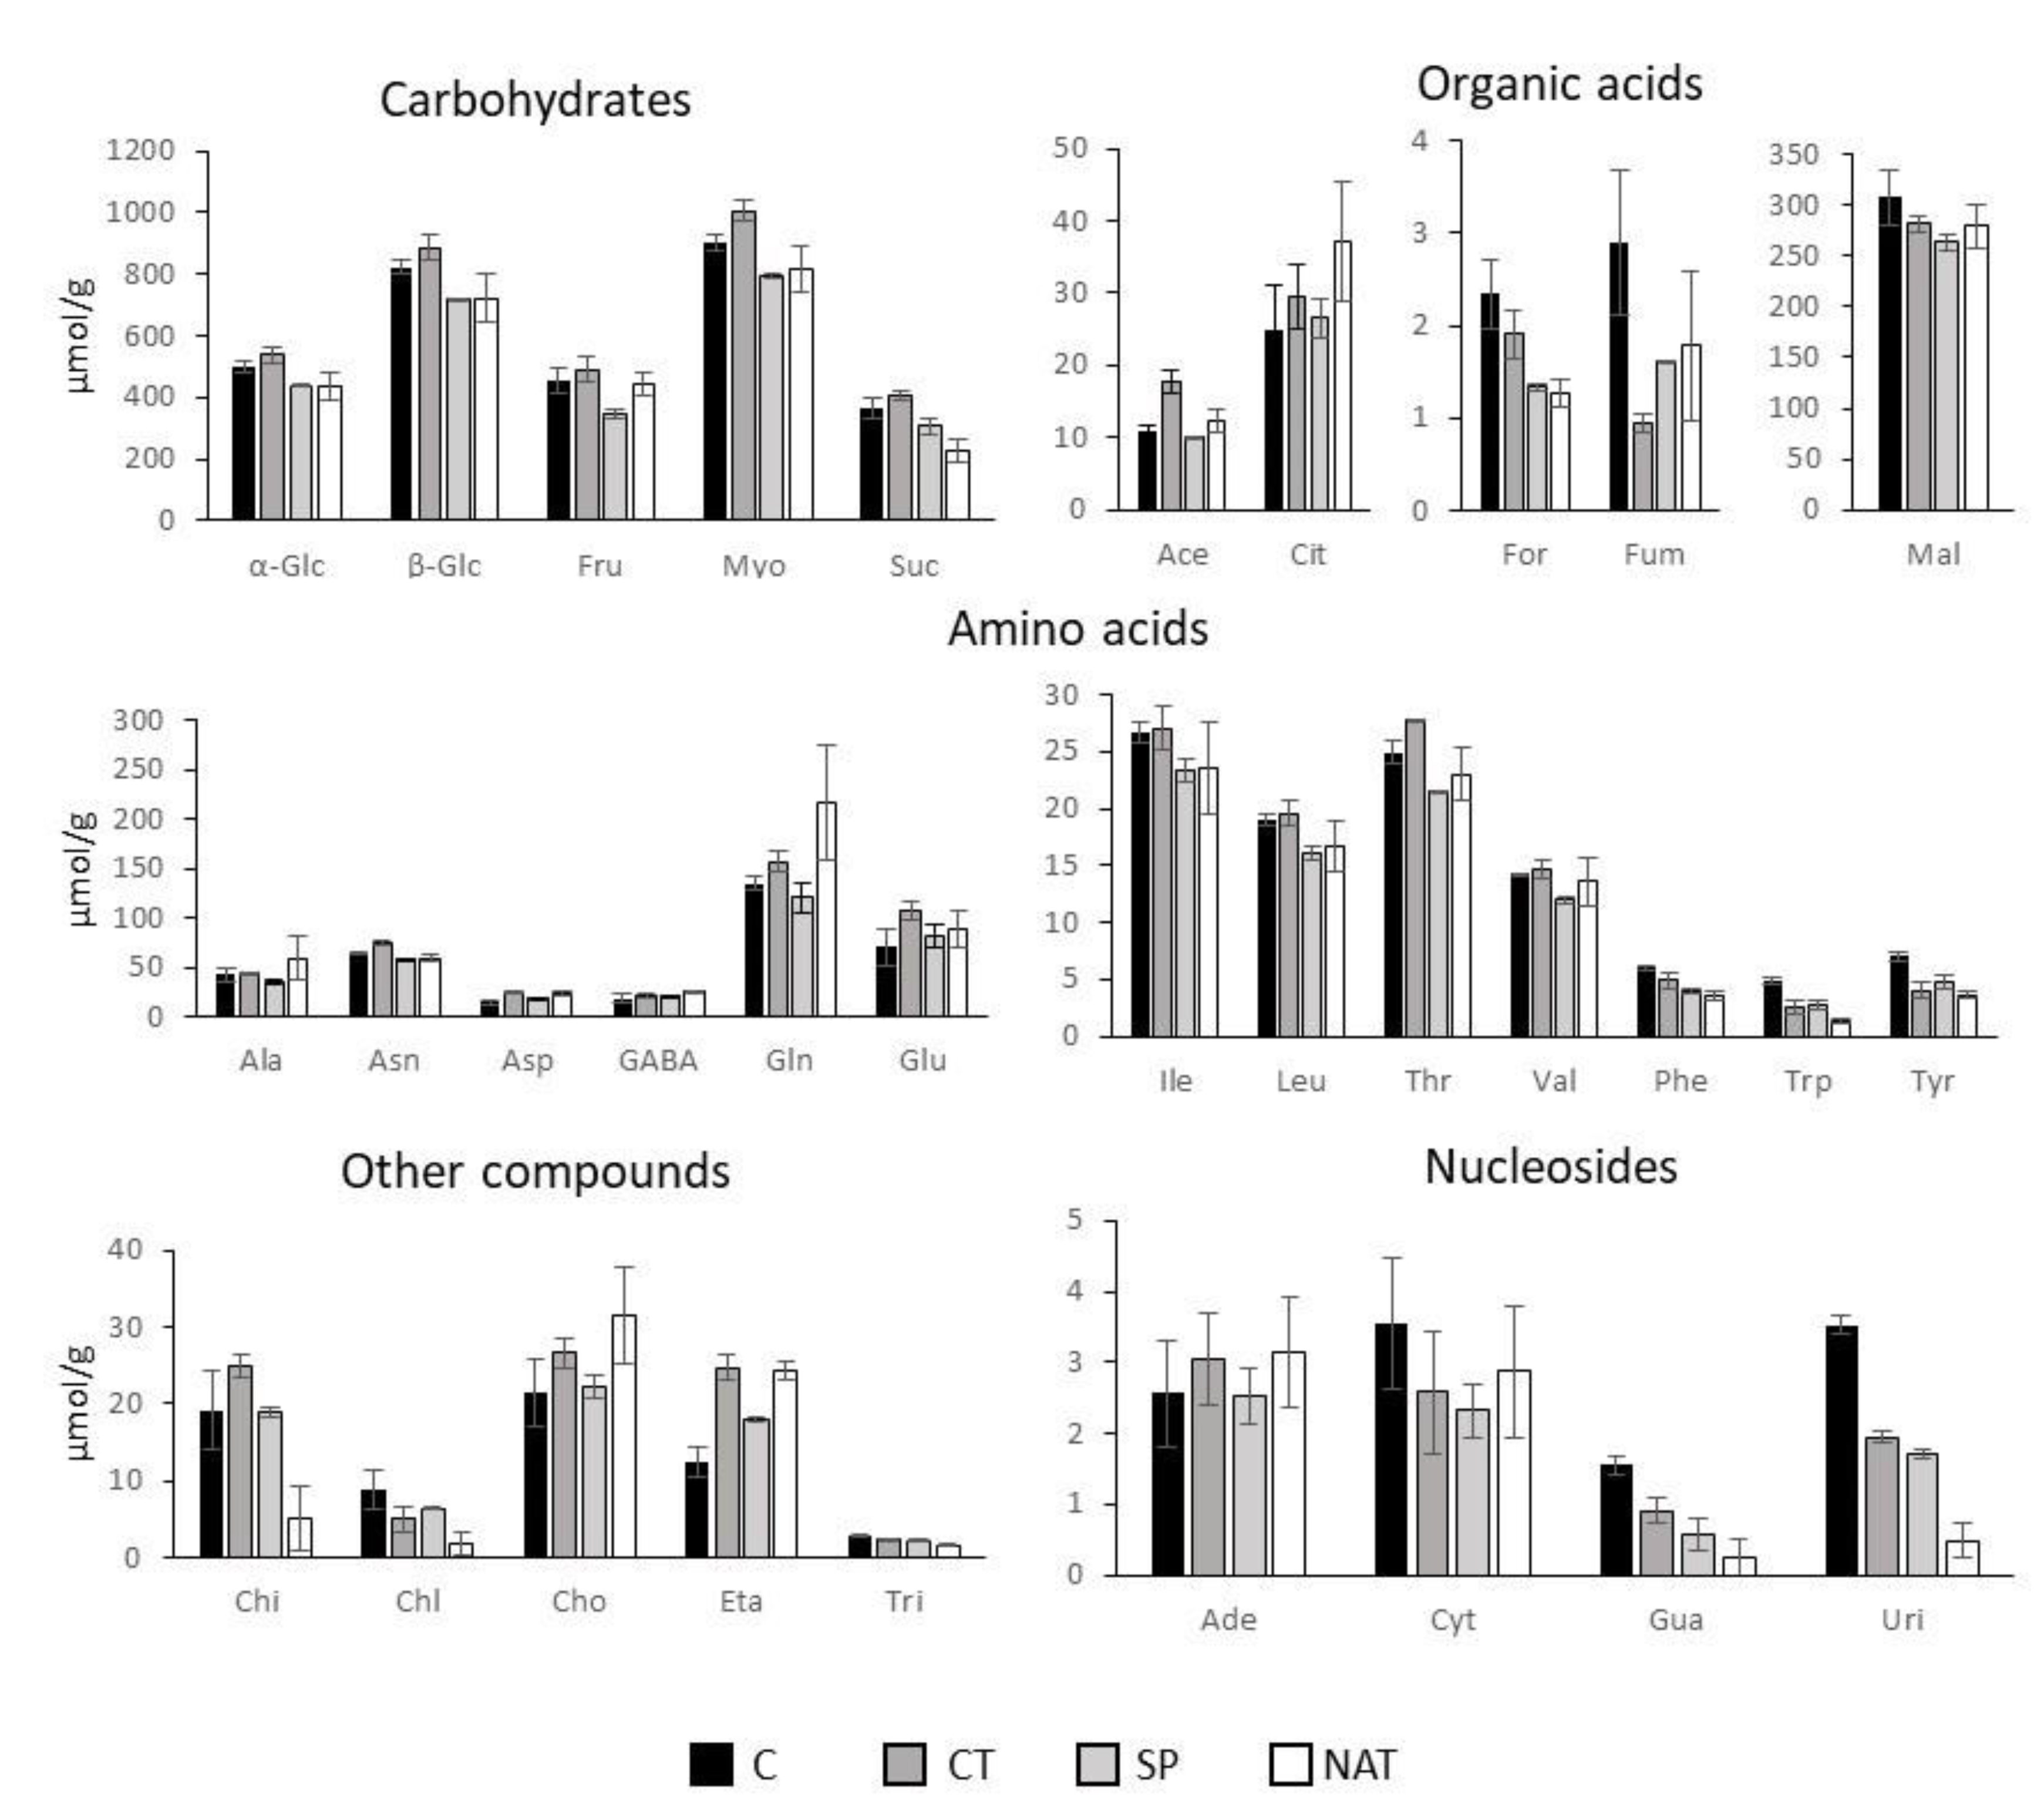
2.4. Metabolomic Treatment Comparison
3. Discussion
4. Materials and Methods
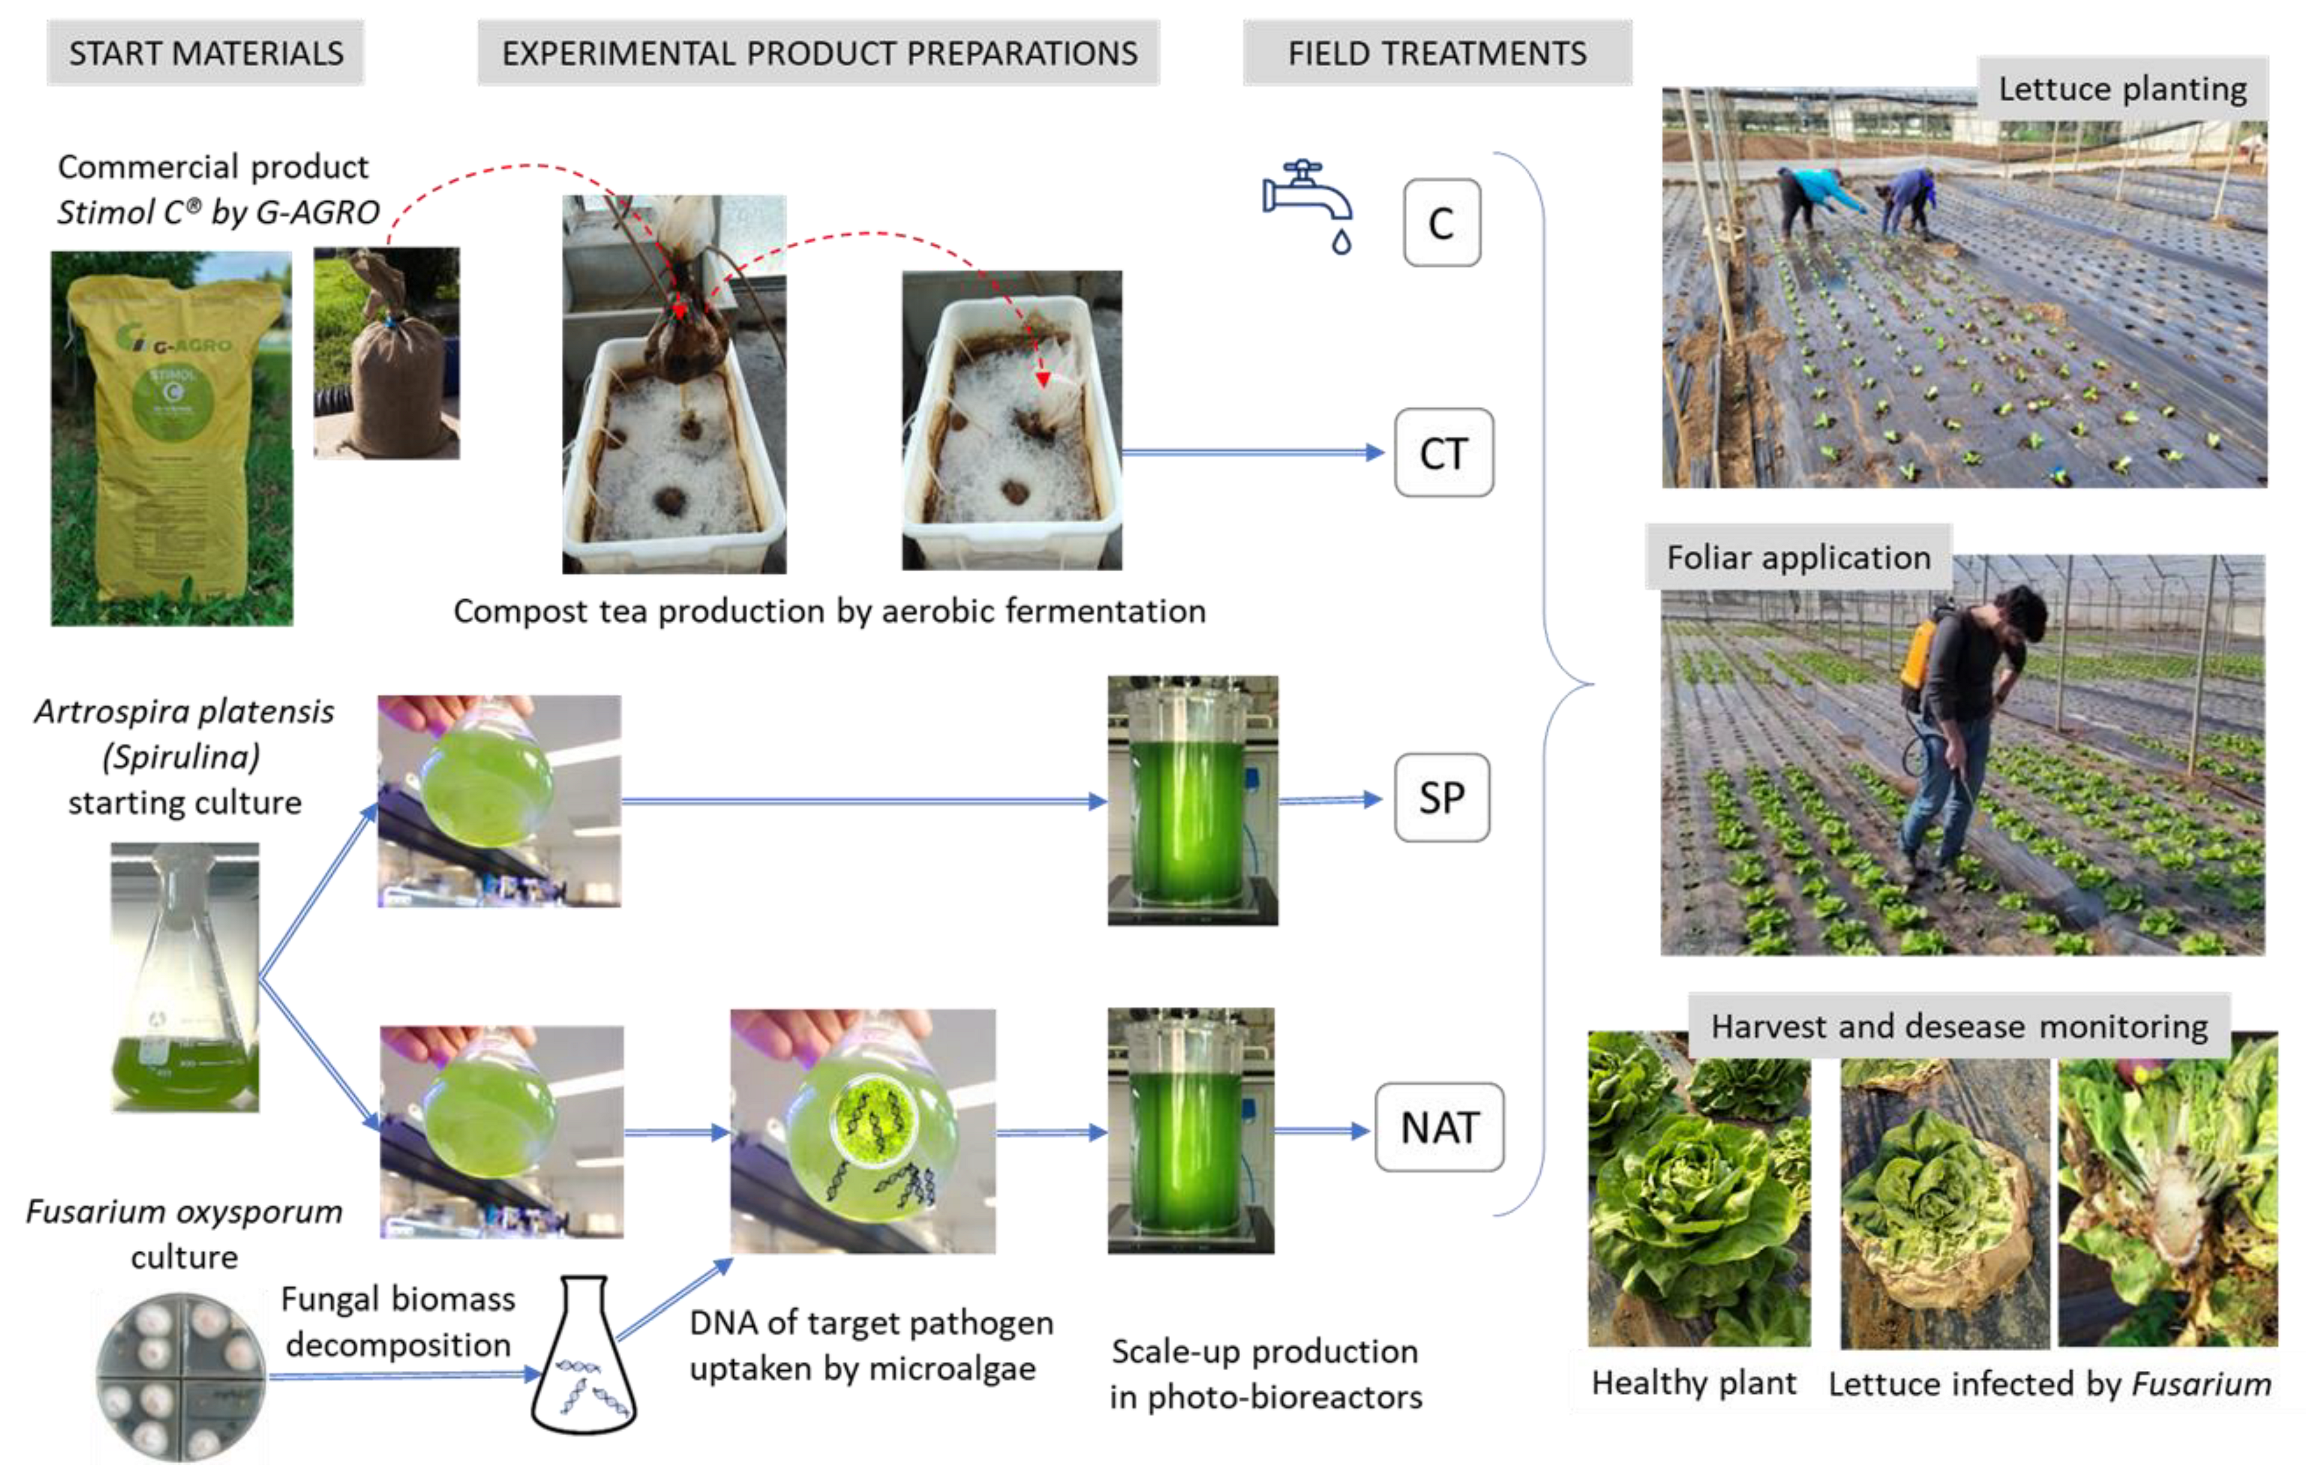
4.1. Field Site and Experimental Design
- (1)
- CT: a commercial compost tea named Stimol-C® produced by GWA—Gima Water & Air S.r.l. and made of mixed plant materials and cow manure from biological farms. The physical and chemical characteristics before starting the aerobic fermentation are the following: humidity 13%, pH: 6.8, organic C: 27%, humic and fulvic acids: 8.2%, organic N: 2.3%, C/N ratio: 11.7, salinity: 12.4 dS/m.
- (2)
- SP: Artrospira platensis (spirulina) selected strain by M2M Engineering, cultivated in a photobioreactor to produce the organic pellet lyophilized and used in the foliar application treatment.
- (3)
- NAT: The same strain of A. platensis used in the SP treatment was exposed in its preparation to a natural uptake from a culture medium enriched with Fusarium oxysporum fragmented DNA before its scale-up in the photobioreactor to produce the organic pellet used in the foliar application treatment.
4.2. Fusarium Oxysporum Lactucae (FOL) Phytopathogenic Analyses
4.3. Natural Microbial Library Preparation
4.4. Data Pre-Processing
4.5. Multivariate Data Analysis
4.6. Chemicals
4.7. Metabolite Extraction Procedure
4.8. NMR Metabolomic Analysis
5. Conclusions
6. Patent
Supplementary Materials
Author Contributions
Funding
Institutional Review Board Statement
Informed Consent Statement
Data Availability Statement
Acknowledgments
Conflicts of Interest
References
- Fiehn, O. Metabolomics—The link between genotypes and phenotypes. Plant Mol. Biol. 2002, 48, 155–171. [Google Scholar] [CrossRef] [PubMed]
- Sumner, L.W.; Mendes, P.; Dixon, R.A. Plant metabolomics: Large-scale phytochemistry in the functional genomics era. Phytochemistry 2003, 62, 817–836. [Google Scholar] [CrossRef] [Green Version]
- Anzano, A.; Bonanomi, G.; Mazzoleni, S.; Lanzotti, V. Plant metabolomics in biotic and abiotic stress: A critical overview. Phytochem. Rev. 2021, 21, 503–524. [Google Scholar] [CrossRef]
- Pignatti, S. Flora D Ital.; Edagricole: Bologna, Italy, 1982; pp. 99–105. ISBN 88-506-2449-2. [Google Scholar]
- Noumedem, J.A.K.; Djeussi, D.E.; Hritcu, L.; Mihasan, M.; Kuete, V. Lactuca sativa. In Medicinal Spices and Vegetables from Africa; Academic Press: Cambridge, MA, USA, 2017; pp. 437–449. ISBN 9780128092866. [Google Scholar]
- Kim, M.J.; Moon, Y.; Tou, J.C.; Mou, B.; Waterland, N.L. Nutritional value, bioactive compounds and health benefits of lettuce (Lactuca sativa L.). J. Food Comp. Anal. 2016, 49, 19–34. [Google Scholar] [CrossRef]
- Sobolev, A.P.; Brosio, E.; Gianferri, R.; Segre, A.L. Metabolic profile of lettuce leaves by high-field NMR spectra. Magn. Reason. Chem. 2005, 43, 625–638. [Google Scholar] [CrossRef] [Green Version]
- Yang, X.; Wei, S.; Liu, B.; Doudou, G.; Bangxiao, Z.; Lei, F.; Yumin, L.; Tomás-Barberán, F.A.; Lijun, L.; Danfeng, H. A novel integrated non-targeted metabolomic analysis reveals significant metabolite variations between different lettuce (Lactuca sativa L.) varieties. Hortic. Res. 2018, 5, 33. [Google Scholar] [CrossRef] [Green Version]
- van Treuren, R.; van Eekelen, H.D.L.M.; Wehrens, R.; de Vos, R.C.H. Metabolite variation in the lettuce gene pool: Towards healthier crop varieties and food. Metabolomics 2018, 14, 146. [Google Scholar] [CrossRef] [Green Version]
- Zhou, W.; Liang, X.; Li, K.; Dai, P.; Li, J.; Liang, B.; Sun, C.; Lin, X. Metabolomics analysis reveals potential mechanisms of phenolic accumulation in lettuce (Lactuca sativa L.) induced by low nitrogen supply. Plant Physiol. Biochem. 2021, 158, 446–453. [Google Scholar] [CrossRef]
- Wei, S.; Zhang, L.; Huo, G.; Ge, G.; Luo, L.; Yang, Q.; Yang, X.; Long, P. Comparative transcriptomics and metabolomics analyses provide insights into thermal resistance in lettuce (Lactuca sativa L.). Sci. Hortic. 2021, 289, 110423. [Google Scholar] [CrossRef]
- Matamoros, V.; Rendón-Mera, A.M.; Piña, B.; Tadić, Đ.; Cañameras, N.; Carazo, N.; Bayona, J.M. Metabolomic and phenotypic implications of the application of fertilization products containing microcontaminants in lettuce (Lactuca sativa). Sci. Rep. 2021, 11, 9701. [Google Scholar] [CrossRef]
- Bailey, K.L.; Lazarovits, G. Suppressing soil-borne diseases with residue management and organic amendments. Soil Tillage Res. 2003, 72, 169–180. [Google Scholar] [CrossRef]
- Bonanomi, G.; Antignani, V.; Pane, C.; Scala, F. Suppression of soilborne fungal diseases with organic amendments. J. Plant Pathol. 2007, 89, 311–324, Available online: www.jstor.org/stable/41998410 (accessed on 19 June 2022). [Google Scholar]
- Termorshuizen, A.J.; Van Rijn, E.; Van Der Gaag, D.J.; Alabouvette, C.; Chen, Y.; Lagerlöf, J.; Malandrakis, A.A.; Paplomatas, E.J.; Rämert, B.; Ryckeboer, J.; et al. Suppressiveness of 18 composts against 7 pathosystems: Variability in pathogen response. Soil Biol. Biochem. 2006, 38, 2461–2477. [Google Scholar] [CrossRef]
- Bonanomi, G.; Antignani, V.; Capodilupo, M.; Scala, F. Identifying the characteristics of organic soil amendments that suppress soilborne plant diseases. Soil Biol. Biochem. 2010, 42, 136–144. [Google Scholar] [CrossRef]
- Sarma, B.K.; Singh, P.; Pandey, S.K.; Singh, H.B. Vermicompost as modulator of plant growth and disease suppression. Dyn. Soil Dyn. Plant 2010, 4, 58–66, Available online: www.globalsciencebooks.info (accessed on 19 June 2022). [Google Scholar]
- Thoden, T.C.; Korthals, G.W.; Termorshuizen, A.J. Organic amendments and their influences on plant-parasitic and free-living nematodes: A promising method for nematode management? Nematology 2011, 13, 133–153. [Google Scholar] [CrossRef]
- Lazarovits, G. Management of soil-borne plant pathogens with organic soil amendments: A disease control strategy salvaged from the past. Can. J. Plant Pathol. 2001, 23, 1–7. [Google Scholar] [CrossRef]
- Pane, C.; Spaccini, R.; Piccolo, A.; Scala, F.; Bonanomi, G. Compost amendments enhance peat suppressiveness to Pythium ultimum, Rhizoctonia solani and Sclerotinia minor. Biocontrol 2011, 56, 115–124. [Google Scholar] [CrossRef]
- Pinto, Z.V.; Bettiol, W.; Morandi, M.A.B. Efeito de casca de camarão, hidrolisado de peixe e quitosana no controle da murcha de Fusarium oxysporum f. sp.chrysanthemi em crisântemo. Trop. Plant Pathol. 2010, 35, 016–023. [Google Scholar] [CrossRef]
- Barakat, R.M.; Al-Masri, M.I. Trichoderma harzianum in combination with sheep manure amendment enhances soil suppressiveness of Fusarium wilt of tomato. Phytopathol. Mediterr. 2009, 48, 385–395. [Google Scholar]
- Khan, W.; Rayirath, U.P.; Subramanian, S.; Jithesh, M.N.; Rayorath, P.; Hodges, D.M.; Critchley, A.T.; Craigie, J.S.; Norrie, J.; Prithiviraj, B. Seaweed extracts as biostimulants of plant growth and development. J. Plant Growth Regul. 2009, 28, 386–399. [Google Scholar] [CrossRef]
- González-Pérez, B.K.; Rivas-Castillo, A.M.; Valdez-Calderón, A.; Gayosso-Morales, M.A. Microalgae as biostimulants: A new approach in agriculture. World J. Microbiol. Biotechnol. 2022, 38, 1–12. [Google Scholar] [CrossRef] [PubMed]
- Braun, J.C.; Colla, L.M. Use of Microalgae for the Development of Biofertilizers and Biostimulants. Bioenerg. Res. 2022, 1–22. [Google Scholar] [CrossRef]
- Abbasi, P.A. Exploiting and understanding disease suppressing effects of fish emulsion for soil-borne and foliar diseases. Am. J. Plant Sci. Biotechnol. 2011, 5, 61–68, Available online: www.globalsciencebooks.info (accessed on 19 June 2022). [Google Scholar]
- Mazzoleni, S.; Cartenì, F.; Bonanomi, G.; Incerti, G.; Chiusano, M.L.; Termolino, P.; Migliozzi, A.; Senatore, M.; Giannino, F.; Rietkerk, M.; et al. New perspectives on the use of nucleic acids in pharmacological applications: Inhibitory action of extracellular self-DNA in biological systems. Phytochem. Rev. 2014, 13, 937–946. [Google Scholar] [CrossRef]
- Mazzoleni, S.; Cartenì, F.; Bonanomi, G.; Senatore, M.; Termolino, P.; Giannino, F.; Incerti, G.; Rietkerk, M.; Lanzotti, V.; Chiusano, M.L. Inhibitory effects of extracellular self-DNA: A general biological process? New Phytol. 2015, 206, 127–132. [Google Scholar] [CrossRef]
- Fan, T.W.M. Metabolite profiling by one-and two-dimensional NMR analysis of complex mixtures. Prog. Nucl. Magn. Reason. Spectrosc. 1996, 28, 161–219. [Google Scholar] [CrossRef]
- de Falco, B.; Grauso, L.; Fiore, A.; Bochicchio, R.; Amato, M.; Lanzotti, V. Metabolomic analysis and antioxidant activity of wild type and mutant chia (Salvia hispanica L.) stem and flower grown under different irrigation regimes. J. Sci. Food Agric. 2021, 101, 6010–6019. [Google Scholar] [CrossRef]
- de Falco, B.; Grauso, L.; Fiore, A.; Bonanomi, G.; Lanzotti, V. Metabolomics and chemometrics of seven aromatic plants: Carob, eucalyptus, laurel, mint, myrtle, rosemary and strawberry tree. Phytochem. Anal. 2022, 33, 696–709. [Google Scholar] [CrossRef]
- Wendt, K.E.; Pakrasi, H.B. Genomics approaches to deciphering natural transformation in cyanobacteria. Front. Pharmacol. 2019, 10, 1259. [Google Scholar] [CrossRef] [Green Version]
- Kosma, C.; Triantafyllidis, V.; Papasavvas, A.; Salahas, G.; Patakas, A. Yield and nutritional quality of greenhouse lettuce as affected by shading and cultivation season. Emir. J. Food Agric. 2013, 25, 974–979. [Google Scholar] [CrossRef]


| Treatment | Dead Plants (#) | Stunting Plants (#) | Weight (g) | |||
|---|---|---|---|---|---|---|
| AVG | SD | AVG | SD | AVG | SD | |
| C | 18.67 | 5.51 | 17.00 | 5.29 | 377.40 | 67.87 |
| NAT | 6.00 | 2.65 | 10.33 | 7.51 | 493.60 | 73.80 |
| SP | 7.33 | 1.15 | 13.67 | 4.16 | 411.60 | 103.47 |
| CT | 6.67 | 2.08 | 17.67 | 3.06 | 487.50 | 106.66 |
| Compound | Assignment | 1H (ppm) | Multiplicity [J (Hz)] |
|---|---|---|---|
| Organic acids | |||
| Acetic acid (Ace) | α-CH3 | 1.88 * | s |
| Citric acid (Cit) | CH2 | 2.59 * | dd [15.0, 15.0] |
| Formic acid (For) | COOH | 8.41 * | s |
| Fumaric acid (Fum) | α-CH | 6.48 * | s |
| Malic acid (Mal) | β’-CH2 | 2.36 | dd [15.7, 8.9] |
| β-CH | 2.65 | dd [15.7, 3.7] | |
| α-CH | 4.28 * | dd [8.9, 3.7] | |
| Amino acids | |||
| Alanine (Ala) | β-CH3 | 1.43 * | d [7.0] |
| Asparagine (Asn) | β-CH | 2.86 | dd [17.4, 3.8] |
| β-CH | 2.87 * | dd [16.9, 7.3] | |
| Aspartic acid (Asp) | β-CH2 | 2.76 * | dd [17.4, 3.8] |
| γ-aminobutyrate (GABA) | β-CH2 | 1.87 | m |
| α-CH2 | 2.26 | t [7.0] | |
| γ-CH2 | 2.97 * | t [7.0] | |
| Glutamic acid (Glu) | β-CH2 | 2.02 | m |
| γ-CH2 | 2.32 * | m [7.0] | |
| Glutamine (Gln) | β-CH2 | 2.10 | m |
| γ-CH2 | 2.43 * | m | |
| Isoleucine (Ile) | δ-CH3 | 0.91 * | t [7.0] |
| γ’-CH3 | 1.00 | d [7.0] | |
| Leucine (Leu) | δ-CH3 | 0.95 * | d [7.0] |
| Phenylalanine (Phe) | CH-2,6 | 7.28 | d [7.0] |
| CH-4 | 7.33 | t [7.0] | |
| CH-3,5 | 7.38 * | d [7.0] | |
| Threonine (Thr) | γ-CH3 | 1.29 * | d [6.4] |
| Tryptophan (Trp) | CH-6 | 7.18 | d [7.5] |
| CH-7 | 7.49 * | d [7.5] | |
| CH-4 | 7.69 | d [7.5] | |
| Tyrosine (Tyr) | CH-3,5 | 6.85 * | d [7.0] |
| CH-2,6 | 7.14 | d [7.0] | |
| Valine (Val) | γ’-CH3 | 0.97 | d [7.0] |
| γ-CH3 | 1.00 * | d [7.0] | |
| Carbohydrates | |||
| α-Glucose (α-Glc) | CH-1 | 5.19 * | d [4.0] |
| β-Glucose (β-Glc) | CH-1 | 4.61 * | d [8.0] |
| Fructose (Fru) | CH-4 | 3.90 | dd |
| CH2-6 | 4.00 * | dd | |
| Myo-inositol (Myo) | CH-4 | 3.20 * | t [9.50] |
| Sucrose (Suc) | Glc CH-1 | 5.38 * | d [4.0] |
| Fru CH-3 | 4.18 | d [8.5] | |
| Nucleotides | |||
| Adenosine (Ade) | CH-2 | 8.21 * | s |
| CH-8 | 8.40 | s | |
| Cytidine (Cyt) | CH-1I | 6.03 | d [3.5] |
| CH-6 | 7.82 * | d [7.0] | |
| Guanosine (Gua) | CH-8 | 7.95 * | s |
| Uridine (Uri) | CH-6 | 7.91 * | d [7.0] |
| Other compounds | |||
| Chicoric acid (Chi) | CH-2 | 6.46 * | d [16.0] |
| CH-3 | 7.70 | d [16.0] | |
| Chlorogenic acid (Chl) | CH-2 | 6.40 * | d [16.0] |
| CH-2I | 7.10 | dd [8.2, 2.2] | |
| CH-3 | 7.62 | d [16.0] | |
| Choline (Cho) | N(CH3)3+ | 3.15 * | s |
| Ethanolamine (Eta) | β-CH2 | 3.10 * | dt [6.8, 4.0] |
| Trigonelline (Tri) | CH | 8.05 | t |
| CH | 8.80 * | t | |
| CH | 9.09 | s | |
Publisher’s Note: MDPI stays neutral with regard to jurisdictional claims in published maps and institutional affiliations. |
© 2022 by the authors. Licensee MDPI, Basel, Switzerland. This article is an open access article distributed under the terms and conditions of the Creative Commons Attribution (CC BY) license (https://creativecommons.org/licenses/by/4.0/).
Share and Cite
Lanzotti, V.; Anzano, A.; Grauso, L.; Zotti, M.; Sacco, A.; Senatore, M.; Moreno, M.; Diano, M.; Parente, M.; Esposito, S.; et al. NMR Metabolomics and Chemometrics of Lettuce, Lactuca sativa L., under Different Foliar Organic Fertilization Treatments. Plants 2022, 11, 2164. https://doi.org/10.3390/plants11162164
Lanzotti V, Anzano A, Grauso L, Zotti M, Sacco A, Senatore M, Moreno M, Diano M, Parente M, Esposito S, et al. NMR Metabolomics and Chemometrics of Lettuce, Lactuca sativa L., under Different Foliar Organic Fertilization Treatments. Plants. 2022; 11(16):2164. https://doi.org/10.3390/plants11162164
Chicago/Turabian StyleLanzotti, Virginia, Attilio Anzano, Laura Grauso, Maurizio Zotti, Adriana Sacco, Mauro Senatore, Mauro Moreno, Marcello Diano, Maddalena Parente, Serena Esposito, and et al. 2022. "NMR Metabolomics and Chemometrics of Lettuce, Lactuca sativa L., under Different Foliar Organic Fertilization Treatments" Plants 11, no. 16: 2164. https://doi.org/10.3390/plants11162164